Article

Quantifying the Geological Premium in Carbon Footprints of Microtunneling: An EN 15804-Based Case Study in Hard Gravel Formations


Department of Landscape Architecture, National Chin-Yi University of Technology, Taichung 411030, Taiwan
Buildings 2026, 16(7), 1413; https://doi.org/10.3390/buildings16071413
Submission received: 11 February 2026 / Revised: 19 March 2026 / Accepted: 27 March 2026 / Published: 2 April 2026
(This article belongs to the Section Building Structures)

Abstract

Although trenchless technology is widely recognized for its low-carbon potential, existing assessment models often overlook the significant impact of regional geological variations on energy consumption. Based on the EN 15804 standard and the Input–Process–Output (IPO) model, this study establishes a high-resolution carbon emission assessment framework focusing on the “Upfront Carbon” stages (Modules A1–A5) of public works. An empirical study was conducted on a sewage microtunneling project in Hualien, Taiwan, characterized by a deep burial depth of 12 m and challenging gravel formations (SPT N-value > 50). Life Cycle Assessment (LCA) principles were adopted to quantify the carbon footprint and benchmark the results against international guidelines from the UK (PJA) and Japan (JSWA). The Life Cycle Inventory (LCI) reveals a unit emission intensity of 349 kgCO2e/m, significantly higher than international benchmarks. Critical findings indicate that this discrepancy is primarily driven by environmental variables—specifically, geological resistance and grid emission factors. Crucially, the sensitivity analysis demonstrates that the physical resistance of the hard gravel layer increased machinery energy intensity by 18.7% compared to baseline soil conditions. This study officially defines this phenomenon as the “Geological Premium.” Additionally, carbon efficiency was found to be profoundly influenced by the regional grid emission factor (Taiwan: 0.495 vs. UK: 0.193 kgCO2/kWh). This research establishes a localized empirical database and validates the necessity of expanding assessment boundaries to include auxiliary works in geologically complex regions. The developed framework provides a scalable solution for optimizing embodied carbon in urban infrastructure, offering policymakers a robust scientific basis for implementing precise “Green Public Procurement” and carbon budgeting strategies.

1. Introduction

1.1. Global Context and Industry Challenges

Climate change has emerged as a severe global challenge, necessitating urgent decarbonization strategies across all industrial sectors. The construction industry, a predominant consumer of energy and natural resources, accounts for nearly 40% of global carbon emissions [1]. Notably, the proportion of “embodied carbon”—emissions generated during material production and construction processes—has been steadily increasing. This trend highlights a critical frontier for mitigation efforts, as operational carbon is gradually reduced through energy efficiency measures. While significant progress has been made in reducing the carbon footprint of above-ground buildings and evaluating surface-level infrastructure (e.g., life-cycle and economic analyses of asphalt pavement rehabilitation strategies) [2,3], the environmental impact of underground infrastructure—particularly extensive urban sewerage and pipeline networks—remains insufficiently addressed. As governments worldwide accelerate public works to build climate-resilient cities, accurately assessing and mitigating the embodied carbon in these heavy civil engineering projects has become an urgent academic and practical priority.
Furthermore, the global water and wastewater industry is currently confronting unprecedented challenges regarding asset investment and sustainable development. As highlighted by existing studies, future infrastructure planning must strategically mitigate risks associated with climate change regulations, energy price volatility, and escalating capital and operating costs [4]. In this context, maximizing the carbon benefits of wastewater infrastructure projects—particularly by adopting low-emission construction methods like trenchless technologies—has become a critical priority to overcome these industry challenges and achieve long-term sustainability.

1.2. Technological Solutions: Microtunneling

In the field of civil pipeline engineering, trenchless technology has gained prominence as a preferred method for modern infrastructure development due to its minimized environmental footprint. Specifically, the short pipe jacking method utilizes hydraulic thrust and controlled excavation to install underground pipes while significantly reducing surface disruption [5]. For small-diameter pipelines (such as the Ø 400–Ø 600 mm pipes analyzed in this study), this technique is technically classified as microtunneling, characterized by highly automated operations and precise directional control [6,7].
When compared to traditional open-cut construction, microtunneling offers substantial environmental and social advantages. Open-cut methods typically involve massive excavation, extensive dewatering, traffic disruptions, and significant noise pollution. In contrast, microtunneling minimizes surface interference and drastically reduces the volume of excavated spoil. However, this trenchless approach also presents distinct disadvantages. It is highly dependent on heavy machinery and continuous power supply. More importantly, when encountering adverse geological conditions—such as hard gravel or cobble strata—the required cutterhead torque and jacking force surge dramatically, leading to a substantial increase in energy consumption. This vulnerability highlights the need for a more nuanced carbon assessment framework that accounts for geological variables.

1.3. Existing Literature and Carbon Benefits

International literature and Life Cycle Assessment (LCA) studies consistently corroborate the environmental advantages of trenchless technologies over traditional open-cut methods [6]. For instance, data from the United Kingdom Pipe Jacking Association (PJA) indicate that pipe jacking can typically achieve greenhouse gas (GHG) savings ranging from 50% to 75% [7]. However, these benchmarks are often derived from standard geological conditions, leaving a gap in understanding how complex environments affect these benefits.
To systematically identify the current research gaps, Table 1 synthesizes key studies and international guidelines focused on the environmental assessments and LCAs of trenchless technologies. Although the low-carbon potential of microtunneling is well-documented, most established models (such as those from the UK and Japan) are calibrated solely for standard, homogeneous soil conditions and shallow depths. Furthermore, comprehensive LCA boundaries that integrate both auxiliary materials (e.g., CLSM) and extreme geological variables remain sparse. This critical limitation highlights the necessity for empirical case studies conducted in geologically complex environments.

1.4. Local Context and Research Objectives

In the context of Taiwan’s infrastructure development, statistics from the National Land Management Agency (NLMA) reveal that the national public sewage system penetration rate has reached approximately 43% [13]. This indicates that infrastructure expansion remains in an active implementation phase. To address the lack of empirical carbon emission data under localized geological conditions, this study utilizes the “Hualien County Xincheng (Beipu Area) Sewage System Project” (initiated by the NLMA in 2022) as a primary case study. The project, spanning from July 2022 to August 2024 with a duration of approximately 800 days, primarily involved the installation of Precast Reinforced Concrete Pipes (RCP) with diameters of Ø 400 mm and Ø 600 mm. Given the cyclic nature of short pipe jacking, this research adopted an on-site inventory approach, sampling construction progress over a three-month period (March to May 2024) to construct a comprehensive profile of the project’s Carbon Footprint of Product (CFP) in a challenging geological environment.

2. Methodology

2.1. System Boundary and Assessment Framework

The assessment framework of this study follows the standardized Life Cycle Assessment (LCA) methodology defined by ISO 14040 and ISO 14044, integrating the sustainable construction standards established by the European Committee for Standardization (CEN/TC 350). The engineering-level calculation logic is derived from EN 15804:2012+A2:2019 [14,15], EN 15978:2011 [16], and ISO 14067:2018 [17] (aligned with CNS 14067 [18]), utilizing Environmental Product Declarations (EPDs) and Product Category Rules (PCRs) for core material data. Carbon emission factors were prioritized from the “Carbon Emission Factor Database for Common Public Works Products” published by the Public Construction Commission, Executive Yuan (PCC) [19]. Site-specific data were meticulously extracted from the contractor’s daily construction logs.
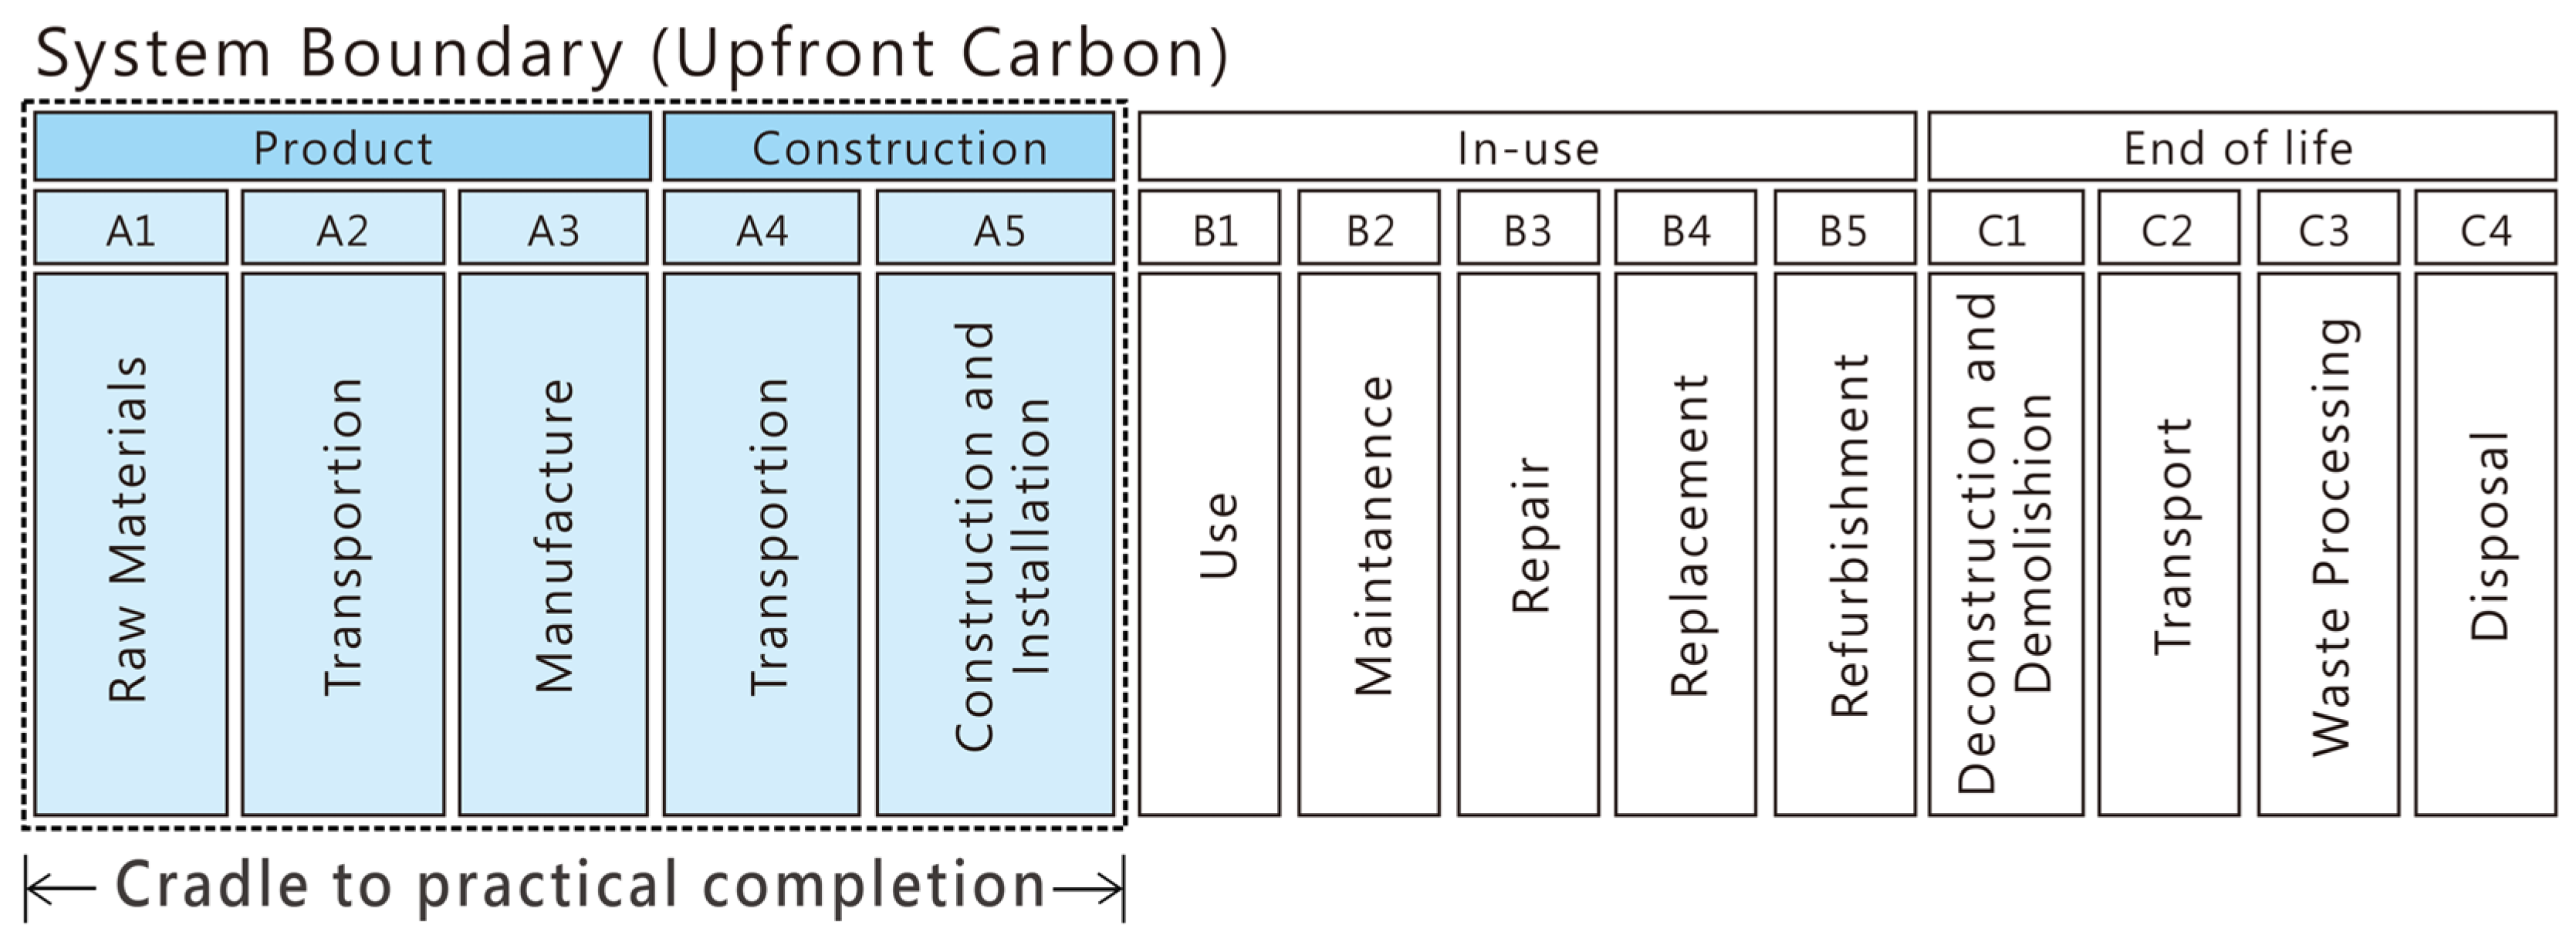
According to the World Green Building Council (World GBC), stages A1 to A5 are collectively defined as “Upfront Carbon” [20]. For civil pipeline engineering, this phase encompasses the entire embodied carbon footprint prior to infrastructure operation, representing the most critical control scope for decarbonization. The study boundary is defined as follows:
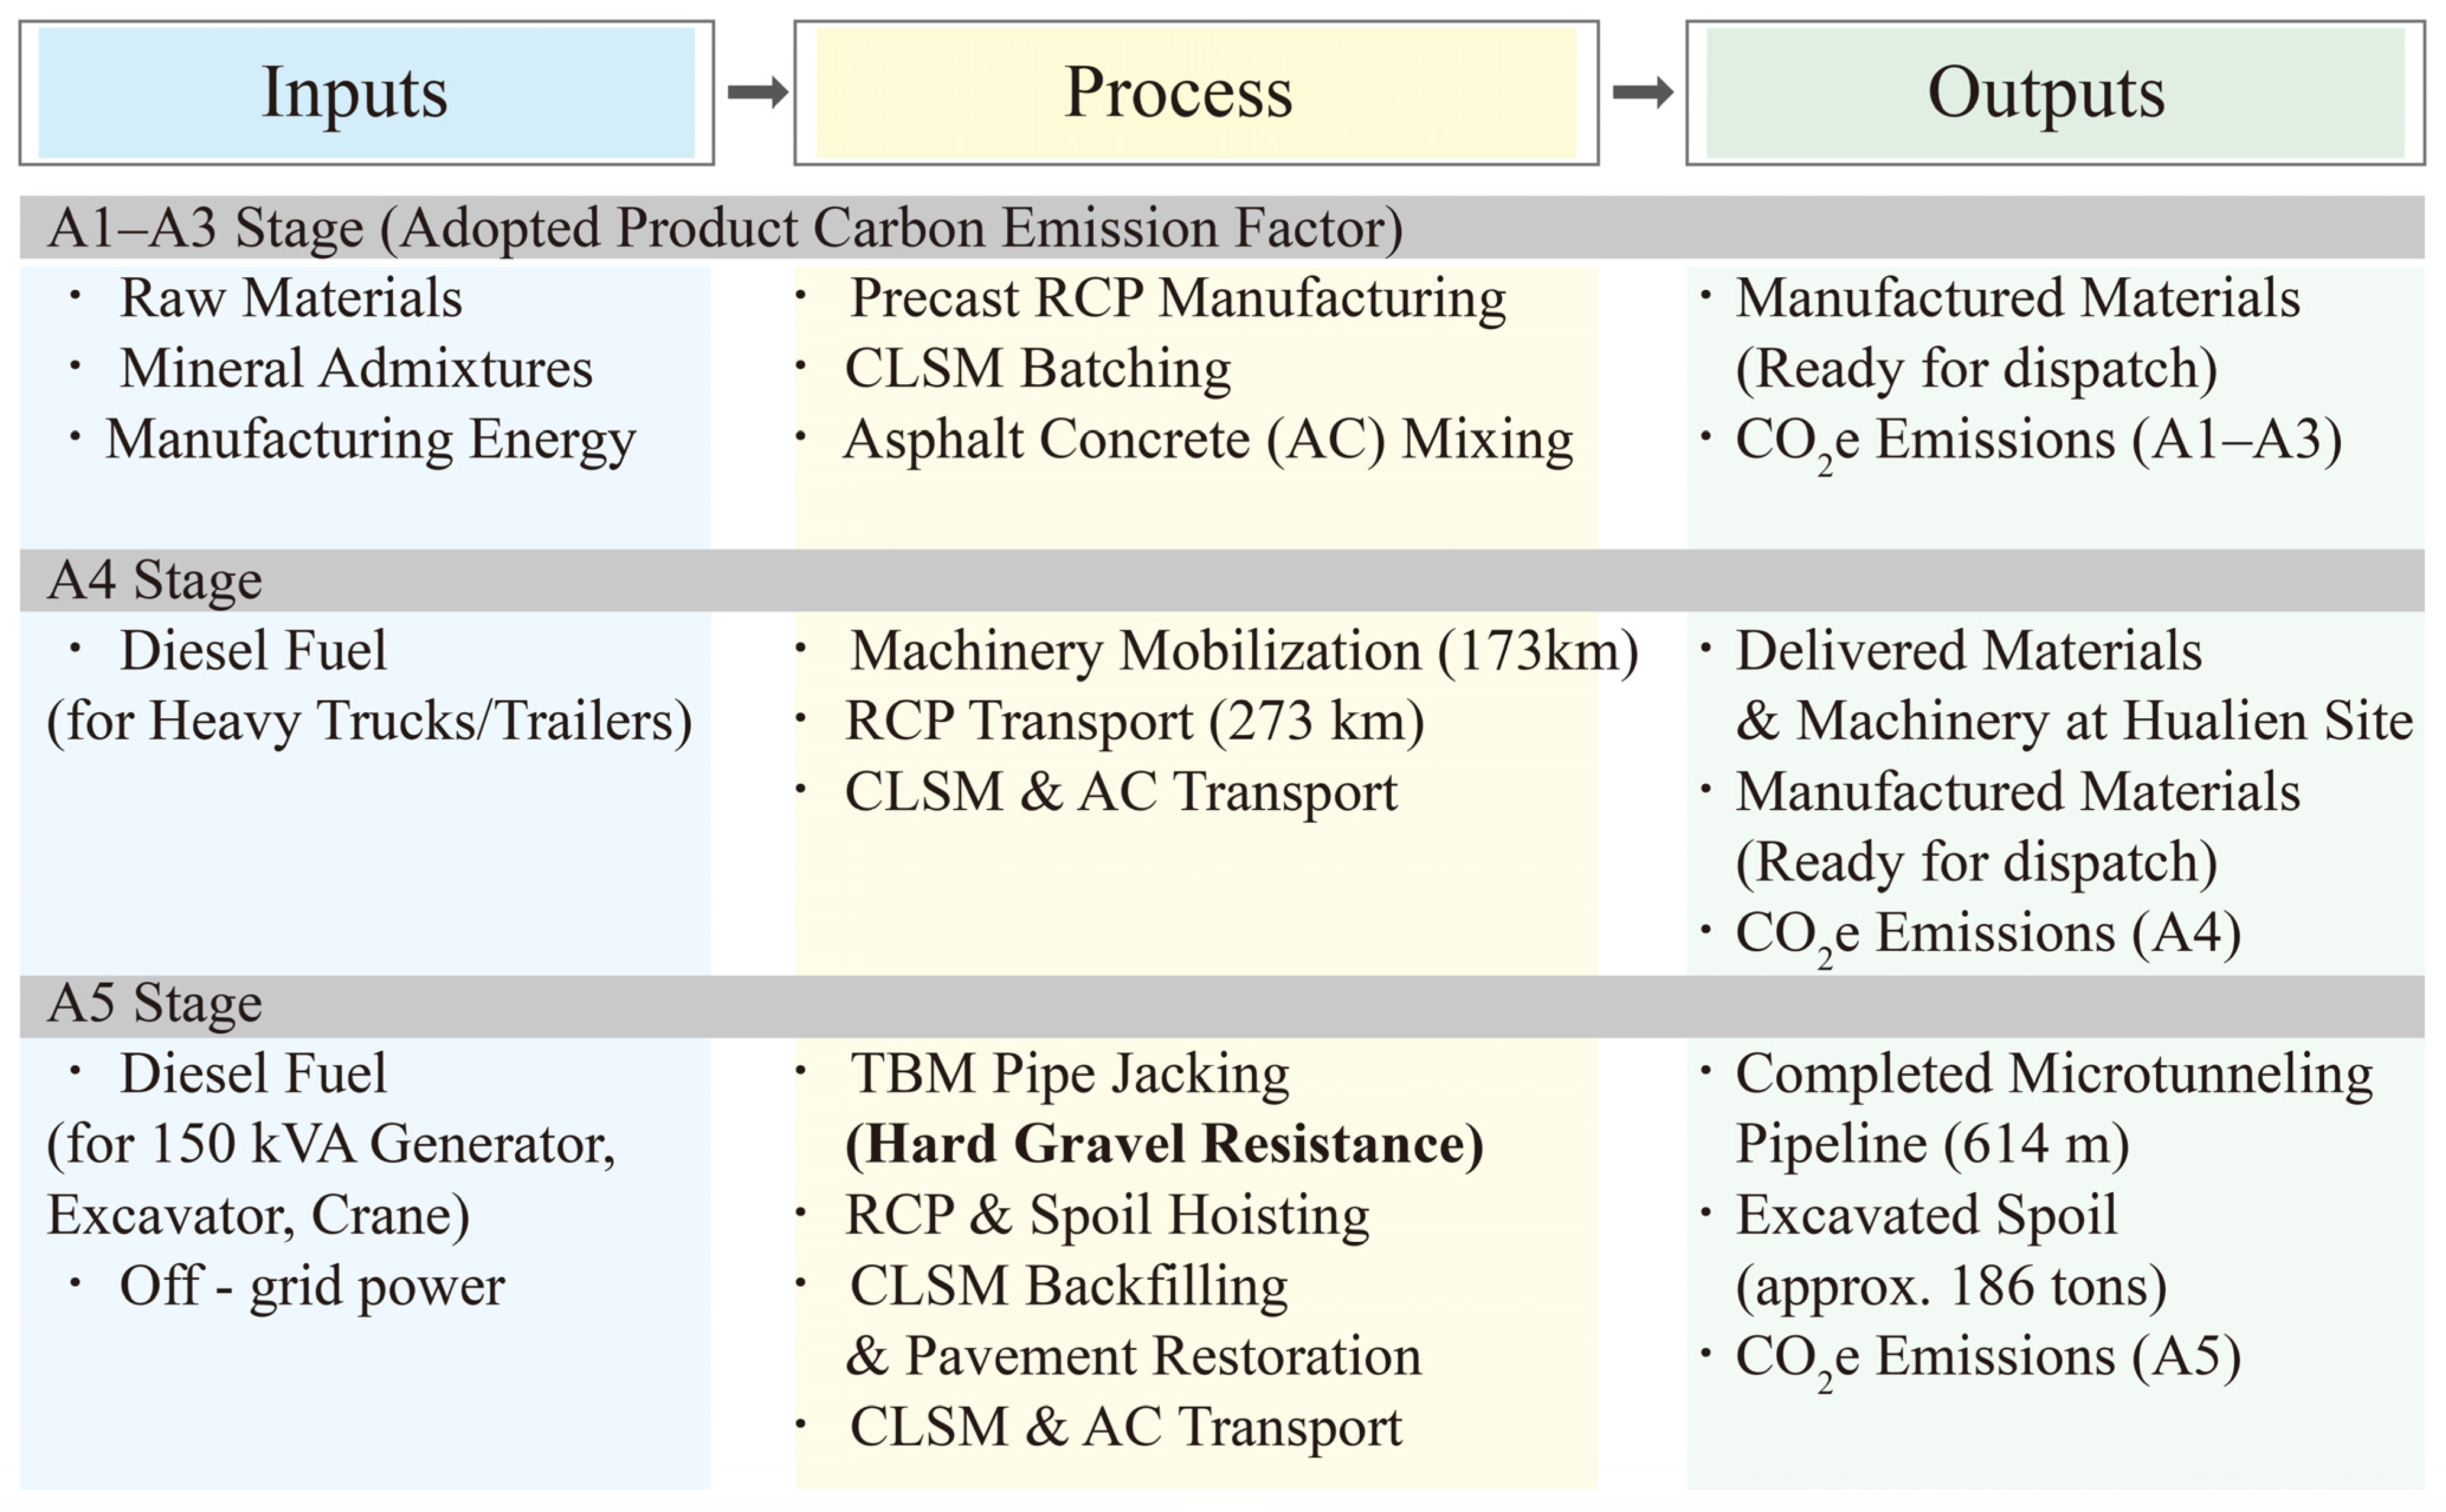
  • System Boundary: Strictly defined as “Cradle-to-Practical Completion,” covering modules A1 through A5, as illustrated in Figure 1. To systematically construct the Life Cycle Inventory (LCI), this study adopted the Input–Process–Output (IPO) model. This approach meticulously maps the material and energy flows across each construction phase, ensuring all core inputs (e.g., materials, fuel) and corresponding outputs (e.g., carbon emissions, excavated spoil) are strictly accounted for within the system boundary (Figure 2).
  • Data Granularity:
    (1)
    Primary Data: For the A5 (Construction Installation) stage, daily fuel consumption records were collected for the 150 kVA diesel generator powering the Tunnel Boring Machine (TBM) and the Hydraulic Power Unit (HPU), along with precise records of spoil removal volumes and truck frequencies.
    (2)
    Secondary Data: For Modules A1–A3, items include Reinforced Concrete Pipes (RCP), Controlled Low Strength Material (CLSM), and Asphalt Concrete (AC). For A4 (Transport to Site), transportation distances for machinery and materials were estimated via Google Maps, with emission factors sourced from the localized “Heavy Vehicle Ton-Kilometer” coefficients provided by the Ministry of Environment [21].
  • Cut-off Criteria: Individual material or energy flows contributing less than 1% of the total greenhouse gas emissions across the intended life cycle were neglected, provided the cumulative excluded emissions did not exceed 5% [21].

2.2. Quantification Model

A summation approach was employed to calculate the total Global Warming Potential (GWP), as expressed in Equation (1):
G W P t o t a l   =   G W P   A 1 A 3 +   G W P A 4     +   G W P A 5  
where:
G W P t o t a l : Total Global Warming Potential (kgCO2e).
G W P A 1 A 3 : Emissions from the Product Stage.
G W P A 4 : Emissions from the Transport to Site Stage.
G W P A 5 : Emissions from the Construction Installation Stage.

2.2.1. Product Stage (GWP A1–A3)

For permanent and consumable materials (e.g., RCP, CLSM, AC), the emissions are calculated using Equation (2):
GWP   A 1 A 3 = i = 1 n ( Q i × E F p r o d , i )    
where:
Q i   is the quantity of the i material;
E F p r o d , i   is its corresponding emission factor.

2.2.2. Transport Stage (GWPA4)

This stage covers the mobilization of machinery (e.g., HPU, TBM, gantry cranes) and material delivery, calculated via Equation (3):
G W P A 4 = j = 1 m ( M i × D i s t j × E F t r a n s , j )  
where:
M j is the weight (ton) of the j object;
D i s t j is the round-trip distance (km);
E F t r a n s , j is the emission factor, kgCO2e/ton/km.

2.2.3. Construction Installation Stage (GWPA5)

Emissions primarily consist of fuel consumption and spoil disposal, using the 2025 announcement data from the Energy Administration (MOEA), expressed in Equation (4):
G W P A 5 = k = 1 p ( V f u e l , k × E F f u e l ) +   ( V w a s t e × E F w a s t e   t o t a l )  
where:
V f u e l , k is the diesel consumption (L) of the k machine;
E F f u e l is the fuel emission factor;
V w a s t e is the volume of spoil (m3);
E F w a s t e   t o t a l is the factor for spoil treatment.

2.3. International Benchmarking and Scenario Simulation

To enhance the international comparability of this case study, data from authoritative global bodies were integrated, including the UK Pipe Jacking Association (PJA), the UK Society for Trenchless Technology (UKSTT) [7,22], and the Japan Sewage Works Association (JSWA) [11,12]. The integration process involved the following structured approaches:
  • Data Categorization:
    (1)
    Material Embodied Carbon: Data were primarily sourced from the Taiwan PCC database [19]. This selection acknowledges that material emissions are intrinsically linked to local energy structures and manufacturing processes, requiring localized coefficients for accuracy.
    (2)
    Decarbonization Benchmarking: Reference was made to UKSTT [23] studies to define the standard energy-saving potentials of pipe jacking relative to traditional open-cut methods.
    (3)
    Energy Consumption Parameters: Technical specifications regarding machinery power output and fuel consumption rates were derived from the JSWA Decarbonization Manual [11].
  • Calibration and Standardization:
    (1)
    Functional Unit Consistency: All datasets were normalized to a standardized functional unit: “carbon emissions per meter of installed length (kgCO2e/m).” This ensures that comparisons across different projects and regions remain valid.
    (2)
    Energy Emission Baselines: Grid electricity and fuel emission factors from the UK (Department for Energy Security) [24] and Japan (Ministry of the Environment) [25,26] were utilized. These were explicitly compared against Taiwan’s 2024 grid factor [21] to isolate the specific impact of regional energy structures on construction carbon efficiency.
  • Application of Benchmarking Tools and Scenario Simulation:
Building upon this standardized framework, this study utilized the PJA Carbon Calculator to compare the empirical data with international standards. The specific conditions of the Hualien project—specifically a 600 mm diameter RCP, a length of 614 m, and a depth of 12 m—were input into the calculator to estimate the baseline spoil volumes for both open-cut and pipe jacking methods.
Furthermore, a scenario simulation was conducted to evaluate the mitigation potential of energy substitution. The methodology involved recalculating the Stage A5 emissions by hypothetically replacing the fuel consumption of the on-site 150 kVA diesel generator with equivalent grid electricity supply.

2.4. Sensitivity Analysis Framework

To isolate and quantify the impact of geological conditions on construction energy consumption (Stage A5), a sensitivity analysis was designed. The analysis evaluates the variation in carbon intensity across different geological hardness levels, utilizing the Standard Penetration Test (SPT) N-value as the primary variable. The baseline was set to typical clay/sand conditions (N < 20) defined by JSWA and PJA benchmarks, which was then compared against moderate gravel (20 < N < 50) and the hard gravel formation (N > 50) observed in the Hualien case.

3. Case Study

3.1. Project Background and Geological Environment

3.1.1. Project Scope and Geographical Context

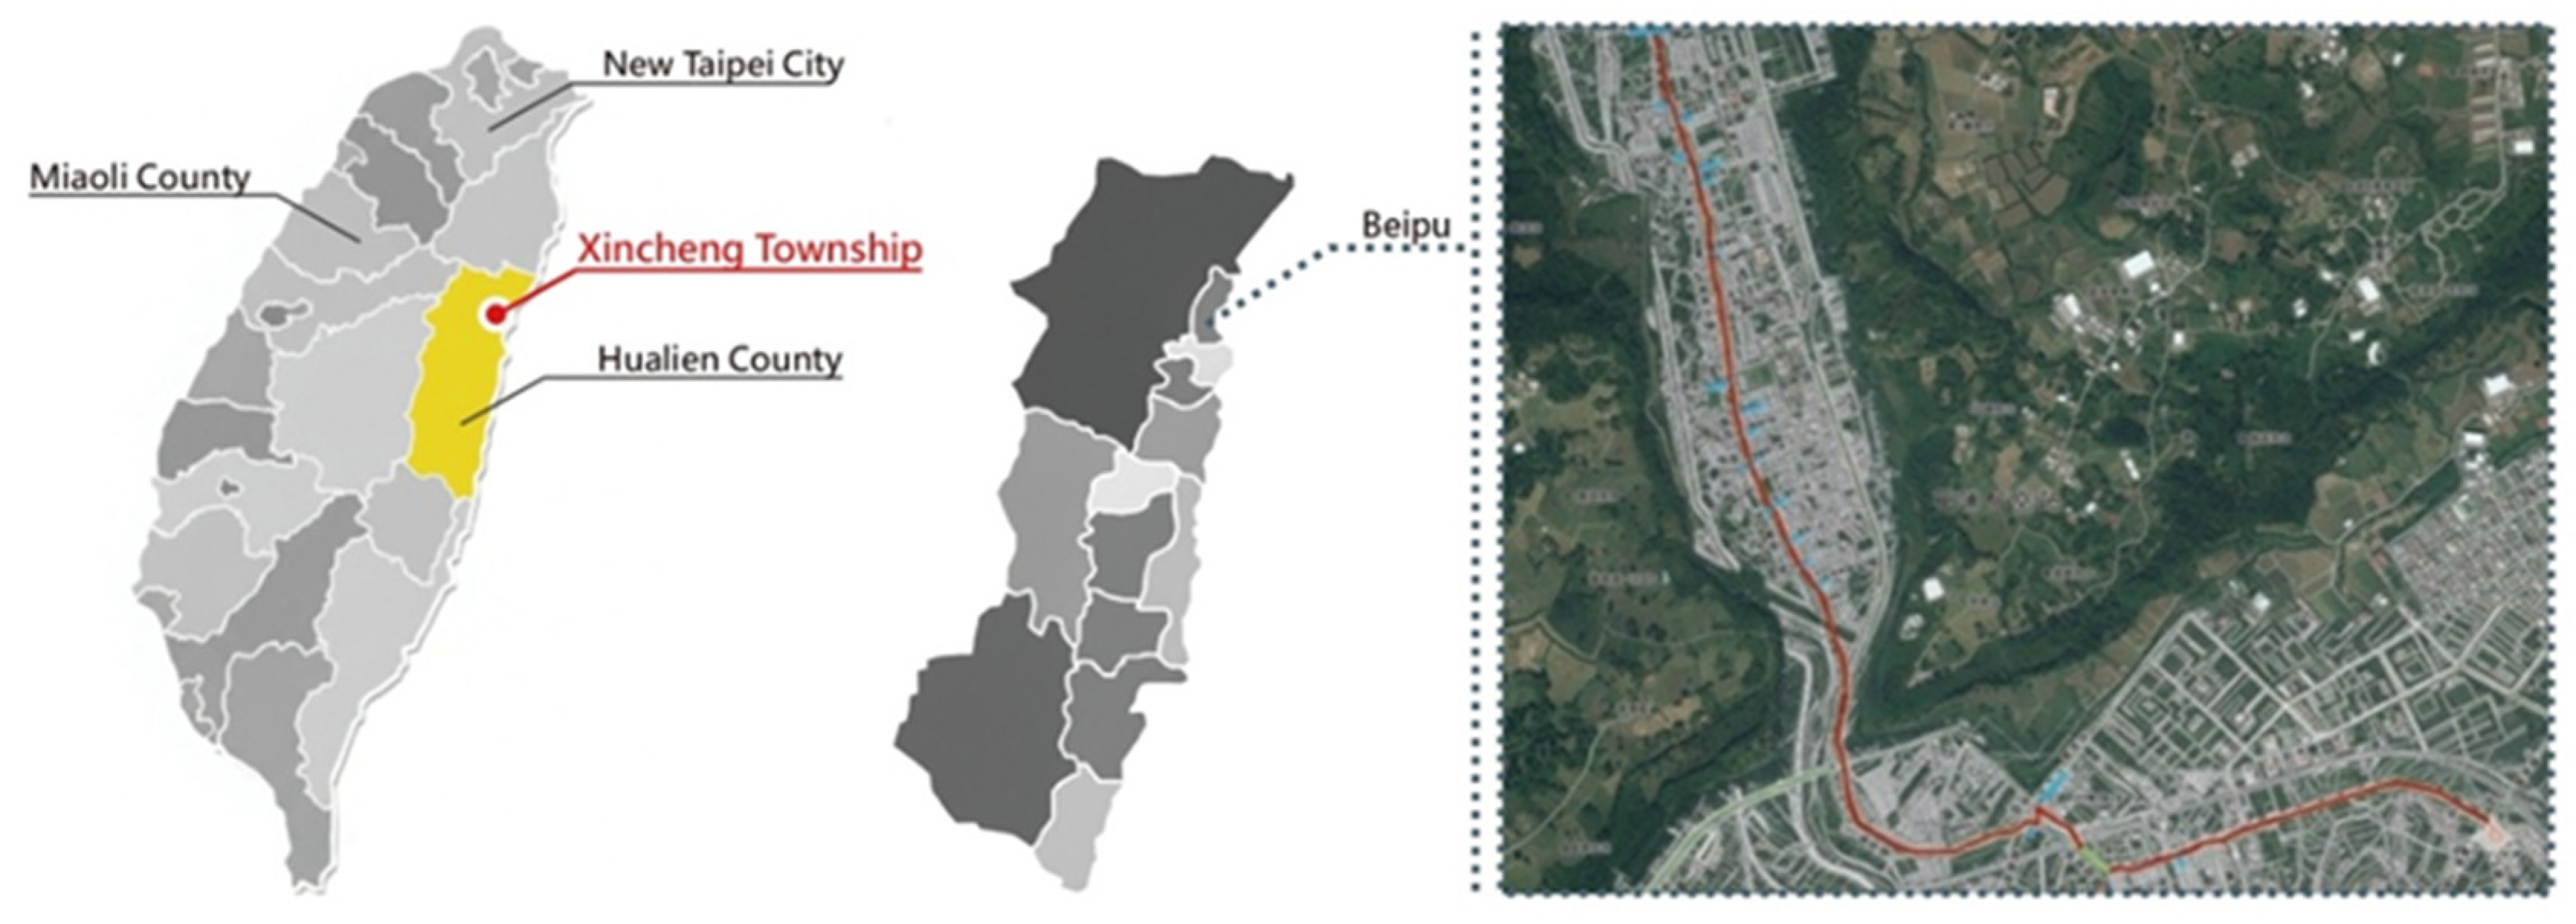
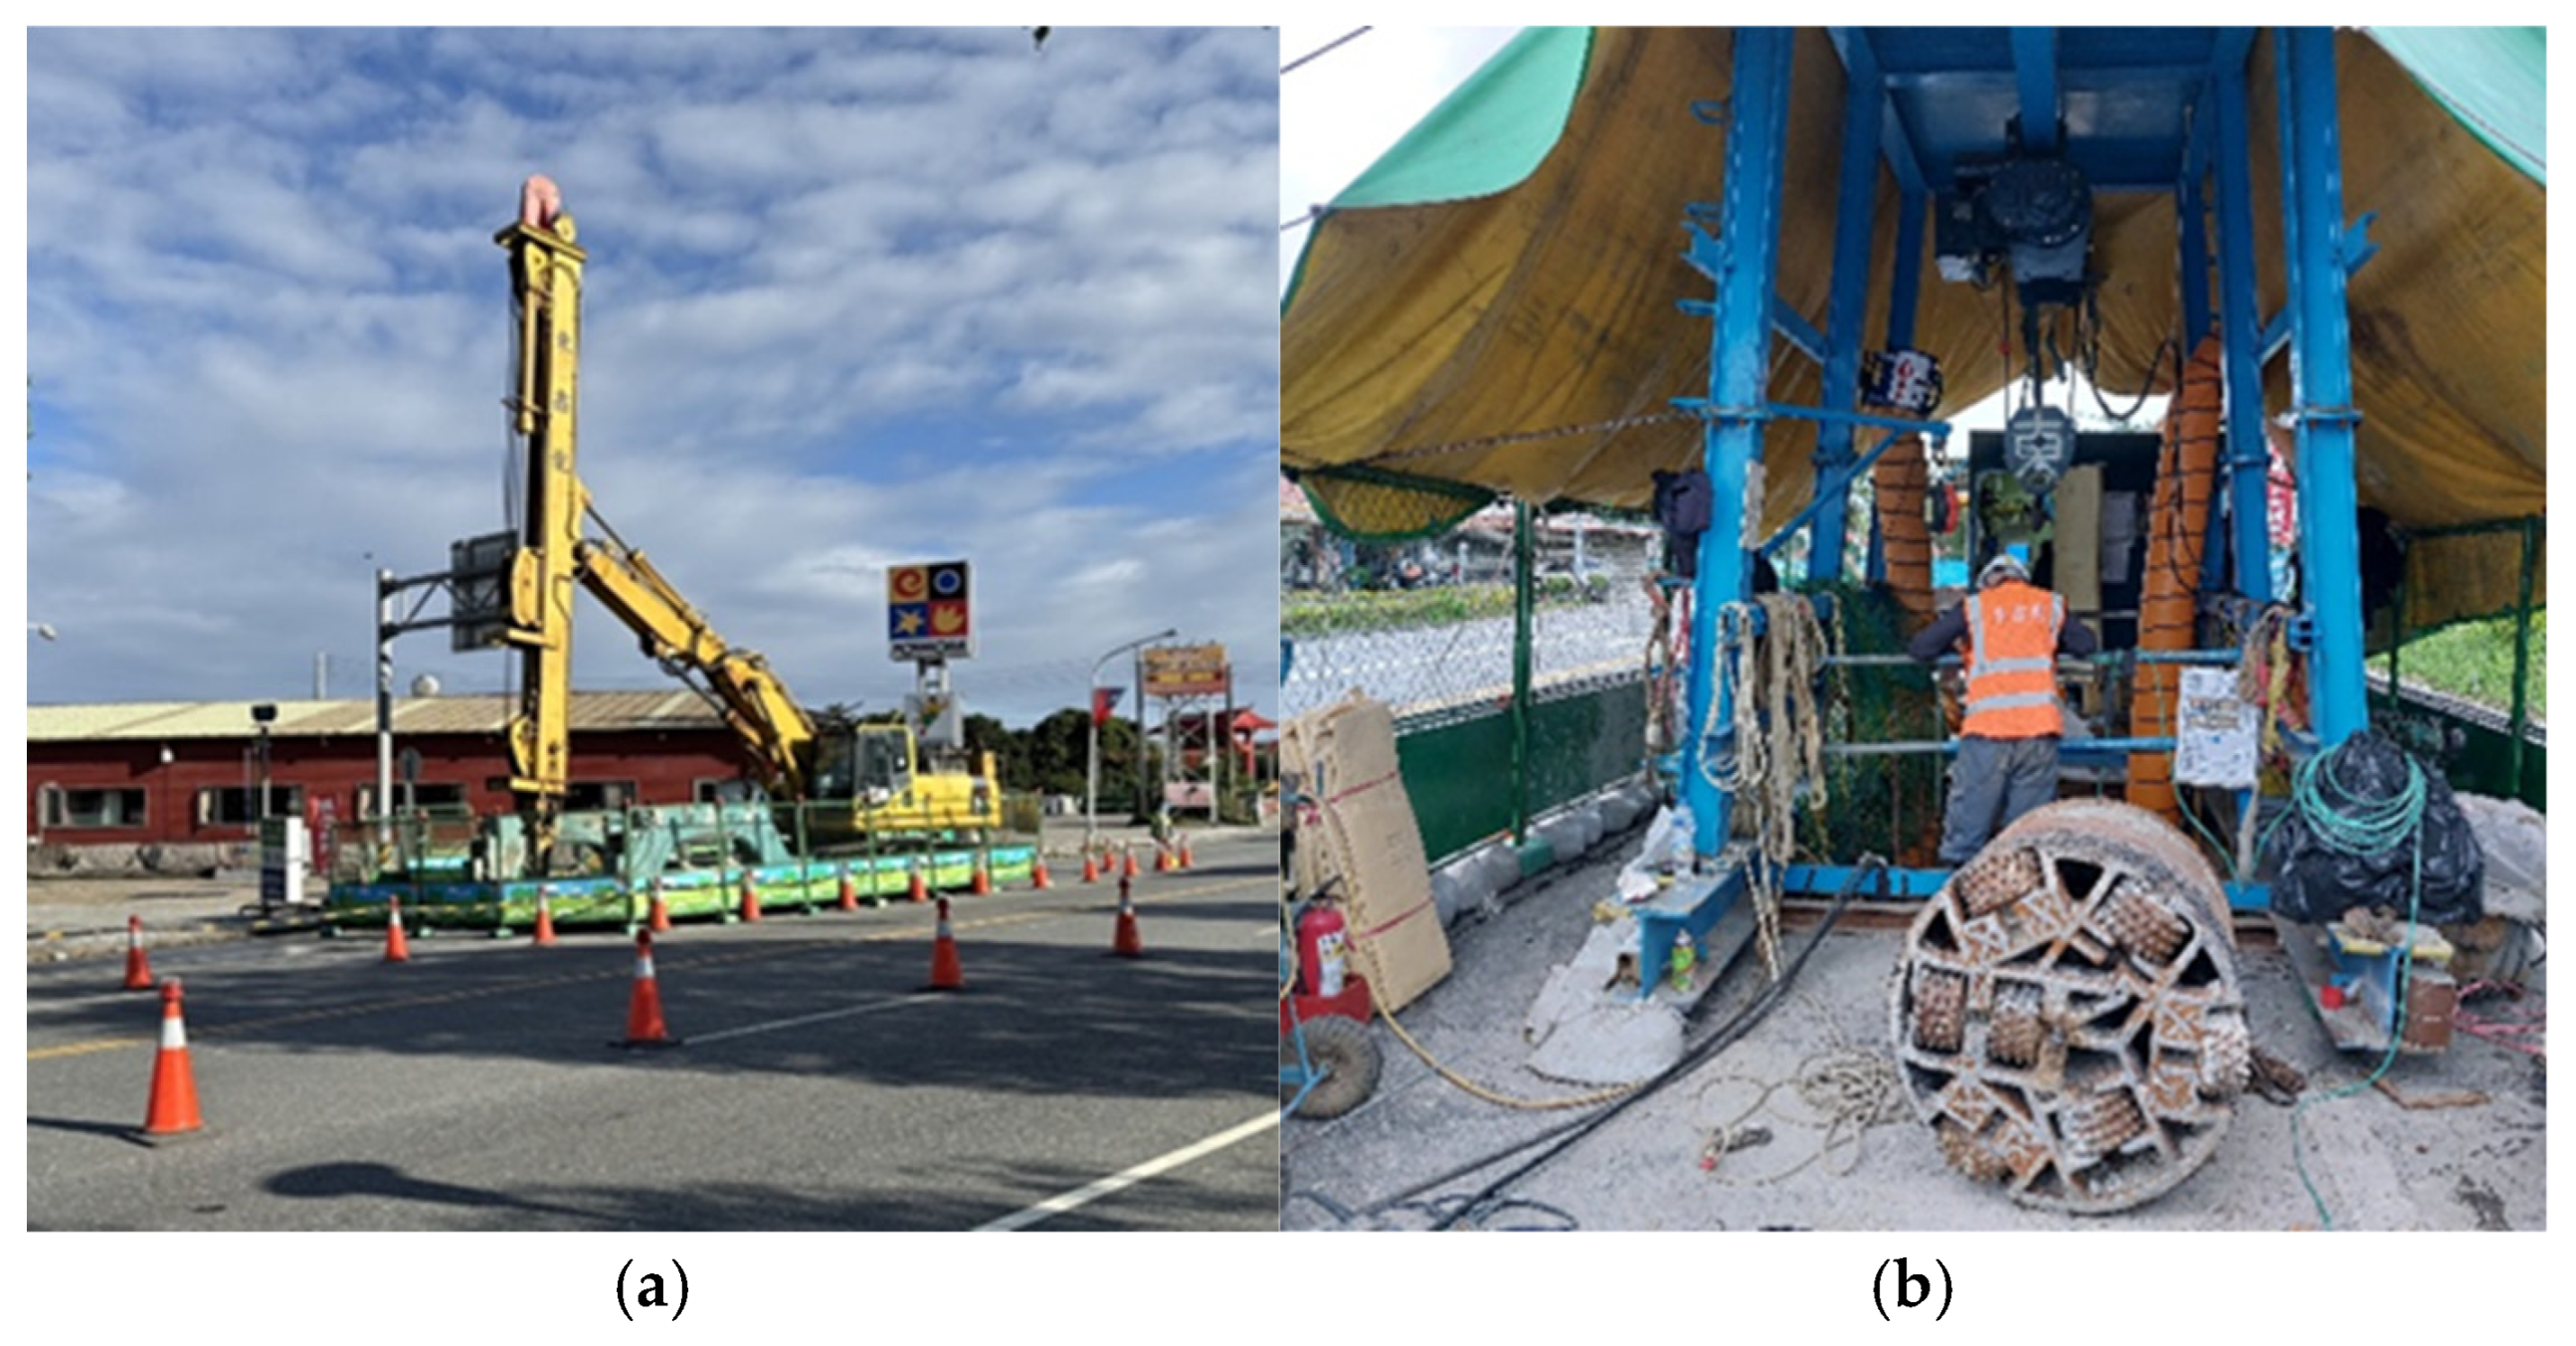
The empirical case selected for this study is the “Xincheng Beipu Sewage System Project” in Hualien County (Coordinates: 24°2′ N, 121°36′ E). The carbon emission inventory scope is illustrated in Figure 3, where the red line indicates the RCP installation route along the main arterial roads of Beipu Village. The pipeline burial depth ranges between 10 and 12 m. Figure 4 presents site photographs, including (a) a long-reach excavator for the working shaft, and (b) the gantry crane and the TBM cutter head.

3.1.2. Geological Challenges: The Impact of Adverse Strata

The project site is located on the Hualien alluvial fan plain, presenting highly challenging geological conditions. According to the project’s Geotechnical Investigation Report, the subsurface strata below GL −0.2 m are predominantly composed of a “gravel layer mixed with silt and coarse sand.” The specific geological characteristics at the pipeline burial depth (GL −10 m to −12 m) and their implications for carbon assessment are analyzed below:
  • Increased Energy Demand Due to High Soil Resistance (Impact on Stage A5 Emissions):
Borehole logs indicate that the gravel layer within the pipe jacking zone is extremely dense. Standard Penetration Test (SPT) results consistently yielded N-values greater than 50 (N > 50), confirming the extreme hardness of the formation. To overcome this substantial geological resistance, the Tunnel Boring Machine (TBM) required significantly higher torque and thrust. Consequently, the load factors of the Hydraulic Power Unit (HPU) and diesel generators remained at elevated levels for extended periods. This strictly physical requirement resulted in a marked increase in fuel and electricity consumption coefficients during the construction process (Stage A5).
2.
Groundwater Levels and Decarbonization Benefits:
The groundwater table at the site exhibits significant fluctuation between GL −2.0 m and −10.0 m, with levels in most areas situated above the pipeline alignment. Had conventional open-cut methods been employed, extensive and prolonged wellpoint dewatering would have been mandatory, resulting in substantial energy consumption and carbon emissions associated with pumping operations. In contrast, the adoption of the Slurry Pressure Balance (SPB) jacking method effectively balanced groundwater pressure and eliminated the necessity for dewatering. This represents a significant “hidden” decarbonization benefit of trenchless technology within Stage A5.

3.2. Short Pipe Jacking Construction Plan

3.2.1. Construction Process and Cyclic Operations

The project utilized the Short Pipe Jacking Method, characterized by highly standardized cyclic operations. To address the challenges of deep overburden and hard geological formations, a repetitive jacking cycle was implemented. The inherent periodicity of these procedures establishes a stable linear correlation between energy consumption (fuel/electricity) and material input. This consistency provides a robust theoretical justification for using a “three-month sampling inventory” as a representative basis for estimating the total carbon footprint of the project.

3.2.2. Equipment Configuration and Material Inventory

  • Heavy Machinery Deployment:
Key equipment deployed on-site included the Hydraulic Power Unit (HPU), Tunnel Boring Machine (TBM), slurry separation systems, gantry cranes, and diesel generators.
2.
Material Specifications and Quantities:
To transparently establish the Life Cycle Inventory (LCI) for the Product Stage (A1–A3), the exact consumption volumes and corresponding product carbon emission factors for key materials are detailed as follows:
(1)
Reinforced Concrete Pipes (RCP): The project installed a total length of 614 m of precast RCPs. The specific product carbon emission factor adopted for these pipes was 151 kgCO2e/piece [19].
(2)
Controlled Low-Strength Material (CLSM): A total volume of 186 m3 of CLSM was utilized for shaft backfilling. To reduce the environmental impact, the CLSM incorporated 62% mineral admixtures (e.g., fly ash or slag) as a cement replacement, resulting in a significantly reduced emission factor of 95 kgCO2e/m3 [19].
(3)
Asphalt Concrete (AC): For the final surface and pavement restoration phase, a total of 33 m3 of asphalt concrete was applied, with a cited emission factor of 77 kgCO2e/m3 [19].

3.3. Logistics and Transportation Characteristics

Due to the geographical isolation of Hualien, separated from Western Taiwan by the formidable Central Mountain Range, the project faced significant logistical challenges necessitating long-distance transportation. Transport distances were calculated based on actual hauling routes using Google Maps. To ensure the reliability of the life cycle inventory (LCI) and the subsequent sensitivity analysis, specific data handling protocols were established for key influencing factors under dynamic working conditions. For transportation routing (Module A4), delivery distances were calculated based on actual road networks from local suppliers to the Hualien construction site using geographic information systems (GIS), specifically selecting primary freight routes to reflect realistic logistical operations. Furthermore, to account for unavoidable on-site operational variations, a conservative material loss rate of 5% was uniformly applied to primary consumables—including RCP, CLSM, and asphalt concrete—aligning with standard civil engineering estimation practices. Establishing these definitive baseline parameters was crucial, as it allowed the sensitivity model to effectively isolate and accurately evaluate the primary variables of interest: geological resistance and regional grid emission factors. The primary logistical scenarios are detailed as follows:
  • Heavy Machinery Mobilization:
Major equipment, including full-casing oscillators, jacking stations, and large-capacity generators, was mobilized from the contractor’s central warehouse in Xindian, New Taipei City. This involved a one-way transport distance of approximately 173 km.
2.
Primary Pipe Materials (RCP):
Reinforced Concrete Pipes (RCP) were procured from a specialized precast plant in Miaoli County, Western Taiwan. As this facility was the sole manufacturer capable of meeting the project’s specific technical requirements, a significant one-way transport distance of 273 km was necessitated.
3.
Construction Materials:
(1)
Ready-mixed Concrete: Sourced from a local batching plant with a minimal transport distance of 2.5 km.
(2)
Controlled Low-Strength Material (CLSM): Transported from a regional plant located 42.6 km from the site.
4.
Spoil Disposal: Surplus excavated soil was transported 27.2 km to a designated resource stacking site for disposal or reuse.

4. Results and Discussion

4.1. Analysis of Carbon Footprint Characteristics from Cradle to Practical Completion

4.1.1. Environmental Characteristics of Hualien: Engineering Challenges of Environmental Determinism

Hualien County is located on the eastern coast of Taiwan. Due to the geographical barrier of the Central Mountain Range, the transportation of construction materials from Western Taiwan relies exclusively on the northern or southern coastal highways (Su-Hua or South-Link Highway). This geographical constraint significantly increases carbon emissions in the A4 transport stage. Geologically, the region is predominantly composed of hard gravel or cobble strata, which correspondingly escalates emissions in the A5 construction stage.
The geological conditions of this project dictated the adoption of trenchless technology to meet the technical requirements for “high strength” and “high durability.” This necessity directly led to a high dependency on Reinforced Concrete (RC) materials. Deeply buried sewage pipelines must withstand immense overburden loads, groundwater buoyancy, and potential seismic shear failure. Consequently, heavy-duty Reinforced Concrete Pipes (RCP) became an indispensable choice, thereby increasing emissions in the A1–A3 product stages.

4.1.2. Carbon Footprint Inventory Results

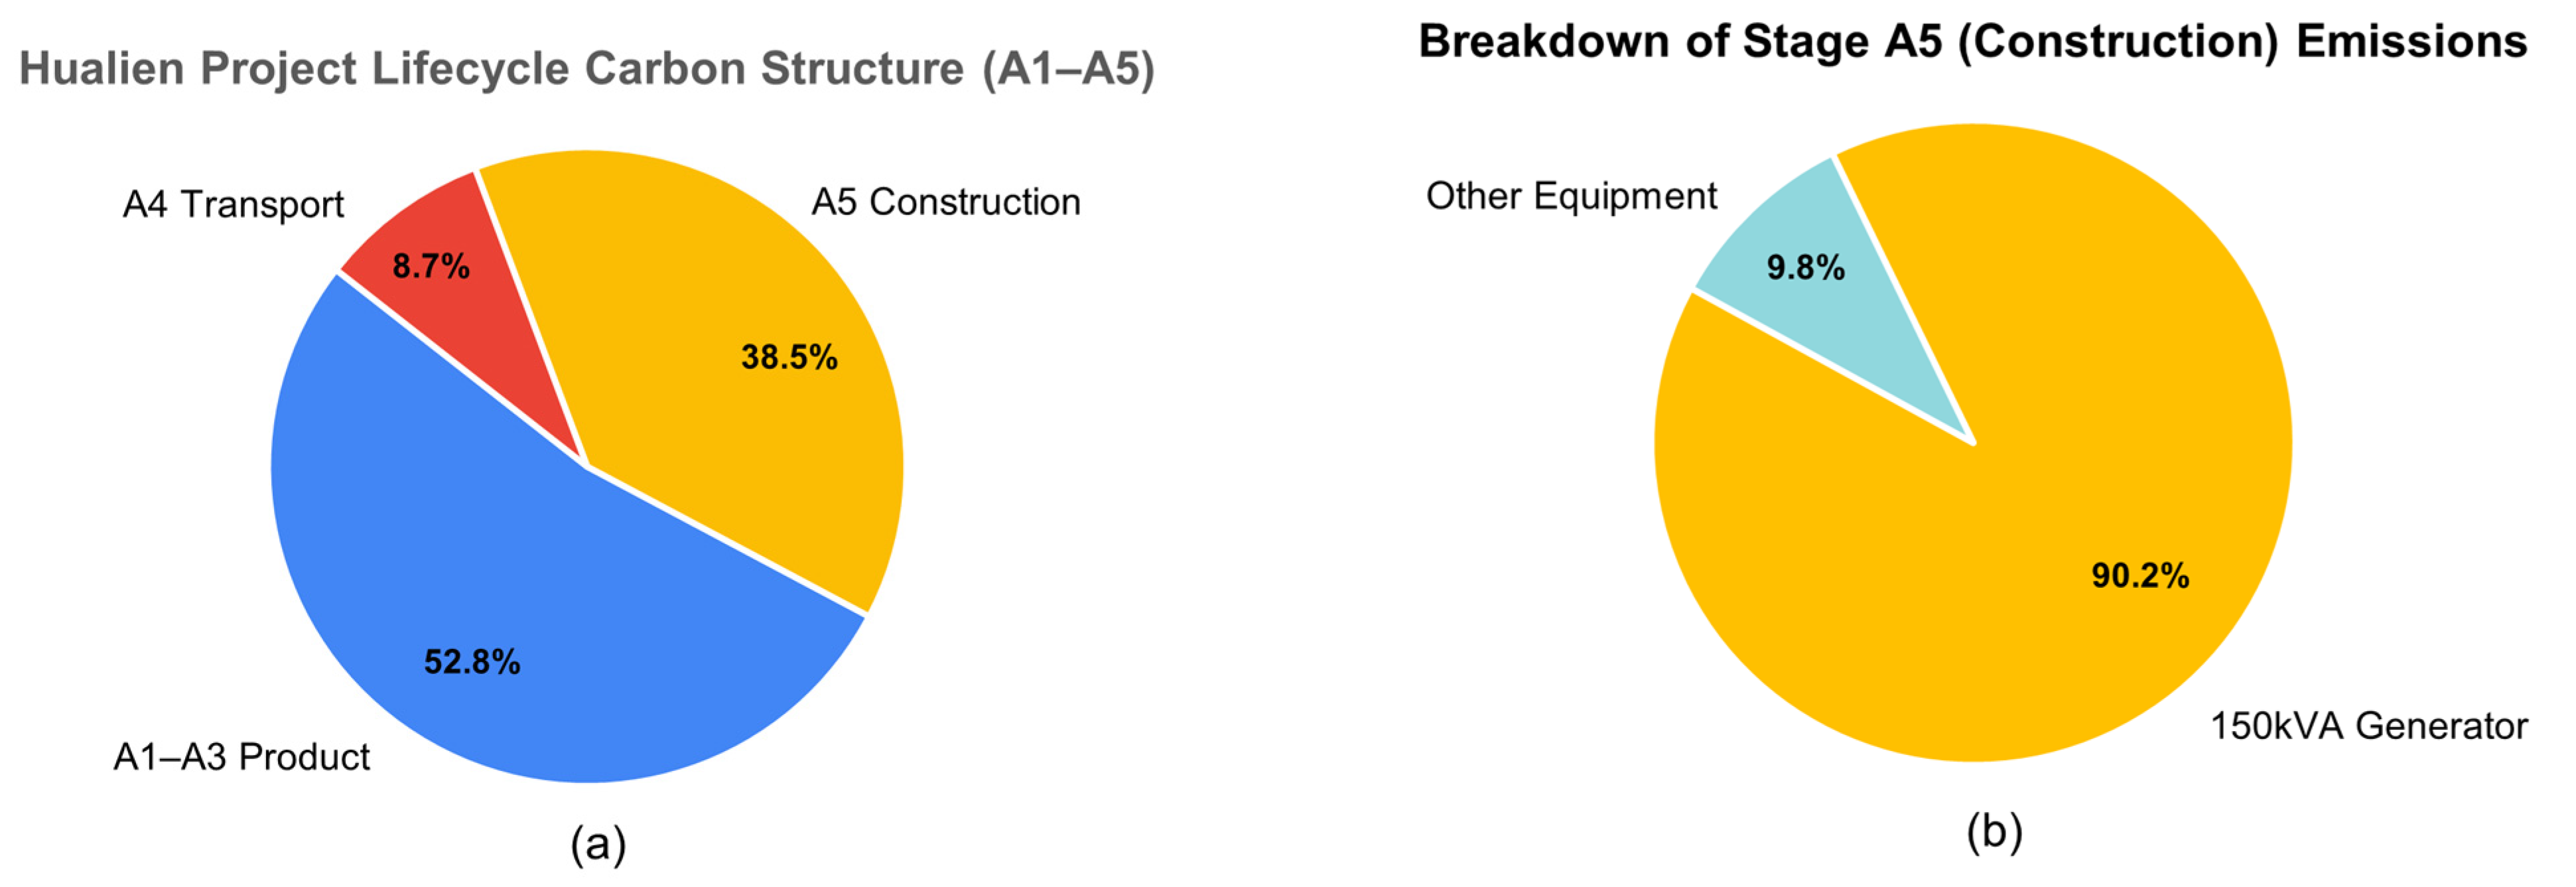
The empirical results of this study indicate that the total carbon emissions for the “Cradle-to-Practical Completion” boundary amounted to 214,003 kgCO2e. With a completed RCP length of 614 m, the unit carbon emission intensity is 349 kgCO2e/m. The distribution of emissions across different stages (as shown in Table 2 and Figure 5) is analyzed as follows:
  • Product Stage (A1–A3, 52.8%): Representing the largest emission source, this is primarily driven by the production of RCP pipes and the extensive use of Controlled Low-Strength Materials (CLSM).
  • Transport Stage (A4, 8.7%): This significant proportion is influenced by the long-distance transportation required within the material supply chain due to geographical isolation.
  • Construction Process Stage (A5, 38.5%): This figure reflects the direct impact of unique geological conditions on mechanical energy consumption. The power for the Tunnel Boring Machine (TBM) and Hydraulic Power Unit (HPU) was supplied entirely by a 150 kVA diesel generator, which directly contributed to 90% of the carbon emissions in the A5 stage.

4.2. Structural Analysis of Carbon Hotspots

4.2.1. Carbon Costs of Geographical Constraints: The Impact of Long-Distance Supply Chains

The carbon emissions in the A4 transport stage amounted to 18,626 kgCO2e, accounting for approximately 8.7% of the project’s total emissions. This figure is primarily attributed to the long-distance transportation of Reinforced Concrete Pipes (RCP) and Controlled Low-Strength Materials (CLSM), which together contributed to over 90% of the emissions in the A4 stage. This disproportionately high percentage reflects the structural dilemma of “geographical isolation” faced by public works projects in Eastern Taiwan regarding supply chain logistics.

4.2.2. Geological Determinants: Anomalous Proportions in the A5 Stage

The carbon emissions in the A5 construction process stage reached 82,339 kgCO2e, representing approximately 38.5% of the total project emissions. This anomaly was predominantly driven by hard geological conditions, which necessitated the Tunnel Boring Machine (TBM) and Hydraulic Power Unit (HPU) to operate at high load factors for extended periods. Consequently, carbon emissions from diesel generator fuel consumption alone reached 74,255 kgCO2e, accounting for approximately 90% of the emissions within the A5 stage.

4.2.3. Distribution of Major Emission Hotspots

  • Product Stage (A1A3):
The carbon emissions from the product stage (A3) amounted to 113,038 kgCO2e, accounting for approximately 52.8% of the project’s total emissions. Within this stage, precast Reinforced Concrete Pipes (RCP) were the primary contributor, accounting for approximately 82.2% of the emissions. Controlled Low-Strength Material (CLSM) contributed about 15.6%, while Asphalt Concrete (AC) accounted for approximately 2.3%.
2.
Transport Stage (A4):
Core Components (Φ600 mm RCP): Due to the lack of manufacturing facilities in Hualien that meet the required specifications, these components had to be supplied from Miaoli County in Western Taiwan. The one-way transport distance was as long as 273 km, contributing to approximately 43.6% of the total transport emissions.
CLSM: Under the official certification and grading management system, the suppliers for CLSM and structural ready-mix concrete are categorized differently. In this project, the CLSM supplier was located 42.6 km from the construction site, accounting for approximately 47.3% of the transport emissions. This stands in stark contrast to the structural concrete plant used in other Hualien projects, which had a transport distance of only 2.5 km.
3.
Construction Process Stage (A5):
Fuel Consumption: The fuel consumption of generators powering the TBM and HPU accounted for approximately 90.2% of the A5 emissions. This is directly correlated with the high hardness of the gravel and cobble geological formations in the Hualien region.
Equipment Usage: Fuel consumption from crane trucks (for hoisting RCP) accounted for approximately 7.7%, while dump trucks (for transporting spoil) accounted for about 2.1%.
Comparison with Traditional Methods: The volume of spoil for this pipe-jacking project was only 120 m3, highlighting the distinct advantage of trenchless technology. Its emission proportion is significantly lower than that of traditional open-cut methods. This case study corroborates the findings of Ariaratnam et al. [8], who noted that “overall average emissions from traditional open-cut methods are approximately 78–88% higher than those from trenchless pipe methods.” Furthermore, it underscores the importance of Short Pipe Jacking as an environmentally friendly trenchless technology in the sustainability assessment of urban infrastructure [27].

4.3. International Comparison of Carbon Emission Structures

This study compares the obtained results with the technical benchmarks established by the Japan Sewage Works Association (JSWA) [11,12], as well as reports from the United Kingdom Pipe Jacking Association (UKPJA), the International Society for Trenchless Technology (ISTT) [7,28], and the United Kingdom Society for Trenchless Technology (UKSTT) [23]. The comparative analysis is presented as follows:

4.3.1. Comparison with JSWA Standards

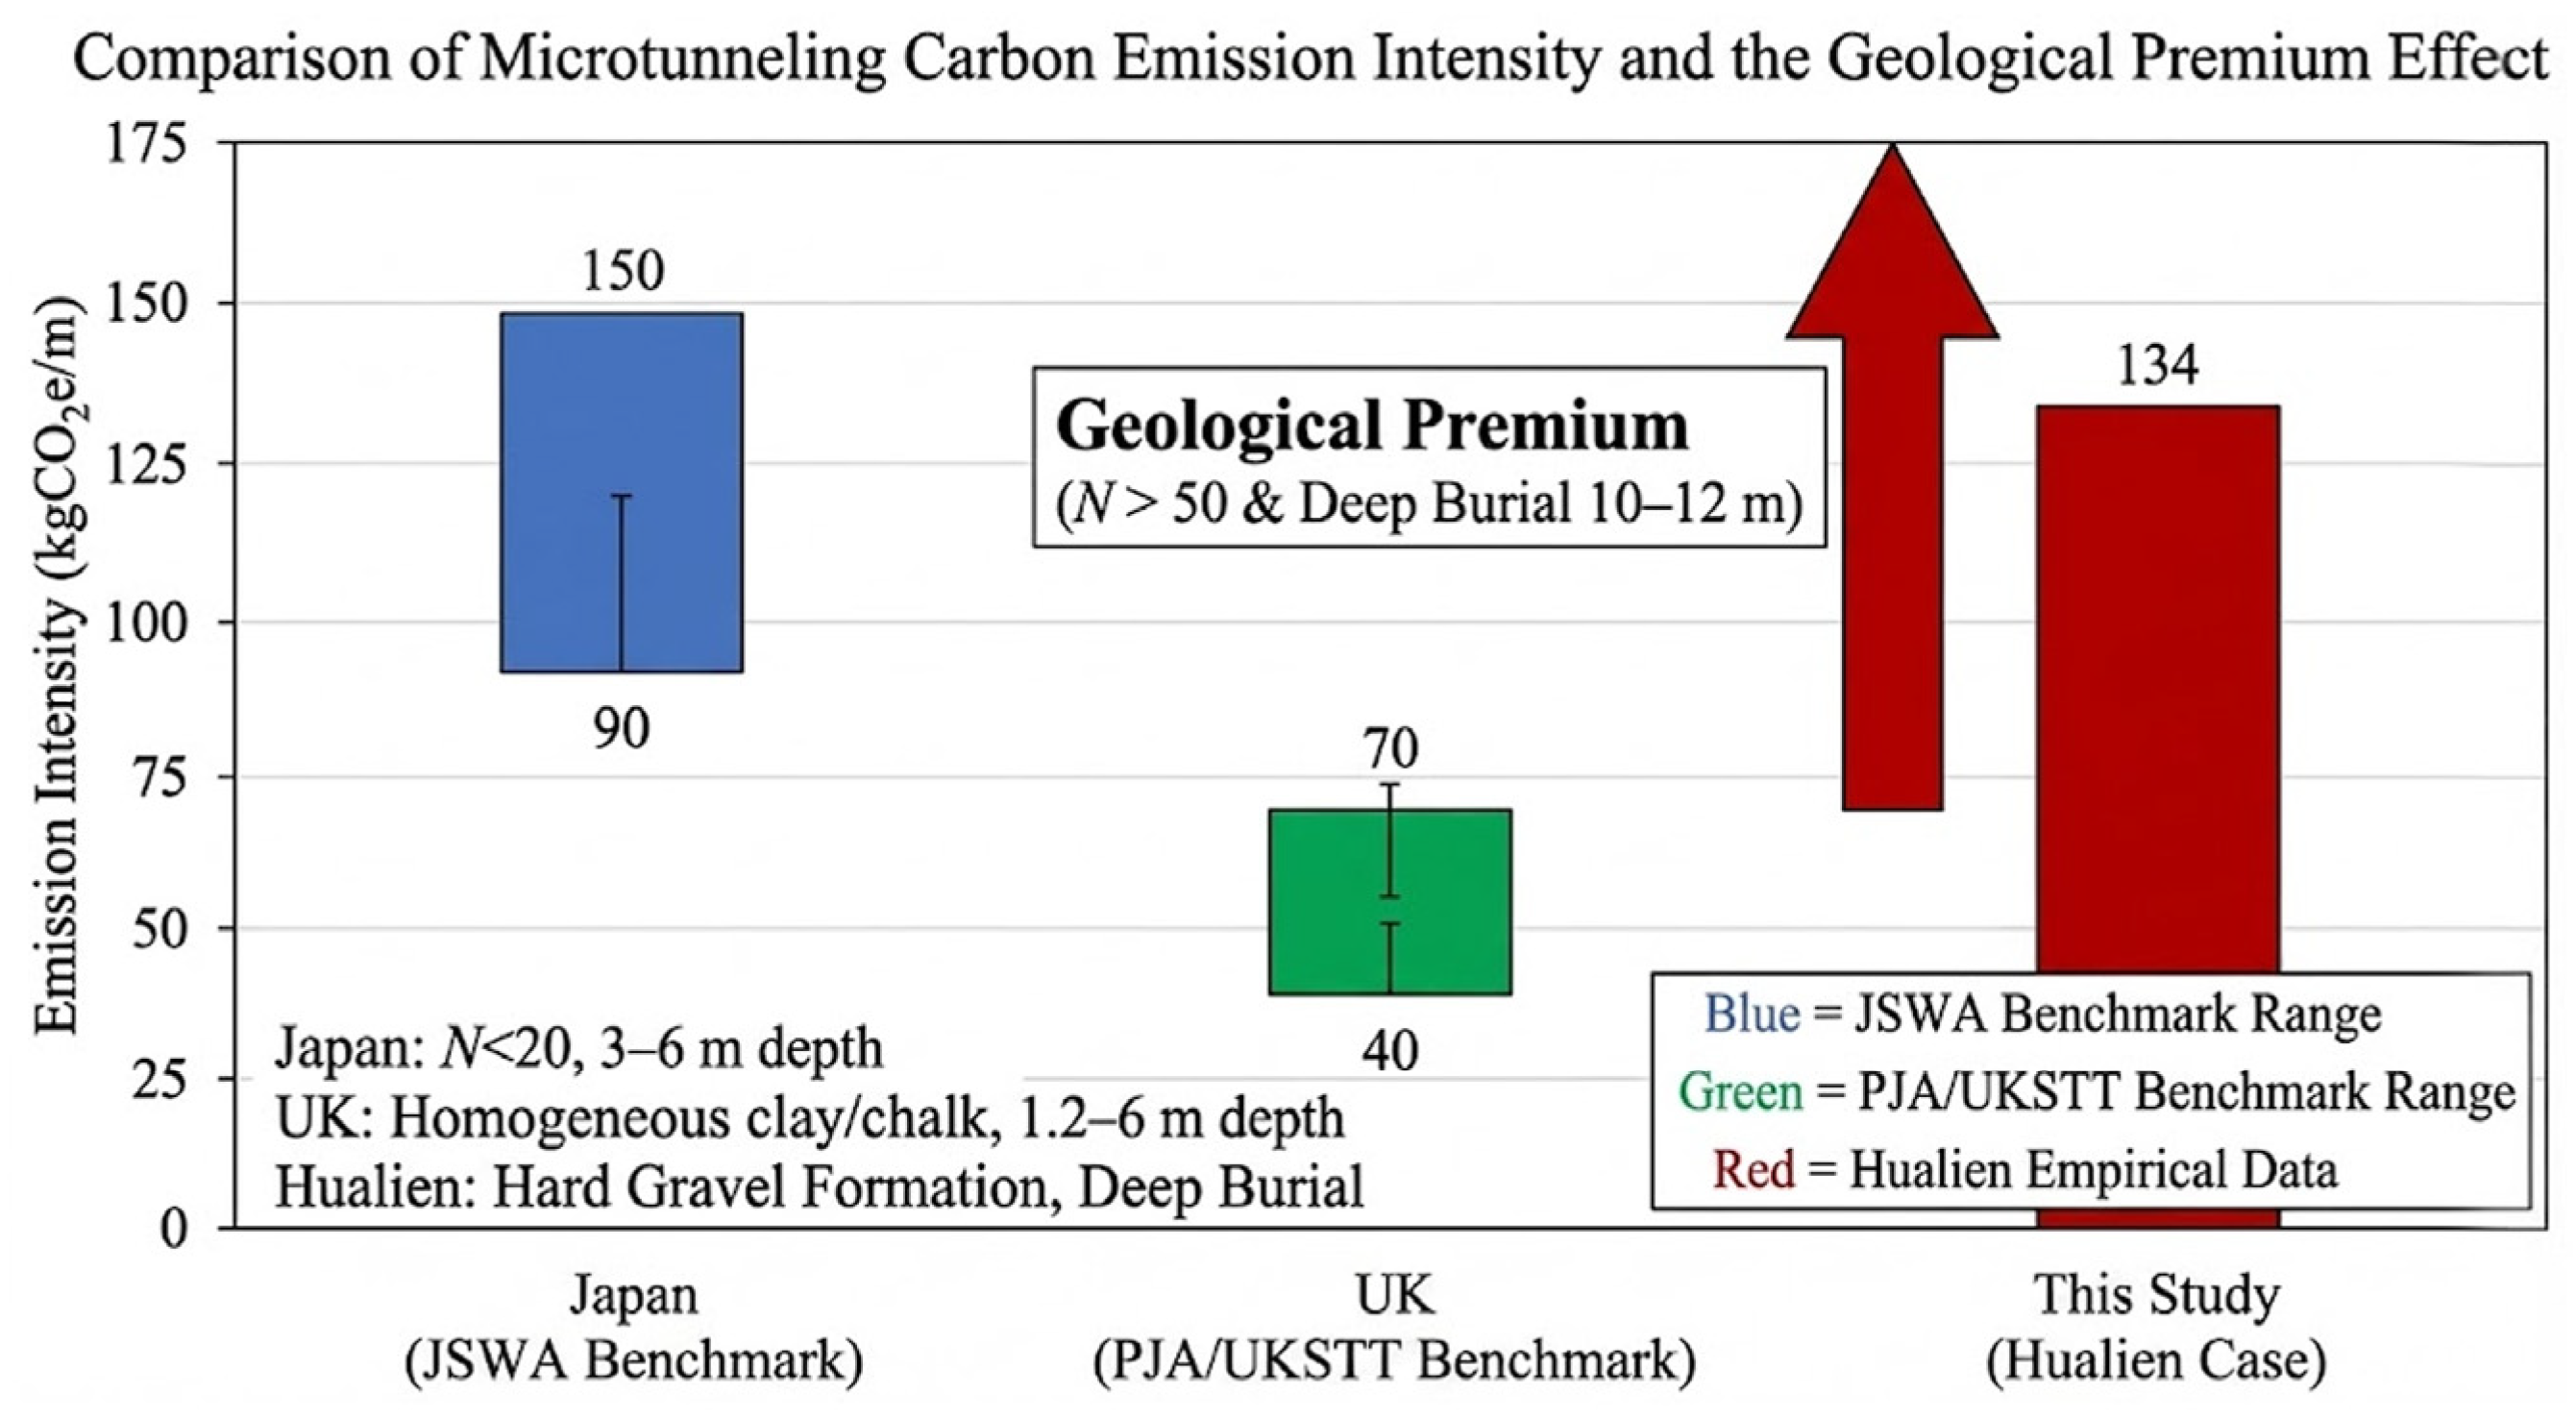
The Japan Sewage Works Association (JSWA) provides a critical global benchmark for trenchless engineering projects. According to the standards defined by JSWA (2021), the standard emission factors (kgCO2e/m) are as follows: 130.2 for the A1A3 stages, 12.5 for the A4 stage, and 107.8 for the A5 stage, resulting in a total engineering carbon emission of approximately 250.5 kgCO2e/m for the A1A5 stages. When evaluating based on the A5 construction stage results, the carbon emissions of the Hualien case (134.1 kgCO2e/m) are 1.25 times higher than the JSWA reference data (107.8 kgCO2e/m). This discrepancy between the empirical data from Hualien and the JSWA technical manual benchmarks is primarily attributed to the following two major factors:
  • Geological and Depth Variables:
The Hualien project site is characterized by hard geological conditions (gravel and cobble formations) and a substantial pipe burial depth of 10 to 12 m. In contrast, the JSWA benchmark assumes standard sandy soil conditions and shallow excavation depths (3–6 m). Consequently, the unit emissions for the construction stage in the Hualien case are inevitably higher. This demonstrates that under extreme geological hardness, jacking resistance and vertical transport energy consumption undergo a “coefficient-level” escalation. This validates the irreplaceability of localized empirical data for accurate carbon budget assessment.
2.
Differences in Comprehensive System Boundaries:
The JSWA benchmark values primarily focus on “Pure Jacking Work.” However, the Hualien case adopts a “Cradle-to-Practical Completion” perspective. This holistic approach includes Controlled Low-Strength Materials (CLSM) and road restoration in the calculation. Although this results in higher data values compared to the JSWA standards, it more realistically reflects the actual environmental impact of urban sewage projects, as shown in Table 3.
Summary:
Compared to the JSWA assessment, the carbon inventory for the “pipe jacking operation” in the Hualien case additionally incorporates the following key work items:
(1)
Material Cycling and Backfilling: Inclusion of a large volume of CLSM products, which constitutes a core emission source in the A1A3 stages.
(2)
Environmental Restoration: Inclusion of material consumption for road milling and paving at the end of construction (A1A5), covering CLSM transport and construction, as well as Asphalt Concrete (AC) pavement repair.

4.3.2. Comparison with UKPJA and UKSTT Standards

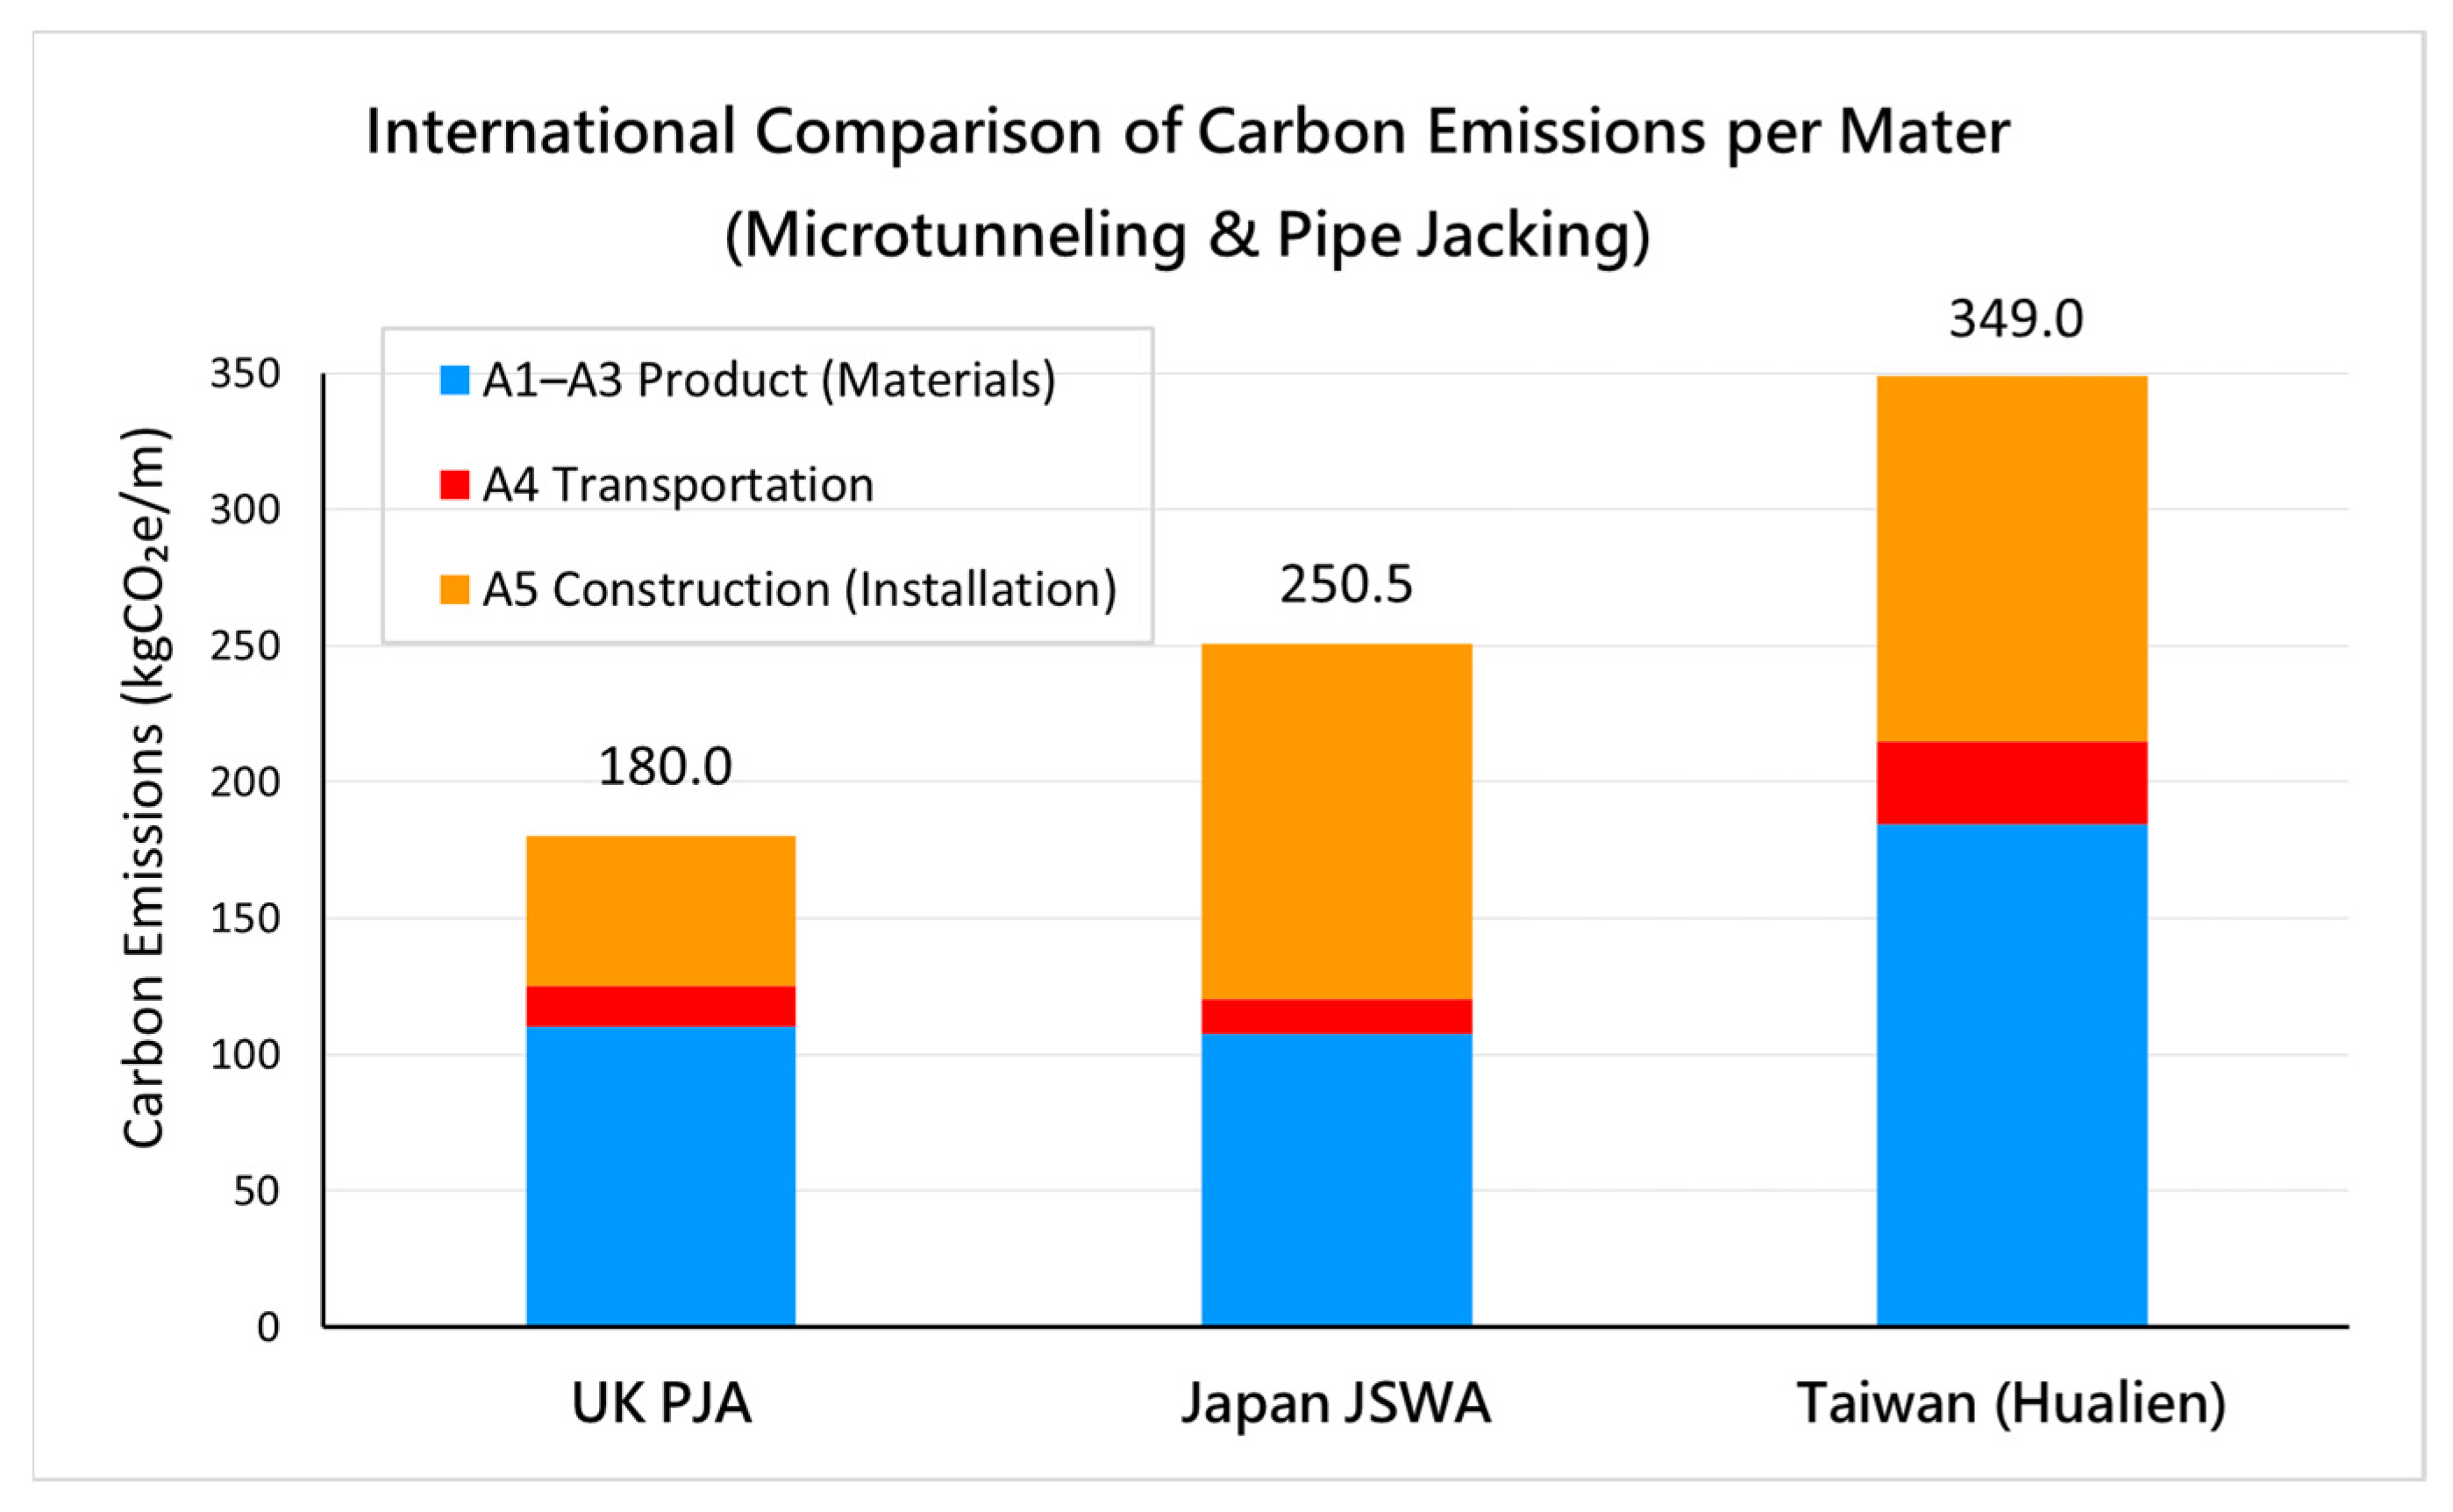
The carbon emission assessments for pipe jacking methods by the Pipe Jacking Association (PJA) and the United Kingdom Society for Trenchless Technology (UKSTT) are primarily based on the Life Cycle Assessment (LCA) framework of the EN 15804 standard. These assessments focus on stages A1A5 (“upfront embodied carbon”). The reference data indicate approximately 110 kgCO2e/m for stages A1A3, 15 kgCO2e/m for stage A4, and 4070 kgCO2e/m (average 55 kgCO2e/m) for stage A5. Consequently, the total engineering carbon emissions for stages A1A5 are approximately 180 kgCO2e/m.
The PJA offers a free online tool, the PJA Carbon Calculator, developed by the Transport Research Laboratory (TRL) and certified by the Water Research Centre (WRc) [8,9,26,28]. This calculator is specifically designed to compare the carbon footprint differences between pipe jacking and the open-cut method. Generally, pipe jacking methods can reduce carbon emissions by approximately 75% compared to open-cut methods.
Following the benchmarking methodology described in Section 2.3, the estimated spoil volume for the open-cut method was approximately 1182 tons, whereas for pipe jacking, it was only 149 tons [9]. The actual spoil volume in the Hualien case was approximately 186 tons, which closely aligns with the PJA Carbon Calculator’s estimate [10,29].
According to the PJA calculation framework, the UK benchmark for upfront embodied carbon in stages A1–A5 is approximately 180 kgCO2e/m. However, the measured value in this study, 349 kgCO2e/m, is significantly higher than this benchmark. This discrepancy is primarily attributed to the fact that the PJA tool assumes a default environment of “6 m depth” and “standard soil layers.” When reflecting the actual conditions of the Hualien case—”12 m depth” and “N-value > 50”—the logic regarding vertical transport and jacking energy consumption revealed by the PJA framework manifests as a “carbon premium” result under extreme construction conditions.

4.3.3. Comprehensive Discussion on Discrepancies

  • Variations in Assessment System Boundaries:
There are significant differences in the carbon assessment boundaries defined by Hualien (this study), Japan (JSWA), and the UK (PJA) regarding trenchless technology, particularly concerning the A1–A5 life cycle stages. A comparative analysis reveals the following:
JSWA (Narrowest Boundary): The assessment boundary set by the JSWA is the narrowest, focusing primarily on electricity and fuel consumption associated with machinery operation.
PJA (Moderate Boundary): The PJA assessment boundary is considered moderate. While it encompasses jacking operations, on-site machinery, and minor backfilling, it predominantly assumes the use of native soil or graded aggregates for backfill, rather than processed materials.
Hualien Case (Widest Boundary): In contrast, the Hualien case study adopts the widest assessment boundary, fully aligning with EN 15804 standards. This includes the high-emission contributions from CLSM and road restoration.
Consequently, the carbon emission data from these three sources exhibit significant discrepancies and distinct characteristics, as detailed in Table 4.
2.
Disparities in Construction Conditions:
Significant differences exist in geological hardness among the Hualien case, Japan, and the UK. Specifically, the Hualien site is characterized by Standard Penetration Test (SPT) N-values > 50, whereas the geological conditions referenced in Japanese and UK standards typically feature N-values < 20.
Regarding burial depth, the Hualien project involves depths ranging from 10 to 12 m, while standard depths in Japan and the UK are generally less than 6 m. In terms of pipe diameter specifications, the conditions across all three contexts are roughly equivalent, as detailed in Table 5 and Figure 6.
3.
Quantitative Discrepancies in Carbon Emissions:
Regarding the comparison of carbon emission values, the Hualien case exhibits the highest unit carbon emission at 349 kgCO2e/m. This is approximately 1.9 times the UK benchmark (180.0 kgCO2e/m) and approximately 1.4 times the Japanese benchmark (250.5 kgCO2e/m). The carbon emission discrepancies across different stages are illustrated in Table 6 and Figure 7. Overall, the UK benchmark for total engineering unit carbon emissions accounts for only 51.6% of the Hualien case, while the Japanese benchmark accounts for only 71.9%. The distinct characteristics of carbon emission differences among the Japanese, UK, and Hualien cases are analyzed as follows:
(1)
Quantification of Geological Premium (Stage A5):
In terms of the proportion of total engineering carbon emissions, the A5 construction stage in the Hualien case is significantly higher than the UK average by approximately 8.5–13.5% and higher than the Japanese average by approximately 1.5% (Table 7). This reflects not only differences in geological conditions but also the fact that the optimization of the UK’s power structure is superior to that of Taiwan. Furthermore, considering the groundwater level factors in the Hualien case, if the open-cut method were adopted, the carbon emissions derived from the “difficulty of diaphragm wall/sheet pile installation” and “dewatering volume” would rise exponentially. This underscores that “relative carbon reduction” in construction energy consumption is a critical hotspot in regions with adverse geological conditions.
(2)
Geographical Vulnerability of the Supply Chain (Stage A4):
Regarding carbon emissions from transport, the proportion of the A4 transport stage in the Hualien case is approximately 2.2 times the UK average and 1.7 times the Japanese average, as shown in Table 7. The reason lies in Japan’s superior status of “material localization” compared to Taiwan, and the UK’s tendency towards “industrial clustering,” which avoids excessive transport distances. Conversely, the Hualien case is constrained by geographical factors leading to long-distance transportation, making transport carbon emissions a substantial invisible contributor to the carbon footprint of public works.
(3)
Structural Impact of Deep Burial on Materials (Stages A1–A3):
Regarding product carbon emissions, the proportion of A1–A3 in the Hualien case appears normal within international benchmarks. However, this is actually a result of being diluted by the “high electricity and high fuel” consumption in stages A4 and A5, thereby presenting a relatively lower carbon emission proportion.
(4)
Fundamental Impact of Energy Structure on Carbon Emissions (Stages A1–A5):
Regarding the electricity emission factor, Taiwan is the highest at 0.495 kgCO2e/kWh [30], followed by Japan at 0.44–0.47 kgCO2e/kWh [25], while the UK is lower at 0.19–0.22 kgCO2e/kWh [24]. Regarding the diesel emission factor, Taiwan is the highest at 3.29 kgCO2e/L [30], followed by Japan at 2.585 kgCO2e/L [25], while the UK is lower at 2.512 kgCO2e/L [24], as shown in Table 7. The carbon emissions from construction products, transport, and construction processes are profoundly influenced by the local energy structure.

4.3.4. Mitigation Potential

  • Leverage Effect of Energy Substitution
Based on the scenario simulation framework defined in Section 2.3, the results indicate that if the 150 kVA diesel generator used on-site were replaced by the Taiwan grid supply, a carbon reduction of over 37% could be achieved in the A5 stage. This highlights the significant decarbonization benefit of shifting from diesel generation to utility grid supply. Furthermore, it demonstrates that “site electrification” is a primary driver for underground engineering projects moving towards net-zero emissions. Although temporary grid power offers high decarbonization potential, practical implementation in remote areas (such as certain sections in Hualien) is often constrained by application timelines or distribution capacity limits, necessitating the continued use of diesel generators.
2.
The Leverage Effect of Material Substitution:
(1)
Reinforced Concrete Pipes (RCP): Strategies should focus on “low-carbon cement and process optimization.” Key approaches include the application of Blended Cement, the use of Green Steel, and manufacturing process improvements (e.g., optimized steam curing).
(2)
Controlled Low-Strength Material (CLSM): The focus should shift towards a “circular economy and non-cementitious binders.” Effective strategies include substituting natural aggregates with Recycled Aggregates, utilizing Cement-free Binders (such as alkali-activated materials), and maximizing Excavated Soil Re-use.

4.4. Impact of Geological Conditions on Energy Consumption Intensity

Following the sensitivity analysis framework outlined in Section 2.4, the results reveal a critical relationship between geological resistance and construction energy consumption. As shown in Table 8, a positive correlation is observed between geological hardness (SPT N-value) and carbon intensity. Specifically, the transition from standard soil conditions recorded in European benchmarks (e.g., clay or sand, N < 20) to the hard gravel and cobble formations encountered in this case (N > 50) results in a quantified 18.7% “Geological Premium.”
This significant increase is primarily driven by the extended duration of high-load generator operations required for rock crushing. From the perspective of physical mechanics, high N-value strata imply significantly higher shear strength and interparticle interlocking. This directly necessitates greater cutterhead torque from the Tunnel Boring Machine (TBM) during the excavation process.
In this empirical case study, the 150 kVA diesel generator was compelled to operate at elevated load factors for prolonged periods to maintain a stable advance rate. This phenomenon reflects the additional mechanical work required for rock fragmentation, which directly converts into higher fuel consumption per unit of length. This measured increment of 18.7% successfully quantifies how geological conditions translate environmental challenges into tangible carbon emission costs. Consequently, it is recommended that future carbon budgets for underground engineering projects introduce a “Geological Correction Factor” to enhance estimation accuracy.

5. Conclusions

As the global construction sector accelerates toward carbon neutrality, precise Life Cycle Assessment (LCA) for underground infrastructure is pivotal for sustainable decision-making. This study, adhering to the EN 15804 international standard, conducts a rigorous carbon footprint analysis of a microtunneling project in Hualien, Taiwan. By investigating a case situated in highly challenging geological conditions, this research fills a critical gap in existing literature regarding the environmental cost of hard rock excavation. The key findings and contributions are summarized as follows:
  • Critical Quantification Metrics and Emission Hotspots
Empirical data from the 614 m installation reveals total life cycle emissions of 214,003 kgCO2e/m, translating to a unified emission intensity of 349 kgCO2e/m. The assessment identifies two dominant emission hotspots: the Product Stage (A1–A3) and the Construction Process Stage (A5), contributing 52.8% and 38.5% to the total footprint, respectively. These figures establish a solid baseline for future infrastructure projects in similar geological contexts.
2.
Quantifying the “Geological Premium”
A primary contribution of this study is the definition and quantification of the “Geological Premium.” In environments characterized by hard gravel and cobble formations (SPT N-values > 50), the energy demand required to overcome high geological resistance drove the Stage A5 emission intensity to 134.1 kgCO2e/m.
Benchmarking Analysis: This intensity is 1.25 times higher than the Japanese JSWA benchmark and 2.4 times higher than the UK PJA benchmark for standard soil conditions.
Sensitivity Confirmation: Crucially, the sensitivity analysis isolates the impact of geological hardness, confirming an 18.7% increase in machinery energy intensity compared to baseline soil conditions (N < 20). This evidence supports the introduction of a “Geological Correction Factor” in future carbon budgeting to prevent budgetary shortfalls.
3.
Necessity of Expanding Assessment Boundaries
This study demonstrates that in complex geological conditions, restricting LCA boundaries to “pure jacking” leads to systematic underestimation. The inclusion of auxiliary works—specifically high-volume CLSM backfilling and Asphalt Concrete (AC) pavement restoration—is essential. Excluding these materials, which are necessitated by site-specific geological and reinstatement requirements, would result in an underestimation of total emissions by approximately 10–15%. Therefore, an expanded system boundary is recommended to ensure the integrity of green procurement and carbon offset schemes.
4.
Strategic Recommendations for Decarbonization
To mitigate the environmental burden imposed by the geological premium, this study proposes a two-phase strategy:
(1)
Short-term: Prioritize the electrification of construction sites by transitioning from diesel generators to grid power. This singular measure is projected to reduce total project emissions by 13.0%.
(2)
Medium-to-Long-term: Adopt low-carbon cementitious materials (e.g., Limestone Calcined Clay Cement, LC3) to significantly lower the embodied carbon in the dominant A1 stage.
5.
Research Limitations and Future Directions
While this study provides robust empirical data, certain limitations must be acknowledged. First, the case study is geographically constrained to Taiwan and specifically bounded by hard gravel and cobble formations. The quantified 18.7% “Geological Premium” is representative of these specific conditions and may vary in other complex strata (e.g., solid bedrock or mixed boulder clays). Second, the scope of this study focused exclusively on embodied carbon (Global Warming Potential), without assessing other environmental impact categories such as acidification or eutrophication. Third, it is important to acknowledge that the influencing factors analyzed in this field study (e.g., machinery efficiency fluctuations, material loss rates, and dynamic transportation routing) are subject to multiple on-site interferences, which inherently limits the universal effectiveness of a static assessment model. Future research should aim to conduct comparative LCAs across diverse geological profiles worldwide to further calibrate the “Geological Correction Factor” and evaluate comprehensive multi-criteria environmental impacts.
In conclusion, the core innovative value of this research lies in formalizing and quantifying the “Geological Premium”—an empirical framework that corrects the severe underestimation of energy intensity in traditional LCA models when encountering extreme soil resistance. This research provides a scientific foundation for establishing “differentiated carbon footprint benchmarks” that account for geological complexity. However, it is important to acknowledge that the influencing factors analyzed in this field study (e.g., machinery efficiency fluctuations, material loss rates, and dynamic transportation routing) are subject to multiple on-site interferences, which inherently limits the universal effectiveness of a static assessment model. Despite these practical limitations, the developed carbon assessment system is fundamentally in line with the United Nations Sustainable Development Goals (SDGs). By providing a high-resolution, localized carbon accounting framework for underground infrastructure, this study directly contributes to SDG 9 (Industry, Innovation and Infrastructure), SDG 11 (Sustainable Cities and Communities), and SDG 13 (Climate Action). It offers a robust framework for public works authorities to set realistic, data-driven low-carbon transition goals for underground engineering projects worldwide, offering policymakers a scientifically sound basis for resilient urban planning and green public procurement.

Funding

This research was funded by the National Science and Technology Council, Taiwan, (Grant No. NCUT 24-T-HL-001).

Institutional Review Board Statement

Not applicable.

Informed Consent Statement

Not applicable.

Data Availability Statement

The data presented in this study are available within the article.

Acknowledgments

The author gratefully acknowledges the Sewerage Engineering Branch of the National Land Management Agency (Ministry of the Interior), T.Y. Lin International, and Dong Xin Long Construction Co., Ltd., for their invaluable support in providing essential data and facilitating the on-site investigations for this research.

Conflicts of Interest

The author declares no conflicts of interest.

References

  1. Global Alliance for Buildings and Construction. 2022 Global Status Report for Buildings and Construction; UNEP: Nairobi, Kenya, 2022; Available online: https://globalabc.org/resources/publications/2022-global-status-report-buildings-and-construction (accessed on 7 February 2026).
  2. Ma, Y.; Polaczyk, P.; Zhang, M.; Xiao, R.; Jiang, X.; Huang, B. Comparative study of pavement rehabilitation using hot in-place recycling and hot-mix asphalt: Performance evaluation, pavement life prediction, and life cycle cost analysis. Transp. Res. Rec. 2023, 2677, 420–431. [Google Scholar] [CrossRef]
  3. Zhang, M.; Gong, H.; Xiao, R.; Jiang, X.; Ma, Y.; Huang, B. Life-cycle cost analysis of rehabilitation strategies for asphalt pavements based on probabilistic models. Road Mater. Pavement Des. 2023, 24, 121–137. [Google Scholar] [CrossRef]
  4. Pernes, G.J. Future challenges to asset investment in the UK water industry: The wastewater asset investment risk mitigation offered by minimising principal operating cost risks. J. Water Clim. Change 2010, 1, 17–35. [Google Scholar] [CrossRef]
  5. Drainage Services Department (DSD). Pipe Jacking/Microtunneling; The Government of the Hong Kong Special Administrative Region: Hong Kong, China, 2025. Available online: https://www.dsd.gov.hk/EN/Sewerage/Technology_Employed/Pipe_jacking___Microtunneling/index.html (accessed on 7 February 2026).
  6. Palmieri Group. Small Diameter Tunnelling and Pipe Jacking. Palmieri S.p.A. 2025. Available online: https://www.palmierigroup.com/ (accessed on 7 February 2026).
  7. Pipe Jacking Association (PJA). An Introduction to Pipe Jacking and Microtunneling Design. 2025. Available online: https://www.pipejacking.org/about_pipe_jacking (accessed on 7 February 2026).
  8. Ariaratnam, S.T.; Sihabuddin, S.S. Comparison of emitted emissions between trenchless pipe replacement and open cut utility construction. J. Green Build. 2009, 4, 126–140. [Google Scholar] [CrossRef]
  9. Pipe Jacking Association (PJA); United Kingdom Society for Trenchless Technology (UKSTT). The Environmental Benefits of Pipe Jacking: Carbon Calculator and Industry Benchmarks; PJA: London, UK, 2021; Available online: https://www.pipejacking.org/ (accessed on 7 February 2026).
  10. TRL Limited. Technical Specification for the PJA carbon Footprint Assessment Tool; Transport Research Laboratory: Crowthorne, UK, 2021; Available online: https://www.trl.co.uk/ (accessed on 7 February 2026).
  11. Japan Sewage Works Association (JSWA). Manual for Promoting Decarbonization in Sewerage Systems; JSWA: Tokyo, Japan, 2021; Available online: http://www.jswa.jp/ (accessed on 7 February 2026). (In Japanese)
  12. Japan Sewage Works Association (JSWA). Technical Manual for Microtunneling Methods and CO2 Emission Standards; JSWA: Tokyo, Japan, 2021; Available online: http://www.jswa.jp/ (accessed on 7 February 2026). (In Japanese)
  13. National Land Management Agency, Ministry of the Interior. Statistics on Public Sewerage Penetration Rate in Taiwan; Ministry of the Interior, R.O.C: Taipei, Taiwan, 2024. Available online: https://www.nlma.gov.tw/ (accessed on 7 February 2026).
  14. BS EN 15804:2012; Sustainability of Construction Works–Environmental Product Declarations–Core Rules for the Product Category of Construction Products. British Standards Institution: London, UK, 2011.
  15. EN 15804:2012+A2:2019; Sustainability of Construction Works—Environmental Product Declarations—Core Rules for the Product Category of Construction Products. European Committee for Standardization (CEN): Brussels, Belgium, 2019.
  16. EN 15978:2011; Sustainability of Construction Works—Assessment of Environmental Performance of Buildings—Calculation Method. European Committee for Standardization (CEN): Brussels, Belgium, 2011.
  17. ISO 14067:2018; Greenhouse Gases—Carbon Footprint of Products—Requirements and Guidelines for Quantification. International Organization for Standardization: Geneva, Switzerland, 2018. Available online: https://www.iso.org/standard/71206.html (accessed on 7 February 2026).
  18. Environmental Protection Administration. 2024 National Greenhouse Gas Inventory Report; Executive Yuan, R.O.C.: Taipei, Taiwan, 2024. Available online: https://www.cca.gov.tw/information-service/publications/national-ghg-inventory-report/12003.html (accessed on 7 February 2026).
  19. Public Construction Commission (PCC). Carbon Emission Factors Database for Common Public Works Products; Executive Yuan, R.O.C.: Taipei, Taiwan, 2024. Available online: https://pcc.gov.tw>downloadFile.pdf (accessed on 7 February 2026).
  20. World Green Building Council (World GBC). Bringing Embodied Carbon Upfront: Coordinated Action for the Building and Construction Sector to Tackle Embodied Carbon; World GBC: London, UK, 2019; Available online: https://worldgbc.org/advancing-net-zero/embodied-carbon/ (accessed on 7 February 2026).
  21. Environmental Protection Administration. Carbon Footprint Information Platform; Executive Yuan, R.O.C.: Taipei, Taiwan, 2024; Available online: https://cfp-calculate.tw/ (accessed on 7 February 2026).
  22. United Kingdom Society for Trenchless Technology (UKSTT). Carbon Footprint Benchmarking for Trenchless Technologies; UKSTT: Coventry, UK, 2022; Available online: https://pipejacking.org/assets/pj/uploads/publications/C02_Calculator_2017_presentation_Final.pdf (accessed on 7 February 2026).
  23. United Kingdom Society for Trenchless Technology (UKSTT). Technical Guidelines for Pipe Jacking and Microtunnelling; UKSTT: Coventry, UK, 2021; Available online: https://www.ukstt.org.uk/ (accessed on 7 February 2026).
  24. Department for Energy Security and Net Zero. Government Greenhouse Gas Reporting: Conversion Factors; UK Government: London, UK, 2025. Available online: https://www.gov.uk/government/collections/government-conversion-factors-for-company-reporting (accessed on 7 February 2026).
  25. Ministry of the Environment, Government of Japan. Emission Factors for Greenhouse Gas Accounting and Reporting; Ministry of the Environment: Tokyo, Japan, 2025. Available online: https://www.env.go.jp/ (accessed on 7 February 2026). (In Japanese)
  26. Ministry of Economy, Trade and Industry (METI), Government of Japan. Greenhouse Gas Emission Factors for Calculation, Reporting, and Publication System; METI: Tokyo, Japan, 2023. Available online: https://www.meti.go.jp/ (accessed on 7 February 2026). (In Japanese)
  27. PAS 2050:2011; Specification for the Assessment of the Life Cycle Greenhouse Gas Emissions of Goods and Services. British Standards Institution: London, UK, 2011. Available online: https://knowledge.bsigroup.com/ (accessed on 7 February 2026).
  28. International Society for Trenchless Technology. Trenchless Technology and Carbon Reduction Goals: 2025 Update; ISTT: Peterborough, UK, 2025; Available online: https://istt.com/reports (accessed on 7 February 2026).
  29. Water Research Centre. Verification Statement for the Pipe Jacking Association (PJA) Carbon Calculator (Issue 3); Water Research Centre: Swindon, UK, 2026; Available online: https://www.wrcgroup.com/ (accessed on 7 February 2026).
  30. Bureau of Energy, Ministry of Economic Affairs. 2024 Electricity Carbon Emission Factor; Ministry of Economic Affairs, R.O.C.: Taipei, Taiwan, 2025. Available online: https://www.moeaea.gov.tw/ (accessed on 7 February 2026).
Figure 1. System boundary of this study (cradle to practical completion, Stages A1–A5).
Buildings 16 01413 g001
Figure 2. Step-by-step process diagram based on the Input–Process–Output (IPO) model, highlighting main material/energy inputs and environmental outputs from cradle to practical completion (Modules A1–A5).
Buildings 16 01413 g002
Figure 3. Map showing the relative location of the experimental project site in the Beipu area, Hualien County, Taiwan. (The red line indicates the RCP installation route).
Buildings 16 01413 g003
Figure 4. On-site photographs of key construction machinery and equipment deployed at the Hualien project site. (a) telescopic excavator; (b) gantry crane, and TBM cutterhead.
Buildings 16 01413 g004
Figure 5. Breakdown of carbon emissions for the Hualien case study (Cradle–to–Practical Completion). (a) Carbon emission breakdown by life cycle stage (A1–A5). (b) Breakdown of Stage A5 emissions.
Buildings 16 01413 g005
Figure 6. Comparative analysis of carbon emission intensity (kgCO2e/m) between international benchmarks (JSWA, PJA/UKSTT) and the Hualien empirical case, illustrating the significant “Geological Premium” effect induced by hard gravel formations (N > 50) and deep burial.
Buildings 16 01413 g006
Figure 7. International comparison of unit carbon footprint across lifecycle stages (A1–A5).
Buildings 16 01413 g007
Table 1. Summary of key studies on environmental assessments of trenchless technologies.
Author/Source
(Year)
[1] Trenchless Technology Used[2] Assessment Method[3]
Key Results (Emissions/Benefits)
[4]
Limitations/Knowledge Gaps
[5]
Other Parameters
[6] Geographical Boundary
Ariaratnam et al. (2009) [8]Pipe Bursting vs. Open-CutEmission factors (Machinery fuel consumption)Trenchless methods reduce emissions by 78–88% compared to open-cut.Excludes embodied carbon of materials; does not account for deep burial depth.Focuses on direct airborne emissions
(HC, CO, NOx).
USA
UK PJA/UKSTT (2021) [9,10]Microtunneling and Pipe JackingEN 15804 LCA (PJA Carbon Calculator)Establishes a benchmark of ~180 kgCO2e/m for A1–A5 stages.Assumes standard soil layers (N-value < 20) and shallow depths (~6 m); often excludes pavement restoration.Evaluates excavated spoil volume differences.UK
JSWA Technical Manual (2021) [11,12]Microtunneling (Slurry/EPB)LCA-based emission standardsEstablishes construction stage (A5) baseline at 107.8 kgCO2e/m.Focuses strictly on pure jacking energy; excludes upstream material impacts (A1–A4).Standardized for N < 20 sandy/clay soil conditions.Japan
This Study (Ou, 2026)Short Pipe Jacking (Microtunneling)EN 15804 LCA (Cradle-to-Practical Completion)Identifies a unit emission of 349 kgCO2e/m; quantifies an 18.7% “Geological Premium.”Focuses primarily on carbon footprint; limited to hard gravel formations.Integrates deep burial (12 m) and high soil resistance (N > 50).Hualien, Taiwan
Table 2. Carbon emission breakdown by stages (A1–A5) for the Hualien case.
Life Cycle StageTotal Emissions
(kgCO2e)
Contribution
(%)
Unit Emissions
(kgCO2e/m)
A1–A3113,03852.8184.1
A418,6268.730.3
A582,33938.5134.1
Total214,003100349
Table 3. Comparison of assessment dimensions between JSWA technical standards and the empirical case study.
Assessment DimensionJSWA (2021) BenchmarkThis Study (Hualien Case)
Primary Assessment ScopePure Jacking Operation (Energy Consumption Only)Full Construction Process
(EN 15804 Compliant)
Backfill MaterialsLubricant/Grouting OnlyFully Included
(High-volume CLSM)
Geological SettingsStandard Soil
(SPT N-value < 20)
Hard Gravel Formation
(SPT N-value > 50)
Pavement RestorationExcludedFully Included
(AC Milling & Paving)
Table 4. Comparison of system boundaries and emission characteristics between international benchmarks and this study.
Source/OrganizationSystem Boundary (Scope)Comparison with Hualien Case (A5 Analysis)
Japan (JSWA)Restricted Scope:
Limited strictly to operational energy (electricity and fuel consumption) of machinery.
Hualien’s A5 intensity is 1.25 times higher.
Primary Factor: Reflects the surge in machinery energy demand required to overcome high geological resistance (SPT N > 50).
UK (PJA/UKSTT)Intermediate Scope:
Includes jacking, on-site machinery, and minor backfilling (mostly utilizing excavated soil or granular material).
The Hualien case falls within the reported range.
Note: However, this study additionally accounts for significant A1–A5 emissions from CLSM backfilling and Asphalt Concrete (AC) restoration, which are often excluded in UK models.
This Study (Hualien)Expanded Scope:
Comprehensively includes jacking, on-site machinery, full backfilling (CLSM), and pavement restoration (AC).
Demonstrates the true environmental cost of the complete engineering lifecycle under complex geological conditions.
Table 5. Comparison of key variables between the empirical case and international technical benchmarks.
ParameterJapan (JSWA) BenchmarkUK (PJA/UKSTT) BenchmarkThis Study
(Hualien Case)
Critical Impact Analysis
Geological ConditionsStandard Sand/Clay
(N < 20)
London Clay or Chalk
(Homogeneous)
Hard Gravel FormationHigh geological resistance drastically increases cutterhead torque and wear.
Burial DepthStandard Depth
(3 m–6 m)
Shallow to Standard
(1.2 m–6 m)
Deep Burial
(10 m–12 m)
Significantly deeper burial increases overburden load and required jacking force compared to UK/Japan.
Classification BasisSlurry/EPB Method and DiameterMicrotunnelingShort Pipe Jacking
(Aligned with JSWA)
Incorporates localized material data to enhance calculation precision.
Emission Intensity (kgCO2e/m)90–150 kgCO2e/m
(RCP Φ500 mm–Φ800 mm)
40–70 kgCO2e/m
(RCP Φ400 mm–Φ600 mm)
134 kgCO2e/m
(RCP Φ400 mm–Φ600 mm)
The superposition of Depth and Geological Factors (K) creates a “Geological Premium,” escalating energy intensity.
Assessment FrameworkJSWA/MLIT StandardsEN 15804/PAS 2080EN 15804/ISO 14067Fully aligned with ISO 14067 and CNS 14067 standards.
Table 6. Detailed breakdown of carbon emission intensity (kgCO2e/m) by life cycle stage: A comparison between Japan, UK, and the Hualien empirical case.
Life Cycle StageJapan (JSWA)UK
(Standard)
Taiwan (Hualien Case)Difference Analysis & Attribution
A1–A3130.2110.0184.1Expanded Scope: Taiwan’s calculation uniquely includes high-volume CLSM backfill and Asphalt Concrete (AC) pavement restoration.
A412.515.030.3Geographical Constraint: Impact of long-distance logistics across the Central Mountain Range due to supply chain isolation.
A5107.855.0
(Range: 40–70)
134.1Geological Premium: Reflects the surge in energy demand required to overcome high soil resistance (Hard Gravel, N > 50).
Total Emissions
(kgCO2e/m)
251180349Relative Ratio: Taking the Hualien case as the baseline (100%), the Japanese benchmark represents 71.9%, while the UK standard is 51.6%.
Table 7. Comparison of emission proportions and energy factors: Hualien empirical case vs. international benchmarks.
ParameterJapan (JSWA)UK (PJA/UKSTT)Taiwan (Hualien Case)
A1–A345%~55%60%~70%52.8%
A44%~6%3%~5%8.7%
A530%~44%25%~30%38.5%
Grid Electricity Factor (kgCO2e/kWh)0.44~0.470.19–0.220.495
Diesel Emission Factor (kgCO2e/L)2.5852.5123.29~3.30
Note: Taiwan’s higher emission factors for electricity and diesel reflect the local energy structure, significantly influencing the total carbon footprint.
Table 8. Sensitivity analysis of geological conditions on Stage A5 emission intensity.
Geological ClassificationRepresentative SPT N-ValueEst. A5 Emission Intensity
(kgCO2e/m)
Incremental Increase
(vs. Baseline)
Physical Mechanism and Remarks
Typical Clay/SandN < 20108.0–115.00%
(Baseline)
Aligns with standard geological conditions defined by PJA (Europe) and JSWA (Japan) benchmarks.
Moderate Gravel20 < N < 50124.0–128.0+10.5%Increased frictional resistance escalates the demand for cutterhead torque.
Hard Gravel (Hualien Case)N > 50134.1+18.7%Geological Premium: Crushing high-strength rock necessitates prolonged high-load operation of diesel generators to maintain thrust.
Disclaimer/Publisher’s Note: The statements, opinions and data contained in all publications are solely those of the individual author(s) and contributor(s) and not of MDPI and/or the editor(s). MDPI and/or the editor(s) disclaim responsibility for any injury to people or property resulting from any ideas, methods, instructions or products referred to in the content.