Article

Experimental Research on the Bending Constitutive Model of Cold-Formed Steel Structural Panels at Elevated Temperatures

1
School of Civil Engineering, Shandong Jianzhu University, Jinan 250101, China
2
Shandong Construction Quality Inspection and Testing Center Co., Ltd., Jinan 250031, China
3
Shandong Branch of China Construction Bank Corporation, Jinan 250099, China
4
School of Civil Engineering and Architecture, University of Jinan, Jinan 250022, China
5
School of Civil Engineering, Southeast University, Nanjing 210096, China
*
Author to whom correspondence should be addressed.
Buildings 2026, 16(7), 1338; https://doi.org/10.3390/buildings16071338
Submission received: 10 November 2025 / Revised: 3 January 2026 / Accepted: 7 January 2026 / Published: 27 March 2026
(This article belongs to the Special Issue Large-Span, Tall and Special Steel and Composite Structures)

Abstract

During fires, the temperature difference between indoor and outdoor environments induces out-of-plane deformation in steel studs. Due to the differential coefficients of thermal expansion between panels and steel, the panels exert a restraining effect on the studs. However, there remains a lack of systematic experimental and theoretical models addressing the failure modes, restraining mechanisms, and synergistic effects of various panels on steel studs. This study conducted high-temperature bending tests to compare the failure modes, load–displacement curves, and key mechanical parameters (peak load, elastic stiffness) of connections combining steel studs with three types of panels: autoclaved lightweight concrete (ALC) panels, fire-resistant gypsum boards, and medium-density calcium silicate board. The research clarifies the constraining effect and temperature sensitivity of different panels. Based on experimental data, a bending constitutive model was developed to quantify the attenuation of the out-of-plane constraining effect at elevated temperatures. The results indicate that the load–displacement curves exhibit three distinct stages: Elastic Ascending Stage, Elastoplastic Ascending Stage, and Post-Peak Stage. A two-stage bending constitutive model was proposed and formulated. Comparison between numerical simulations and experimental specimens in terms of failure modes and characteristic parameters demonstrated that simplifying the panels as spring elements, with stiffness defined by the proposed bending constitutive model, yields errors within 15%, confirming the accuracy of the model. This study systematically investigates the influence of sheathing panels on the high-temperature out-of-plane mechanical behavior of cold-formed steel studs, innovatively proposes a two-stage bending constitutive model, provides theoretical and data support for cold-formed steel structural fire-resistant design, and offers new perspectives and methodologies for future research.

1. Introduction

Cold-formed steel structures are inherently industrialized buildings, characterized by their light weight, excellent seismic performance, and high prefabrication. In cold-formed steel structures, steel studs are connected to each other and to panels using self-drilling screws. The strength of self-drilling screw connections directly impacts the overall performance of the structure, and the behavior of these connections under fire conditions influences the fire resistance design of the entire structure.
Extensive research has been conducted on the performance of self-drilling screw connections at ambient temperature [1,2,3,4,5,6,7,8]. For instance, Seleim [9] evaluated the influence of low-ductility steel on connection strength by designing various parameters, including edge distance, plate thickness, width, screw arrangement, and elongation, and conducting tension, shear, and bearing tests. Laboube [10] performed tests by varying screw arrangement, spacing, and quantity, thereby establishing design equations that consider screw spacing and number to provide an optimization basis for residential structures. Bambach [11] conducted 120 sets of single-lap connection tests to propose a design equation for modified nominal shear strength. Nithyadharan [12] designed static and cyclic shear tests on screw connections between cold-formed steel frames and calcium silicate boards to determine load-deformation relationships and failure modes, ultimately proposing design equations for ultimate shear strength and resistance factors applicable to calcium silicate board connections. Fiorino [13], aiming to compare the effects of different panel materials, loading directions, edge distances, and cyclic protocols, utilized 62 specimens for monotonic loading and three cyclic protocols. The study found that panel material significantly influences connection strength and proposed a predictive method for lateral load–displacement response. Additional studies on the mechanical properties of self-drilling screw connections at ambient temperature are also available [14,15,16,17,18,19,20,21,22,23].
Relatively fewer studies have been conducted on the performance of self-drilling screw connections under elevated temperatures. Wei Lu [24] investigated self-drilling screw connections at high temperatures using a combination of experimental research and finite element numerical simulation. The experimental results indicated that the ultimate bearing capacity of the connections primarily consists of four components: bearing between the thin sheet and the stud, friction between the thin and thick sheets, friction between the washer and the thin sheet, and inclined bearing of the thin sheet. Ben Young [25,26,27,28,29,30,31] conducted research on cold-formed steel self-drilling screw connections at elevated temperatures using two experimental methods: the steady-state method and the transient-state method. The test results demonstrated that the degradation of the connection’s ultimate strength with increasing temperature exhibits significant similarity to the degradation of the base material’s tensile strength; regarding the strength prediction of self-drilling screw connections, the strength obtained from both steady-state and transient tests showed similar degradation trends as temperature increased; and under low applied loads, the failure modes of self-drilling screw connections were similar in both transient and steady-state tests. Chen Wei [32] obtained experimental results through a study on the high-temperature mechanical properties of steel stud-gypsum board connections: at ambient temperature, self-drilling screw connections exhibited failure modes of bearing failure at the end of the board and bending failure, with noticeable tilting of the screw, which gradually diminished as temperature increased; the shear strength of the connections increased with larger screw edge distances and an increased number of board layers. Furthermore, based on the experimentally obtained data, Chen Wei [32] proposed a predictive model for the shear strength of steel stud-gypsum board connections and a simplified characterization equation for the load–displacement curve.
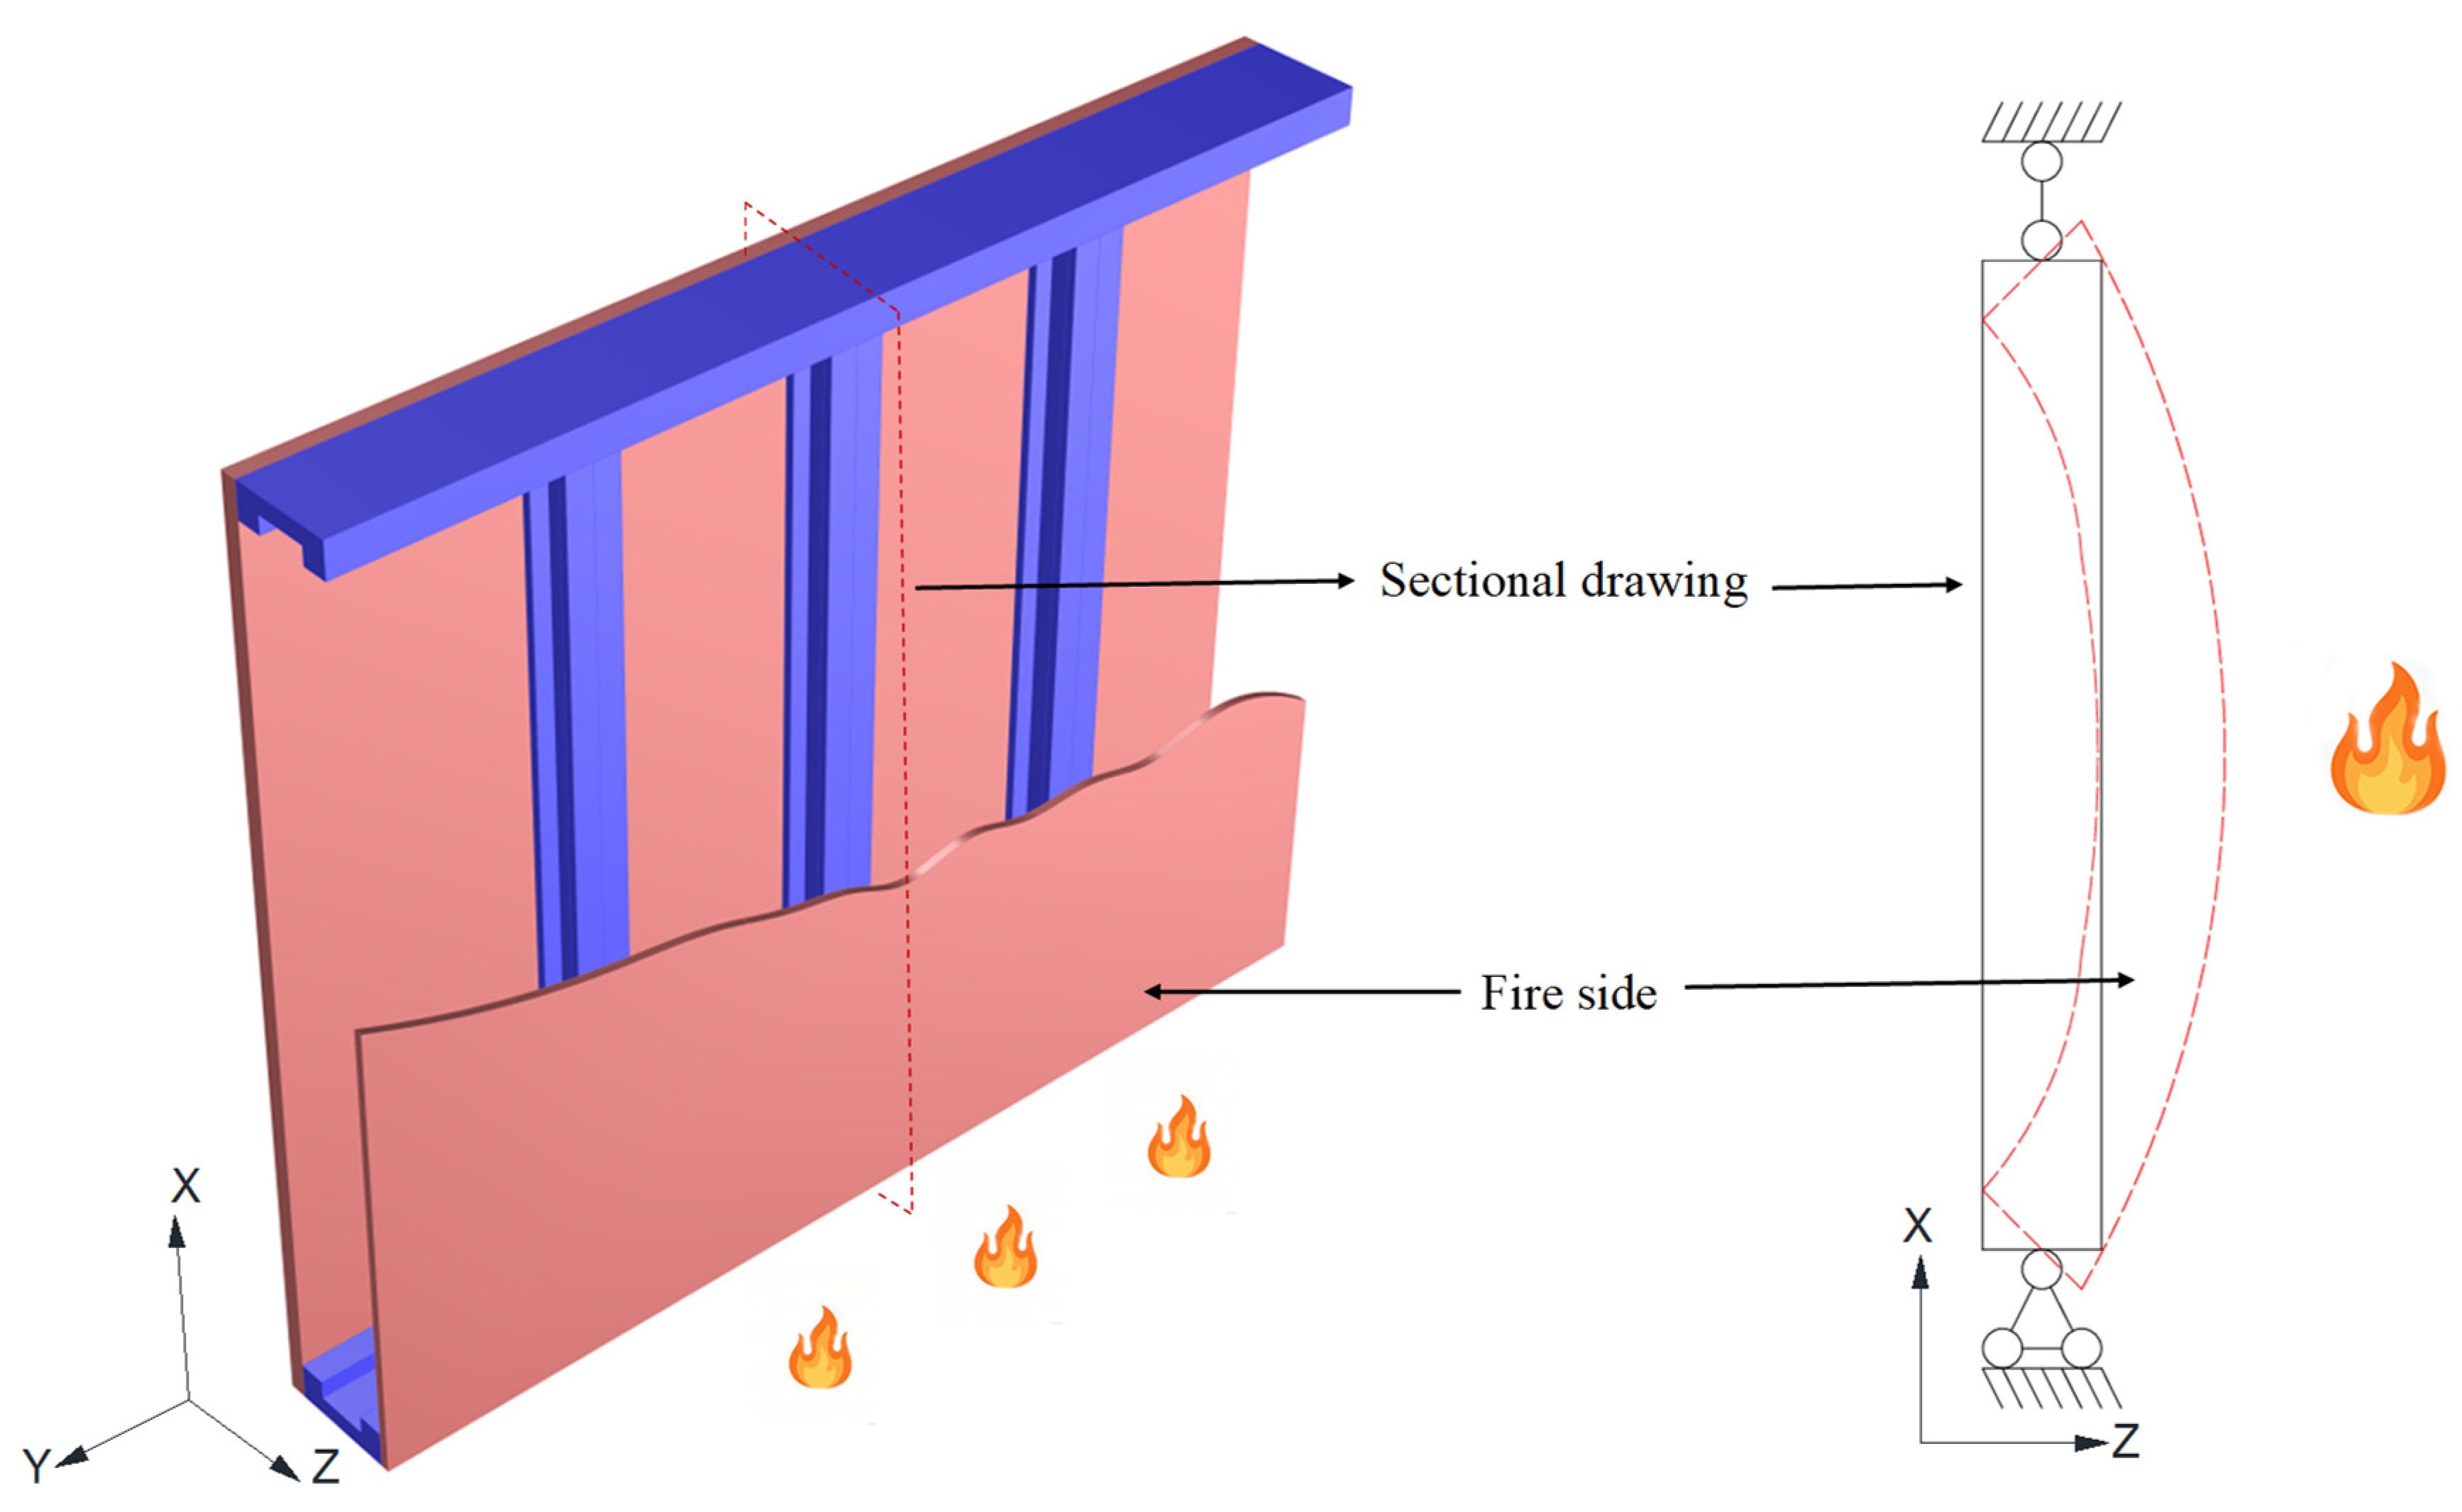
Current research on self-drilling screw connections under elevated temperatures has primarily focused on their in-plane mechanical properties, with limited investigation into the high-temperature out-of-plane mechanical behavior of these connections (in-plane refers to the X-Y plane in Figure 1, while out-of-plane refers to the Z-axis direction). However, during building fires, a significant temperature differential forms between interior and exterior environments. The differential thermal expansion deformation between the cold and hot flanges of steel studs makes out-of-plane bending the predominant deformation mode (bending deformation along the Z-axis direction in Figure 1). The study of restraining effects provided by wall panels and self-drilling screw connections against out-of-plane deformation of steel studs is therefore crucially important. Literature [33] investigated the high-temperature out-of-plane mechanical performance through numerical simulation, confirming the out-of-plane constraining effect of panels during building fires. However, the study simplified this constraining effect without considering nonlinear variations under high temperatures. Consequently, comprehensive research on the out-of-plane mechanical properties of self-drilling screw connections under elevated temperatures is necessary to facilitate the calculation and design of fire resistance in cold-formed steel structural systems. To date, while there has been considerable research on panels [34], no experimental studies have been conducted on the out-of-plane restraining effect of wall panels and self-drilling screws on steel studs.
Therefore, this study selected three typical types of panels—autoclaved lightweight concrete sheathing panels, fire-resistant gypsum lining boards, and medium-density calcium silicate board—which were assembled with steel studs using self-drilling screws. High-temperature three-point bending tests were conducted in the PWS-100 high-temperature fatigue testing system. By analyzing the failure modes, load–displacement curves, and relevant mechanical parameters of different self-drilling screw connections, a bending constitutive model was established, and its feasibility was demonstrated through numerical simulations. The aforementioned bending constitutive model can be applied to refined numerical calculations and fire resistance design of cold-formed steel structures.

2. Tests Conducted at Ambient and Elevated Temperatures

In experiments on cold-formed steel members, employing full-scale wall tests is not only extremely costly but also makes it difficult to ensure uniform temperature distribution throughout the specimen. Therefore, a simplified experimental model of the panel-to-stud connection was designed for this study.

2.1. Test Device

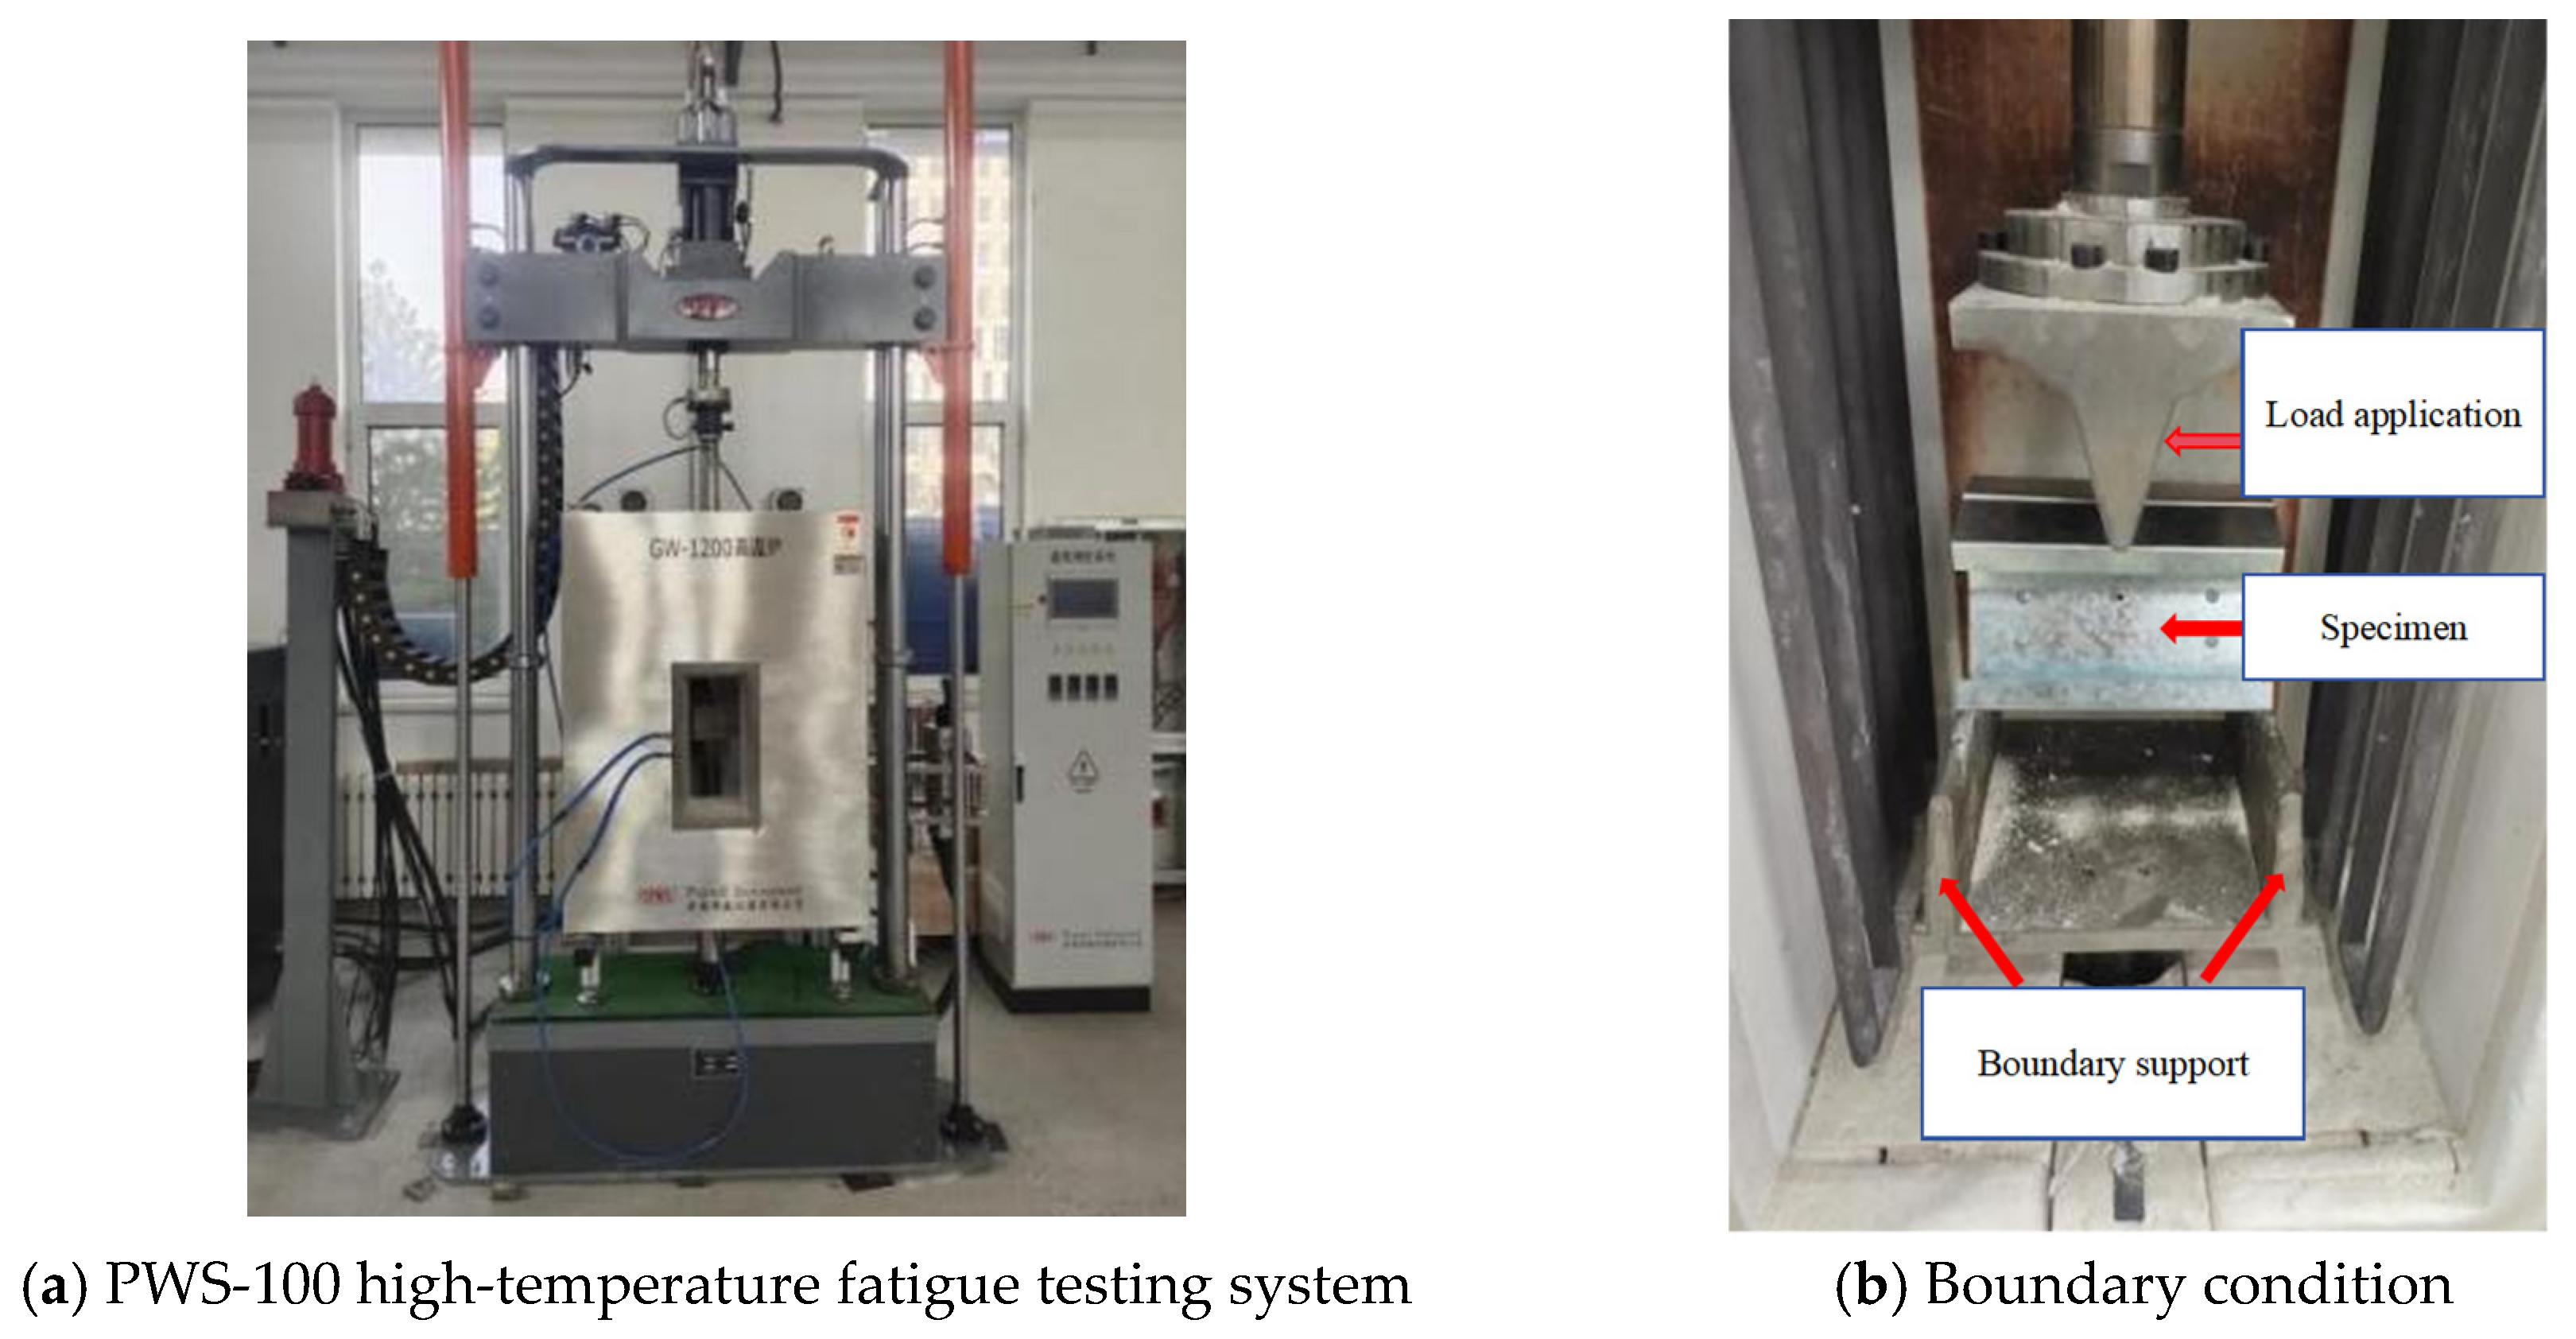
The mechanical performance tests in this study were conducted using a PWS-100 high-temperature fatigue testing system (maximum capacity: 100 kN, Jinan Bangwei Instrument Co., Ltd, Jinan, China). The high-temperature furnace features a maximum operating temperature of 1200 °C with an effective working chamber dimensions of 450 mm × 300 mm × 700 mm. The high-temperature fatigue testing system and its equipped heating apparatus are shown in Figure 2a. The load application and boundary support configuration for the connections are illustrated in Figure 2b.

2.2. Test Coupons

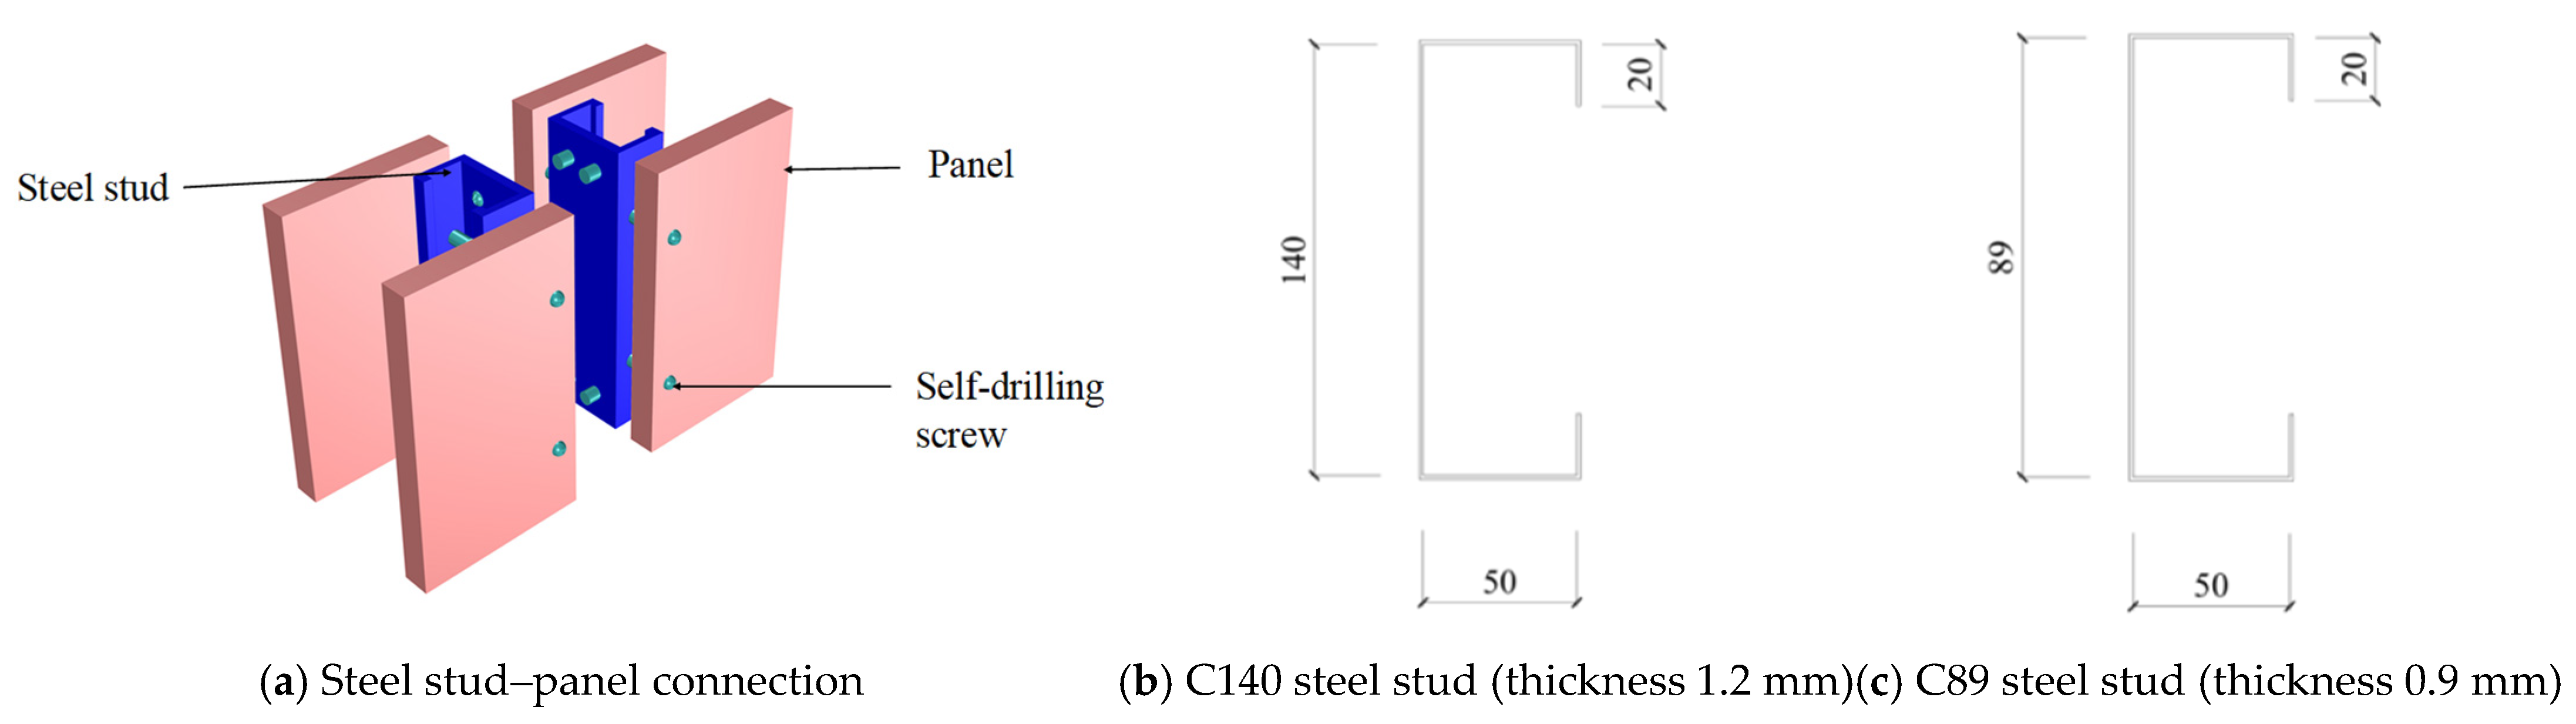
The steel stud–panel connection is illustrated in Figure 3a. The composite connection consists of Q355 cold-formed thin-walled steel studs and panels assembled using ST4.8-32 cross recessed round head self-drilling screw (nominal diameter 4.8 mm, effective length 32 mm). A control group was designed with back-to-back C-shaped steel stud connections using self-drilling screw to eliminate the influence of panels on mechanical performance. The steel studs are categorized into two types: C140 (Figure 3b) and C89 (Figure 3c) steel studs. Three types of panels are used: autoclaved lightweight concrete panels, fire-resistant gypsum boards, and medium-density calcium silicate board, with thicknesses of 50 mm, 12 mm, and 9 mm, respectively.
The number of specimens was determined as follows: With reference to the AISI Cold-Formed Steel Design Manual [30], the number of specimens under each temperature condition was determined according to the following procedure: two tests were first conducted for the same group of specimens. If the difference between each measured load-carrying capacity and the average of the two falls within 10%, the requirement is satisfied. If the difference exceeds 10%, a third test is performed. In this case, it must be ensured that the deviation between any of the three test results and the average of the three is within 15%; otherwise, a fourth test is conducted.
A total of eight cold-formed steel and sheathing panel connection specimens were designed, with specific parameters provided in Table 1. The specimen naming convention is as follows. FPP denotes fire-resistant gypsum board, MBTB denotes medium-density fiber cement board, and ALC denotes autoclaved lightweight concrete panel. The section height of the steel studs is used to represent their geometric size. All temperatures are reported in degrees Celsius (°C).

2.3. Test Methods

The specimens were placed on the loading fixture within the furnace. A linear heating regime was implemented, raising the temperature at a constant rate of 20 °C/min until reaching the target temperature, followed by a 40 min soaking period maintained through PID closed-loop control. Loading commenced immediately after the soaking phase.
Displacement-controlled loading was applied at a constant rate of 0.02 mm/s until failure occurred in the panel at the bottom flange of the specimen. The high-temperature fatigue testing system recorded test data—including load, displacement, time, and temperature—in real time at a sampling frequency of 100 Hz.
Considering the differences in thermal properties among materials, three types of sheathing panels were subjected to different temperature conditions:
FFP: 6 conditions (25 °C, 100 °C, 150 °C, 200 °C, 250 °C, and 300 °C)
MBTB: 4 conditions (25 °C, 100 °C, 150 °C, and 200 °C)
ALC: 10 conditions (25 °C, 100 °C, 150 °C, 200 °C, 250 °C, 300 °C, 350 °C, 400 °C, 450 °C, and 500 °C)

3. Test Results

3.1. Test Phenomena

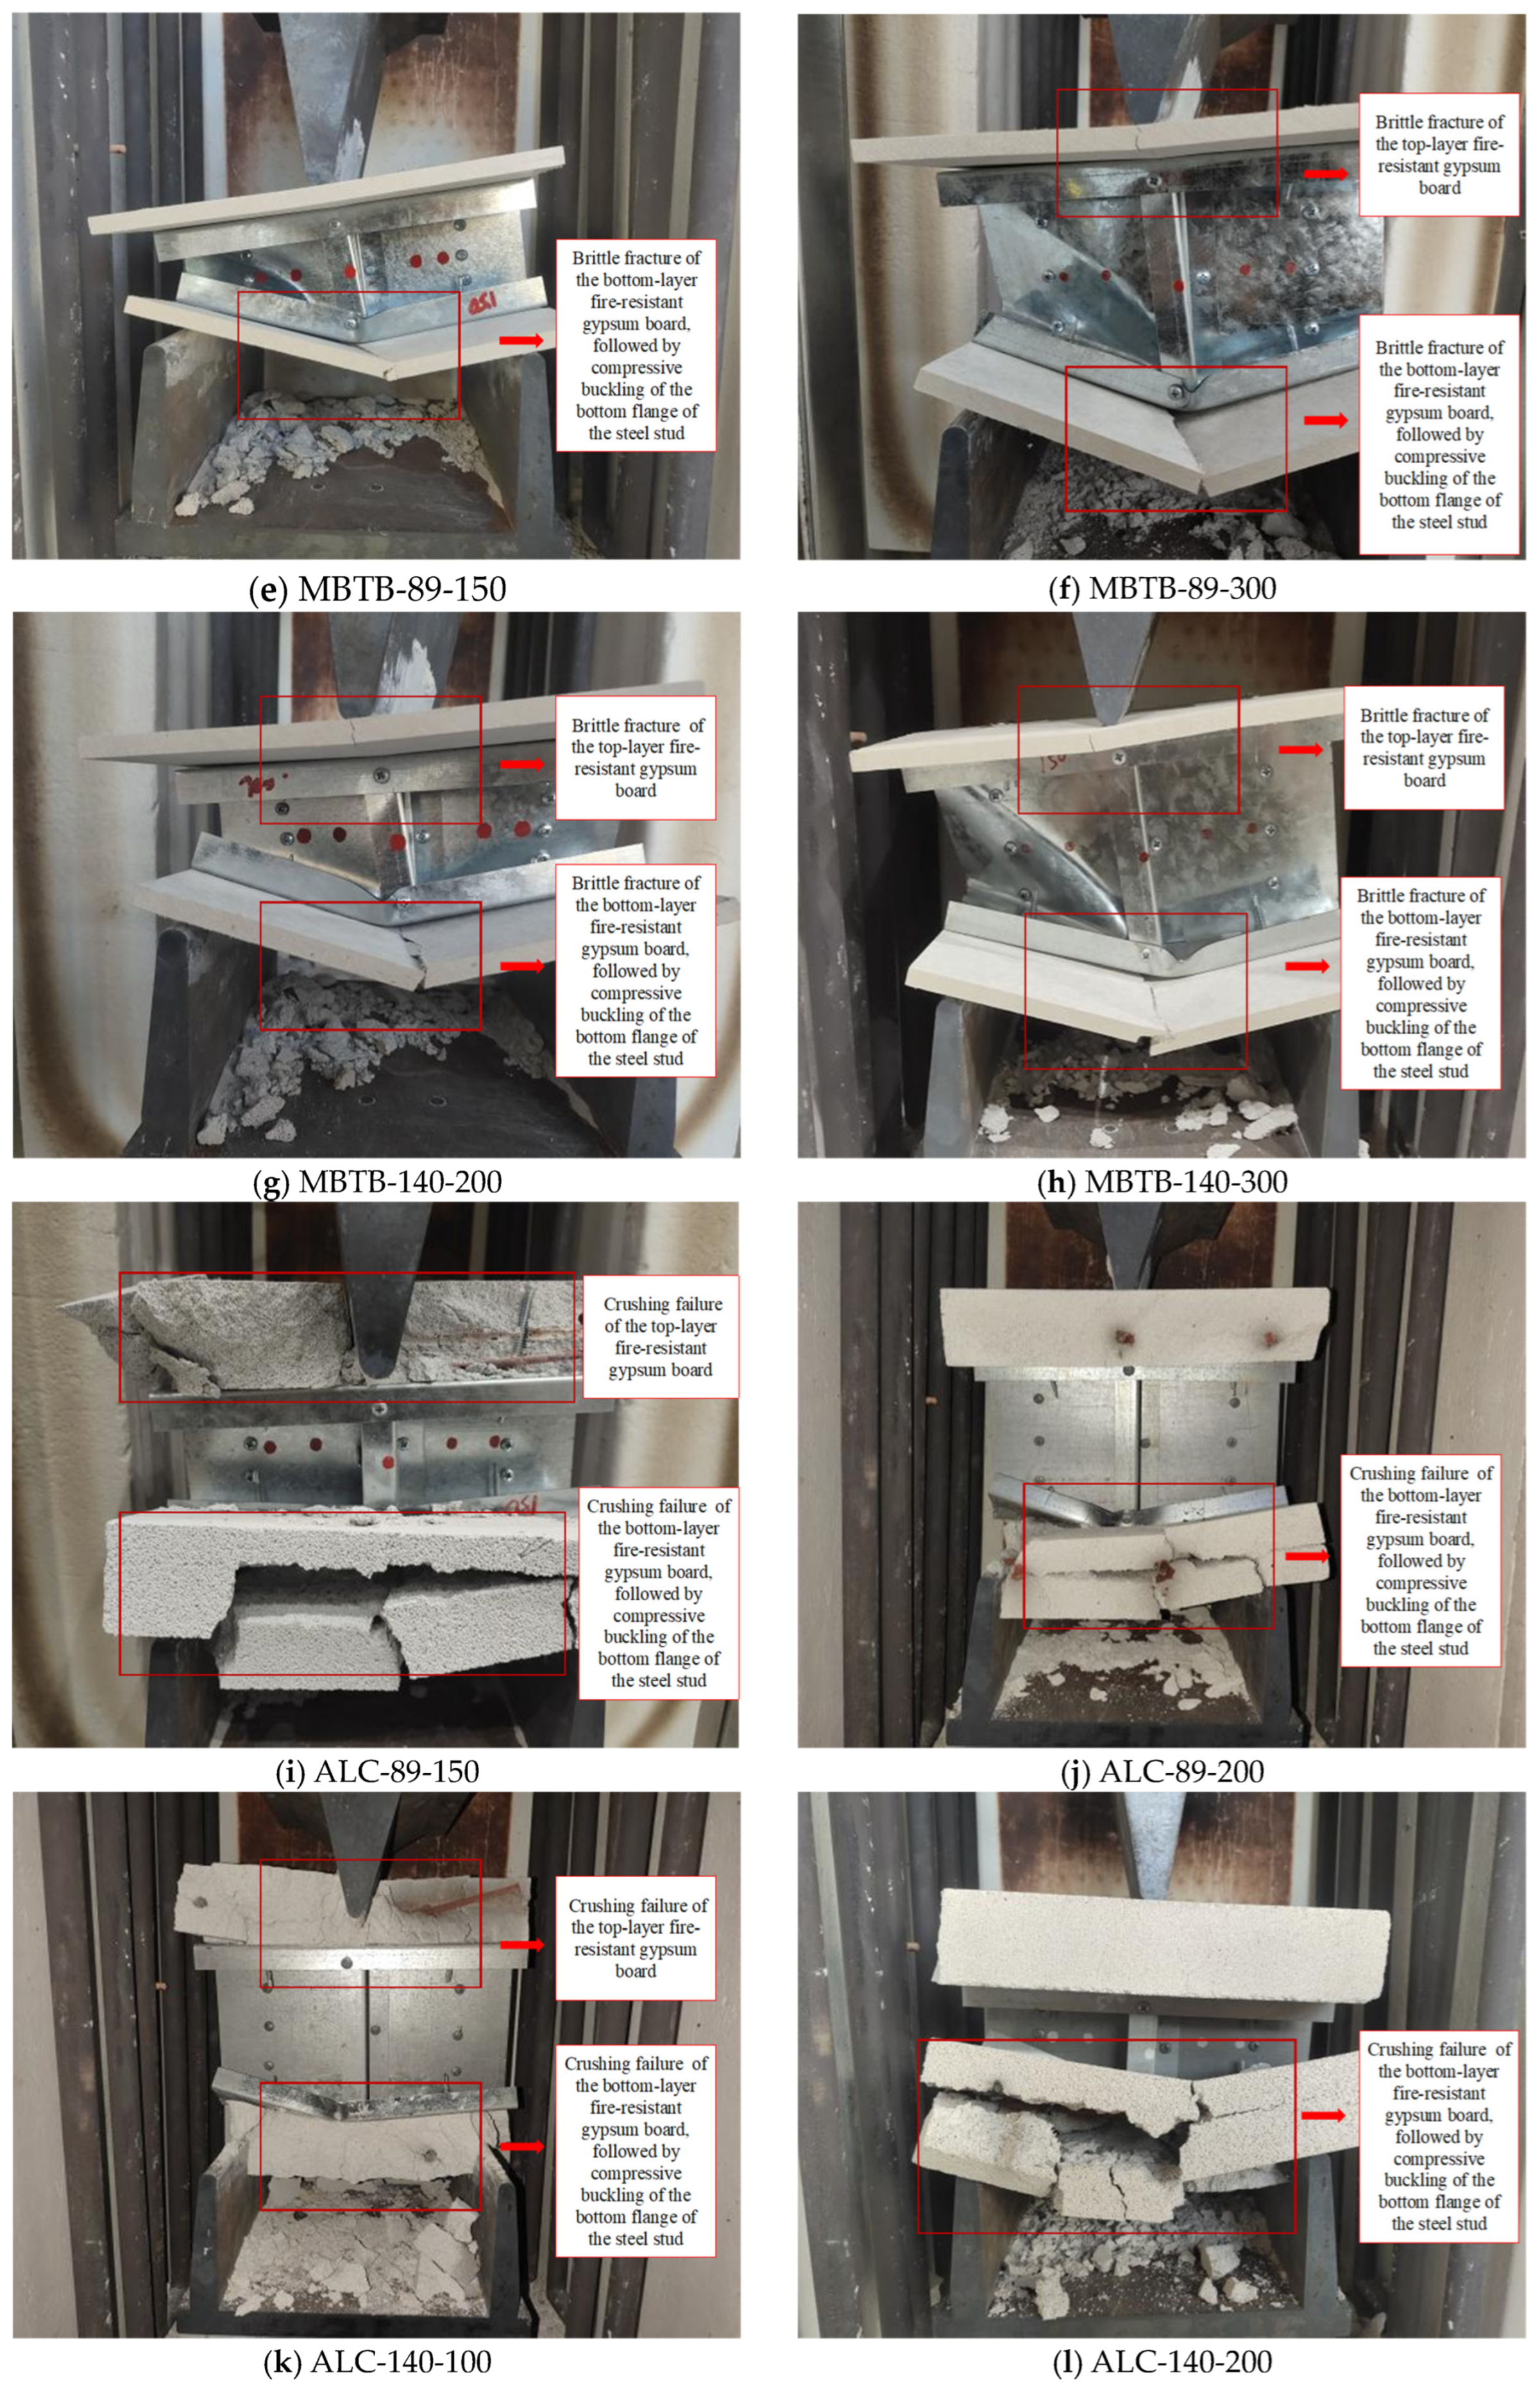
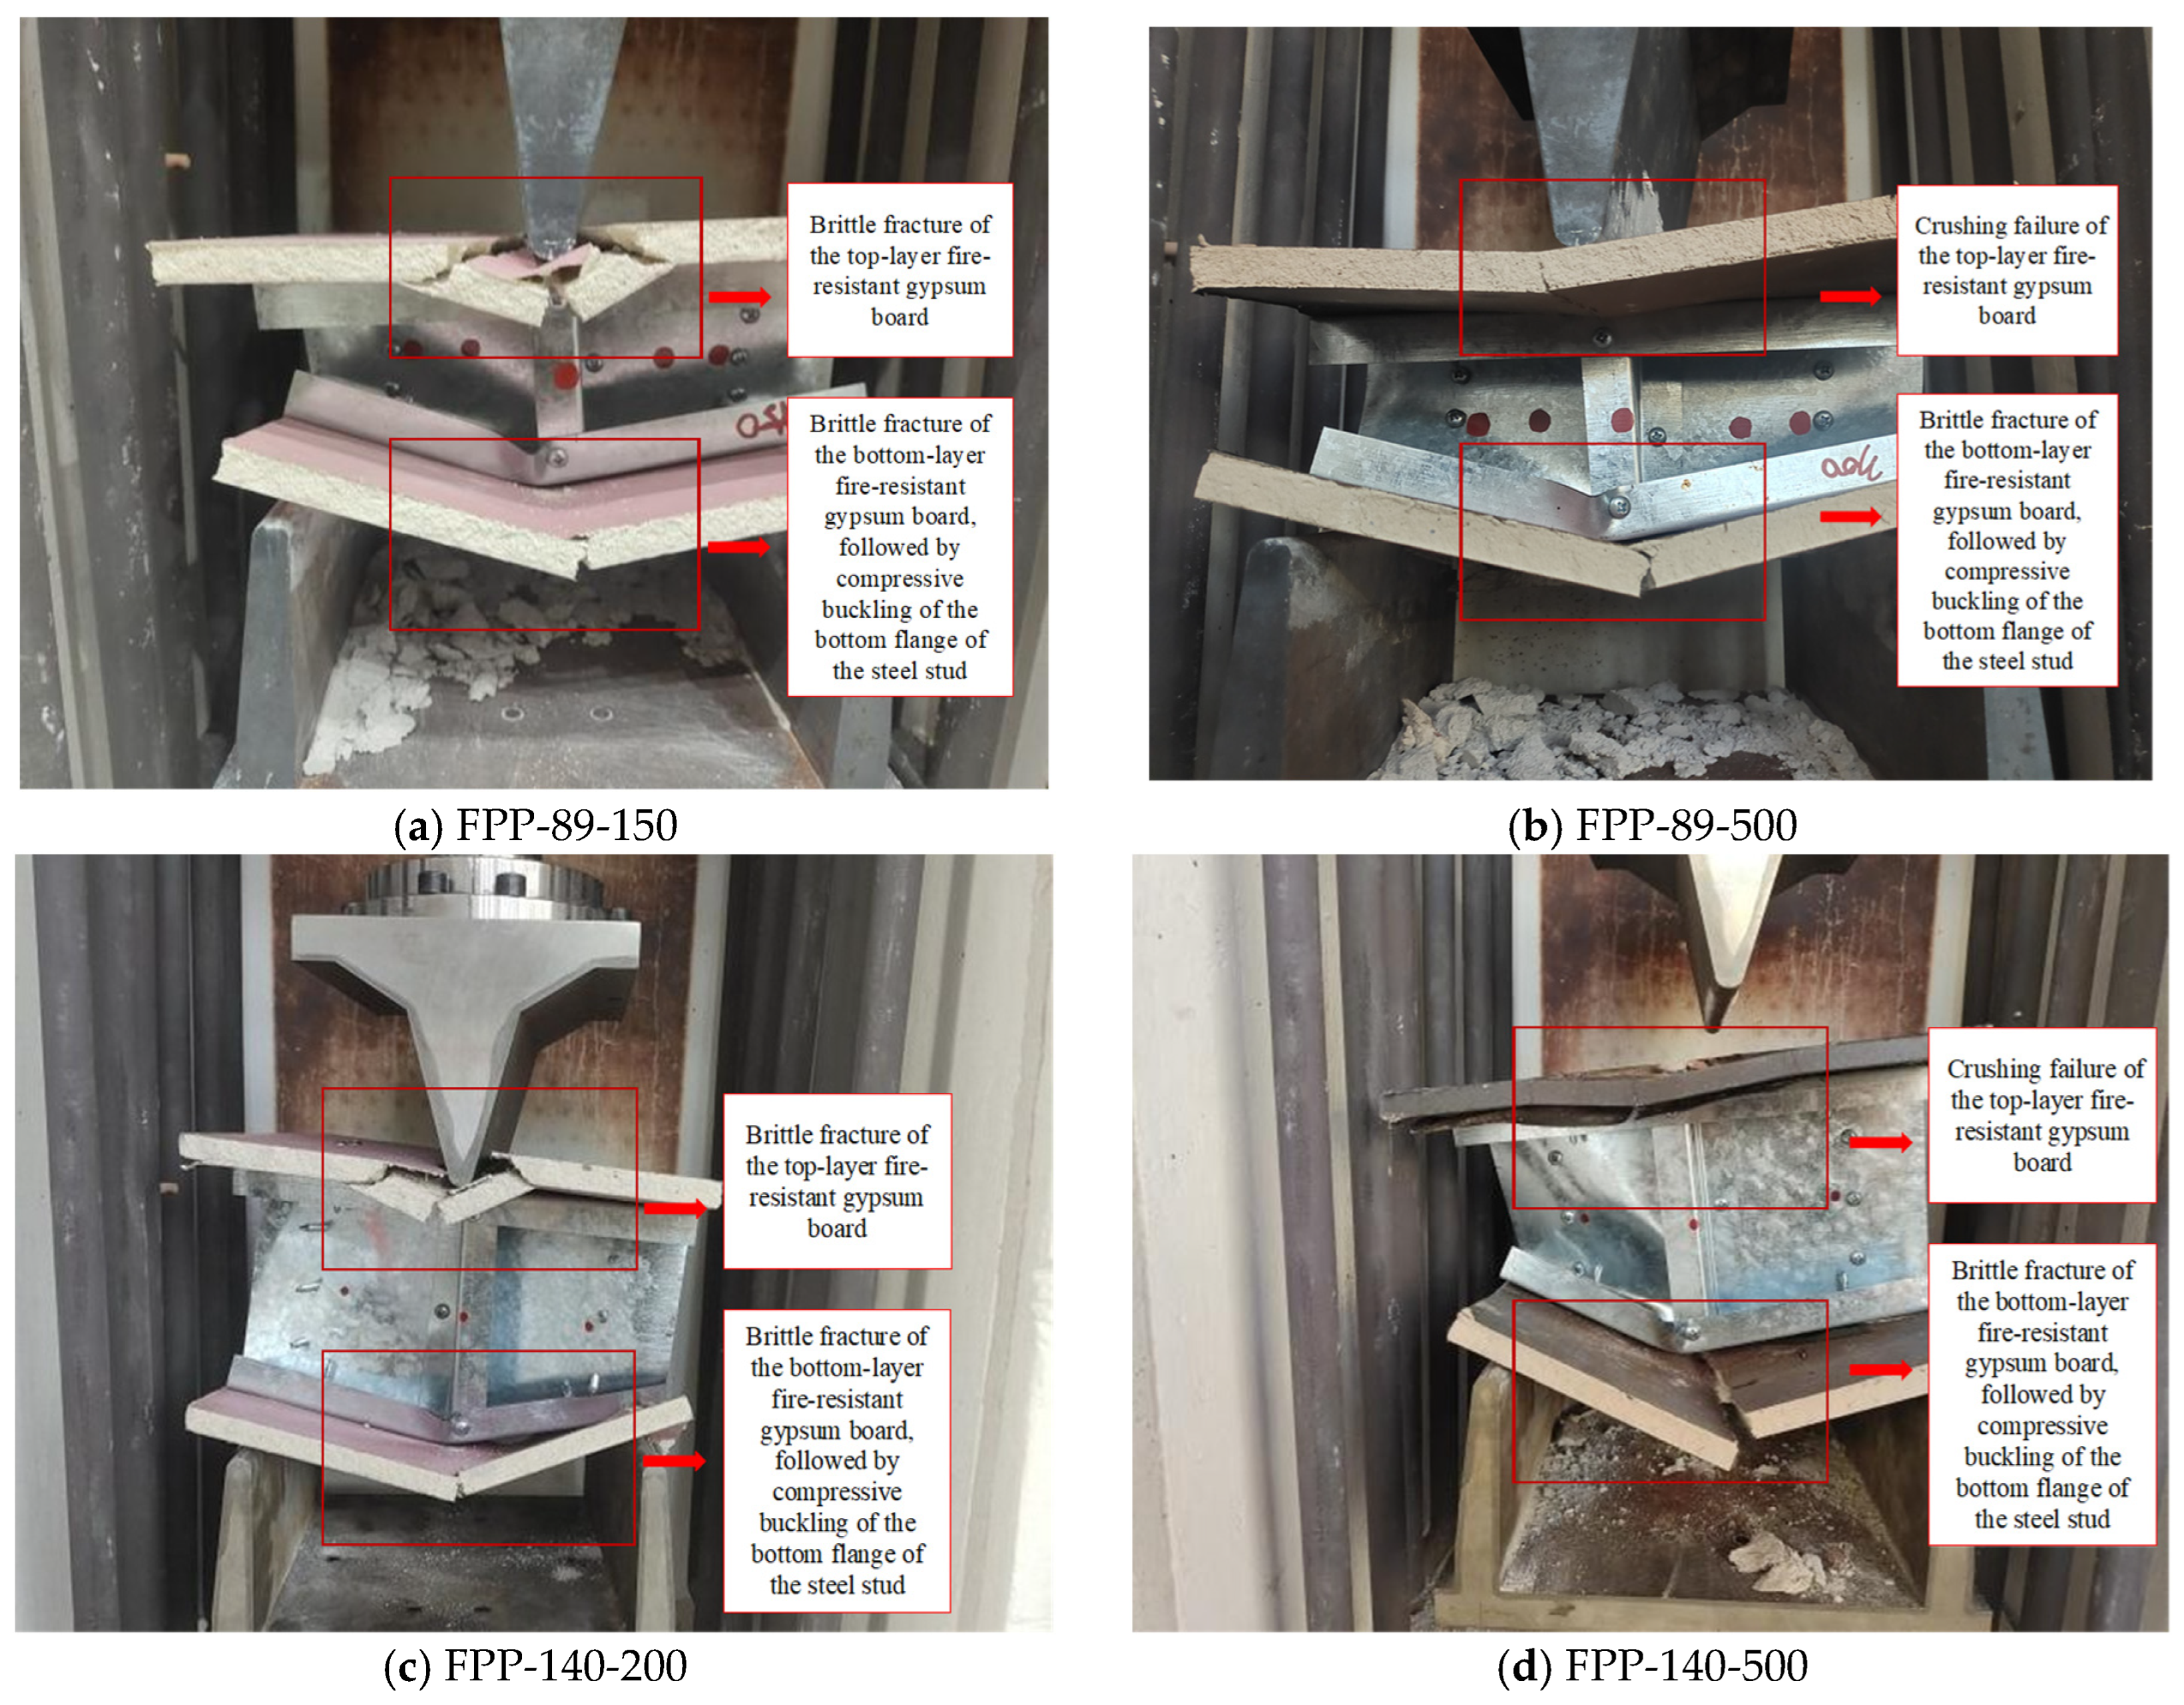
Figure 4 illustrates the failure modes of connections with three different panel types at various temperatures (only two representative temperature conditions are shown for each panel type). For FPP connections, the ultimate failure mode consistently involved initial cracking under compression and brittle fracture of the bottom-layer fire-resistant gypsum board, followed by compressive buckling of the bottom flange of the steel stud (Figure 4a–d). The distinction in failure modes across temperatures manifested in whether—and how—the top-layer gypsum board failed: within the 20–200 °C range, the top board experienced crushing failure, while at 250 °C, surface carbonization occurred, leading to strength loss.
The ultimate failure mode of MBTB connections was similar to that of FPP connections (Figure 4e–h), with both exhibiting fracture of the bottom panel followed by buckling failure of the steel stud’s bottom flange. ALC connections also showed a similar failure sequence—crushing of the bottom panel followed by compressive buckling of the stud’s bottom flange—but differed in the panel’s failure mechanism. Instead of fracturing, the ALC panel failed by crushing due to its low tensile strength, leading to fragmentation.

3.2. Load–Displacement Curve

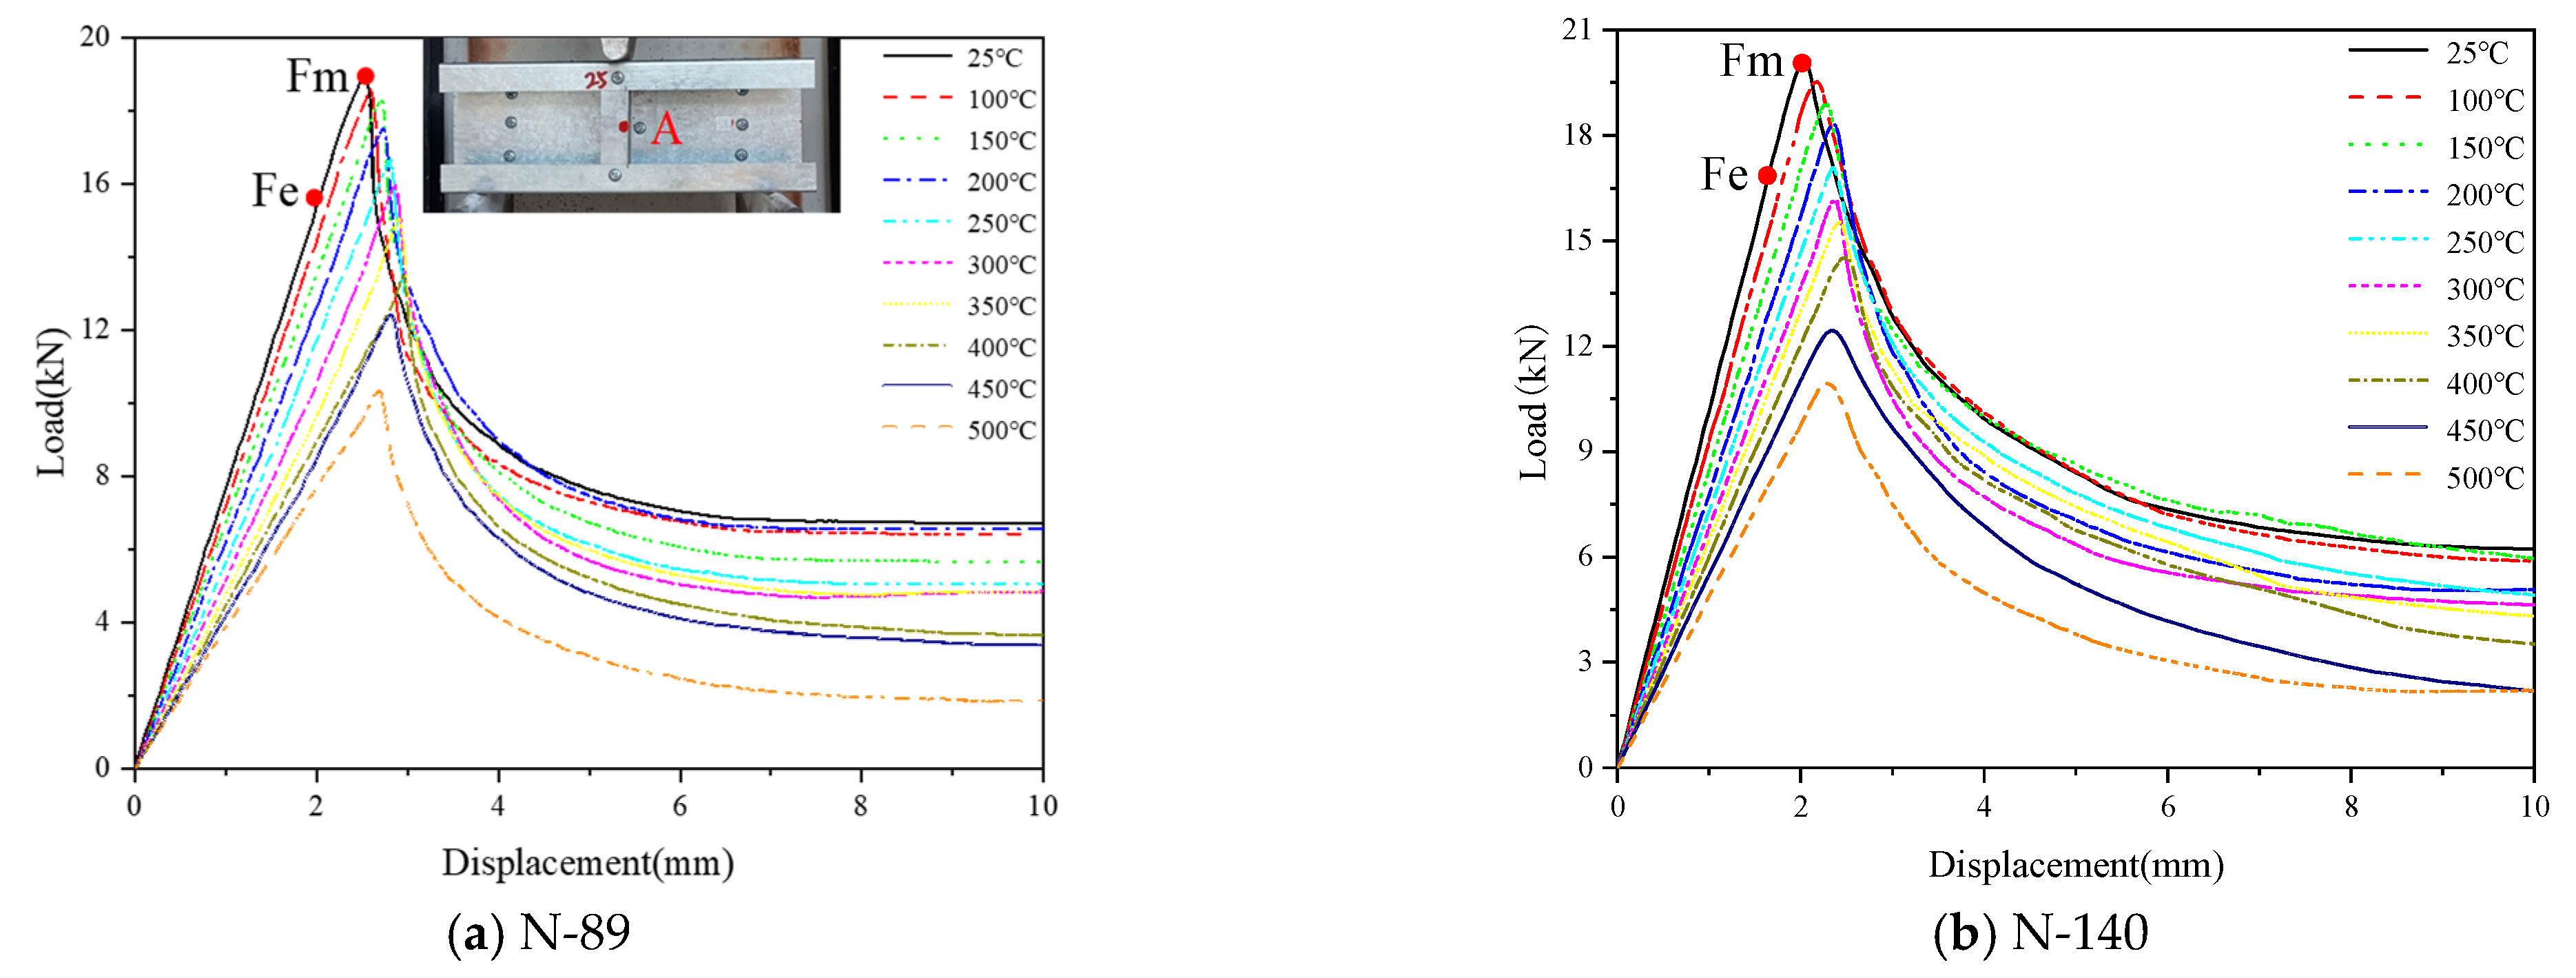
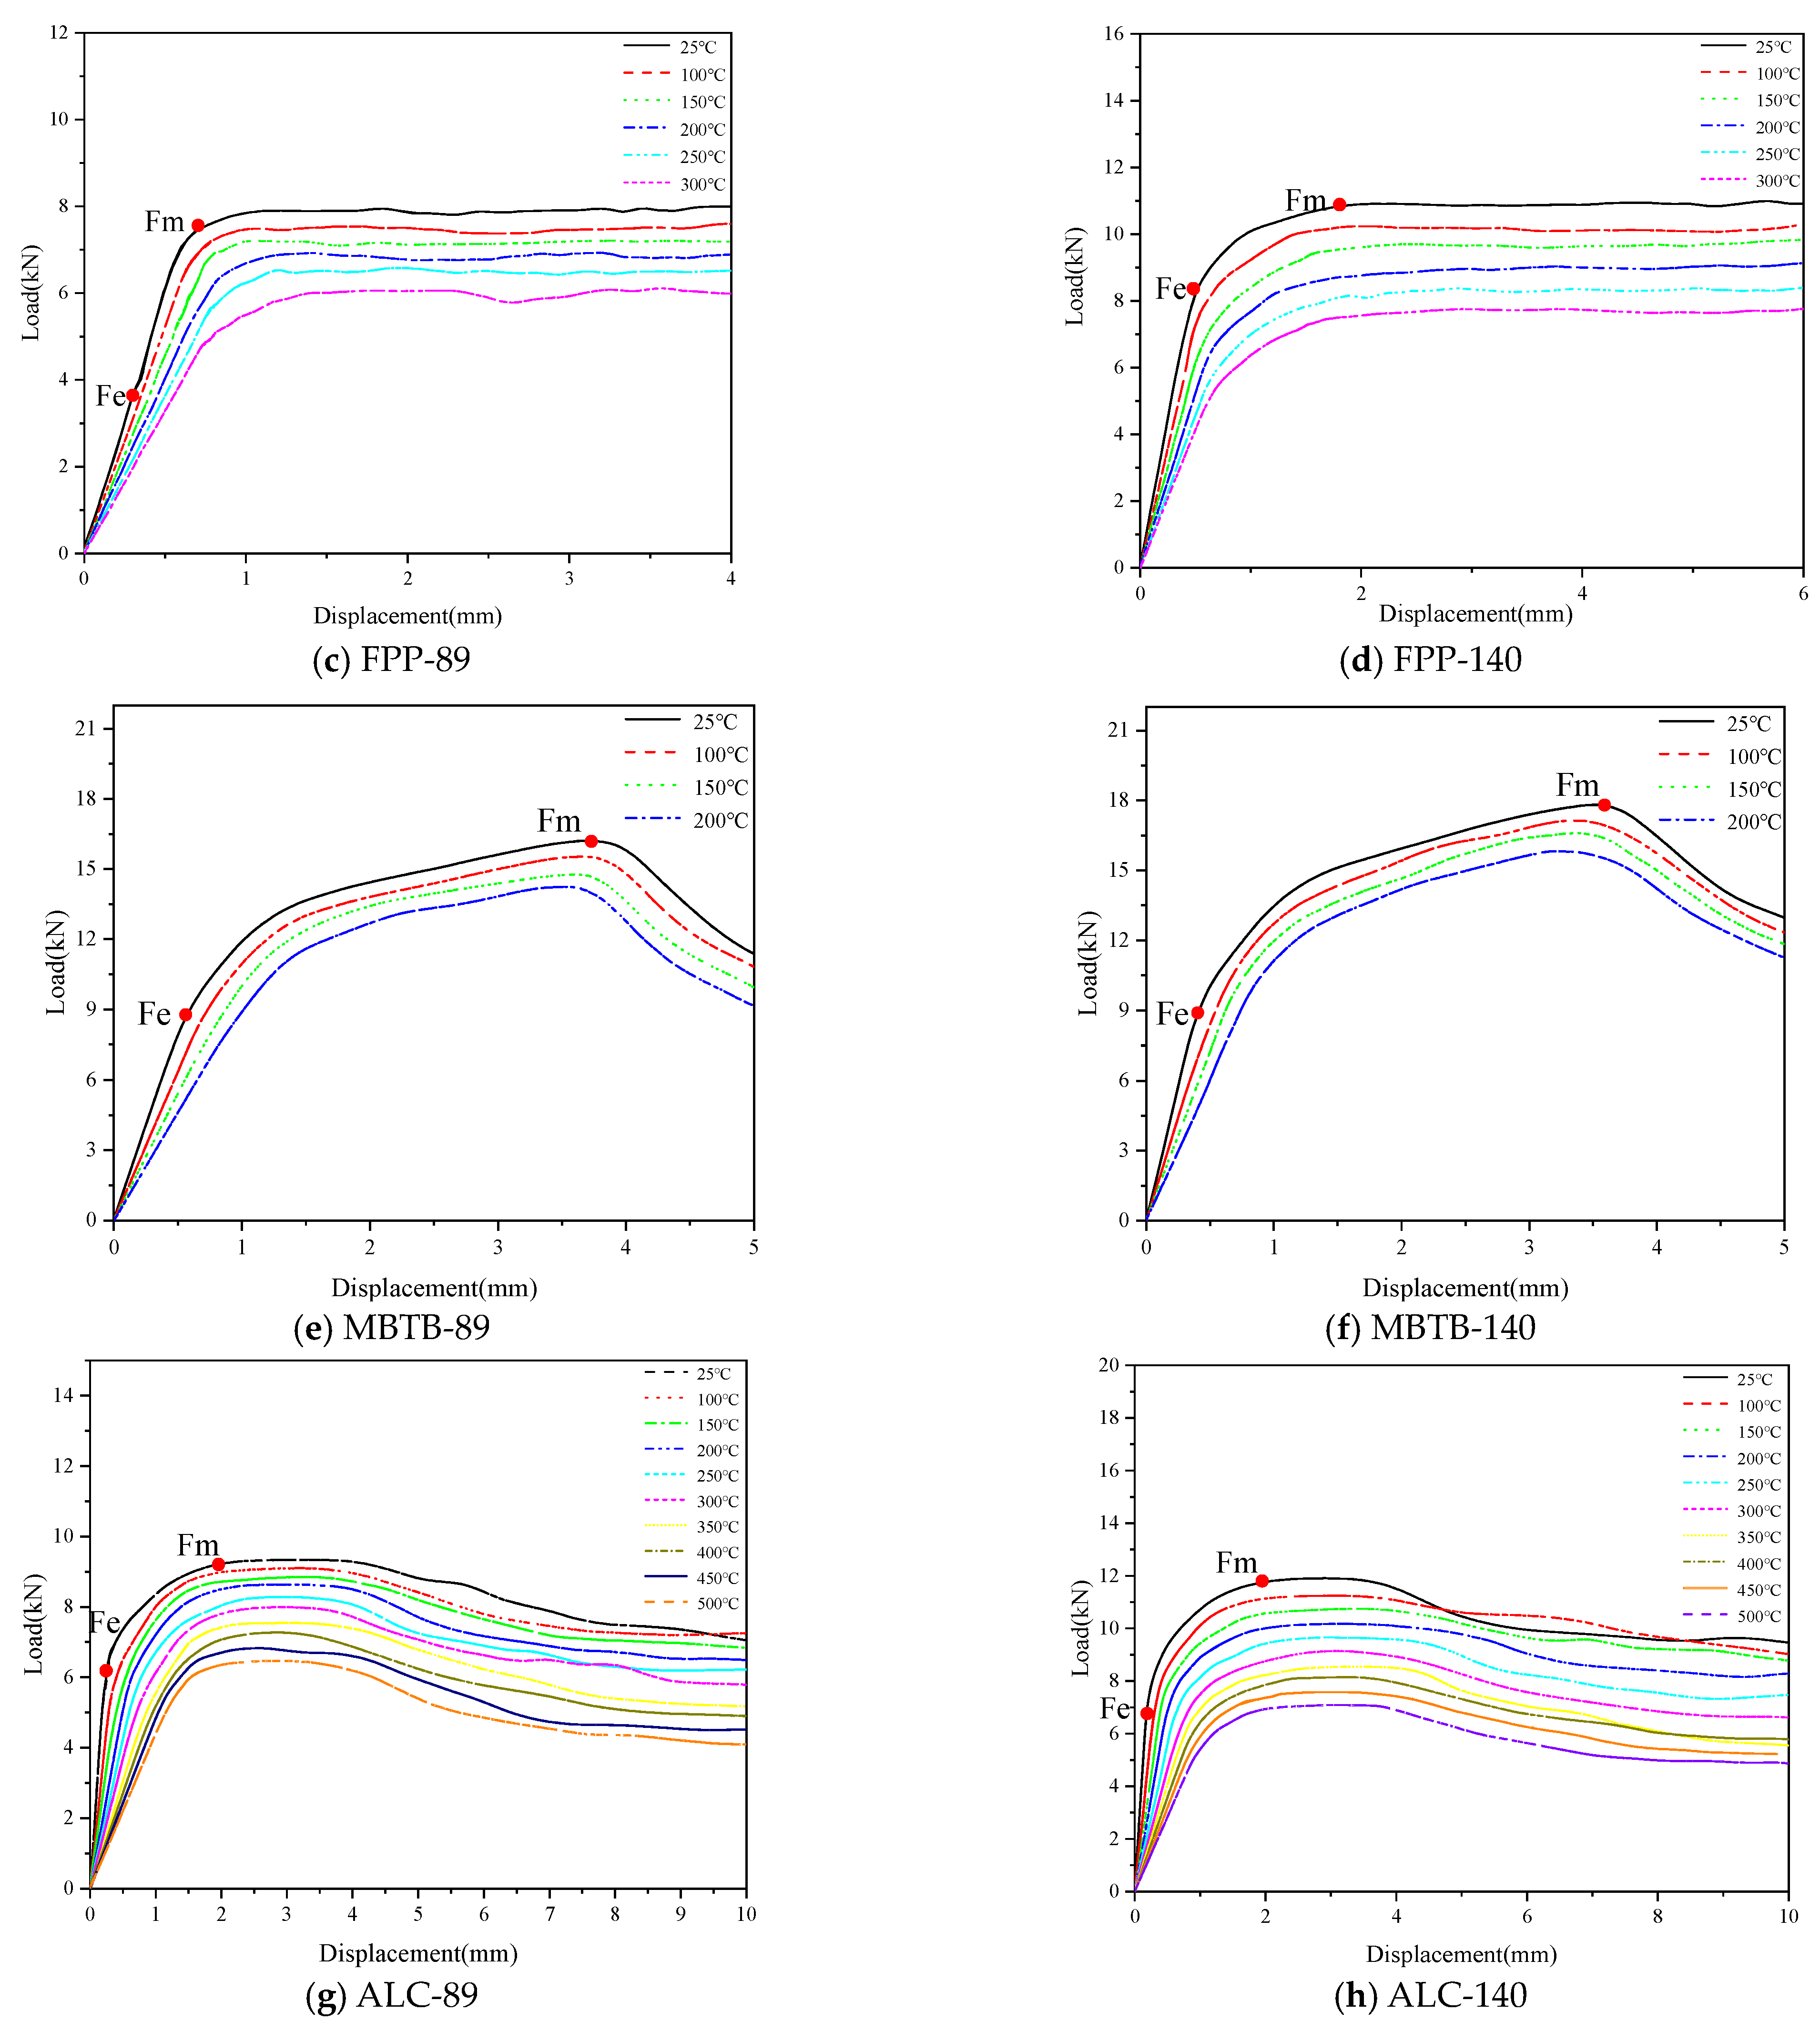
Figure 5 presents the load–displacement curves of various connection types under different temperature conditions. The X-axis represents the displacement variation at the midpoint of the central axis (Point A in Figure 5a) of the specimen. Analysis of the load–displacement curves for the steel-to-steel stud connection in Figure 5a reveals that under different temperature conditions, the curves can be divided into three distinct stages: Elastic ascending stage (F ≤ Fe): In this stage, the displacement increases progressively with increasing load, exhibiting a linear relationship between load and displacement. Inelastic ascending stage (Fe < F ≤ Fm): This stage demonstrates a nonlinear positive correlation between load and displacement. Descending stage (F > Fm): During this stage, the load capacity decreases with further increases in displacement.
Analysis of the load–displacement curves for connections in Figure 5c–h reveals that under different temperature conditions, all six connection types exhibit three distinct stages.
Stage 1: Elastic Ascending Stage (F ≤ Fe)
Displacement increases with applied load, demonstrating a linear load–displacement relationship. During this stage, cracks initiated and propagated rapidly in the top flange panels of both FPP and ALC connections; No cracking occurred in the bottom flange panels. MBTB connections showed differential behavior. MBTB-140 connections developed cracks in the top flange panel with slow propagation. MBTB-89 connections exhibited no cracking in either top or bottom flange panels.
Stage 2: Elastoplastic Ascending Stage (Fe < F ≤ Fm)
A nonlinear positive correlation between load and displacement was observed. For FPP and ALC connections, cracks in top flange panels widened progressively until compressive fracture occurred; bottom flange panels experienced plastic deformation with crack initiation and widening; For MBTB-140 connections, bottom flange panels showed plastic deformation with crack development and widening; top flange panels exhibited cracking without complete fracture; For MBTB-89 connections, bottom flange panels demonstrated plastic deformation with crack formation and propagation; top flange panels maintained crack-free condition throughout.
Stage 3: Post-Peak Stage (F > Fm)
The three panel types exhibited divergent behaviors. For MBTB and ALC connections, entered a rapid descending phase where load capacity decreased with increasing displacement. Bottom flange panels developed through-thickness cracks leading to brittle fracture, resulting in complete loss of out-of-plane constraining effect on steel studs. FPP connections: reached a gentle plateau phase. Although bottom flange panels experienced fracture failure and lost their out-of-plane constraining capacity, the connections maintained residual load-bearing capability.

3.3. Characteristic Parameters

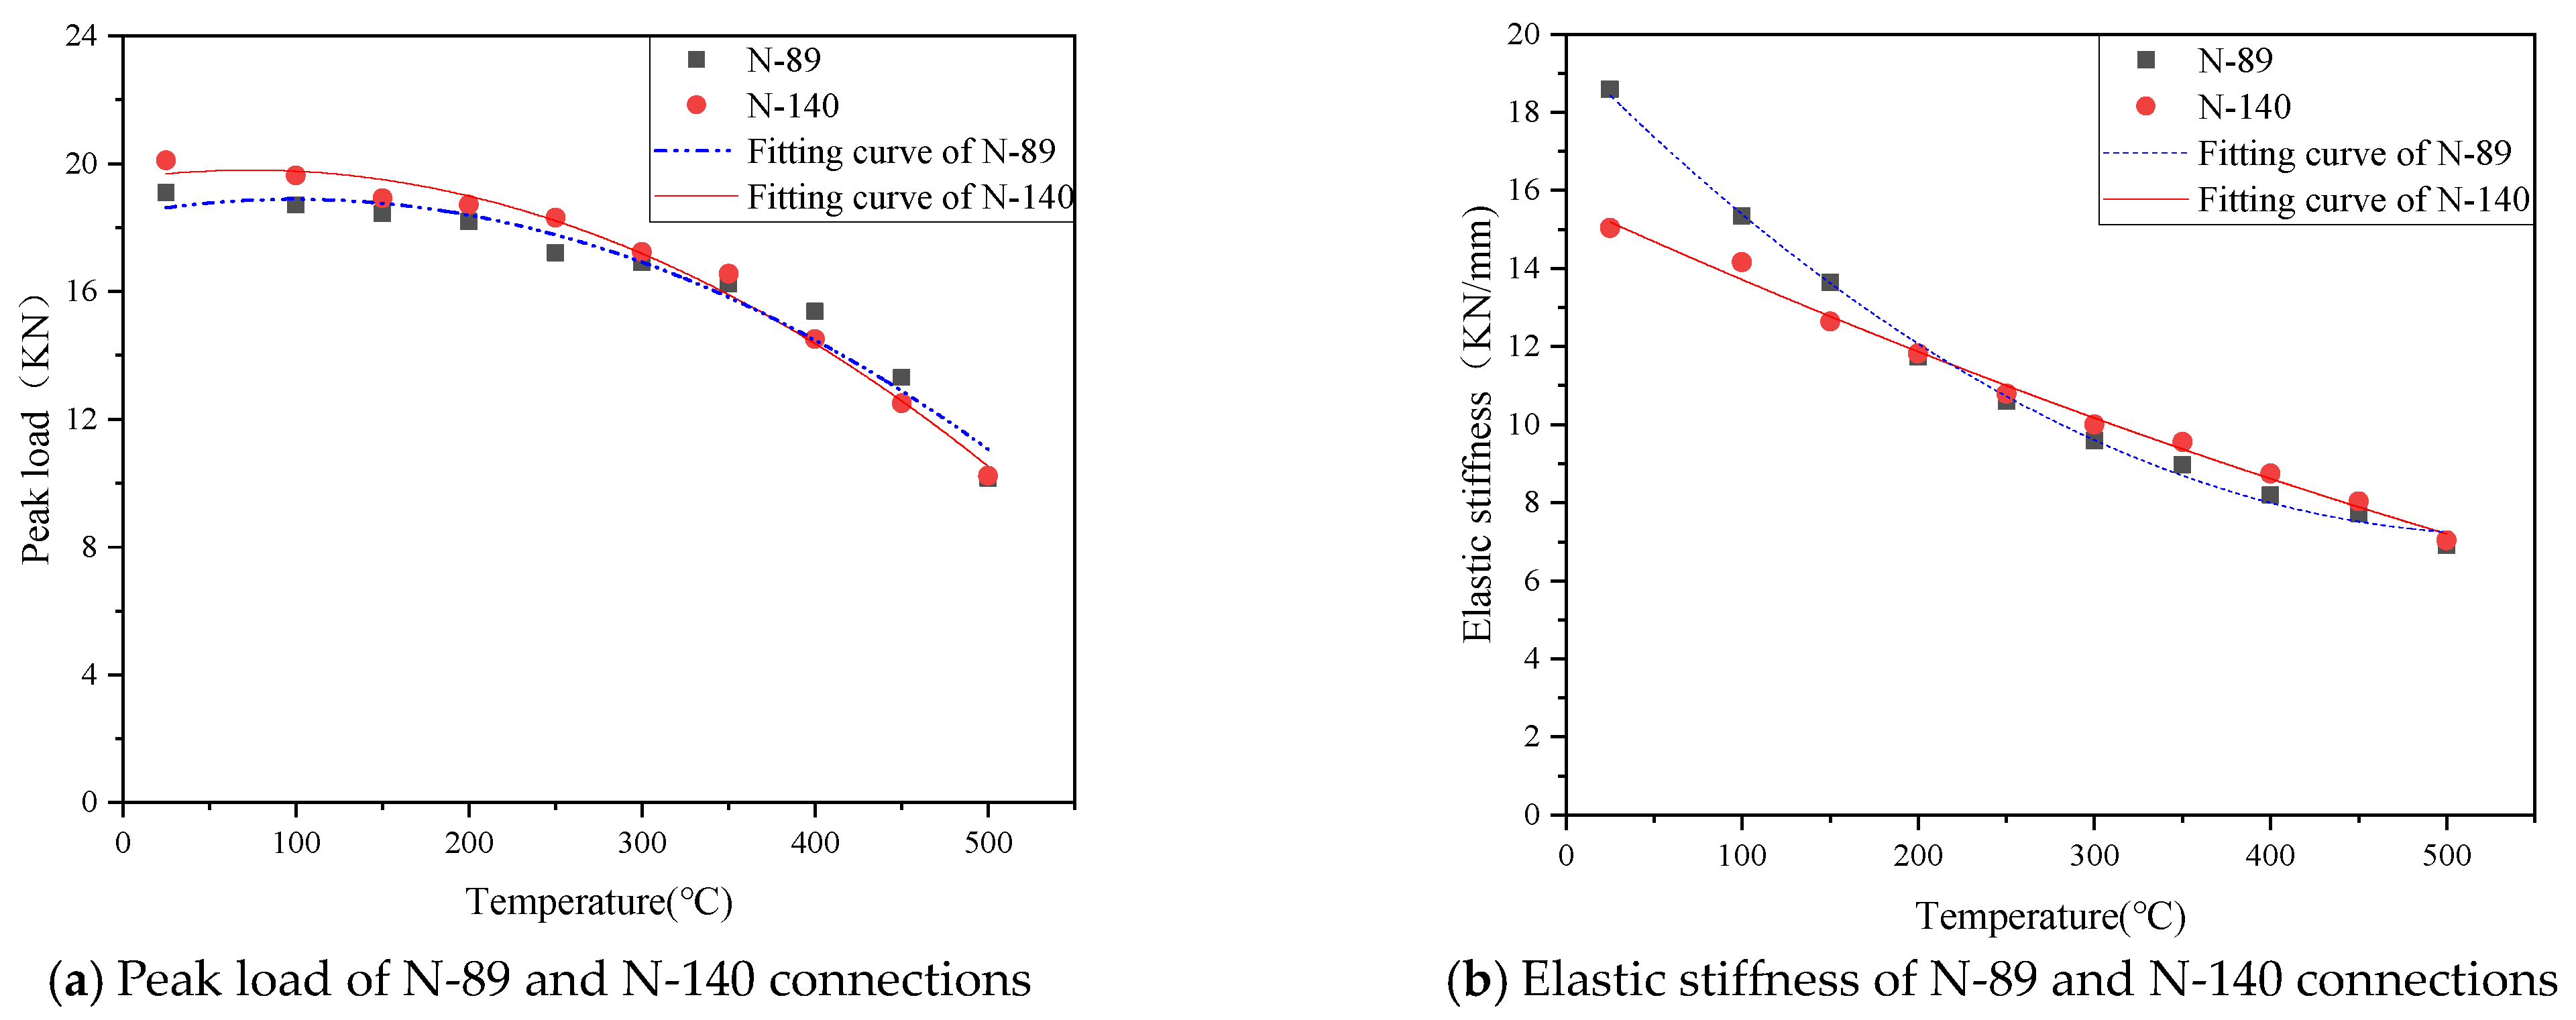
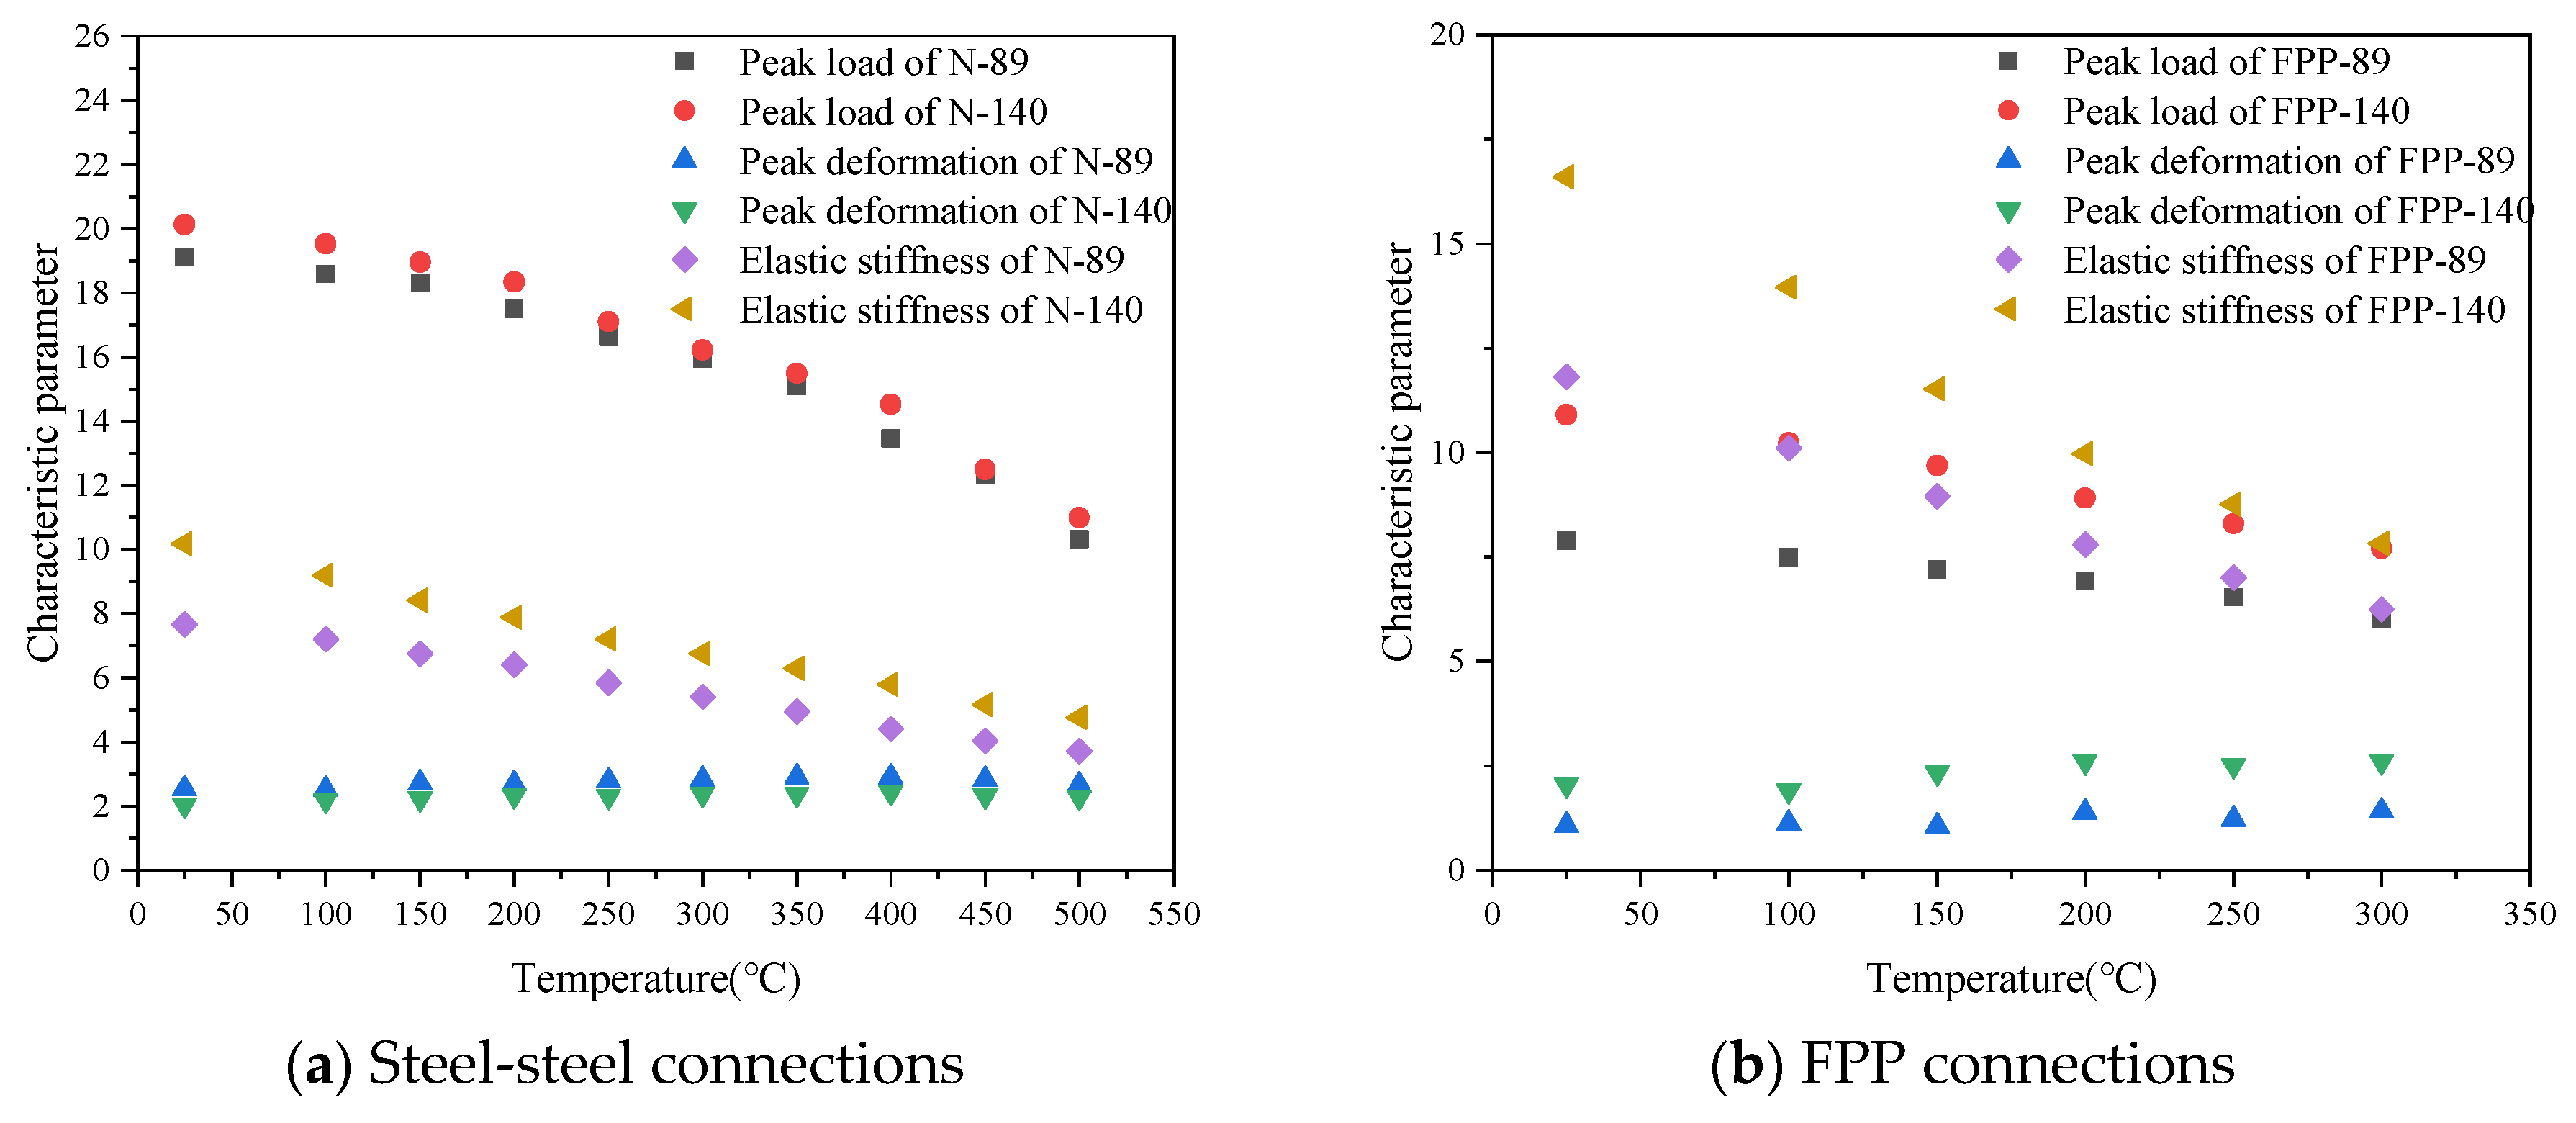
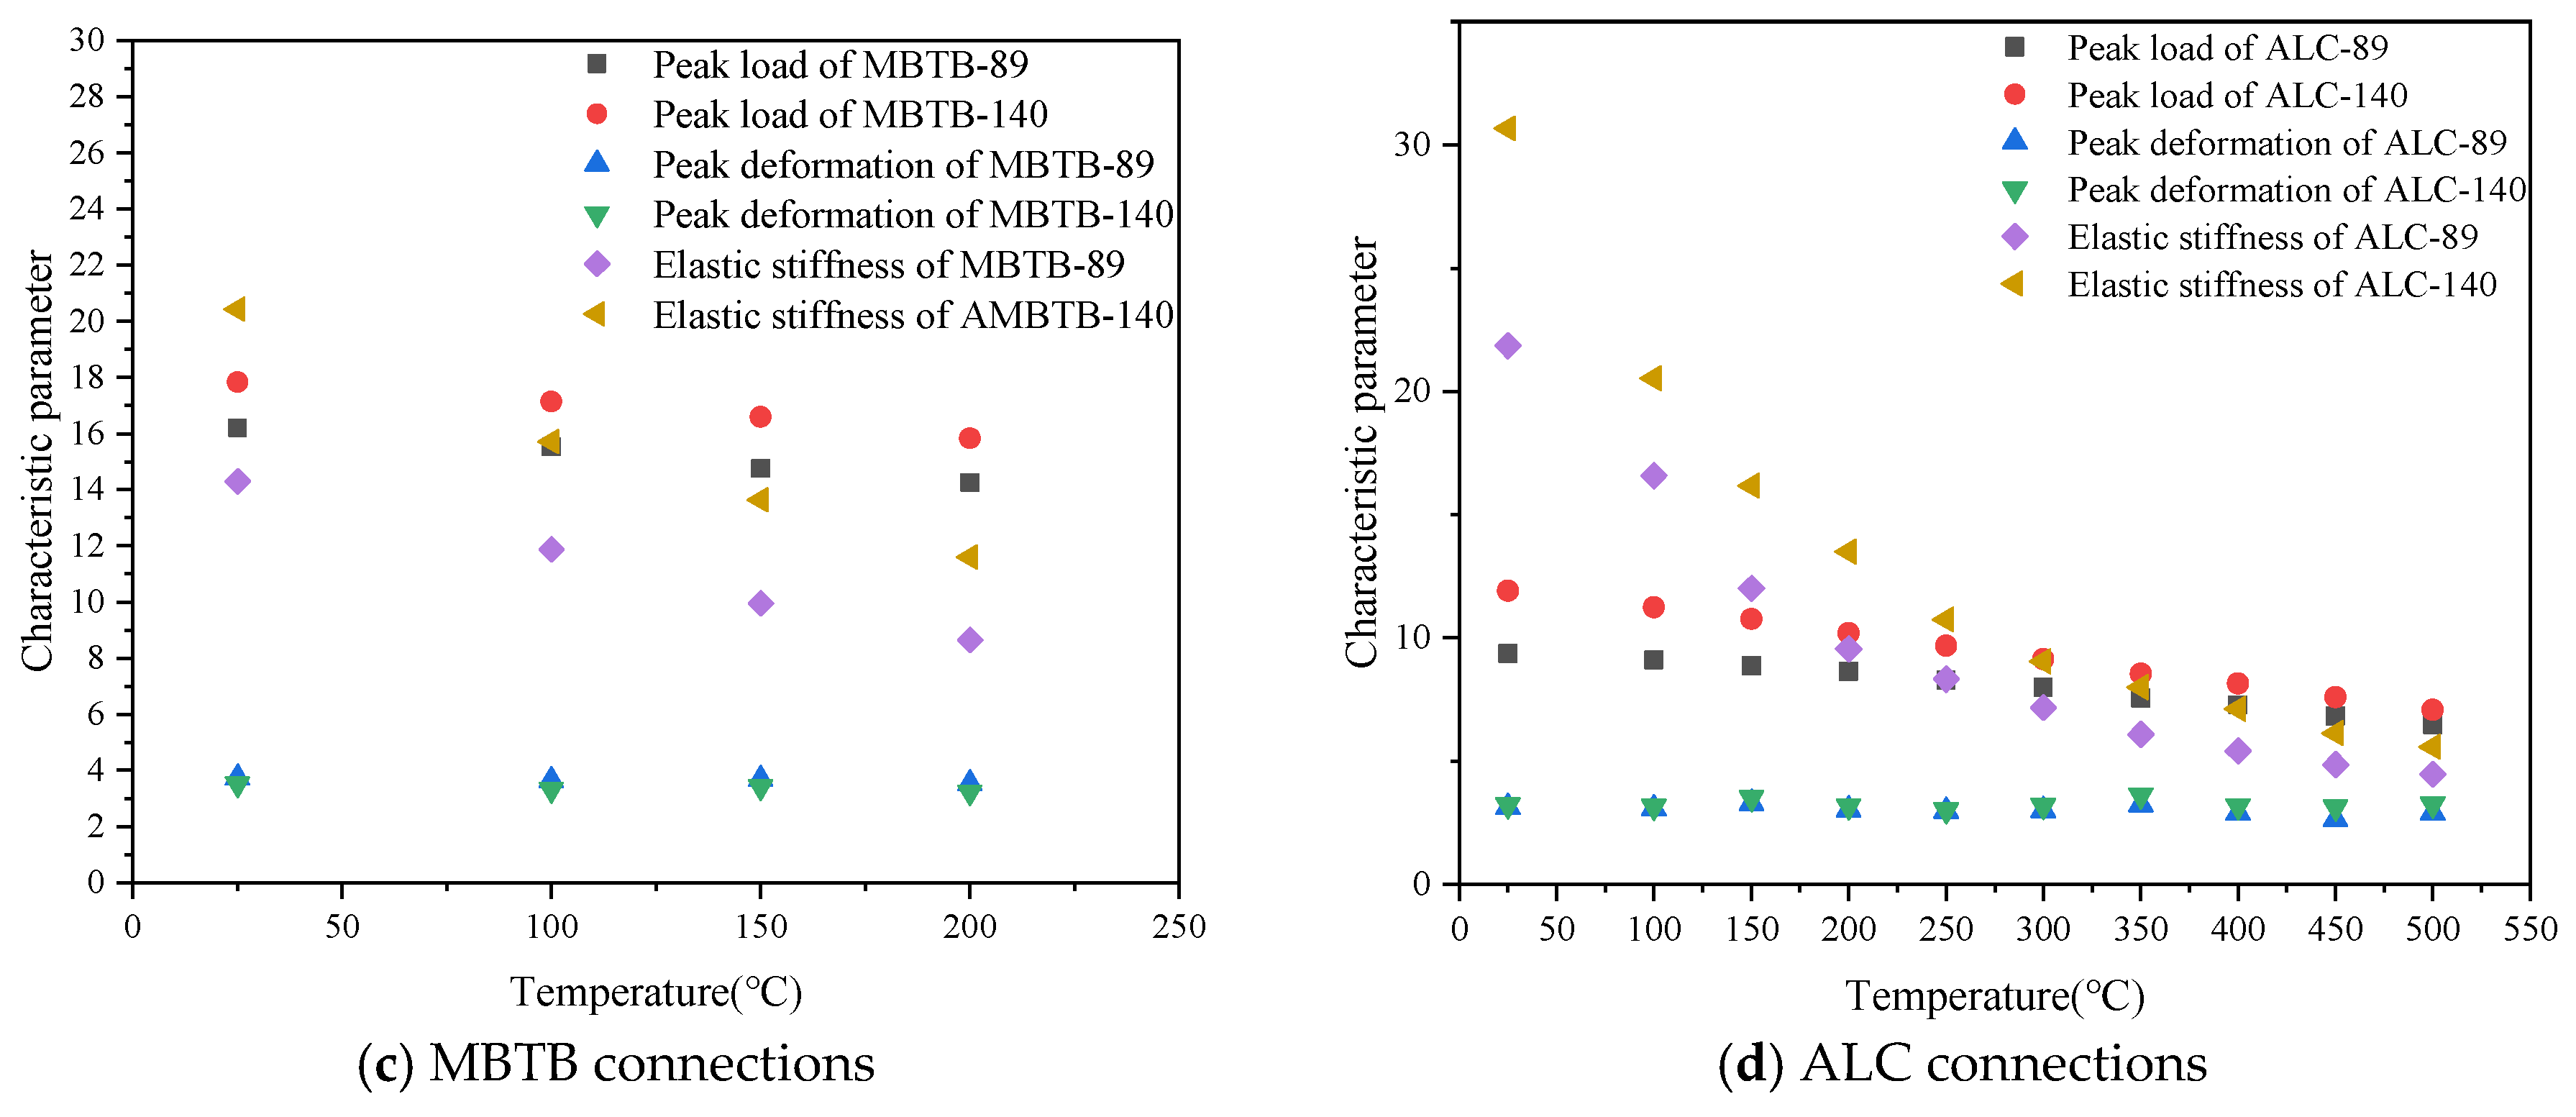
Figure 6 presents the peak load-temperature curves, elastic stiffness-temperature curves, and peak deformation-temperature curves for various connection types under different temperature conditions. The peak load, elastic stiffness, and peak deformation values used for plotting represent the arithmetic mean of repeated test results for specimens of the same group under identical temperature conditions.
Analysis of the characteristic parameter variations in Figure 6 reveals:
(1)
The peak loads of both steel-to-steel stud connections decrease with increasing temperature. Within the 25–500 °C range, the peak load of N-140 connections consistently slightly exceeds that of N-89 connections. At ambient temperature, the peak loads of N-89 and N-140 connections are 19.10 kN and 20.13 kN, respectively. This difference arises because the C140 steel stud exhibits a larger sectional moment of inertia than the C89 steel stud. When temperature rises to 200 °C, the degradation rate of peak load accelerates significantly for both connection types, indicating rapid deterioration of steel material properties above 200 °C.
(2)
The elastic stiffness of both steel-to-steel stud connections decreases with increasing temperature. Throughout the 25–500 °C range, the N-140 connections maintain slightly higher elastic stiffness than N-89 connections, though with a marginally greater rate of reduction with temperature.
(3)
The peak deformation of both steel-to-steel stud connections remains relatively stable across temperatures. The peak deformation of N-89 connections ranges from 2.53 mm to 2.92 mm, while that of N-140 connections ranges from 2.05 mm to 2.44 mm.
Analysis of the characteristic parameters for all connection types presented in Figure 6 yields the following conclusions:
(1)
The elastic stiffness of all six connection types decreases with increasing temperature. Across all temperature conditions, connections with C140 steel studs consistently exhibit higher elastic stiffness than those with C89 steel studs. However, this difference gradually diminishes as temperature increases, indicating that the influence of steel stud cross-sectional geometry on elastic stiffness becomes less significant at elevated temperatures.
(2)
The peak load of all six connection types decreases with rising temperature. Under all temperature conditions, connections utilizing C140 steel studs maintain higher peak loads than those with C89 studs. For FPP-89/FPP-140 and ALC-89/ALC-140 connections, this difference progressively decreases with temperature elevation. In contrast, MBTB-89 and MBTB-140 connections show no significant difference in peak load capacity.
(3)
The peak deformation of all six connection types remains relatively unaffected by temperature variations, with values fluctuating within specific ranges:
FPP-89: 1.06 mm~1.41 mm; FPP-140: 1.91 mm~2.60 mm; MBTB-89: 3.53 mm~3.74 mm; MBTB-140: 3.22 mm~3.51 mm; ALC-89: 2.64 mm~3.28 mm; ALC-140: 3.02 mm~3.61 mm.

3.4. Influence of Panels on Characteristic Parameters

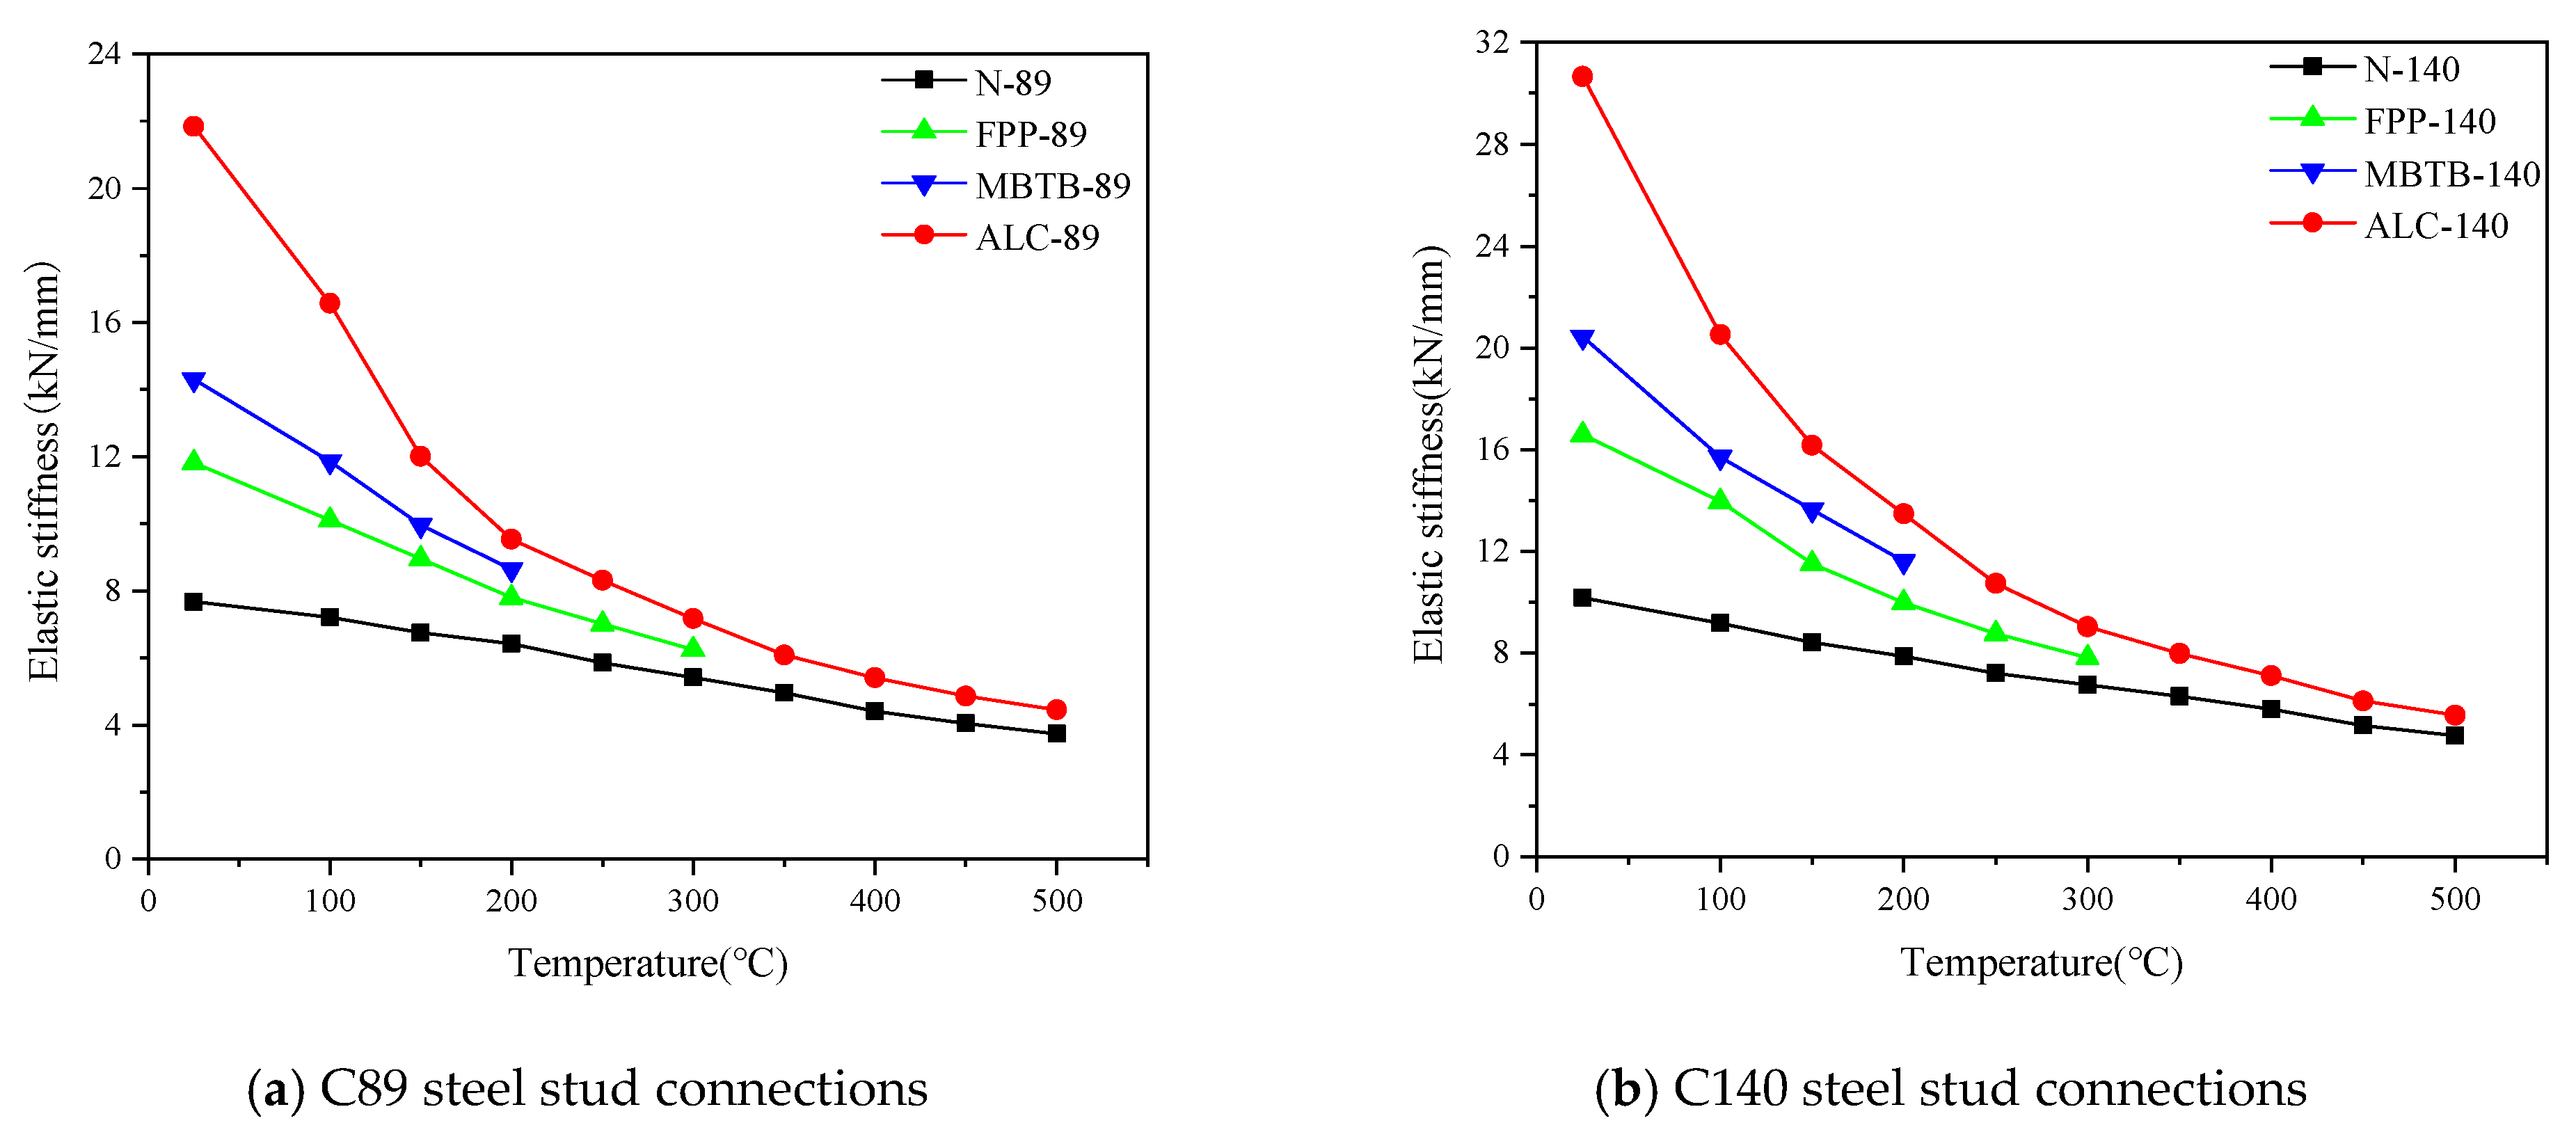
Figure 7 and Figure 8 present the variation trends of elastic stiffness and peak load with temperature for different connection types, respectively. As shown in Figure 7, the elastic stiffness of all connections decreases with increasing temperature. For connections with C89 steel studs, the elastic stiffness follows this descending order: ALC-89 connections > MBTB-89 connections > FPP-89 connections > N-89 connections. The elastic stiffness of connections with panels is consistently higher than that of connections without panels, indicating that panels significantly enhance the overall connection stiffness. Furthermore, the greater the inherent stiffness of the panel itself, the more pronounced this enhancing effect on connection elastic stiffness becomes.
Compared to ambient temperature conditions, the difference in elastic modulus among different panel connections markedly decreases starting from 200 °C, suggesting that beyond this temperature, all types of panels undergo gradual degradation of material properties, leading to progressively diminished constraining effects on the connections. Additionally, among the four connection types, ALC panel connections exhibit the most rapid degradation rate of elastic stiffness with increasing temperature. For connections utilizing C140 steel studs, the variation pattern of elastic modulus follows the same trend as observed in C89 stud connections.
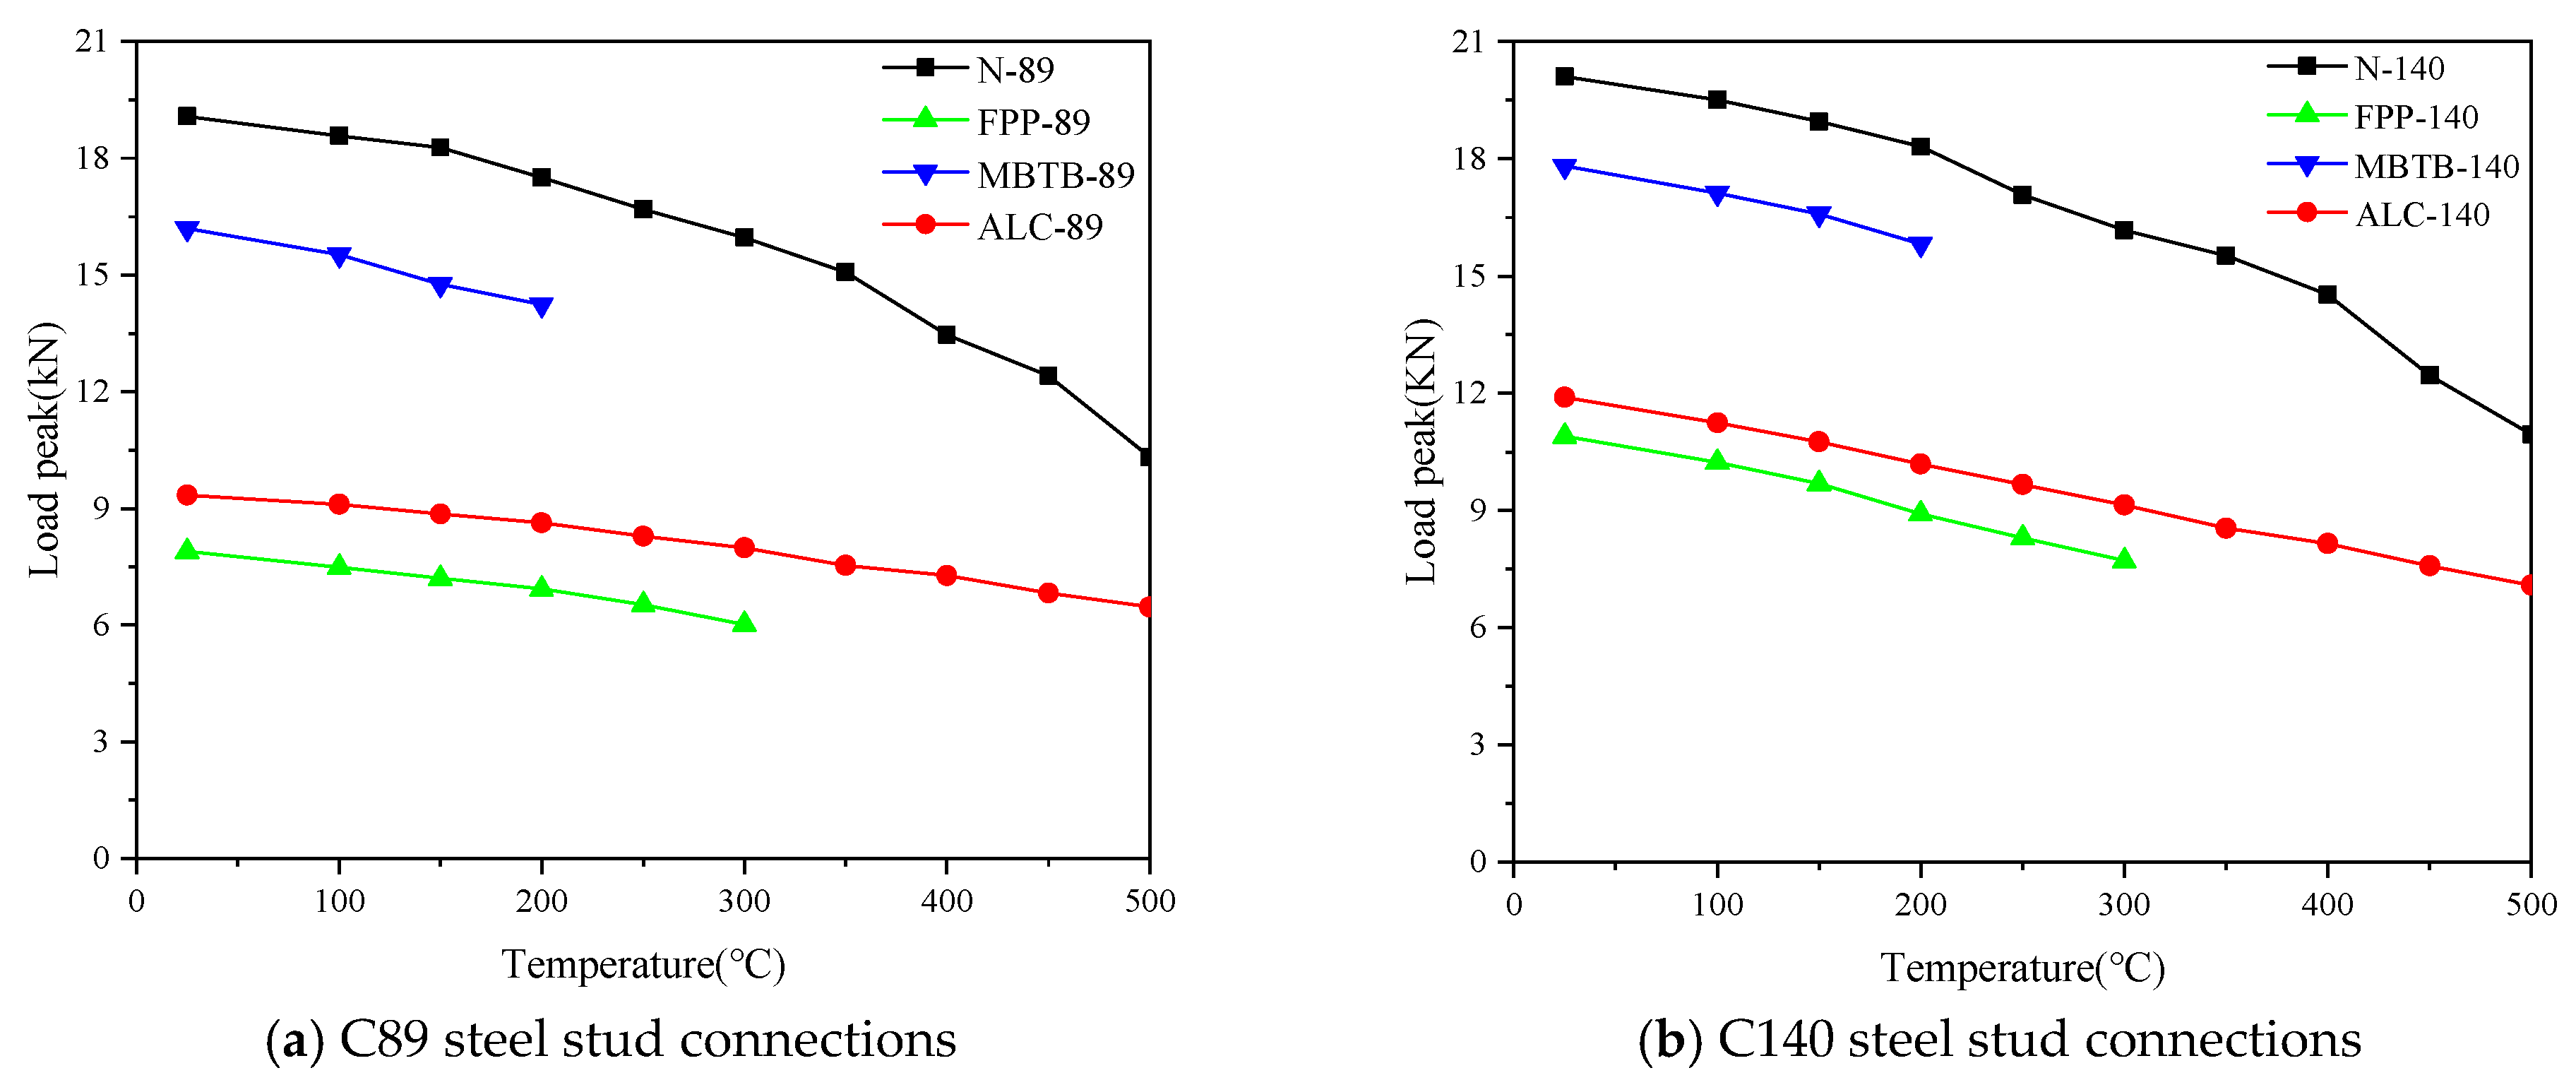
As shown in Figure 8, the peak load of all connections decreases with increasing temperature. For connections with C89 steel studs, the peak load follows this descending order: N-89 connections > MBTB-89 connections > ALC-89 connections > FPP-89 connections. Among these, N-89 connections exhibit the most rapid degradation rate of peak load with temperature. This is primarily attributed to the significant constraining effect provided by panels against out-of-plane deformation of the connections. Conversely, ALC-89 connections demonstrate the slowest degradation rate of peak load with temperature. This behavior results from the greater thickness of ALC panels compared to the other three panel materials, which enhances the overall connection stiffness. For connections utilizing C140 steel studs, the variation pattern of peak load with temperature follows the same trend as observed in C89 stud connections.

4. Bending Constitutive Model

4.1. Characteristic Parameter Calculation

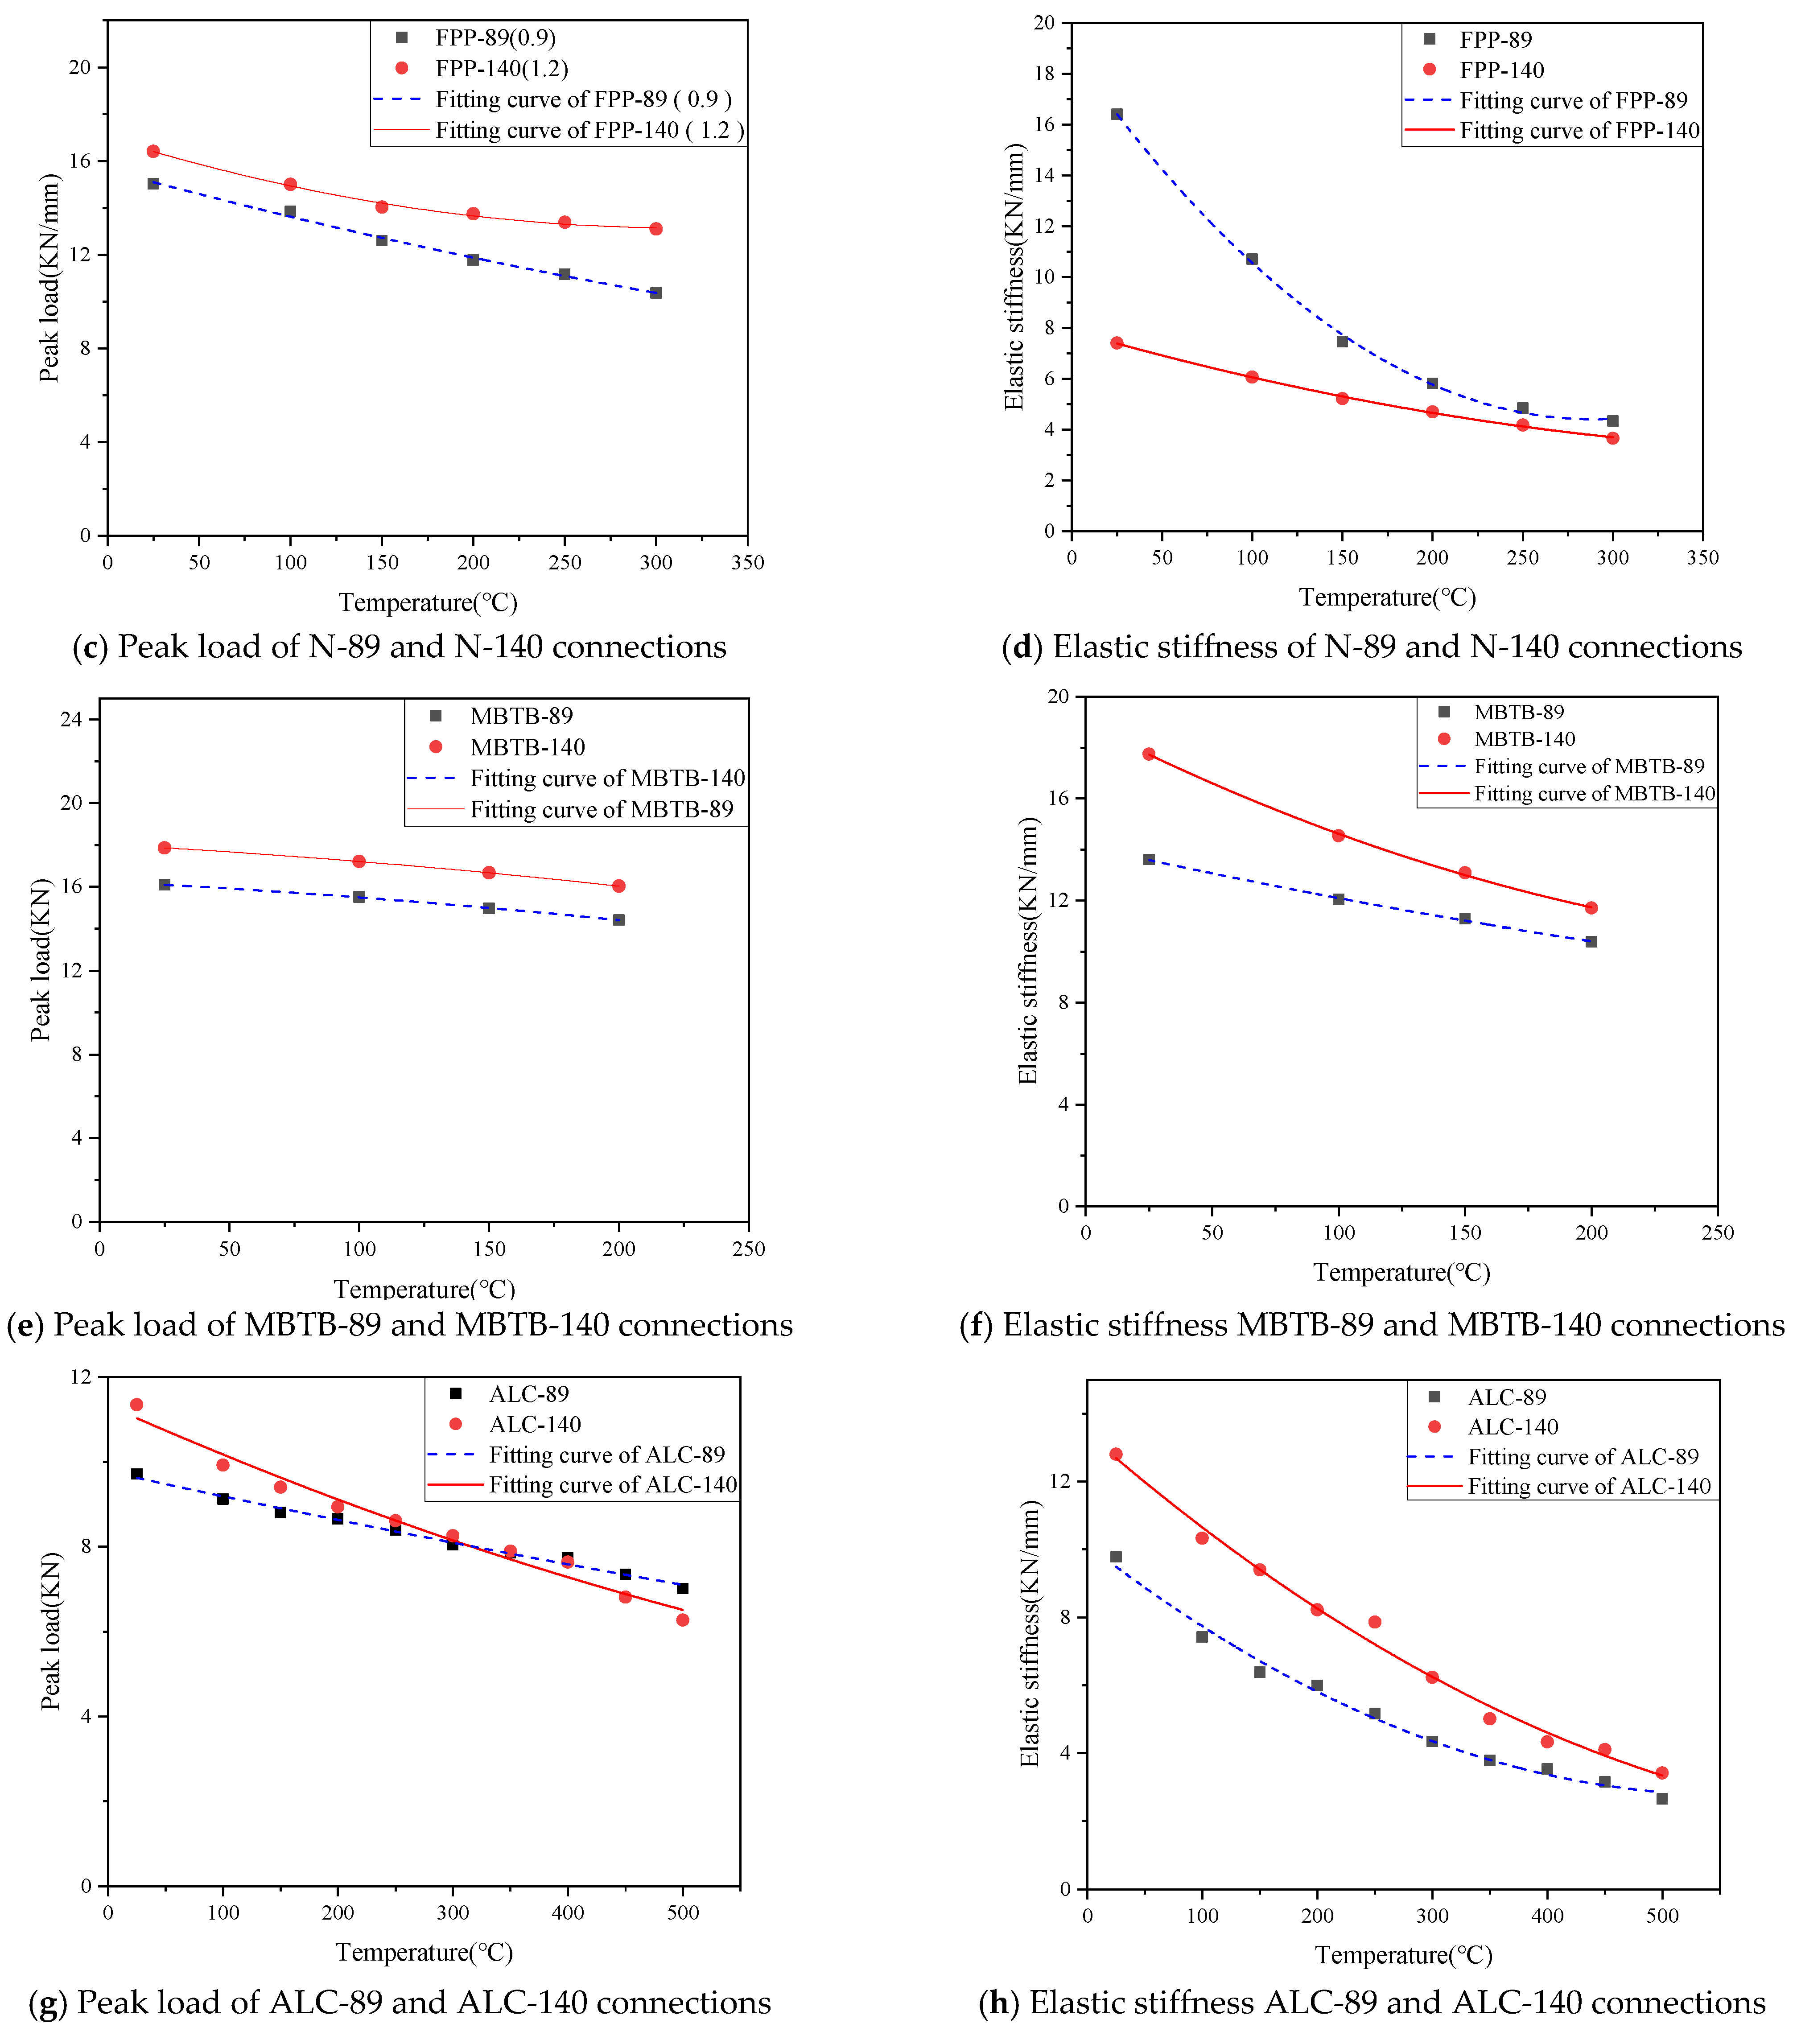
In load–displacement curves, both peak load and elastic stiffness are critical parameters that define the curve characteristics and serve as essential inputs for establishing bending constitutive models. This study employs unified linear Equations (1) and (2) to fit the peak load and elastic stiffness, respectively. The values of the coefficients in Equations (1) and (2) are presented in Table 2.
E T = A 1 T 1.1 + B 1 T + C 1
F m , T = A 2 T 1.1 + B 2 T + C 2
In the Equations, T (°C) represents the ambient temperature of the specimen in degrees Celsius; Fm,T (kN) denotes the peak load at temperature T; ET (kN/mm) indicates the elastic stiffness at temperature T; and A1, A2, B1, B2, C1, C2 are constants.
Figure 9 compares the experimental and fitted results for the peak load and elastic stiffness of different connections. It can be concluded that the predicted values of both characteristic parameters are consistent with the experimental results.

4.2. Establishment of the Bending Constitutive Model

As indicated in Section 3.2, panels significantly influence the out-of-plane mechanical performance of the connections. Given that the number of specimens, volume of data, curve profiles, and temperature effects complicate the study of out-of-plane deformation in sheathed panel connections, it is necessary to develop a simplified bending constitutive model to characterize the restraining effect of panels on the out-of-plane deformation of the connections. Here, the ALC panel connection is taken as an example for analysis.
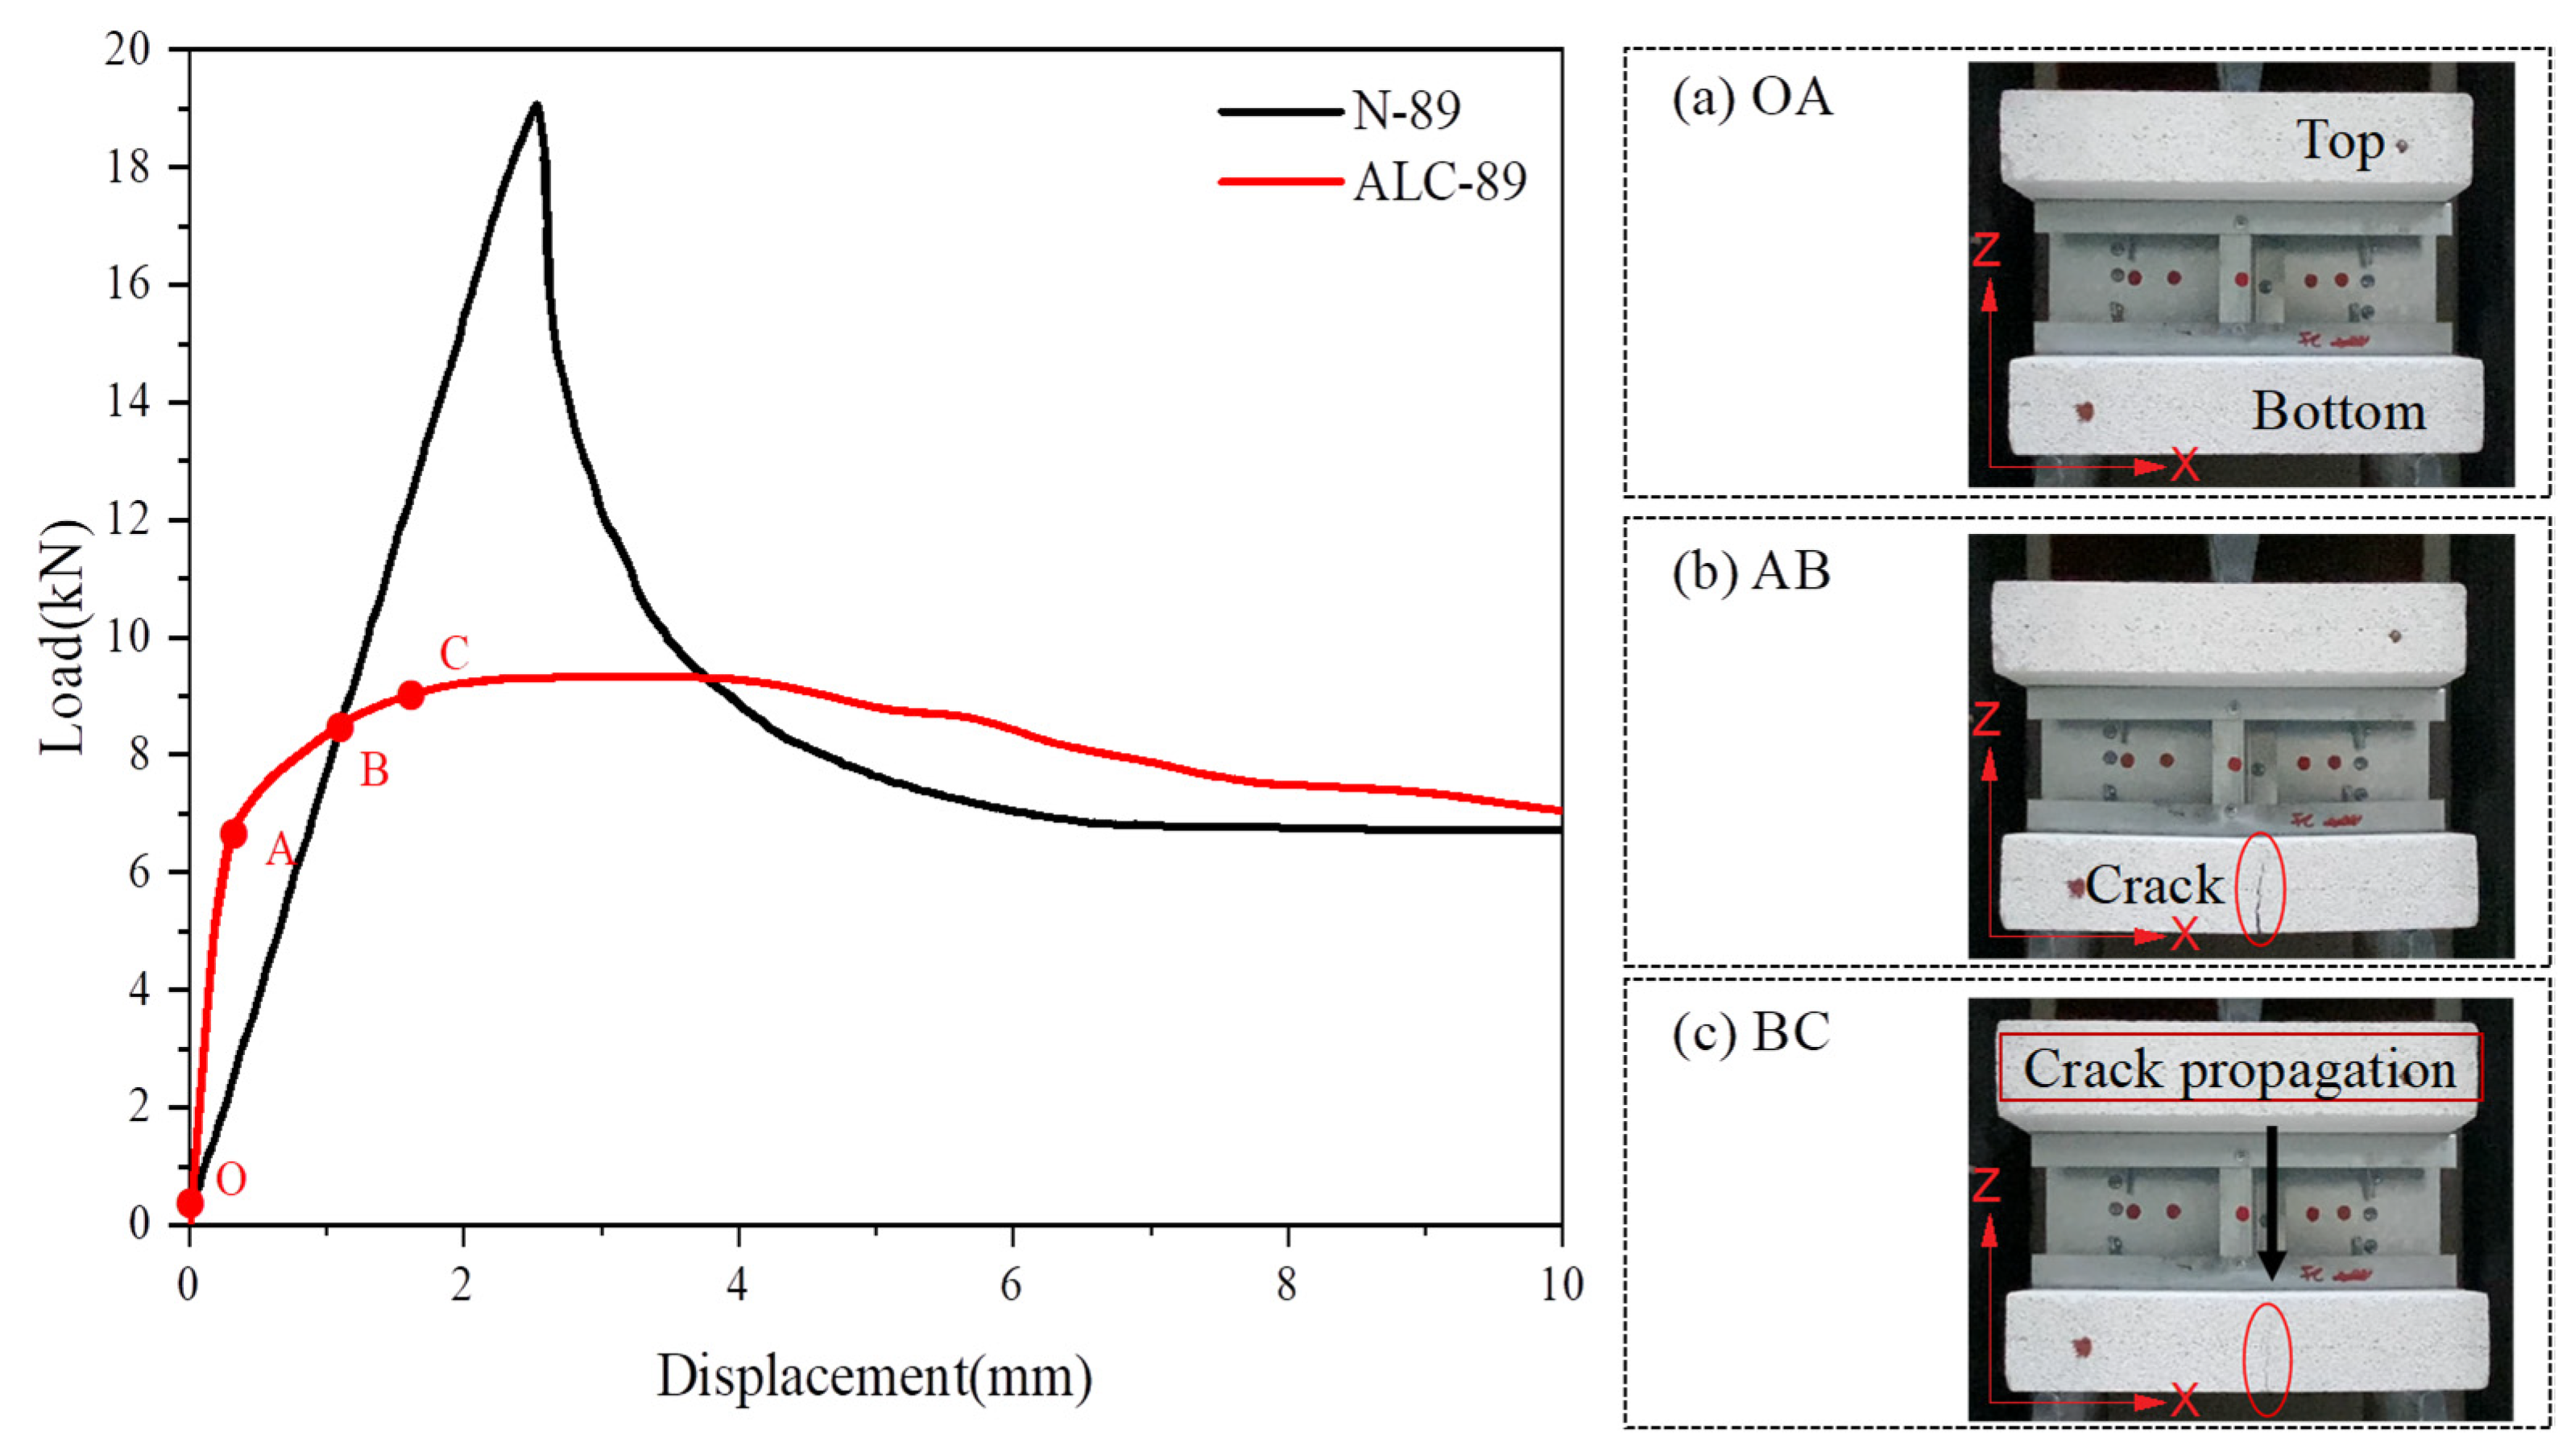
Taking the ALC-89-25 connection as an example, a comparative analysis of its load–displacement curve with that of the N-89-25 connection can be divided into the following four stages (Figure 10). When the load–displacement curve is in the OA segment, both ALC-89-25 and N-89-25 connections are in the elastic stage. Point A is defined as the inflection point in the displacement difference between the connections with panel sheathing and those without. Before Point A, the displacement difference increases as the deformation of the connections grows; after Point A, the displacement difference decreases with further deformation. At this point, both the panel and steel stud in the ALC-89-25 connection remain elastic with minimal out-of-plane deformation (Z-axis direction in Figure 10). No cracking occurs in the bottom flange panel, and the failure mode of the specimen is shown in Figure 10a. During this stage, for identical displacements, the applied load value of the ALC-89-25 connection consistently exceeds that of N-89-25, and the load difference continuously increases (OA segment in Figure 10). This is attributed to the enhancing effect of the sheathing panel on the overall connection stiffness.
When the load–displacement curve progresses to the AB segment, the ALC-89-25 connection has entered the elastoplastic stage, while the N-89-25 connection remains elastic. At this stage, the steel stud in the ALC-89-25 connection continues to behave elastically, but cracks develop in the bottom ALC panel as shown in Figure 10b. For identical displacements during this phase, the load value of ALC-89-25 remains higher than that of N-89-25, though the load difference gradually diminishes (AB segment in Figure 11). This phenomenon occurs because cracking in the bottom ALC panel compromises the connection integrity and reduces its enhancing effect on the overall flexural stiffness.
During the combined OA + AB segments, under identical out-of-plane deformation, the load carried by the ALC panel connection consistently exceeds that of the N-89-25 connection. This behavior results from two main factors: (1) The panel enhances the overall flexural stiffness of the connection. When subjected to loading causing out-of-plane deformation, the steel stud and panel form a composite section through self-drilling screws, significantly increasing the moment of inertia (I) of the section and consequently enhancing the flexural stiffness (EI). (2) The sheathing panel optimizes the load transfer path. Through contact with the steel stud at both top and bottom flange surfaces, it distributes the load, avoids stress concentration, and enables more uniform stress distribution in the steel stud.
When the load–displacement curve reaches the BC segment, cracks in the bottom panel propagate rapidly, forming through-thickness cracks that prevent the bottom sheathing panel from sharing load with the steel stud, resulting in loss of restraining effect on out-of-plane deformation. The experimental observation at point C is shown in Figure 10c. At this stage, significant buckling deformation occurs in the steel stud web. The measured displacement data represents the combined effect of connection out-of-plane deformation and web buckling deformation, unable to accurately reflect the restraining effect of sheathing panels on out-of-plane deformation. Therefore, the out-of-plane bending constitutive model of panels on steel studs can be simplified as follows: when the load–displacement curve exceeds point B, the load applied to the connection is entirely carried by the steel stud, neglecting the constraining effect of panels. Thus, when establishing the out-of-plane bending constitutive model of panels on steel studs, only the OA + AB segments need be considered.
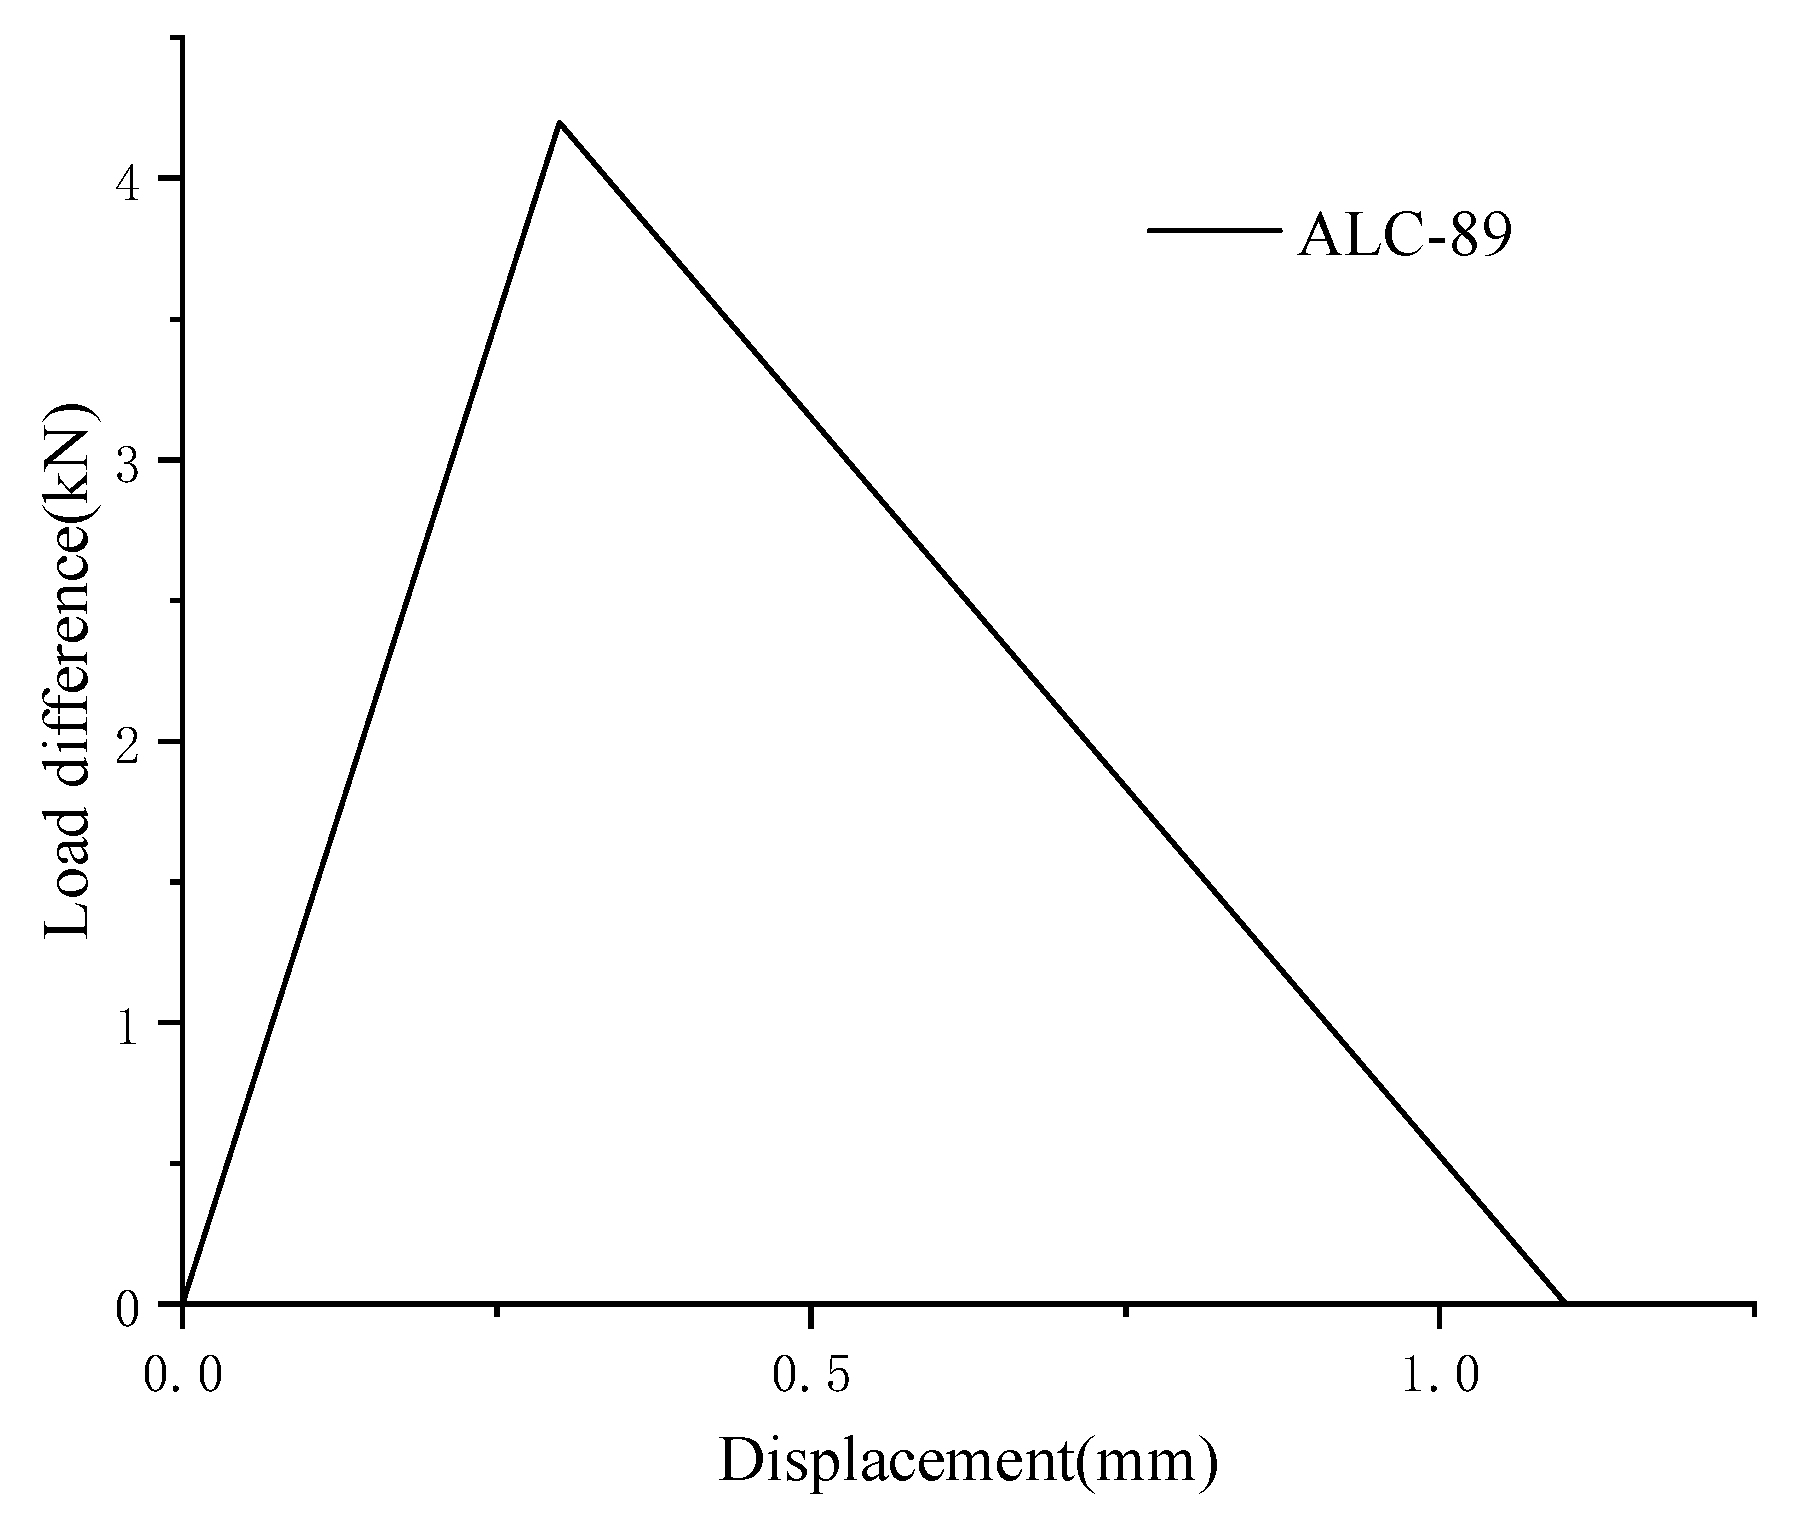
Taking the ALC panel connection as an example, the load difference-displacement curve is plotted (Figure 11). Figure 11 illustrates the variation in load difference between connections with and without panels at identical displacements. The physical significance of this difference corresponds to the load value carried by the panel within the connection. Consequently, the load difference-displacement curve represents the load–displacement behavior of the panel itself, characterizing the evolution of its constraining effect on the steel stud with increasing displacement.
In Figure 11, the OA segment shows a consistently positive and gradually increasing load difference, indicating a progressive increase in the load borne by the panel. In contrast, the AB segment maintains a positive but gradually decreasing load difference, reflecting a reduction in the load carried by the panel. Point A represents the transition point of the curve. Combined with the failure mode of the connection shown in Figure 10a, it can be concluded that the panel remains in the elastic stage during the OA segment, while it enters a brittle failure phase in the AB segment. This indicates that the constraining effect of the panel on the steel stud initially increases and then decreases with displacement, with the transition point corresponding to the initiation of cracking in the panel.
Thus, the load difference-displacement curve effectively captures the evolution of the restraining effect provided by the panel against out-of-plane deformation of the steel stud. Therefore, fitting the load difference-displacement curve serves as a bending constitutive model for quantifying the out-of-plane restraining effect of sheathing panels on steel studs.
The constraining effect of ALC panels on steel studs can be distinctly divided into two stages. Accordingly, a two-stage representation is adopted for model establishment, as shown in Equation (3). Here, T (°C) represents the temperature to which the specimen is exposed; F (kN) denotes the applied load; d (mm) indicates the out-of-plane deformation at the midpoint of the specimen’s centerline along the vertical direction; deT refers to the peak deformation of the connection; and A, B, C, and D are coefficients of the bending constitutive model.
Simultaneously, Equation (3) must satisfy the corresponding boundary conditions, as specified in Equations (4) and (5). Here, EACL,T and EN,T represent the elastic stiffness of the ALC panel connection and the connection without sheathing panels at temperature T, respectively, with values obtained from Equation (1). Therefore, coefficients A and B can be solved as shown in Equations (6) and (7), respectively. The coefficients of the bending constitutive model for different types of connections are listed in Table 3.
F = A d 0 d d e , T B d 2 + C d + D d e , T d
A · d e , T = E ALC , T · d e , T E N , T · d e , T
A · d e , T = B · d e , T 2 + C · d e , T + D
A = E ALC , T · d e , T E N , T · d e , T / d e , T
B = A · d e , T C · d e , T D d e , T 2
Coefficient A represents the ratio of the load difference between the sheathed panel connectors and the unsheathed panel to the displacement, and its physical meaning reflects how the load carried by the panel changes with the deformation of the connectors. Coefficients B, C, and D are used to express the load–displacement relationship of the connectors in the form of a quadratic function. Specifically, B represents the acceleration of load decay, C corresponds to the rate of decay, and D denotes the peak load. As shown in Table 3, coefficient A decreases with increasing temperature, indicating that the load difference diminishes as temperature rises. This means the studs bear more load while the sheathing panels carry less, due to the deterioration of the panel properties at high temperatures, which reduces their load-bearing capacity.
Based on the coefficients C and D corresponding to different temperature values, Equations (8)–(11) were obtained through fitting procedures. Here, C89 indicates that the connection employs C89-type steel studs (Figure 3b).
C 89 = 0.03 T / 100 3 1.37 T / 100 1.5 + 11.16 T / 100 0.5 12.39
C 140 = 0.03 ( T / 100 ) 4 + 0.06 ( T / 100 ) 3.5 0.12 ( T / 100 ) 2.5 + 3.47 ( T / 100 ) 8.42
D 89 = 0.1 ( T / 100 ) 4 1.34 ( T / 100 ) 1.1 + 0.1566 / ( T / 100 ) 1.1 + 4.48
D 140 = 0.0158 ( T / 100 ) 4 0.0783 ( T / 100 ) 3 1.02 ( T / 100 ) + 6.03
The bending constitutive model for FPP connections, along with the corresponding coefficient values, is given by Equations (12)–(16). Similarly, the bending constitutive model for MBTB connections and its associated coefficient values are presented in Equations (17)–(23).
F = A d 0 d d e , T B d 3.5 + C d e , T d
A = E F P P , T d e , T E N , T d e , T
B = A · d e , T C / d e , T 3.5
C 89 = 0.0016 T 1.65 0.0027 T 1.57 + 3.07
C 140 = 0.0071 T 1.7 0.0081 T 1.68 + 3.59
F = A d 0 d d e , T B d 2 + C d + D d e , T d
A = E MBTB , T · d e , T E N , T · d e , T / d e , T
B = A · d e , T C · d e , T D / d 2 e , T
C 89 = 0.0147 T + 4.1290
C 140 = 0.0076 T 1.1 39.03 / T 0.5 + 10.1712
D 89 = 0.0238 T + 3.6895
D 140 = 0.0802 T 1.1 0.1566 T + 5.8739
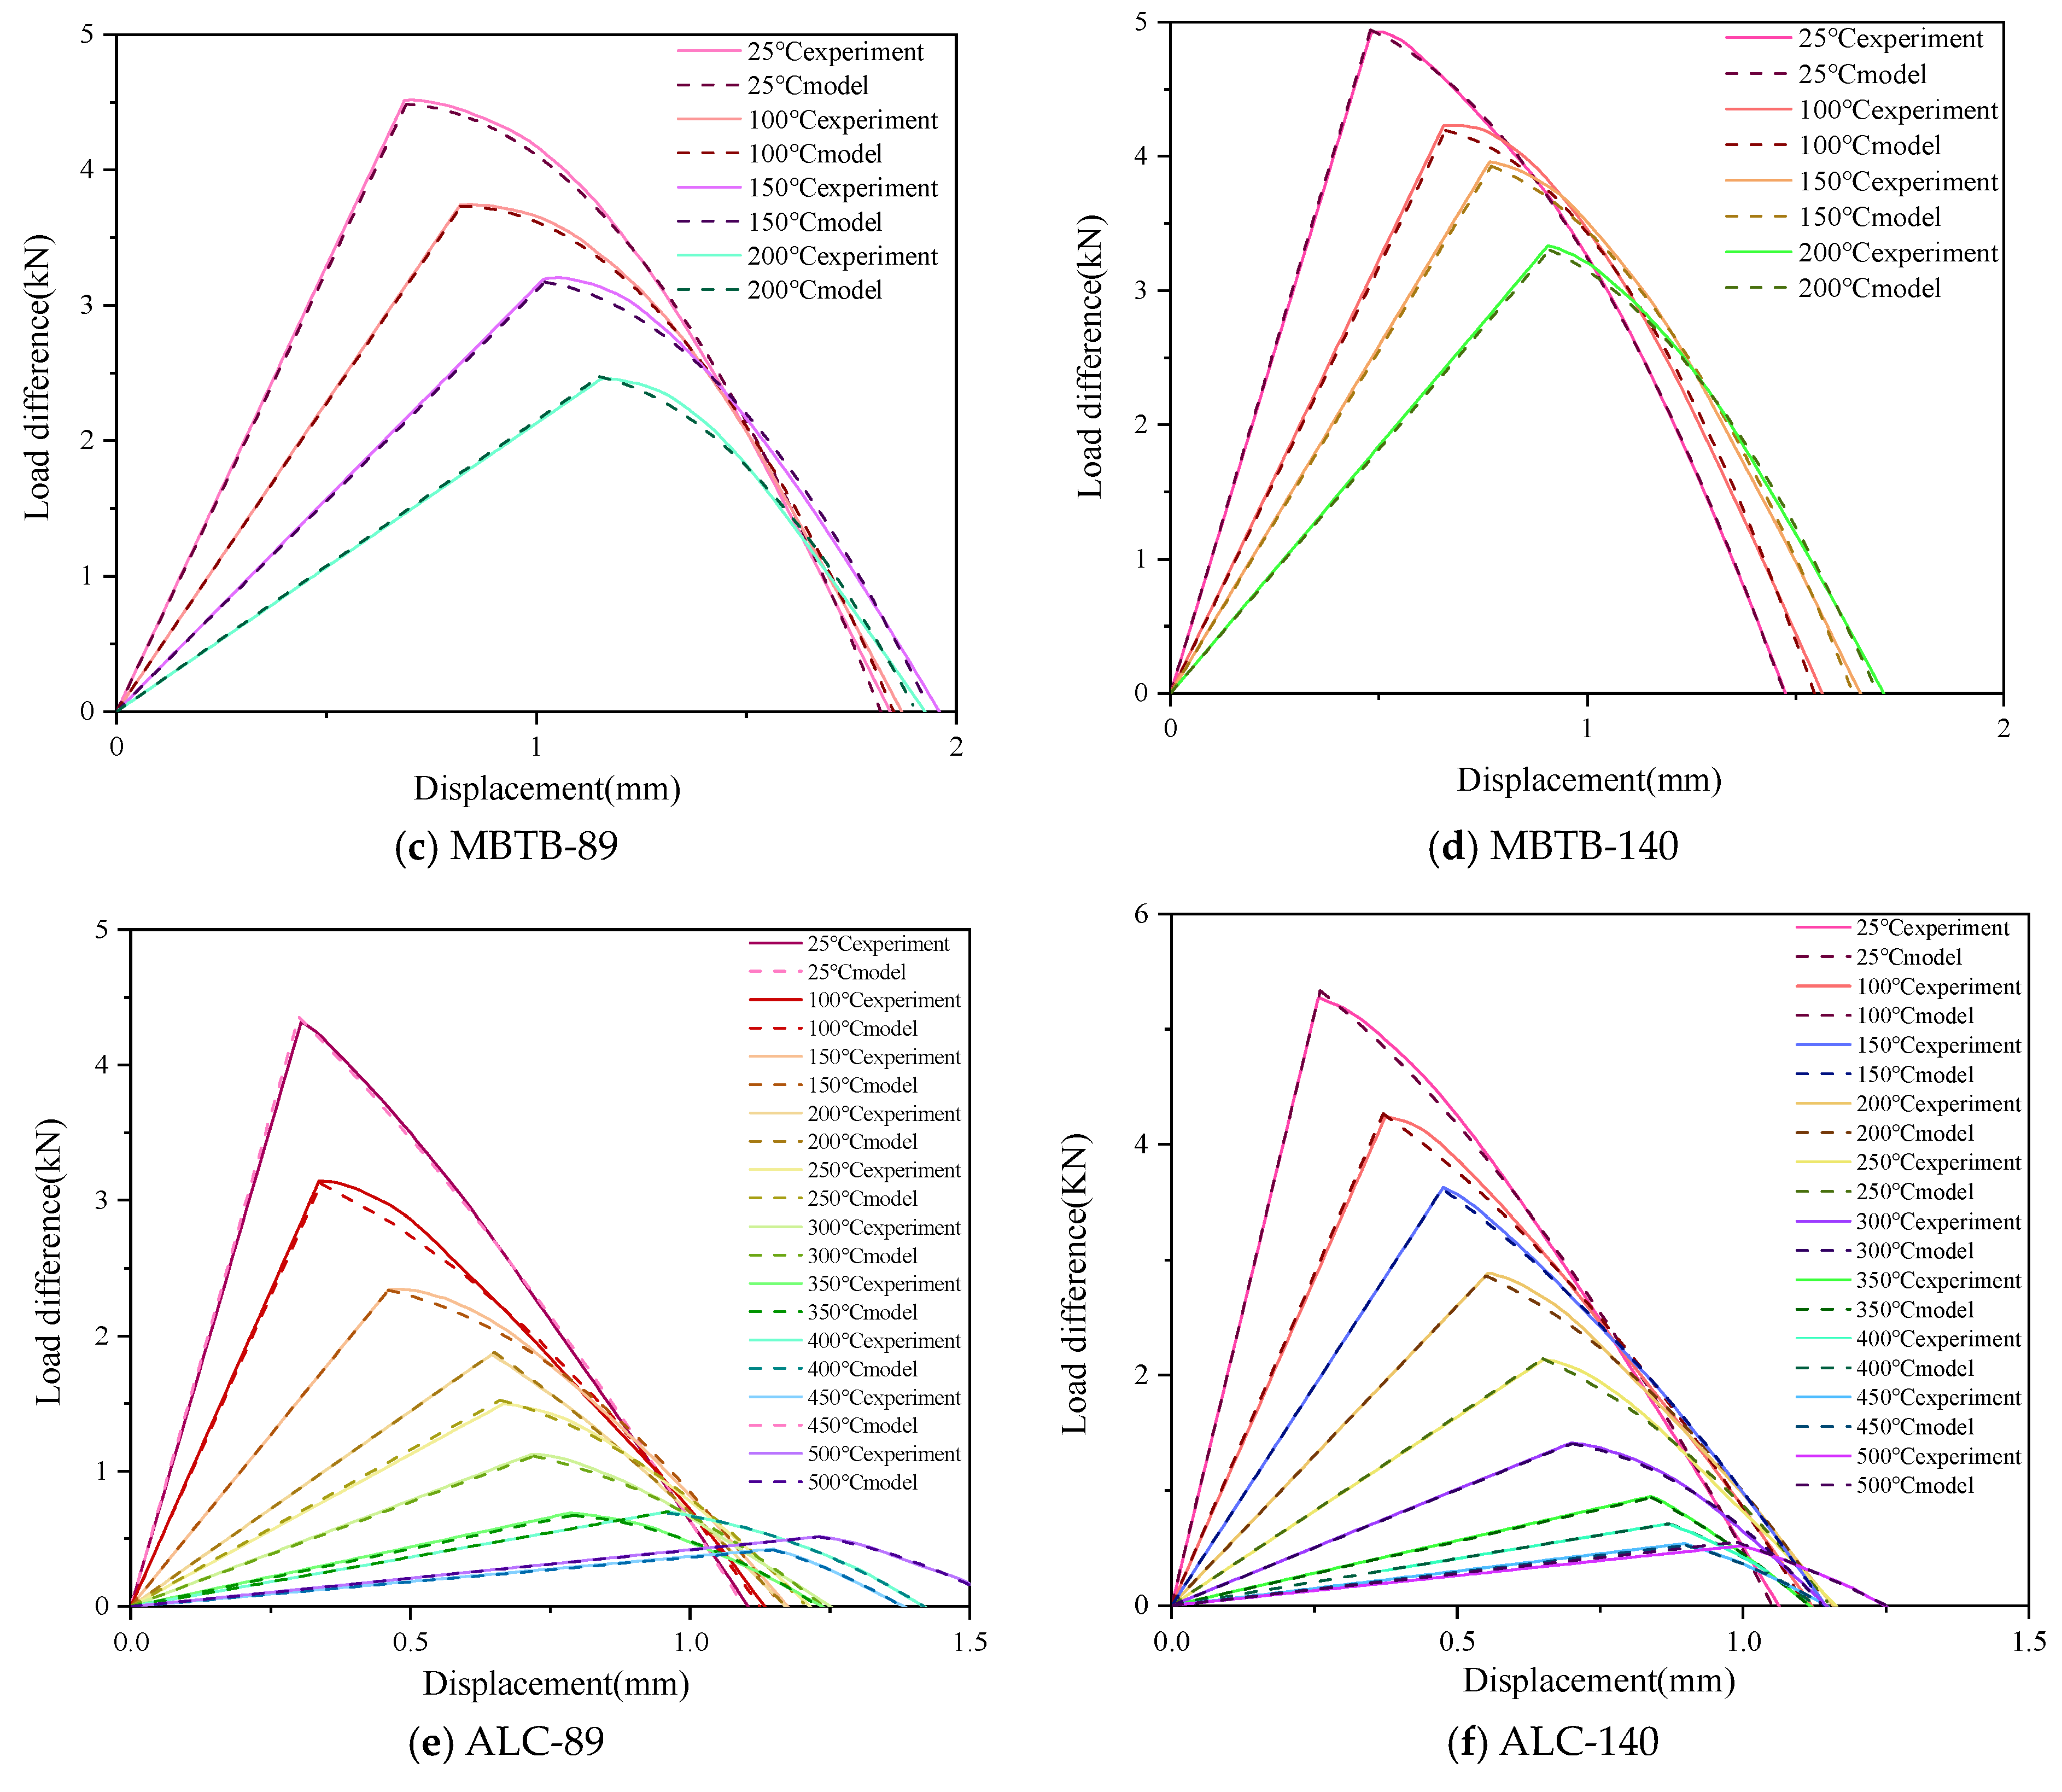
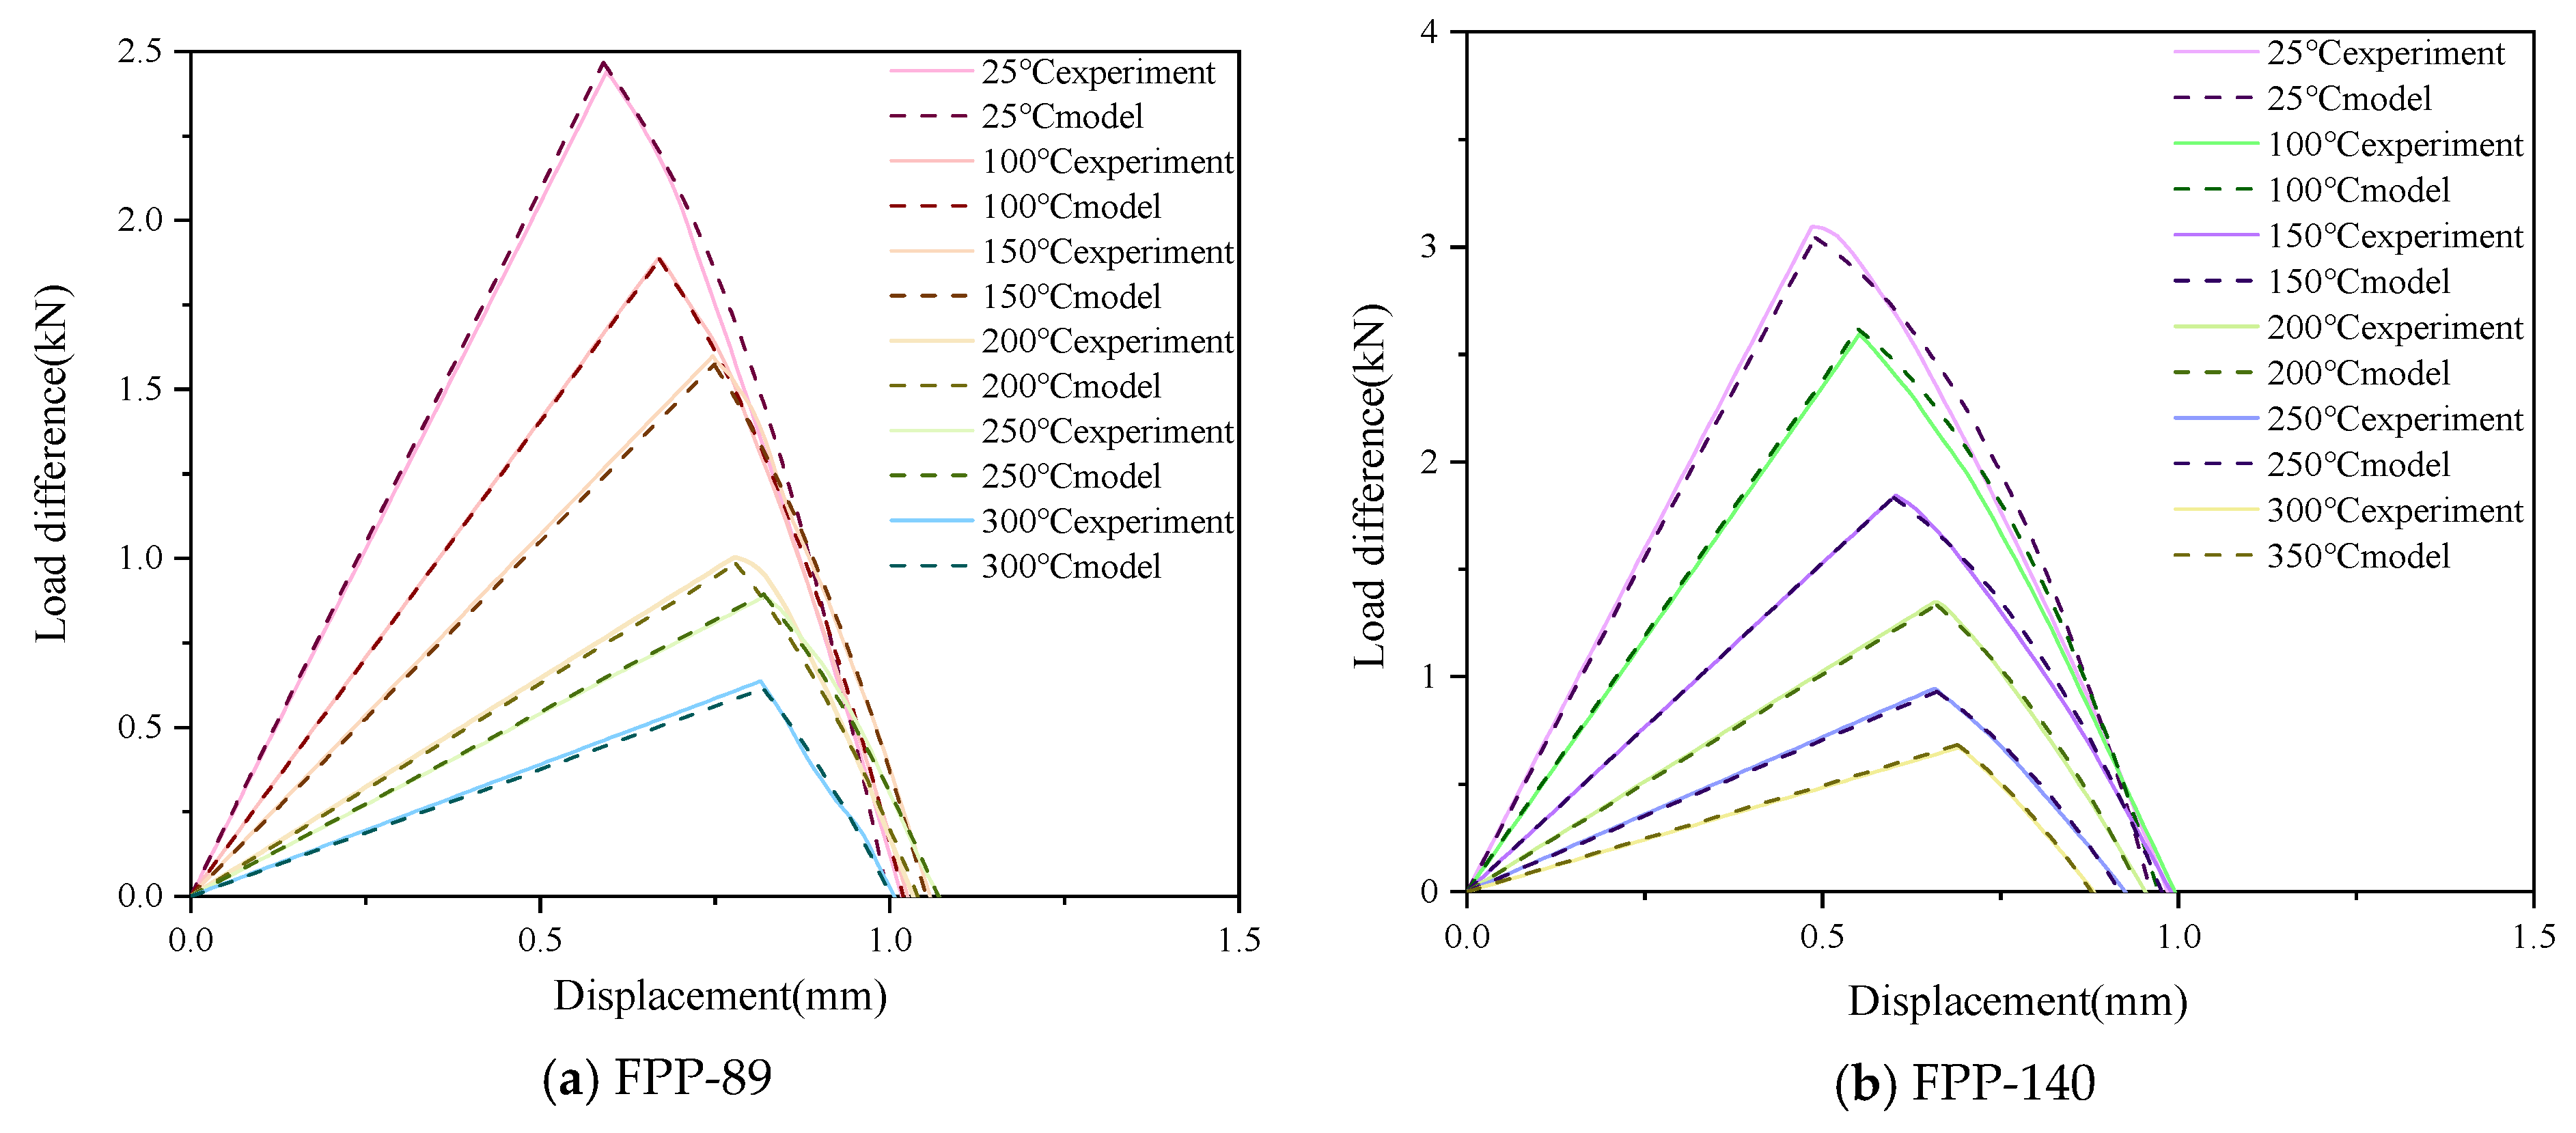
A comparison between the experimental data of FPP, MBTB, and ALC connections and the computational results obtained from the proposed bending constitutive model is presented in Figure 12. As can be observed, the curves of the computational results from the proposed bending constitutive model show excellent agreement with the experimental data, demonstrating that the proposed bending constitutive model can accurately characterize the out-of-plane constraining effect of panels on steel studs.
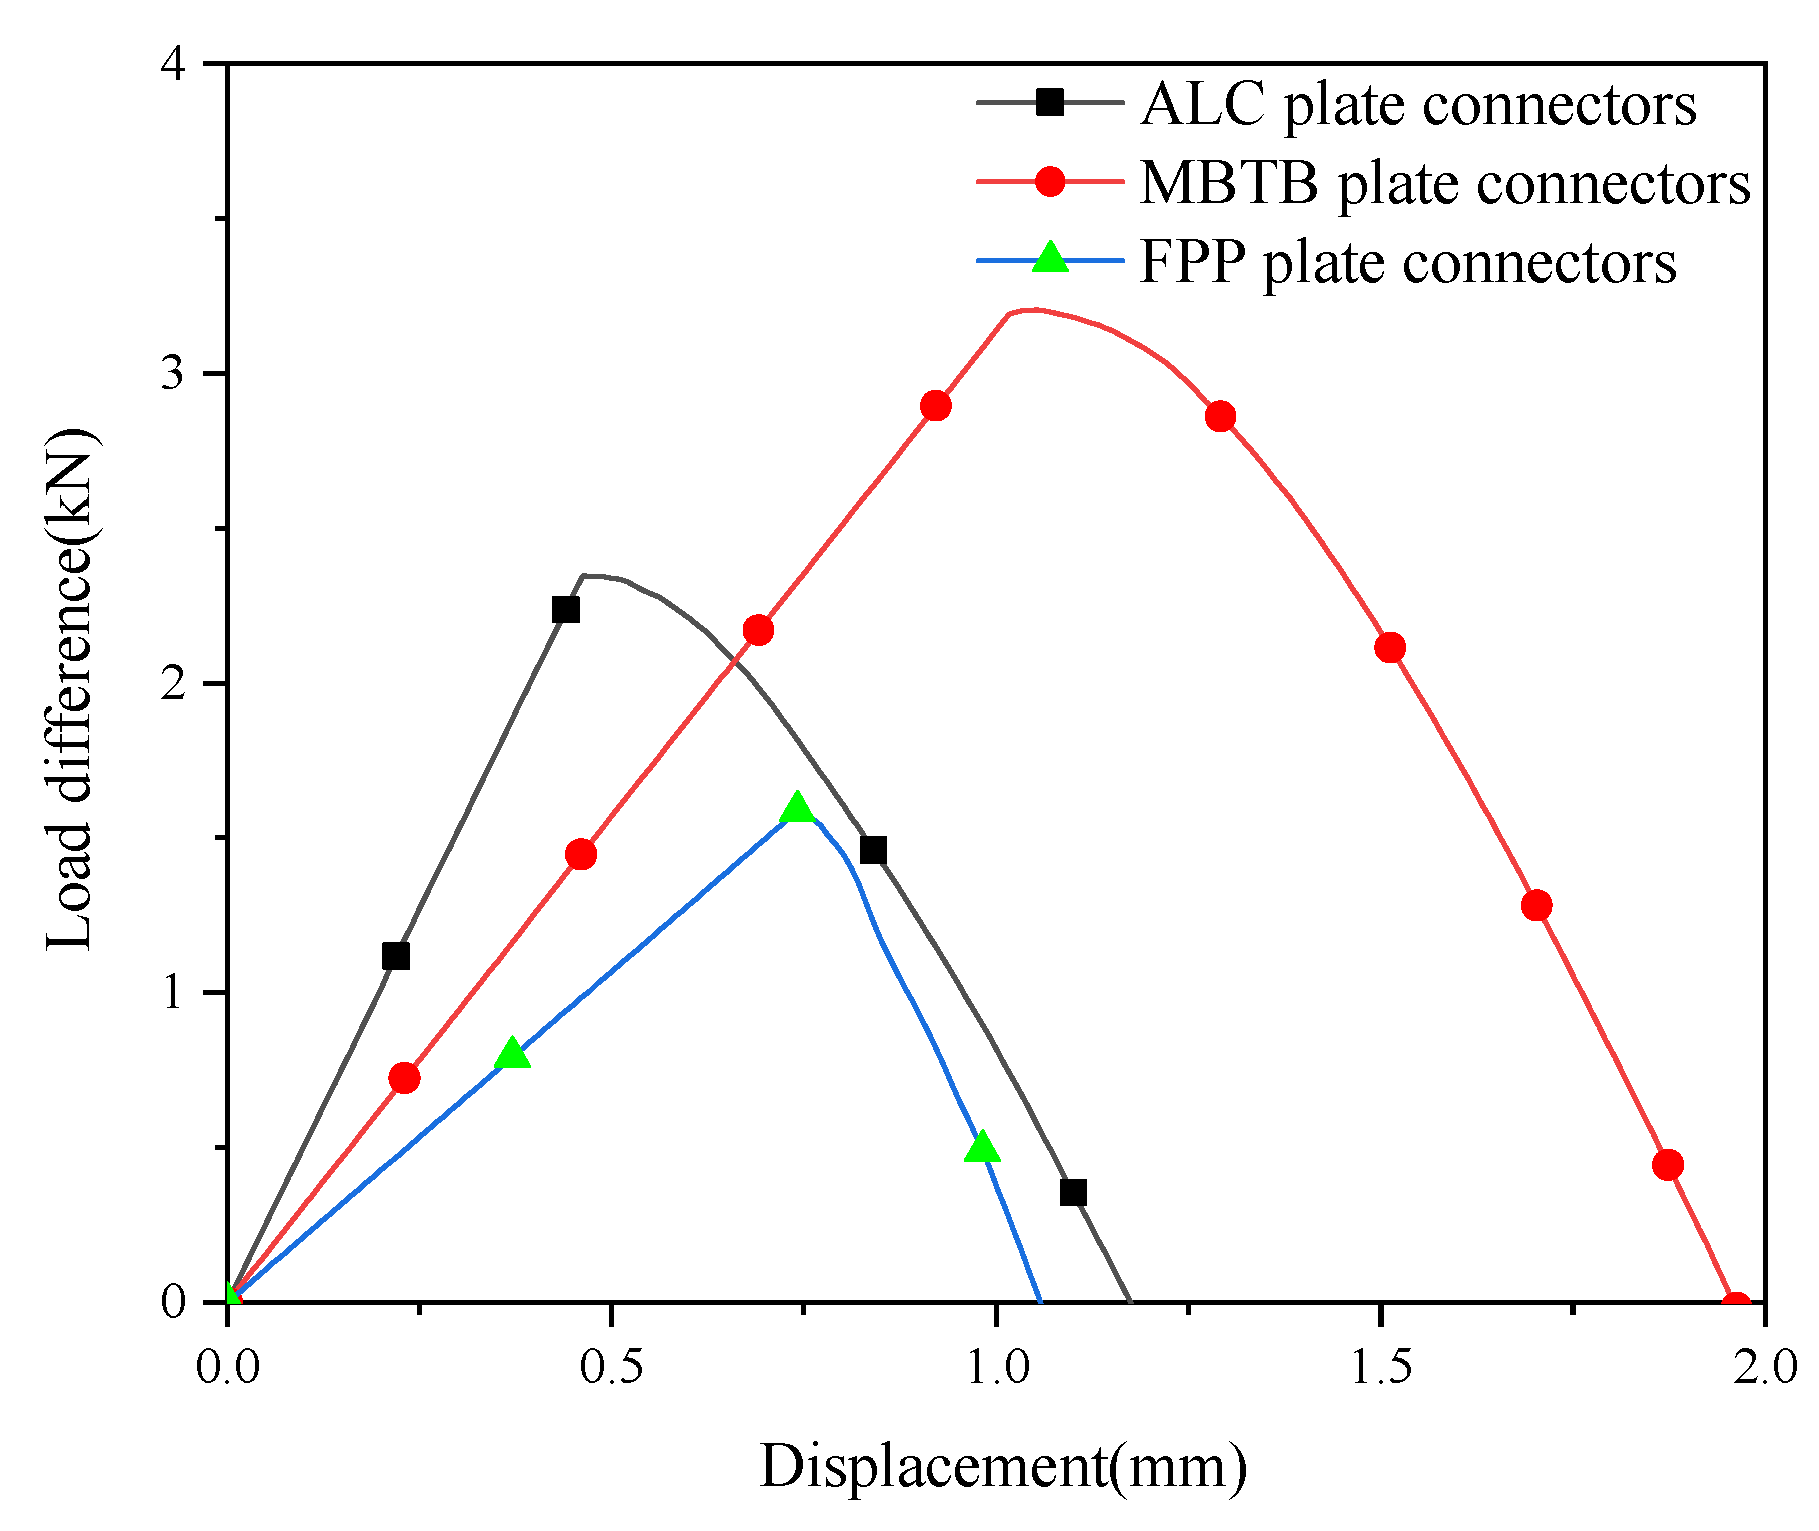
As can be observed from Figure 13, before reaching the elastic stiffness, the load differences for all three types of panel connections remain positive and increase linearly. Among them, the ALC panel, due to its highest strength, shows the fastest increase in load difference with displacement; the MBTB panel ranks second; and the FPP panel, having the lowest strength, exhibits the slowest growth. This indicates that in the elastic stage, the ALC panel can more effectively share the load at the connection, thereby providing stronger out-of-plane restraint.
The load difference reaches its peak when the elastic stiffness is attained. Subsequently, the panels enter the elastoplastic stage and gradually yield, resulting in a decrease in load-bearing capacity and a corresponding reduction in load difference. Once noticeable cracks appear in the sheathing panel at the lower flange, the tensile load transfer path is hindered, and the panel can no longer effectively share the load, leading to a loss of restraint against out-of-plane deformation of the connection. From the perspective of material characteristics, a further comparison reveals:
ALC panels exhibit significant brittleness, transitioning earlier from the elastic to the elastoplastic stage and developing cracks at smaller displacements. Consequently, both their peak load difference and the displacement at which the load difference returns to zero are lower than those of the medium-density particleboard connections.
FPP panels, having the lowest strength, show the smallest peak load difference and the smallest displacement at zero load difference among the three.
MBTB panels demonstrate intermediate strength and deformation capacity, presenting a relatively balanced mechanical response.
These differences can be attributed to the inherent material properties of each panel type: ALC panels are characterized by high brittleness and high strength; FPP panels exhibit low strength and limited ductility; while MBTB panels possess moderate stiffness and toughness. These properties directly influence the evolution of stiffness, the transition from brittle to ductile behavior, and the rate of performance degradation with increasing temperature during the heating process.

5. Numerical Simulation

5.1. Model Establishment

(1) 
Model simplification and meshing
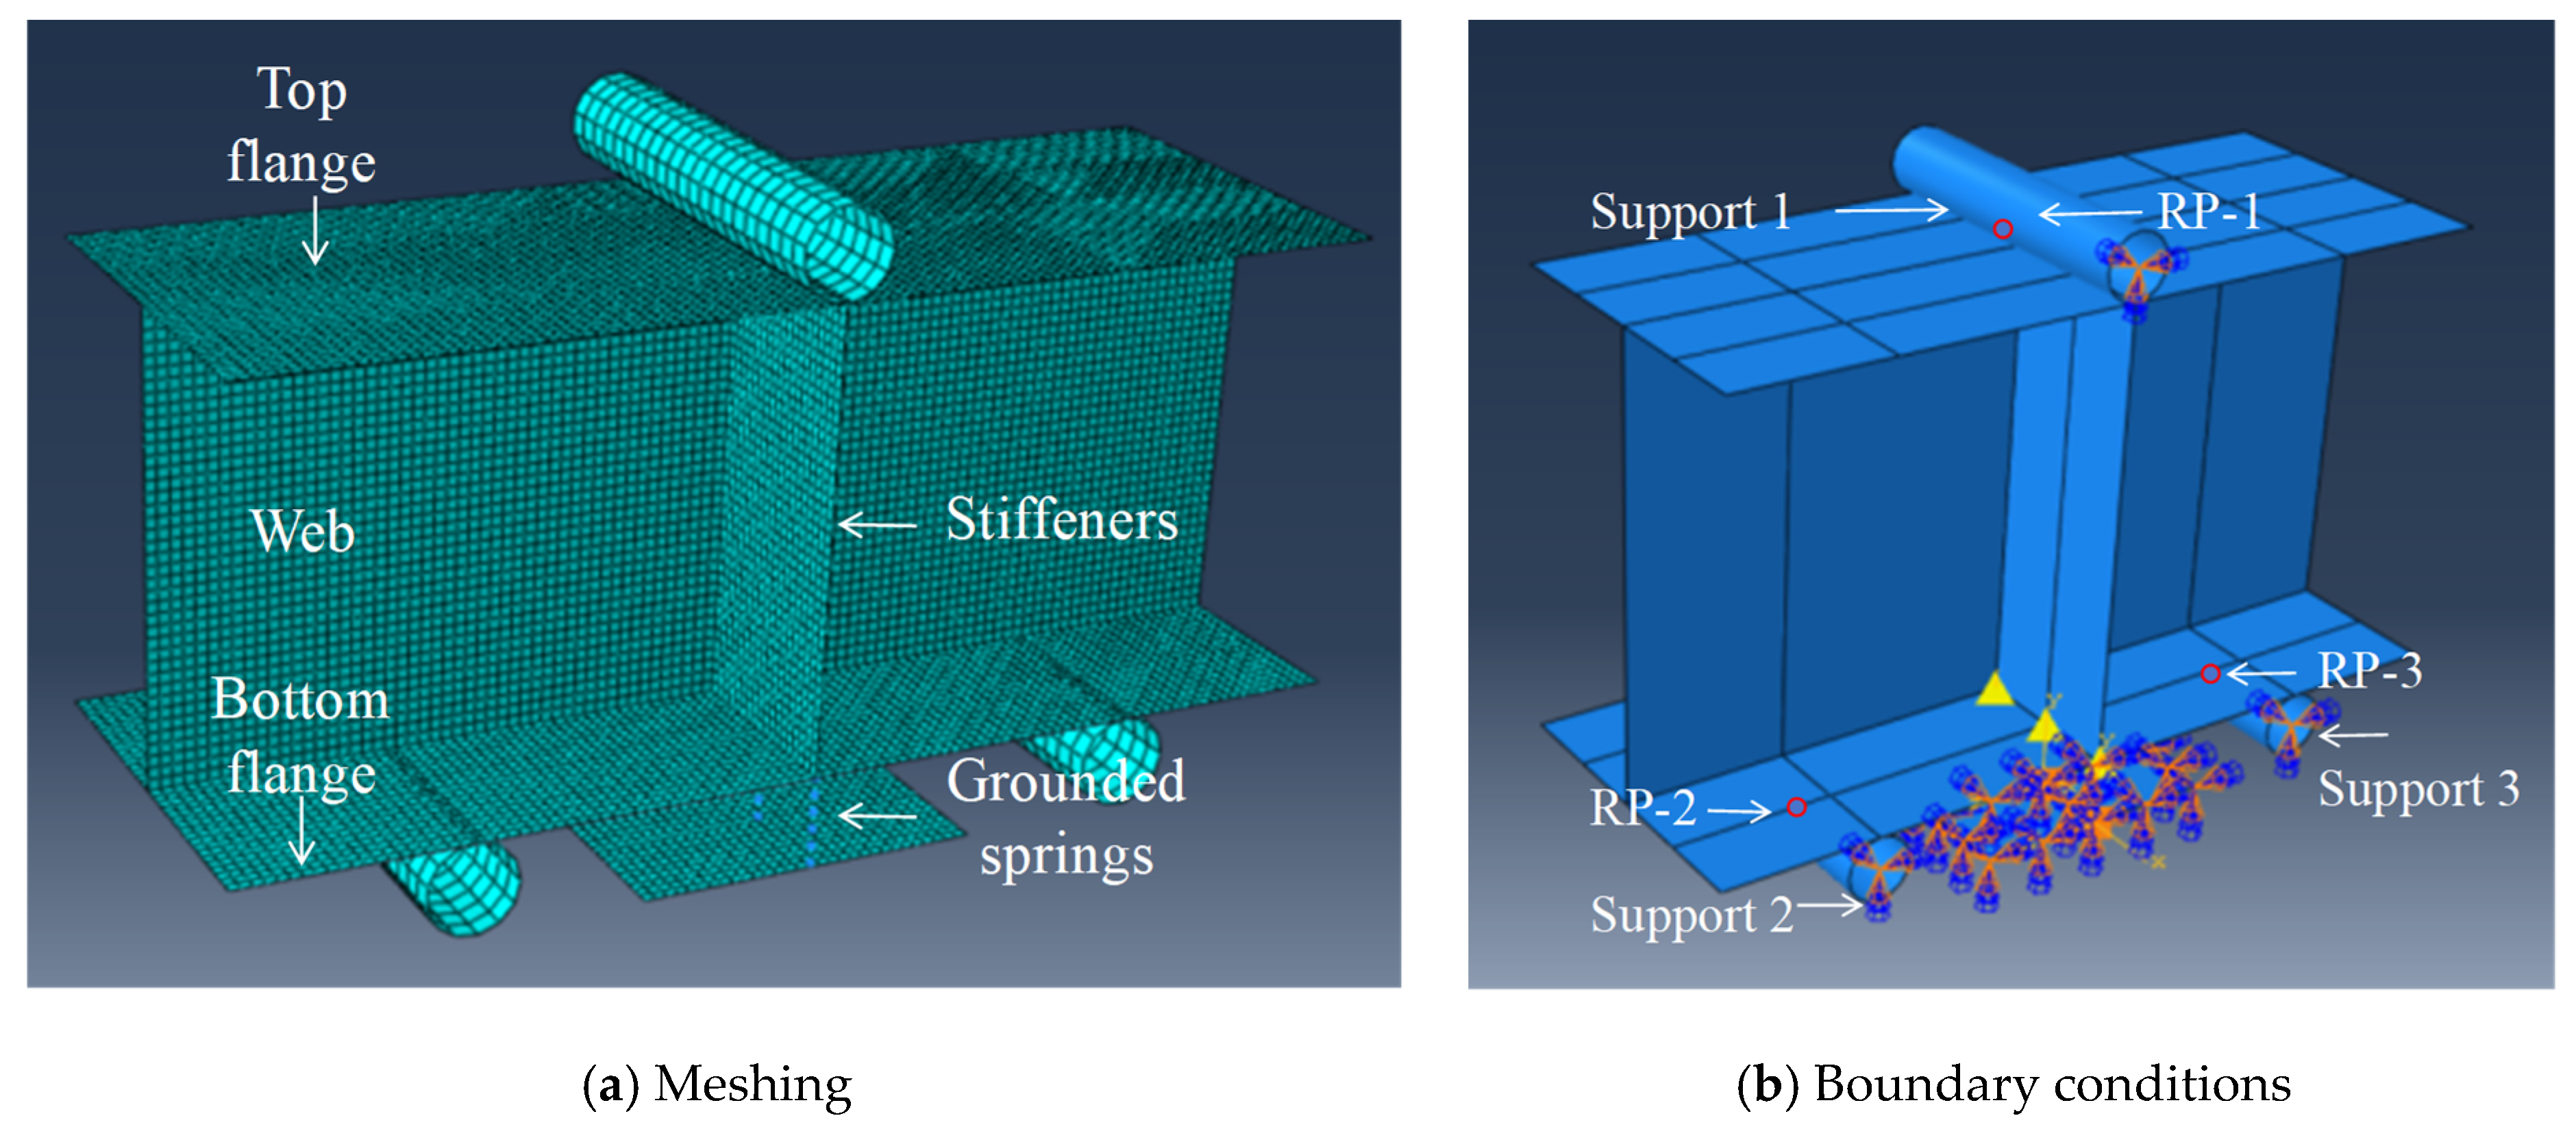
The numerical simulation model was simplified as follows: The back-to-back C-shaped steel studs and stiffeners were integrated as a single component, neglecting the 12 mm edge stiffeners of stud flanges. The top flange lining panel was omitted due to its negligible influence on the out-of-plane deformation of the connection. The bottom flange lining wall panel and self-drilling screw connections were simplified as grounded springs, with spring parameters assigned according to the bending constitutive model The simplified model is shown in Figure 14a.
In the model, the steel studs were modeled using S4R elements with a mesh size of 1 mm × 1 mm. According to the mesh sensitivity analysis documented in the literature [35], for structural components with larger geometrical dimensions such as wall panels, a coarser mesh (e.g., 5 cm × 5 cm as adopted in the cited reference) may be used to maintain computational efficiency. In the present study, however, the component dimensions are relatively small, and computational efficiency is not a primary constraint. Therefore, an element size approximately equal to the material thickness was selected (the tests employed two thicknesses: 0.9 mm and 1.2 mm). The model supports were divided into several simpler regions through appropriate partitioning, and a structured meshing technique was applied to generate the mesh. The resulting mesh configuration is shown in Figure 14a.
(2) 
Load Application and Boundary Conditions
To simulate the boundary conditions of the test specimen, three supports were applied to both the top and bottom flanges of the steel stud in the model, representing the load application device and bottom support points, as shown in Figure 14b. A reference point (RP-1) was defined at the center of the upper load application device. Coupling constraints were applied between RP-1 and the support surface, with all degrees of freedom constrained except for displacement in the Z-direction. Two additional reference points (RP-2 and RP-3) were established at the centers of the lower supports, respectively, and coupled to their corresponding support surfaces. Both RP-2 and RP-3 were fully fixed.
To facilitate the implementation of grounded springs, a plane was created near the center of the bottom flange and assigned fully fixed constraints. The translational type of the grounded springs was set to Cartesian, with rotational degrees of freedom disabled. The behavior type was defined as elastic and nonlinear, with relevant data from the bending constitutive model incorporated. The boundary conditions of the model are illustrated in Figure 14b.
The model employed a displacement-controlled loading method. Displacement was applied along the longitudinal axis of the connection to simulate the three-point bending test. Additionally, surface-to-surface contact was defined between the load application device/bottom support points and the upper/lower flange surfaces of the steel stud. The contact normal behavior was modeled as “hard contact,” while the tangential behavior accounted for frictional shear stresses between the contact surfaces. The support surfaces with coarser mesh were designated as the master surface, and the steel stud surfaces with finer mesh were assigned as the slave surface. Finite sliding was selected for the contact interaction between the supports and the steel stud.
(3) 
Material Parameters
The material properties of the steel stud were based on high-temperature mechanical performance data from steady-state tests of Q355 cold-formed steel reported in Reference [36]. Specific values of elastic modulus and yield strength are summarized in Table 4.

5.2. Comparison of Experimental and Numerical Simulation Results

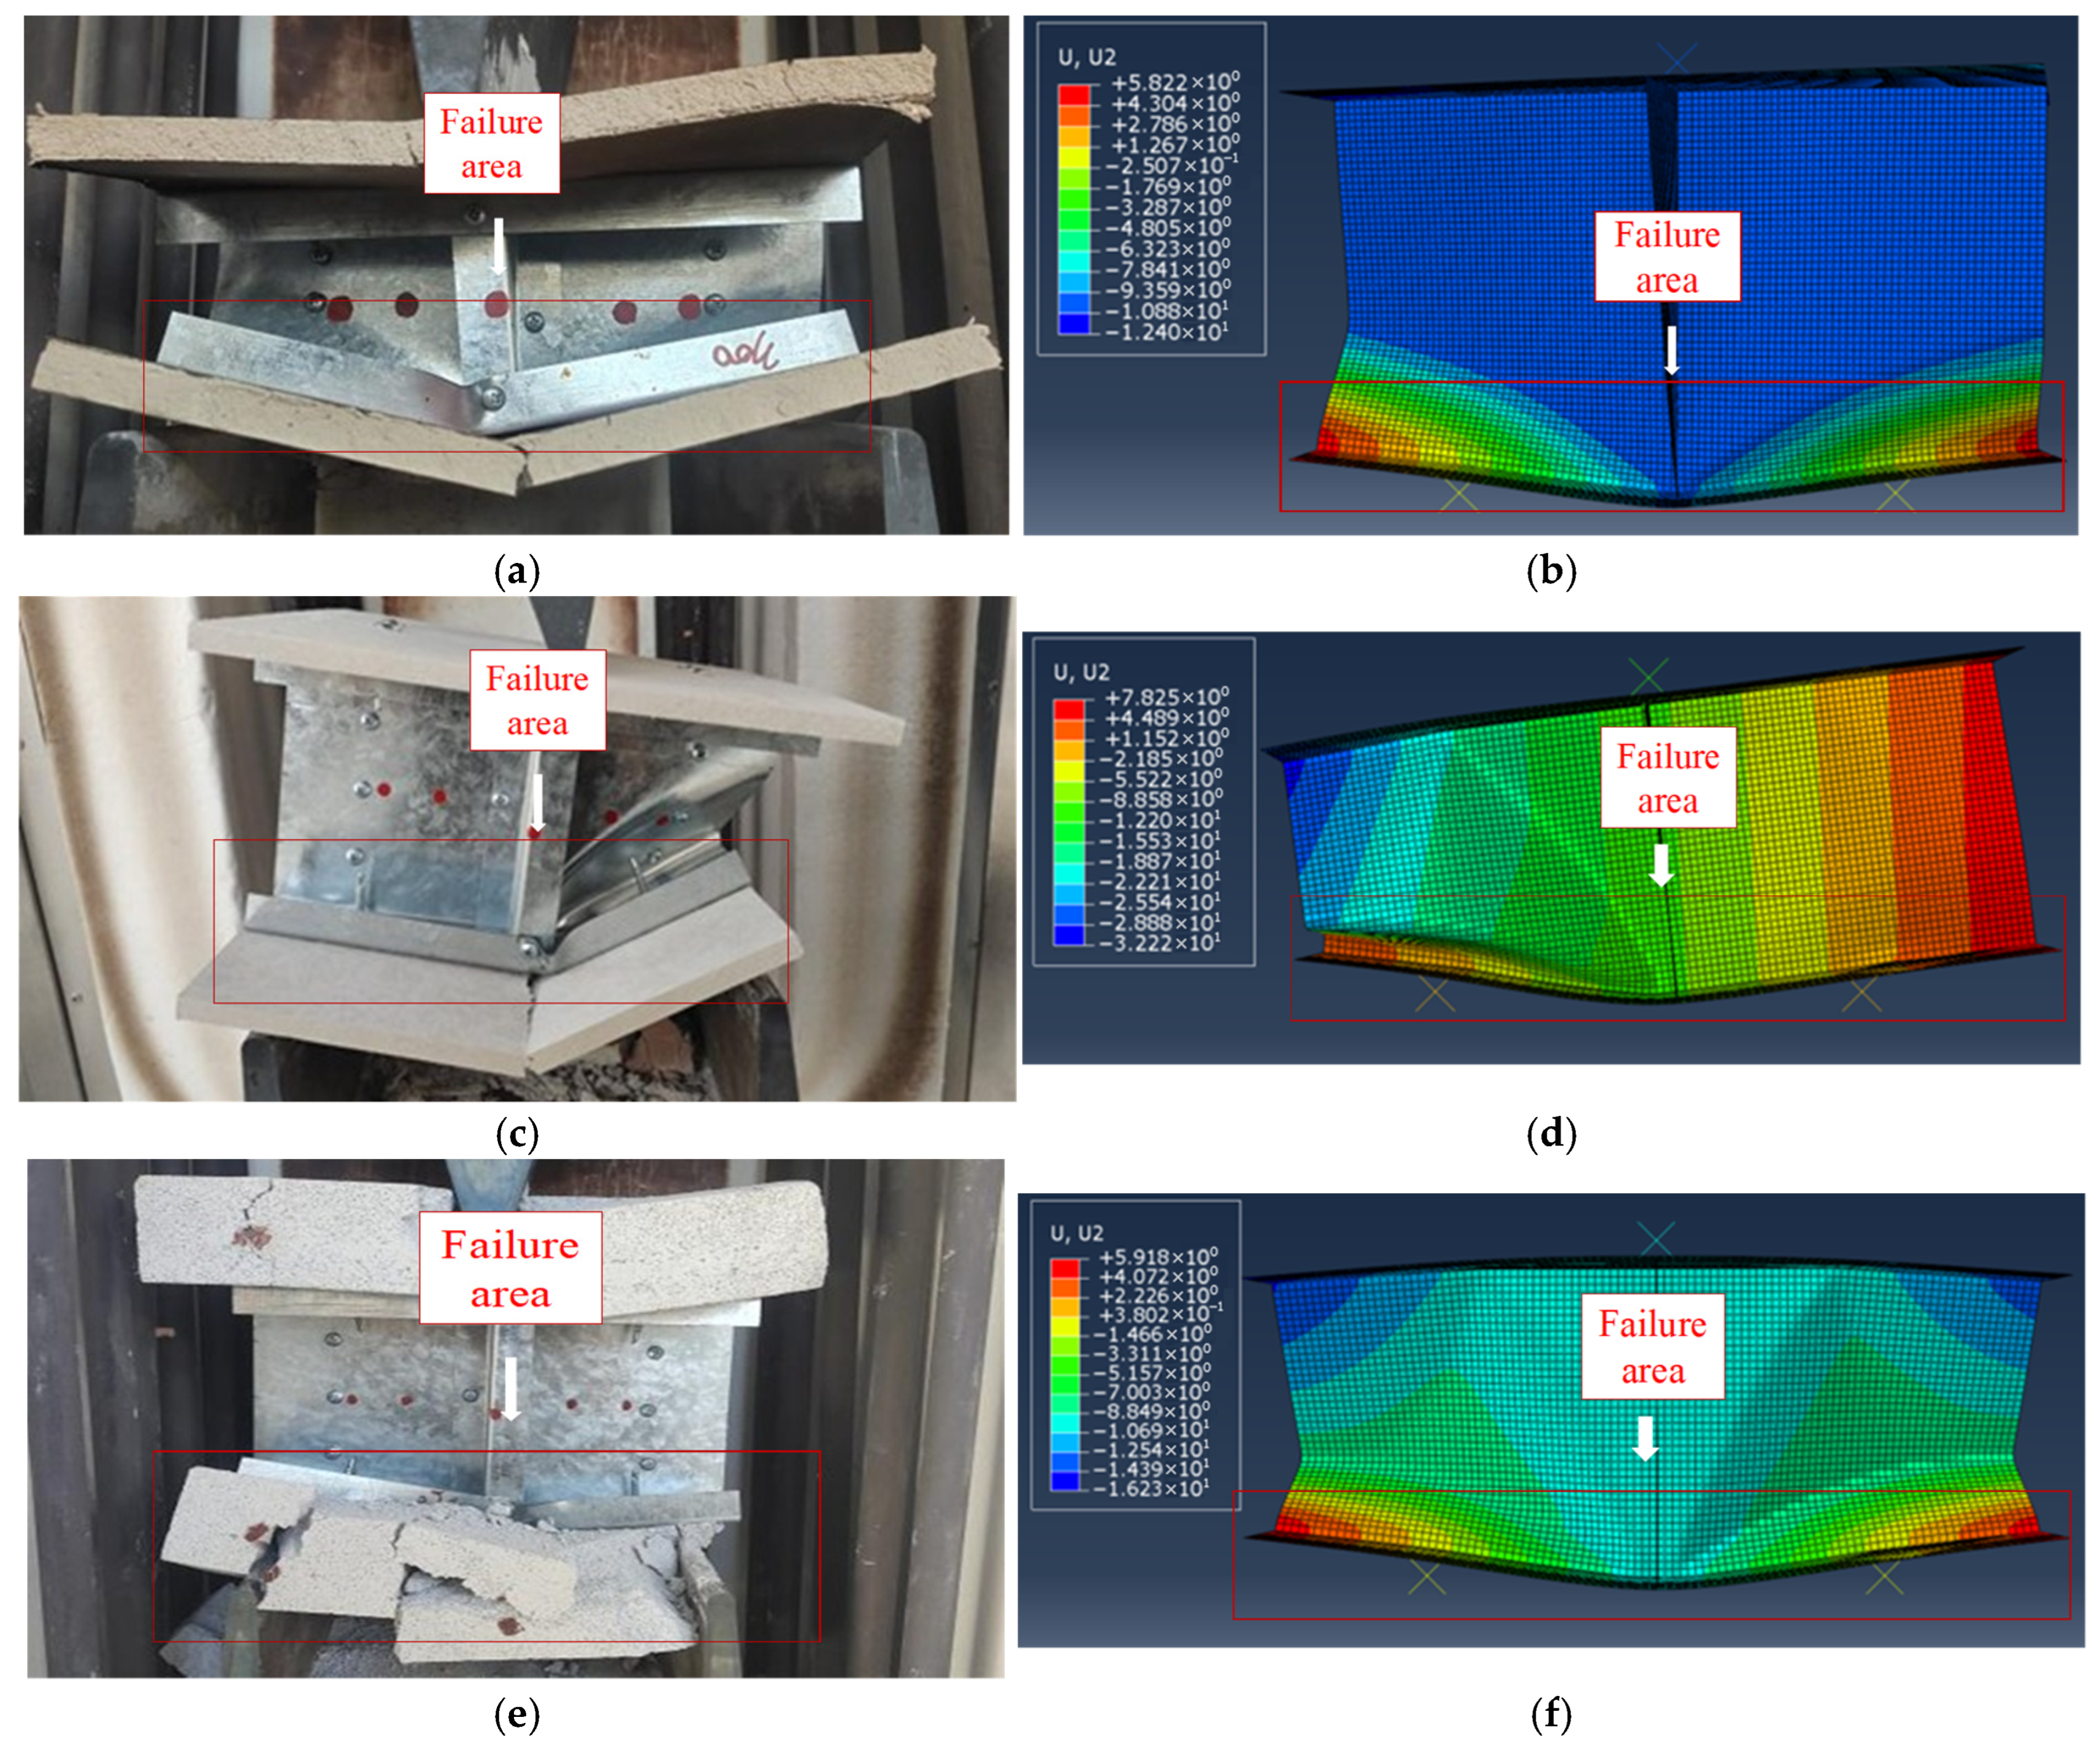
For different connection types, three typical specimens were selected to compare the experimental failure modes with simulation results, as shown in Figure 15. The numerical simulation results exhibit the same “V”-shaped deformation pattern and web buckling as observed in the experimental tests. The top flange did not show significant local deformation but underwent overall downward displacement under loading. In contrast, the bottom flange gradually deformed during loading, with both sides bending upward and exhibiting upward displacement.
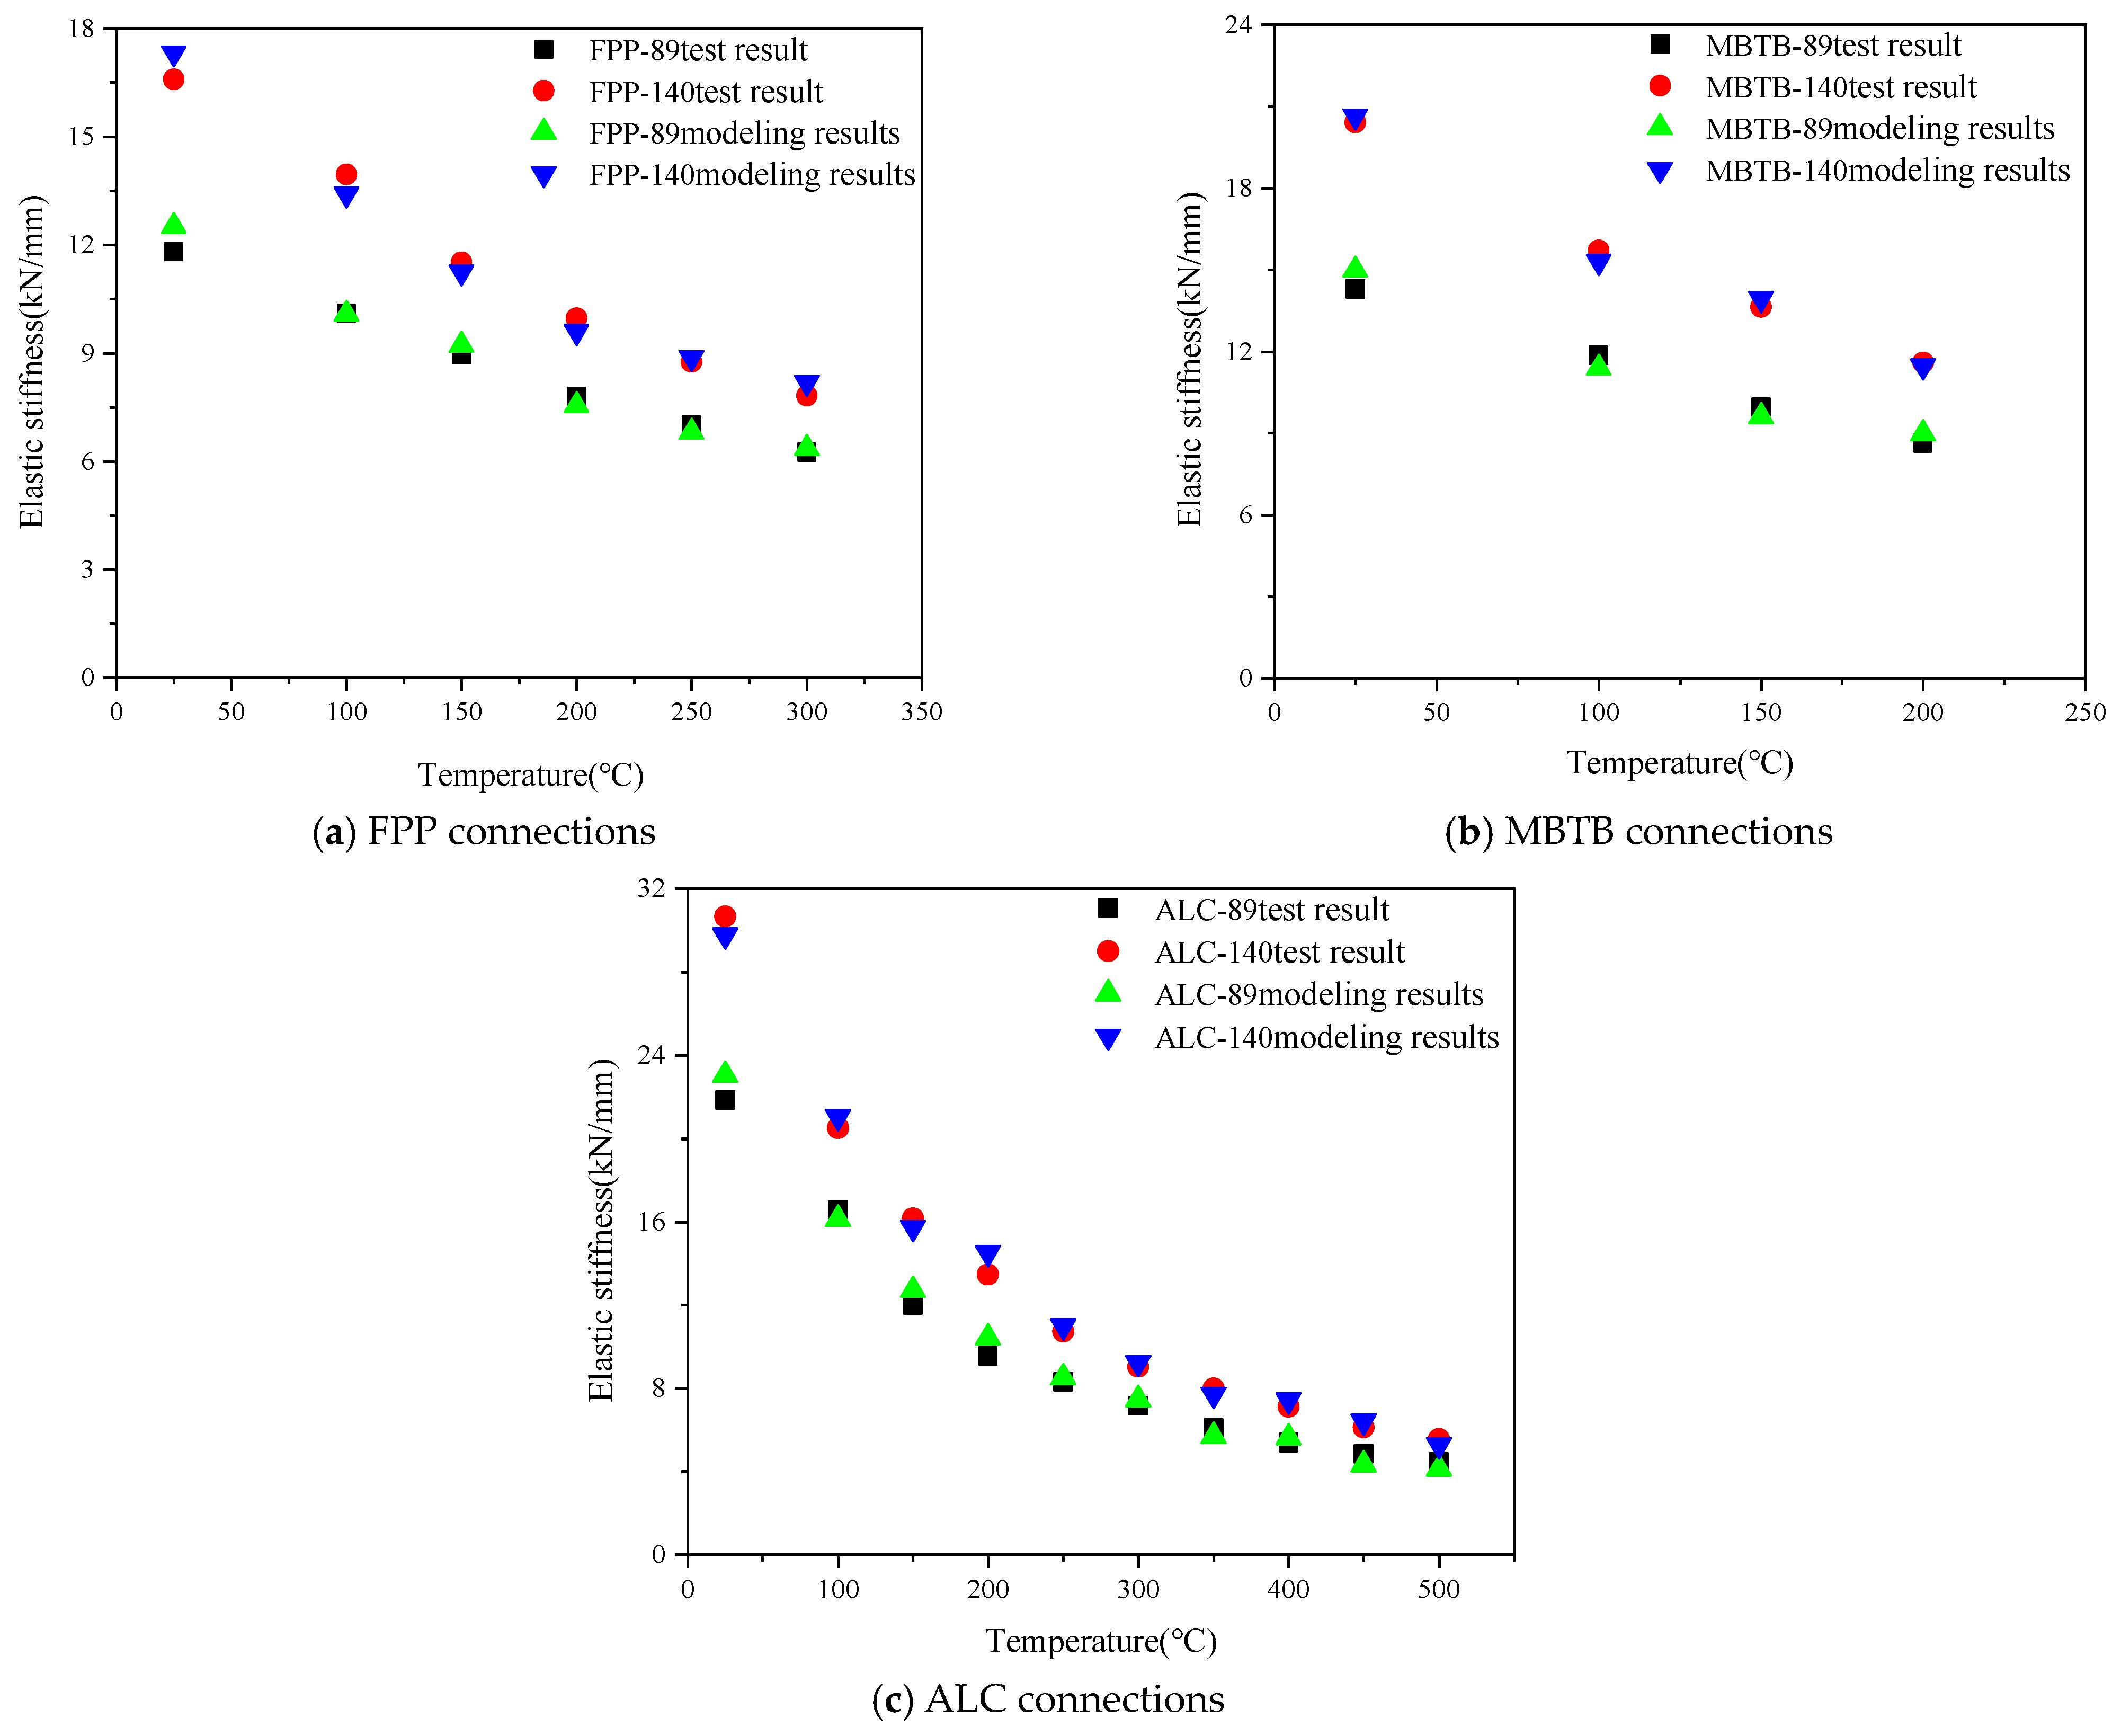
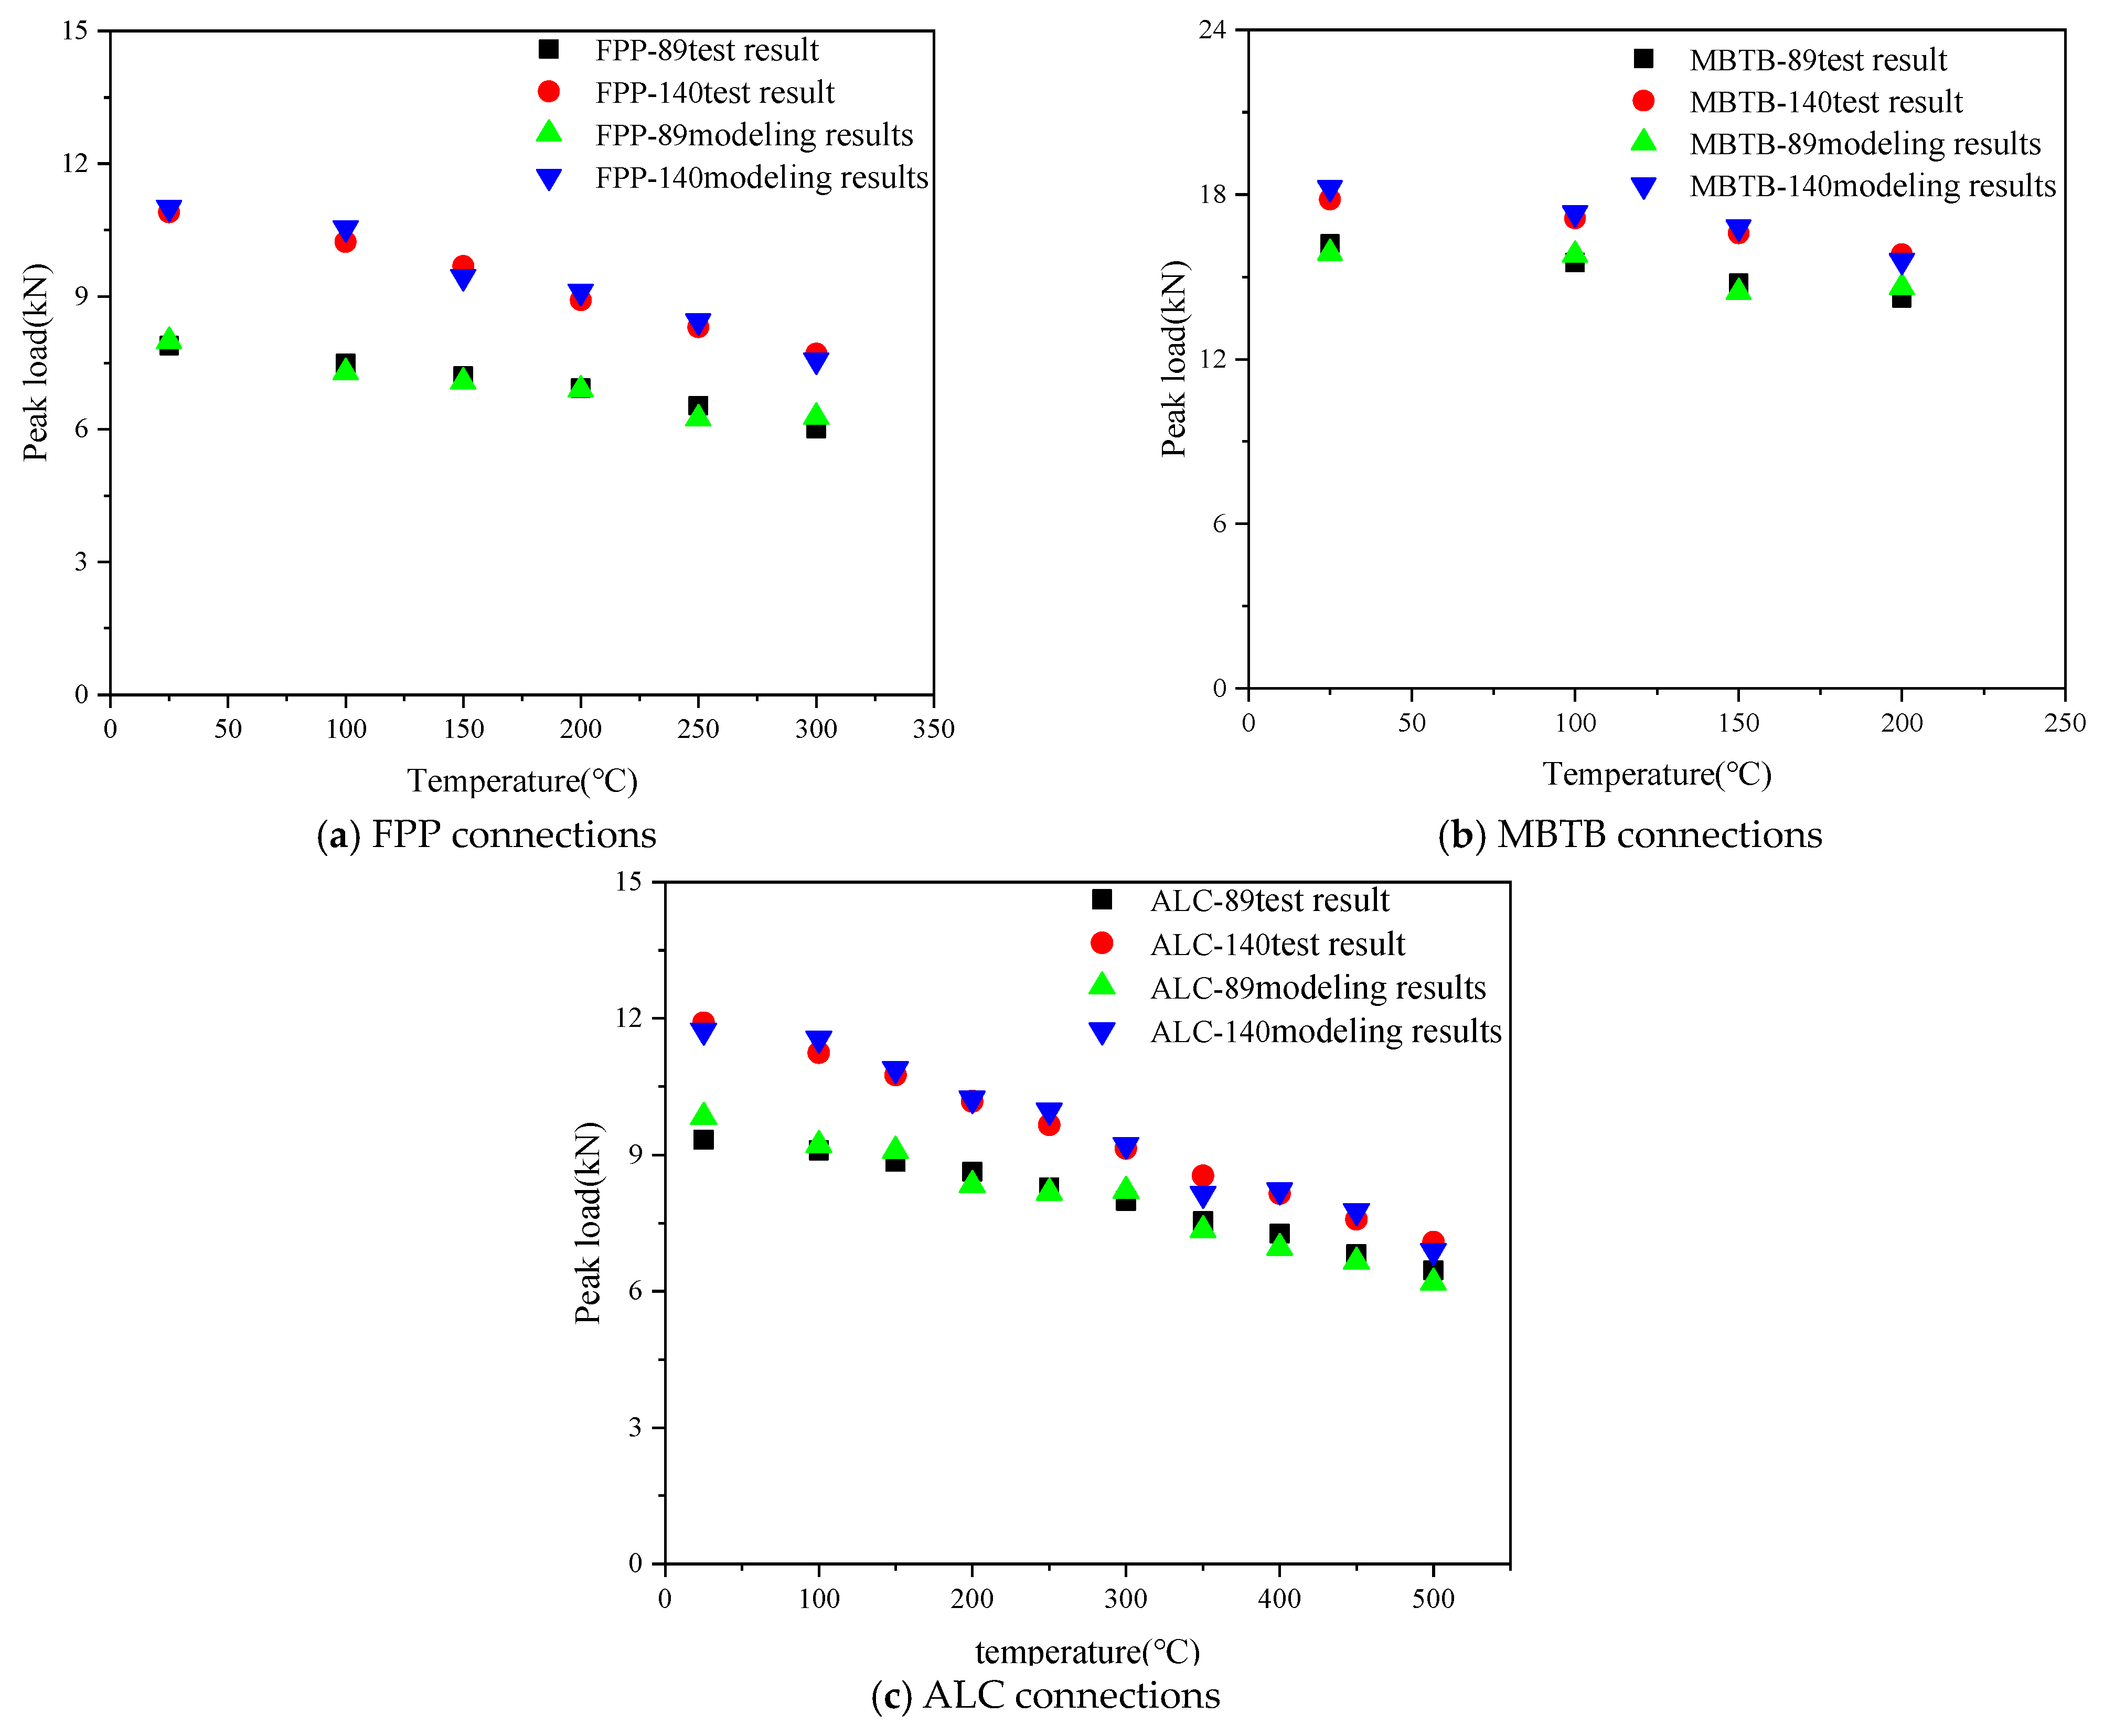
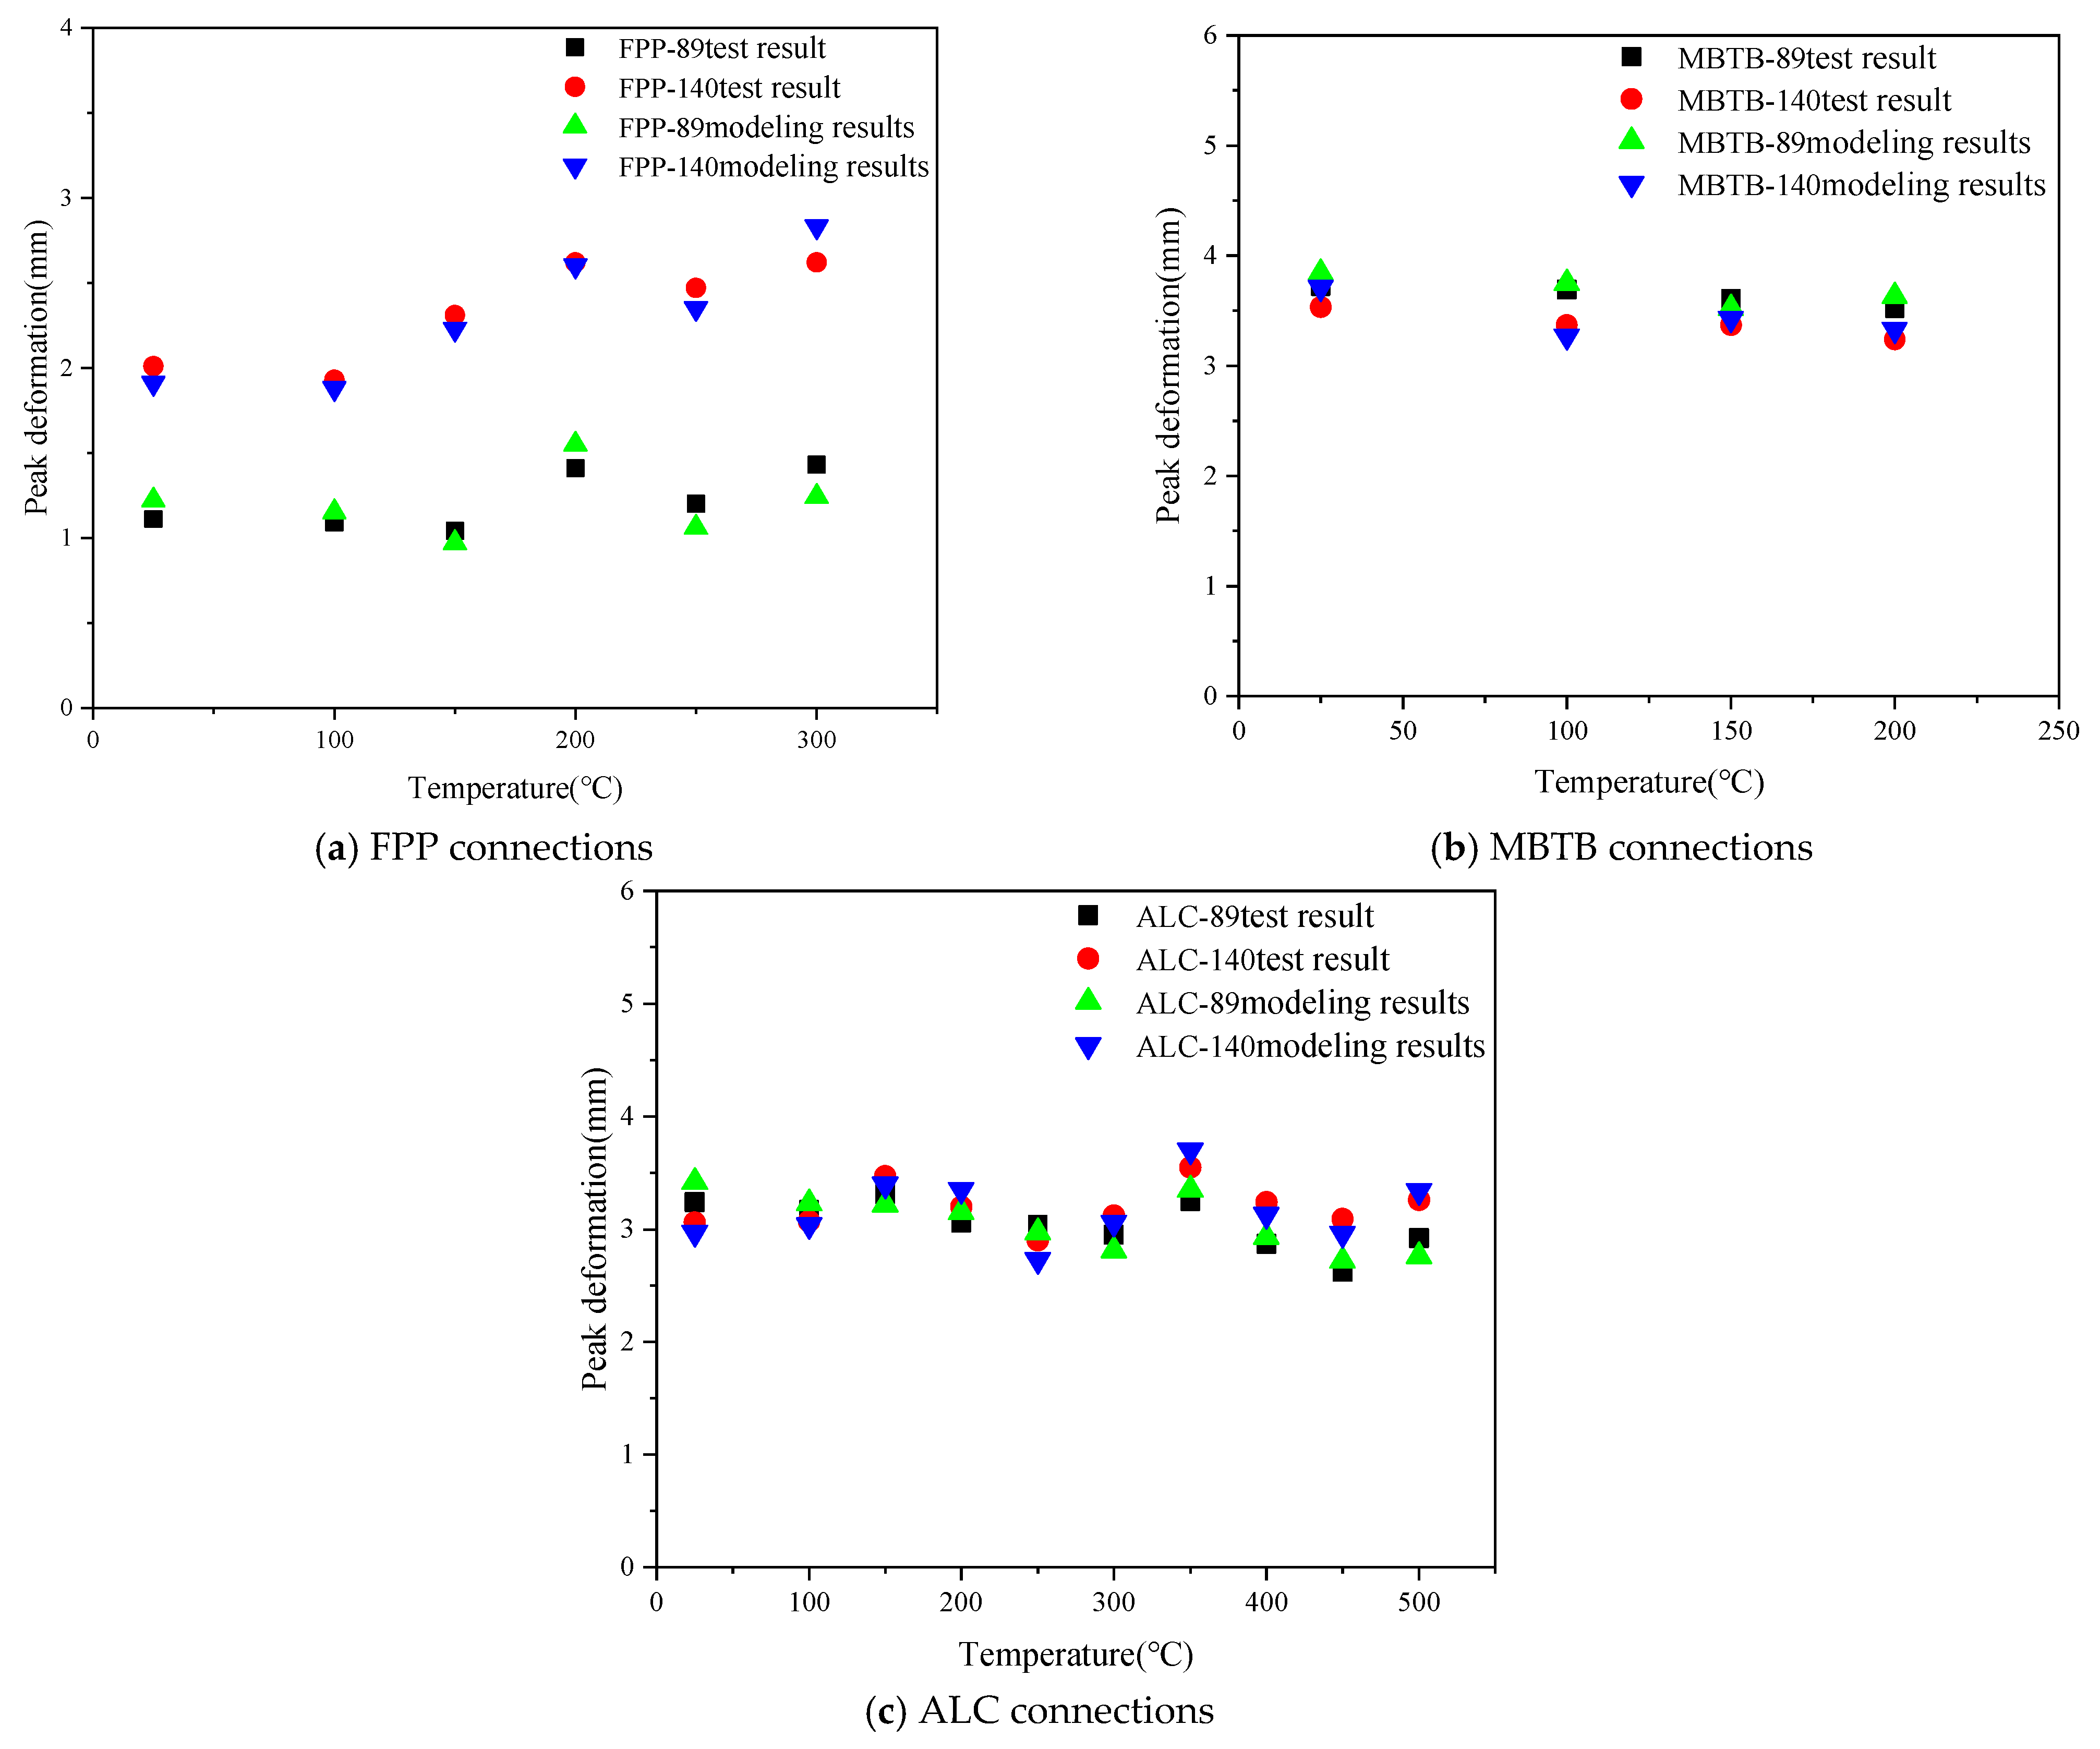
Figure 16, Figure 17 and Figure 18 compare the experimental and simulated values of elastic stiffness, peak load, and peak deformation for connections with different sheathing panels, respectively. The results demonstrate that the numerical simulations agree well with the experimental data in terms of elastic stiffness, peak load, and peak deformation. Minor discrepancies between simulated and experimental results for a few specimens may be attributed to manufacturing tolerances and initial imperfections.
Table 5 summarizes the ratios of experimental to numerical simulation parameters for different connections. These ratios generally fall within the range of 0.91–1.15, indicating a maximum error of 15%. This confirms the reliability of the finite element model established using the bending constitutive model.

6. Discussion

This study systematically investigates the out-of-plane mechanical performance of three typical sheathing panels (ALC board, fire-resistant gypsum board, and medium-density fiberboard) connected to steel studs via self-tapping screws, through high-temperature three-point bending tests. The paper focuses on comparing and analyzing the failure modes, load–displacement curve evolution, and key mechanical parameters such as peak load and elastic stiffness of different specimens. This clarifies the enhancing effect of each sheathing material on the connection joints and their sensitivity to temperature rise. Based on the experimental data, a constraint model is further proposed to describe the effect of sheathing panels on the out-of-plane deformation of steel studs, and the attenuation of this constraining contribution with increasing temperature is quantified.
Literature [34] studied the out-of-plane mechanical behavior at high temperatures using numerical simulation, confirming the constraining role of sheathing panels during building fires. However, the study simplified the constraint effect without considering nonlinear changes under high temperatures. Therefore, it is necessary to conduct in-depth experimental research on the out-of-plane mechanical performance of self-tapping screw connections at elevated temperatures to support fire resistance calculation and design of cold-formed steel structural systems. To date, no experimental study has been reported on the out-of-plane constraining effect of sheathing panels and self-tapping screws on steel studs.
In summary, compared with literature [34], this study reveals the out-of-plane failure mechanism of composite walls under high temperature through experimental methods, quantifies the nonlinear temperature dependence of the constraint effect, and proposes an engineering-applicable constraint model and material selection strategy. This not only verifies and deepens the conclusions of previous numerical studies but, more importantly, addresses the simplification issue related to high-temperature nonlinearity, thereby providing a solid theoretical basis and experimental foundation for refined fire-resistant design of building structures.

7. Conclusions

This study selected three types of panels—autoclaved lightweight concrete panels, fire-resistant gypsum boards, and medium-density calcium silicate boards—assembled with steel studs using self-drilling screws to form steel stud–panel connections. Three-point bending tests were conducted at various temperatures to investigate the influence of panels and self-drilling screws on the out-of-plane mechanical behavior of the connections. The following conclusions were drawn:
(1)
Under different temperatures, all types of connections exhibited consistent failure modes: failure of the bottom sheathing panel followed by compressive buckling of the steel stud flange. The main distinction lay in the failure mode of the bottom panel: gypsum boards and calcium silicate board underwent fracture failure, while ALC panels experienced crushing failure. Based on the measured load–displacement curves, the response of the composite connections can be divided into three stages: Elastic Ascending Stage, Elastoplastic Ascending Stage, and Post-Peak Stage. However, in fire-resistant gypsum boards connections, due to the loss of enhancing effect after panel fracture, the load–displacement curve exhibited a plateau stage without a descending segment.
(2)
By comparing the failure modes and load–displacement curves of connections with and without sheathing panels, the out-of-plane restraint provided by the sheathing panels to the steel studs can be simplified into two stages: the first where the panel remains elastic, and the second where cracks develop until the panel loses its constraining function. Based on this analysis, a calculation formula for the bending constitutive model was proposed. The load–displacement curves calculated using this model show good agreement with experimental curves, demonstrating that the proposed formula accurately describes the out-of-plane restraining effect of panels on steel studs.
(3)
Comparison between numerical simulation results and experimental specimens in terms of failure modes and characteristic parameters indicates that simplifying the panels as spring elements with stiffness defined by the proposed bending constitutive model yields errors within 15%. This simplified numerical modeling approach not only ensures computational accuracy but also improves efficiency, reduces convergence issues, and saves time for numerical analysis of entire structures under fire conditions.
The simplified bending constitutive model proposed in the paper is based on an experimental model. To accurately capture the degradation of out-of-plane restraint provided by self-tapping screws and sheathing panels, a simplified connection test was designed. To further investigate the applicability of the model presented in this paper, a full-scale wall furnace test will be conducted in future research, in which the influence of axial load will be taken into account.

Author Contributions

Conceptualization, W.C.; investigation, J.L. (Jie Li), L.X., Y.D., W.C. and X.Z.; writing—original draft preparation, J.L. (Jie Li); writing—review and editing, L.X., Y.D. and J.L. (Jiankang Lin); funding acquisition, W.C. All authors have read and agreed to the published version of the manuscript.

Funding

This research was funded by Natural Science Foundation of Shandong Province grant number [NO. ZR2023QE260].

Data Availability Statement

The original contributions presented in this study are included in the article. Further inquiries can be directed to the corresponding author.

Conflicts of Interest

Author Yutong Dong was employed by the company Shandong Construction Quality Inspection and Testing Center Co., Ltd., Jinan, and author Long Xu was employed by the Shandong Construction Quality Inspection and Testing Center Co., Ltd., Jinan and Shandong Branch of China Construction Bank Corporation, Jinan, China. The remaining authors declare that the research was conducted in the absence of any commercial or financial relationships that could be construed as a potential conflict of interest.

References

  1. Pan, F.; Gao, J.; Wang, Y.; Wang, T. Study on seismic performance of cold-formed steel frame structures based on software ABAQUS. In Proceedings of the 2024 3rd International Conference on Materials Engineering and Applied Mechanics, Taiyuan, China, 15–17 March 2024; IOP Publishing Ltd.: Bristol, UK, 2024. [Google Scholar]
  2. Niksefat, M.; Shamim, I. Investigating seismic behaviour of cold-formed steel moment frames with the welded through-plate flexural connection. Thin-Walled Struct. 2024, 196, 111477. [Google Scholar] [CrossRef]
  3. Meglio, E.; Formisano, A. Seismic Design and Analysis of a Cold-Formed Steel Exoskeleton for the Retrofit of an RC Multi-Story Residential Building. Appl. Sci. 2024, 14, 8674. [Google Scholar] [CrossRef]
  4. Jiang, L.; Zhang, X.; Cheng, X.; Chen, Z.; Hu, Y. Seismic performance of various types of cold-formed steel composite shear walls with CFRP-toughened screw connections. Eng. Struct. 2024, 314, 118411. [Google Scholar]
  5. Abbasi, M.; Riahi, H.T.; Zeynalian, M.; Rahnama, M.Y. Parametric study on seismic response modification factor of strap-braced cold-formed steel systems. Structures 2024, 60, 105791. [Google Scholar] [CrossRef]
  6. Xingxing, W.; Yaozhao, Z.; Rasa, E.; Wei, W. Seismic fragility of cold-formed steel structures considering the performance degradation of hold-downs. Structures 2024, 60, 105868. [Google Scholar] [CrossRef]
  7. Xu, Z.; Chen, Z.; Zuo, D.Y. Experimental Study on Seismic Behavior of Lightweight Concrete-Filled Cold-Formed Steel Shear Walls Strengthened Using Horizontal Reinforcement. J. Earthq. Eng. 2023, 27, 4126–4160. [Google Scholar] [CrossRef]
  8. Hou, H.J.; Chen, Z.H.; Wang, X.L. Experimental study on the seismic performance of a cold-formed thin-walled steel-concrete composite column-H steel beam frame. Sci. Rep. 2023, 13, 4486. [Google Scholar] [CrossRef]
  9. Seleim, S.; Laboube, R. Behavior of low ductility steels in Cold-Formed Steel connections. Thin-Walled Struct. 1996, 25, 135–151. [Google Scholar] [CrossRef]
  10. Laboube, R.A.; Sokol, M.A. Behavior of Screw Connections in Residential Construction. J. Struct. Eng. 2002, 128, 115–118. [Google Scholar] [CrossRef]
  11. Bambach, M.R.; Rasmussen, K.J.R. Behavior of Self-Drilling Screws in Light-Gauge Steel Construction. J. Struct. Eng. 2007, 133, 895–898. [Google Scholar]
  12. Nithyadharan, M.; Kalyanaraman, V. Experimental study of screw connections in CFS-calcium silicate board wall panels. Thin-Walled Struct. 2011, 49, 724–731. [Google Scholar] [CrossRef]
  13. Fiorino, L.; Della Corte, G.; Landolfo, R. Experimental tests on typical screw connections for cold-formed steel housing. Eng. Struct. 2007, 29, 1761–1773. [Google Scholar] [CrossRef]
  14. Yu, W.W.; LaBoube, R.A. University of Missouri-Rolla research on cold-formed steel structures. Thin-Walled Struct. 1997, 28, 213–223. [Google Scholar] [CrossRef]
  15. Rogers, C.A.; Hancock, G.J. Screwed Connection Tests of Thin G550 and G300 Sheet Steels. J. Struct. Eng. 1998, 124, 798–808. [Google Scholar] [CrossRef]
  16. Lu, L.; Wang, D.; Wang, W.; Wu, H.; Ding, K.; Darkwah, K.K.; Yan, H. Shear bearing capacity of self-drilling screw group connections of CFS sheets. Structures 2022, 35, 160–171. [Google Scholar] [CrossRef]
  17. Peterman, K.D.; Nakata, N.; Schafer, B.W. Hysteretic characterization of cold-formed steel stud-to-sheathing connections. J. Constr. Steel Res. 2014, 101, 254–264. [Google Scholar] [CrossRef]
  18. Chen, Z.H.; Niu, X.Y.; Liu, J.D.; Khan, K. Experimental study of thin-walled steel-timber single-shear connection with a self-tapping screw. Structures 2021, 34, 4389–4405. [Google Scholar] [CrossRef]
  19. Zhang, A.L.; Liu, J.D.; Wang, J.S.; Chen, Z.; Li, Y. Experimental and analytical behaviour of light gauge steel-fast growing timber composite shear connections. Structures 2023, 47, 1691–1709. [Google Scholar] [CrossRef]
  20. Kou, Y.F.; Tian, L.M.; Hao, J.P.; Jin, B.B. Lateral resistance of the screwed connections of original bamboo. J. Build. Eng. 2022, 45, 103601. [Google Scholar] [CrossRef]
  21. Zhao, J.; Lai, B.L.; Fan, S.; Liu, M.; Li, C. Numerical simulation of local-distortional buckling behavior of lipped C-section stainless steel columns. J. Constr. Steel Res. 2023, 211, 108148. [Google Scholar] [CrossRef]
  22. Lai, B.L.; Zheng, X.F.; Fan, S.G.; Chang, Z.Q. Behavior and design of concrete filled stainless steel tubular columns under concentric and eccentric compressive loading. J. Constr. Steel Res. 2024, 213, 108319. [Google Scholar] [CrossRef]
  23. Lai, B.L.; Li, Y.R.; Becque, J.; Zheng, Y.-Y.; Fan, S.-G. Axial compressive behavior of circular stainless steel tube confined UHPC stub columns under monotonic and cyclic loading. Thin-Walled Struct. 2025, 208, 112830. [Google Scholar] [CrossRef]
  24. Lu, W.; Ma, Z.; Mäkeläinen, P.; Outinen, J. Behaviour of shear connectors in cold-formed steel sheeting at ambient and elevated temperatures. Thin-Walled Struct. 2012, 61, 229–238. [Google Scholar] [CrossRef]
  25. Yan, S.; Young, B. Tests of single shear bolted connections of thin sheet steels at elevated temperatures—Part I: Steady state tests. Thin-Walled Struct. 2011, 49, 1320–1333. [Google Scholar] [CrossRef]
  26. Yan, S.; Young, B. Tests of single shear bolted connections of thin sheet steels at elevated temperatures—Part II: Transient state tests. Thin-Walled Struct. 2011, 49, 1334–1340. [Google Scholar] [CrossRef]
  27. Yan, S.; Young, B. Screwed connections of thin sheet steels at elevated temperatures—Part I: Steady state tests. Eng. Struct. 2012, 35, 234–243. [Google Scholar] [CrossRef]
  28. Yan, S.; Young, B. Screwed connections of thin sheet steels at elevated temperatures—Part II: Transient state tests. Eng. Struct. 2012, 35, 228–233. [Google Scholar] [CrossRef]
  29. Cai, Y.; Young, B. High temperature tests of cold-formed stainless steel double shear bolted connections. J. Constr. Steel Res. 2015, 104, 49–63. [Google Scholar] [CrossRef]
  30. Cai, Y.; Young, B. Transient state tests of cold-formed stainless steel single shear bolted connections. Eng. Struct. 2014, 81, 1–9. [Google Scholar] [CrossRef]
  31. Cai, Y.; Young, B. Behavior of cold-formed stainless steel single shear bolted connections at elevated temperatures. Thin-Walled Struct. 2014, 75, 63–75. [Google Scholar] [CrossRef]
  32. Chen, W.; Ye, J.; Chen, T. Design of Cold-Formed Steel Screw Connections with Gypsum Sheathing at Ambient and Elevated Temperatures. Appl. Sci. 2016, 6, 248. [Google Scholar] [CrossRef]
  33. Chen, W.W.; Ye, J.H. A new simplified calculation model of CFS composite exterior walls under fire conditions. Structures 2019, 22, 53–64. [Google Scholar] [CrossRef]
  34. Staszak, N.; Szymczak-Graczyk, A.; Garbowski, T. Elastic analysis of three-layer concrete slab based on numerical homogenization with an analytical shear correction factor. Appl. Sci. 2022, 12, 9918. [Google Scholar] [CrossRef]
  35. Chen, W.; Ye, J. Simplified calculation model for load-bearing CFS composite walls under fire conditions. Adv. Struct. Eng. 2020, 23, 1683–1701. [Google Scholar]
  36. Ye, J.; Chen, W. Elevated Temperature Material Degradation of Cold-Formed Steels under Steady- and Transient-State Conditions. J. Mater. Civ. Eng. 2013, 25, 947–957. [Google Scholar] [CrossRef]
Figure 1. Failure modes of cold-formed steel wall under fire conditions.
Buildings 16 01338 g001
Figure 2. PWS-100 high-temperature fatigue testing system and boundary condition.
Buildings 16 01338 g002
Figure 3. Schematic diagram of cold-formed steel stud–panel connection and stud dimensions.
Buildings 16 01338 g003
Figure 4. Failure modes of various connections under elevated temperatures.
Buildings 16 01338 g004aBuildings 16 01338 g004b
Figure 5. Load–displacement curves of various connections under elevated temperatures.
Buildings 16 01338 g005aBuildings 16 01338 g005b
Figure 6. Characteristic parameters of different connections under elevated temperatures.
Buildings 16 01338 g006aBuildings 16 01338 g006b
Figure 7. Influence of panels on elastic stiffness.
Buildings 16 01338 g007
Figure 8. Influence of panels on peak load.
Buildings 16 01338 g008
Figure 9. Comparison of predictions from formulas with different connection parameters against experimental data.
Buildings 16 01338 g009aBuildings 16 01338 g009b
Figure 10. Phase-based analysis of the load–displacement curve.
Buildings 16 01338 g010
Figure 11. Load difference-displacement curve of the ALC panel connection.
Buildings 16 01338 g011
Figure 12. Comparison of load–displacement curves and theoretical formulas.
Buildings 16 01338 g012aBuildings 16 01338 g012b
Figure 13. Comparison of Load Difference-Displacement Curves.
Buildings 16 01338 g013
Figure 14. Meshing and boundary conditions of numerical simulation model.
Buildings 16 01338 g014
Figure 15. Comparison of experimental and simulated results for different connections. (a) Failure mode of the FPP-89-300 connection specimen. (b) Numerical simulation results of the FPP-89-300 connection. (c) Failure mode of the MBTB-89-25 connection specimen. (d) Numerical simulation results of the MBTB-89-25 connection. (e) Failure mode of the ALC-140-250 connection specimen. (f) Numerical simulation results of the ALC-140-250 connection.
Buildings 16 01338 g015
Figure 16. Comparison of experimental and simulated elastic stiffness values.
Buildings 16 01338 g016
Figure 17. Comparison of experimental and simulated peak load values.
Buildings 16 01338 g017
Figure 18. Comparison of experimental and simulated peak deformation values.
Buildings 16 01338 g018
Table 1. Cold-formed steel stud–panel connection specimens.
Specimen IDPresence of PanelPanel TypeSteel Stud Type
N-89-25No/C89
N-140-25No/C140
FPP-89-25YesFPPC89
FPP-140-25YesFPPC140
MBTB-89-25YesMBTBC89
MBTB-140-25YesMBTBC140
ALC-89-25YesALCC89
ALC-140-25YesALCC140
Table 2. Coefficient values in Equations (1) and (2).
Specimen IDA1A2B1B2C1C2
N-890.00280.0720−0.00320.11887.964818.3738
N-1400.01380.0611−0.03710.096910.670019.6451
FPP-890.0287−0.0146−0.07240.019712.68557.8778
FPP-1400.0701−0.0148−0.15950.014918.308111.0592
MBTB-890.0181−0.0151−0.06440.014815.308916.3615
MBTB-1400.1264−0.0287−0.27060.038722.809817.8352
ALC-890.0608−0.0129−0.25290.018325.56099.3257
ALC-1400.3299−0.0019−0.6743−0.006735.937912.1701
Table 3. Values of coefficients A, B, C, and D.
Specimen IDABCDSpecimen IDABCD
ALC-89-2514.5116.99−6.944.91ALC-140-2520.5221.99−7.525.80
ALC-89-1009.185.88−2.993.46ALC-140-10011.528.86−4.994.90
ALC-89-1505.080.02−0.492.56ALC-140-1507.484.37−3.864.43
ALC-89-2002.892.50−2.082.17ALC-140-2005.210.64−1.473.48
ALC-89-2502.31−0.890.211.77ALC-140-2503.30−0.37−0.752.78
ALC-89-3001.54−0.790.311.30ALC-140-3002.01−2.140.462.13
ALC-89-3500.85−1.401.310.52ALC-140-3501.12−2.661.211.80
ALC-89-4000.72−1.001.080.54ALC-140-4000.82−1.651.160.95
ALC-89-4500.36−1.101.420.24ALC-140-4500.58−1.681.530.50
ALC-89-5000.42−0.841.340.14ALC-140-5000.55−0.43−0.181.16
Table 4. Characteristic Value Parameters of Steel at Elevated Temperatures.
Temperature (°C)25100150200250300350400450500
ET (GPa)203.6186.5188.7190.8174.3157.8147.8137.8130.179.0
FyT (MPa)336.9305.9303.2300.5263.0225.4216.2206.9166.478.5
Table 5. Ratios of experimental to numerical simulation parameters.
Elastic StiffnessPeak LoadPeak Deformation
Specimen IDEEXP/ENESpecimen IDFEXP/FNESpecimen IDdEXP/dNE
ALC-89-250.95ALC-89-250.95ALC-89-250.95
ALC-89-1001.03ALC-89-1000.99ALC-89-1000.98
ALC-89-1500.94ALC-89-1500.97ALC-89-1501.03
ALC-89-2000.91ALC-89-2001.03ALC-89-2000.97
ALC-89-2500.98ALC-89-2501.01ALC-89-2501.02
ALC-89-3000.96ALC-89-3000.97ALC-89-3001.05
ALC-89-3501.07ALC-89-3501.03ALC-89-3500.97
ALC-89-4000.96ALC-89-4001.05ALC-89-4000.98
ALC-89-4501.12ALC-89-4501.03ALC-89-4500.96
ALC-89-5001.08ALC-89-5001.04ALC-89-5001.06
ALC-140-251.03ALC-140-251.01ALC-140-251.03
ALC-140-1000.97ALC-140-1000.97ALC-140-1001.01
ALC-140-1501.03ALC-140-1500.99ALC-140-1501.02
ALC-140-2000.93ALC-140-2000.99ALC-140-2000.96
ALC-140-2500.98ALC-140-2500.97ALC-140-2501.06
ALC-140-3000.98ALC-140-3000.99ALC-140-3001.02
ALC-140-3501.04ALC-140-3501.05ALC-140-3500.96
ALC-140-4000.96ALC-140-4000.99ALC-140-4001.04
ALC-140-4500.95ALC-140-4500.98ALC-140-4501.04
ALC-140-5001.05ALC-140-5001.03ALC-140-5000.98
FPP-89-250.94FPP-89-250.99FPP-89-250.91
FPP-89-1001.00FPP-89-1001.03FPP-89-1000.95
FPP-89-1500.97FPP-89-1501.02FPP-89-1501.07
FPP-89-2001.03FPP-89-2001.01FPP-89-2000.91
FPP-89-2501.03FPP-89-2501.05FPP-89-2501.13
FPP-89-3000.98FPP-89-3000.96FPP-89-3001.15
FPP-140-250.96FPP-140-250.99FPP-140-251.05
FPP-140-1001.04FPP-140-1000.97FPP-140-1001.03
FPP-140-1501.02FPP-140-1501.03FPP-140-1501.04
FPP-140-2001.04FPP-140-2000.98FPP-140-2001.01
FPP-140-2500.99FPP-140-2500.98FPP-140-2501.05
FPP-140-3000.95FPP-140-3001.02FPP-140-3000.93
MBTB-89-250.95MBTB-89-251.02MBTB-89-250.97
MBTB-89-1001.04MBTB-89-1000.98MBTB-89-1000.98
MBTB-89-1501.03MBTB-89-1501.02MBTB-89-1501.03
MBTB-89-2000.96MBTB-89-2000.97MBTB-89-2000.97
MBTB-140-250.99MBTB-140-250.98MBTB-140-250.95
MBTB-140-1001.03MBTB-140-1000.99MBTB-140-1001.03
MBTB-140-1500.98MBTB-140-1500.99MBTB-140-1500.98
MBTB-140-2001.01MBTB-140-2001.01MBTB-140-2000.97
Note: EEXP, FEXP and dEXP represent the elastic stiffness, peak load, and peak deformation of the experimental model, respectively; ENE represents the elastic stiffness, peak load, and peak deformation of the numerical simulation model.
Disclaimer/Publisher’s Note: The statements, opinions and data contained in all publications are solely those of the individual author(s) and contributor(s) and not of MDPI and/or the editor(s). MDPI and/or the editor(s) disclaim responsibility for any injury to people or property resulting from any ideas, methods, instructions or products referred to in the content.