


Abstract
Traditional villages in the Jiangnan region have experienced significant spatial transformation under rural revitalization, yet thermal environment regulation in public spaces remains insufficiently addressed. This study examines how spatial morphology influences microclimate and outdoor thermal comfort during summer and proposes evidence-based climate-responsive strategies. Three representative provincial-level traditional villages in Wuxi—Yaogeli Village, Zhu Village, and Huangtutang Ancient Village Area—were selected as case studies. Public spaces were classified into open, semi-open, and semi-private types according to spatial openness. Field microclimate measurements and thermal comfort surveys were conducted, and Physiological Equivalent Temperature (PET) was calculated to evaluate thermal conditions. Results show that rural public spaces generally experience significant summer heat stress, with PET exceeding the neutral range during most daytime periods. Spatial openness is significantly positively correlated with PET, identifying solar radiation as the dominant thermal driver. Water bodies provide cooling benefits within limited spatial ranges, constrained by configuration and ventilation conditions. Ecological and composite surfaces reduce heat accumulation compared to single materials. These findings indicate that thermal comfort in rural public spaces is a multi-factor and interaction-driven process, providing empirical support for climate-adaptive rural renewal.
1. Introduction
With the intensifying trend of global climate warming [1], increasingly frequent extreme heat events during summer have exerted significant impacts on outdoor activities and human health [2,3]. As the gap between urban and rural areas gradually narrows, thermal environment issues are no longer challenges faced solely by urban spaces but have increasingly become an important factor affecting the quality of public life in rural areas [4]. This phenomenon is particularly evident in eastern China, where economic development and urbanization have rapidly expanded [5]. In the economically developed Yangtze River Delta region, especially within traditional Jiangnan villages, the modernization of rural areas has gradually introduced urbanization-related problems into traditional settlements [6].
In current rural construction and renewal processes, the planning and transformation of public spaces tend to prioritize tourism-oriented landscape shaping and functional modernization [7]. Therefore, understanding the role of traditional rural public spaces in microclimate regulation and outdoor thermal comfort is of considerable importance for optimizing rural spatial environments.
Previous studies have shown that the spatial configurations of traditional rural settlements can regulate local microclimates and improve outdoor thermal comfort through elements such as street networks, courtyards, and water systems [7,8,9,10,11]. However, most existing studies focus either on single village types or on macro-scale analyses, lacking systematic evaluations of different types of public spaces in the context of contemporary spatial transformation. Meanwhile, during processes of spatial renewal, the original microclimate regulation mechanisms embedded in traditional settlements may be altered [8], and newly constructed or renovated modern spaces often exhibit higher levels of thermal stress [12].
To address this research gap, the present study systematically evaluates the thermal environment characteristics and human thermal perception across multiple types of public spaces in traditional Jiangnan villages. By examining the thermal environment of public spaces in Jiangnan traditional villages after modernization-oriented transformation, this study explores the relationships between spatial elements and outdoor thermal comfort and verifies the effectiveness of rural design strategies in improving human living environments. The findings are expected to provide both theoretical and practical support for climate-adaptive optimization of rural spaces [13,14].
In the field of outdoor thermal comfort research, relatively mature evaluation frameworks have been established for assessing human thermal perception. Indices such as Physiological Equivalent Temperature (PET) and Predicted Mean Vote (PMV) are widely used to evaluate human thermal sensation and are typically associated with air temperature, relative humidity, wind speed, and solar radiation [15,16,17]. Recent methodological advances include refined calibration approaches based on Thermal Sensation Vote (TSV) data [18], as well as assessments of the applicability of PET under outdoor hot–humid climatic conditions [19]. Field measurements and simulation studies have further demonstrated that spatial morphology, landscape elements, and the Sky View Factor (SVF) are significantly associated with local thermal environments, highlighting the cooling contributions of vegetation and shading infrastructure [20,21,22]. These methodological frameworks developed in urban thermal comfort research provide an important foundation and feasible approach for examining the relationships between spatial elements and thermal comfort in rural public spaces.
Traditional Jiangnan rural settlements have evolved spatial configurations that are highly adapted to their local environments through long-term human–environment interactions, reflecting natural responses to climatic, hydrological, and topographical conditions [23]. Wuxi, located in the hinterland of the Taihu Plain within the Yangtze River Delta, represents one of the regions where traditional Jiangnan villages are widely distributed. Taking three representative traditional villages in Wuxi—Yaogeli Village, Zhu Village, and Huangtutang Ancient Village—as case studies, this research integrates spatial morphology analysis, on-site microclimate measurements, and thermal comfort questionnaire surveys to systematically evaluate the thermal environmental characteristics and human thermal perception across different types of public spaces. On this basis, key spatial factors influencing thermal comfort are identified, and targeted climate-adaptive design strategies are proposed to support the sustainable optimization of public spaces in traditional rural settlements.
This study aims to answer the following research questions:
- (1)
- How do different types of traditional villages exhibit distinct microclimatic characteristics and thermal comfort conditions during summer?
- (2)
- How do different types of rural public spaces influence outdoor thermal environments and thermal comfort levels?
- (3)
- How do key spatial elements—such as spatial openness, water bodies, and surface materials—affect outdoor thermal comfort in rural public spaces?
2. Research Design
2.1. Research Objects
The Wuxi region is characterized by a dense network of rivers and lakes, forming a typical Jiangnan water-town landscape. The summer climate is generally marked by a relatively long hot season, high temperatures, humid conditions, and abundant sunshine. Regional wind patterns are influenced by the monsoon circulation system, with southeasterly winds prevailing throughout most of the year [24].
The spatial morphology of traditional Jiangnan villages is closely associated with their natural geographical environments, where different environmental conditions often shape distinct settlement patterns [25]. To ensure the representativeness and comparability of the research results, village selection in this study was guided by three main criteria: traditional authenticity and representativeness, diversity of spatial types, and integrity of preservation. Priority was given to well-preserved provincial-level traditional villages in Jiangsu Province, while also considering variations in natural environments and settlement spatial structures [26].
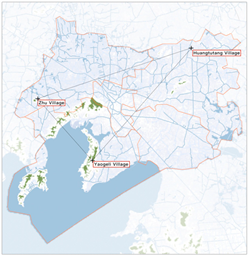
Accordingly, three Jiangsu provincial traditional villages in Wuxi from different designation batches were selected as representative case villages: Huangtutang Ancient Village, Yaogeli Village in Xushe Community, and Zhu Village in Yangshan Village (Table 1). All three settlements evolved from natural villages that developed through long-term interactions with their surrounding natural environments.
Table 1.
Distribution and Pattern Characteristics of Survey Respondents.
Huangtutang Ancient Village, located in Xishan District of Wuxi, represents a plain water-network settlement type, with a branched cluster spatial pattern. Yaogeli Village, situated in Binhu District, belongs to the hilly settlement type. Zhu Village in Yangshan Village, located in Huishan District, also represents a plain water-network settlement type, with a linear belt-like spatial configuration.
2.2. Testing Instruments
Based on prior validation through field measurements reported in relevant studies [27], a Kestrel 5500 (Kestrel Instruments, Boothwyn, PA, USA) was employed to record wind speed, air temperature, and relative humidity. Black globe temperature was measured using an AZ8778 globe thermometer (AZ Instrument Corp., Taichung, Taiwan), enabling the subsequent calculation of PET and its correlation with microclimatic parameters (Table 2).
Table 2.
Table of Parameters for Microclimate Measurement Instruments.
All instruments were installed at a standardized height of 1.5 m above ground level at each measurement point to represent pedestrian-level thermal conditions.
2.3. Testing Scheme
2.3.1. Layout of Measurement Points
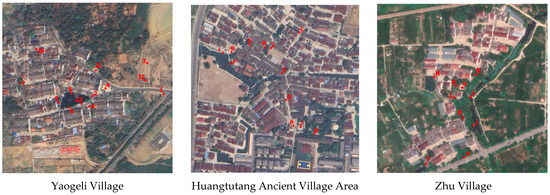
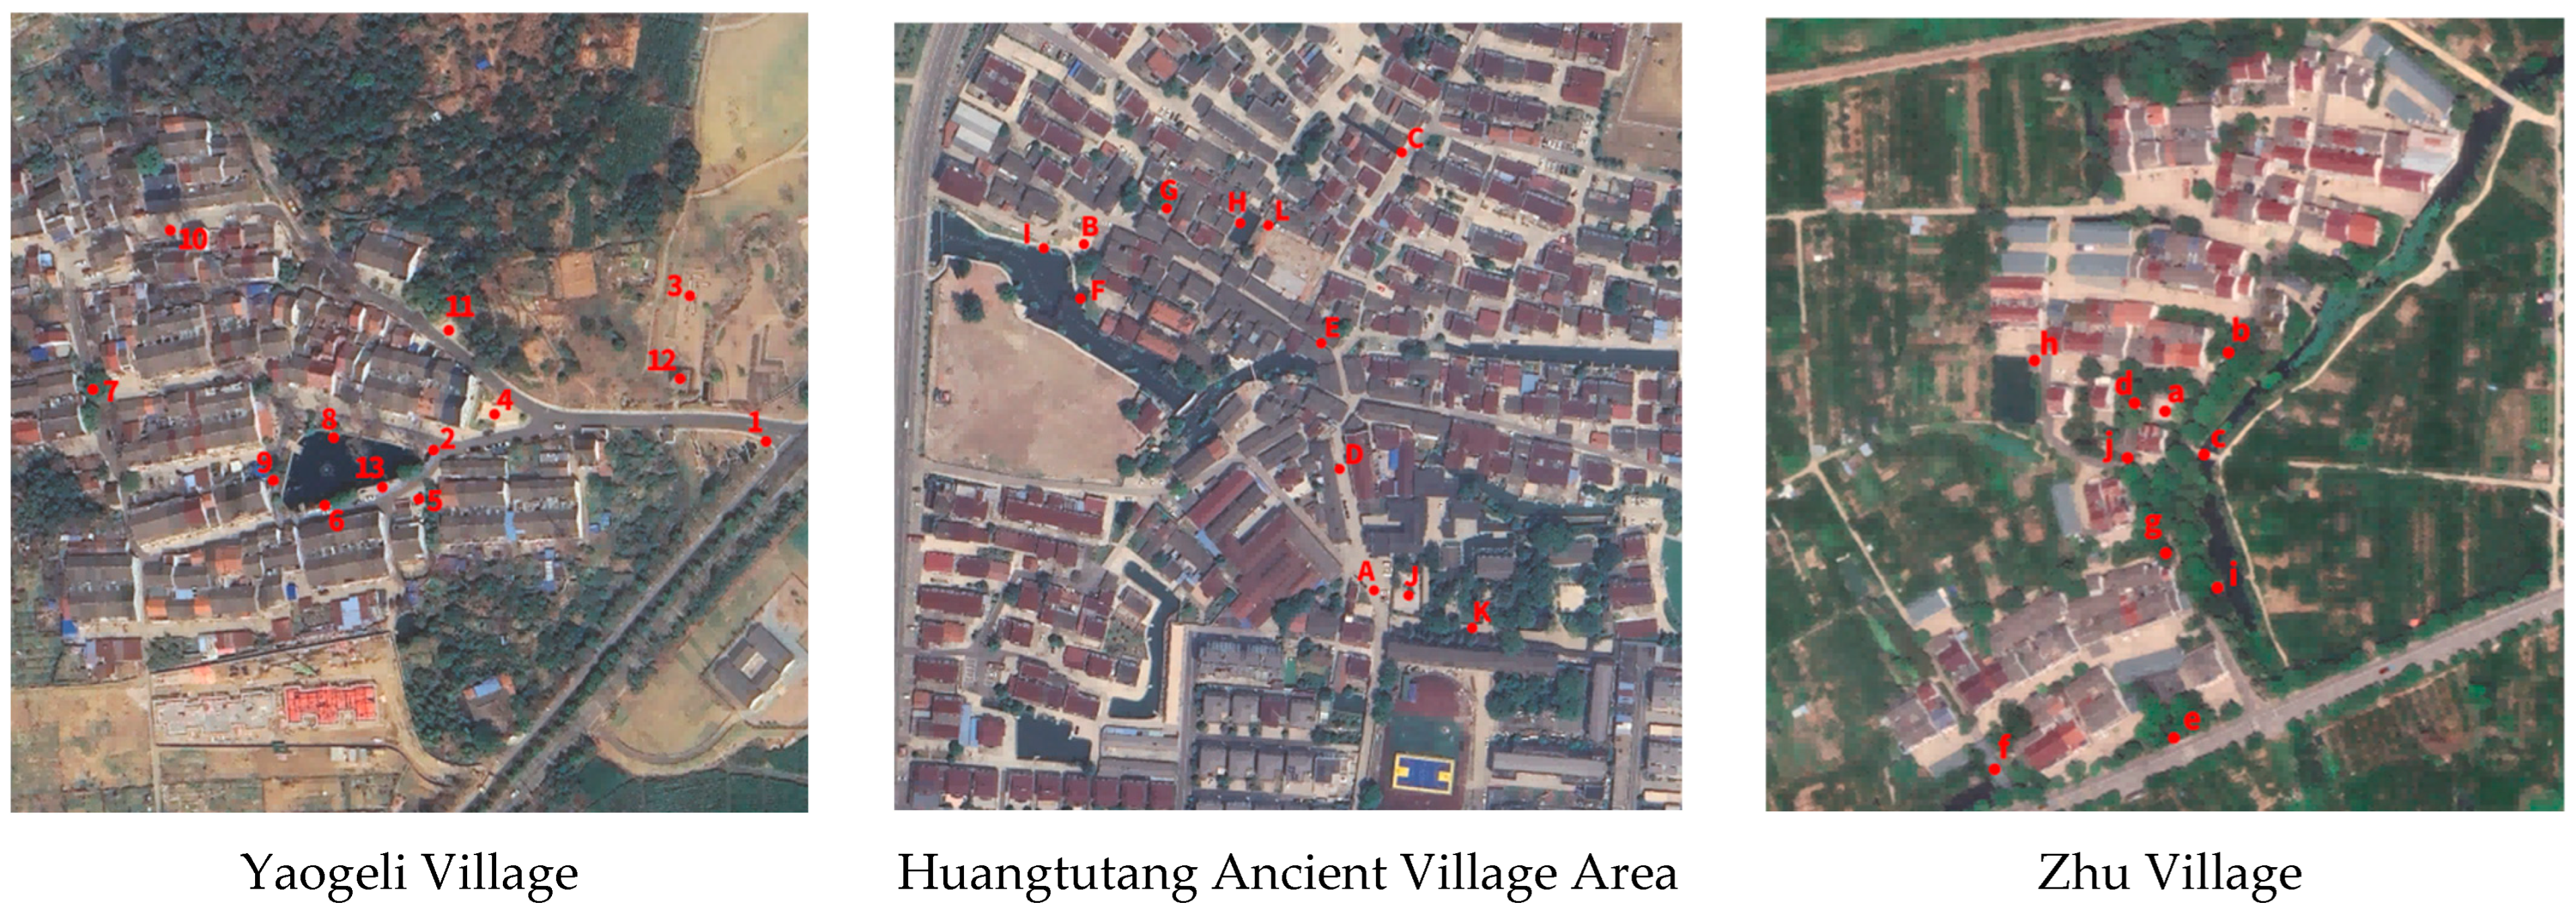
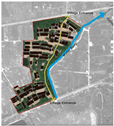
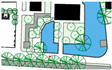
Measurement points were arranged according to the spatial configurations of public spaces within each village (Figure 1). In Yaogeli Village, the overall terrain gradually rises from south to north, while the internal spaces remain relatively flat. Public spaces are mainly concentrated at the village entrance and around the central pond. Residential streets radiate outward from the pond, forming two primary activity zones. Accordingly, measurement points were distributed to cover representative spaces including the village entrance, main streets, and areas surrounding the pond.
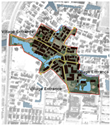
Figure 1.
Layout of Monitoring Points in the Three Villages.
Huangtutang Ancient Village is characterized by relatively flat terrain. A linear river running east–west traverses the village and, together with north–south streets, forms the primary spatial framework of the settlement. Public spaces are distributed along this spatial structure. Measurement points were therefore mainly arranged along riverside streets as well as at typical spatial nodes, such as the historic street at the main village entrance and the memorial park.
Zhu Village is also located on relatively flat terrain. The residential settlement is situated near a north–south river on the eastern side, while the main road lies between the river and the settlement area. Public spaces are primarily distributed along the main road and around nearby ponds. Measurement points were placed to cover the main road space and activity nodes adjacent to water bodies.
Considering both the physical attributes and social functions of rural public spaces [28], these spaces can be categorized into three types based on their degree of openness: open spaces, semi-open spaces, and semi-private spaces [29]. Taking into account the distinct topographical characteristics and spatial structures of the three villages, 11–13 measurement points were selected in each village, resulting in a total of 36 measurement locations. Microclimate data were collected using a combination of sequential mobile measurements and short-term fixed-point readings. The measurements collectively covered the representative spatial types of rural public spaces in Wuxi, and the time interval between different measurement points was controlled within one hour.
2.3.2. Spatial Characteristic Indicators of Measurement Points
To identify representative spatial elements influencing thermal comfort in rural public spaces, three key variables were selected: Sky View Factor (SVF), distance to water, and surface material, representing the geometric, environmental, and surface dimensions of the space, respectively [12,30,31]. Spatial attributes at each measurement point were quantified, including shading intensity and waterfront characteristics.
In this study, SVF was used to quantify the degree of spatial enclosure and shading. Proximity to water was characterized using a scaled distance index (δ). To account for the combined influence of both distance to water and water body size on thermal comfort [30], the effective characteristic length of the water body was defined as Leff, and the scaled distance was calculated as:
where d represents the horizontal straight-line distance from the measurement point to the nearest water shoreline. A smaller value of δ indicates either closer proximity to water or a larger water body.
δ = d/Leff
For areal water bodies, the equivalent area-based characteristic length was calculated as:
where A denotes the water surface area. For linear water bodies, the characteristic length was defined as:
where W is the river width.
Leff = W/2
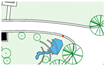
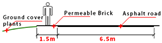
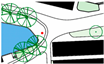
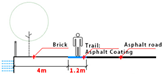
Surface interface materials within a 5 m radius of each measurement point were classified to facilitate subsequent thermal comfort comparisons (Table 3, Table 4 and Table 5).
Table 3.
Basic Information of the Three Types of Public Spaces in Yaogeli Village.
Table 4.
Basic Information of the Three Types of Public Spaces in Huangtutang Ancient Village Area.
Table 5.
Basic Information of the Three Types of Public Spaces in Zhu Village.
2.3.3. Measurement Time
According to meteorological records from 2011 to 2024, summer weather conditions in Wuxi are generally characterized by persistent high temperatures. The daily maximum temperature during summer typically ranges from 32 to 34 °C, with an average air temperature of approximately 26–28 °C. In July, the average sunshine duration reaches about 157 h, and precipitation is relatively concentrated. Hot and sunny conditions occur frequently, leading to increased human thermal load. Therefore, field measurements were conducted during representative summer days characterized by clear skies and high temperatures.
The measurements were carried out from 3 to 5 July 2025, between 9:00 and 18:00, covering three consecutive days with nine hours of observation each day. Data obtained from the mobile measurements were aggregated to the nearest hourly interval. For comparative analysis among the three villages, the average values from the three-day measurements were calculated and used as the hourly data for each measurement point.
Previous studies have indicated that multi-day continuous monitoring under typical meteorological conditions can effectively capture the characteristics of outdoor thermal environments. Therefore, the selected measurement period in this study can be considered representative [7,32].
2.3.4. Thermal Comfort Questionnaire
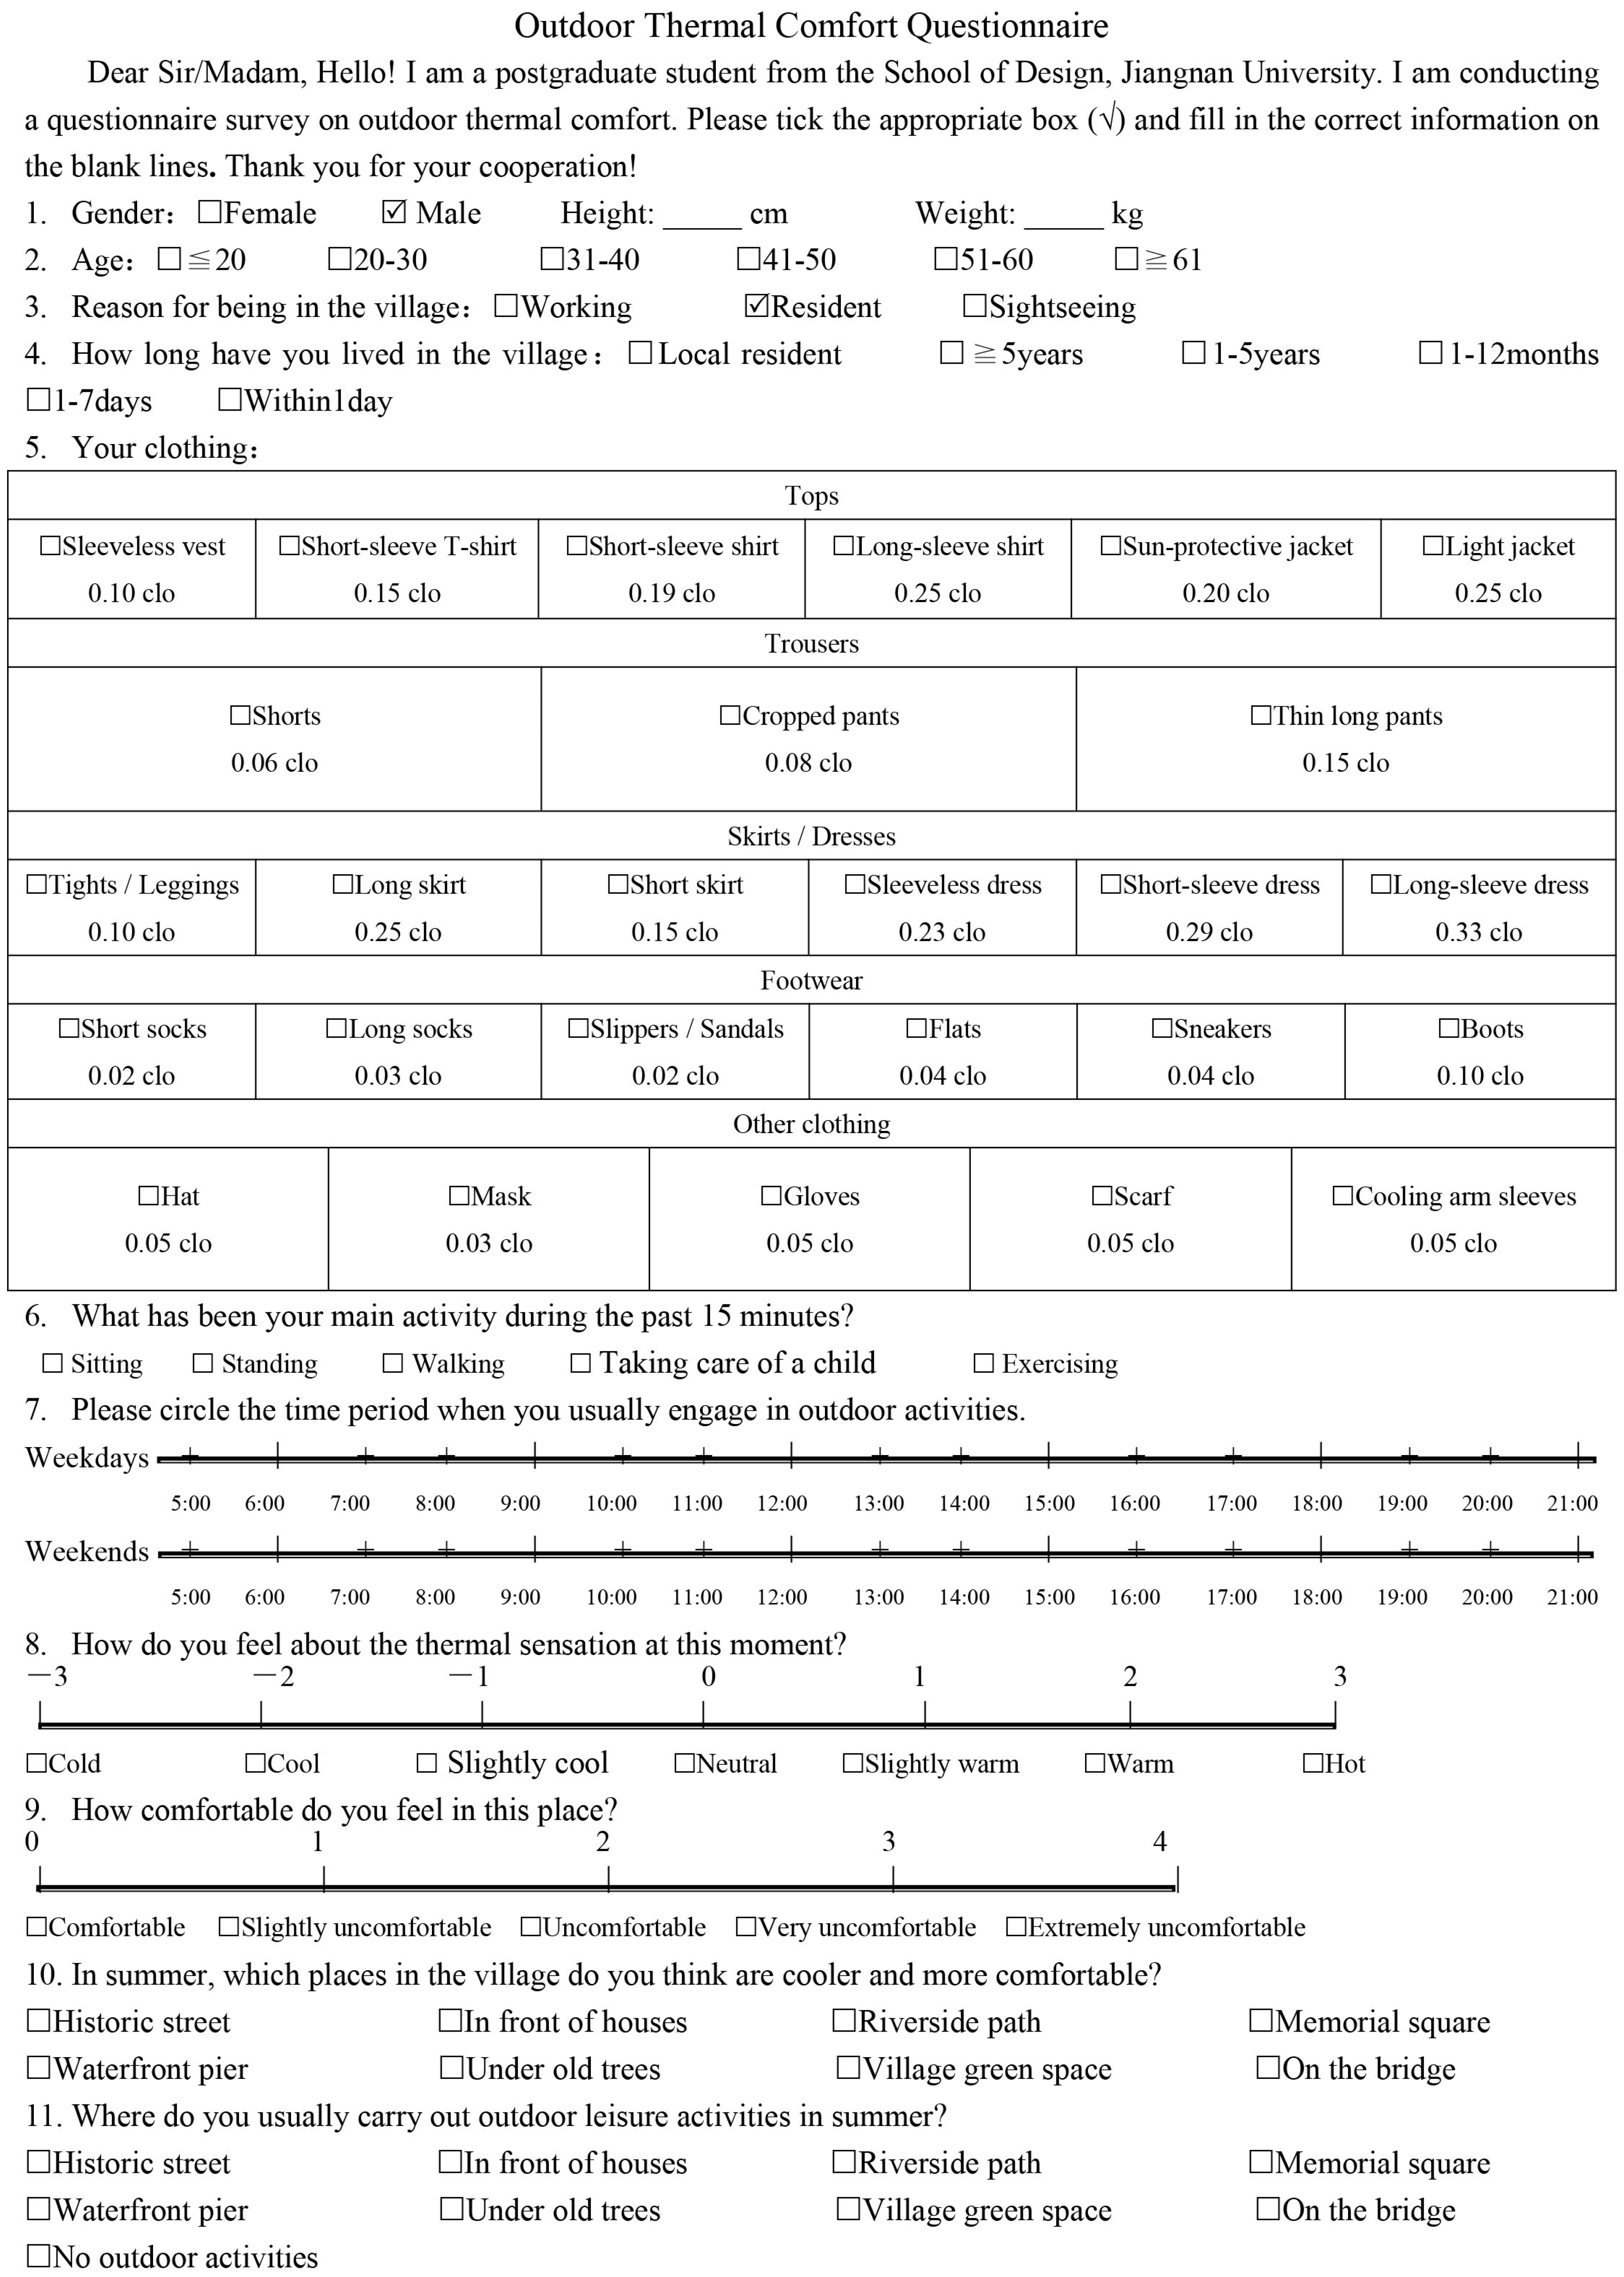
The questionnaire survey consisted of two main sections. The first section collected respondents’ basic demographic information, including gender, body weight, height, age, and clothing conditions, which were used to estimate the average clothing insulation parameters required for the calculation of Physiological Equivalent Temperature (PET). The second section focused on respondents’ thermal perception, including thermal sensation and thermal comfort at each measurement point (Appendix A).
During the microclimate measurements at each site, respondents who were engaging in activities or temporarily staying within the surveyed spaces were invited by investigators to complete the questionnaire. This approach ensured temporal consistency between subjective thermal perception and the objectively measured microclimatic conditions.
Thermal sensation was assessed using the seven-point scale recommended by the American Society of Heating, Refrigerating and Air-Conditioning Engineers (ASHRAE), and the responses were quantified as Thermal Sensation Vote (TSV). Thermal comfort was evaluated using a five-point scale to obtain the Thermal Comfort Vote (TCV). The questionnaire design also referred to established methodologies commonly used in outdoor thermal comfort surveys [33,34].
3. Analysis of Measurement Results
3.1. Microclimate Measurement Results
3.1.1. Instantaneous Wind Speed (Va)
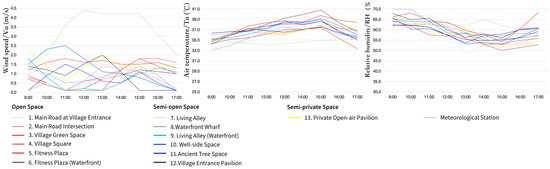
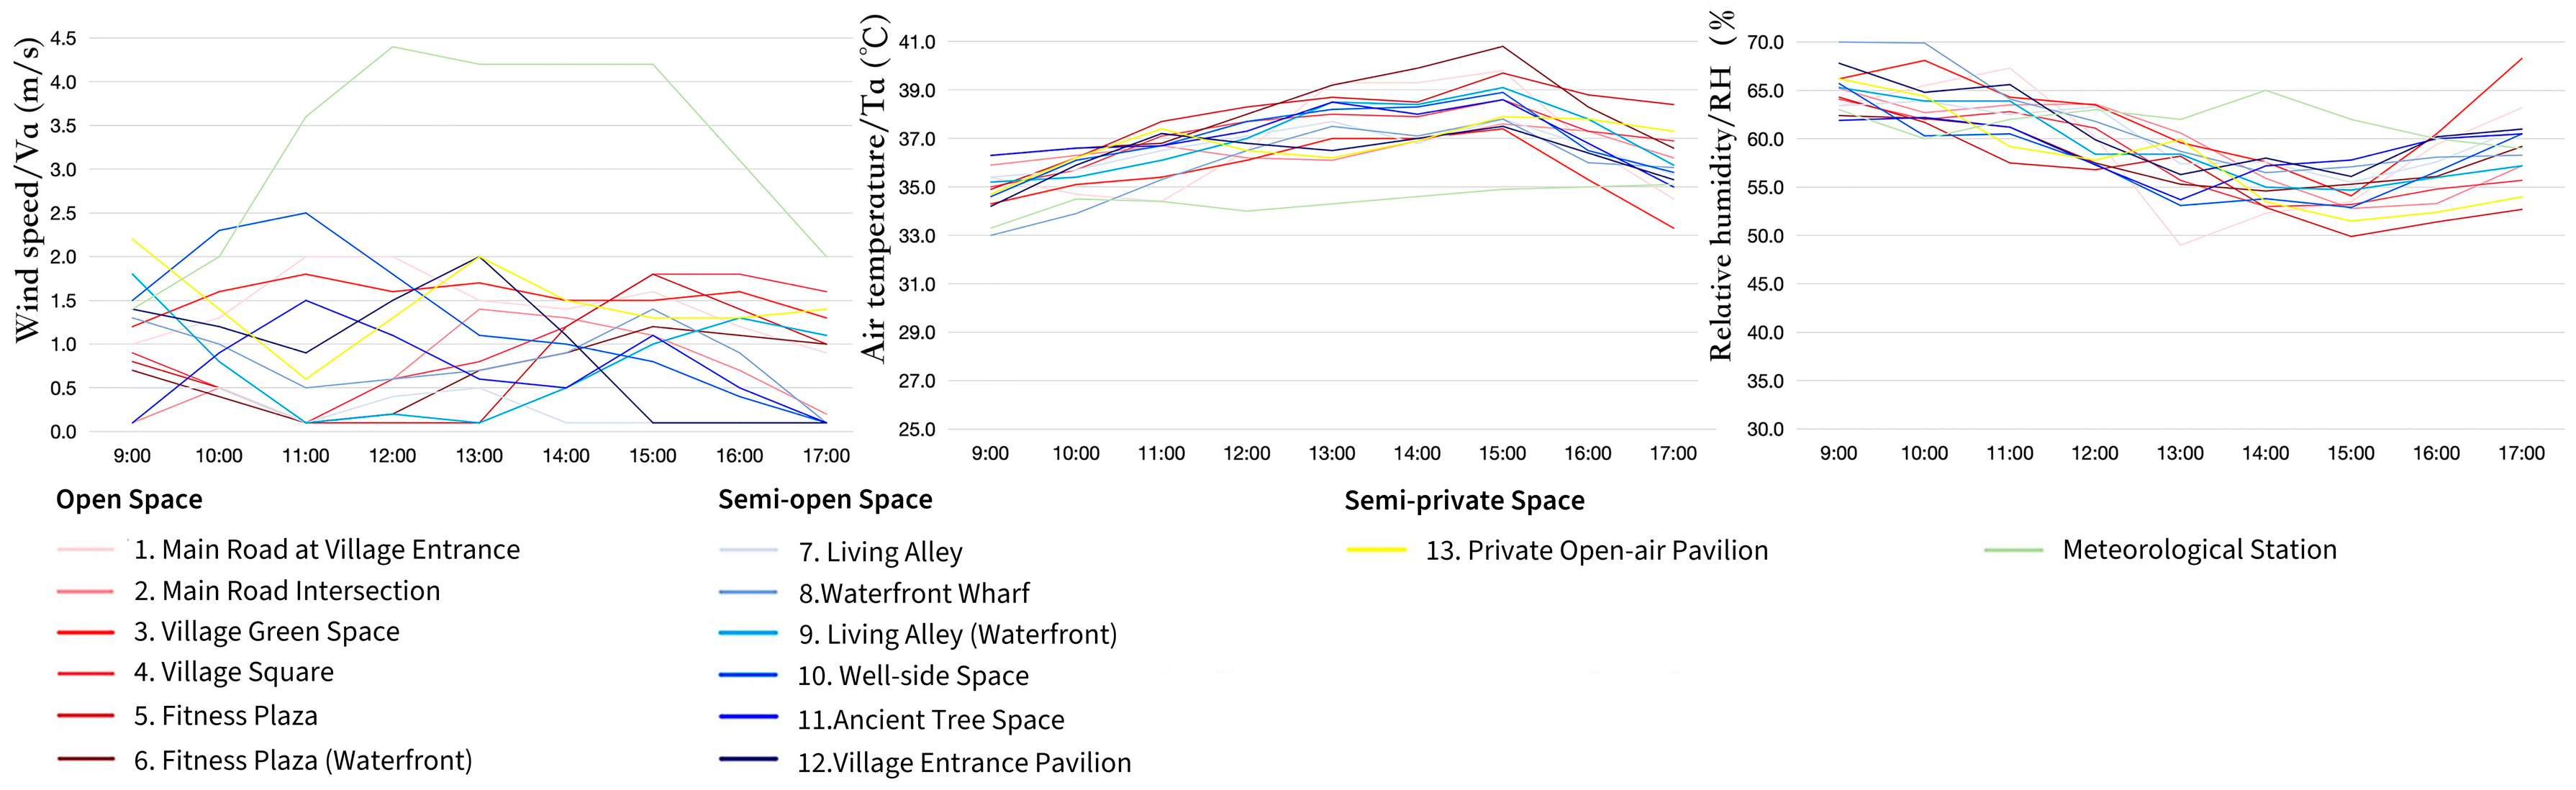
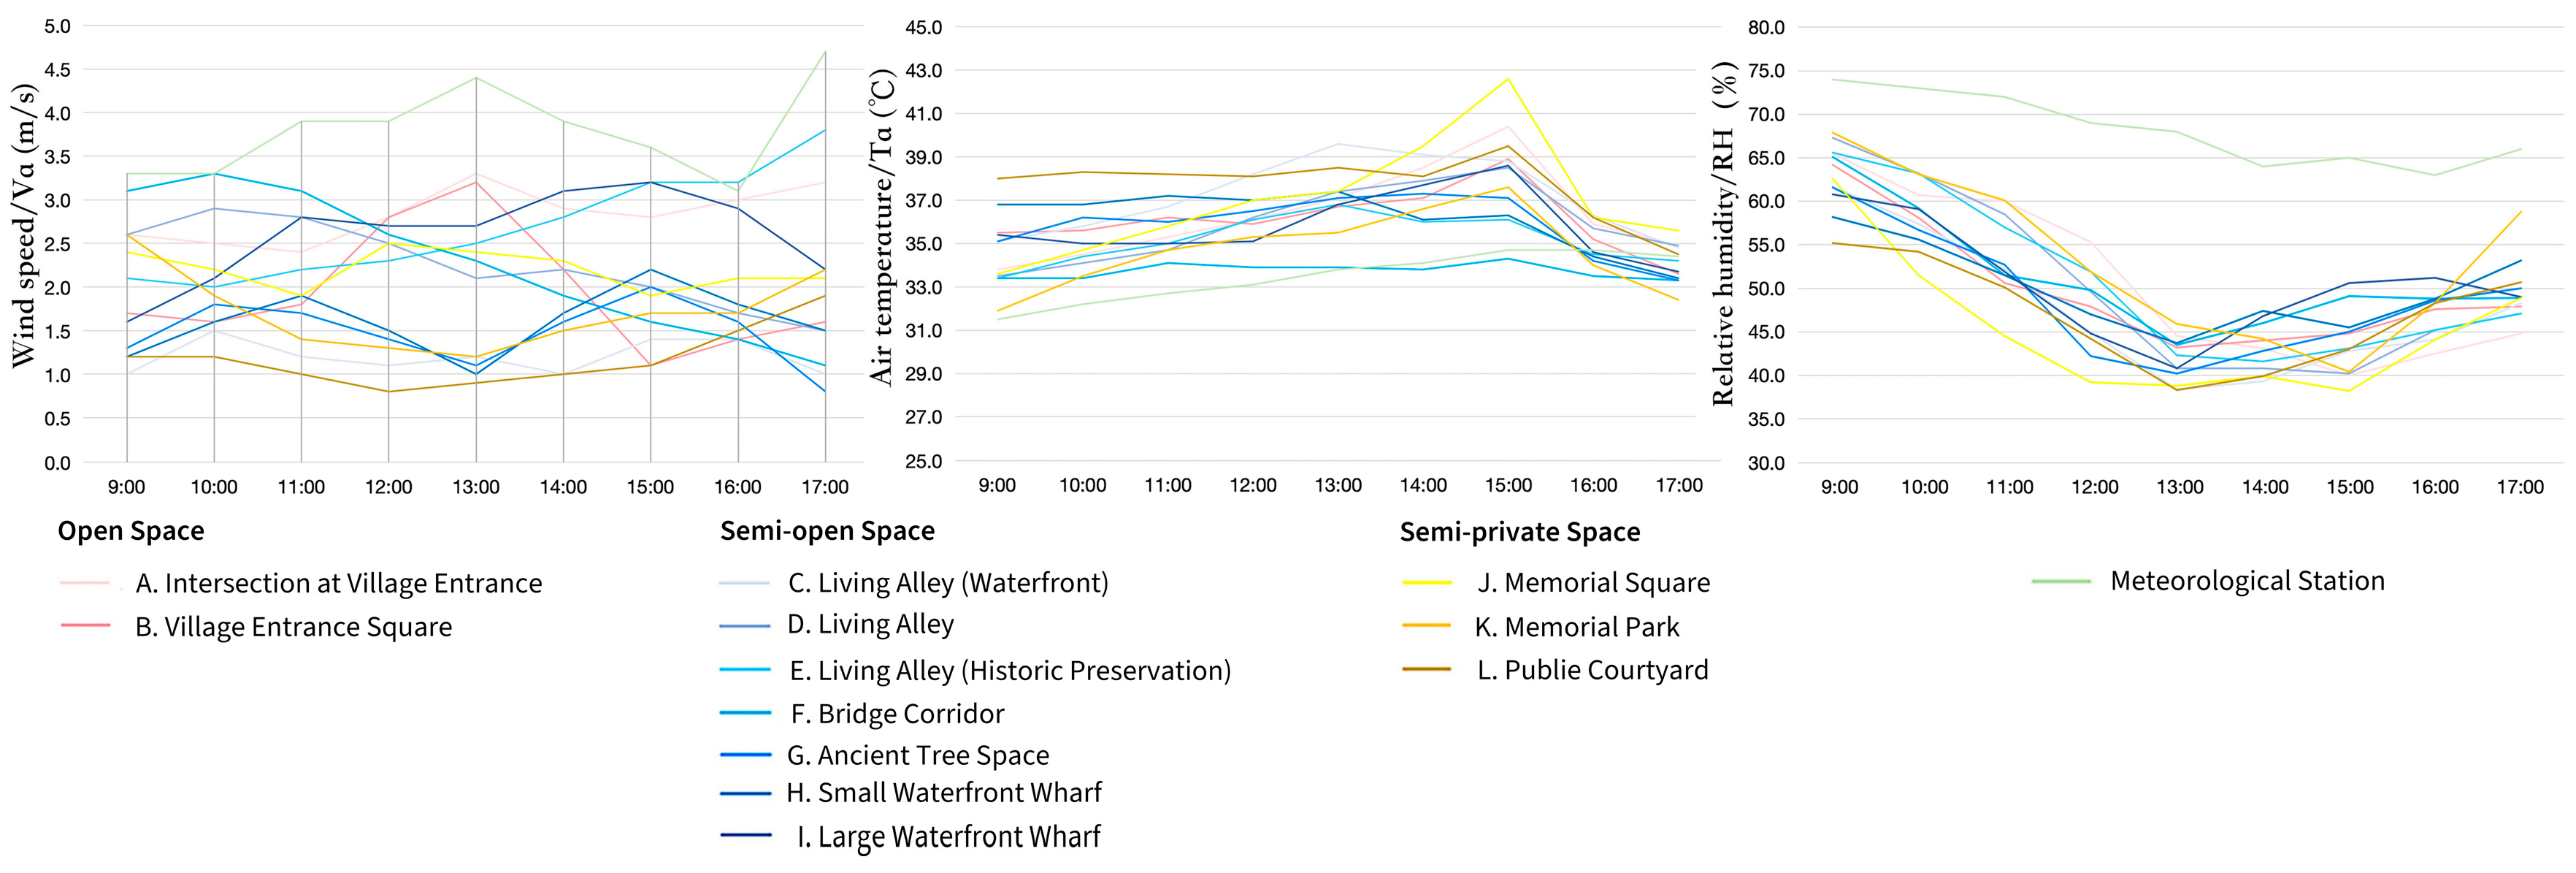
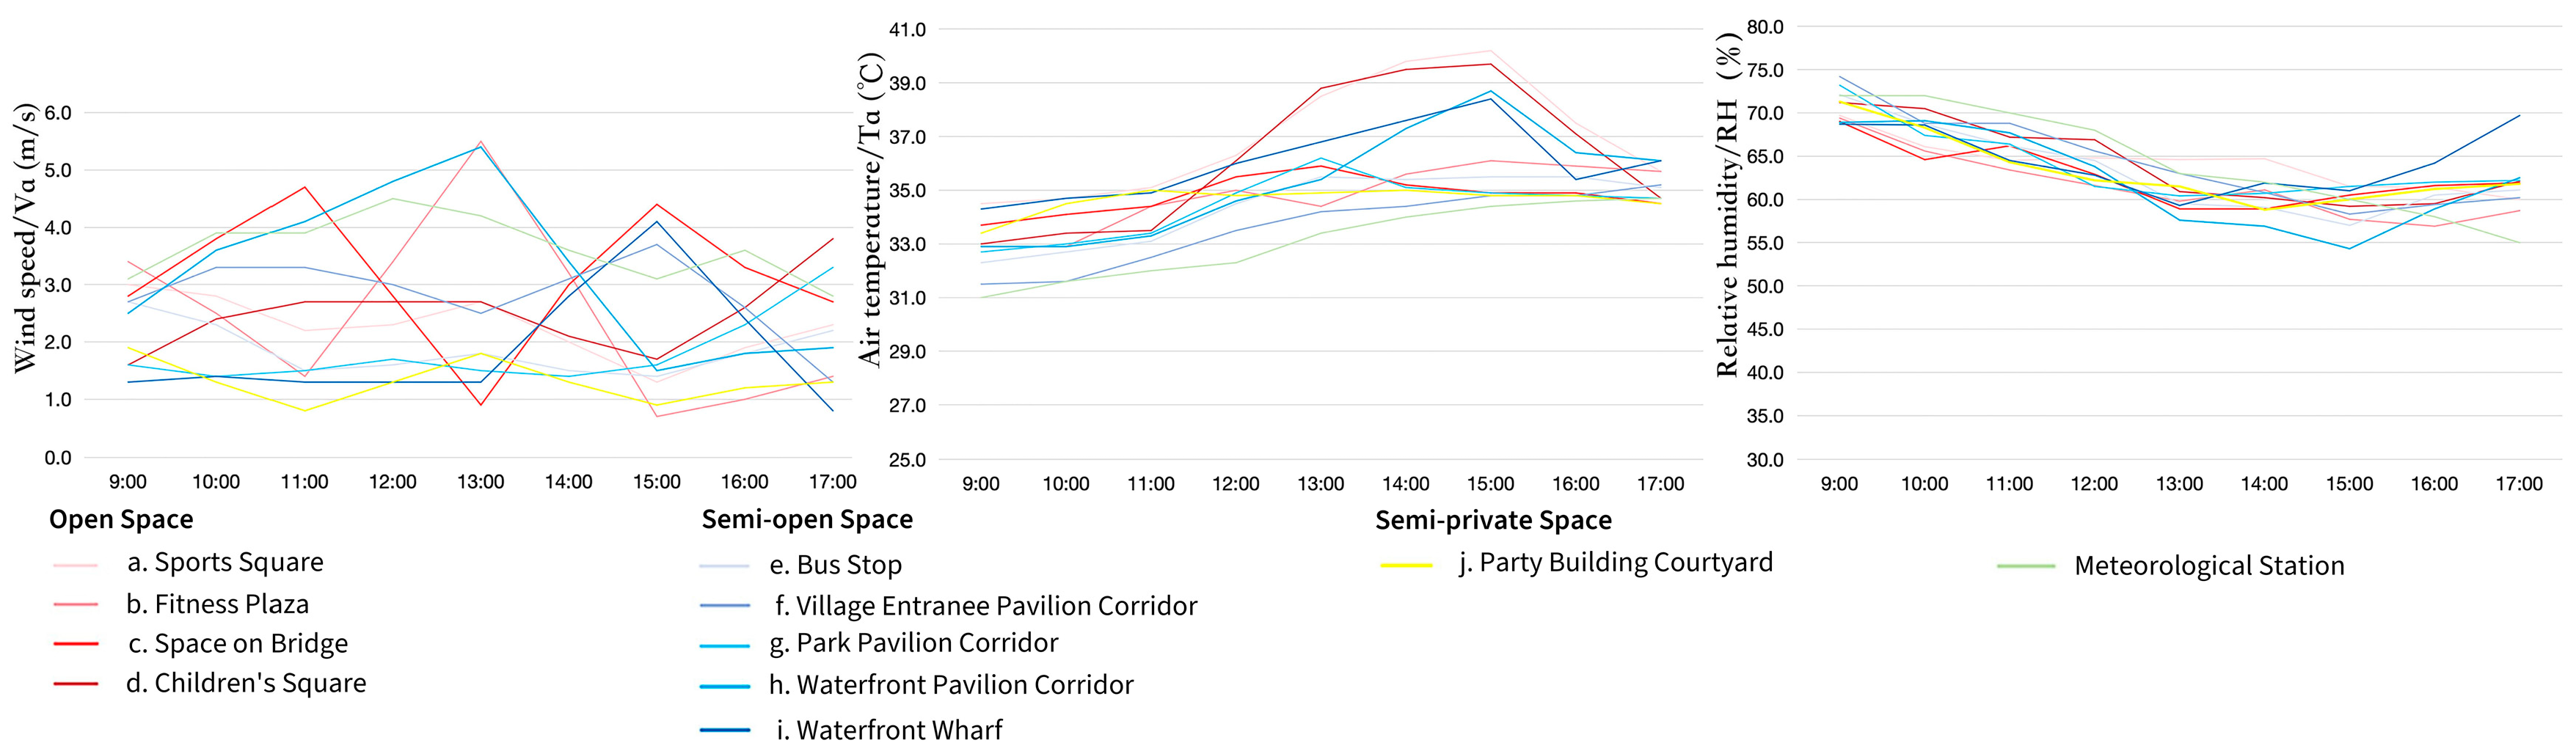
Field measurements revealed a clear diurnal variation in wind speed across the three villages, characterized by lower values in the morning, increasing speeds in the afternoon, and a decline toward the evening (Figure 2, Figure 3 and Figure 4). Notable inter-village differences were observed. Zhu Village consistently recorded the highest wind speeds, followed by Huangtutang Ancient Village Area, while Yaogeli Village exhibited the lowest overall values.
Figure 2.
Meteorological Data Variation at Each Monitoring Point in Yaogeli Village.
Figure 3.
Meteorological Data Variation at Each Monitoring Point in Huangtutang Ancient Village Area.
Figure 4.
Meteorological Data Variation at Each Monitoring Point in Zhu Village.
In Zhu Village, wind speeds at open square and road sites (Sites a and c) reached approximately 3.5–4.0 m/s during the afternoon period. In Huangtutang Ancient Village Area, the interconnected water network contributed to relatively stable wind conditions, with overall speeds ranging from 1.5 to 2.5 m/s. Owing to the corridor effect along the waterfront, wind speed at the wharf (Site J) peaked at 2.8 m/s at 14:00. In contrast, most sites in Yaogeli recorded wind speeds below 1.5 m/s. The shaded location beneath mature trees (Site 7, SVF = 0.118) maintained particularly low values, remaining near 0.8 m/s throughout the day.
These results suggest that spatial openness and ventilation corridor effects play a dominant role in shaping local wind environments.
3.1.2. Air Temperature (Ta)
Air temperature in the three villages exhibited a typical diurnal pattern, increasing in the morning, reaching a maximum at approximately 14:00–15:00, and declining toward the evening (Figure 2, Figure 3 and Figure 4). However, notable differences were observed in peak temperature levels. Yaogeli recorded the highest values, followed by Zhu Village, while Huangtutang Ancient Village Area consistently exhibited the lowest peak temperatures.
At the village entrance and square sites in Yaogeli (Sites 1 and 4, SVF ≈ 0.9), peak temperatures exceeded 39 °C, approximately 1.0–1.5 °C higher than corresponding locations in Huangtutang Ancient Village Area and Zhu Village. In Zhu Village, the square site (Site a) reached a peak of 38.5 °C; however, the duration of peak temperature was relatively short, likely due to enhanced ventilation. In contrast, Huangtutang Ancient Village Area demonstrated more stable thermal conditions. Influenced by the cooling and buffering effects of adjacent water bodies and vegetation, peak temperatures at most sites remained around 37 °C.
These findings indicate that spatial context and environmental configuration significantly influence thermal accumulation. Hilly or relatively enclosed environments tend to facilitate heat retention, whereas river-network environments provide a moderating effect on peak air temperature.
3.1.3. Relative Humidity (RH)
Relative humidity in the three villages exhibited an inverse diurnal trend compared to air temperature, with higher values in the morning, decreasing levels in the afternoon, and partial recovery toward the evening (Figure 2, Figure 3 and Figure 4). Inter-village differences were evident: Huangtutang recorded the highest overall humidity levels, Zhu showed intermediate values, and Yaogeli exhibited the lowest.
In Huangtutang, afternoon relative humidity remained relatively stable at approximately 50%. In Zhu, humidity decreased to a minimum of 45% at the square site but remained above 50% at riverside locations (Sites g and i). In Yaogeli, relative humidity declined to a minimum of 43% at the village entrance; however, levels remained above 50% near the pond (Sites 6, 8, and 13), likely influenced by evaporative effects from adjacent water surfaces.
These results suggest that water bodies and vegetation contribute to localized moisture retention, whereas relatively enclosed or leeward hilly environments are more susceptible to pronounced afternoon humidity reductions.
3.2. Results and Calculation of Thermal Comfort Survey
3.2.1. Thermal Comfort Questionnaire Survey
A total of 192 valid questionnaires were collected, including 65 from Yaogeli, 64 from Huangtutang, and 63 from Zhu. Respondents comprised both local residents and tourists; 42% were male and 58% were female, with middle-aged and elderly individuals representing the predominant age group.
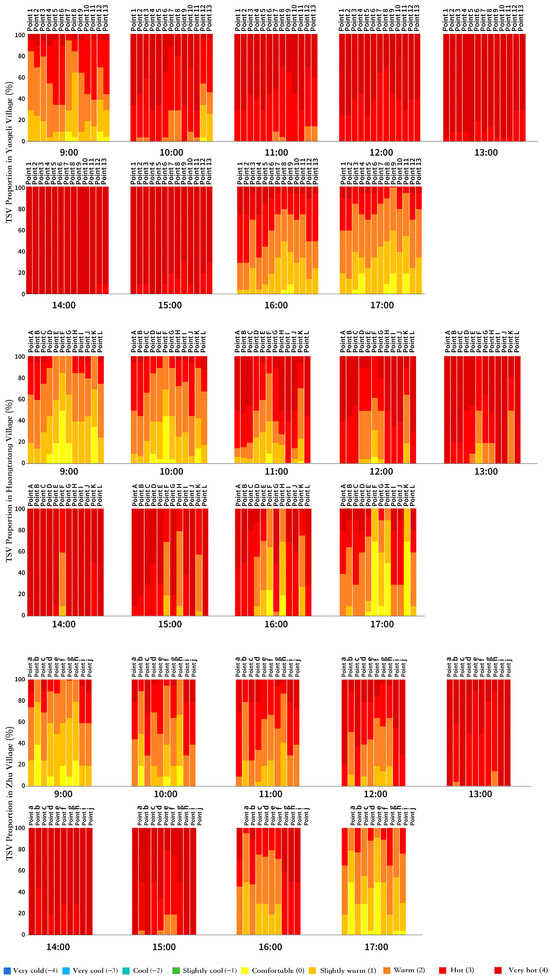
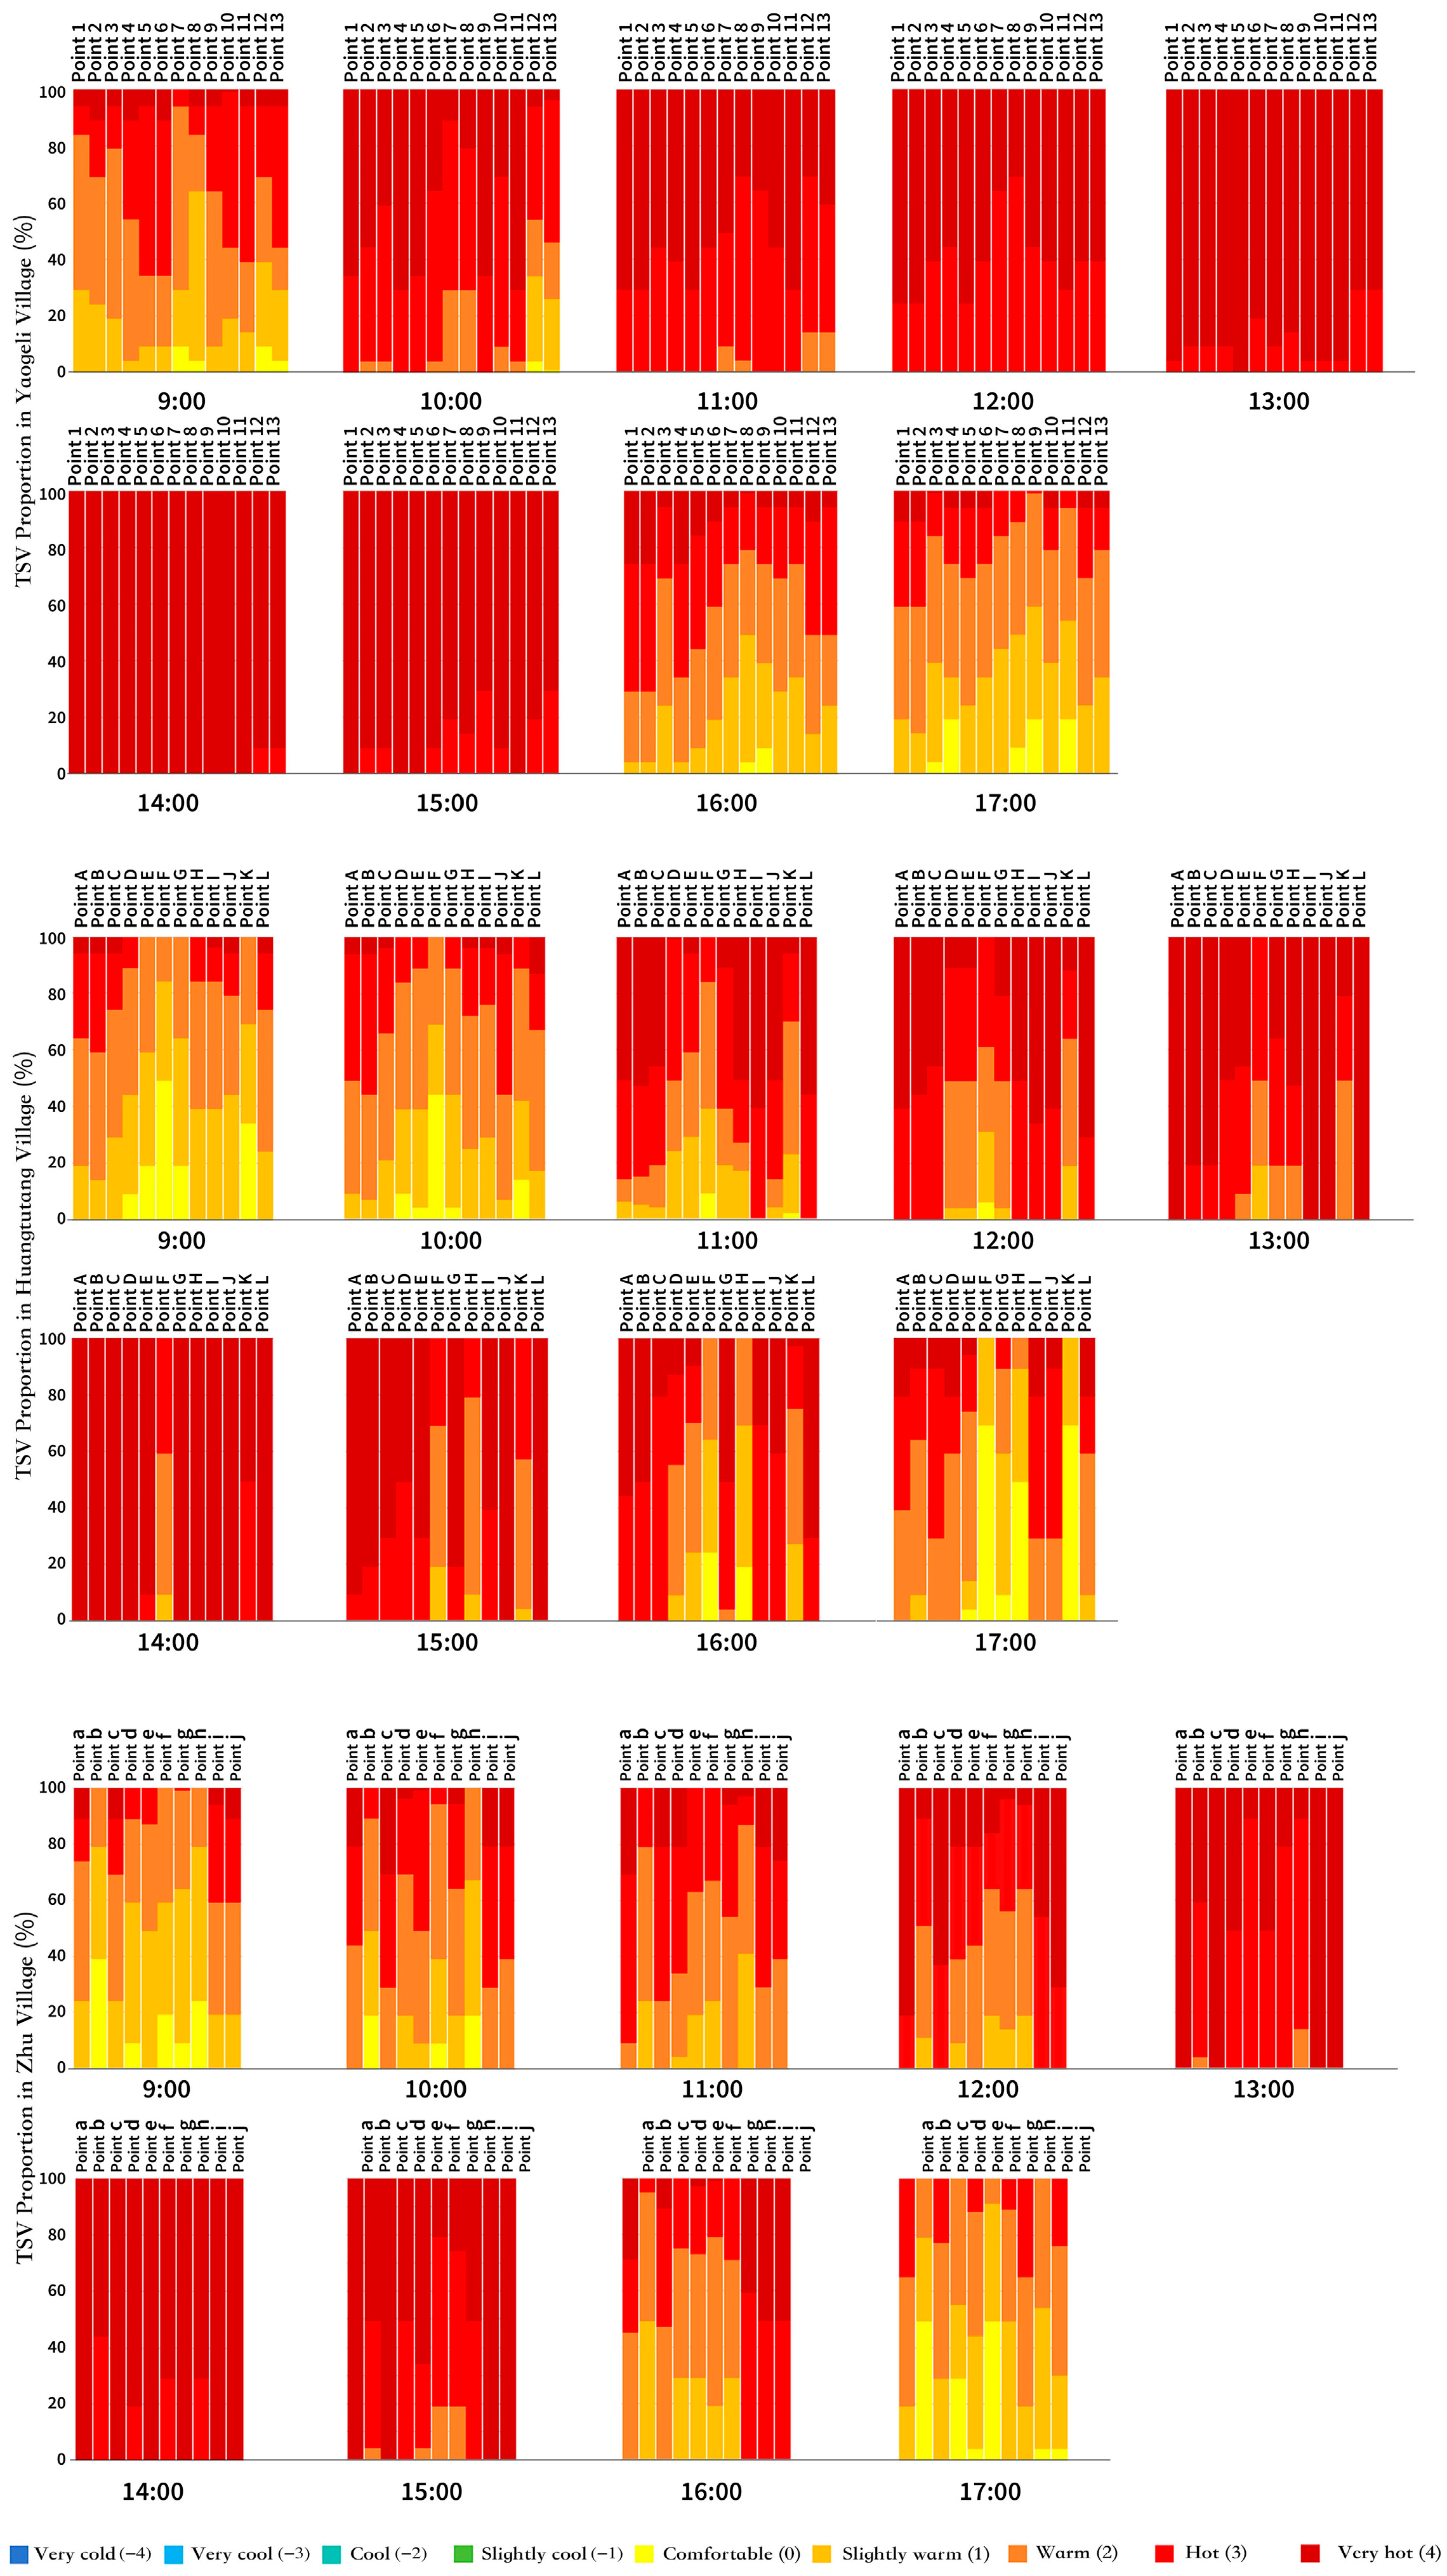
Overall, summer thermal sensation votes (TSV) were primarily concentrated in the “slightly warm” category (TSV = 2), accounting for approximately 35–40% of responses, followed by “warm” (TSV = 3) at about 25–30%. The proportion of “neutral” responses (TSV = 0) remained below 20%, indicating a generally warm perception of outdoor conditions.
Temporal variation was evident. During the morning period (9:00–11:00), 5–10% of respondents reported “slightly cool” (TSV = −1). As the air temperature increased toward midday and afternoon, thermal discomfort intensified. The combined proportion of “warm” and “hot” (TSV ≥ 3) exceeded 50%, reflecting concentrated exposure to high thermal stress (Figure 5). Overall, thermal neutrality in rural public spaces during summer was limited, and heat-related discomfort was prominent.
Figure 5.
Thermal Sensation Vote Results for Each Village.
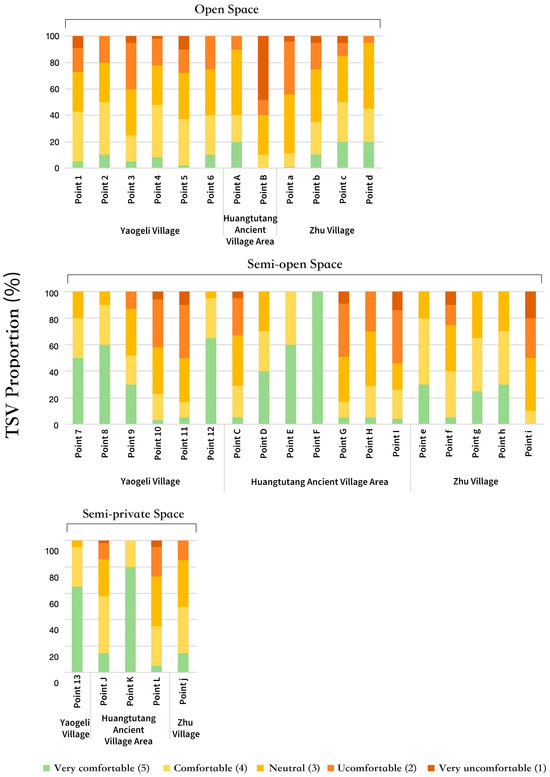
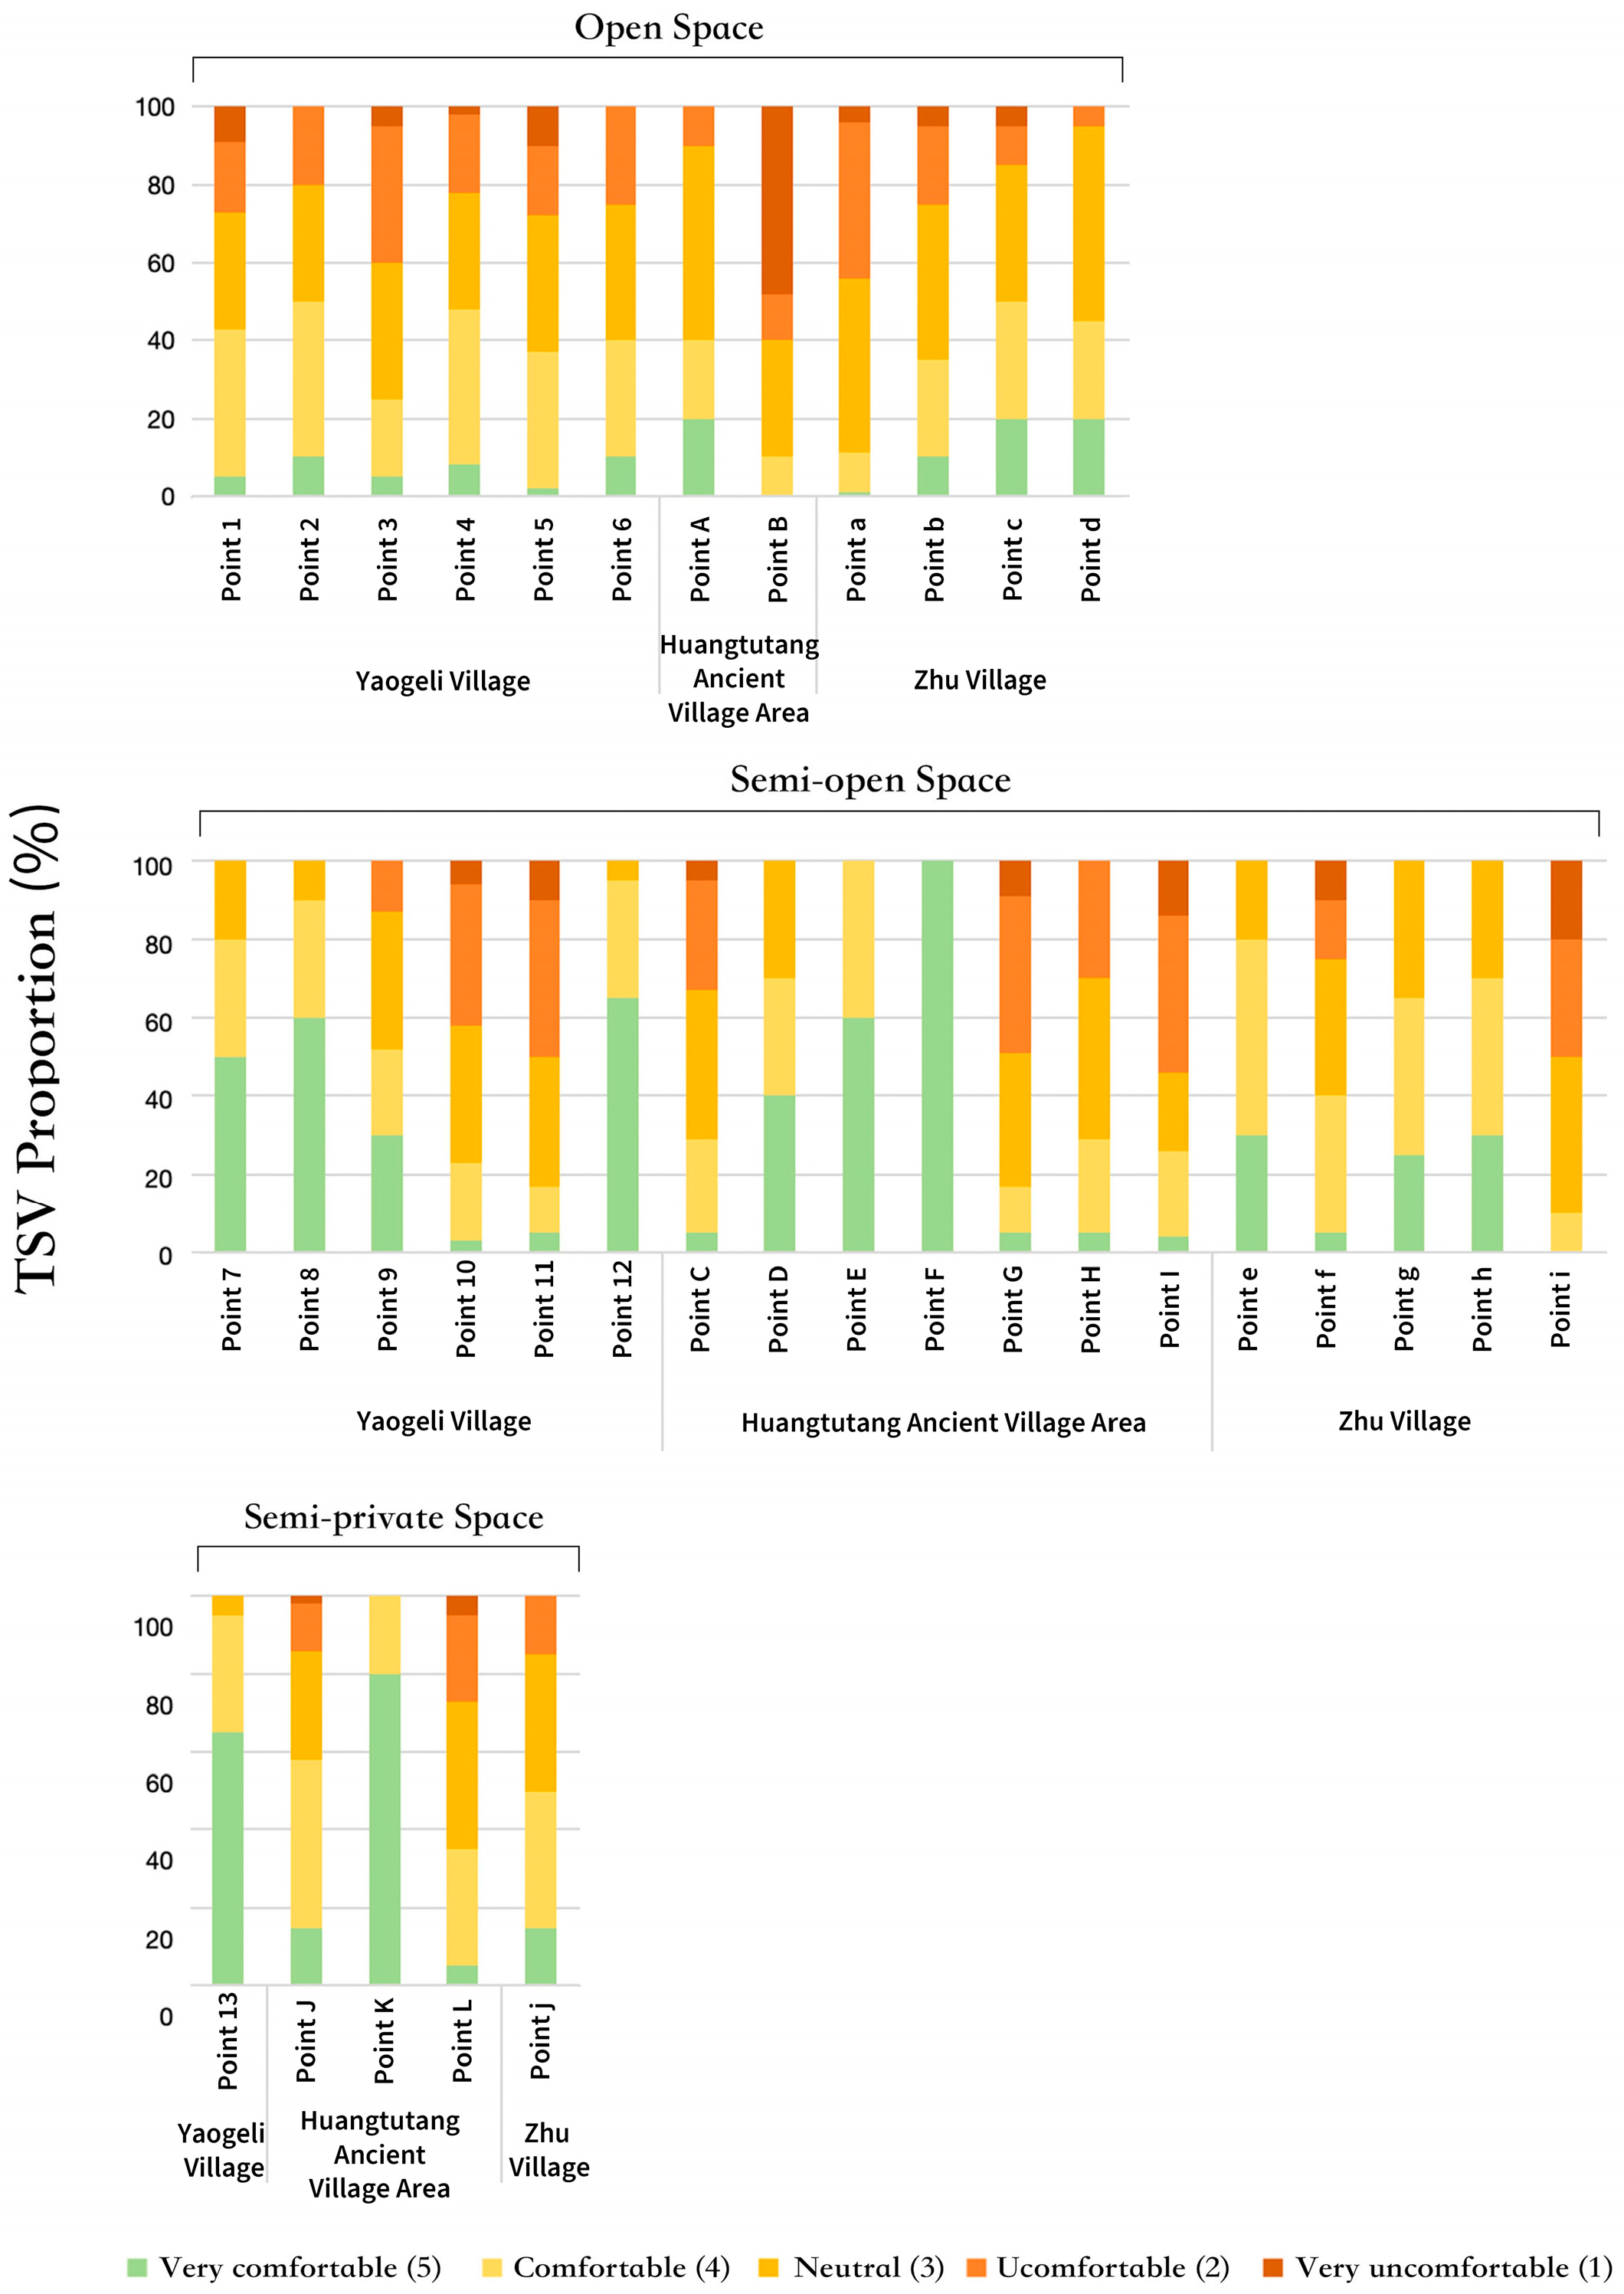
From the perspective of thermal comfort votes (TCV) (Figure 6), the share of “comfortable” and “slightly comfortable” responses reached 40–45% during the morning and evening periods. In contrast, between 12:00 and 15:00, the combined proportion of “uncomfortable” and “very uncomfortable” responses rose sharply to over 60%, identifying this interval as the most thermally stressful period of the day.
Figure 6.
Thermal Sensation Vote Results for Each Different Types of Spaces.
Notably, even in certain shaded spaces, 20–25% of respondents still reported discomfort, suggesting that shading alone may be insufficient to ensure satisfactory thermal conditions. In addition, site-specific management factors—such as the placement of trash bins at ventilation outlets—were observed to obstruct airflow and potentially aggravate localized thermal stress.
Clear differences were also found among spatial typologies. Open squares and road spaces, characterized by extensive hard paving and limited shading, exhibited the highest levels of thermal discomfort, with the combined proportion of “warm” and “hot” responses exceeding 65%. Semi-open alleys and courtyard spaces, shaded by both buildings and vegetation, showed a concentration of responses in the “slightly warm” and “neutral” categories, indicating comparatively higher comfort levels. Waterfront spaces received a greater proportion of “slightly cool” (TSV = −1) responses in the evening (nearly 15%), reflecting their relative cooling advantage.
3.2.2. Thermal Comfort Index Calculation
Physiologically Equivalent Temperature (PET) at each measurement site was calculated using the RayMan model. Clothing insulation was set to the mean value derived from the questionnaire survey (0.39 clo). Based on questionnaire responses and on-site observations, most respondents were engaged in low- to moderate-intensity outdoor activities, including sitting, slow walking, short conversations, and light hiking. Accordingly, a representative metabolic rate of 75 W·m−2 was uniformly adopted for PET calculation.
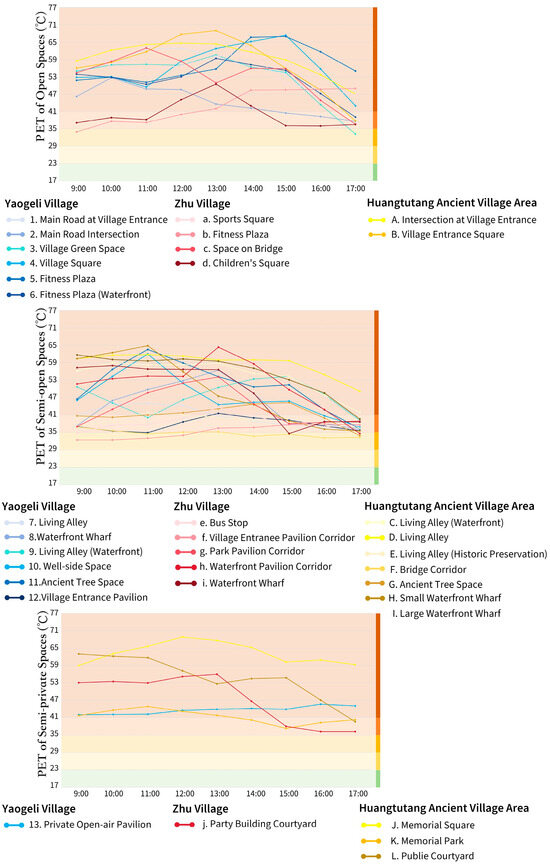
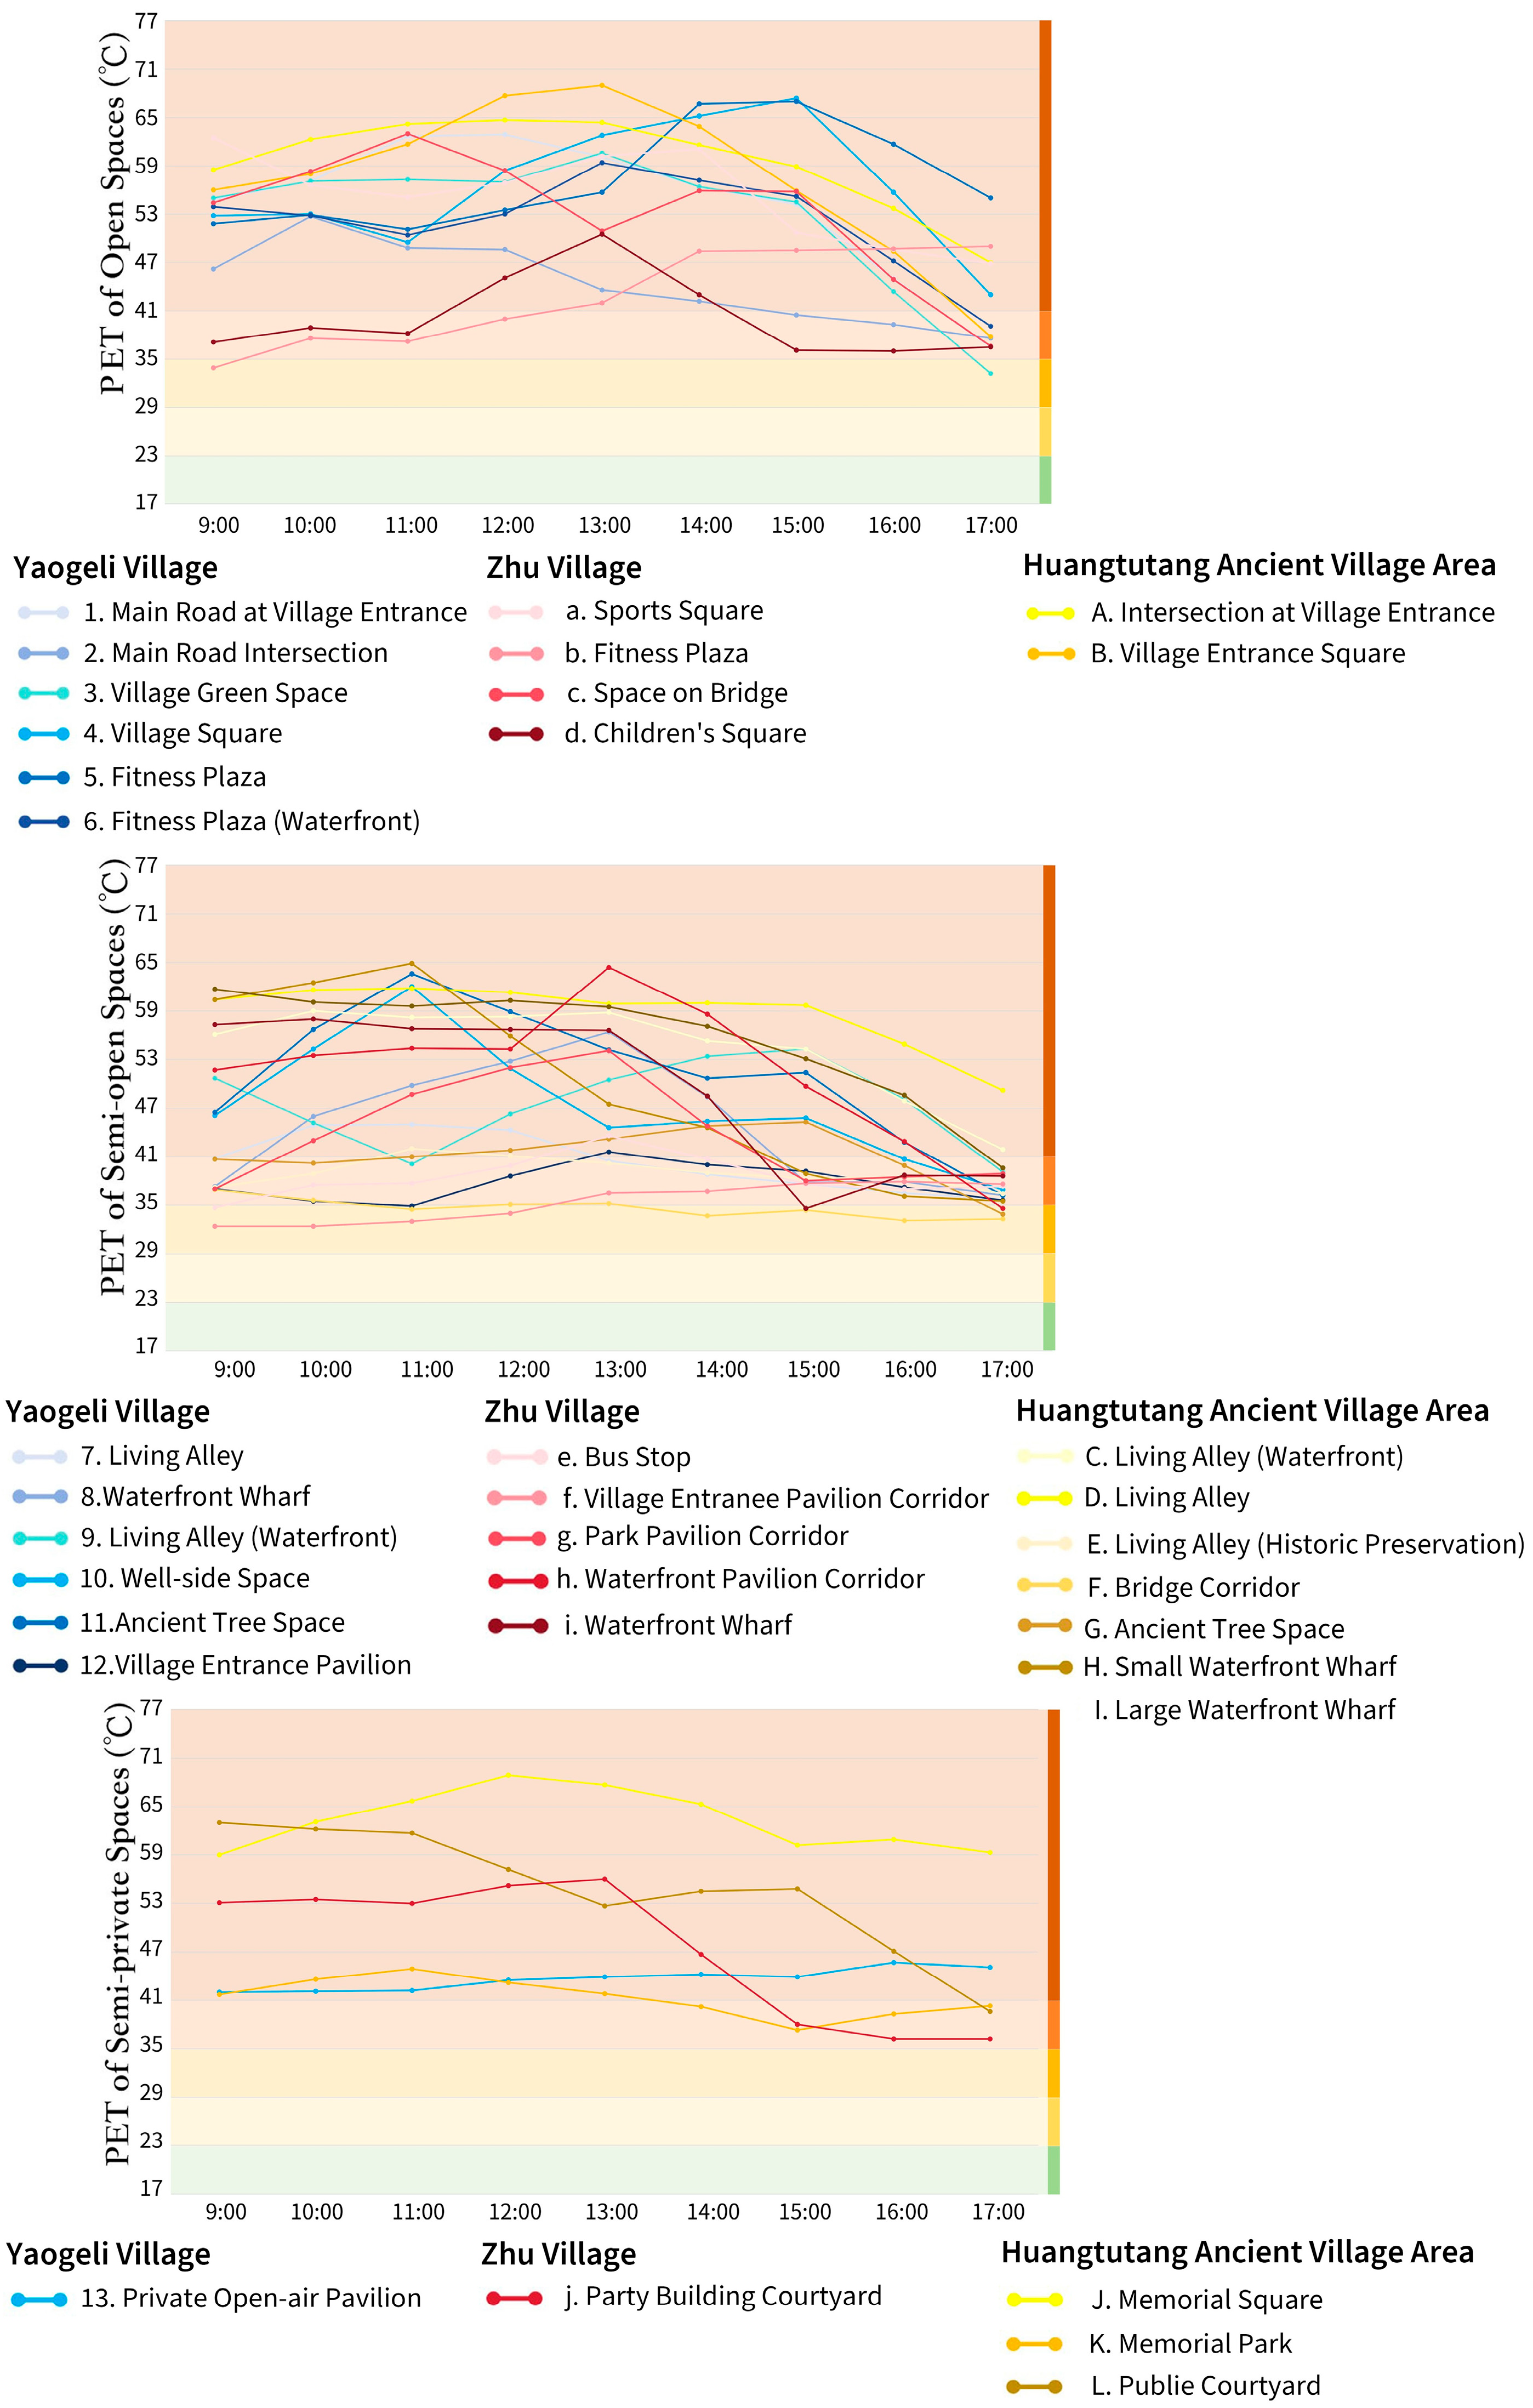
As illustrated in Figure 7, PET values across different spatial types substantially exceeded the commonly accepted outdoor thermal comfort range (23–29 °C). Most daytime periods were classified within the “hot” to “extremely hot” categories, indicating pronounced heat stress in village public spaces during summer.
Figure 7.
Distribution of Physiologically Equivalent Temperature (PET) in Various Types of Spaces During Test Periods.
Open squares and road spaces exhibited the highest PET levels, with peak values approaching 65–70 °C. These spaces remained within extreme heat categories throughout most of the day and represented zones of concentrated thermal exposure.
Semi-open alleys and courtyard spaces showed comparatively lower PET values, generally ranging from 45 to 55 °C. The combined shading effects of buildings and vegetation contributed to moderated thermal conditions relative to fully exposed spaces.
Waterfront spaces demonstrated a noticeable buffering effect. Afternoon PET values were typically 5–10 °C lower than those recorded in open squares, and certain sites declined to 35–40 °C in the evening, reflecting a measurable cooling advantage associated with proximity to water.
Across all spatial types, PET peaked at approximately 14:00 and gradually declined thereafter. The period between 12:00 and 15:00 represented the most thermally stressful interval of the day, consistent with the marked increase in “warm” and “hot” responses observed in the questionnaire results.
At several semi-shaded sites, PET values suggested comparatively improved thermal conditions; however, a substantial proportion of respondents still reported discomfort. This divergence indicates that, under high-temperature conditions, subjective thermal perception may be influenced not only by calculated thermal indices but also by contextual factors such as airflow limitations, radiant heat accumulation, spatial enclosure, and psychological expectations. Consequently, reliance solely on PET may not fully capture perceived thermal comfort in rural public spaces.
3.2.3. Relationship Between Thermal Comfort Index and Thermal Sensation
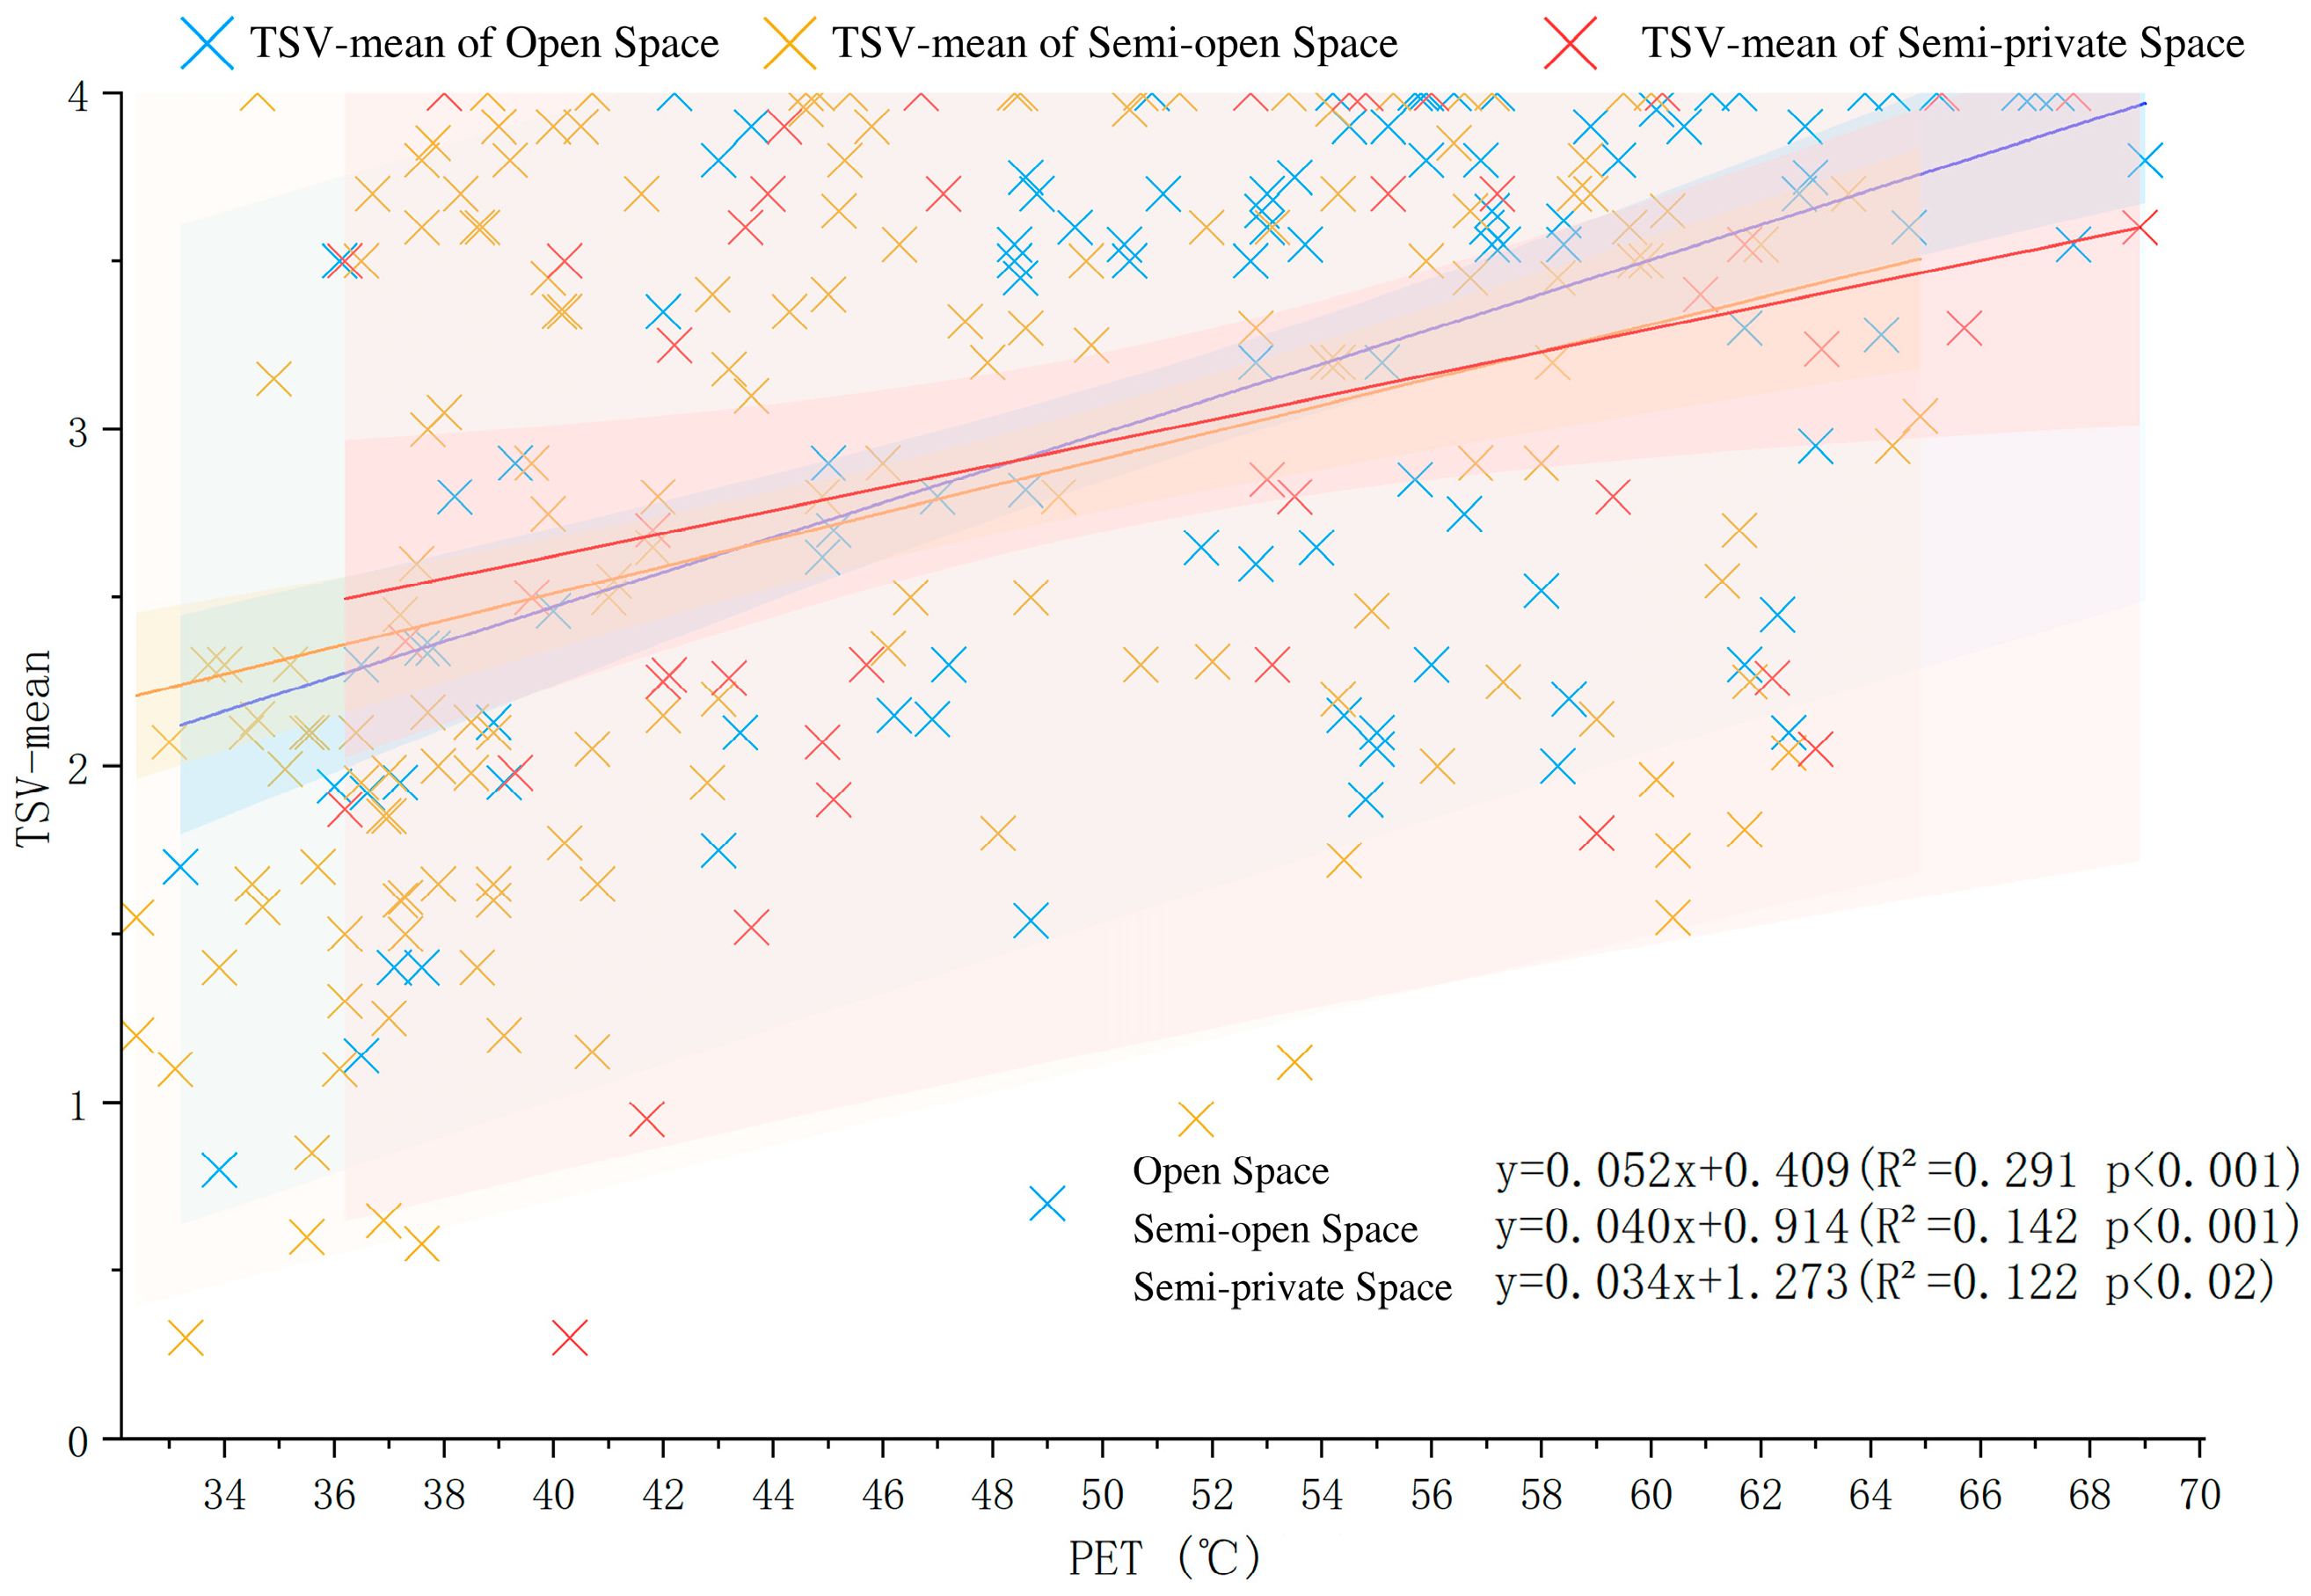
To examine the relationship between physiological thermal load and perceived thermal sensation, as well as to compare differences among spatial typologies, linear regression analysis was conducted between Physiological Equivalent Temperature (PET) and Thermal Sensation Vote (TSV).
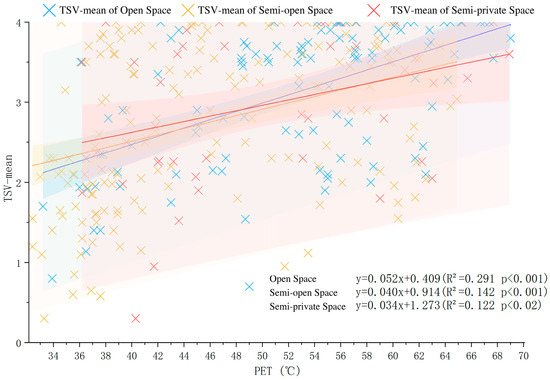
As shown in Figure 8, PET exhibited a positive and statistically significant association with TSV across all spatial types. The strength of the relationship, however, varied by spatial category.
Figure 8.
Linear regression results between Physiologically Equivalent Temperature (PET) and Thermal Sensation Vote (TSV) for various spatial types.
In open spaces, the correlation was comparatively stronger (R2 = 0.291, p < 0.001), indicating that variations in PET explained a greater proportion of thermal sensation responses in fully exposed environments. Semi-open spaces also showed a significant association (R2 = 0.142, p < 0.001), although the explanatory power was reduced. In semi-private spaces, the relationship remained statistically significant but relatively weaker (R2 = 0.122, p < 0.05).
These findings suggest that spatial enclosure and shading elements may moderate the direct correspondence between calculated thermal indices and subjective thermal perception, potentially reducing the sensitivity of TSV to changes in PET.
3.3. Correlation Analysis Between Spatial Elements and Thermal Comfort Index
3.3.1. Spatial Openness and Thermal Comfort
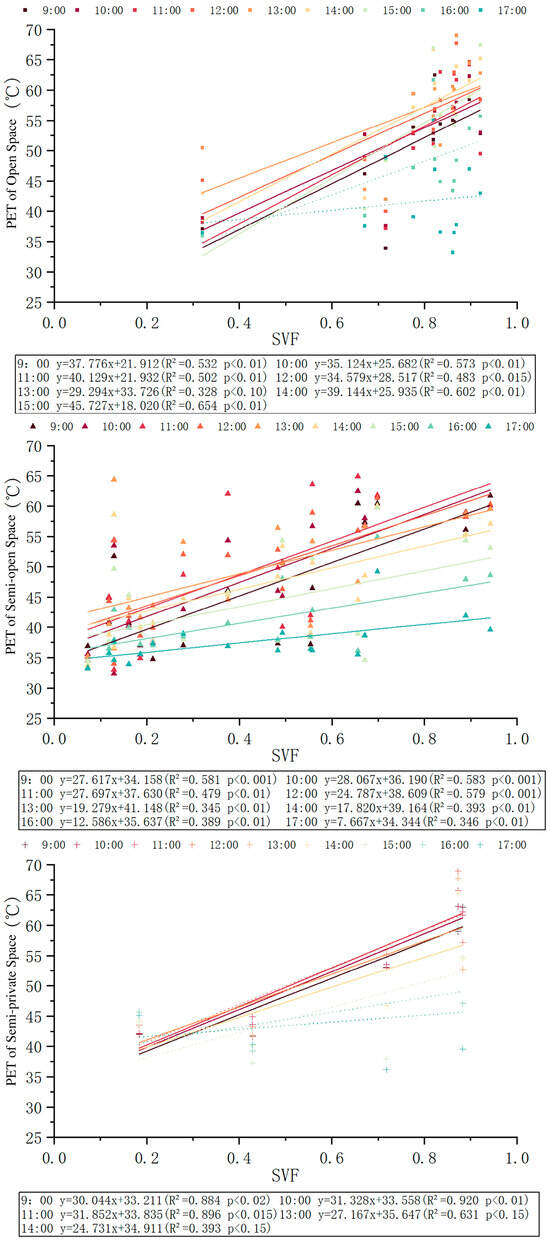
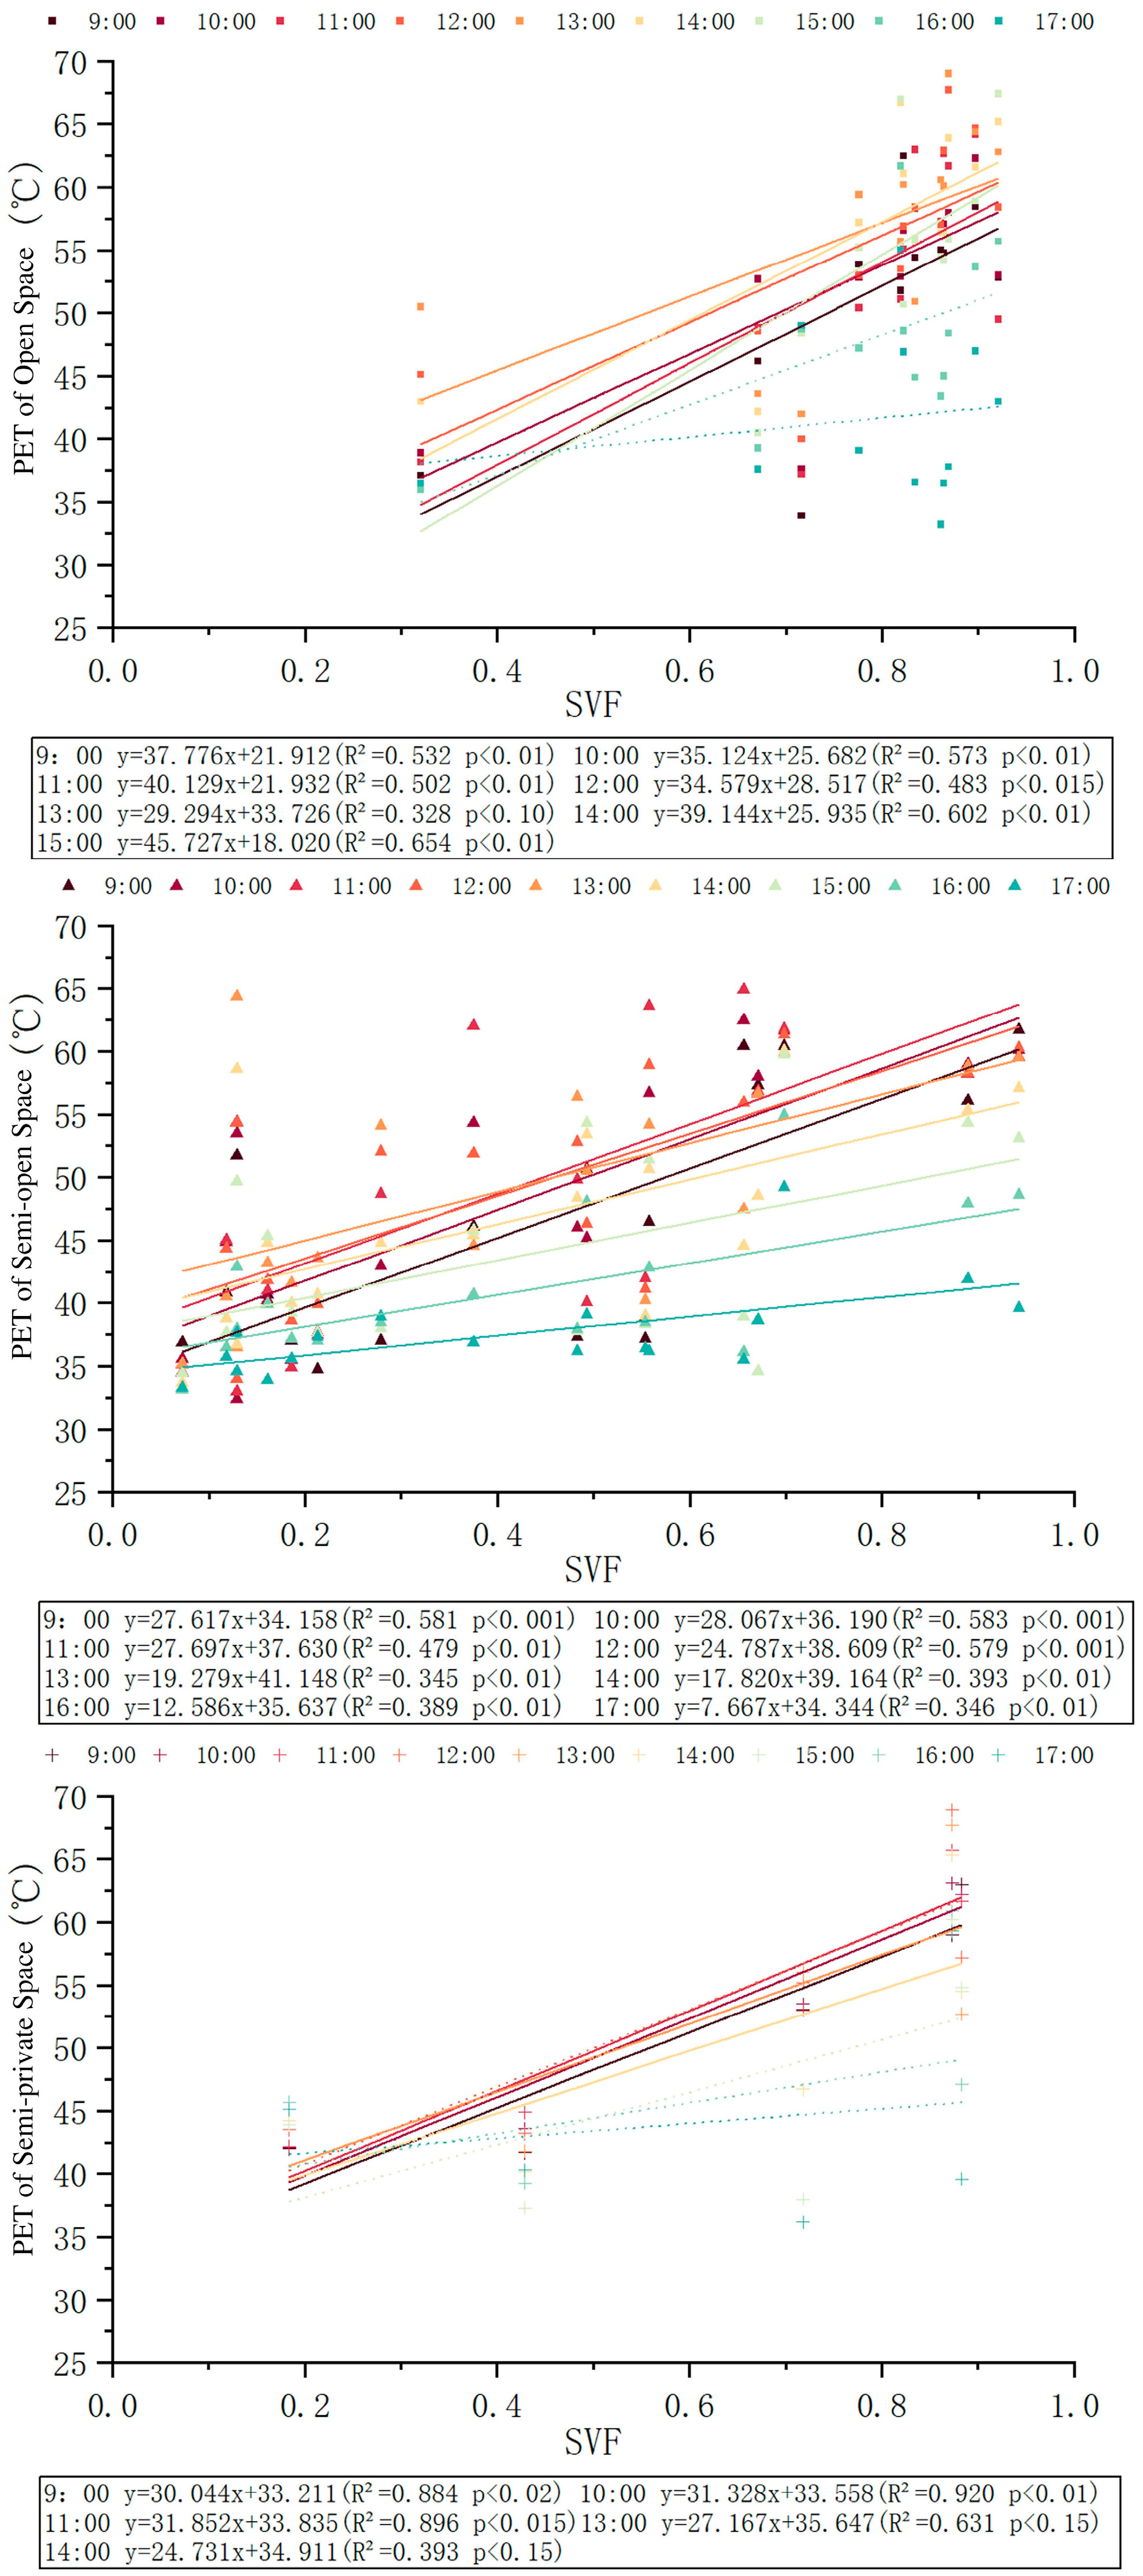
In this study, Sky View Factor (SVF) was employed to quantify spatial openness. The results revealed a consistent positive association between SVF and PET across different spatial types (Figure 9).
Figure 9.
Linear Regression Results of Sky View Factor (SVF) and Physiologically Equivalent Temperature (PET) in Various Types of Spaces.
For semi-open spaces, SVF showed statistically significant correlations with PET over the longest time span, indicating that variations in openness exert a sustained influence on thermal load under partially shaded conditions. In open spaces, the regression slope of the significant equations was the steepest, suggesting a stronger sensitivity of PET to changes in SVF under fully exposed conditions. In contrast, regression curves for semi-private spaces across different time periods displayed considerable overlap, implying a comparatively stable relationship between SVF and PET. This pattern suggests that spatial enclosure and shading elements in semi-private environments may attenuate external radiative fluctuations and moderate internal thermal accumulation.
Analysis of slope variation over time further revealed a clear temporal dependence. For all three spatial types, regression slopes were highest around midday, gradually declined in the afternoon, and reached their lowest values in the evening. These findings indicate that the influence of SVF on PET is strongly modulated by solar radiation intensity, with the most pronounced effect occurring during peak radiation periods.
3.3.2. Water Body Elements and Thermal Comfort
Water bodies influence local microclimates through processes such as evaporative cooling, radiative exchange, and airflow modification, thereby affecting human thermal comfort. In regions such as Wuxi, characterized by dense water networks, water features constitute a key environmental component shaping spatial thermal conditions.
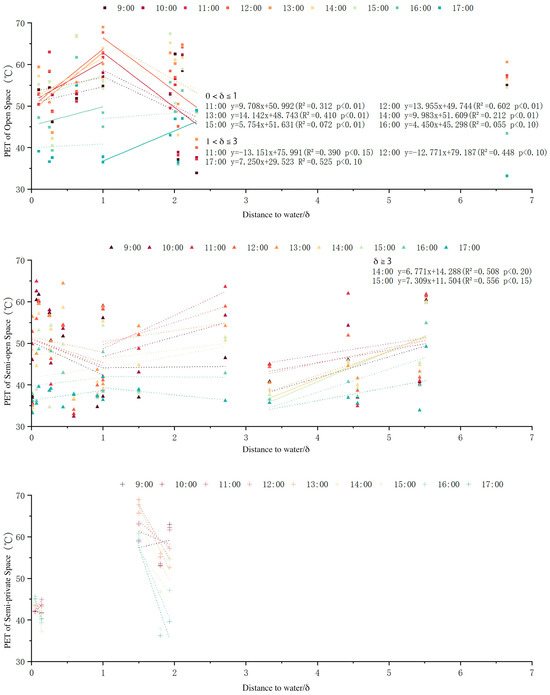
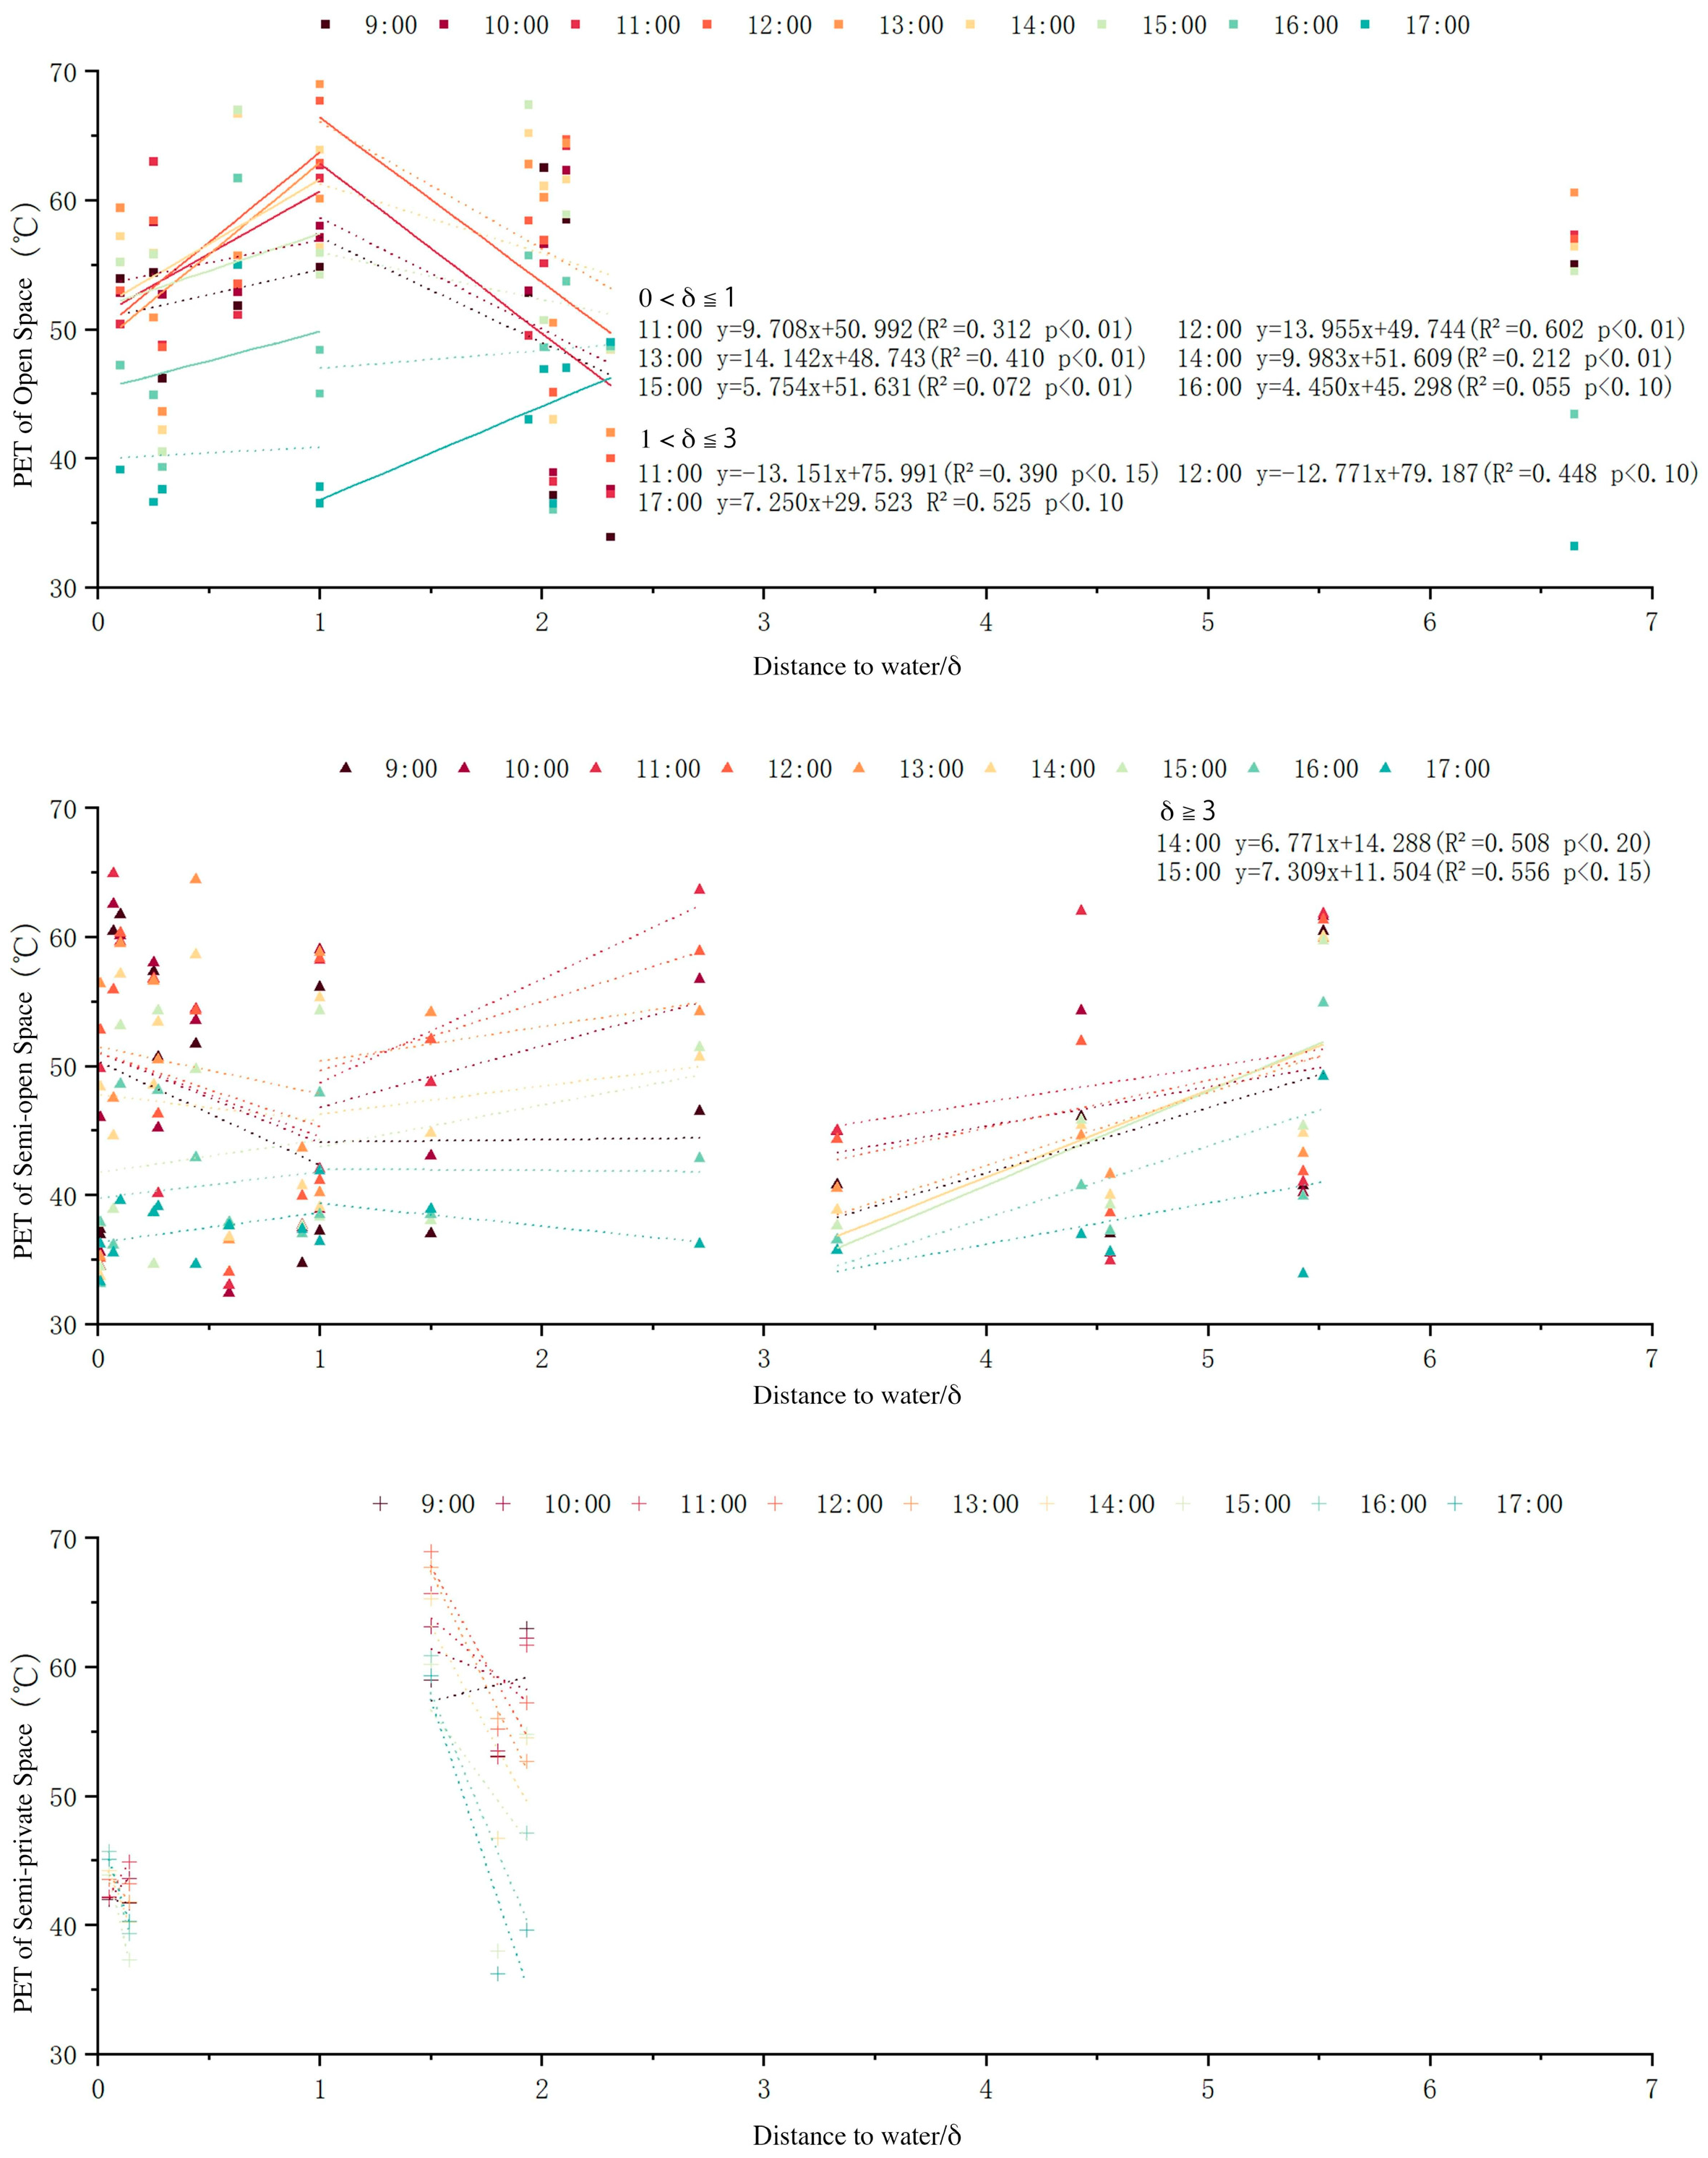
As illustrated in Figure 10, the scaled distance to water (δ) exhibited a significant relationship with PET in open spaces during daytime periods. When δ ranged between 0 and 1, smaller δ values (i.e., closer proximity to water or larger water bodies) were associated with lower PET, indicating a measurable cooling effect within a close spatial range. When δ exceeded 1, the relationship weakened and PET values showed greater variability, suggesting that the cooling influence of water bodies diminishes beyond a certain distance threshold.
Figure 10.
Linear Regression Results of Distance to Water and Physiologically Equivalent Temperature (PET) in Various Types of Spaces.
In semi-open spaces, the relationship between δ and PET was comparatively weaker and less consistent than in open spaces. In certain midday periods, sites located closer to water did not demonstrate a pronounced cooling advantage. This may be attributed to limited ventilation or constrained radiative exchange within partially enclosed spatial configurations, which can reduce the effective dispersion of accumulated heat.
In semi-private spaces, the association between δ and PET was weakest, implying that the cooling contribution of nearby water bodies was comparatively limited. High levels of enclosure and shading likely reduced solar exposure and external heat gain, thereby attenuating the relative contribution of water-induced cooling to overall thermal conditions.
3.3.3. Surface Materials and Thermal Comfort
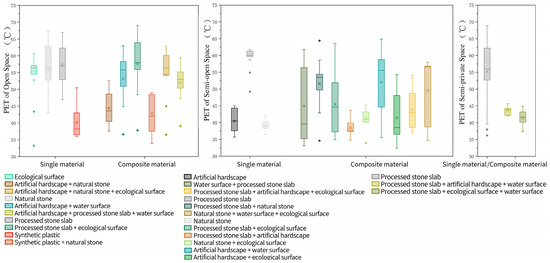
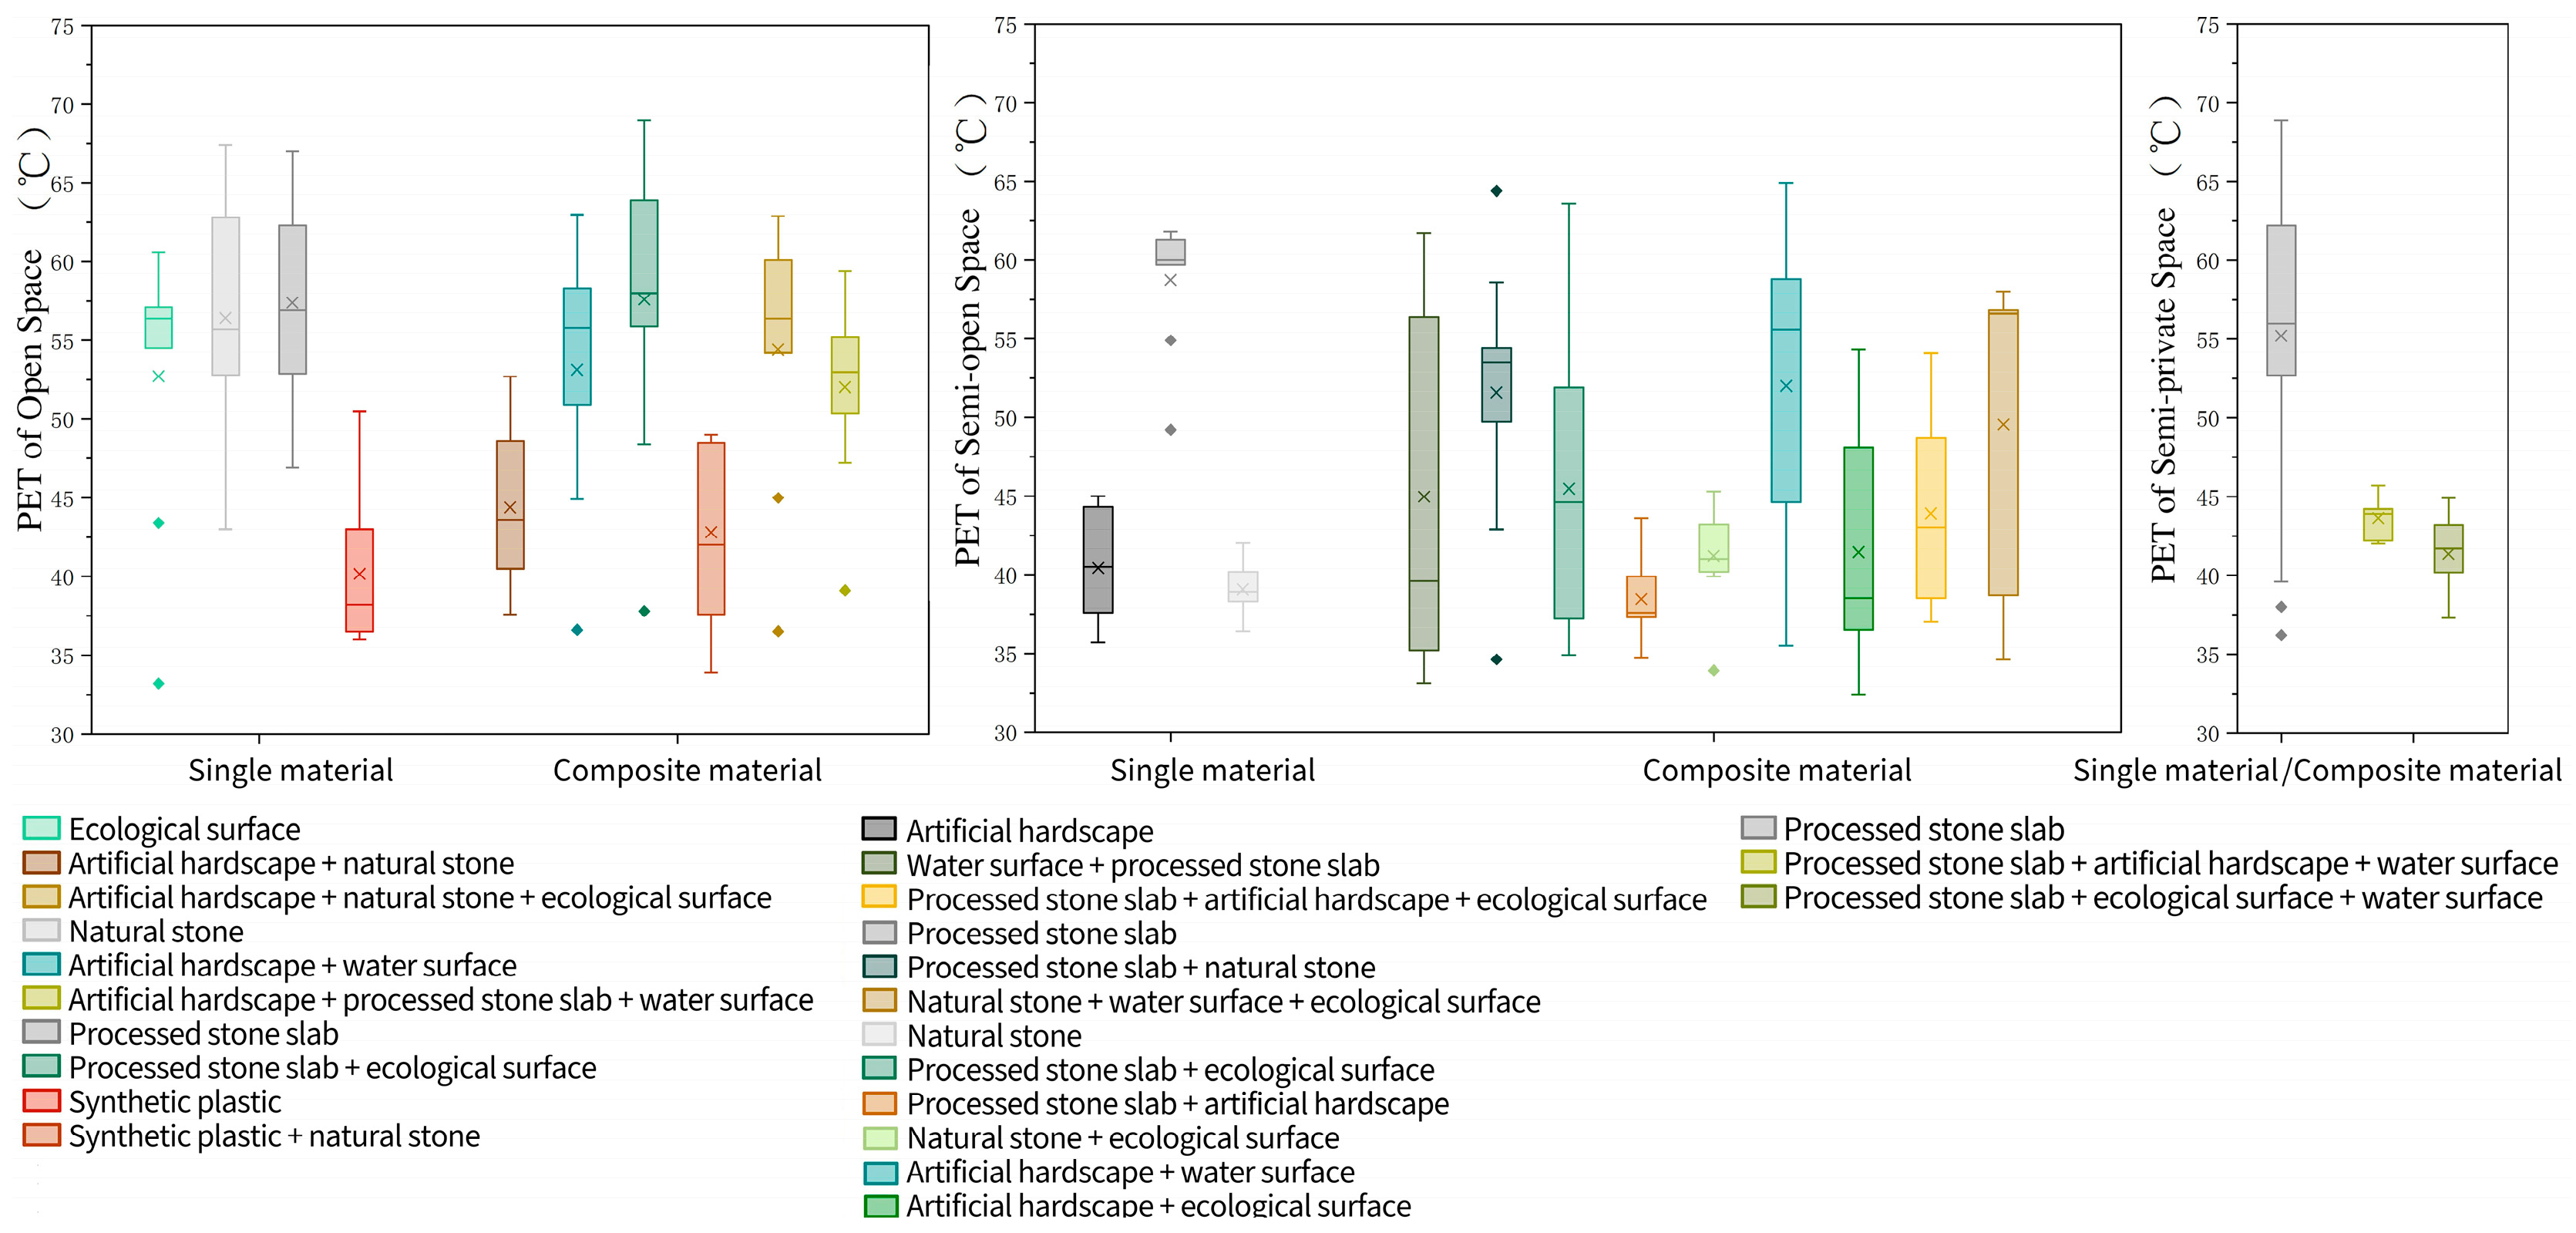
As illustrated in the box plots (Figure 11), differences in PET were observed among various surface material types. In general, single-material surfaces exhibited greater variability in PET compared to composite materials, suggesting differential thermal responses associated with material composition.
Figure 11.
Comparison of Physiologically Equivalent Temperature (PET) for Different Materials in Various Spaces.
Among single materials, ecological surfaces showed comparatively smaller PET fluctuations, indicating relatively stable thermal performance. However, variations in shading conditions, proximity to water, and spatial configuration among measurement sites also contributed to PET differences, implying that surface material effects cannot be fully separated from other spatial determinants.
In open spaces, sites surfaced with synthetic permeable materials, as well as synthetic plastic combined with natural stone, corresponded to relatively lower PET values. This pattern may be associated with higher surface permeability and reduced heat storage capacity; however, the observed cooling tendency should be interpreted in conjunction with concurrent spatial factors.
In semi-open spaces, single processed stone slabs were associated with comparatively higher PET values. After accounting for shading conditions, combinations of natural stone and ecological surfaces tended to correspond to lower PET, suggesting that mixed material configurations may contribute to moderated thermal conditions under partially shaded environments.
In semi-private spaces, single-material surfaces generally corresponded to higher PET values than composite materials. This trend indicates that diversified material composition may enhance thermal regulation under enclosed or shaded spatial conditions, although its influence remains intertwined with shading and ventilation characteristics.
4. Discussion and Conclusions
4.1. Discussion
4.1.1. Research Findings
Based on field measurements and thermal perception questionnaire results, the microclimatic characteristics of different types of traditional rural public spaces in Wuxi exhibit significant differences, reflecting the coupling relationship between terrain configuration and landscape elements. Yaogeli Village, influenced by a wind-sheltered hilly terrain, generally experiences low wind speeds (<1.5 m/s), which limits heat dissipation and results in the highest temperature peaks (>39 °C), accompanied by a noticeable decrease in humidity. This reflects the typical characteristics of mountainous settlements, where insufficient ventilation leads to heat accumulation.
Huangtutang Ancient Village is located in a plain water-network area. The combined effects of water evaporation and shading from vegetated corridors maintain relatively high humidity levels (still above 50% in the afternoon) while producing the smallest temperature fluctuations (approximately 37 °C), demonstrating the buffering effect of water-town environments on local microclimates.
Zhu Village features a relatively open spatial structure with higher wind speeds (reaching up to 4.0 m/s in the afternoon), which facilitates heat dissipation. However, due to insufficient shading and limited water bodies, temperatures remain close to 38.5 °C, indicating a condition of “adequate ventilation but still high thermal load.” These differences suggest that the climate-adaptation limitations of different village types exhibit clear spatial characteristics.
Correlation analysis of thermal comfort indicates that PET shows an overall positive relationship with TSV, with the strongest correlation occurring in open spaces. However, the overall correlation remains relatively weak, suggesting that discrepancies still exist between objective thermal environment indicators and subjective thermal perception. On the one hand, this deviation may be attributed to psychological adaptation and expectation effects, as residents and visitors may exhibit greater tolerance to high temperatures within familiar and leisure-oriented spatial contexts. On the other hand, sensory disturbances commonly present in rural public spaces during summer—such as mosquitoes or unpleasant odors caused by improperly placed waste bins—may also influence respondents’ evaluation processes. Although these factors do not directly alter thermal environment parameters, they may affect users’ spatial experience and increase the variability of subjective thermal perception.
Regarding spatial elements, the influence of spatial openness on thermal comfort exhibits clear temporal characteristics. Around midday, PET increases significantly with increasing Sky View Factor (SVF), while its influence gradually weakens toward the evening, indicating that solar radiation becomes the dominant source of thermal load during periods of intense sunlight.
The regulating effect of water bodies is strongly constrained by spatial type. In open spaces, the cooling effect is most evident within the 0–1 m proximity to water and gradually decreases with increasing distance. In some semi-open and semi-private spaces, however, the cooling effect of water bodies cannot be fully realized due to limited ventilation and shading conditions, and in some cases, PET values near water even appear slightly higher.
Regarding surface materials, spaces with composite materials exhibit more stable PET levels compared with those with single materials. Their thermal buffering capacity contributes to improved outdoor thermal comfort.
Further threshold analysis indicates that when SVF exceeds approximately 0.6, PET increases more rapidly with increasing SVF during midday. In contrast, when SVF falls below approximately 0.3, the stabilizing effect of shading on the thermal environment becomes more evident. In terms of water influence, the normalized water-distance parameter shows a clear cooling effect within the range of 0–1, while the effect becomes negligible once the distance exceeds approximately δ = 3.
An interaction effect between water bodies and SVF was also observed. In highly open spaces, the cooling influence of water bodies becomes more pronounced, whereas in highly shaded spaces, the cooling effect may be constrained by limited ventilation conditions.
4.1.2. Comparison with Previous Studies
Through field microclimate measurements and questionnaire surveys, this study explored the effects of spatial openness, water proximity, and surface materials on outdoor thermal comfort. In recent years, several scholars have begun to examine quantitative relationships between the spatial morphology of traditional villages and microclimates. Yang et al. [35] found that spatial morphological factors such as street scale, building density, and shading conditions significantly influence thermal environments in mountainous rural settlements through field monitoring and PET analysis. Chen et al. [8], in their study of Linpan settlements in the Chengdu Plain, demonstrated that vegetation coverage and spatial enclosure have significant effects on outdoor thermal comfort.
Similarly, studies by Xiong et al. [7] and Ma et al. [10] indicated that spatial configuration, enclosure degree, shading conditions, and spatial scale of public spaces in traditional Jiangnan villages significantly affect rural thermal environments. Fan et al. [9] further identified spatial morphology and landscape configuration as key influencing factors through microclimate measurements and layout simulations of rural public spaces, and proposed corresponding optimization strategies for rural spatial planning.
These studies, mainly focusing on the overall settlement structure or individual spatial types, confirmed that the spatial configuration and landscape elements of traditional villages possess certain climate-adaptive characteristics. Consistent patterns were also observed in the field monitoring of traditional villages in Wuxi in this study. However, unlike previous studies that primarily examined settlement morphology at the village scale, this research further investigates the mechanisms of spatial elements affecting thermal comfort at the public-space scale. By comparing measured data from similar types of public spaces across multiple villages, this study refines the understanding of how different spatial elements influence outdoor thermal comfort and provides more specific design guidance for climate-adaptive optimization of traditional rural public spaces.
With the intensification of global climate warming, the issue of summer outdoor thermal comfort for rural residents has gradually attracted increasing attention. Yin et al. [36] investigated the thermal comfort conditions and behavioral responses of rural residents in Northeast China through field surveys. Rawal et al. [37], based on large-scale measurements across multiple climate zones in India, established an adaptive thermal comfort model, demonstrating that residents’ thermal adaptation capacity is significantly higher than predicted by conventional thermal comfort models.
Focusing on rural thermal comfort, this study systematically analyzed the thermal environment characteristics of public spaces in traditional villages in Wuxi at the spatial level and proposed climate-adaptive design strategies suitable for Jiangnan rural areas. To some extent, this research expands the perspective of thermal environment studies in traditional Jiangnan rural public spaces and provides more systematic empirical evidence for climate-adaptive optimization of rural public spaces.
4.1.3. Theoretical and Practical Contributions
Taking representative traditional villages in Wuxi as case studies, this research investigated the combined effects of spatial openness, water elements, and surface materials on outdoor thermal comfort through microclimate measurements, questionnaire surveys, and PET calculations. The results indicate that the overall thermal environment of rural public spaces during summer tends to be hot, with PET values exceeding the human thermal neutrality threshold (23–29 °C) for most periods. Among different spatial types, open spaces experience the highest thermal load, followed by semi-open spaces, while semi-private spaces with stronger shading conditions are relatively more comfortable. Questionnaire responses show that thermal sensation votes are mainly concentrated around “slightly warm” and “warm,” with the most intense heat exposure occurring from midday to early afternoon.
From the perspective of influencing mechanisms, spatial openness exhibits a significant positive correlation with PET. In open spaces, SVF has the strongest influence on PET, with the steepest slope occurring at midday, indicating that direct solar radiation associated with high openness is the dominant heat source. Semi-open spaces show a longer period of significant influence, reflecting their delayed response to climatic changes, whereas semi-private spaces exhibit highly overlapping curves, suggesting more stable thermal conditions.
Water elements play an important role in regulating rural thermal environments in Jiangnan villages but are strongly constrained by spatial structures. After excluding the influence of spatial structure, a significant cooling effect is observed within the water-distance range of 0–1, while the effect decreases substantially when the distance exceeds 3.
Regarding surface materials, single materials are more sensitive to environmental changes. Stone surfaces, in particular, tend to heat up quickly and release heat slowly, resulting in higher thermal loads. In contrast, composite paving systems combining ecological surfaces with natural stone or artificial hard materials can create a thermal buffering effect, effectively reducing ground temperature fluctuations and improving local thermal comfort.
Based on these findings, this study proposes that thermal comfort optimization in rural public spaces should focus on three aspects (Table 6). First, regulation of spatial openness: in open spaces, tree planting and adjustable shading structures should be introduced to reduce solar exposure, while semi-open and semi-private spaces can achieve a balance between shading and ventilation through spatial layout and interface adjustments. Second, optimization of water-body layouts: activity nodes should be arranged within the 0–1 m proximity to water in order to fully utilize the cooling effect while maintaining airflow corridors to avoid shading conditions that weaken cooling performance. Third, diversification of surface materials: composite paving should be widely adopted in open spaces to mitigate heat accumulation, whereas in highly enclosed or shaded spaces, artificial hard materials with higher thermal conductivity are recommended to accelerate ground heat dissipation and prevent excessive humidity that may lead to a stuffy thermal sensation.
Table 6.
Thermal Comfort Optimization Strategies for Typical Public Space Types.
Through these strategies, a dynamic balance of the ground-level thermal environment can be achieved across different spatial scales in rural public spaces.
4.1.4. Limitations and Future Research Directions
Due to limitations in sample size and the availability of variables, this study did not construct a multivariate regression model to isolate the independent effects of individual factors. However, by conducting comparative analyses across different spatial types, the influence of spatial attribute differences was partially controlled. Future research could expand the sample size and incorporate behavioral variables as well as environmental disturbance factors to establish multi-factor models, thereby providing a more comprehensive understanding of the mechanisms underlying thermal comfort perception in rural public spaces.
Second, information on respondents’ height and body weight was self-reported rather than measured on site, which may introduce certain individual-level inaccuracies. Nevertheless, these parameters were mainly used to estimate metabolic rate and average human-body parameters, and thus their influence on the overall evaluation of thermal comfort is expected to be relatively limited. In addition, the survey participants included both local residents and visitors. Since this study primarily focused on instantaneous thermal perception under different spatial morphologies, the two groups were not analyzed separately in the statistical analysis. However, differences in long-term climatic adaptation may exist between these groups. Future studies could therefore further distinguish between different user groups and conduct more in-depth comparative analyses of their thermal adaptation characteristics.
Furthermore, China spans a vast territory with diverse climatic zones and regional environmental conditions, resulting in significant differences in the thermal environment characteristics of rural public spaces. At present, empirical studies on outdoor thermal comfort in rural areas remain relatively limited in China, particularly regarding systematic measurements of public spaces in traditional Jiangnan villages. Future research could therefore conduct comparative studies across multiple regions and broader spatial scales, accumulating microclimate and thermal comfort data from rural public spaces in different climatic zones. Such efforts would help gradually establish regional thermal comfort databases, providing more robust theoretical foundations and empirical data support for climate-adaptive design and environmental optimization of rural public spaces.
4.2. Conclusions
This study investigated the thermal environment characteristics and influencing mechanisms of different types of rural public spaces in typical traditional villages in Wuxi. Through field microclimate measurements, thermal comfort questionnaires, and Physiological Equivalent Temperature (PET) calculations, the thermal environmental conditions and their spatial determinants were systematically analyzed. The main conclusions are as follows:
- (1)
- Significant differences were observed in the microclimatic characteristics of different types of traditional rural public spaces, which are closely associated with terrain conditions and settlement spatial patterns. Hilly villages located in wind-sheltered terrains tend to experience poor ventilation and the highest summer temperatures. In contrast, villages situated in plain water-network environments benefit from the combined effects of water evaporation and vegetated corridors, resulting in smaller temperature fluctuations. Villages with higher spatial openness generally exhibit better ventilation; however, insufficient shading still leads to relatively high thermal loads.
- (2)
- Objective thermal environment indicators show an overall positive relationship with subjective thermal perception, although the correlation remains relatively weak. The relationship between PET and TSV is most pronounced in open spaces, indicating that solar radiation is the dominant source of thermal load in rural public spaces during summer. Meanwhile, psychological adaptation and environmental disturbances may increase the variability of subjective thermal evaluations.
- (3)
- Spatial elements play a significant role in regulating outdoor thermal comfort. Spatial openness, represented by the Sky View Factor (SVF), shows a positive correlation with PET, with the strongest influence occurring during midday when solar radiation is most intense. Water bodies exhibit a clear cooling effect within a proximity range of 0–1 m. In addition, composite surface materials demonstrate more stable thermal environmental performance compared with single materials.
- (4)
- Based on these findings, the optimization of thermal comfort in rural public spaces should focus on three aspects: regulation of spatial openness, optimization of water-body layouts, and diversification of surface materials. Strategies such as increasing tree shading, rationally organizing waterfront activity spaces, and optimizing paving material combinations can effectively improve outdoor thermal environments and enhance spatial comfort during summer.
Author Contributions
Conceptualization, X.Y., X.L. and R.Z.; methodology, X.Y. and X.L.; software, X.Y.; validation, X.Y.; formal analysis, X.Y.; investigation, X.Y. and X.L.; data curation, X.Y.; writing—original draft preparation, X.Y.; writing—review and editing, X.Y. and X.L.; visualization, X.Y.; supervision, R.Z. All authors have read and agreed to the published version of the manuscript.
Funding
This research was funded by the Postgraduate Practice and Innovation Program of Jiangsu Province (Grant No. SJCX25_1315).
Institutional Review Board Statement
The study was conducted in accordance with the Declaration of Helsinki, and approved by the Ethics Committee of Medical Ethics Committee of Jiangnan University (protocol code JUN202506RB070, June 2025).
Informed Consent Statement
Informed consent was obtained from all subjects involved in the study.
Data Availability Statement
The raw data supporting the conclusions of this article will be made available by the authors on request.
Acknowledgments
The authors would like to thank the local village committees and residents for their cooperation during the field investigation. During the preparation of this manuscript, the authors used ChatGPT (OpenAI, GPT-4) for language editing and text refinement. The authors have reviewed and edited the output and take full responsibility for the content of this publication.
Conflicts of Interest
The authors declare no conflicts of interest.
Appendix A
Outdoor Thermal Comfort Questionnaire
Dear Sir/Madam, Hello! I am a postgraduate student from the School of Design, Jiangnan University. I am conducting a questionnaire survey on outdoor thermal comfort. Please tick the appropriate box (√) and fill in the correct information on the blank lines. Thank you for your cooperation!
References
- IPCC. Climate Change 2021: The Physical Science Basis. Contribution of Working Group I to the Sixth Assessment Report of the Intergovernmental Panel on Climate Change; Cambridge University Press: Cambridge, UK, 2021. [Google Scholar] [CrossRef] [Scilit]
- Gauer, R.; Meyers, B.K. Heat-related illnesses. Am. Fam. Physician 2019, 99, 482–489. Available online: https://www.aafp.org/pubs/afp/issues/2019/0415/p482.html (accessed on 19 January 2026).
- de Bont, J.; Nori-Sarma, A.; Stafoggia, M.; Banerjee, T.; Ingole, V.; Jaganathan, S.; Mandal, S.; Rajiva, A.; Krishna, B.; Kloog, I.; et al. Impact of heat waves on all-cause mortality in India: A comprehensive multi-city study. Environ. Int. 2024, 184, 108461. [Google Scholar] [CrossRef] [Scilit]
- Zou, B.; Fan, C.; Wang, M.; Li, J.; Zhou, X.; Liao, Y. How do urban–rural and regional summer heat exposures evolve? A case study of 301 cities in China from 2000 to 2020. Build. Environ. 2025, 271, 112584. [Google Scholar] [CrossRef] [Scilit]
- Cao, Q.; Yu, D.; Georgescu, M.; Wu, J.; Wang, W. Impacts of future urban expansion on summer climate and heat-related human health in eastern China. Environ. Int. 2018, 112, 134–146. [Google Scholar] [CrossRef] [Scilit]
- Wang, J.W.; Gao, Y.Z.; Xiong, X.; Lan, L. Analysis on the protection and development of rural landscapes in the Jiangnan region under the background of rural revitalization. Mod. Agric. 2019, 11, 9–11. [Google Scholar]
- Xiong, Y.; Zhang, J.; Yan, Y.; Sun, S.; Xu, X.; Higueras, E. Effect of the spatial form of Jiangnan traditional villages on microclimate and human comfort. Sustain. Cities Soc. 2022, 87, 104136. [Google Scholar] [CrossRef] [Scilit]
- Chen, L.; Kalonji, G.; Xu, L.; Ma, P.; Hu, L. Combining microclimatic monitoring with questionnaires for understanding thermal comfort in Linpan, a typical agricultural ecosystem settlement in the Chengdu plain. Build. Environ. 2023, 228, 109868. [Google Scholar] [CrossRef] [Scilit]
- Fan, Q.; Du, F.; Li, H.; Zhang, C. Thermal-comfort evaluation of and plan for public space of Maling Village, Henan, China. PLoS ONE 2021, 16, e0256439. [Google Scholar] [CrossRef] [Scilit] [PubMed]
- Ma, K.; Tang, X.; Ren, Y.; Wang, Y. Research on the Spatial Pattern Characteristics of the Taihu Lake Dock Village Based on Microclimate: A Case Study of Tangli Village. Sustainability 2019, 11, 368. [Google Scholar] [CrossRef] [Scilit]
- Zhang, T.; Hu, Q.; Ding, Q.; Zhou, D.; Gao, W.; Fukuda, H. Towards a rural revitalization strategy for the courtyard layout of vernacular dwellings based on regional adaptability and outdoor thermal performance in the gully regions of the Loess Plateau, China. Sustainability 2021, 13, 13074. [Google Scholar] [CrossRef] [Scilit]
- Santamouris, M. Using cool pavements as a mitigation strategy to fight urban heat island—A review of the actual developments. Renew. Sustain. Energy Rev. 2013, 26, 224–240. [Google Scholar] [CrossRef] [Scilit]
- Shanmugasundaram, S.; Baskaran, P.; Radhakrishnan, R.V.; Raghav, P.; Gupta, A.K. Sociocultural and indigenous practices of rural India in adapting to heat stress: An exploratory descriptive qualitative study. Int. Health 2025, ihaf153. [Google Scholar] [CrossRef] [Scilit]
- Philokyprou, M.; Michael, A. Environmental sustainability in the conservation of vernacular architecture: The case of rural and urban traditional settlements in Cyprus. Int. J. Archit. Herit. 2021, 15, 1741–1763. [Google Scholar] [CrossRef] [Scilit]
- Höppe, P. The physiological equivalent temperature—A universal index for the biometeorological assessment of the thermal environment. Int. J. Biometeorol. 1999, 43, 71–75. [Google Scholar] [CrossRef] [Scilit]
- Matzarakis, A.; Mayer, H.; Iziomon, M.G. Applications of a universal thermal index: Physiological equivalent temperature. Int. J. Biometeorol. 1999, 43, 76–84. [Google Scholar] [CrossRef] [Scilit]
- Nikolopoulou, M.; Steemers, K. Thermal comfort and psychological adaptation as a guide for designing urban spaces. Energy Build. 2003, 35, 95–101. [Google Scholar] [CrossRef] [Scilit]
- de Dear, R.; Xiong, J.; Kim, J.; Cao, B. A review of adaptive thermal comfort research since 1998. Energy Build. 2020, 214, 109893. [Google Scholar] [CrossRef] [Scilit]
- Zhang, S.; Zhang, X.; Niu, D.; Fang, Z.; Chang, H.; Lin, Z. Physiological equivalent temperature-based and universal thermal climate index-based adaptive-rational outdoor thermal comfort models. Build. Environ. 2023, 228, 109900. [Google Scholar] [CrossRef] [Scilit]
- Almaaitah, T.; Appleby, M.; Rosenblat, H.; Drake, J.; Joksimovic, D. The potential of blue-green infrastructure as a climate change adaptation strategy: A systematic literature review. Blue-Green Syst. 2021, 3, 223–248. [Google Scholar] [CrossRef] [Scilit]
- Chen, Q.; Liu, R.; Cheng, Q.; Chen, Y.; Cao, S.; Du, M.; Li, K. Evaluating the impact of sky view factor and building shadow ratio on air temperature in different residential and commercial building scenarios: A case study of Beijing, China. Urban Clim. 2023, 49, 101509. [Google Scholar] [CrossRef] [Scilit]
- Xiao, J.; Yuizono, T. Climate-adaptive landscape design: Microclimate and thermal comfort regulation of station square in the Hokuriku Region, Japan. Build. Environ. 2022, 212, 108813. [Google Scholar] [CrossRef] [Scilit]
- Huang, Y.H.; Huang, Y.Y.; Chen, Y.L.; Yan, Y.; Zheng, L.; Ying, Z.Y. Interpretation of the Jiangnan Landscape and Countryside (Shan-Shui) Pattern: Evidence from the Classification and Spatial Form of Traditional Settlements in the Nanxi River Basin. Buildings 2025, 15, 413. [Google Scholar] [CrossRef] [Scilit]
- Wuxi Water Resources Bureau. Wuxi Water Conservancy Annals; China Water & Power Press: Beijing, China, 2008.
- Bi, S.; Du, J.; Tian, Z.; Zhang, Y. Investigating the spatial distribution mechanisms of traditional villages from the human geography region: A case study of Jiangnan, China. Ecol. Inform. 2024, 81, 102649. [Google Scholar] [CrossRef] [Scilit]
- Yang, Z.; Wang, H.; Kharchenko, A. Spatial typologies and structural characteristics of Jiangnan water town settlements: A “water system–human settlement” perspective. Front. Earth Sci. 2025, 13, 1652780. [Google Scholar] [CrossRef] [Scilit]
- Zhou, S.-Q.; Yu, Z.-W.; Ma, W.-Y.; Yao, X.-H.; Xiong, J.-Q.; Ma, W.-J.; Xiang, S.-Y.; Yuan, Q.; Hao, Y.-Y.; Xu, D.-F.; et al. Vertical canopy structure dominates cooling and thermal comfort of urban pocket parks during hot summer days. Landsc. Urban Plan. 2025, 254, 105242. [Google Scholar] [CrossRef] [Scilit]
- Cao, H.L. Village public space in rural social transformation—A case study of Yao Village in northern Jiangsu. China Rural Surv. 2005, 6, 61–73. [Google Scholar]
- Shen, J.Y.; Lou, J.X.; Chen, Y.R.; Zhang, H.Y.; Huang, L.F. Investigation and improvement research on rural public communication space—Taking Zhangjiafeng Village in Shaoxing as an example. Rural Econ. Sci.-Technol. 2023, 34, 154–156. [Google Scholar]
- Wu, Z.; Zhang, Y. Water Bodies’Cooling Effects on Urban Land Daytime Surface Temperature: Ecosystem Service Reducing Heat Island Effect. Sustainability 2019, 11, 787. [Google Scholar] [CrossRef] [Scilit]
- Huang, Z.; Gou, Z.; Cheng, B. An investigation of outdoor thermal environments with different ground surfaces in the hot summer–cold winter climate region. J. Build. Eng. 2020, 27, 100994. [Google Scholar] [CrossRef] [Scilit]
- Kim, Y.J.; Brown, R.D. A multilevel approach for assessing the effects of microclimatic urban design on pedestrian thermal comfort: The High Line in New York. Build. Environ. 2021, 204, 108244. [Google Scholar] [CrossRef] [Scilit]
- Xu, S.; Liu, S.; Zhang, C.; Shao, S.; Li, H.; Chen, X.; Wang, M. Synergistic effects of spatial morphology and thermal comfort on pedestrian activities in residential areas: A field-based study in Wuhan, China. Build. Environ. 2024, 248, 113782. [Google Scholar] [CrossRef] [Scilit]
- Wang, Z.; Zhang, H.; He, Y.; Luo, M.; Li, Z.; Hong, T.; Lin, B. Revisiting individual and group differences in thermal comfort based on ASHRAE database. Energy Build. 2020, 219, 110017. [Google Scholar] [CrossRef] [Scilit]
- Yang, W.; Yu, K.; Xu, J.; Kang, X. Climate-responsive thermal comfort in rural mountain settlements: Field measurements and spatial morphology analysis. Build. Environ. 2025, 282, 113232. [Google Scholar] [CrossRef] [Scilit]
- Yin, Q.; Zhang, Y.; Liu, Y. Investigation on thermal comfort and thermal adaptive behaviors of rural residents in Suibin Town, China, in summer. Sustainability 2023, 15, 6630. [Google Scholar] [CrossRef] [Scilit]
- Rawal, R.; Shukla, Y.; Vardhan, V.; Asrani, S.; Schweiker, M.; de Dear, R.; Garg, V.; Mathur, J.; Prakash, S.; Diddi, S.; et al. Adaptive thermal comfort model based on field studies in five climate zones across India. Build. Environ. 2022, 222, 109187. [Google Scholar] [CrossRef] [Scilit]

































































































Disclaimer/Publisher’s Note: The statements, opinions and data contained in all publications are solely those of the individual author(s) and contributor(s) and not of MDPI and/or the editor(s). MDPI and/or the editor(s) disclaim responsibility for any injury to people or property resulting from any ideas, methods, instructions or products referred to in the content. |
© 2026 by the authors. Licensee MDPI, Basel, Switzerland. This article is an open access article distributed under the terms and conditions of the Creative Commons Attribution (CC BY) license.