Article

Nature in Indoor Environments: An EEG Study Comparing Natural Greenery with Nature-Derived Visual Alternatives


Institute of Industrial Science, The University of Tokyo, Tokyo 153-8505, Japan
*
Author to whom correspondence should be addressed.
Buildings 2026, 16(7), 1284; https://doi.org/10.3390/buildings16071284
Submission received: 9 February 2026 / Revised: 14 March 2026 / Accepted: 19 March 2026 / Published: 25 March 2026
(This article belongs to the Section Architectural Design, Urban Science, and Real Estate)

Abstract

Integrating greenery into built environments plays a significant role in enhancing indoor space, nurturing mental health, and reinforcing overall well-being. Yet, many indoor settings lack direct access to natural greenery, raising questions whether nature-derived visual alternatives, such as chromatic properties or visual complexity could evoke neural responses comparable to those induced by natural greenery. Four indoor window-view stimuli were presented: White Color (control), Green Color, Natural Greenery, and Shadows of Greenery. We used electroencephalography (EEG) to monitor brain electrical activity, with a particular focus on frontal alpha asymmetry (FAA) as an indicator of approach/withdrawal motivation and affective engagement. Natural Greenery showed the strongest asymmetry, with the most negative FAA values. Natural Greenery was also rated highest in comfort and likability. Additionally, a two-way repeated measures ANOVA indicated significantly greater right-frontal engagement in the Natural Greenery view. No comparable neural response was observed for Green Color or Shadows of Greenery.

1. Introduction

Architectural research has increasingly emphasized concerns for occupants’ health and well-being in indoor environments [1,2,3,4]. Consequently, integrating greenery as a natural element has been one way to improve indoor environmental quality and support mental health outcomes [5,6]. The innate connection of humans with nature, known as “biophilia,” was popularized by Edward O. Wilson in 1984 [7], who argued that this connection might be attributed to the genetic past of human evolution in the natural environment. Wilson relates this human tendency to connect with nature as a biological need integral to the physical and mental development of the human species. Even before “biophilia” was defined as a term, researchers explored related ideas about how natural settings influence cognitive development, esthetic preferences, behavior, and even physical healing [8].

1.1. Restorative Environments and Attention Restoration Theory

When William James [9] distinguished between two types of attention (involuntary and directed attention), he described certain natural elements, such as moving things, wild animals, and blows, as examples of involuntary attention. Similarly, Attention Restoration Theory (ART), originally developed by Kaplan, extensively explores the restorative quality of nature [10]. ART contends that nature captures our attention effortlessly and serves as the best resource for resting directed attention, reducing fatigue, and restoring mental function and effectiveness [10]. Kaplan and Kaplan [11] identified four essential components of restorative environments, including fascination. They suggest that fascinations with nature, such as clouds, sunsets, and rustling leaves, can be called “soft fascinations” and allow for a reflective mode. A stimulus that elicits fascination draws involuntary attention, making it critical for a restorative experience—it attracts people, keeps them from boredom, and allows them to function without directed attention.

1.2. Visual Access to Nature in Indoor Settings

Originally a theoretical framework, biophilia has evolved into a foundational concept in design discourse. In particular, the emerging paradigm of biophilic design translates biophilic principles into strategies for shaping the built environment. Certification frameworks, such as LEED [12] and WELL standards [13], integrate biophilic principles to enhance environmental quality and human health. These frameworks emphasize the role of daylight, greenery, and natural materials as a critical strategy for creating biophilic design.
Research has increasingly examined the restorative impact of visual access to nature in indoor environments [14]. Studies associate access to greenery views in the indoor environment with higher relaxation states [15], improved well-being [16], reduced stress [17], enhanced cognitive performance [18], and improved sleep and mood regulation [19,20]. During the COVID-19 pandemic, green window views from within the home have been associated with increased life satisfaction, subjective happiness, self-esteem [21], and reduced depressive/anxiety symptoms [22]. Moreover, biophilic environments have been shown to facilitate faster recovery from stress compared to non-biophilic settings [23]. However, many of these previous studies have relied on subjective questionnaires as a general assessment approach. The subjective nature of such reports can limit the researchers to the subjective perception of occupants’ satisfaction [24,25]. Consequently, an unbiased and objective assessment is important to maximize its benefits and improve design practices. To address this limitation, architectural research has increasingly incorporated neuroscience to deepen the objective assessment of these interactions.

1.3. Neuroarchitectural Approaches and EEG-Based Assessment

Neuroarchitecture portrays a new frontier in architecture, lying between the interrelation of neuroscience and architecture. A key area of this field is examining how architectural elements influence cognitive and emotional states by drawing on insights from cognitive neuroscience. Several authors [26,27,28,29] have highlighted that the value of collaboration between architecture and neuroscience lies in generating empirical evidence as a core component of the research and design process.
Electroencephalography (EEG), a well-established neuroscientific method for measuring brain activity owing to its high temporal resolution and non-intrusive nature, has been widely used in neuroarchitectural studies [30]. EEG measures electrical activity in the brain through voltage fluctuations across regions [31,32]. These signals are categorized into frequency bands: delta, theta, alpha, beta, and gamma—each linked to different states of awareness [33]. Notably, alpha waves (8–13 Hz) have been linked to relaxation and stress reduction [34,35,36,37]; higher frontal lobe alpha activity is considered a sign of cognitive recovery, and a positive correlation to emotional states and motivation, particularly when subjects had views towards greenery [38,39,40,41,42,43,44,45].

1.4. Frontal Alpha Asymmetry (FAA) in Nature Processing

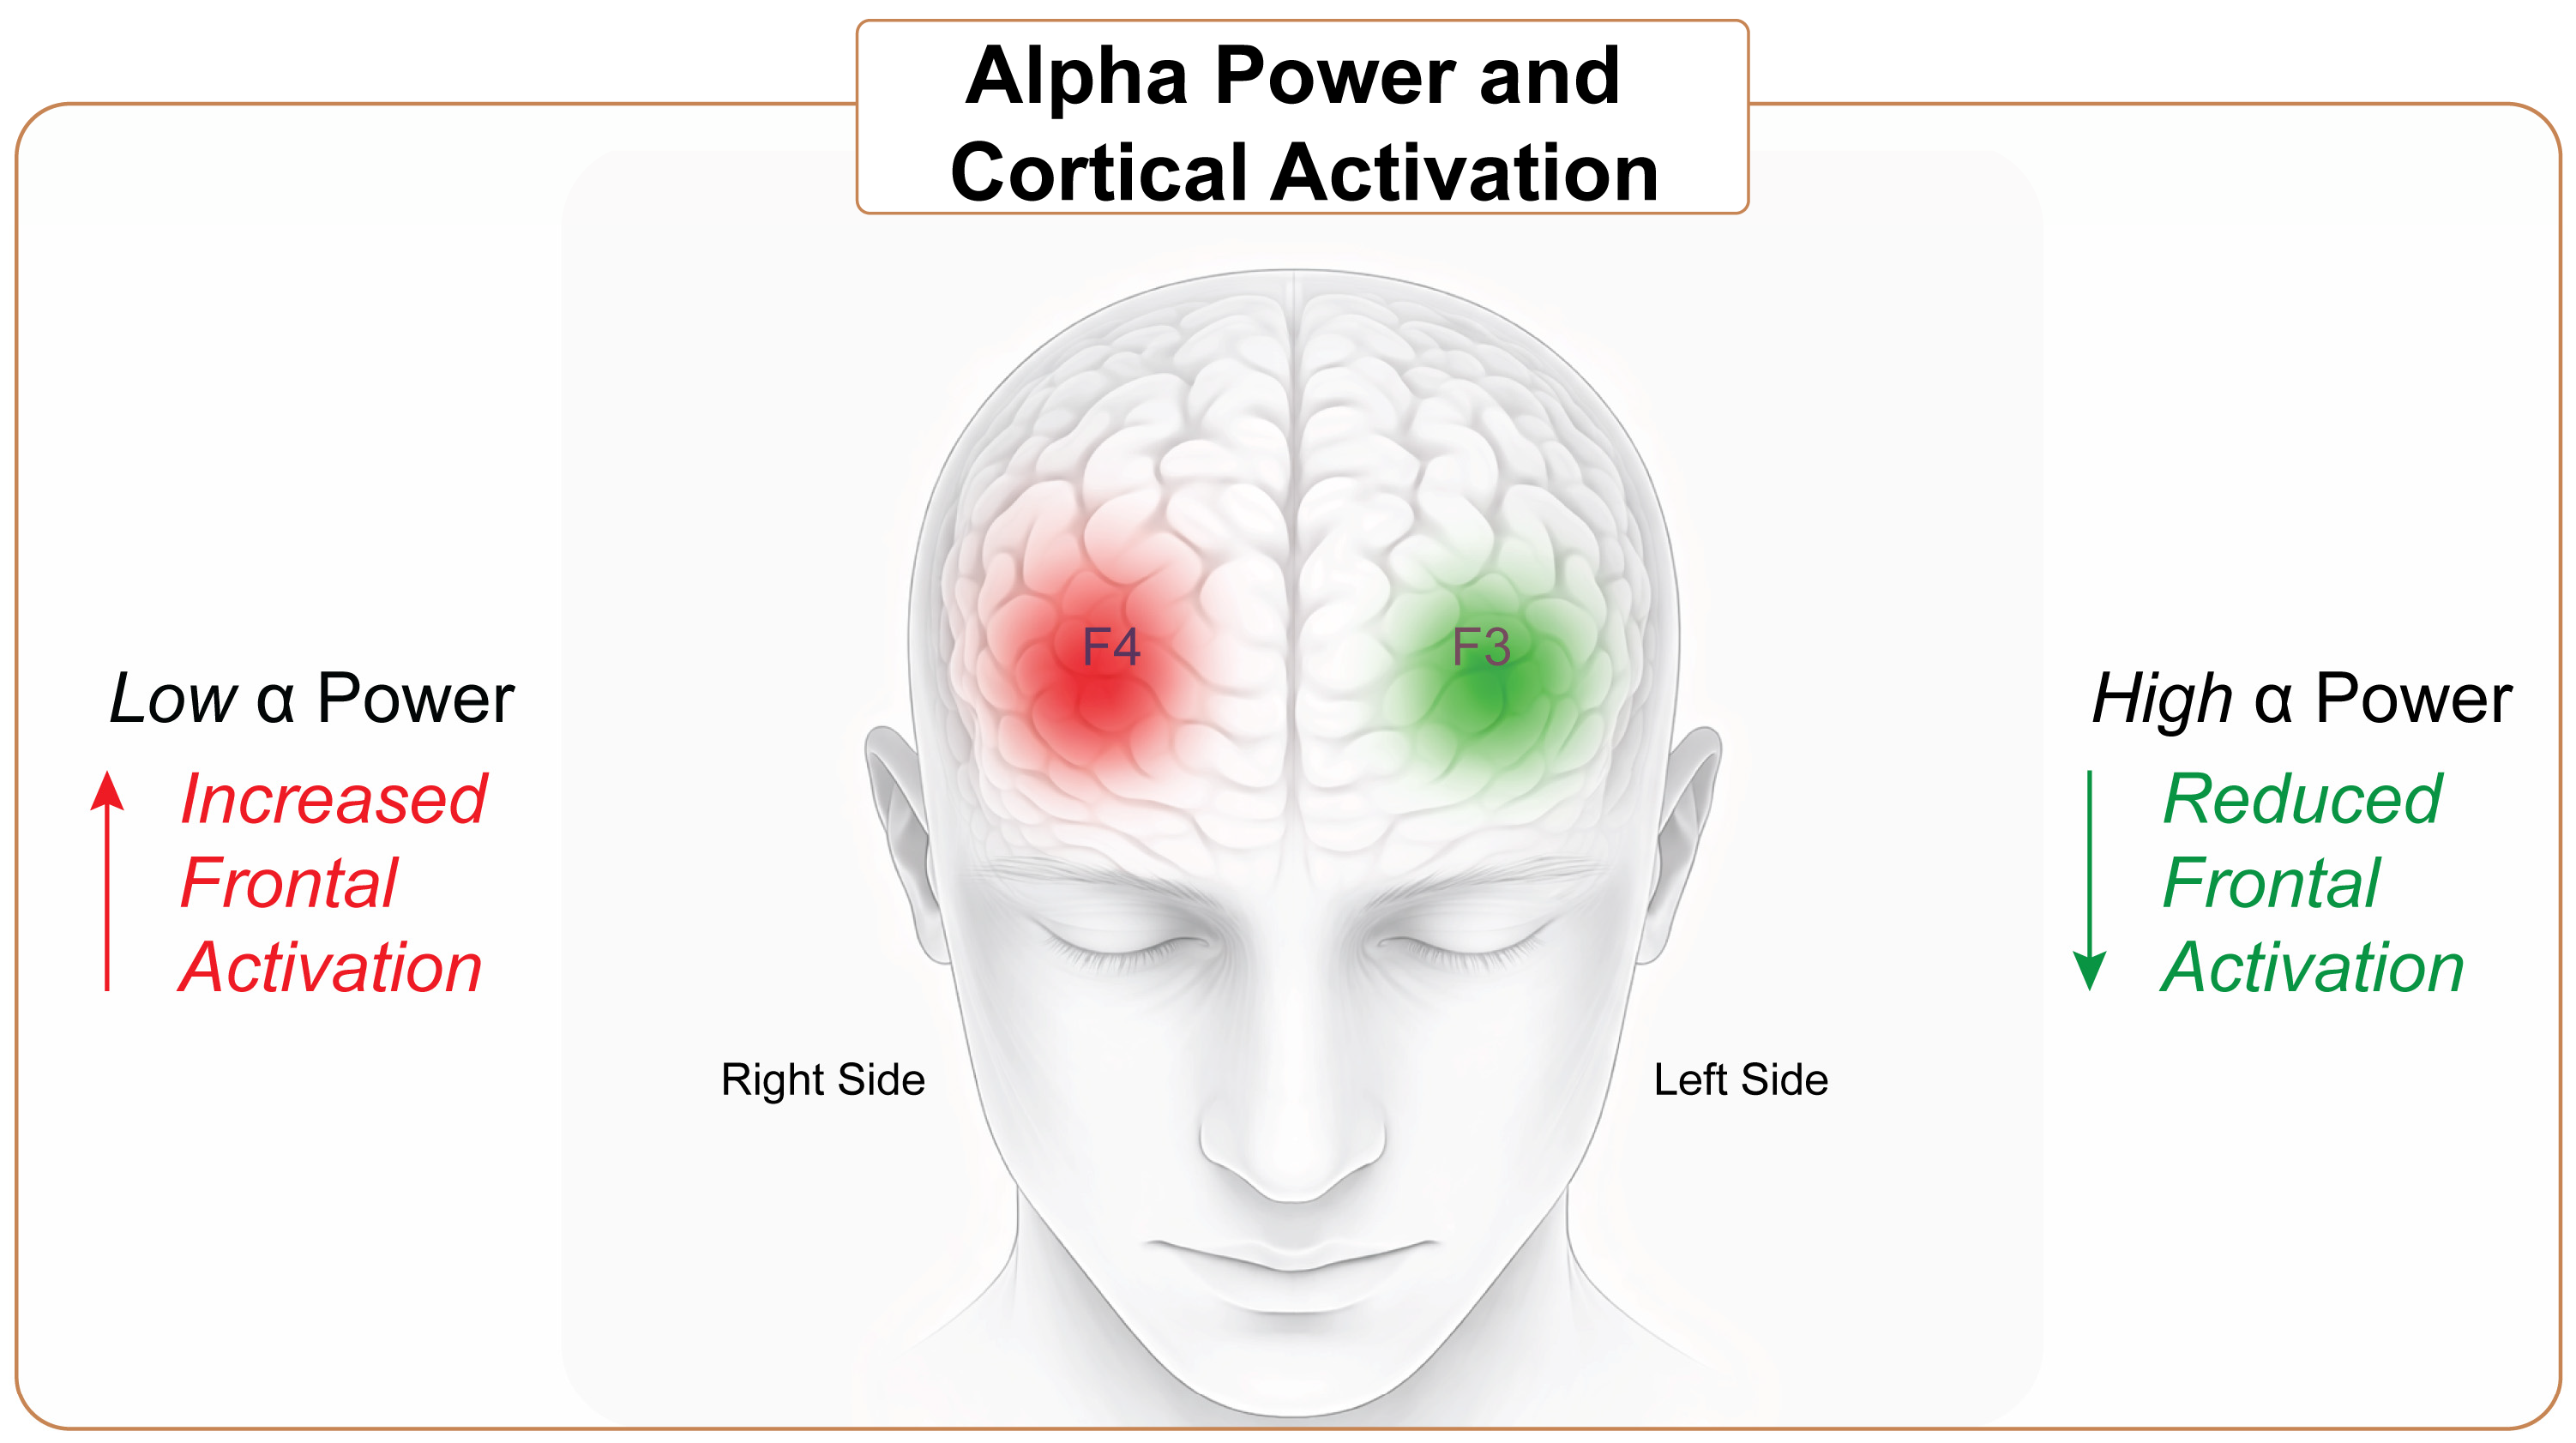
In the wake of research on the relationship between the frontal lobe and alpha waves, a specific interest has emerged in the phenomenon of asymmetric modulation of alpha waves in the prefrontal cortex, known as cerebral asymmetry or frontal alpha asymmetry (FAA). FAA reflects variations in alpha activity between the right and left hemispheres and serves as a neural marker of emotional processing, particularly in relation to individual differences in positive and negative affect, and motivational tendencies [46]. Davidson et al. [47] presented evidence that the difference in frontal alpha hemispheres represents the approach and withdrawal motivation. They found that greater relative right frontal activation (higher left alpha frequency) was significantly associated with negative responses and withdrawal. In contrast, left frontal activation was associated with approach motivation and positive responses (Figure 1). Subsequent studies have supported this model [45,46,48,49,50], including research on exposure to greenery [38]. Other evidence, however, has reported conflicting findings, indicating that exposure to greenery views increases right frontal activation [51,52]. This suggests an engagement of involuntary attentional processes rather than solely eliciting emotional effects [45,53,54,55,56]. These contradictory FAA results, which support both affective and attentional interpretations, highlight a gap to which the present study contributes additional evidence by examining neural responses to different forms of greenery in architectural environments.

1.5. Do Nature-Derived Visual Features Elicit Similar Neural Responses?

We spend more than 90% of our time in indoor environments [57,58,59]. As a result, there is a growing effort to elucidate the relationship between environmental stimuli and neural activity to maximize the effective use of greenery. In settings where natural greenery is unavailable, it is important to explore potential substitutes that might evoke similar restorative effects. In some cases, architects and interior designers use green hues or greenery patterns to replicate natural greenery. Therefore, an investigation into different types of greenery representation is crucial for expanding the knowledge on greenery integration. However, until now, FAA has been mainly analyzed in studies comparing natural and non-natural settings (e.g., urban landscapes vs. natural greenery) [34,38,54,60,61,62,63,64]. To close this gap, this study examines whether greenery alternatives, such as color and pattern, can elicit similar neural responses to those of natural greenery, particularly in environments where real plants or natural views are limited.
A common experience in nature is the irregular patterns of light and shadow created when sunlight filters through a tree canopy, known as dappled light. Even in the absence of a direct view of nature, these dynamic light patterns serve as subtle reminders of natural surroundings. In this study, this effect is referred to as “Shadows of Greenery”. This phenomenon relates to fractal geometry, explored by mathematician Benoit Mandelbrot, who observed such patterns in nature (including tree branches, cloud formation, and coastlines) [65]. The fractal dimension (D) describes the scaling relationship of these structures by measuring their repetition at different scales. A D value near one indicates a smooth, sparse pattern, while a D value closer to two represents a highly intricate, detailed structure [66]. Research has shown that both natural and mathematical fractals can influence esthetic preferences and human brain dynamics [66]. Furthermore, fractals can induce alpha responses, indicating a state of relaxation [67]. Augustin S. [68] suggests that a preference for such patterns may be an adaptive trait that signals favorable environmental conditions, such as the presence of nearby trees that can serve as shelter. More recent research finds that shadows of greenery projected onto room surfaces through a window, particularly those with medium to high complexity, were significantly more preferred and induced higher levels of relaxation compared to simpler patterns [69].
Another commonly used alternative to natural greenery is the color green, often applied through green-colored walls or other forms of interior design elements intended to evoke associations with nature through color. However, limited research has been completed on the effects of green color on brain activity indoors. One study found that the color green was associated with higher levels of alpha and theta bandwidth [70], while another study that investigated the effect of perceiving color in an indoor environment found that a green room was the only room that had a depression score of 0.00 [71].
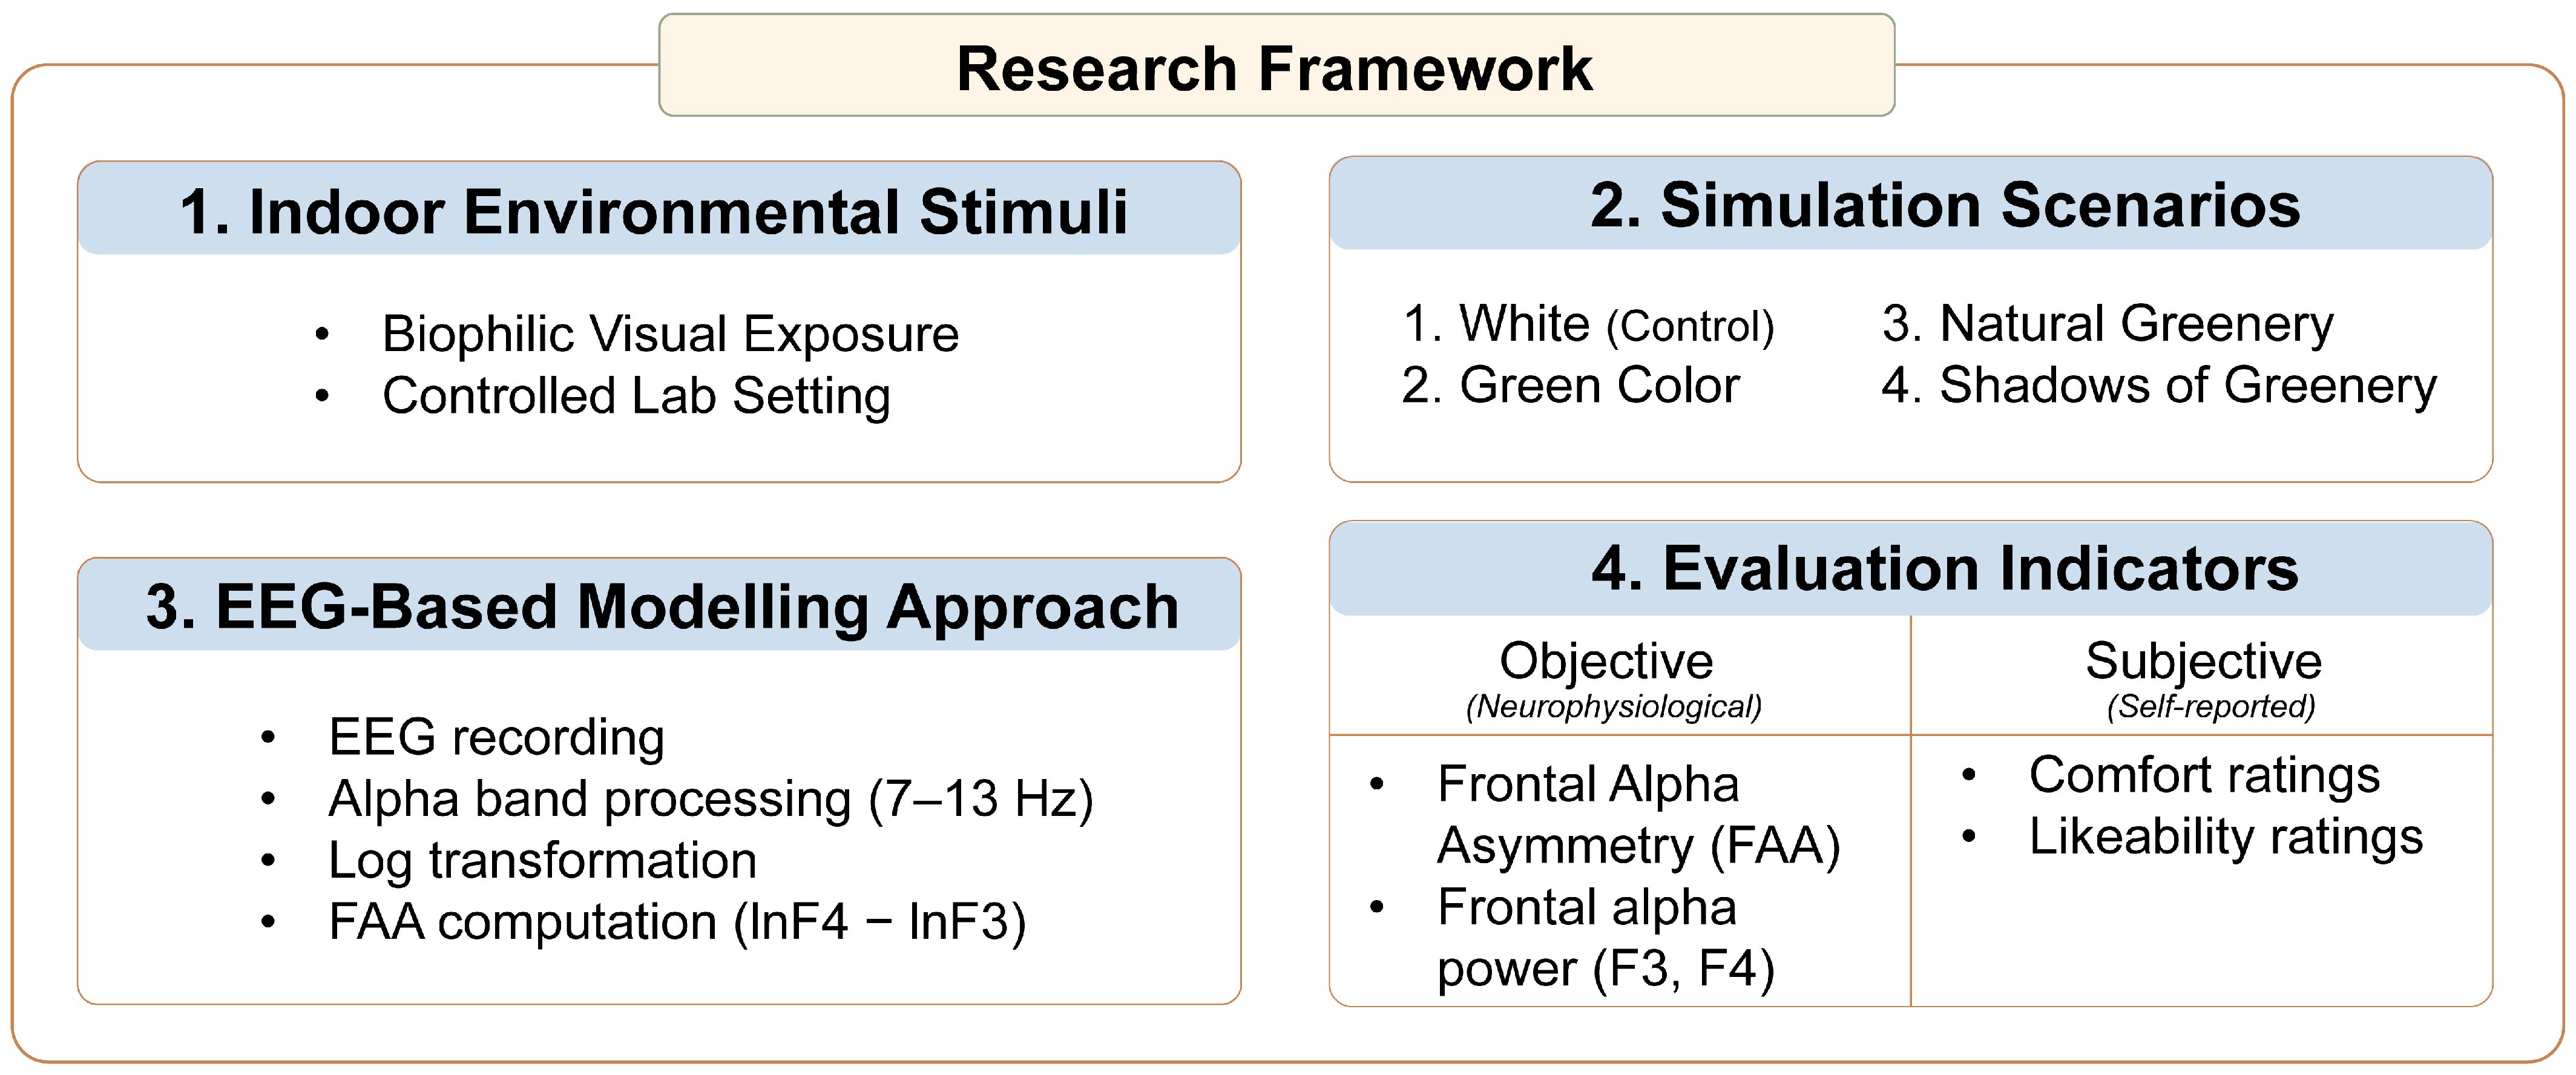
As discussed above, existing research suggests that fractal patterns and green color can increase relaxation and preference for indoor environments. However, it remains unclear whether these substitutes from nature activate neural processes comparable to those elicited by actual natural greenery. This question is directly relevant to architectural design because these substitutes are often used where indoor environments lack views of natural greenery. To the best of our knowledge, no previous study has directly compared the neural responses to Natural Greenery, Shades of Greenery, and Green Color using FAA, a neurophysiological marker of approach-withdrawal motivation. While earlier research primarily examined the broader relationship between nature and urban environments, the present study directly compares neural responses to natural greenery and commonly used design substitutes (green color and shadow patterns), providing a neurophysiological perspective on how different visual representations of greenery are processed in indoor environments. We hypothesize that Natural Greenery will elicit the strongest FAA response. Then we examine whether Shadows of Greenery and Green Color produce FAA patterns that are relative to natural greenery or remain distinguishable from it. Together, these analyses extend FAA research by examining nuanced representations of greenery, offering insights that may inform future biophilic design strategies. The conceptual research framework and analytical workflow of the study are illustrated in Figure 2.

2. Materials and Methods

2.1. Participants

In this study, 25 healthy volunteers (mean age ± SD 32.88 ± 8.68 years; 13 female) participated in all experimental conditions. All participants reported normal or corrected-to-normal vision and no history of neurological or psychiatric disorders. Participants who normally used corrective lenses were allowed to wear them during the experiment. Participants were recruited from the university community. Written informed consent was obtained from all participants, and all data were anonymized and protected in accordance with the Code of Ethics. Before the screening, we informed participants that the research involved investigating esthetic judgments and measuring brain waves, but we did not mention the experimental goals. The study was approved by the Ethics Committee of the University of Tokyo (approval date: 13 May 2021; reference number: 21-17).
Power analysis was conducted using G*Power 3.1 [72]. For the one-way repeated measures ANOVA with four conditions, assuming a medium effect size (f = 0.3), an alpha level of 0.05, a correlation among repeated measures of 0.5, and a non-sphericity correction ε = 0.75, the achieved power with this sample was 0.89. For the two-way repeated measures ANOVA with factors Trigger (four levels) and Hemisphere (two levels), under the same assumption, the achieved power was 0.99. Therefore, the study was adequately powered to detect medium-sized effects, although nonsignificant results should be interpreted with appropriate caution.

2.2. Stimuli Set

Four types of visual stimuli were prepared to systematically examine the effects of color, natural elements, and light-shadow patterns.
White Color (Control): The White Control condition consisted of a plain white background in the window view, eliminating visual input related to color, natural elements, or shadow patterns. This neutral baseline was created to ensure that the differences observed were due to the stimuli themselves, not to external visual factors.
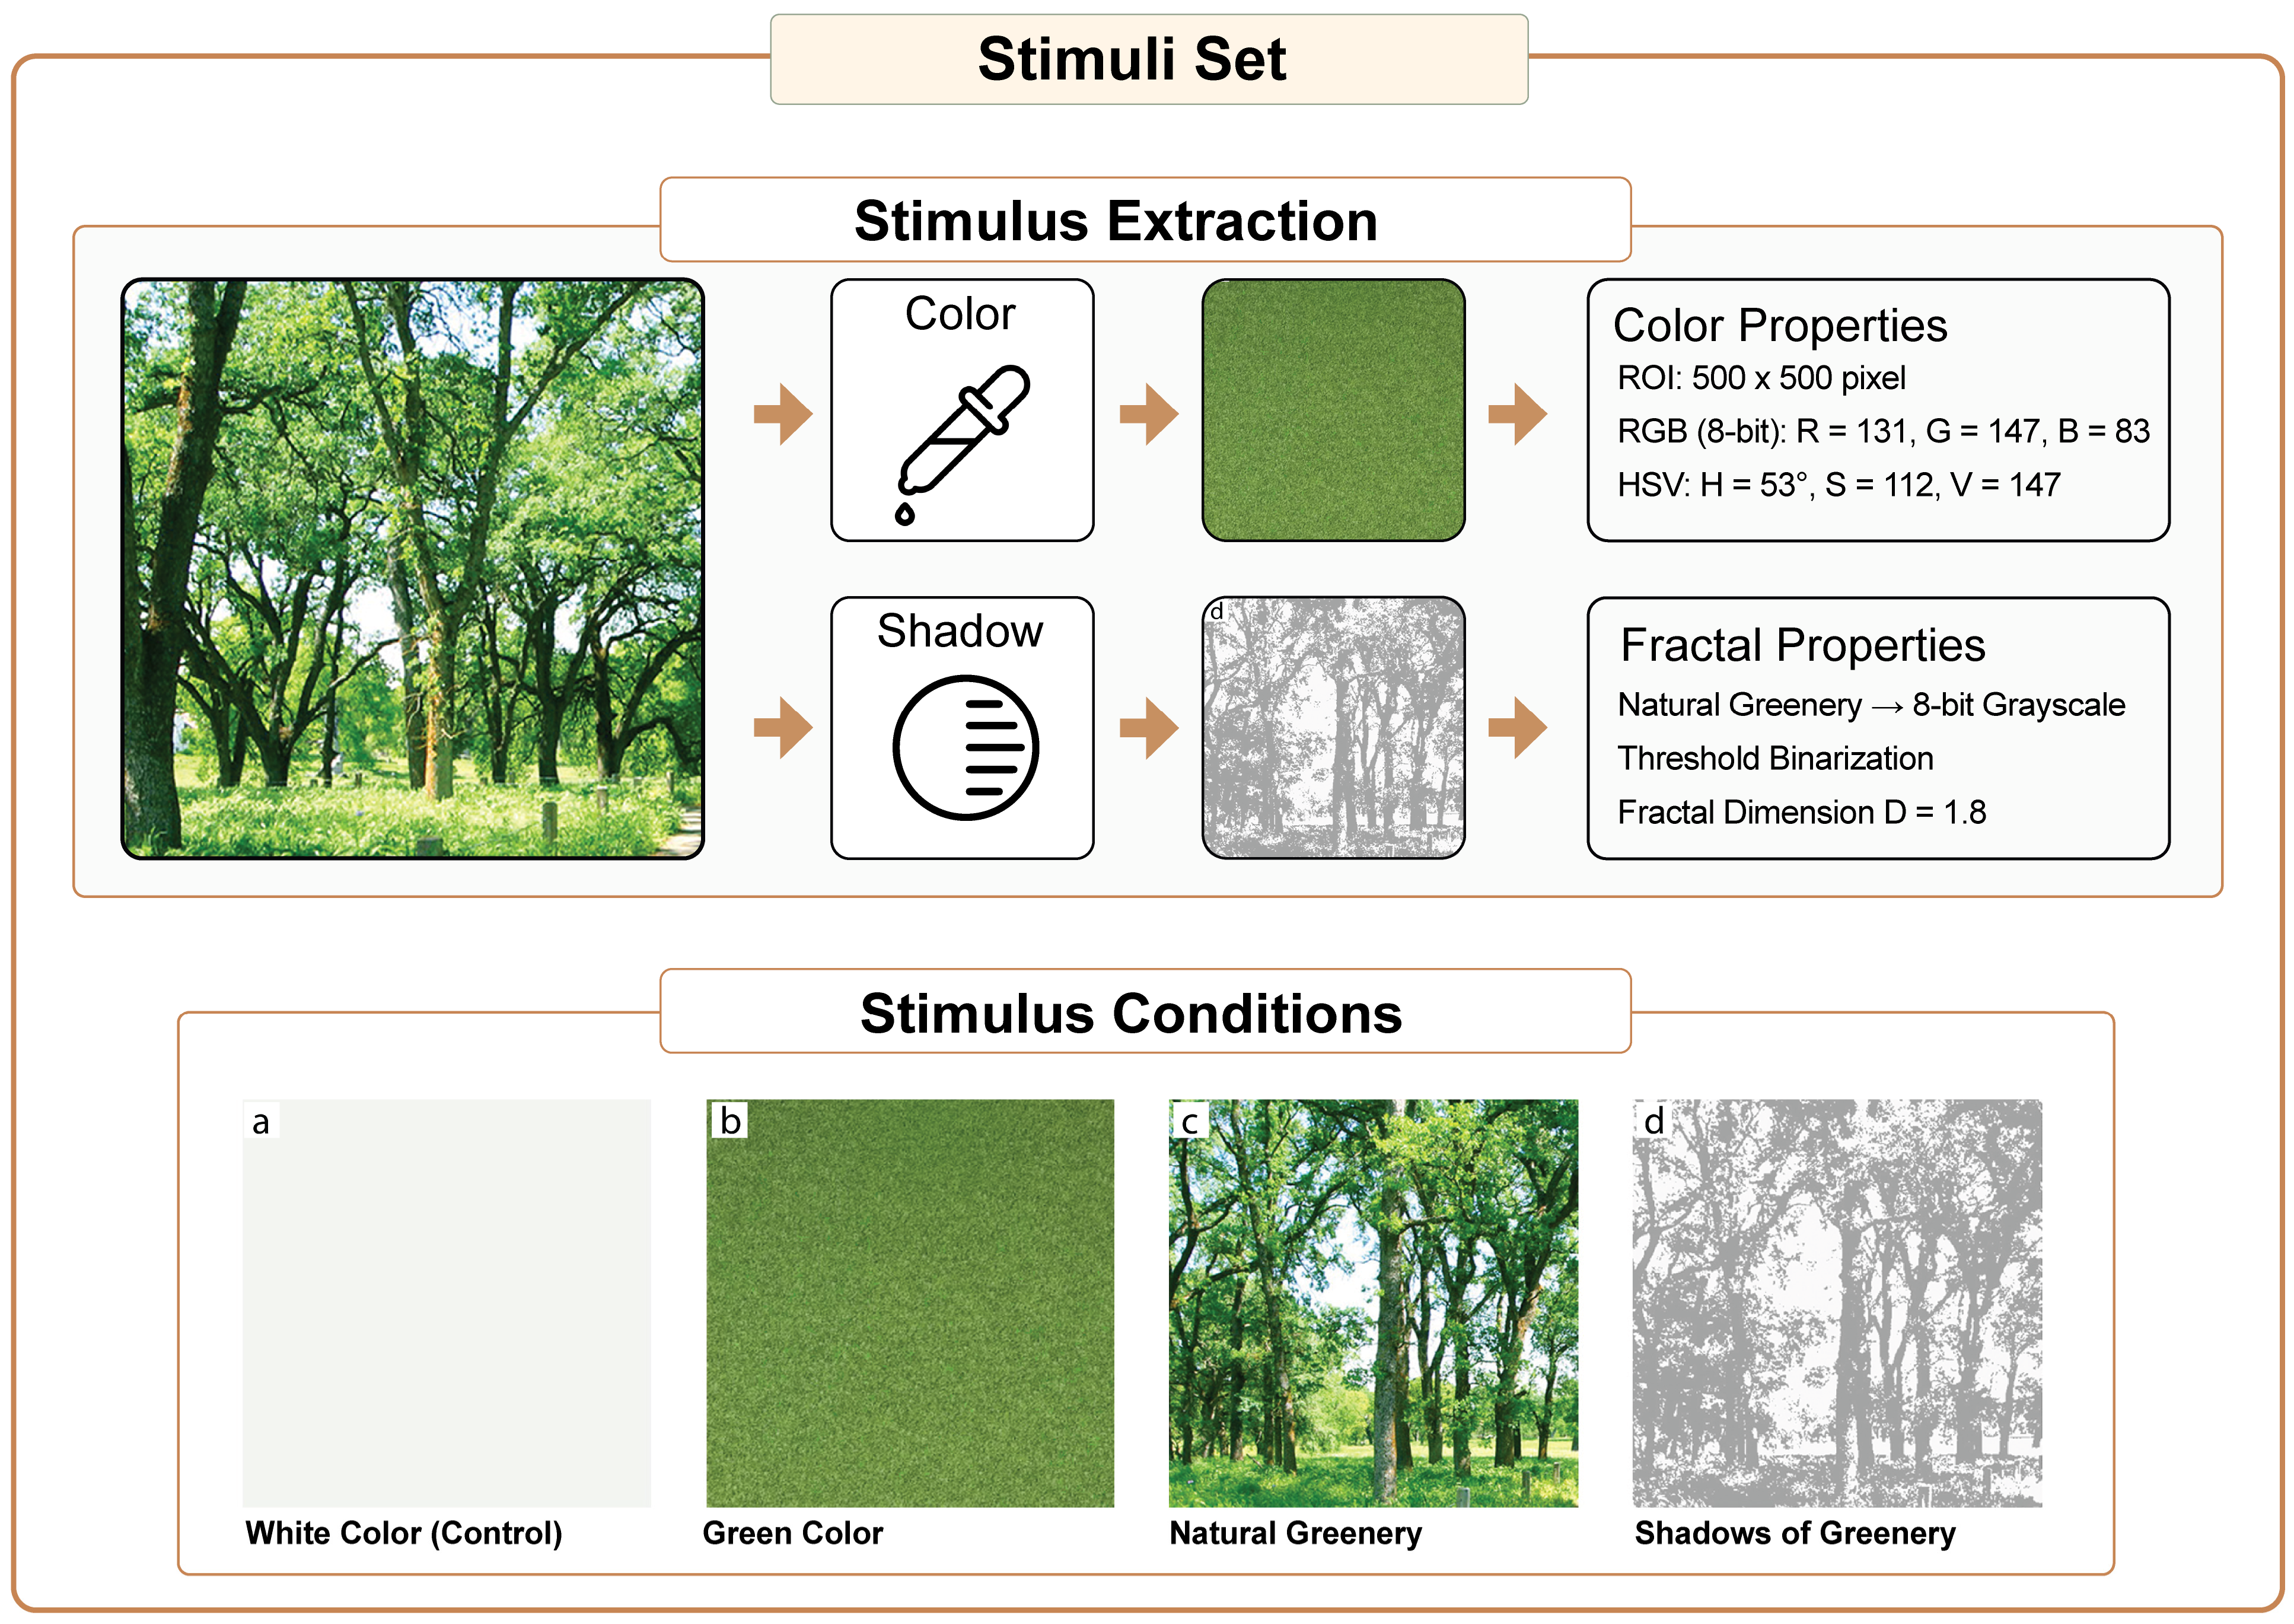
Green Color: The green color used in the Green Color stimulus was sampled from the Natural Greenery image. To quantitatively characterize the chromatic properties of the stimulus, mean RGB values were extracted from a centrally defined region of interest (ROI; 500 × 500 pixels), covering approximately 47% of the image area, within the Green Color stimulus using Fiji/ImageJ (ImageJ version 1.53c; https://imagej.net/software/fiji/). The resulting mean color values were R = 131, G = 147, and B = 83 (8-bit scale).
Natural Greenery: We selected a high-resolution photograph depicting a natural setting with trees to represent a direct view of natural greenery. This provided a reference for an ecological visual input, whereas the image remained static throughout the experiment.
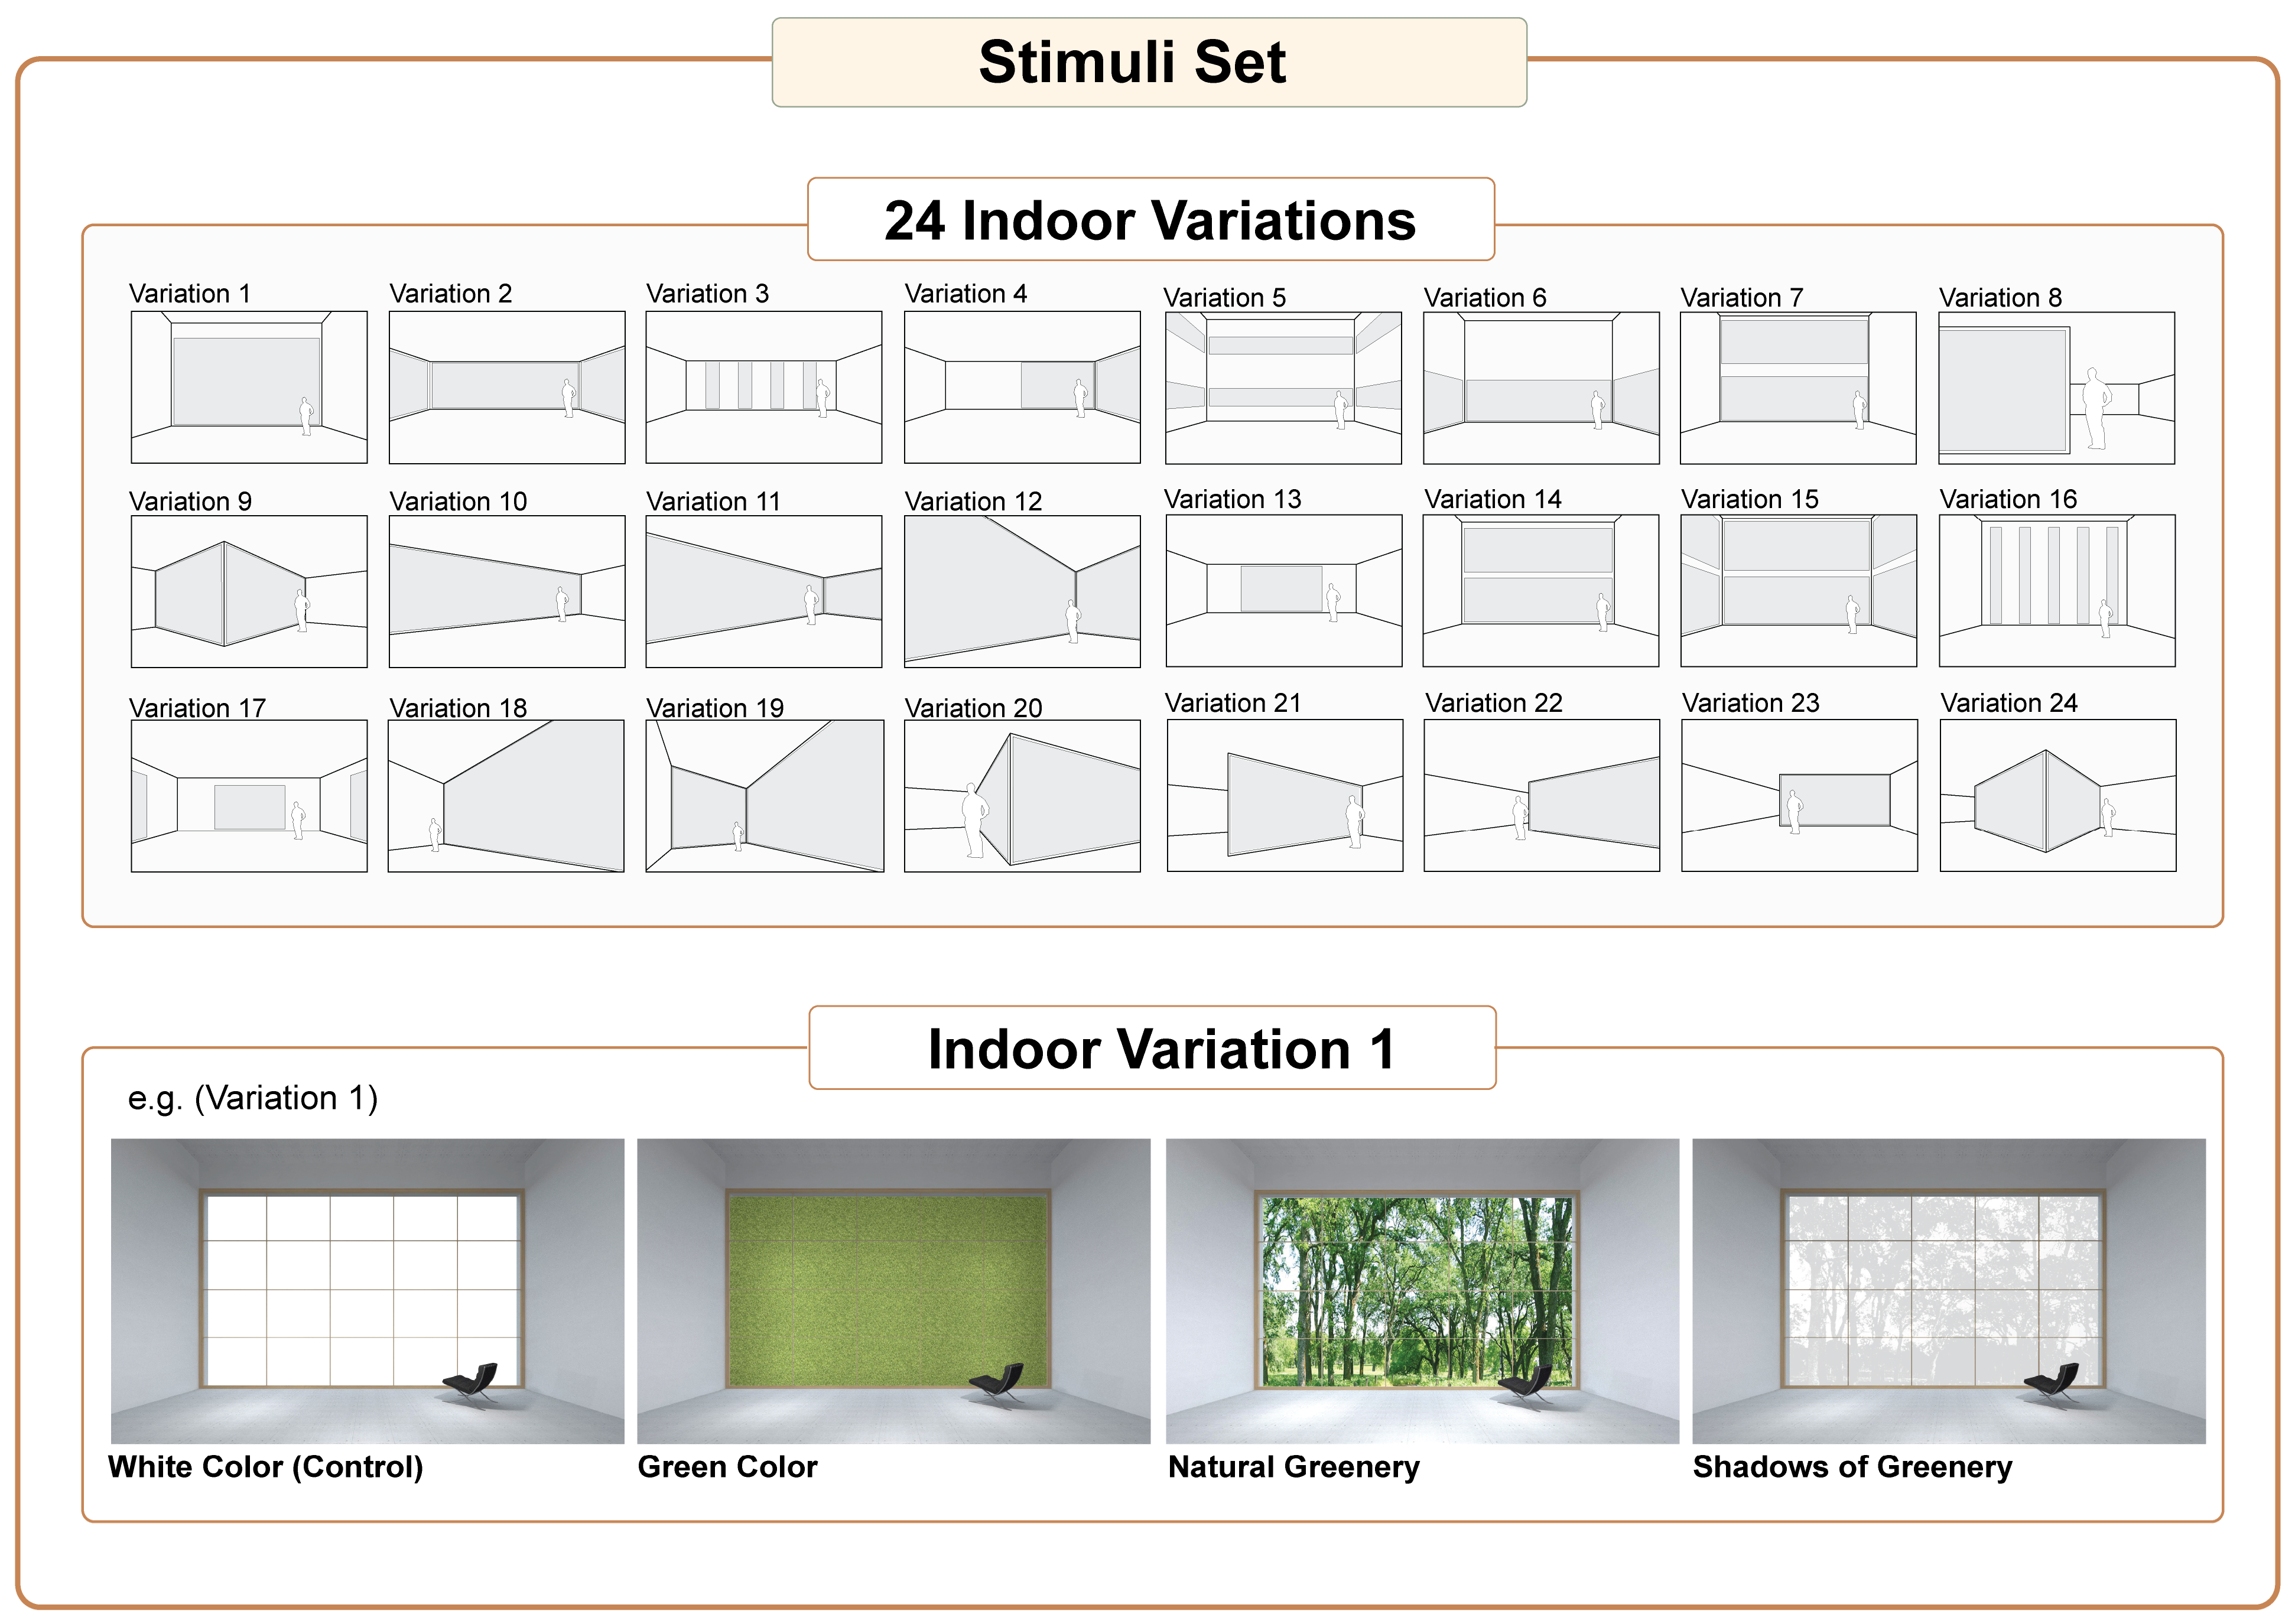
Shadows of Greenery: We used the same natural greenery image to capture the dappled-light effect and processed it using Fiji/ImageJ. We first converted the image to 8-bit grayscale. Then, we binarized it using the threshold function to increase contrast between light and shadow. Lastly, we applied fractal box counting, yielding a fractal dimension of D = 1.8. This dimension represents a medium-to-high fractal complexity. Similar fractal dimensions (approaching D ≈ 1.9) have been used to represent highly detailed tree and vegetation branching patterns in experimental studies of fractal perception [66]. Moreover, as recent research found that shadows of greenery projected onto room surfaces through a window, particularly those with medium to high complexity, were significantly more preferred and induced higher levels of relaxation compared to simpler patterns [69], the choice for this dimension was intended to approximate naturally occurring shadow patterns of vegetation. Since the binarization process produced a high-contrast black-and-white image, the opacity of the shadow regions was reduced to achieve a more neutral grayscale image. This helped reach a balanced perception of the stimulus without excessive contrast effects. Like the natural greener condition, this stimulus remained static throughout the experiment. The stimuli set is illustrated in Figure 3.
For this study, we designed 24 room variations with views toward the windows. The overall dimensions of the rooms remained constant while the window shapes and placements were altered. All four stimuli (White Color (control), Green Color, Natural Greenery, and Shadows of Greenery) were presented in every room variation, resulting in 96 final variations. Figure 4 shows all 24 room variations and the use of all four stimulus conditions within a single room variation.
The purpose of testing the stimuli under multiple layouts was not to compare these window configurations as independent variables, but rather to confirm that the observed effects of the stimuli were not dependent on a single room configuration. We left the rooms intentionally non-materialized so that interior design features would not impose additional effects beyond the window views themselves. While some influence of room layout cannot be entirely ruled out, the study was designed to maintain a clear and focused investigation on greenery-related visual stimuli.

2.3. Experimental Design and Data Collection

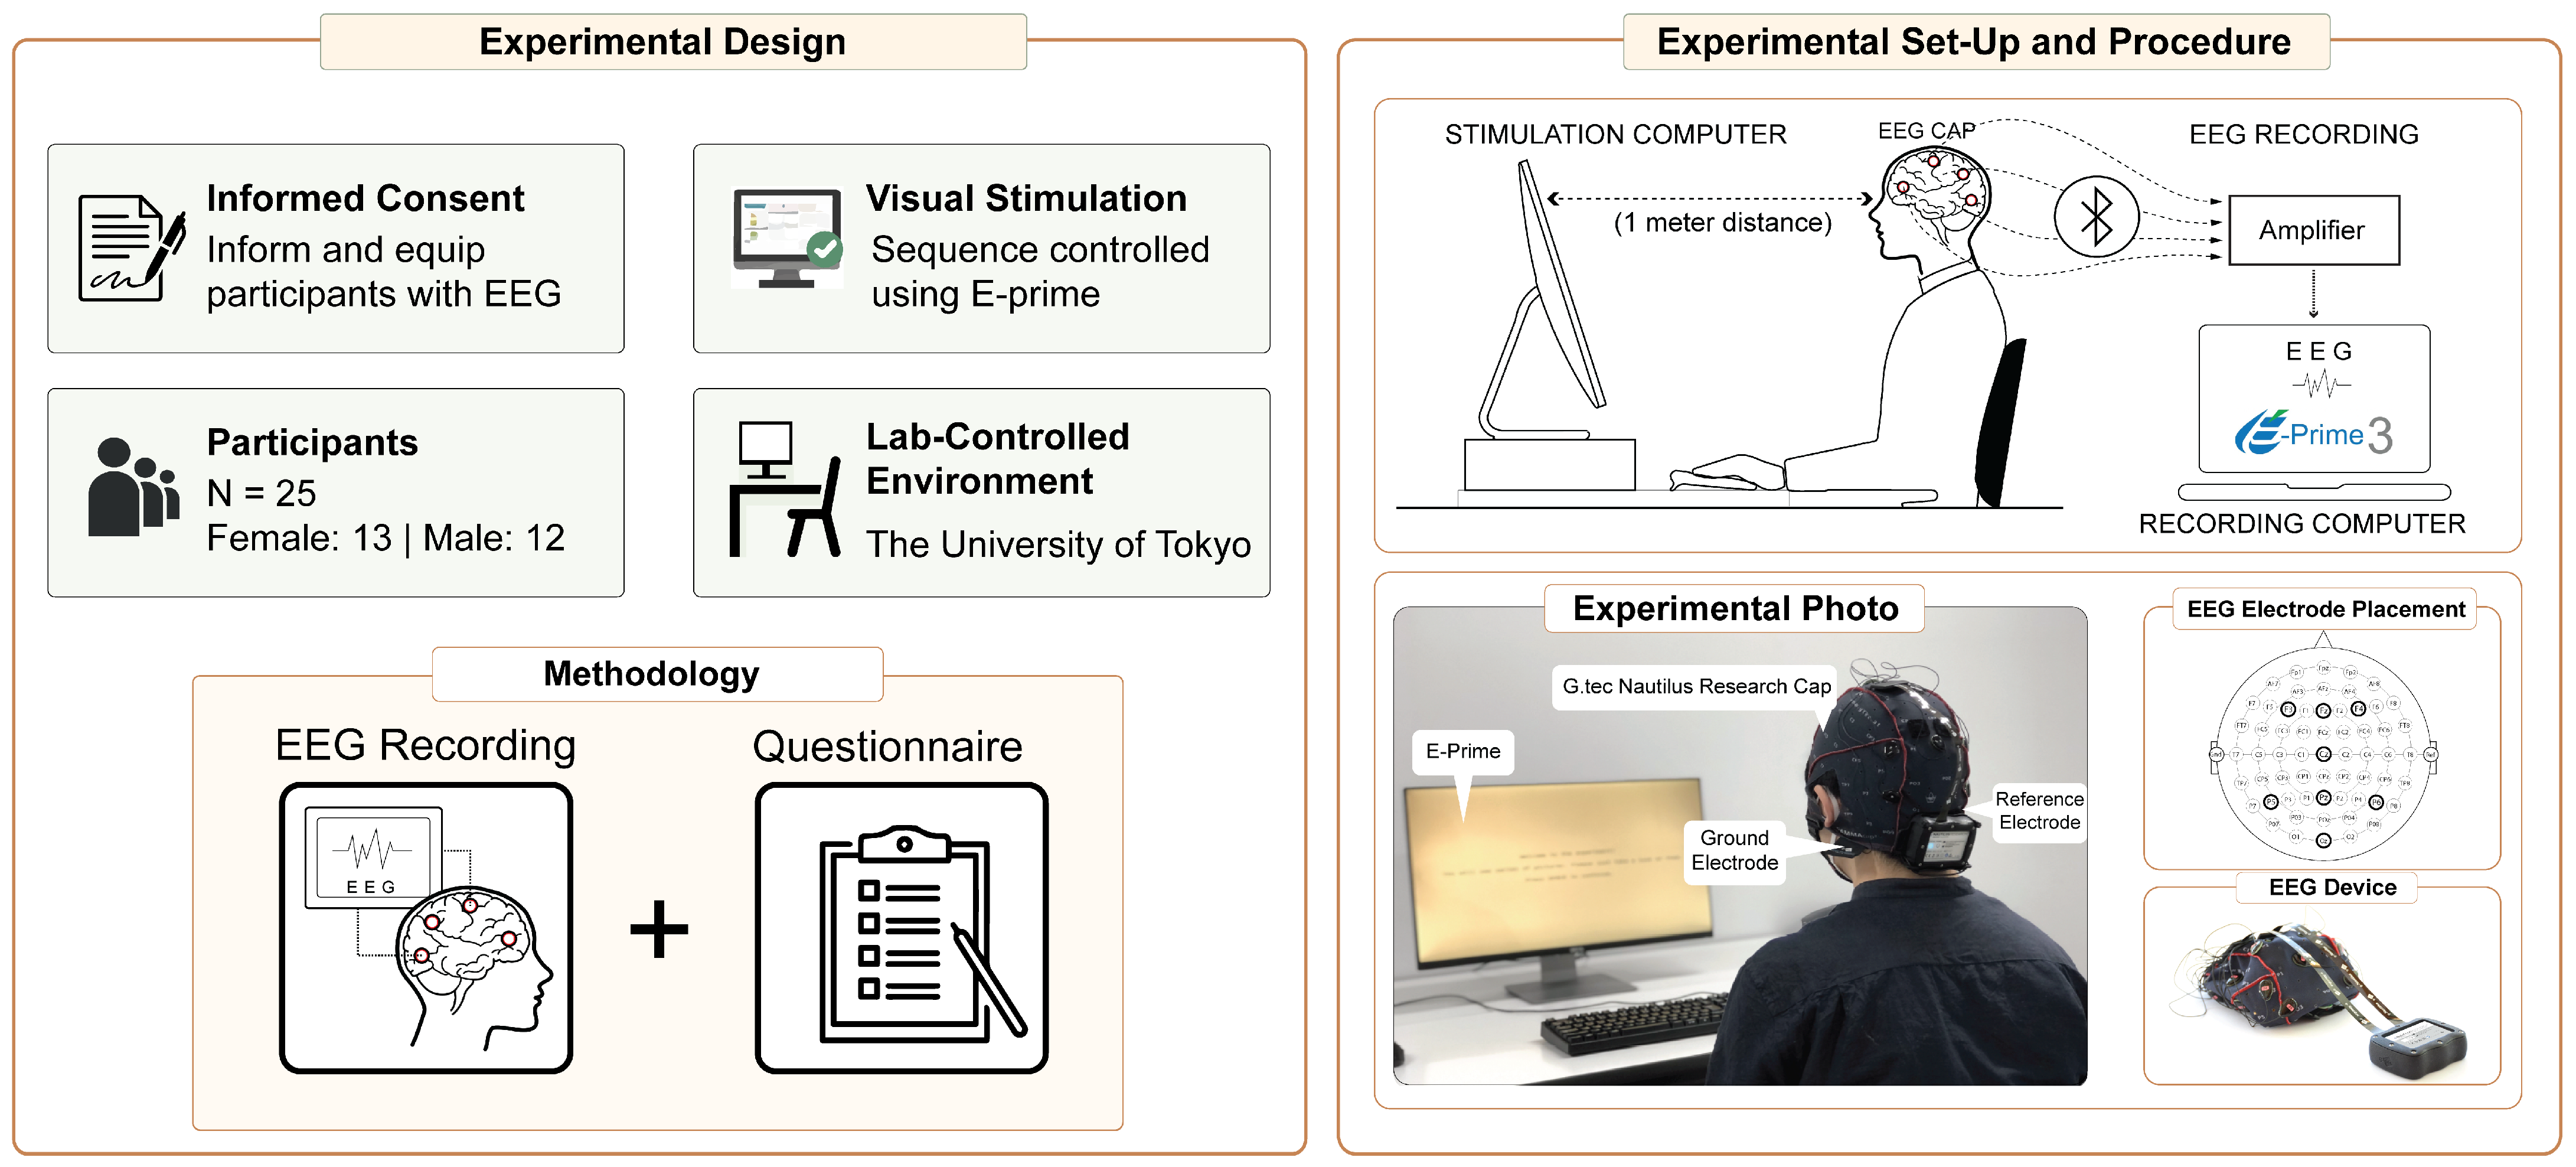
Data collection took place in a laboratory-controlled environment on the premises of the University of Tokyo. Participants were instructed to passively sit on a chair placed 1 m away from the viewing screen and follow the screen instructions (Figure 5).
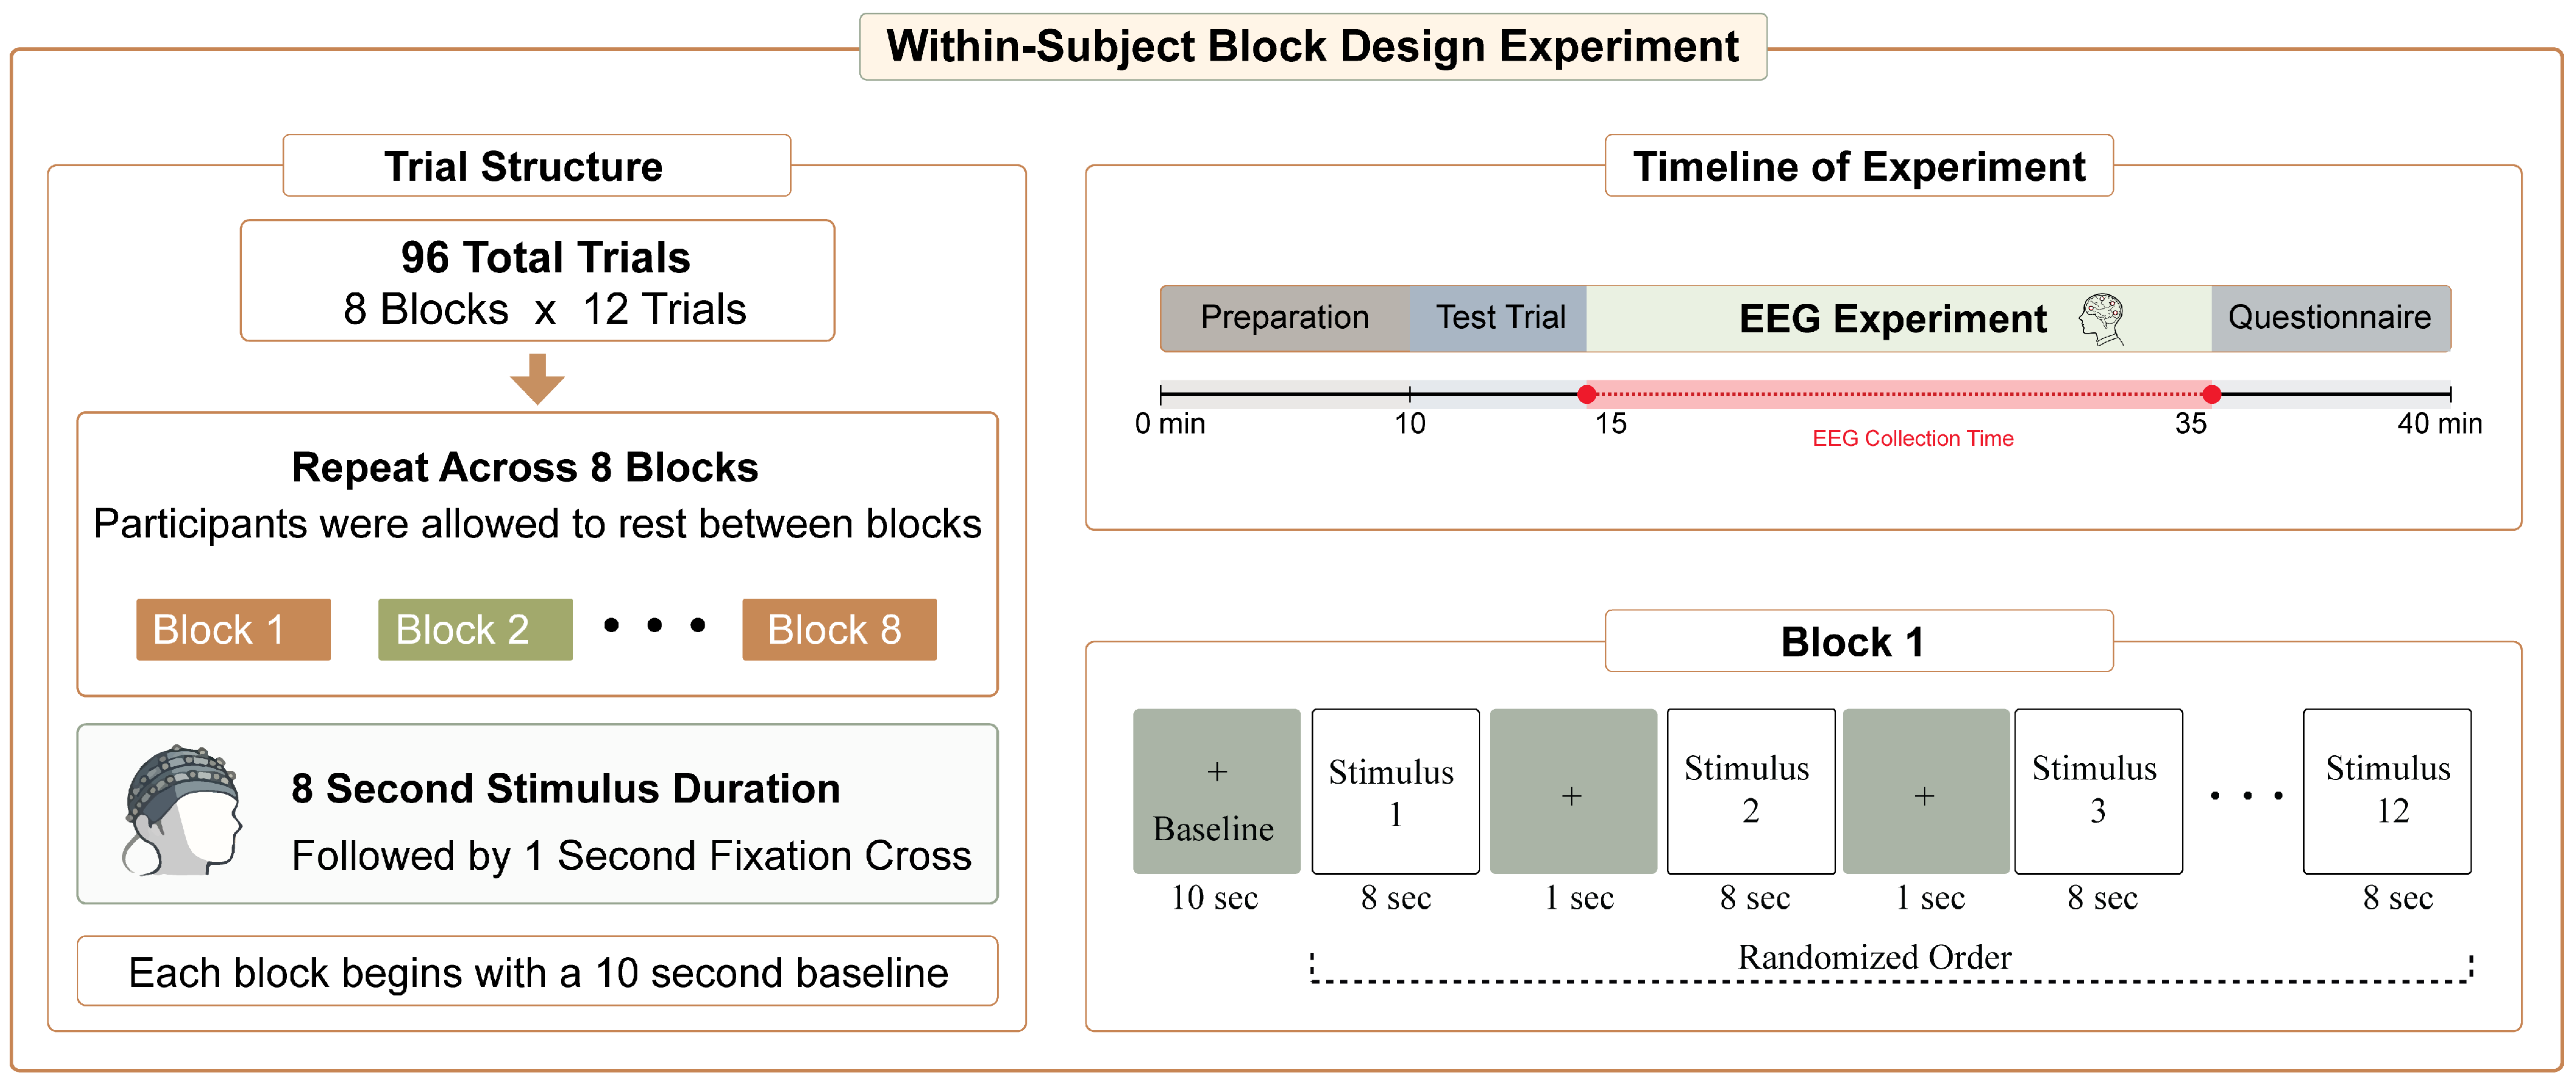
For this experiment we used a within-subject block design. We divided the critical trials into eight blocks of 12 stimuli, each beginning with a 10 s baseline. After each block, participants were encouraged to rest before starting the next at their own pace. Each participant completed 96 trials in total (8 blocks × 12 trials). To control the sequence, we used E-Prime 3.0 (Psychology Software Tools, Inc., Pittsburgh, PA, USA), which delivered the visual stimuli and automatically recorded the onset time of each segment.
The four stimulus conditions (White Color, Green Color, Natural Greenery, and Shadows of Greenery) were presented in a randomized order within each block. EEG stimulus presentation durations vary across studies, depending on research objectives and methodological constraints. Previous research shows that frontal alpha asymmetry (FAA) differences can emerge within milliseconds (300 ms) [73]. Given that our study focused on neural responses, rather than sustained emotional states, we chose an 8 s EEG stimulus duration. The stimulus duration was selected to be sufficiently long to allow stimulus processing while remaining short enough to minimize common EEG artifacts, such as eye blinks and attentional drift. The 8 s viewing period was followed by a 1 s fixation cross (Figure 6).
First, we asked participants to carefully read and sign the informed consent paperwork. Then, we equipped them with the EEG cap and gave them a short period of time to adjust to the equipment. A brief test recording was conducted to verify signal quality, and to familiarize participants with the experimental procedure. After that, we informed them of the tasks they would perform during the experimental session.
After viewing all conditions, participants rated each condition on comfort and likability using a 7 point semantic differential scale. Subjects were asked to judge the opposites presented by scores of +3 to −3, ranked in the following order: Very (+3/−3), Moderately (+2/−2), Slightly (+1/−1), Neither (0).
The four indoor environmental conditions (White Color, Green Color, Natural Greenery, and Shadows of Greenery) were grouped and analyzed according to their assigned visual trigger, independent of room variation, which was kept consistent across conditions.

2.4. EEG Acquisition and Preprocessing

Electroencephalography (EEG) acquisition and reporting followed current community recommendations for EEG/MEG methods reporting, including explicit specification of sensor layout, reference/ground, sampling rate, and filter settings [74]. EEG was recorder in a controlled laboratory environment using g.Nautilus Research wireless EEG headset (g.tec medical engineering GmbH, Schiedlberg, Austria), equipped with eight dry g.Sahara electrodes, positioned according to the international 10–20 system for electrode placement (Fz, F3, F4, Cz, Pz, P4, P5, Oz). During acquisition, signals were referenced to the right-ear clip and grounded using the ear-mounted ground electrode, consistent with the g.Nautilus acquisition configuration that uses dedicated mastoid/ear reference and ground clips [75]. This reference was maintained throughout the entire preprocessing pipeline, as the reference signal was subtracted at each time point during acquisition; thus, no additional re-referencing was applied during analysis, in accordance with g.tec’s acquisition protocol. EEG data were sampled at 250 Hz, which is a typical hardware-supported sampling rate for the g.Nautilus platform and provides sufficient bandwidth for analysis focused on frequencies below 50 Hz. Online filtering included a 0.5–50 Hz bandpass and a 50 Hz line-noise notch (implemented as a 48–52 Hz bandstop), consistent with g.Nautilus example pipelines for 50 Hz power-line environments, such as Eastern Japan (Tokyo), where the experiment was conducted. Data were then exported for analysis using g.tec’s tools and MATLAB (Version R2024a, MathWorks, Natick, MA, USA). EEG signals were amplified by a g.Nautilus amplifier.
Preprocessing decisions were defined a priori and reported in accordance with EEG/MEG reporting recommendations, including artifact criteria and documentation of rejected data [74,76]. Trials were screened for ocular and myogenic contamination using a two-stage procedure: (1) automated amplitude-based flagging and (2) visual confirmation. Amplitude-based flagging used a peak-to-peak threshold of ±75 µV, a commonly used criterion in EEG epoch screening and consistent with published examples for threshold-based artifact rejection.
To ensure data quality, flagged trials were then visually inspected for confirmation following established EEG preprocessing guidelines [77]. Trials containing clear artifacts were excluded for further analysis. Because artifact prevalence can differ across experimental conditions [74], the number of retained and rejected trials was tracked per participant and condition.
In line with common EEG preprocessing practice [77], participant-specific adjustments were applied in cases of unusually high EEG amplitude variance. For four participants showing consistently high alpha amplitude without behavioral or visual evidence of artifact contamination, the amplitude threshold was adjusted to ±100 µV. This adjustment reduced unnecessary rejection of physiologically plausible high-amplitude alpha activity while maintaining artifact control.

2.5. Alpha Power Extraction and FAA Calculation

Alpha power was obtained using a FFT-based bandpass filter between 7 and 13 Hz implemented in the g.Nautilus processing pipeline (g.tec medical engineering GmbH, Schiedlberg, Austria). The software computes spectral power over 0.5 s sliding windows (125 samples) with a 124-sample overlap. For each participant stimulus condition, all retained 8 s trials were averaged to yield a single mean alpha power value (in µV2) per electrode (F3 and F4). The entire 8 s segment was treated as one analysis unit; no further temporal subdivision or segmentation was applied within the epoch. Thus, one alpha power value per electrode was obtained per participant per condition.
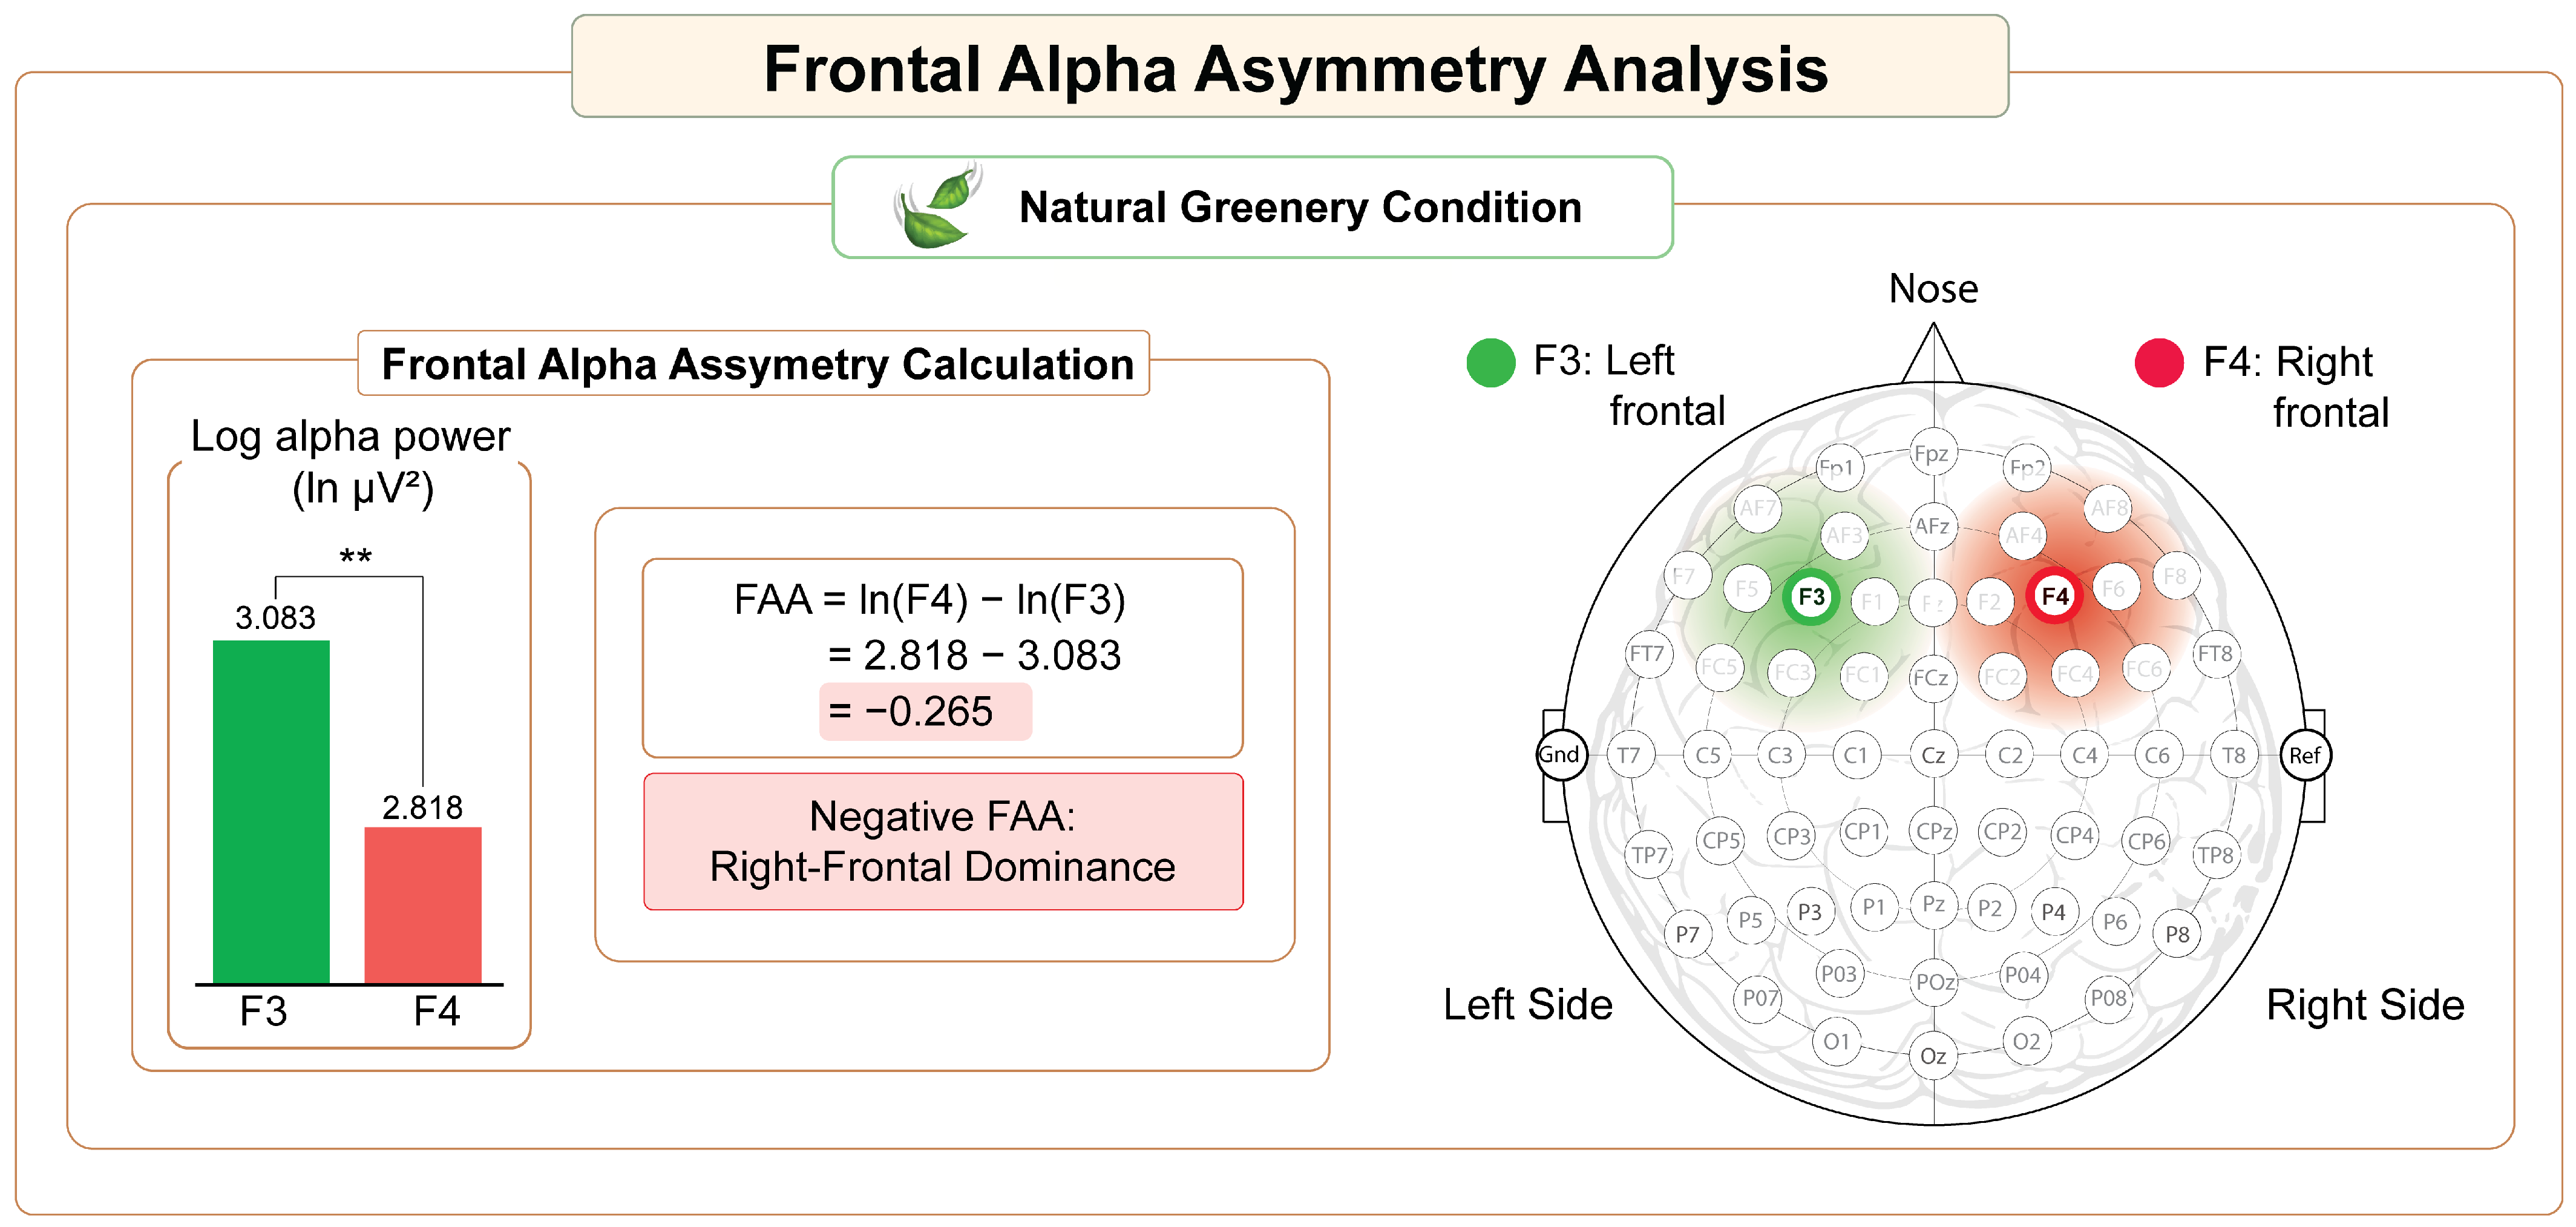
The extracted alpha power values were transformed by calculating the natural logarithm (ln) of µV2 values. Frontal alpha asymmetry (FAA) was calculated as the difference between the natural log of alpha power at the right frontal site (F4) and the left frontal site (F3), i.e., FAA = ln(F4) − ln(F3). This log-transformed metric, essentially the log ratio of right to left alpha power, is a widely used and validated approach in EEG research to quantify hemispheric asymmetry [47,48,50,78].
We interpret FAA as an index of relative hemispheric differences in frontal alpha-band power during stimulus viewing, computed using the log-difference metric that is commonly used in FAA methodology [79].
In the present study, FAA serves as a comparative neural index across within-subject conditions rather than as a biomarker of attention or affect. Although FAA has been linked to motivational and affective processes in some literature, ongoing theoretical and methodological debates persist, and conclusions are sensitive to analytic and referencing choices.

2.6. Statistical Analysis

We used IBM SPSS Statistics (v 29.0) to perform all the analyses. Given the within-subject experimental design and the comparison across multiple stimulus conditions, repeated measures ANOVA was selected as an appropriate statistical approach to account for correlations among repeated observations within the same participants. For the EEG, frontal alpha asymmetry (FAA = ln F4 − ln F3) was first examined with a one-way repeated measures ANOVA across the four window-view triggers (White Color (control), Green Color, Natural Greenery, and Shadows of Greenery). To maximize statistical power, a complementary two-way repeated measures ANOVA was then run with Trigger (four levels: White, Green Color, Natural Greenery, Shadows of Greenery) and Hemisphere (two levels: ln F4, ln F3) as within-subject factors. When Mauchly’s test indicated a violation of sphericity, we applied Greenhouse–Geisser corrections to the F-tests and Bonferroni adjustments to all pairwise contrasts.
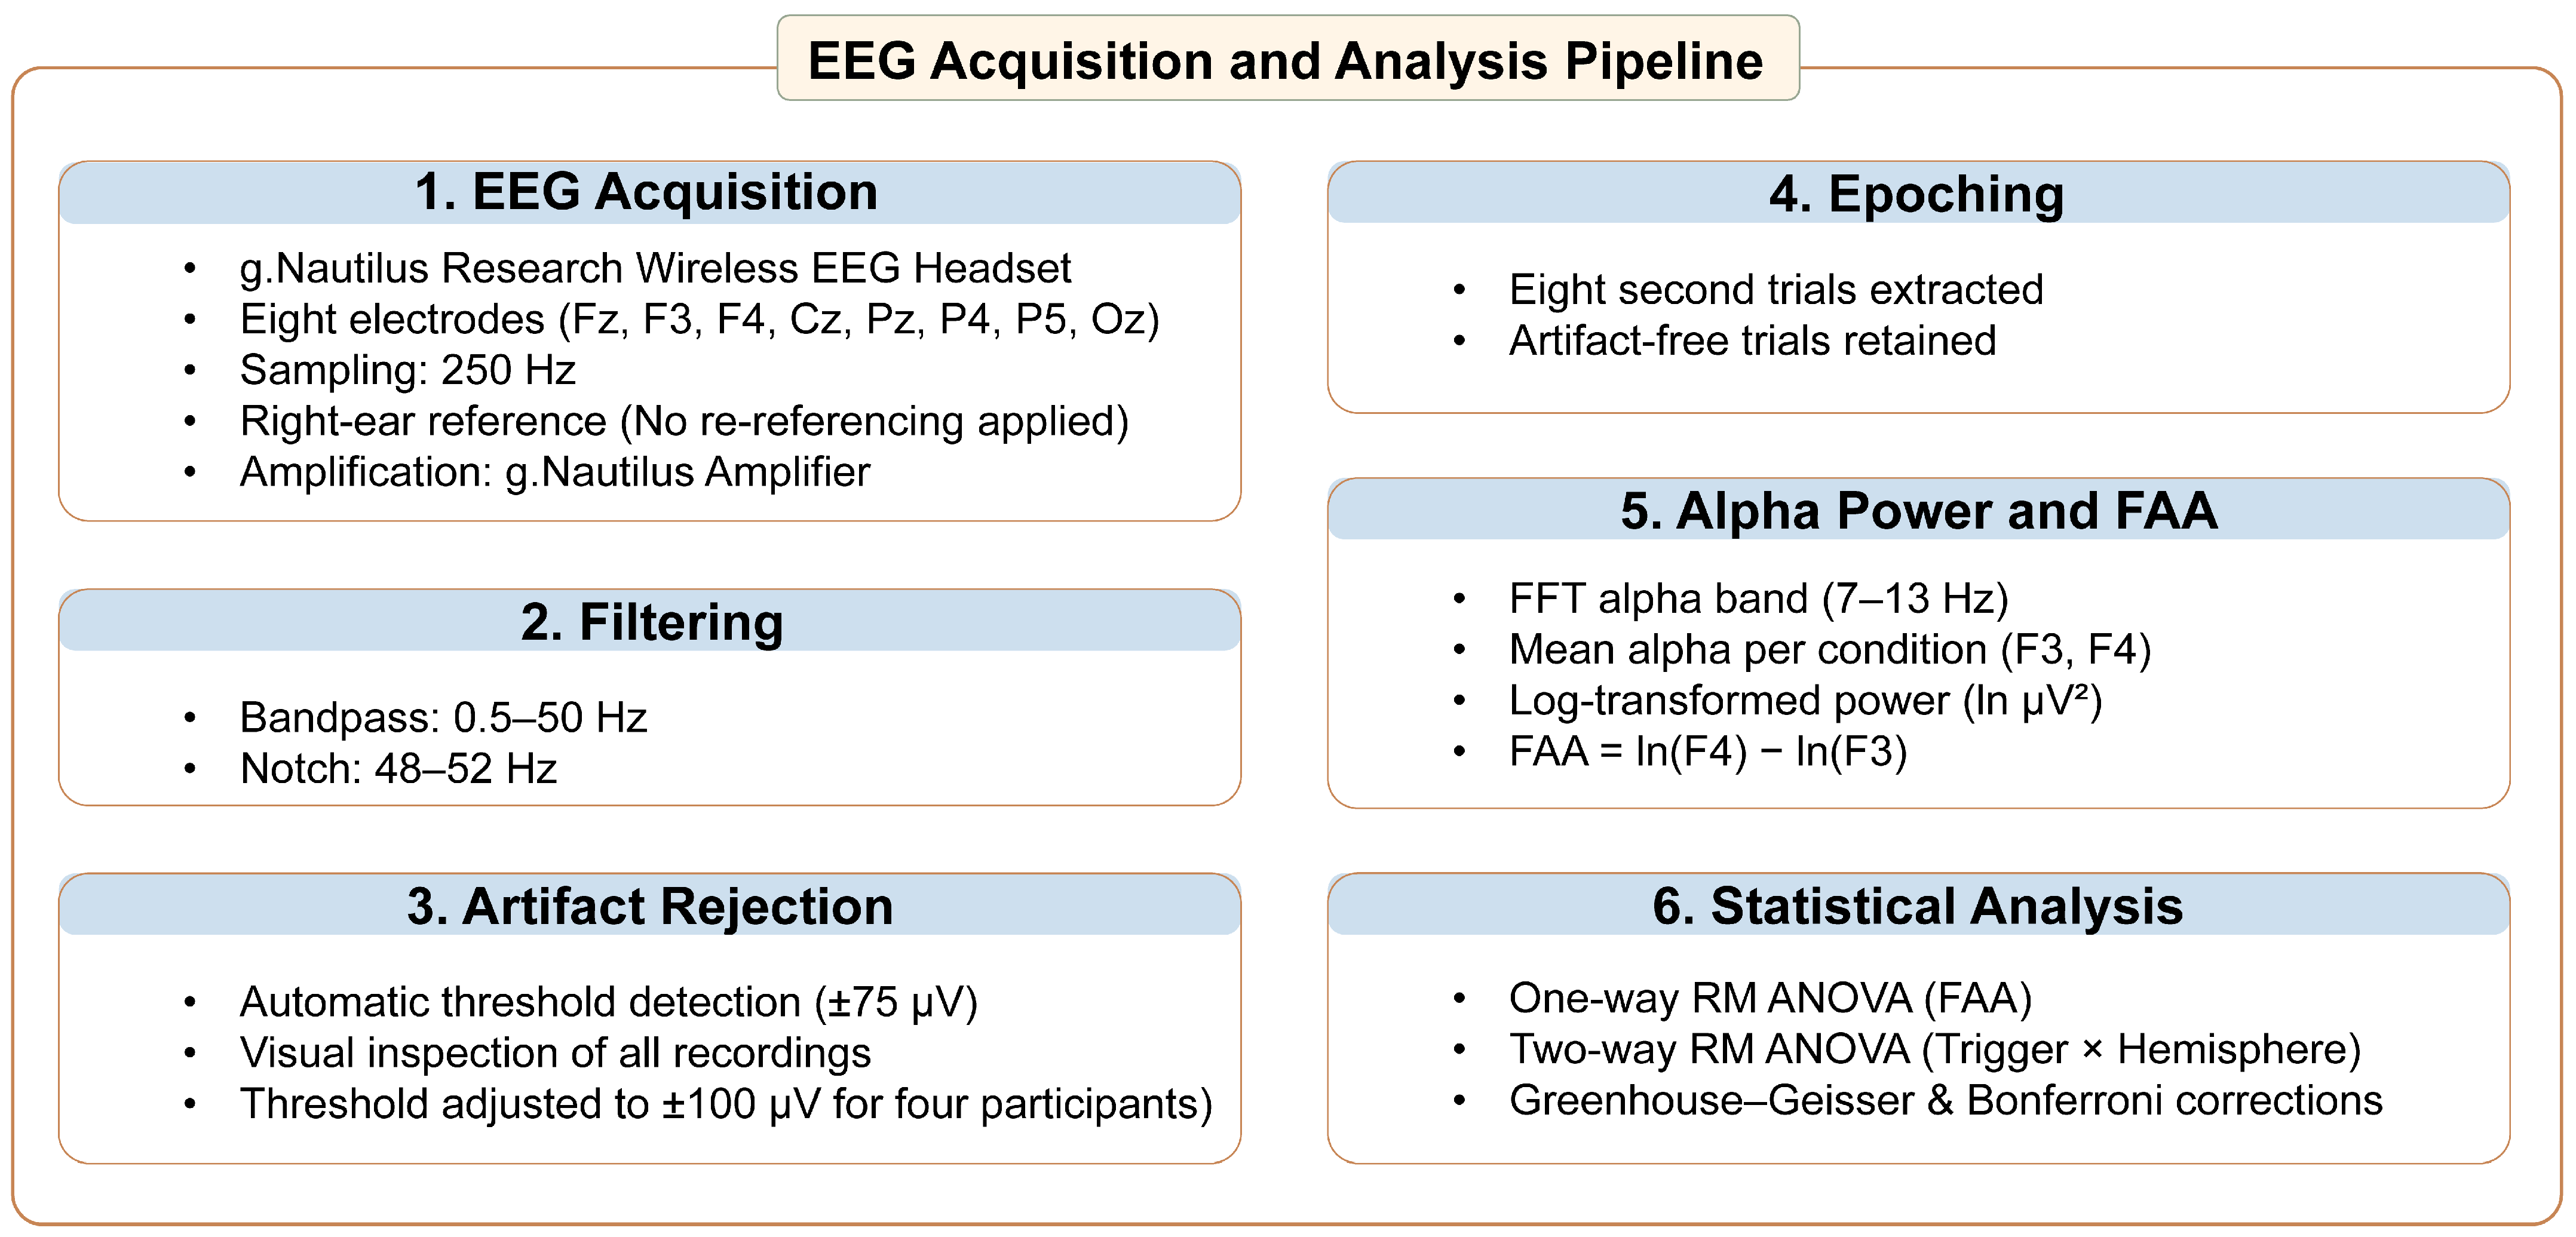
For the semantic-differential questionnaire, comfort and likeability ratings were analyzed in separate one-way repeated measures ANOVAs across the same four triggers. We used identical assumption checks and Bonferroni-corrected post hoc comparisons. All tests were two-tailed, with α = 0.05 after the relevant corrections, and descriptive statistics are reported as mean ± SD. The overall EEG acquisition and analysis workflow is illustrated in Figure 7.

3. Results

3.1. Frontal Alpha Asymmetry (FAA): One-Way Repeated Measures ANOVA

A one-way repeated measures ANOVA was first conducted to test whether there were statistically significant differences in frontal alpha asymmetry scores (FAA = ln(F4) − ln(F3)) across the four visual conditions: White, Green Color, Natural Greenery, and Shadows of Greenery. The analysis revealed a significant main effect of condition, F(2.124, 50.968) = 4.591, p = 0.013, partial η2 = 0.161, indicating variation in FAA across stimuli. Normality was met for most conditions, with mild deviations observed in two measures (lnF3 for Green Color and Shadows of Greenery). Sphericity violations were corrected using the Greenhouse–Geisser adjustment.
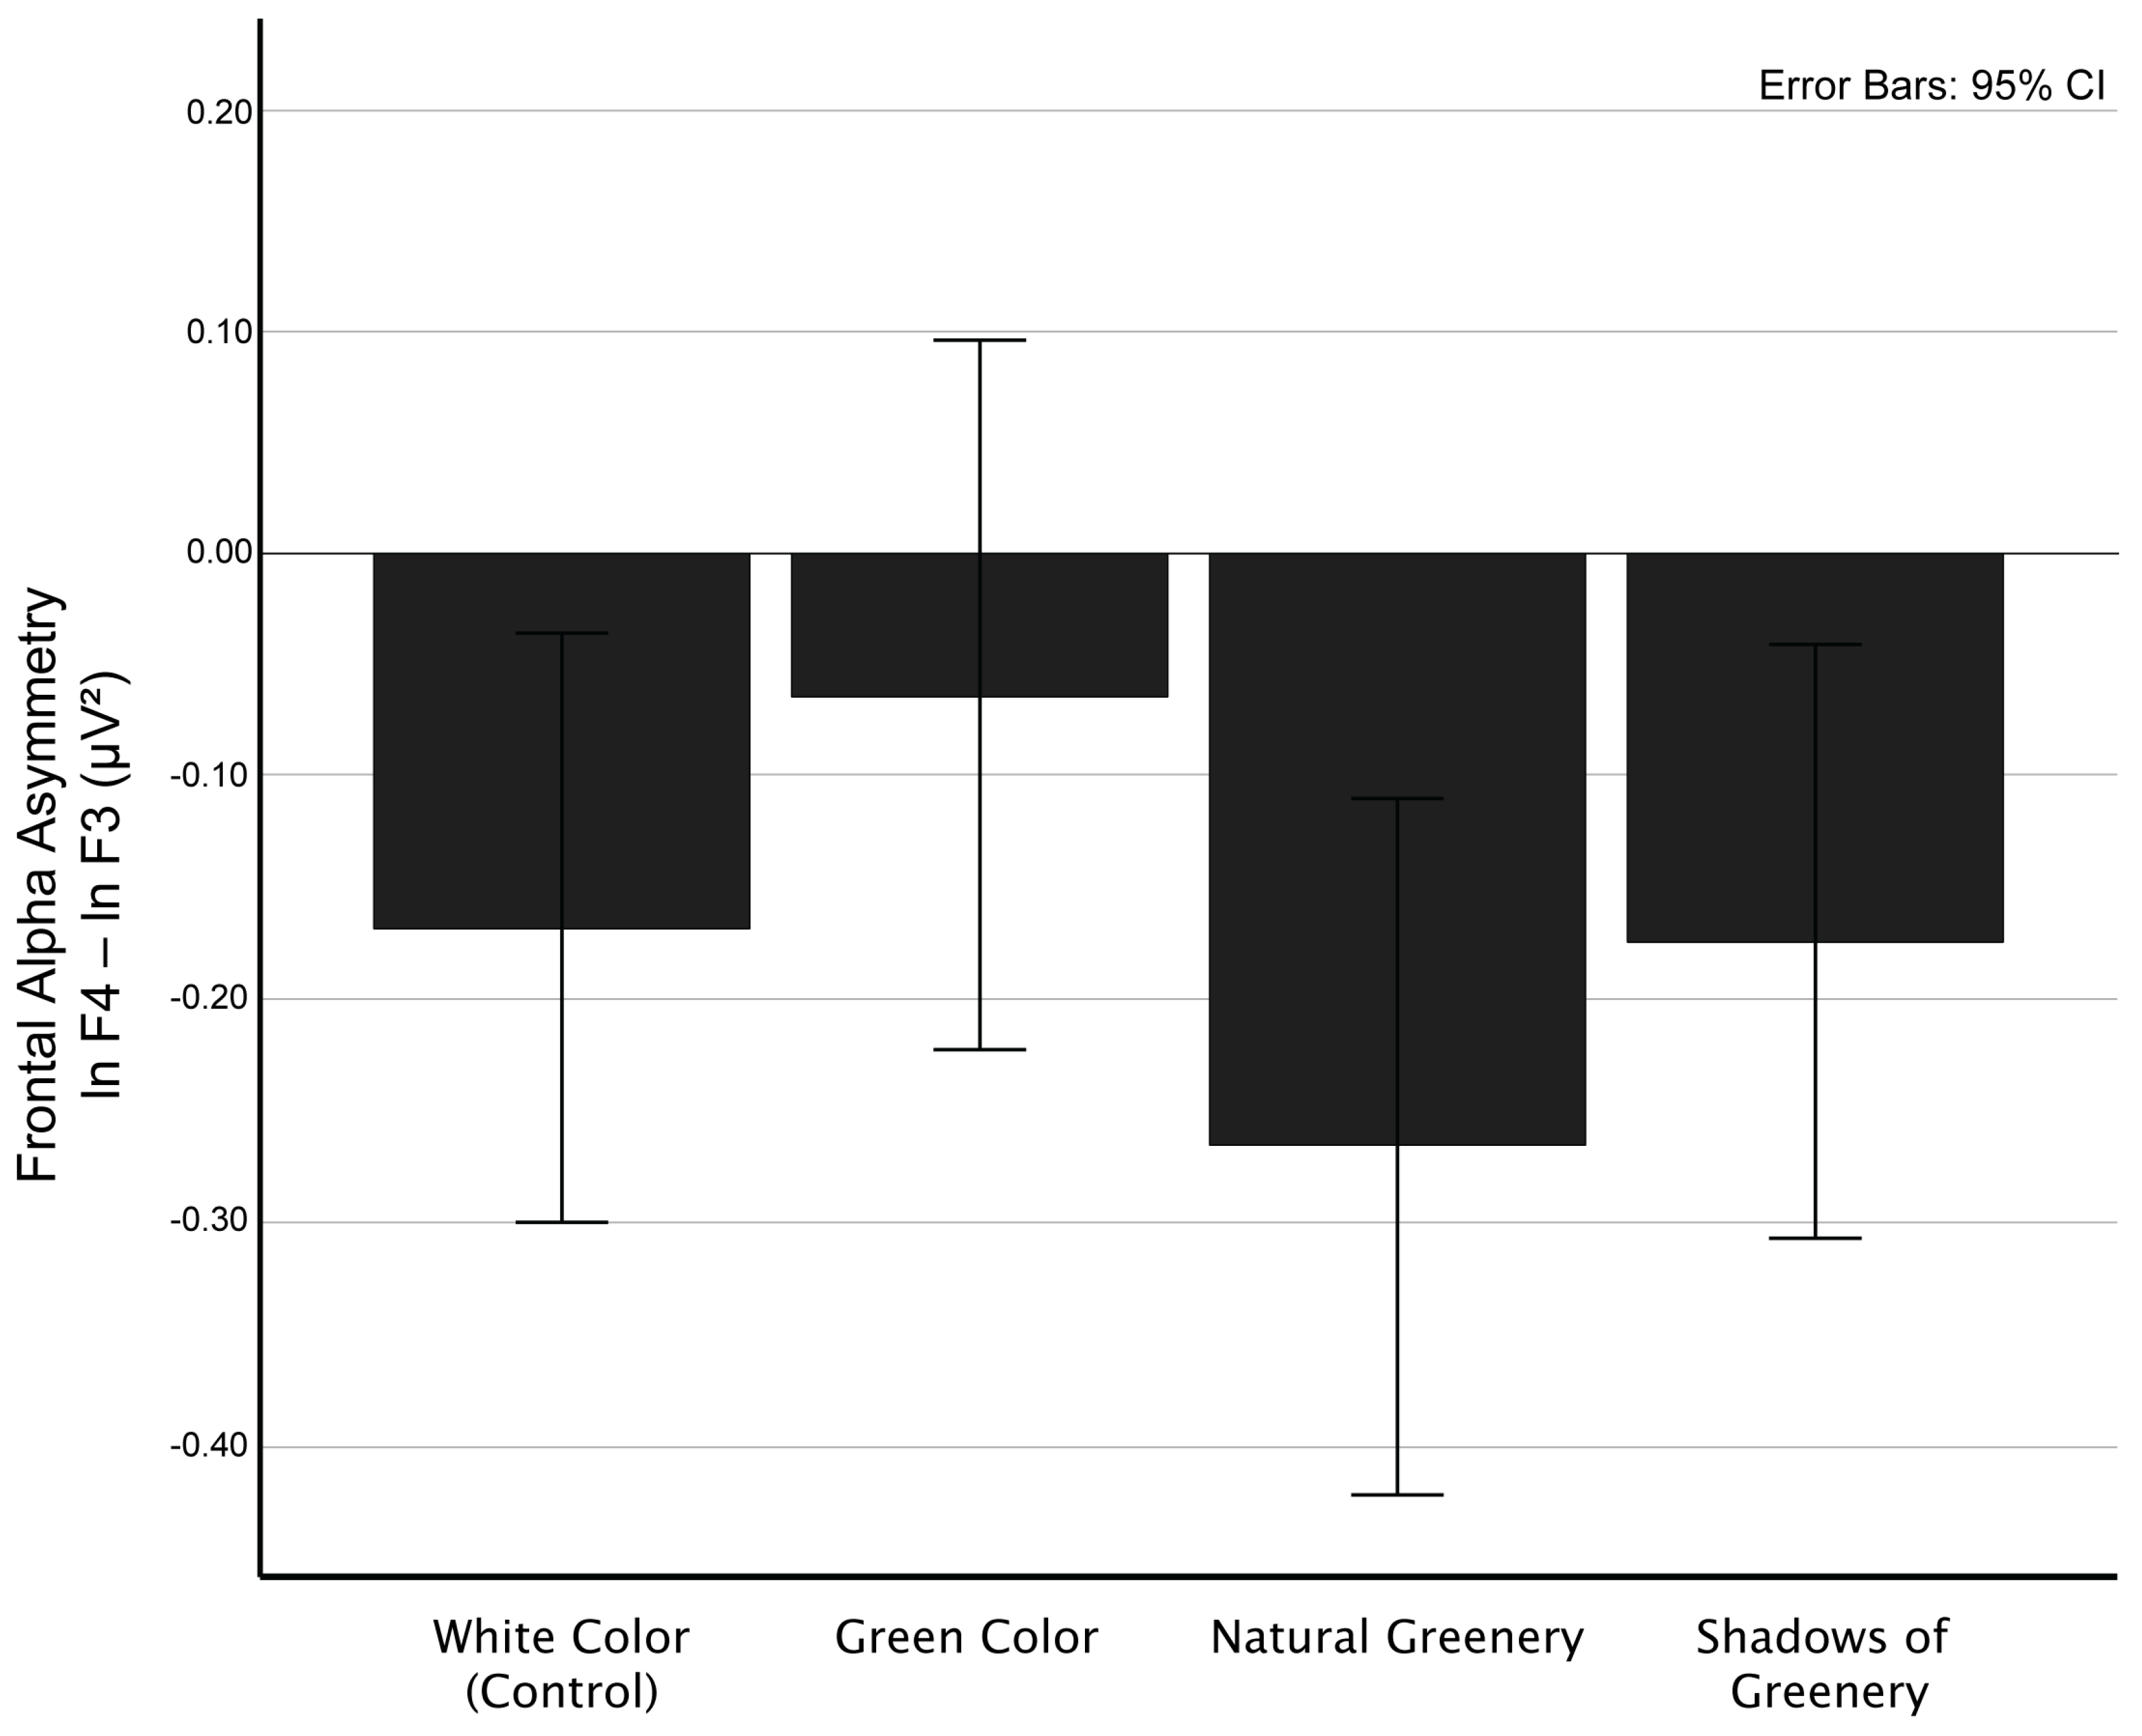
Although Bonferroni-adjusted pairwise comparisons did not reach conventional significance (lowest adjusted p = 0.062 for Natural Greenery vs. Green Color), the Natural Greenery condition consistently exhibited the most negative FAA values, suggesting a trend toward increased right-frontal activation (i.e., a right-dominant FAA score), as shown in Figure 8.
To further explore lateralized activity, a two-way repeated measures ANOVA including Hemisphere (left vs. right) as a within-subject factor was conducted. Descriptive statistics for each condition are presented in Table 1.

3.2. Frontal Alpha Asymmetry (FAA): Two-Way Repeated Measures ANOVA

To examine hemispheric differences in alpha activity across visual conditions, a two-way repeated measures ANOVA was conducted with factors Trigger (White, Green Color, Natural Greenery, Shadows of Greenery) and Hemisphere (F3, F4) on log-transformed frontal alpha power. Normality assumptions were met for most conditions, with minor deviations in two. Sphericity violations were corrected using the Greenhouse–Geisser method.
The analysis revealed a significant interaction between Trigger and Hemisphere, F(2.124, 50.968) = 4.59, p = 0.013, partial η2 = 0.161, indicating that the effect of visual stimuli varied by hemisphere. This prompted further examination of simple effects within each condition.
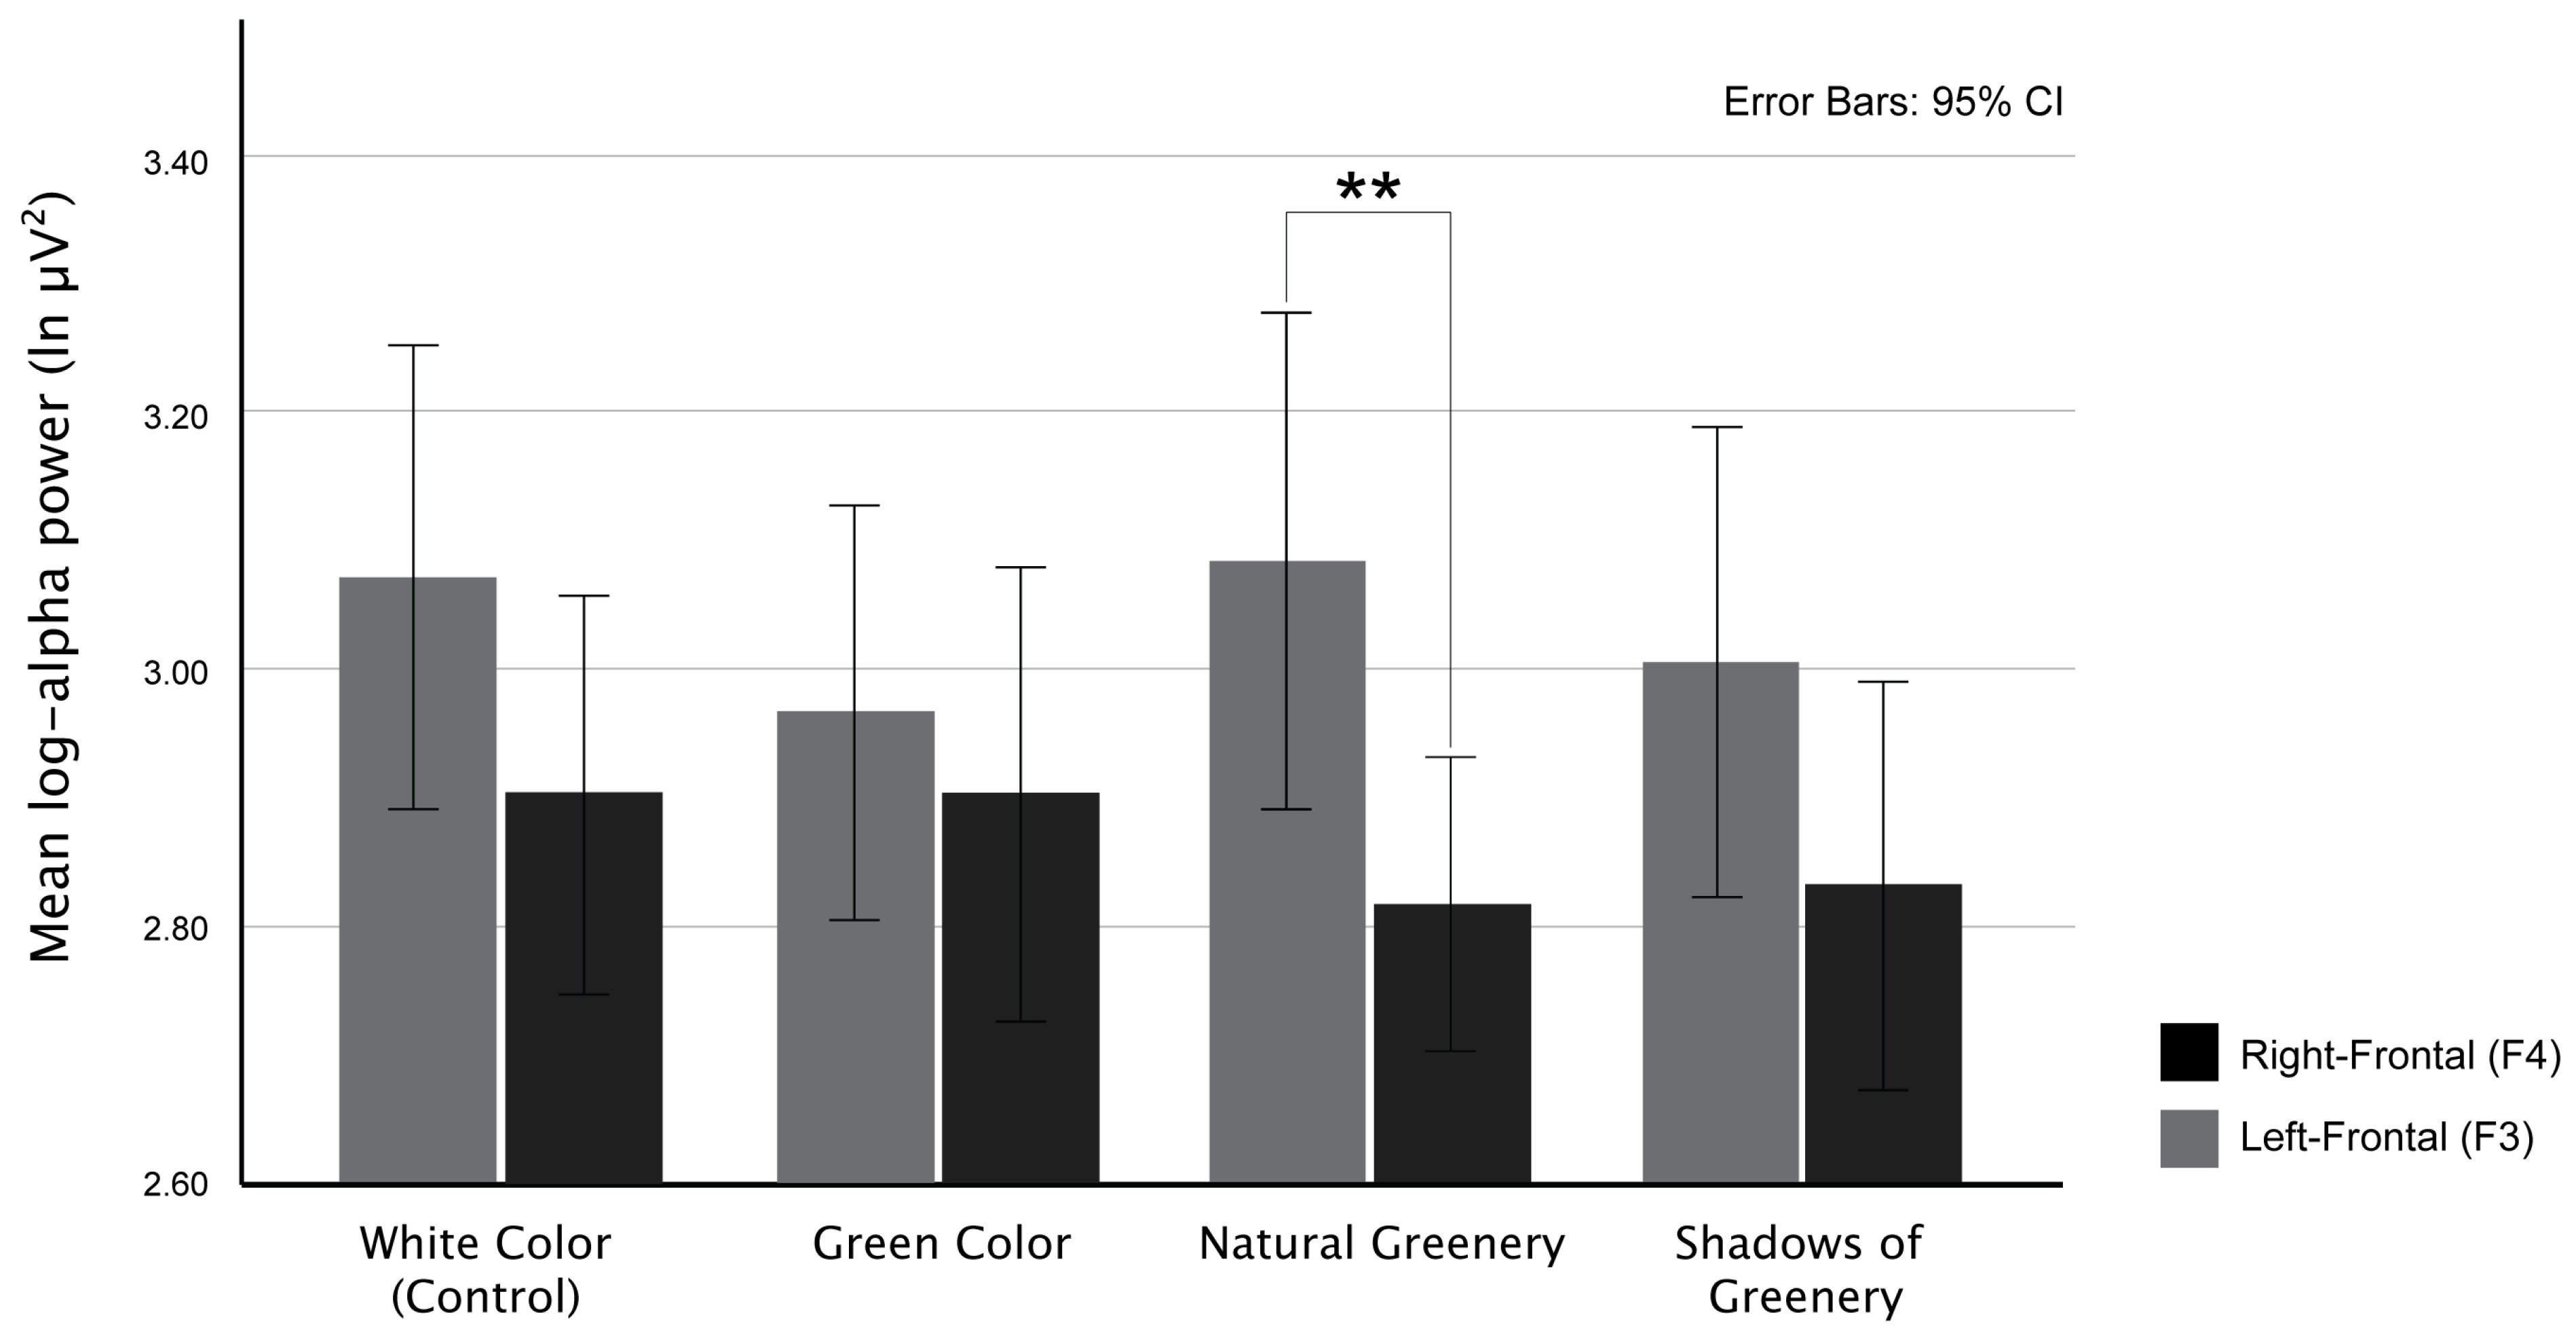
In the Natural Greenery condition, right frontal alpha power (F4: 2.818 ± 0.275 ln µV2) was significantly lower than left (F3: 3.084 ± 0.465), F(1, 24) = 12.29, p = 0.002, partial η2 = 0.339, consistent with increased right-hemisphere activation—a neural marker linked to approach/motivation. We observed a similar pattern in the Shadows of Greenery condition, F(1, 24) = 7.20, p = 0.013, though it did not meet Bonferroni-adjusted significance (α = 0.0125). The White (control) condition also showed right-dominant asymmetry, F(1, 24) = 6.80, p = 0.015, but again fell short of corrected thresholds. No significant hemispheric difference was observed in the Green Color condition, F(1, 24) = 0.66, p = 0.424, partial η2 = 0.027 (Figure 9). Frontal alpha asymmetry (FAA) analysis is shown in Figure 10. Descriptive statistics for each condition are presented in Table 2, and the results of the two-way repeated measures ANOVA are presented in Table 3.

3.3. Subjective Ratings: Semantic Differential Questionnaires

One-way repeated measures ANOVA was used to assess scores of the semantic differential questionnaire for likeability and comfort ratings across the four window-view conditions (White Color, Green Color, Natural Greenery, and Shadows of Greenery).
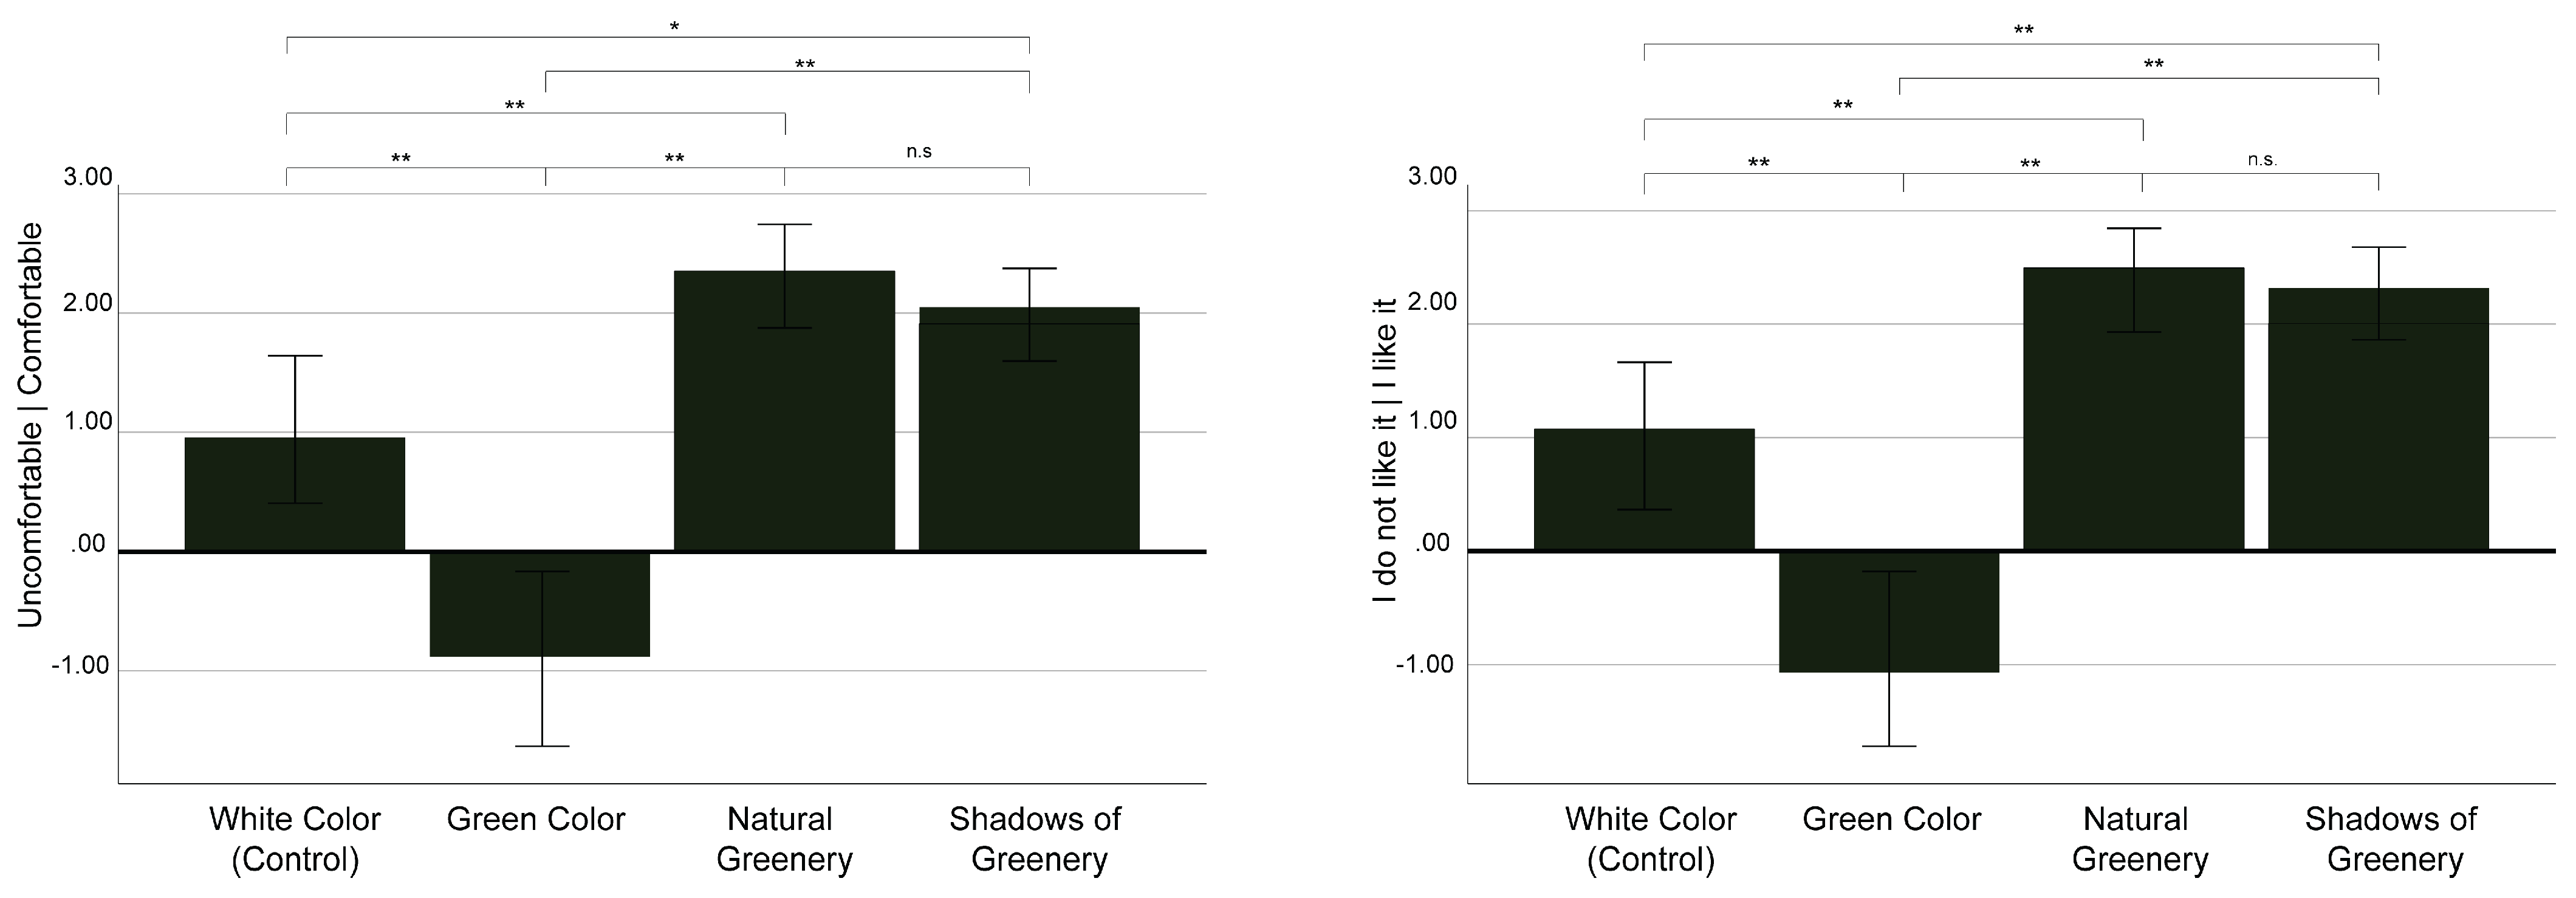
Likeability: Natural Greenery received the highest likeability ratings, showing a significant difference between both the Green Color and White conditions. Mauchly’s test indicated that the assumption of sphericity was violated (W = 0.585, χ2(5) = 12.18, p = 0.033); Greenhouse–Geisser correction was therefore applied (ε = 0.741). The effect of Trigger was highly significant, F(2.22, 53.25) = 43.60, p < 0.001, partial η2 = 0.645. Mean ratings (± SD) were 1.08 ± 1.38 for White, −1.08 ± 1.73 for Green Color, 2.48 ± 0.87 for Natural Greenery, and 2.28 ± 0.94 for Shadows of Greenery. Bonferroni-adjusted pairwise contrasts showed that Green Color was rated less likable than every other view (p < 0.001 in all cases), and Natural Greenery exceeded both White (p = 0.001) and Green Color (p < 0.001). In contrast, Shadows of Greenery differed from Green Color (p < 0.001) but did not differ from Natural Greenery or White (both p = 1.000).
Comfort: Comfort ratings followed a similar pattern, with Natural Greenery and Shadows of Greenery rated significantly more comfortable than Green Color. Mauchly’s test indicated that the assumption of sphericity was not violated (W = 0.779, χ2(5) = 5.68, p = 0.339). The ANOVA revealed a robust main effect of Trigger, F(3, 72) = 37.71, p < 0.001, partial η2 = 0.611. Mean comfort scores were 0.96 ± 1.40 (White), −0.88 ± 1.72 (Green Color), 2.36 ± 0.95 (Natural Greenery), and 2.00 ± 0.91 (Shadows of Greenery). Bonferroni comparisons indicated that Green Color was judged significantly less comfortable than all other views (p < 0.001); Natural Greenery was more comfortable than White and Green Color (both p < 0.001); and Shadows of Greenery exceeded Green Color (p < 0.001) but did not differ significantly from White after correction (p = 0.017) (Figure 11).

4. Discussion

Our study investigated frontal alpha asymmetry (FAA = InF4 − InF5) and hemispheric frontal alpha power while participants viewed four indoor-view conditions: White Color (control), Green Color, Natural Greenery and Shadows of Greenery. FAA differed across conditions, with Natural Greenery consistently showing the most negative values. Although Bonferroni-adjusted pairwise comparisons did not reach the corrected threshold, this directional pattern was reinforced by the Trigger and Hemisphere analysis reported below.
In the two-way repeated measures ANOVA, the interaction between Trigger and Hemisphere showed significant results, consistent with greater right-frontal engagement in the case of Natural Greenery (lower right frontal alpha power (F4) relative to left (F3)). White Color and Shadows of Greenery did not survive Bonferroni correction but showed similar directional tendencies. Green Color showed no hemispheric difference. Taken together, these findings indicate that Natural Greenery elicits a clearer right-left differentiation in frontal alpha activity than simplified green cues.

4.1. Attention Restoration Theory (ART) and Neural Evidence

According to ART, when natural scenes evoke “soft fascination” they capture involuntary attention with minimal effort, thereby allowing directed attentional resources to rest and recover from fatigue [11,80]. In the present study, Natural Greenery produced lower alpha power at F4 relative to F3 (negative FAA), consistent with greater right-frontal engagement during passive viewing. Given previous evidence that right hemisphere engagement, particularly in frontal regions, supports attentional vigilance and monitoring [51,81], (and in some contexts, threat-related orienting [82]), our results correlate more closely with an attentional processing rather than a valence-based interpretation of FAA. This interpretation is also consistent with the experimental paradigm used in the present study. Participants passively viewed static indoor scenes for a relatively short stimulus duration (8 s), in addition to the picture being static, which more likely engaged perceptual monitoring and attentional orientation rather than sustained affective states. Adding to this perspective, neuroimaging work has also reported the recruitment of right-lateralized networks involved in bottom-up attention during nature exposure [51,52]. EEG and fMRI studies grounded in ART have described changes in brain wave activity consistent with reduced executive demand during natural scene viewing [53,54,55,56]. Within ART, such patterns are compatible with “soft fascination,” whereby natural features hold attention effortlessly without sustained executive control.
By contrast, other lines of research emphasize affective calming and stress reduction rather than attentional engagement. For example, FAA differences during passive viewing have been interpreted as reflecting mood or approach-related tendencies [83], and neuroimaging studies have highlighted reduced stress-related limbic activity, following nature exposure [84]. In indoor biophilic design research, greenery has also been associated with lower-arousal electrophysiological profiles [85,86], suggesting relaxation mechanisms that may differ from attentional accounts. These differences may reflect variation in paradigm, outcome measures, and whether attention is engaged implicitly or assessed during tasks.
Previous work has relied on comparisons between contrasting conditions, such as urban versus natural environments, rather than systematically differentiating between different types of greenery. By testing Natural Greenery, Green Color, and Shadows of Greenery in the laboratory setting, the present results suggest that frontal alpha asymmetry can help distinguish which nature-related visual features elicit the strongest hemispheric engagement, which, in return, helps apply restoration-oriented theories into indoor design strategies.
Although the findings are discussed in relation to Attention Restoration Theory (ART), the present study did not directly measure attentional restoration or emotional states. Therefore, these interpretations should be considered as theoretical context rather than direct empirical evidence.

4.2. Divergence Between Neural and Subjective Responses

In the present study, Natural Greenery was associated with greater right-frontal engagement, while participants rated this condition highest in comfort and likeability relative to the other viewing conditions. If FAA is interpreted through an affective/motivational lens, relatively greater right-frontal activation is often discussed in relation to withdrawal-oriented or negatively valenced processing [45,46,47,48,49,50]. This expectation is not supported by the present pattern. This contradiction suggests that in our experiment, FAA may not be indexing valence alone. Notably, the positive subjective ratings of comfort and likability observed for the Natural Greenery condition further argue against a negative affective interpretation of right-frontal activation. Instead, the right-frontal activation could be context-dependent, linked to attentional monitoring during scene processing. This is consistent with ART’s attentional interpretations of effortless engagement during nature simulation exposure and could have implications for interpretations of nature restoration. However, as attention and fatigue recovery were not directly assessed, this is presented as a theoretically informed interpretation instead of evidence of restoration per se. More broadly, it is plausible that subjective appraisals and FAA capture partially distinct components of the experience, which should be tested directly in future work using combined neural, behavioral, and self-report measures.

4.3. Chromatic and Visual Complexity Considerations

Our study addresses important questions about the role of chromatic composition and visual complexity in neural response to greenery. Although previous studies have shown that green color promotes relaxation, influences brain activity, and reduces depression [70,71], our results suggest that chromatic hues alone are insufficient to elicit the same neural pattern noticed with natural greenery. Likewise, while fractal patterns commonly found in nature evoke positive esthetic responses [66,67], our findings show that, as an isolated factor, greenery patterns devoid of chromatic distinction might not be sufficient to achieve the same impact. The combined effects of chromatic hues and the dynamic complexity of natural forms may play a critical role in modulating attentional and affective responses, pointing to the need for further research to examine these factors.

4.4. Design Implications: What This Means for Architectural Practice

The findings from this study indicate that indoor green design features are not processed equivalently at the neural level. In practice, green paint, simplified plant motifs, or shadow-like patterns are often used as substitutes for real greenery. Here, Natural Greenery produced a more distinct frontal alpha pattern than Green Color, while Shadows of Greenery showed a similar directional tendency that did not survive correction. This suggests that visual access to actual vegetation, through indoor planting, green wall systems, or views to outdoor greenery, may be more likely to elicit the neural profile observed during Natural Greenery viewing than simplified green cues alone.
Consistent with the neuroarchitecture perspective that links the built environments to brain function and experience [26,28,87], these results illustrate how EEG measures such as FAA and hemispheric alpha power can complement self-report when evaluating indoor environmental features. Combined with established restoration and attention outcomes, such approaches can support evidence-based biophilic design strategies.

4.5. Limitations and Future Directions

4.5.1. Methodology

Methodological differences may have affected the overall EEG results, as previous studies with similar approaches typically compared natural to non-natural settings [34,61,62,63,64], whereas our study compared triggers representing different associations with nature.

4.5.2. Stimulus Design

The present experimental study has been represented by a single stimulus for each category (one natural green image, one green color stimulus, and one shadow pattern). Consequently, the observed effects may partly reflect properties specific to these particular images rather than the broader stimulus categories. Moreover, viewing nature on a screen is a proxy for real environments. Previous research suggests that digital nature stimuli can evoke measurable psychological and physiological responses, but their effects may differ in response to real environments due to the absence of multisensory cues such as depth, movement, and environmental context [88,89]. Future studies should therefore include multiple stimulus exemplars within each category or systematically manipulate visual parameters to improve the generalizability and external validity of the findings. Additionally, integrating complementary physiological or behavioral indicators, such as heart rate variability or attention-based tasks, would provide a more comprehensive assessment of restorative responses.

4.5.3. Room Layout

We used 24 room variations with different window shapes and placements to avoid tying the stimuli to a single spatial configuration. Window layout was not treated as an independent experimental factor in the statistical analysis. Because each stimulus condition was presented across the same set of room layouts, window configuration was not systematically associated with any single stimulus condition. Future studies systematically examining multiple window configurations across architectural variables, such as window size or placement, could help determine whether these spatial factors influence neural or subjective responses.

4.5.4. Participant Variability

Participants’ cultural backgrounds varied, which may have influenced responses across all visual conditions. Differences in esthetic preferences, familiarity with natural cues, and culturally shaped associations with greenery or specific colors may have contributed towards variability in both subjective and neural responses. In addition, individual differences such as prior exposure to natural environments or biophilic tendencies were not systematically assessed in the present study and could be explored in future research. These factors may partly limit the generalizability of the findings across populations.

4.5.5. Sample Size and Screening

Although a power analysis indicated that n = 25 is sufficient power to detect medium effects for the present experimental design, the modest size may have reduced sensitivity for detecting smaller condition-specific differences, particularly in the context of EEG research examining frontal alpha asymmetry (FAA). This may partly explain why Bonferroni-corrected pairwise comparisons did not reach statistical significance despite the overall effect observed in the repeated measures ANOVA. Therefore, the neural interpretations presented in this study should be considered with caution. Future research with larger samples is needed to further verify the robustness and generalizability of the observed patterns. Additionally, while participants were screened for major cognitive impairments and mental health conditions, pre-existing cognitive and emotional states were not directly assessed. Lastly, although participants reported normal or corrected-to-normal vision, formal ophthalmological or cognitive screening tests were not conducted prior to the experiment. Future studies could incorporate standardized visual and cognitive assessments to further control for potential individual differences.

5. Conclusions

This study affirms the critical role of visual access to natural greenery in an indoor environment. We used EEG to examine whether green visual cues derived from natural greenery can work as substitutes in indoor window views. We compared Natural Greenery with Green Color and Shadows of Greenery. Natural Greenery showed the clearest hemispheric differentiation in frontal alpha activity and the most pronounced FAA tendency, alongside the highest likability and comfort ratings.
In contrast, while Shadows of Greenery showed a similar direction, Green Color did not produce a comparable pattern. The evidence from this study implies that nature-related visual features are not processed equivalently, and that real greenery elicits a distinct neural pattern compared with simplified green cues. From a design perspective, these findings support the importance of incorporating actual vegetation or direct visual access to greenery in indoor environments rather than relying solely on symbolic green elements. Such evidence contributes to the development of evidence-based biophilic design strategies aimed at improving user experience and well-being in built environments.
These findings may also have implications for architectural certification frameworks. For example, they can support the criteria used in certification frameworks such as LEED and WELL, which both incorporate biophilic principles to improve environmental quality and human health. Furthermore, these findings provide a modest contribution to the database needed to understand how biophilic principles affect the human brain. Finally, they could serve as evidence to help architects justify integrating natural greenery into built environments.
Lastly, these findings could bridge the gap between neuroscience and practical applications of it in indoor design, highlighting the value of integrating neuroscientific methods into architectural practice—an emerging discipline often referred to as neuroarchitecture.

Author Contributions

Conceptualization, D.L.; methodology, D.L.; software, D.L.; formal analysis, D.L.; investigation, D.L.; resources, Y.K.; writing—original draft preparation, D.L.; writing—review and editing, D.L. and Y.K.; visualization, D.L.; supervision, Y.K.; project administration, Y.K. All authors have read and agreed to the published version of the manuscript.

Funding

This research received no external funding.

Institutional Review Board Statement

The study was conducted in accordance with the Declaration of Helsinki and approved by the Ethics Committee of the University of Tokyo (protocol code 21-17, 13 May 2021).

Informed Consent Statement

Written informed consent was obtained from all participants, and all data were anonymized and protected in accordance with the Code of Ethics.

Data Availability Statement

The data are not publicly available due to ethical and privacy considerations.

Acknowledgments

We would like to thank Yuko Yotsumoto (The University of Tokyo) for helpful discussions on EEG methodology and experimental design. We also thank Tomohiro Ishizu (Kansai University) for valuable comments and insightful discussions on EEG methodology and experimental considerations during the development of this study. We would also like to acknowledge all participants of the experiment for their willingness to contribute their time and patience to our study.

Conflicts of Interest

The authors declare no conflicts of interest.

Abbreviations

The following abbreviations are used in this manuscript:
EEGElectroencephalography
FAAFrontal alpha asymmetry
ARTAttention Restoration Theory
SDSemantic Differential
DFractal Dimension
CIConfidence Interval
lnF3Log-transformed alpha power at electrode F3
lnF4Log-transformed alpha power at electrode F4
ln µV2Log-transformed alpha power (microvolt squared)
α_adjAdjusted significance level after Bonferroni correction

References

  1. Bluyssen, P.M. The Indoor Environment Handbook; Taylor & Francis: Oxfordshire, UK, 2009; Volume 165. [Google Scholar]
  2. Constant, C. Eileen Gray: Operating in Dialogue; Disegno: London, UK, 2015. [Google Scholar]
  3. Neutra, R. Survival Through Design; Oxford University Press: New York, NY, USA, 1954. [Google Scholar]
  4. De Botton, A. The Architecture of Happiness; Knopf Doubleday Publishing Group: New York, NY, USA, 2008. [Google Scholar]
  5. Persiani, S.G.L. Benefits of Using Plants in Indoor Environments: Exploring Common Research Gaps. Architecture 2021, 1, 83–98. [Google Scholar] [CrossRef]
  6. Moya, T.A.; van den Dobbelsteen, A.; Ottelé, M.; Bluyssen, P.M. A review of green systems within the indoor environment. Indoor Built Environ. 2019, 28, 298–309. [Google Scholar] [CrossRef]
  7. Wilson, E.O. Biophilia; Harvard University Press: Cambridge, MA, USA, 1984. [Google Scholar]
  8. Kellert, S.R.; Wilson, E.O. The Biophilia Hypothesis; Island Press: Washington, DC, USA, 1993. [Google Scholar]
  9. James, W. Psychology, Briefer Course; Macmillan and Co.: London, UK, 1892. [Google Scholar]
  10. Kaplan, S. The restorative benefits of nature: Toward an integrative framework. J. Environ. Psychol. 1995, 15, 169–182. [Google Scholar] [CrossRef]
  11. Kaplan, R.; Kaplan, S. The Experience of Nature: A Psychological Perspective; Cambridge University Press: Cambridge, MA, USA, 1989. [Google Scholar]
  12. U.S. Green Building Council. Designing with Nature: Biophilic Design for the Indoor Environment Pilot Credit—Biophilic Design Plan Template. 2018. Available online: https://www.usgbc.org/credits/new-construction-core-and-shell-schools-new-construction-retail-new-construction-31 (accessed on 19 February 2025).
  13. International WELL Building Institute. Biophilia I—Qualitative: To Nurture the Innate Human-Nature Connection Within the Project|WELL Standard. Feature 88. Available online: https://standard.wellcertified.com/mind/biophilia-i-qualitative (accessed on 20 February 2025).
  14. Allen, J.G.; Bernstein, A.; Cao, X.; Eitland, E.S.; Flanigan, S.; Gokhale, M.; Goodman, J.M.; Klager, S.; Klingensmith, L.; Laurent, J.G.C.; et al. The 9 Foundations of a Healthy Building. 2017. Available online: www.ForHealth.org (accessed on 20 February 2025).
  15. Nakamoto, Y.; Nishina, H.; Masui, N.; Hashimoto, Y. Analysis of Amenity Effect on Human Psychology as Affected by Ornamental Foliage Plants Used as a Screen. J. Soc. High Technol. Agric. 1999, 11, 136–139. [Google Scholar] [CrossRef][Green Version]
  16. Danielski, I.; Svensson, A.; Weimer, K.; Lorentzen, L.; Warne, M. Effects of Green Plants on the Indoor Environment and Wellbeing in Classroom—A Case Study in a Swedish School. Sustainability 2022, 14, 3777. [Google Scholar] [CrossRef]
  17. Shin, W.S. The influence of forest view through a window on job satisfaction and job stress. Scand. J. For. Res. 2007, 22, 248–253. [Google Scholar] [CrossRef]
  18. Li, D.; Sullivan, W.C. Impact of views to school landscapes on recovery from stress and mental fatigue. Landsc. Urban Plan. 2016, 148, 149–158. [Google Scholar] [CrossRef]
  19. Aries, M.B.; Aarts, M.P.; van Hoof, J. Daylight and health: A review of the evidence and consequences for the built environment. Light. Res. Technol. 2013, 47, 6–27. [Google Scholar] [CrossRef]
  20. Boubekri, M.; Cheung, I.N.; Reid, K.J.; Wang, C.-H.; Zee, P.C. Impact of windows and daylight exposure on overall health and sleep quality of office workers: A case-control pilot study. J. Clin. Sleep Med. 2014, 10, 603–611. [Google Scholar] [CrossRef] [PubMed]
  21. Soga, M.; Evans, M.J.; Tsuchiya, K.; Fukano, Y. A room with a green view: The importance of nearby nature for mental health during the COVID-19 pandemic. Ecol. Appl. 2021, 31, e2248. [Google Scholar] [CrossRef] [PubMed]
  22. Dzhambov, A.M.; Lercher, P.; Browning, M.H.E.M.; Stoyanov, D.; Petrova, N.; Novakov, S.; Dimitrova, D.D. Does greenery experienced indoors and outdoors provide an escape and support mental health during the COVID-19 quarantine? Environ. Res. 2021, 196, 110420. [Google Scholar] [CrossRef]
  23. Yin, J.; Yuan, J.; Arfaei, N.; Catalano, P.J.; Allen, J.G.; Spengler, J.D. Effects of biophilic indoor environment on stress and anxiety recovery: A between-subjects experiment in virtual reality. Environ. Int. 2020, 136, 105427. [Google Scholar] [CrossRef]
  24. Ergan, S.; Radwan, A.; Zou, Z.; Tseng, H.-A.; Han, X. Quantifying Human Experience in Architectural Spaces with Integrated Virtual Reality and Body Sensor Networks. J. Comput. Civ. Eng. 2019, 33, 4018062. [Google Scholar] [CrossRef]
  25. Jeong, T.-J. A Study on the Healing Environment with Natural Elements in Healthcare Facility—Focused on the Case Study of Seoul National University Hospital. J. Archit. Inst. Korea Plan. Des. 2019, 35, 61–68. [Google Scholar]
  26. Albright, T.D. Neuroscience for Architecture. In Mind in Architecture: Neuroscience, Embodiment, and the Future of Design; Robinson, S., Pallasmaa, J., Eds.; MIT Press: Cambridge, MA, USA, 2015; pp. 197–217. [Google Scholar]
  27. Gage, F.H. Architecture and Neuroscience. In Proceedings of the Theme Presentation at AIA 2003 National Convention, San Diego, CA, USA, 8–10 May 2003. [Google Scholar]
  28. Pallasmaa, J.; Mallgrave, H.F.; Arbib, M. Architecture and Neuroscience; The Tapio Wirkkala-Rut Bryk Foundation: Espoo, Finland, 2009. [Google Scholar]
  29. Holl, S.; Pallasmaa, J.; Pérez-Gómez, A. Questions of Perception: Phenomenology of Architecture; William Stout Publisher: San Francisco, CA, USA, 1994. [Google Scholar]
  30. Haufe, S.; Nikulin, V.V.; Müller, K.-R.; Nolte, G. A critical assessment of connectivity measures for EEG data: A simulation study. Neuroimage 2012, 64, 120–133. [Google Scholar] [CrossRef] [PubMed]
  31. Başar, E. Brain Function and Oscillations—Volume I: Brain Oscillations. In Principles and Approaches; Springer: Berlin/Heidelberg, Germany, 1998. [Google Scholar]
  32. Wolpaw, J.R.; Wolpaw, E.W. Brain–Computer Interfaces: Principles and Practice; Oxford University Press: Oxford, UK, 2012. [Google Scholar]
  33. Malik, A.S.; Amin, H.U. Designing an EEG Experiment. In Designing EEG Experiments for Studying Brain; Academic Press: San Diego, CA, USA, 2017; pp. 1–30. [Google Scholar]
  34. Ulrich, R.S. Natural Versus Urban Scenes: Some Psychophysiological Effects. Environ. Behav. 1981, 13, 523–556. [Google Scholar] [CrossRef]
  35. Grassini, S.; Segurini, G.V.; Koivisto, M. Watching Nature Videos Promotes Physiological Restoration: Evidence From the Modulation of Alpha Waves in Electroencephalography. Front. Psychol. 2022, 13, 871143. [Google Scholar] [CrossRef]
  36. Jing, X.; Liu, C.; Li, J.; Gao, W.; Fukuda, H. Effects of Window Green View Index on Stress Recovery of College Students from Psychological and Physiological Aspects. Buildings 2024, 14, 3316. [Google Scholar] [CrossRef]
  37. Elsadek, M.; Deshun, Z.; Liu, B. High-rise window views: Evaluating the physiological and psychological impacts of green, blue, and built environments. Build. Environ. 2024, 262, 111798. [Google Scholar] [CrossRef]
  38. Elsadek, M.; Liu, B.; Xie, J. Window view and relaxation: Viewing green space from a high-rise estate improves urban dwellers’ wellbeing. Urban For. Urban Green. 2020, 55, 126846. [Google Scholar] [CrossRef]
  39. Chang, C.-Y.; Chen, P.-K. Human response to window views and indoor plants in the workplace. HortScience 2005, 40, 1354–1359. [Google Scholar] [CrossRef]
  40. Lee, M.J.; Oh, W. Changes in Electroencephalographic Results and Heart Rate Variability after Exposure to Green Landscape Photographs Correlated with Color Temperature and Illumination Level. J. People Plants Environ. 2021, 24, 639–649. [Google Scholar] [CrossRef]
  41. Zhu, H.; Yang, F.; Bao, Z.; Nan, X. A study on the impact of Visible Green Index and vegetation structures on brain wave change in residential landscape. Urban For. Urban Green. 2021, 64, 127299. [Google Scholar] [CrossRef]
  42. Kim, S.H.; Lee, C.H.; Park, S.A. Brain Wave Changes in the Prefrontal Cortex When Exposed to Varying Plant Types as Visual Stimuli. HortScience 2024, 59, 1413–1418. [Google Scholar] [CrossRef]
  43. Saadati, F.R.; Hir, Y.P.; Narimani, M. The effectiveness of exposure to green space on absolute power of alpha waves and stress reduction in people with attention-deficit/hyperactivity disorder. J. Res. Psychopathol. 2025, 6, 46–58. [Google Scholar]
  44. Park, S.-A.; Song, C.; Choi, J.-Y.; Son, K.-C.; Miyazaki, Y. Foliage Plants Cause Physiological and Psychological Relaxation as Evidenced by Measurements of Prefrontal Cortex Activity and Profile of Mood States. HortScience 2016, 51, 1308–1312. [Google Scholar] [CrossRef]
  45. Olszewska-Guizzo, A.; Escoffier, N.; Chan, J.; Yok, T.P. Window view and the brain: Effects of floor level and green cover on the alpha and beta rhythms in a passive exposure eeg experiment. Int. J. Environ. Res. Public Health 2018, 15, 2358. [Google Scholar] [CrossRef]
  46. Sabu, P.; Stuldreher, I.V.; Kaneko, D.; Brouwer, A.M. A Review on the Role of Affective Stimuli in Event-Related Frontal Alpha Asymmetry. Front. Comput. Sci. 2022, 4, 869123. [Google Scholar] [CrossRef]
  47. Davidson, R. EEG Measures of Cerebral Asymmetry: Conceptual and Methodological Issues. J. Neurosci. 1998, 39, 71–89. [Google Scholar] [CrossRef] [PubMed]
  48. Zhao, G.; Zhang, Y.; Ge, Y. Frontal EEG asymmetry and middle line power difference in discrete emotions. Front. Behav. Neurosci. 2018, 12, 225. [Google Scholar] [CrossRef] [PubMed]
  49. Fischer, N.L.; Peres, R.; Fiorani, M. Frontal alpha asymmetry and theta oscillations associated with information sharing intention. Front. Behav. Neurosci. 2018, 12, 166. [Google Scholar] [CrossRef]
  50. Coan, J.A.; Allen, J.B. Frontal EEG asymmetry and the behavioral activation and inhibition systems. Psychophysiology 2003, 40, 106–114. [Google Scholar] [CrossRef]
  51. Deutsch, G.; Papanicolaou, A.C.; Bourbon, W.T.; Eisenberg, H.M. Cerebral Blood Flow Evidence of Right Frontal Activation in Attention Demanding Tasks. Int. J. Neurosci. 1987, 37, 23–28. [Google Scholar] [CrossRef]
  52. Martínez-Soto, J.; Gonzales-Santos, L.; Pasaye, E.; Barrios, F.A. Exploration of neural correlates of restorative environment exposure through functional magnetic resonance. Intell. Build. Int. 2013, 5, 10–28. [Google Scholar] [CrossRef]
  53. McDonnell, A.S.; Strayer, D.L. Immersion in nature enhances neural indices of executive attention. Sci. Rep. 2024, 14, 1845. [Google Scholar] [CrossRef] [PubMed]
  54. McDonnell, A.S.; LoTemplio, S.B.; Scott, E.E.; Strayer, D.L. Nature images are more visually engaging than urban images: Evidence from neural oscillations in the brain. Front. Hum. Neurosci. 2025, 19, 1575102. [Google Scholar] [CrossRef]
  55. Jiang, X.; Hu, Y.; Larsen, L.; Chang, C.Y.; Sullivan, W.C. Impacts of urban green infrastructure on attentional functioning: Insights from an fMRI study. Front. Psychol. 2023, 14, 1047993. [Google Scholar] [CrossRef]
  56. Kühn, S.; Forlim, C.G.; Lender, A.; Wirtz, J.; Gallinat, J. Brain functional connectivity differs when viewing pictures from natural and built environments using fMRI resting state analysis. Sci. Rep. 2021, 11, 4110. [Google Scholar] [CrossRef] [PubMed]
  57. Harrison, R.M.; Hester, R.E. (Eds.) Indoor Air Pollution; Royal Society of Chemistry: London, UK, 2019. [Google Scholar]
  58. Hellenbeck, W.H. Quantitative Risk Assessment for Environmental and Occupational Health; CRC Press: Boca Raton, FL, USA, 2018. [Google Scholar]
  59. Rippe, J.M. (Ed.) Lifestyle Medicine; CRC Press: Boca Raton, FL, USA, 2013. [Google Scholar]
  60. Olszewska-Guizzo, A.A.; Paiva, T.O.; Barbosa, F. Effects of 3D contemplative landscape videos on brain activity in a passive exposure eeg experiment. Front. Psychiatry 2018, 9, 317. [Google Scholar] [CrossRef]
  61. Grassini, S.; Revonsuo, A.; Castellotti, S.; Petrizzo, I.; Benedetti, V.; Koivisto, M. Processing of natural scenery is associated with lower attentional and cognitive load compared with urban ones. J. Environ. Psychol. 2019, 62, 1–11. [Google Scholar] [CrossRef]
  62. Lindemann-Matthies, P.; Benkowitz, D.; Hellinger, F. Associations between the naturalness of window and interior classroom views, subjective well-being of primary school children and their performance in an attention and concentration test. Landsc. Urban Plan. 2021, 214, 104146. [Google Scholar] [CrossRef]
  63. Roe, J.J.; Aspinall, P.A.; Mavros, P.; Coyne, R. Engaging the brain: The impact of natural versus urban scenes using novel EEG methods in an experimental setting. Environ. Sci. 2013, 1, 93–104. [Google Scholar] [CrossRef]
  64. Berman, M.G.; Jonides, J.; Kaplan, S. The Cognitive Benefits of Interacting With Nature. Psychol. Sci. 2008, 19, 1207–1212. [Google Scholar] [CrossRef]
  65. Mandelbrot, B. The Fractal Geometry of Nature, 3rd ed.; Freeman: San Francisco, CA, USA, 1982. [Google Scholar]
  66. Spehar, B.; Clifford, C.W.G.; Newell, B.R.; Taylor, R.P. Universal aesthetic of fractals. Comput. Graph. 2006, 27, 813–820. [Google Scholar] [CrossRef]
  67. Hägerhäll, C.M.; Laike, T.; Küller, M.; Marcheschi, E.; Boydston, C.; Taylor, R.P. Human physiological benefits of viewing nature: EEG responses to exact and statistical fractal patterns. Nonlinear Dyn. Psychol. Life Sci. 2015, 19, 1–12. [Google Scholar]
  68. Augustin, S. Place Advantage: Applied Psychology for Interior Architecture; John Wiley & Sons, Inc.: Hoboken, NJ, USA, 2009. [Google Scholar]
  69. Abboushi, B.; Elzeyadi, I.; Taylor, R.; Sereno, M. Fractals in architecture: The visual interest, preference, and mood response to projected fractal light patterns in interior spaces. J. Environ. Psychol. 2019, 61, 57–70. [Google Scholar] [CrossRef]
  70. Yoto, A.; Katsuura, T.; Iwanaga, K.; Shimomura, Y. Effects of object color stimuli on human brain activities in perception and attention referred to EEG alpha band response. J. Physiol. Anthropol. 2007, 26, 373–379. [Google Scholar] [CrossRef]
  71. Sroykham, W.; Wongsathikun, J.; Wongsawat, Y. The effects of perceiving color in living environment on QEEG, Oxygen saturation, pulse rate, and emotion regulation in humans. In Proceedings of the 2014 36th Annual International Conference of the IEEE Engineering in Medicine and Biology Society, EMBC 2014, Chicago, IL, USA, 26–30 August 2014; pp. 6226–6229. [Google Scholar] [CrossRef]
  72. Lan, L.; Lian, Z. Application of statistical power analysis—How to determine the right sample size in human health, comfort and productivity research. Build. Environ. 2010, 45, 1202–1213. [Google Scholar] [CrossRef]
  73. Schöne, B.; Schomberg, J.; Gruber, T.; Quirin, M. Event-related frontal alpha asymmetries: Electrophysiological correlates of approach motivation. Exp. Brain Res. 2016, 234, 559–567. [Google Scholar] [CrossRef]
  74. Keil, A.; Debener, S.; Gratton, G.; Junghöfer, M.; Kappenman, E.S.; Luck, S.J.; Luu, P.; Miller, G.A.; Yee, C.M. Committee report: Publication guidelines and recommendations for studies using electroencephalography and magnetoencephalography. Psychophysiology 2014, 51, 1–21. [Google Scholar] [CrossRef] [PubMed]
  75. g.tec Medical Engineering GmbH. g.SAHARA Active Dry Electrode System. Schiedlberg, Austria. Available online: www.gtec.at (accessed on 18 March 2026).
  76. Pernet, C.; Garrido, M.I.; Gramfort, A.; Maurits, N.; Michel, C.M.; Pang, E.; Salmelin, R.; Schoffelen, J.M.; Valdes-Sosa, P.A.; Puce, A. Issues and recommendations from the OHBM COBIDAS MEEG committee for reproducible EEG and MEG research. Nat. Neurosci. 2020, 23, 1473–1483. [Google Scholar] [CrossRef]
  77. Luck, S.J. An Introduction to the Event-Related Potential Technique, 2nd ed.; MIT Press: Cambridge, MA, USA, 2014. [Google Scholar]
  78. Coan, J.A.; Allen, J.J.B. Frontal EEG asymmetry as a moderator and mediator of emotion. Biol. Psychol. 2004, 67, 7–50. [Google Scholar] [CrossRef] [PubMed]
  79. Smith, E.E.; Reznik, S.J.; Stewart, J.L.; Allen, J.J.B. Assessing and conceptualizing frontal EEG asymmetry: An updated primer on recording, processing, analyzing, and interpreting frontal alpha asymmetry. Int. J. Psychophysiol. 2017, 111, 98–114. [Google Scholar] [CrossRef]
  80. Berto, R. Exposure to restorative environments helps restore attentional capacity. J. Environ. Psychol. 2005, 25, 249–259. [Google Scholar] [CrossRef]
  81. Asanowitc, D.; Marzecová, A.; Jaśkowski, P.; Wolski, P. Hemispheric asymmetry in the efficiency of attentional networks. Brain Cogn. 2012, 79, 117–128. [Google Scholar] [CrossRef][Green Version]
  82. Avram, J.; Baltes, F.R.; Miclea, M.; Miu, A.C. Frontal EEG Activation Asymmetry Reflects Cognitive Biases in Anxiety: Evidence from an Emotional Face Stroop Task. Appl. Psychophyiol. Biofeedback 2010, 35, 285–292. [Google Scholar] [CrossRef] [PubMed]
  83. Olszewska-Guizzo, A.; Sia, A.; Fogel, A.; Ho, R. Can exposure to certain urban green spaces trigger frontal alpha asymmetry in the brain?—Preliminary findings from a passive task EEG study. Int. J. Environ. Res. Public Health 2020, 17, 394. [Google Scholar] [CrossRef]
  84. Sudimac, S.; Sale, V.; Kühn, S. How nature nurtures: Amygdala activity decreases as the result of a one-hour walk in nature. Mol. Psychiatry 2022, 27, 4446–4452. [Google Scholar] [CrossRef]
  85. Jung, D.; Kim, D.I.; Kim, N. Bringing nature into hospital architecture: Machine learning-based EEG analysis of the biophilia effect in virtual reality. J. Environ. Psychol. 2023, 89, 102033. [Google Scholar] [CrossRef]
  86. Fukumoto, H.; Shimoda, M.; Hoshino, S. The effects of different designs of indoor biophilic greening on psychological and physiological responses and cognitive performance of office workers. PLoS ONE 2024, 19, e0307934. [Google Scholar] [CrossRef]
  87. Eberhard, J.P. Brain Landscape: The Coexistence of Neuroscience and Architecture. In Brain Landscape: The Coexistence of Neuroscience and Architecture; Oxford University Press: Oxford, UK, 2009; pp. 1–280. [Google Scholar] [CrossRef]
  88. Kjellgren, A.; Buhrkall, H. A comparison of the restorative effect of a natural environment with that of a simulated natural environment. J. Environ. Psychol. 2010, 30, 464–472. [Google Scholar] [CrossRef]
  89. Kahn, P.H., Jr.; Friedman, B.; Gill, B.; Hagman, J.; Severson, R.L.; Freier, N.G.; Feldman, E.N.; Carrère, S.; Stolyar, A. A plasma display window?-The shifting baseline problem in a technologically mediated natural world. J. Environ. Psychol. 2008, 28, 192–199. [Google Scholar] [CrossRef]
Figure 1. Conceptual illustration of frontal alpha asymmetry (FAA) in the prefrontal cortex. EEG alpha power is commonly interpreted as inversely related to cortical activation, such that lower alpha power reflects greater neural frontal activation whereas higher alpha power indicates reduced frontal activation. Differences in alpha activity between the left and right frontal regions are used to infer hemispheric differences in neural processing.
Buildings 16 01284 g001
Figure 2. Conceptual research framework of the study.
Buildings 16 01284 g002
Figure 3. Stimuli set: extraction of color and shadow visual features from the base greenery image. The color stimulus was defined using average RGB values, while the shadow pattern was generated through image thresholding and fractal analysis (D dimension) to represent the complexity of dappled light. These processed elements were then used to construct the four experimental conditions: (a) White (control), (b) Green Color, (c) Natural Greenery, and (d) Shadows of Greenery.
Buildings 16 01284 g003
Figure 4. Outline of the 24 room variations used in the study, illustrating different window shapes and placements. The gray areas indicate window views, where all four stimuli conditions were presented in each variation.
Buildings 16 01284 g004
Figure 5. Experimental design, methodology, and EEG recording setup. The figure summarizes the experimental procedure and laboratory configuration used in the study. Participants were seated approximately 1 m from the viewing screen while visual stimuli were presented using E-Prime 3.0 (Psychology Software Tools, Inc., Pittsburgh, PA, USA). EEG signals were recorded using a g.Nautilus Research wireless EEG system (g.tec medical engineering GmbH, Schiedlberg, Austria), with electrode placement based on the international 10–20 system. The layout also includes the experimental environment and the recording configuration used during data acquisition.
Buildings 16 01284 g005
Figure 6. Within-subject block design of the EEG experiment. The figure illustrates the experimental timeline and the structure of the trials. The EEG session consisted of 96 trials organized into eight blocks of 12 randomized trials, with each block beginning with a 10 s baseline and stimuli presented for 8 s, followed by a 1 s fixation cross (“+”).
Buildings 16 01284 g006
Figure 7. EEG acquisition and analysis pipeline. The diagram illustrates the main stages of the EEG processing workflow, including signal acquisition with the g.Nautilus system, filtering, artifact rejection, epoch extraction, alpha-band power computation, frontal alpha asymmetry (FAA) calculation, and statistical analysis.
Buildings 16 01284 g007
Figure 8. Mean frontal alpha asymmetry (FAA = lnF4 − lnF3) across the four window-view conditions. Error bars represent 95% confidence intervals. Negative FAA values indicate relatively stronger right-frontal activation, whereas positive values indicate stronger left-frontal activation. No pairwise differences survived Bonferroni correction.
Buildings 16 01284 g008
Figure 9. Mean log-transformed alpha power (ln µV2) at the frontal electrodes F3 (left) and F4 (right) across the four window-view conditions. Error bars represent 95% confidence intervals. ** indicates significant differences after Bonferroni correction (α_adj = 0.0125).
Buildings 16 01284 g009
Figure 10. Frontal alpha asymmetry (FAA) analysis based on alpha power at electrodes F3 and F4. The figure illustrates the relationship between alpha power and frontal activation, the FAA calculation, and electrode locations used for the Natural Greenery condition. ** indicates statistically significant differences after Bonferroni correction (α_adj = 0.0125).
Buildings 16 01284 g010
Figure 11. Mean ratings from the semantic differential questionnaire for the four window-view conditions. Left: Comfort ratings (−3 = Uncomfortable, +3 = Comfortable). Right: Likeability ratings (−3 = I do not like it, +3 = I like it). Error bars represent 95% confidence intervals. Asterisks indicate significance levels based on Bonferroni-adjusted pairwise comparisons (* p < 0.05, ** p < 0.01); n.s. = not significant.
Buildings 16 01284 g011
Table 1. Descriptive statistics for frontal alpha asymmetry (FAA = ln(F4) − ln(F3)) across visual conditions (N = 25).
ConditionMean FAASD
White Color (Control)−0.1680.321
Green Color−0.0630.386
Natural Greenery−0.2660.379
Shadows of Greenery−0.1740.324
Table 2. Descriptive statistics for log-transformed frontal alpha power.
Condition (Trigger)F4 (Mean ± SD)F3 (Mean ± SD)
White Color (Control)2.905 ± 0.3763.072 ± 0.436
Green Color2.904 ± 0.4262.967 ± 0.393
Natural Greenery2.818 ± 0.2753.084 ± 0.465
Shadows of Greenery2.833 ± 0.3833.006 ± 0.439
Note: values represent mean ± standard deviation of log-transformed frontal alpha power recorded at right (F4) and left (F3) frontal electrodes across the four visual conditions (n = 25).
Table 3. Two-way repeated measures ANOVA for log-transformed frontal alpha power.
EffectdfFpPartial η2
Trigger1.557, 37.360.6930.4720.028
Hemisphere1, 247.2240.0130.231
Trigger × Hemisphere2.124, 50.9684.5910.0130.161
Note. Greenhouse–Geisser correction was applied where the sphericity assumption was violated.
Disclaimer/Publisher’s Note: The statements, opinions and data contained in all publications are solely those of the individual author(s) and contributor(s) and not of MDPI and/or the editor(s). MDPI and/or the editor(s) disclaim responsibility for any injury to people or property resulting from any ideas, methods, instructions or products referred to in the content.