Article

Investigation of Optimal Installation Positions for Two Coherent Motors to Minimize Structure-Borne Sound Transmission to a Floor in Buildings


Department of Building Environment and Energy Engineering, The Hong Kong Polytechnic University, Hung Hom, Kowloon, Hong Kong, China
*
Author to whom correspondence should be addressed.
Buildings 2026, 16(6), 1176; https://doi.org/10.3390/buildings16061176
Submission received: 13 February 2026 / Revised: 13 March 2026 / Accepted: 14 March 2026 / Published: 17 March 2026
(This article belongs to the Special Issue Sustainable Acoustics and Noise Control in Buildings)

Abstract

This paper investigates the optimal installation positions of two coherent motors by analyzing the structure-borne sound power transmission to a simply supported rectangular concrete floor. The free velocity and source mobility of the motors were measured experimentally, while the receiver mobility of the floor was obtained via the modal summation method. Based on these parameters, the study examined how installation positions and inter-point interactions influence the transmitted sound power. The results showed that the difference in structure-borne sound power level between the optimal and worst-case installations was 20.44 dB in the 1/3-octave band centered at 50 Hz. Crucially, the optimal positions remained unchanged even when inter-point interactions were neglected in the power calculations, providing actionable guidance for practical vibration isolation design in building applications.

1. Introduction

In contemporary urban buildings, building services equipment—including pumps, compressors, heating, ventilation, and air-conditioning (HVAC) systems—constitutes a dominant, persistent source of low-frequency noise and vibration. When such disturbances propagate into acoustically sensitive spaces (e.g., residential bedrooms, offices, and meeting rooms), they directly compromise indoor acoustic comfort and functional performance, highlighting critical limitations in current noise control methodologies and underscoring the urgent need for advanced strategies in acoustic prediction [1]. Extensive research has linked such disturbances to compromised resident well-being and living quality, including increased annoyance, elevated stress, reduced cognitive performance, and impaired concentration [2,3,4,5,6,7,8]. In the broader context of international research, accurately evaluating machine–structure interactions remains a critical challenge. For instance, coupled experimental–numerical predictive analyses have demonstrated that non-isolated or poorly evaluated machine-induced vibrations can easily trigger severe resonance on inter-story floors, profoundly degrading both the structural integrity and the acoustic environment of buildings [9].
Notably, in real building construction practices, parallel operation of multiple identical, coherent building services units is a ubiquitous engineering configuration. However, current mainstream noise control design specifications and engineering practices are predominantly tailored to single equipment units, with a critical lack of standardized guidance for layout optimization of multi-coherent-source systems. This gap often leads to a significant mismatch between predicted and actual noise reduction performance in practical projects, even when properly selected vibration isolators are implemented. A primary driver of this discrepancy is the complex superposition of structure-borne waves, which fundamentally involves strong constructive and destructive interference effects. When multiple coherent sources operate simultaneously, their transmitted structural vibrations interact spatially. In other engineering domains, the principle of actively exploiting such interference effects to minimize total noise and vibration has been highly successful—for instance, through “synchrophasing control” to dynamically cancel out multi-propeller or multirotor noise [10,11] and to robustly attenuate the structure-borne sound of multiple electrical machines mounted on large-scale floating raft isolation systems [12,13,14]. In building acoustics, while active phase control is less common, an analogous passive strategy serves as a practicable alternative: installation layout optimization. By strategically altering spatial phase differences through the topology and volume optimization of machinery base plates [15] or hybrid optimization frameworks that co-configure supporting structures and isolator locations [16], researchers can passively maximize destructive interference to minimize structural resonance.
While existing studies have advanced the prediction and assessment of resultant indoor noise metrics and acoustic quality modeling [17,18,19,20,21], they predominantly focus on the acoustic receiving end (i.e., indoor noise) rather than the source transmission mechanisms. There remains a critical need to quantify how mounting point configurations govern the transmission of structure-borne sound from building services equipment into buildings.
Vibration isolators are widely employed in engineering to mitigate structure-borne sound transmission, with force transmissibility commonly adopted as a practical performance indicator owing to its experimental accessibility and computational tractability. Mak and Su [22,23] proposed the “power transmissibility” method for evaluating the performance of vibration isolation. Grounded in structure-borne sound power transmission, this method integrates force and velocity to deliver a comprehensive assessment of vibration isolation effectiveness, offering a more robust metric for evaluating control performance in engineering applications [24]. Subsequent studies expanded this framework to analyze power transmission from two coherent machines to simple and dual-layer floor systems [25,26]. Their work [25,26] considered not only the floor mobility and the interactions of the installation points of the same vibration source, but also the interactions of the installation points of different vibration sources on the floor. They pointed out a practical engineering question: What is the optimum installation position for a vibration-isolated machine on a floor structure such that the minimum amount of structure-borne sound power is transmitted? While this foundational work established the theoretical framework for multi-source structure-borne sound transmission, there remains a lack of quantitative, engineering-applicable optimization guidelines for coherent dual-motor systems, which are widely used in practice.
To determine the optimum installation positions for a single vibratory machine on a floor structure in buildings, the mobility of the floor and interactions among installation points of the machine were considered in the calculation of the structure-borne sound power transmission [27]. However, their analytical model relies on a rectangular uniform-mass machine model, neglecting real-world complexities. This study bridges this gap by investigating how installation point interactions of two real coherent single-phase motors influence total structure-borne sound power transmission. Given that vertical-component structure-borne sound power dominates low-frequency dynamics in engineering [28], we focus on vertical forces and velocity responses to streamline power transmission analysis, providing quantitative, easy-to-implement guidance for the low-noise layout design of coherent building services equipment in practical building engineering.

2. Methods

2.1. Structure-Borne Sound Power Transmission

As shown in Figure 1, two coherent single-phase motors, each equipped with four vibration isolators, were installed on a floor with all edges simply supported. The dynamic forces transmitted from the two coherent motors to the simply supported floor at the eight installation points are given by
F c = Y s 1 0 4 × 4 0 4 × 4 Y s 2 + Y k 11 Y k 12 Y k 21 Y k 22 + Y r 11 Y r 12 Y r 21 Y r 22 V f 1 V f 2
Y k 11 = Y k 22 = ( j ω K k + 1 j ω M k )   ×   I 4 × 4
Y k 11 = Y k 22 = I 4 × 4 j ω M k
where 04×4 denotes a 4 × 4 zero matrix; Ys1 and Ys2 are the source mobility matrices of motor A and motor B, respectively; Yk11 to Yk22 are the mobility matrices of the spring isolators; Yr11 and Yr22 are the floor mobility matrices at points 1–4 and 5–8, respectively; Yr12 and Yr21 are the cross mobility matrices between the set of points; Vf1 and Vf2 are the free velocity vectors at the mounting positions of the two motors; j denotes the imaginary unit; ω denotes the angular frequency; and Kk and Mk denote the stiffness and mass of each isolator, respectively.
The total structure-borne sound power transmitted from the two motors to the floor is given by [29]
P c = 1 2 R e ( F c ) * T Y r 11 Y r 12 Y r 21 Y r 22 F c
where superscript * denotes the complex conjugate, and the superscript T denotes the transpose of a matrix. To compute Pc, the free velocity, source mobility and receiver mobility must be determined (Equations (1)–(4)). In this study, the free velocity and source mobility of the motors were obtained via experimental measurements, and the receiver mobility was derived using the modal summation method as presented in the literature [30,31]. The general expression of the mobility between two points (x1, y1) and (x2, y2) on a plate can be expressed as follows:
Y r ( x 1 , y 1 | x 2 , y 2 )   =   j ω r = 1 r ( x 1 , y 1 ) r ( x 2 , y 2 ) M p ω r 2 ( 1   +   j η )   -   ω 2
where r ( x , y ) and ωr denote the rth order mode shape function and corresponding natural frequency of the plate, respectively; Mp is the plate mass; and η is the loss factor. For a simply supported rectangular plate, ωr and r ( x , y ) can be analytically derived [32]:
ω r   =   D / ρ h r 1 π / l x 2   +   r 2 π / l y 2
r ( x , y ) = 2 sin r 1 π x / l x sin r 2 π y / l y
where D   =   12 E h 3 / 1 μ 2 is the bending stiffness; ρ is the density; h is the thickness; r1 and r2 are the modal indices of the rth mode; lx and ly are the plate dimensions; and μ is the Poisson’s ratio.
When neglecting the coupling between the two motors, the transmitted forces and the corresponding structure-borne sound power can be expressed as
F s = Y s 1 0 4 × 4 0 4 × 4 Y s 2 + Y k 11 Y k 12 Y k 21 Y k 22 + Y r 11 0 4 × 4 0 4 × 4 Y r 22 V f 1 V f 2
P s = 1 2 Re ( F s ) * T Y r 11 0 4 × 4 0 4 × 4 Y r 22 F s
The sound power levels for the coupled (Pc) and decoupled (Ps) can be expressed as
L pc = 10   × log 10 P c / P ref
L ps = 10   × log 10 P s / P ref

2.2. Experimental Setup

Experimental measurements of free velocity and source mobility were performed using an impulse hammer (9276A, Kistler, Winterthur, Switzerland), four accelerometers (4394, B&K, Milano, Italy) and a Pulse (3560D, B&K) system with Labshop software. The measurement procedures were conducted according to ISO 7626-1 [33] and ISO 7626-5 [34].
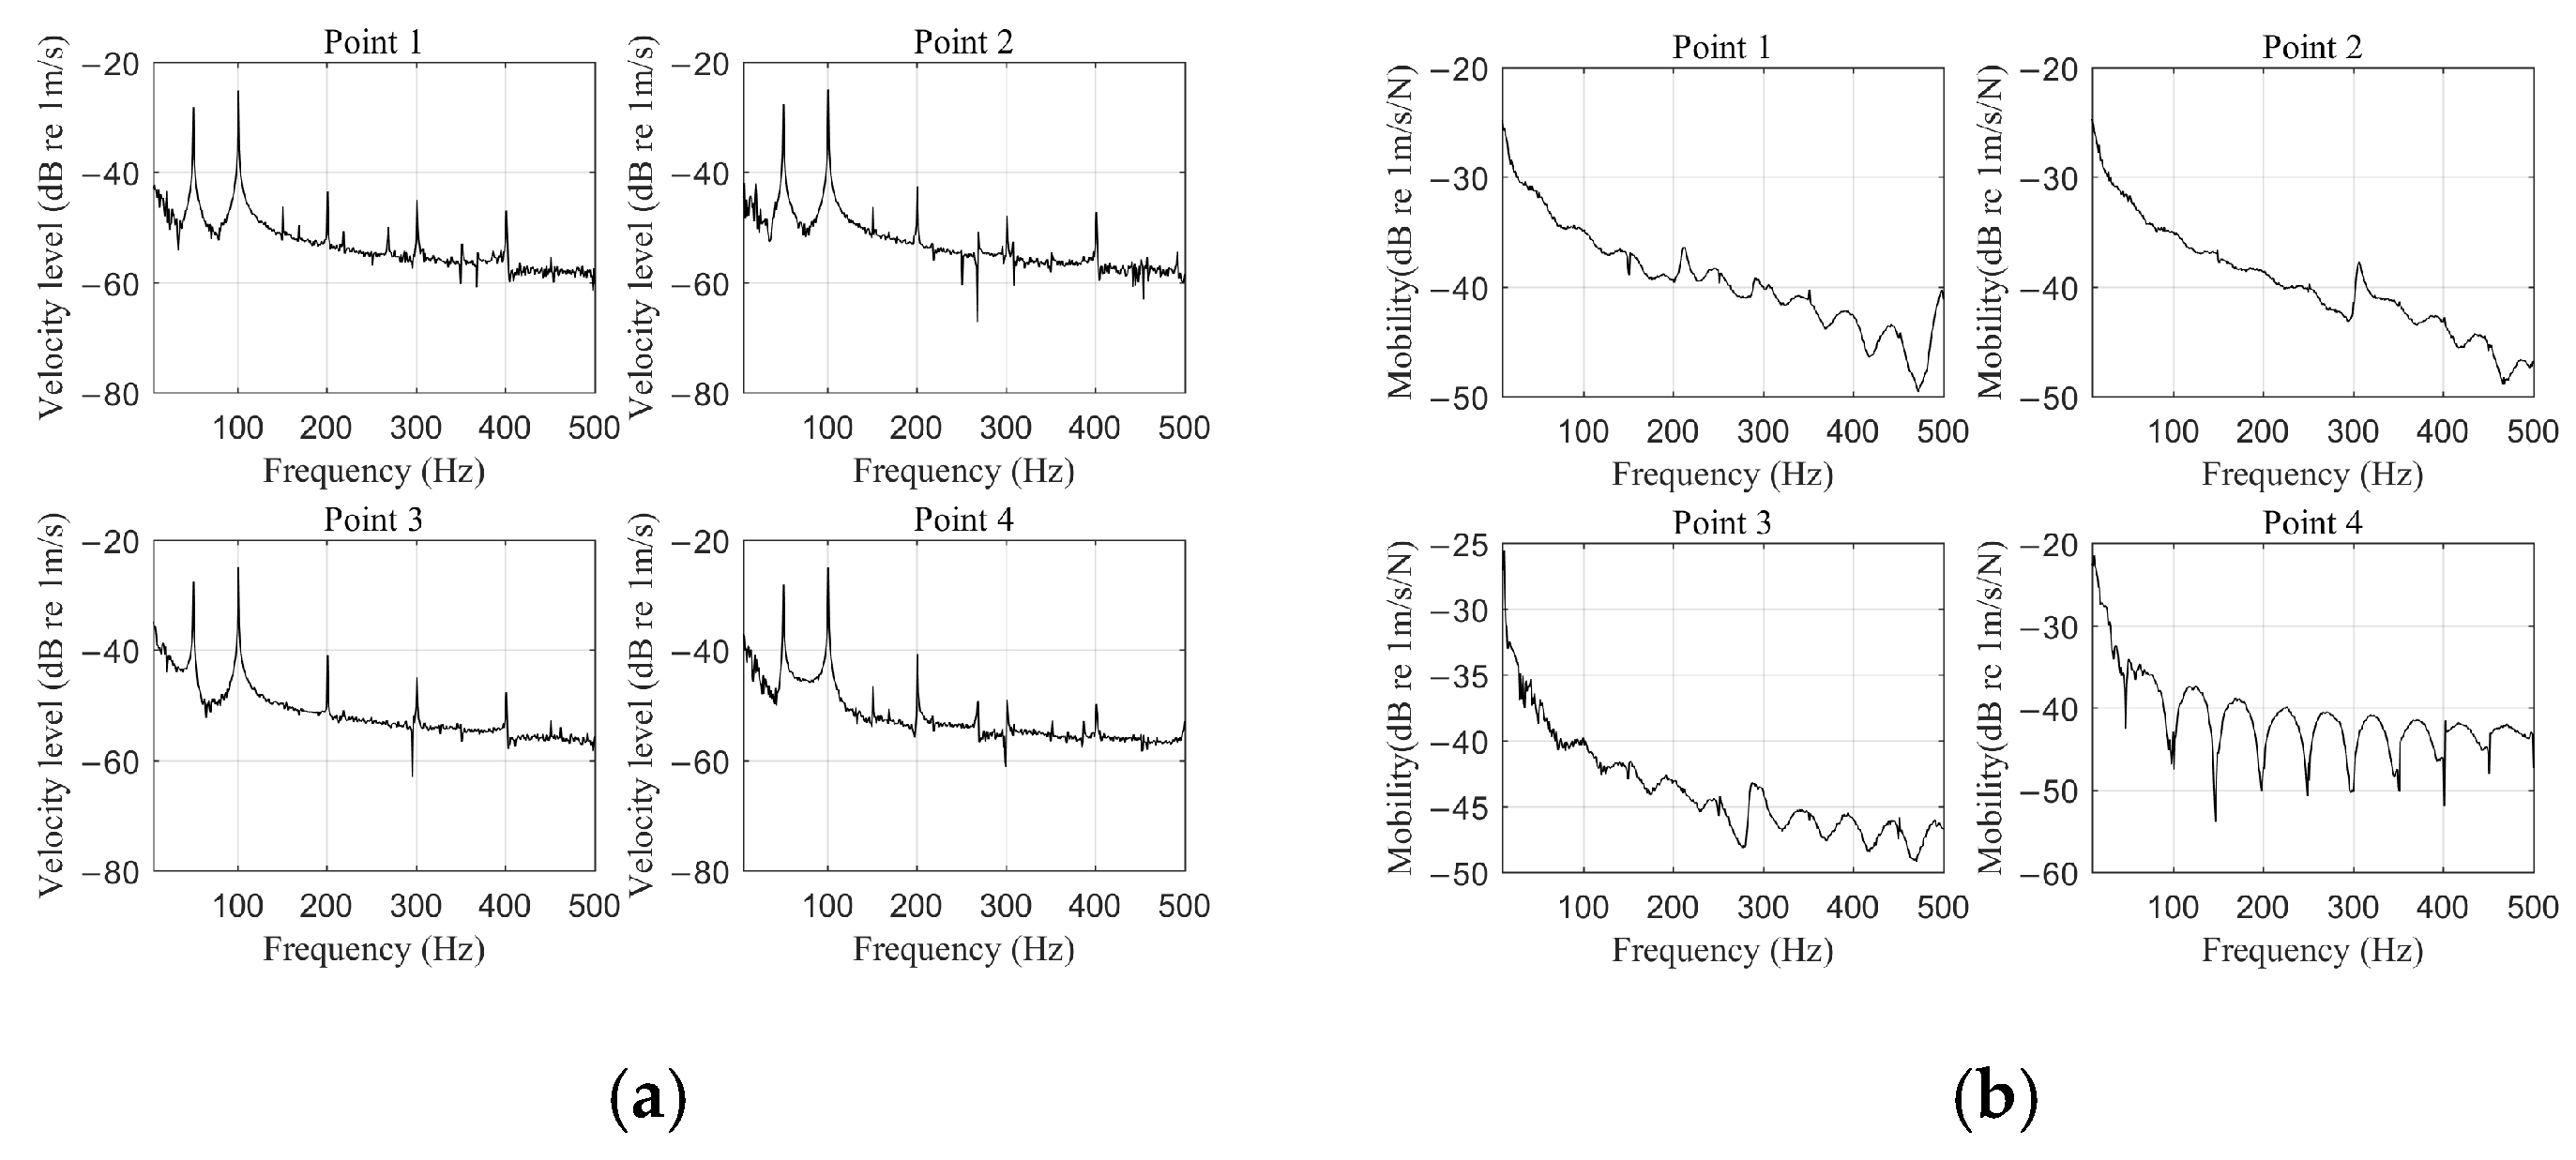
In the experiment, the motor was suspended by rubber ropes to achieve the free boundary condition [35]. Free velocities at the four mounting points of the motor were measured under steady-state operation. The measured frequency-domain velocity levels at these points are presented in Figure 2a, while the measured frequency-domain point mobility magnitudes at the same mounting points are shown in Figure 2b.

2.3. Parameters for Simulation

The geometrical properties of the rectangular concrete floor were as follows: length L = 6 m, width W = 4.5 m, and thickness d = 0.12 m. The physical properties of the floor were as follows: density ρ = 2.8 × 10³ kg/m3, Young’s modulus E = 2.1 × 10¹⁰ N/m2, and Poisson’s ratio μ = 0.2. The loss factor of the floor, η, is assumed to be constant at 0.03, though it is noted that loss factors of floors in buildings are generally frequency-dependent. However, complex modeling of this frequency dependency is beyond the scope of this paper. The mass and stiffness of the eight spring isolators are Mk = 0.2 kg and Kk = 1.1 × 10⁵ N/m. The natural frequencies and mode shapes of the floor with all edges simply supported were obtained using Equations (6) and (7). Receiver mobilities for the floor were obtained using Equation (5).

3. Results and Discussions

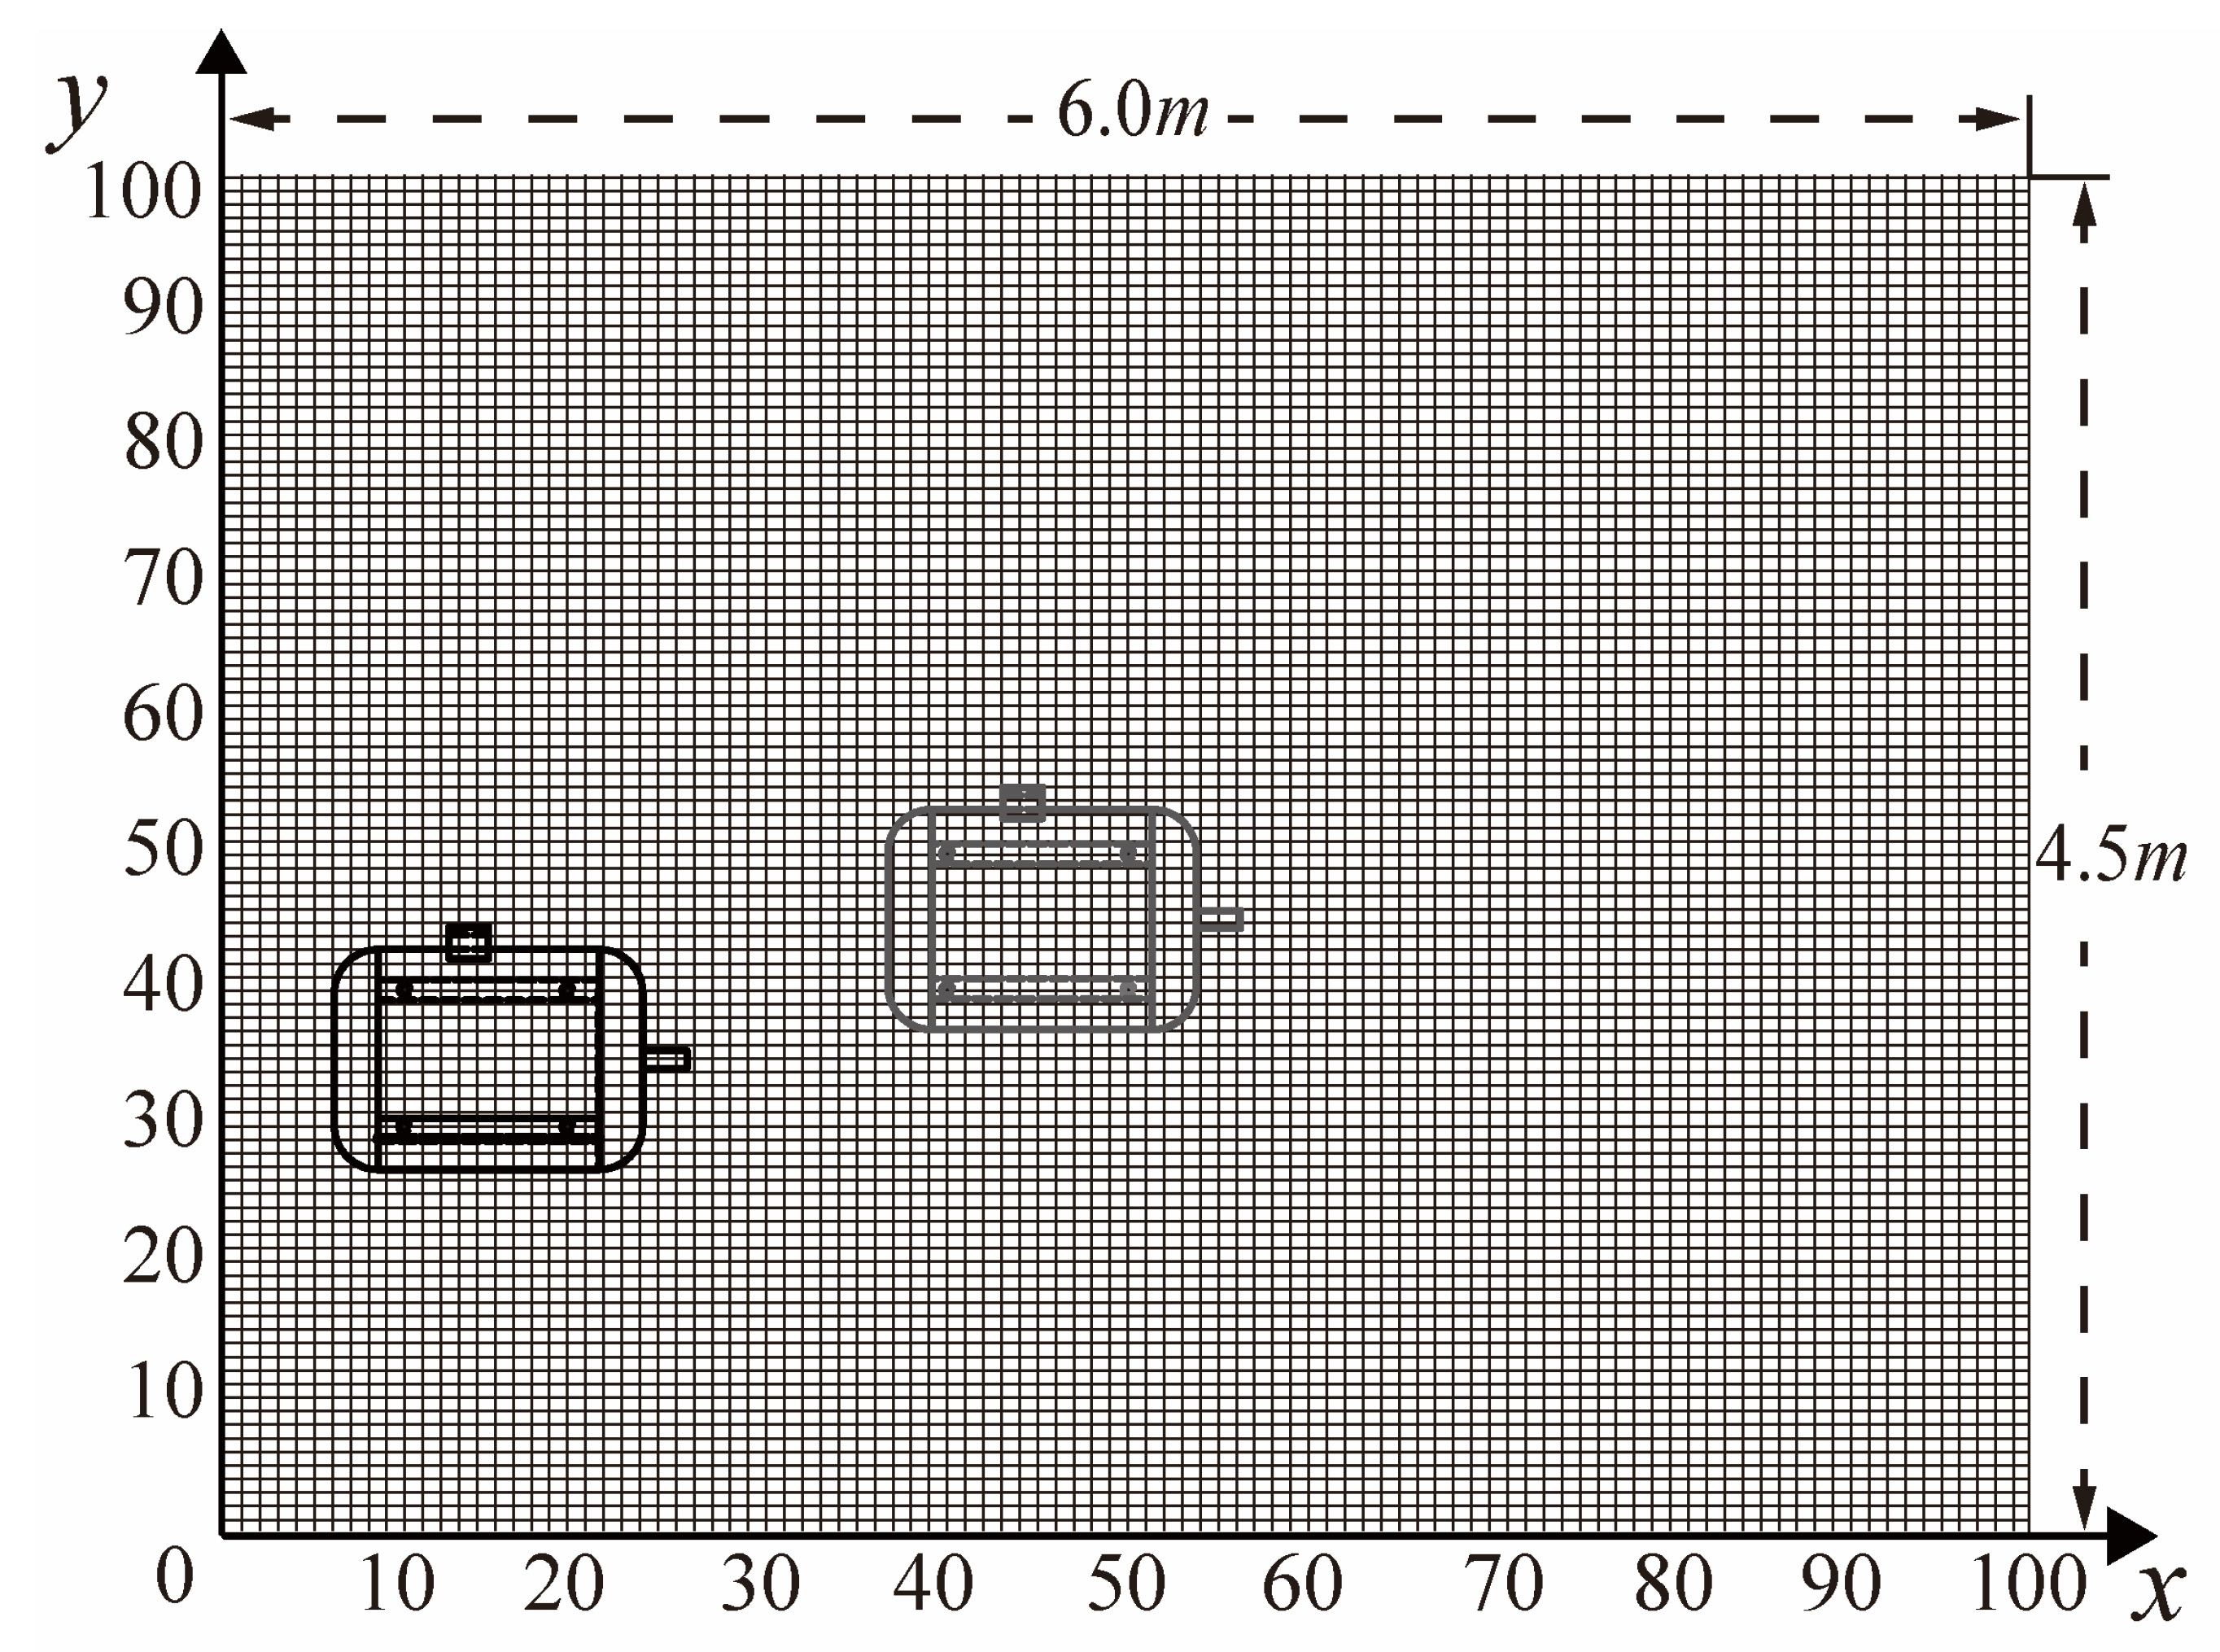
The floor was uniformly discretized into a 100 × 100 mesh of elements, as shown in Figure 3, where the numbers along the axes denote the mesh indices. Two installation scenarios for the two coherent motors were investigated. In the first scenario (Case 1), the position of motor A was fixed (represented by the black motor diagram), with its installation points 1–4 located at coordinates (10, 40), (20, 40), (20, 30), and (10, 30), respectively. In the second scenario (Case 2), motor A was fixed at a different position (represented by the gray motor diagram), with its installation points 1–4 located at coordinates (40, 50), (50, 50), (50, 40), and (40, 40), respectively. In both cases, the optimal installation position of motor B was investigated. For each possible installation configuration of motor B, the total structure-borne sound power transmitted from the two motors was computed. In this study, no phase differences are assumed between the free velocities of the installation point pairs: (1, motor A) and (5, motor B), (2, motor A) and (6, motor B), (3, motor A) and (7, motor B), as well as (4, motor A) and (8, motor B).
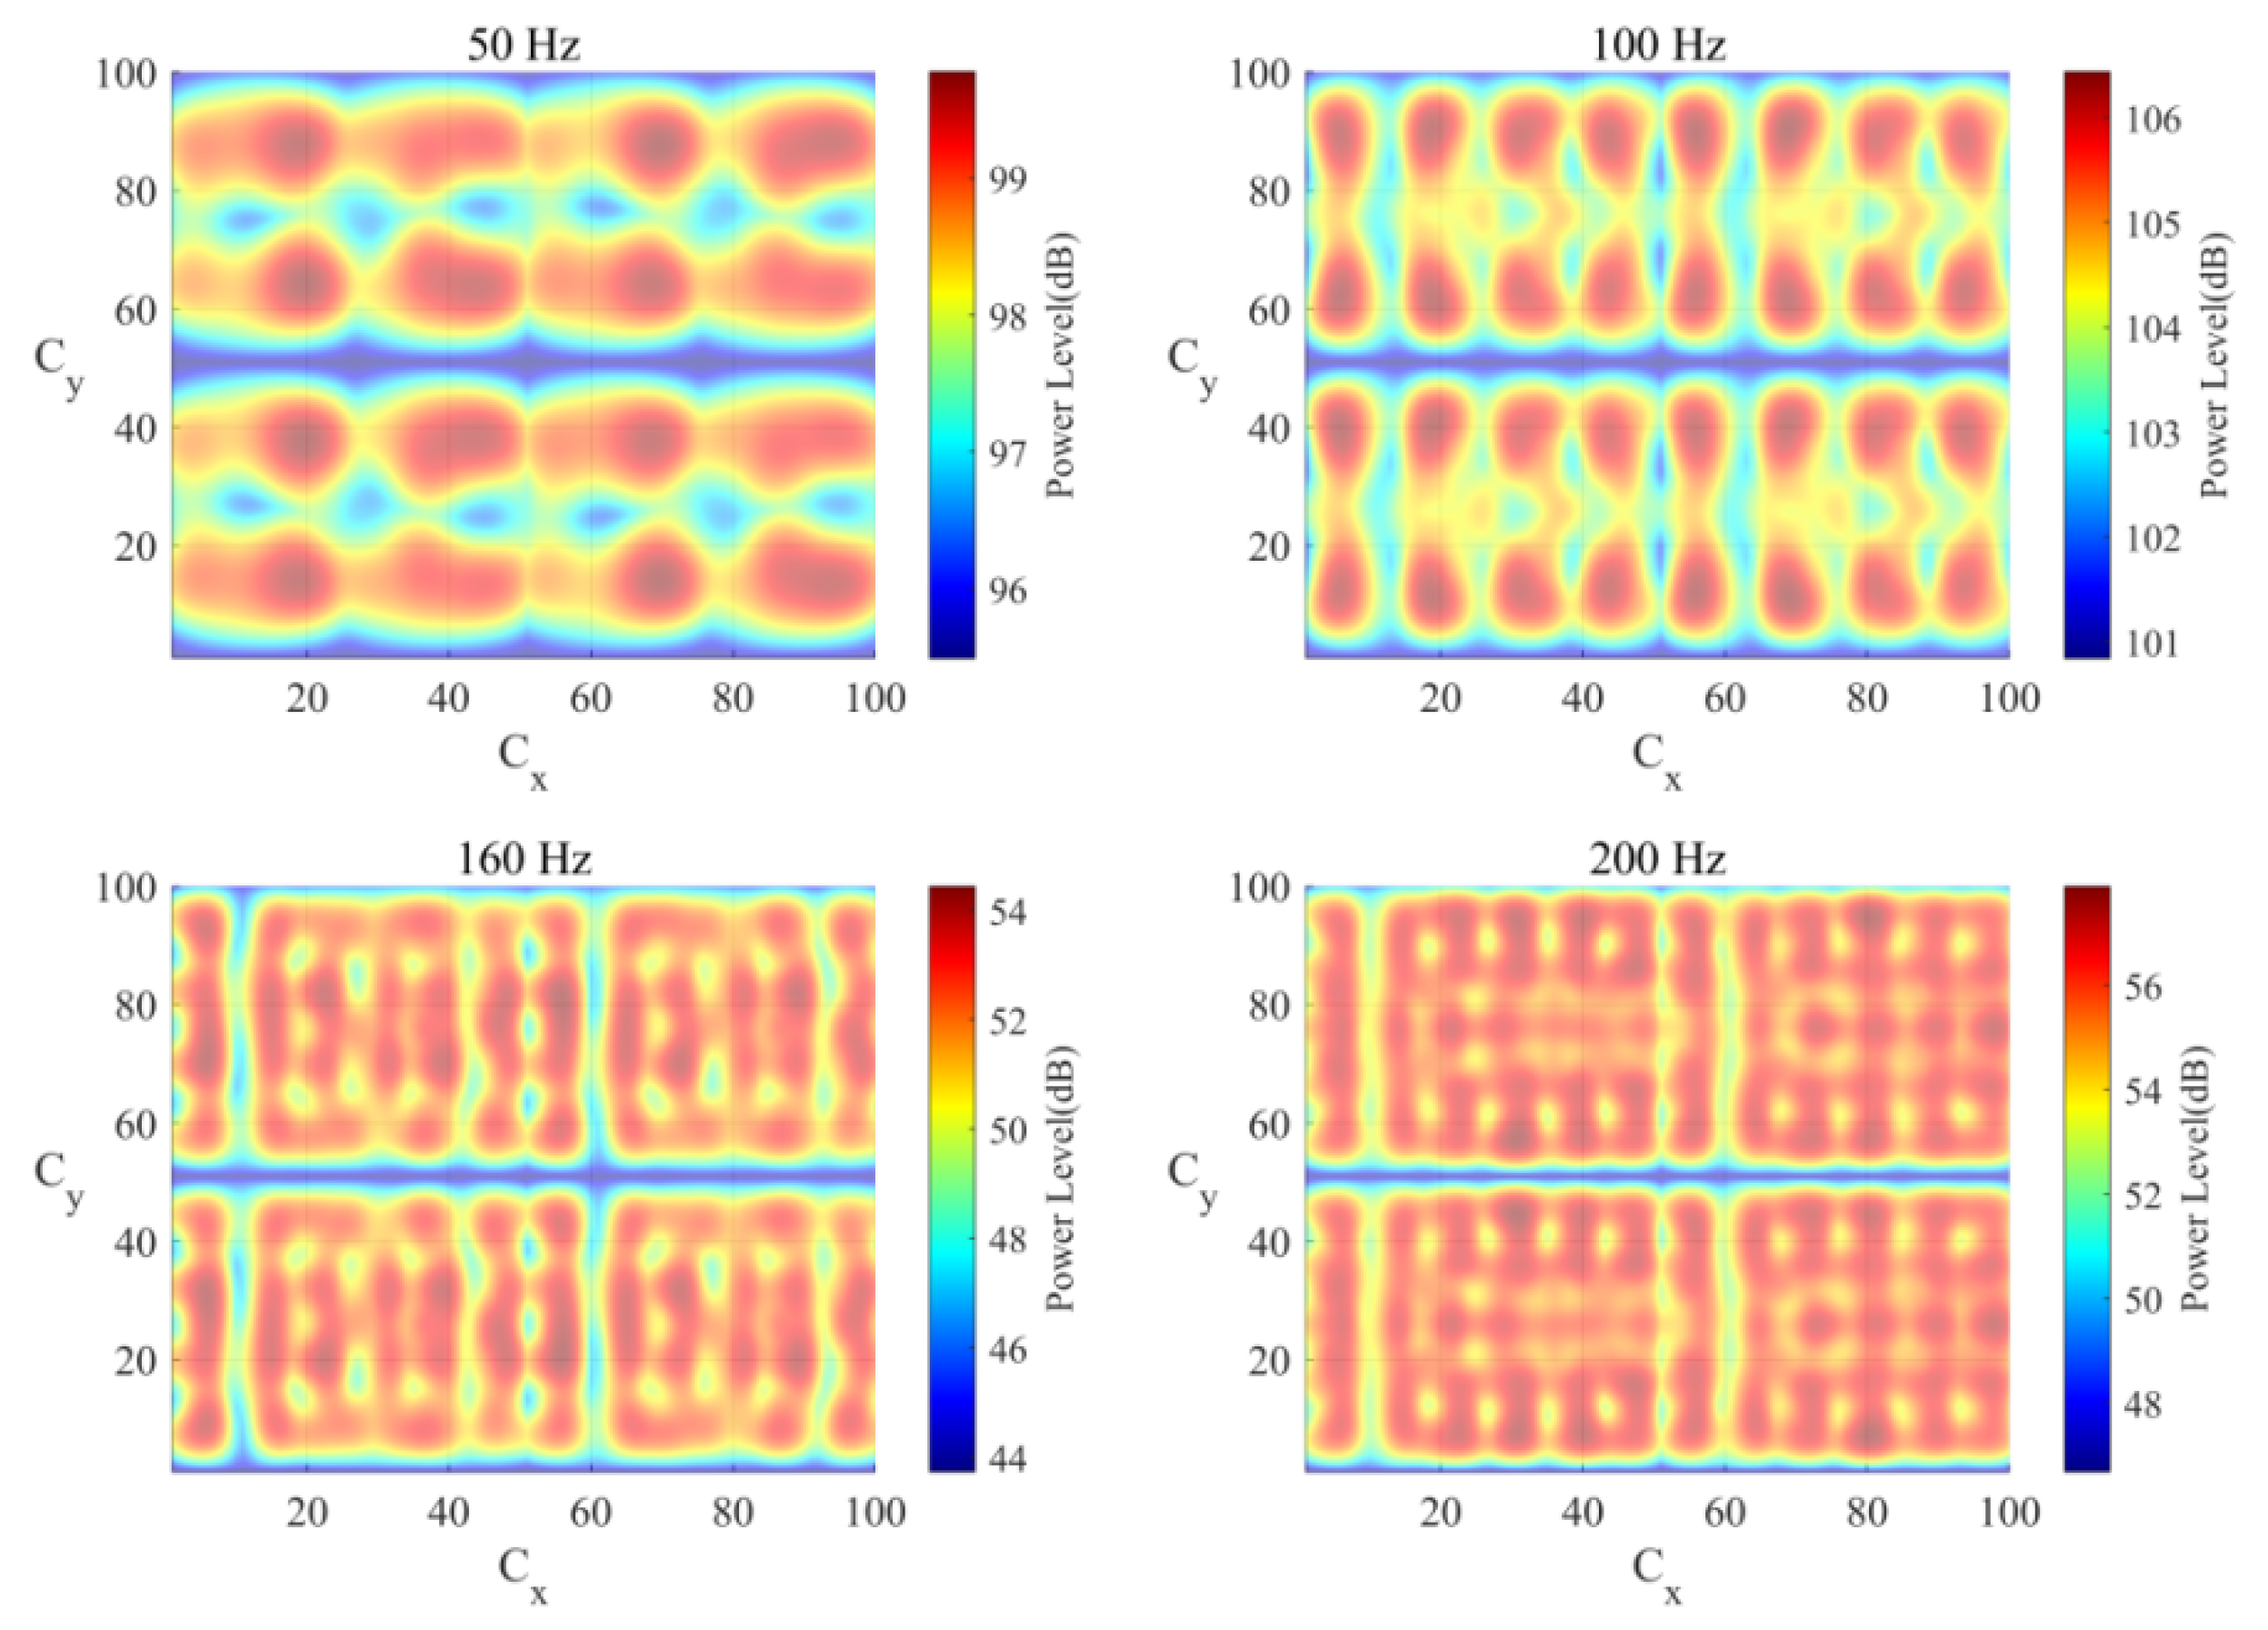
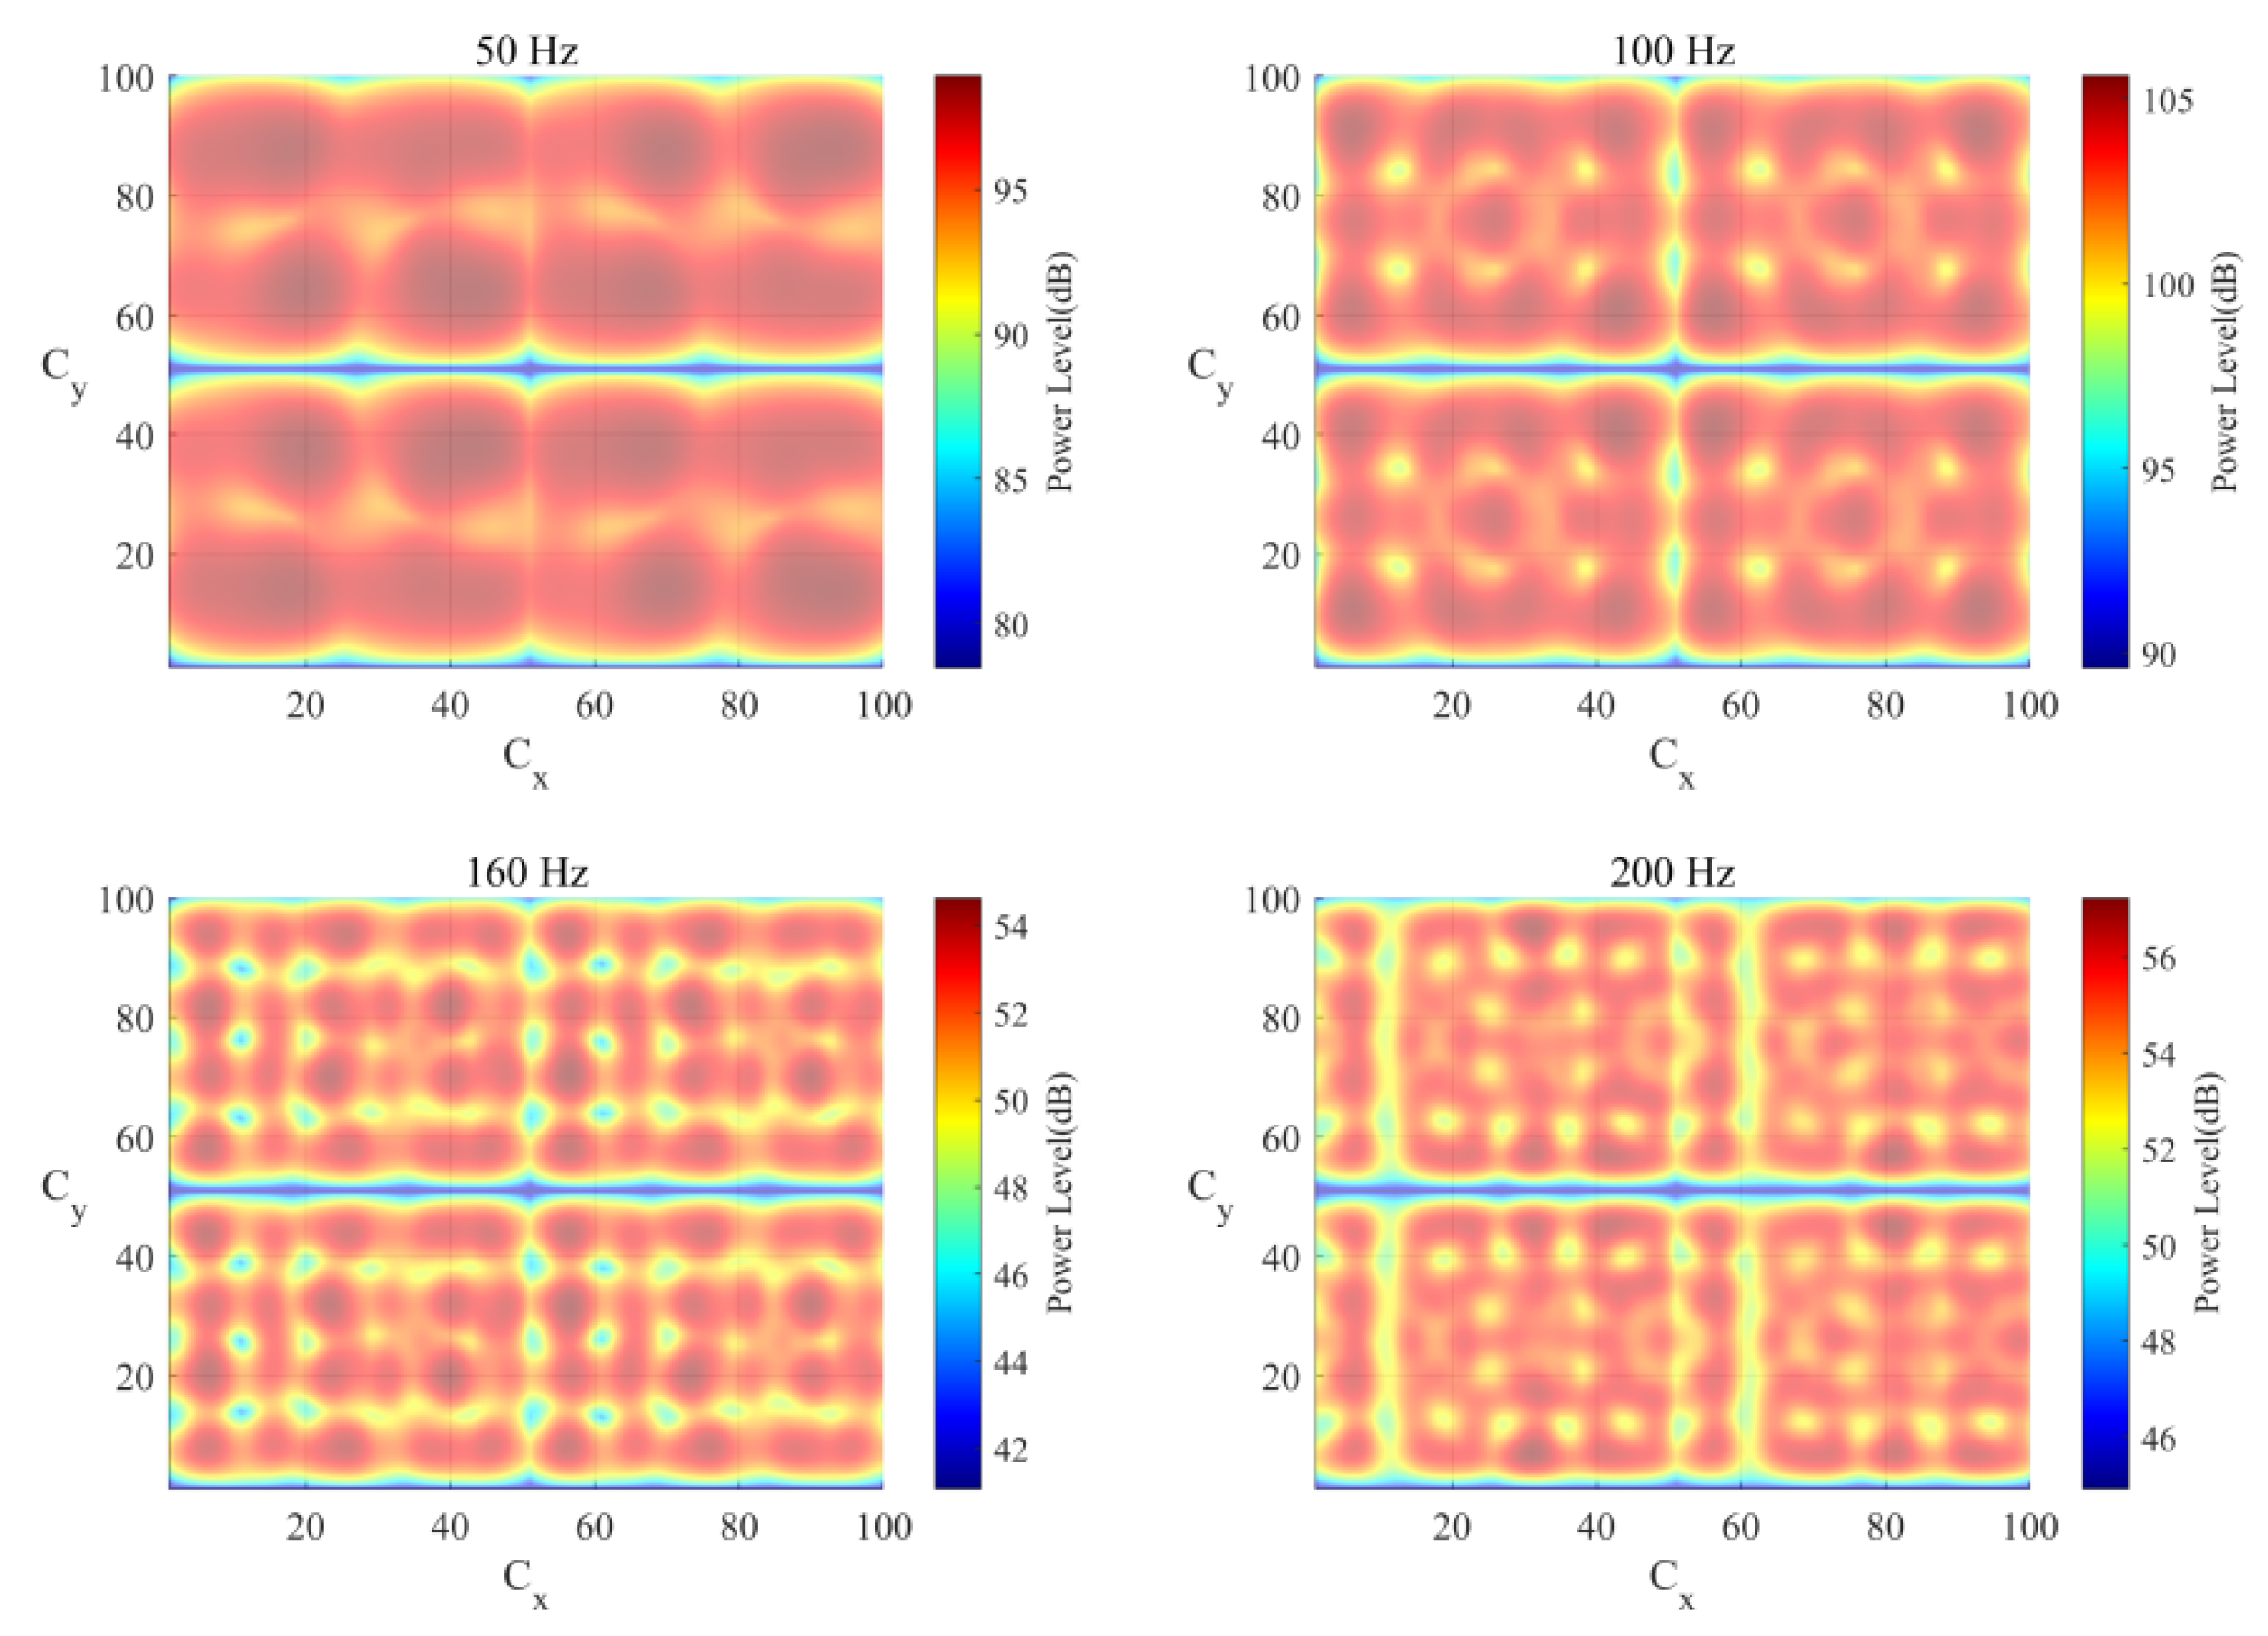
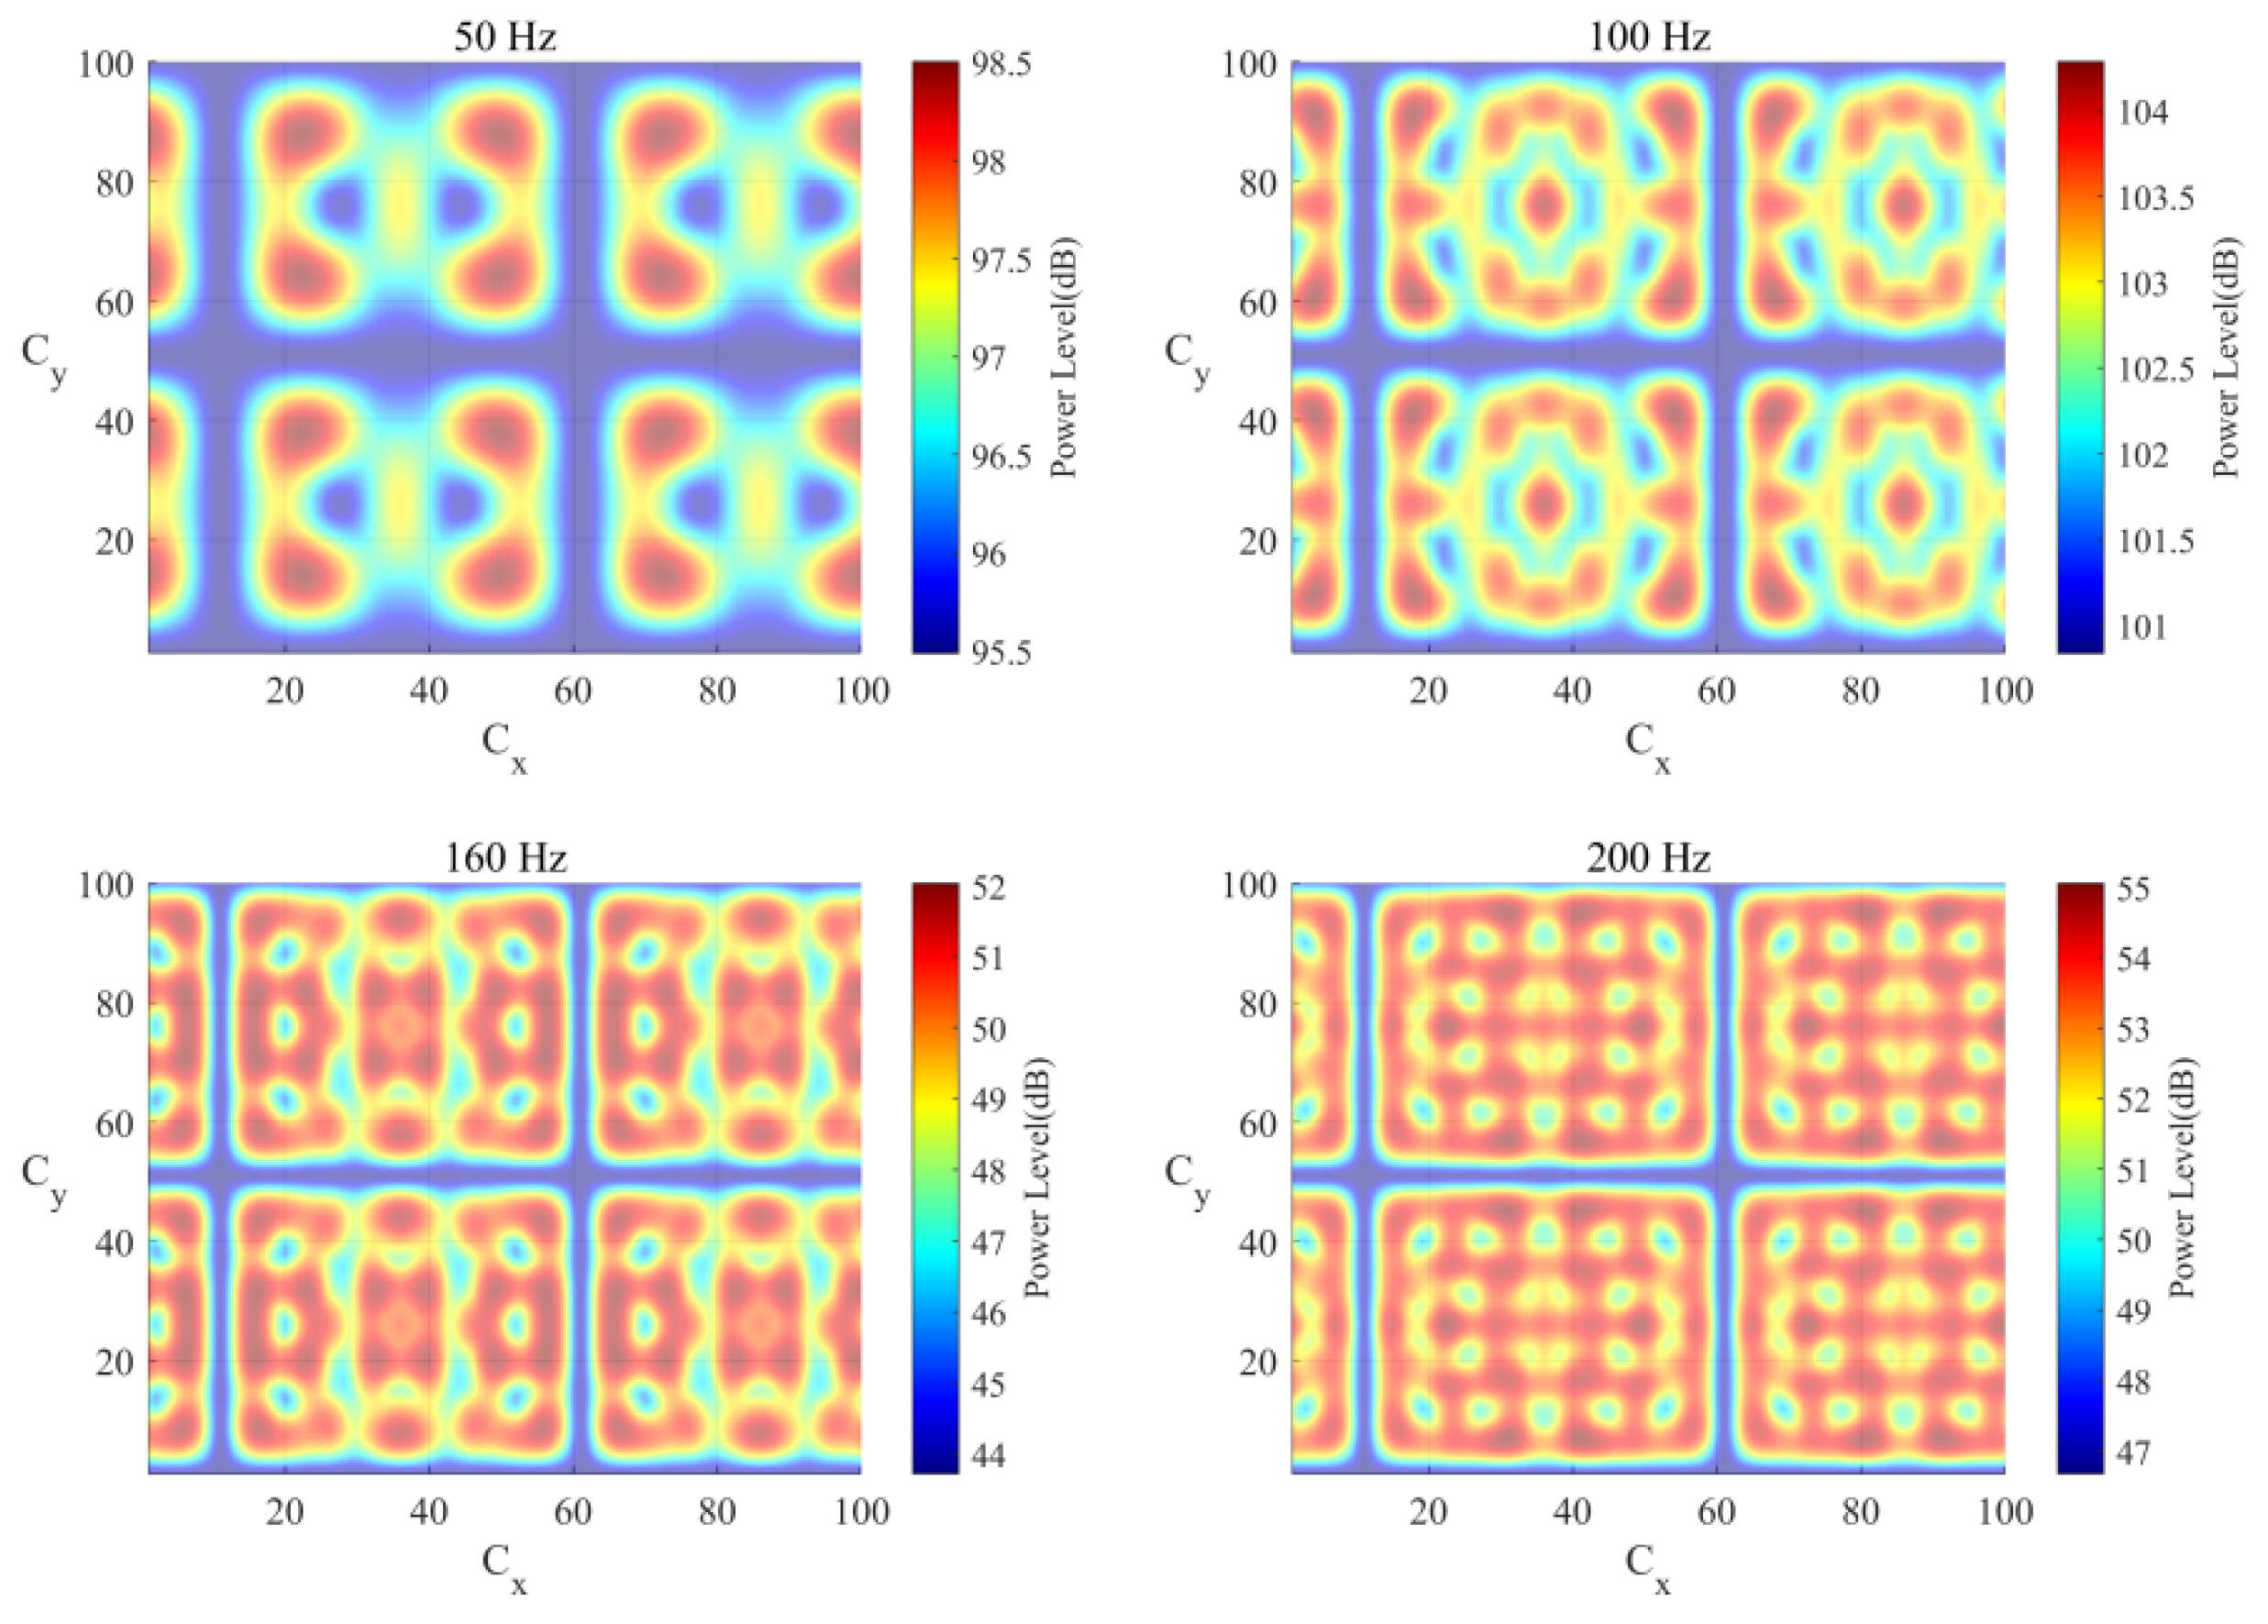
The structure-borne sound power Pc transmitted from the two coherent motors to the floor in the 1/3-octave bands at 50, 100, 160, and 200 Hz for the first installation scenario (Case 1) and the second installation scenario (Case 2) was computed. The structure-borne sound power level Lpc in the same 1/3-octave bands is presented in Figure 4 for Case 1 and Figure 5 for Case 2. In Figure 4 and Figure 5, the labels ‘Cx’ and ‘Cy’ denote the X-axis and Y-axis coordinates of the installation positions within the scenarios, respectively. The maxima, minima, and ranges of the structure-borne sound power level Lpc in the 1/3-octave bands at 50 Hz, 100 Hz, 160 Hz, and 200 Hz for both scenarios are listed in Table 1.
According to Figure 4 and Figure 5, installation positions around the top edge, bottom edge, and central axis parallel to the X-axis are more likely to be the optima based on the criterion of minimum structure-borne sound power level (Lpc). In each 1/3-octave band, the maximum power levels for the two installation scenarios are nearly identical (differences < 1 dB). For the 1/3-octave bands centered at 160 Hz and 200 Hz, the minimum power levels of the two installation scenarios also show little difference (differences < 3 dB). Notably, however, the minimum power levels of the two installation scenarios differ substantially at other frequencies: by 17.03 dB at 50 Hz and 11.24 dB at 100 Hz. For the second installation scenario (Case 2), the range of power levels exhibits a maximum of 20.44 dB in the 1/3-octave bands centered at 50 Hz, highlighting the engineering significance of optimizing installation positions—this optimization can reduce power transmission by up to 20.44 dB. Furthermore, installation positions exert a more pronounced influence on structure-borne sound power transmission in the low-frequency 1/3-octave bands.
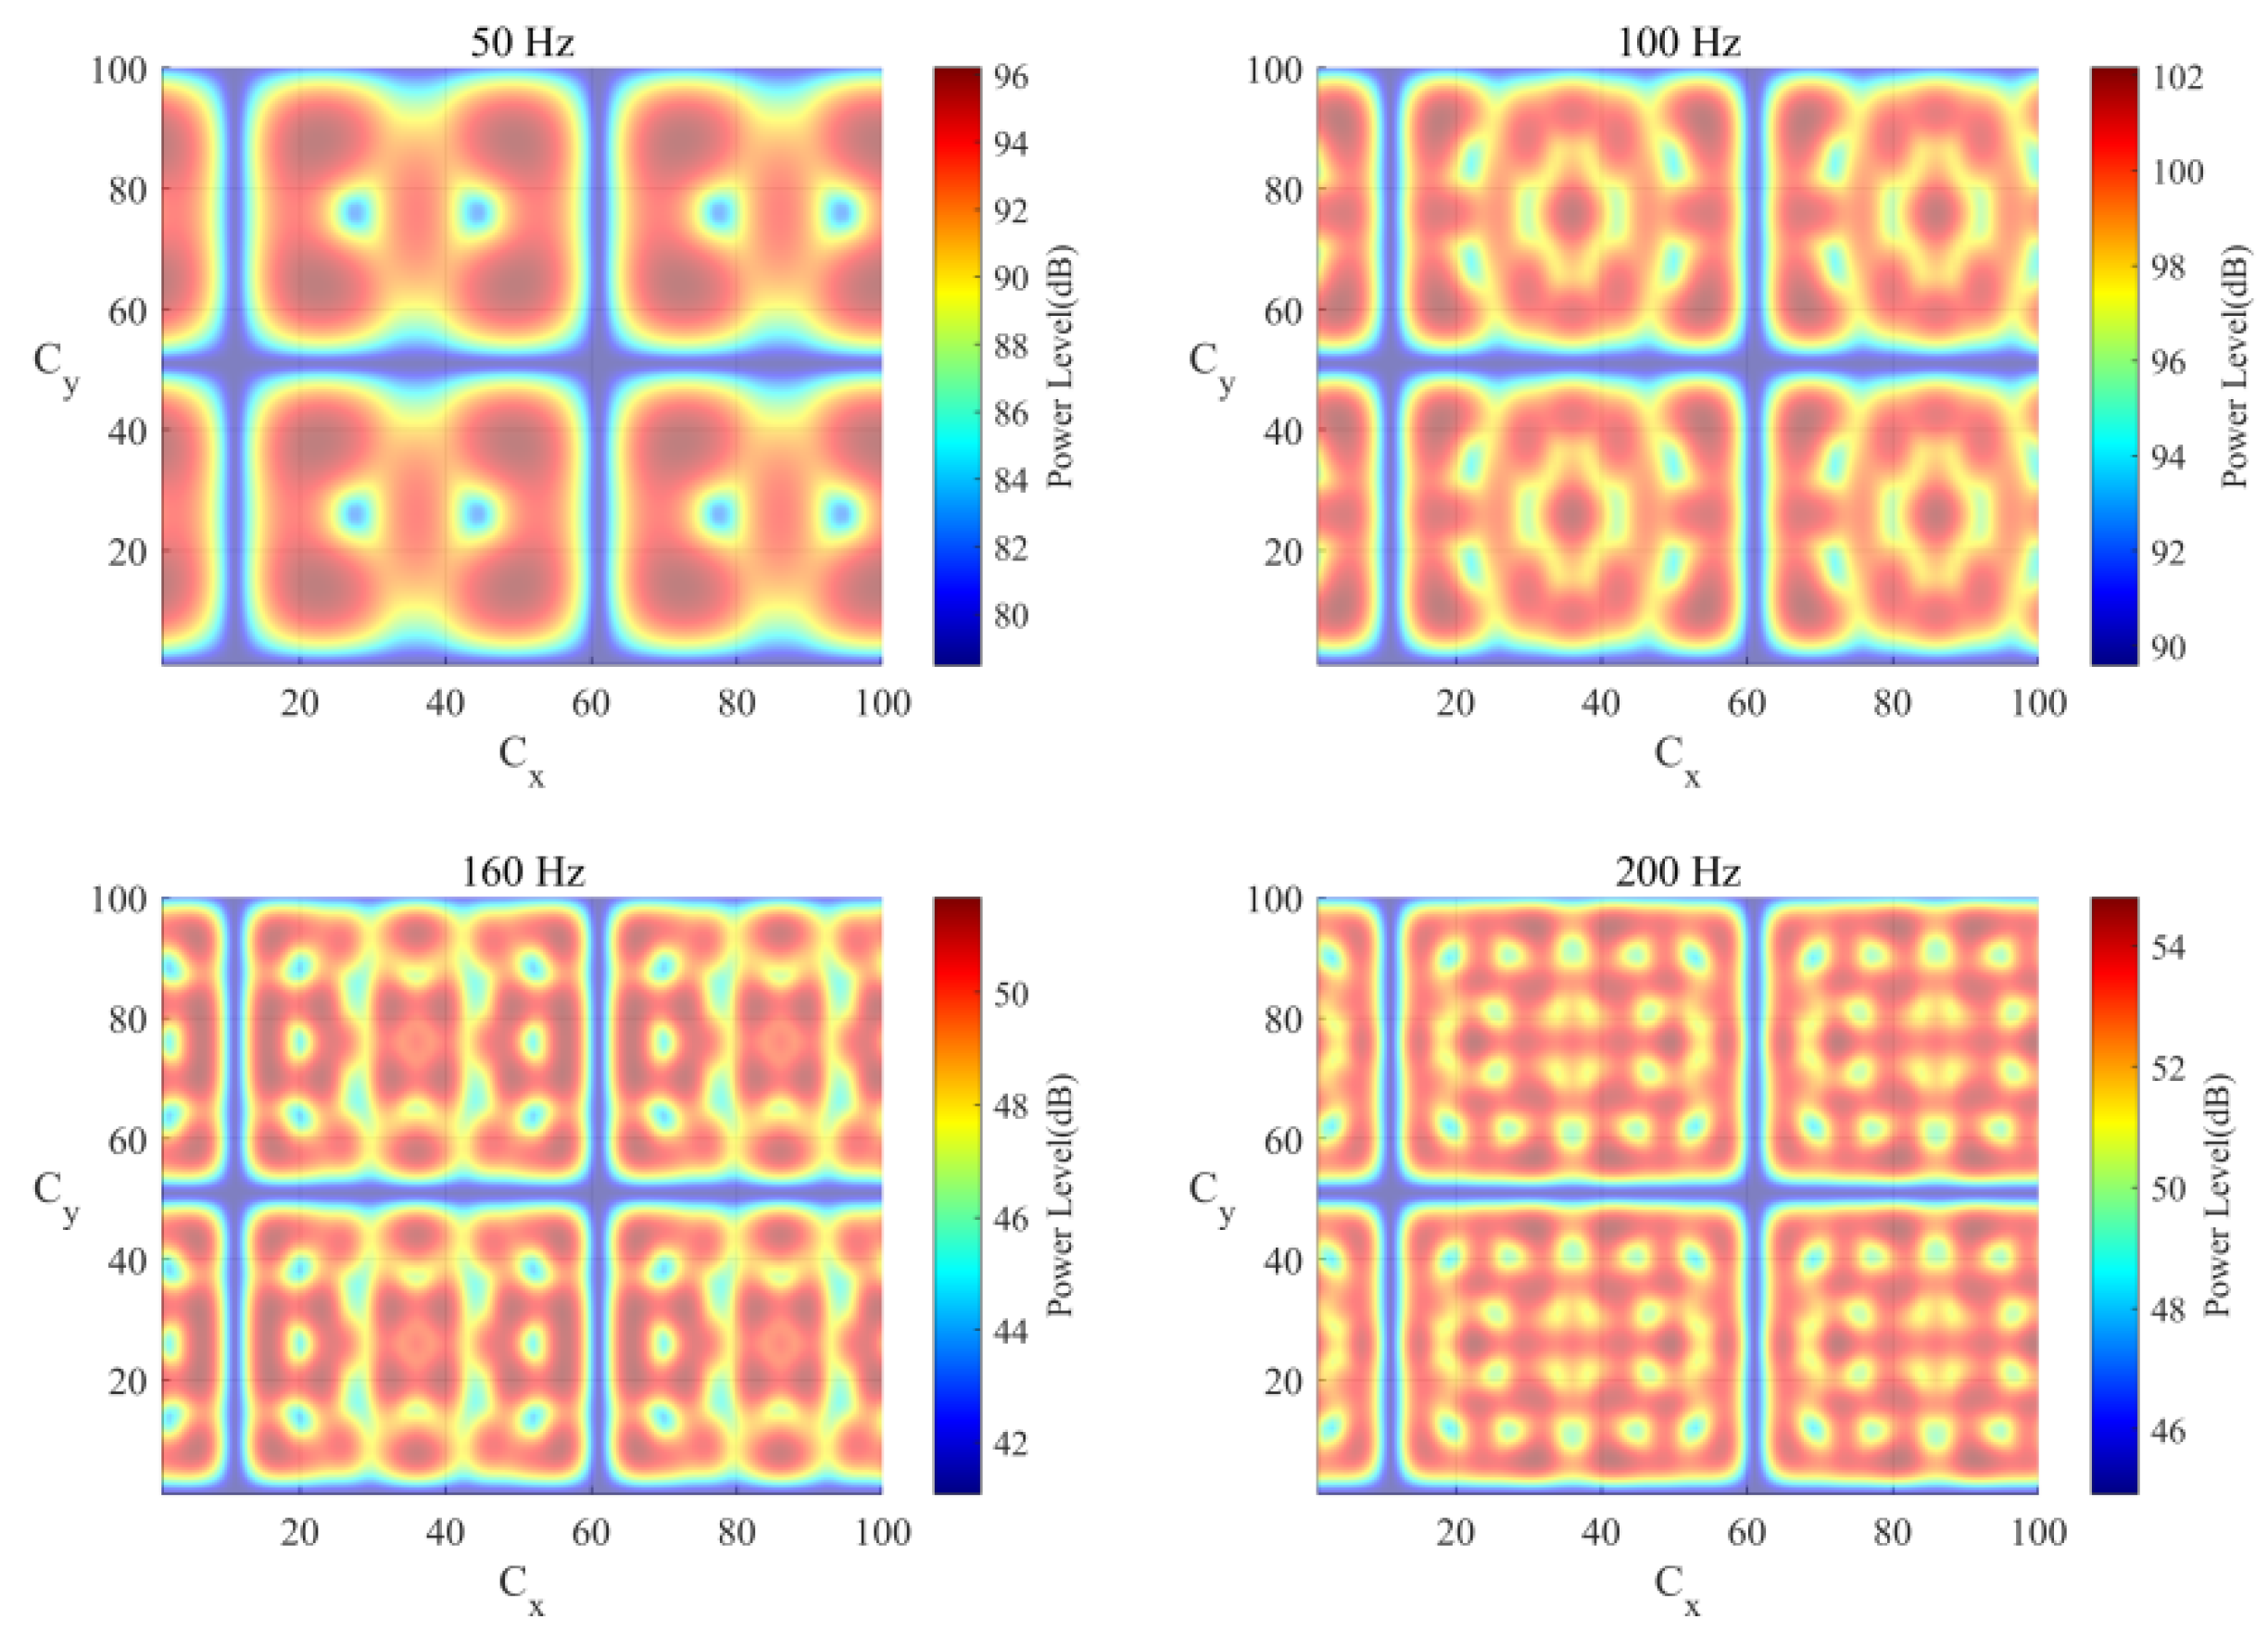
The structure-borne sound power Ps transmitted from the two coherent motors to the floor in the 1/3-octave bands centered at 50 Hz, 100 Hz, 160 Hz, and 200 Hz was calculated for the first and second installation scenarios (Cases 1 and 2). The structure-borne sound power level Lps in the same frequency bands is presented in Figure 6 for the first scenario (Case 1) and in Figure 7 for the second scenario (Case 2). Table 2 lists the maxima, minima, and ranges of the structure-borne sound power level (Lps) in the 1/3-octave bands centered at 50 Hz, 100 Hz, 160 Hz, and 200 Hz for both scenarios.
As shown in Figure 6 and Figure 7, installation positions around the top edge, bottom edge, and central axis parallel to the X-axis are more likely to be optimal for minimizing the power level. Similar trends are observed in Figure 6 and Figure 7, but Figure 6 and Figure 7 show that more positions (e.g., those around vertical lines with coordinate numbers 10 and 60) tend to be optimal under the same criterion.
Table 2 indicates that the maximum power levels for the two cases are almost identical, with differences of less than 4 dB in each 1/3-octave band. In the 1/3-octave bands of 160 Hz and 200 Hz, the minimum power levels for the two cases are nearly the same (differences of <3 dB), whereas the difference reaches 17.03 dB in the 1/3-octave bands of 50 Hz and 11.24 dB in the 1/3-octave bands of 100 Hz.
Table 1 and Table 2 show that the minimum values of the structure-borne sound power level Lpc equal the corresponding Lps minimum values. The differences between Lpc and Lps maximum values are less than 4 dB, indicating that ignoring motor coupling does not change the minimum structure-borne sound power but slightly affects the maximum values.
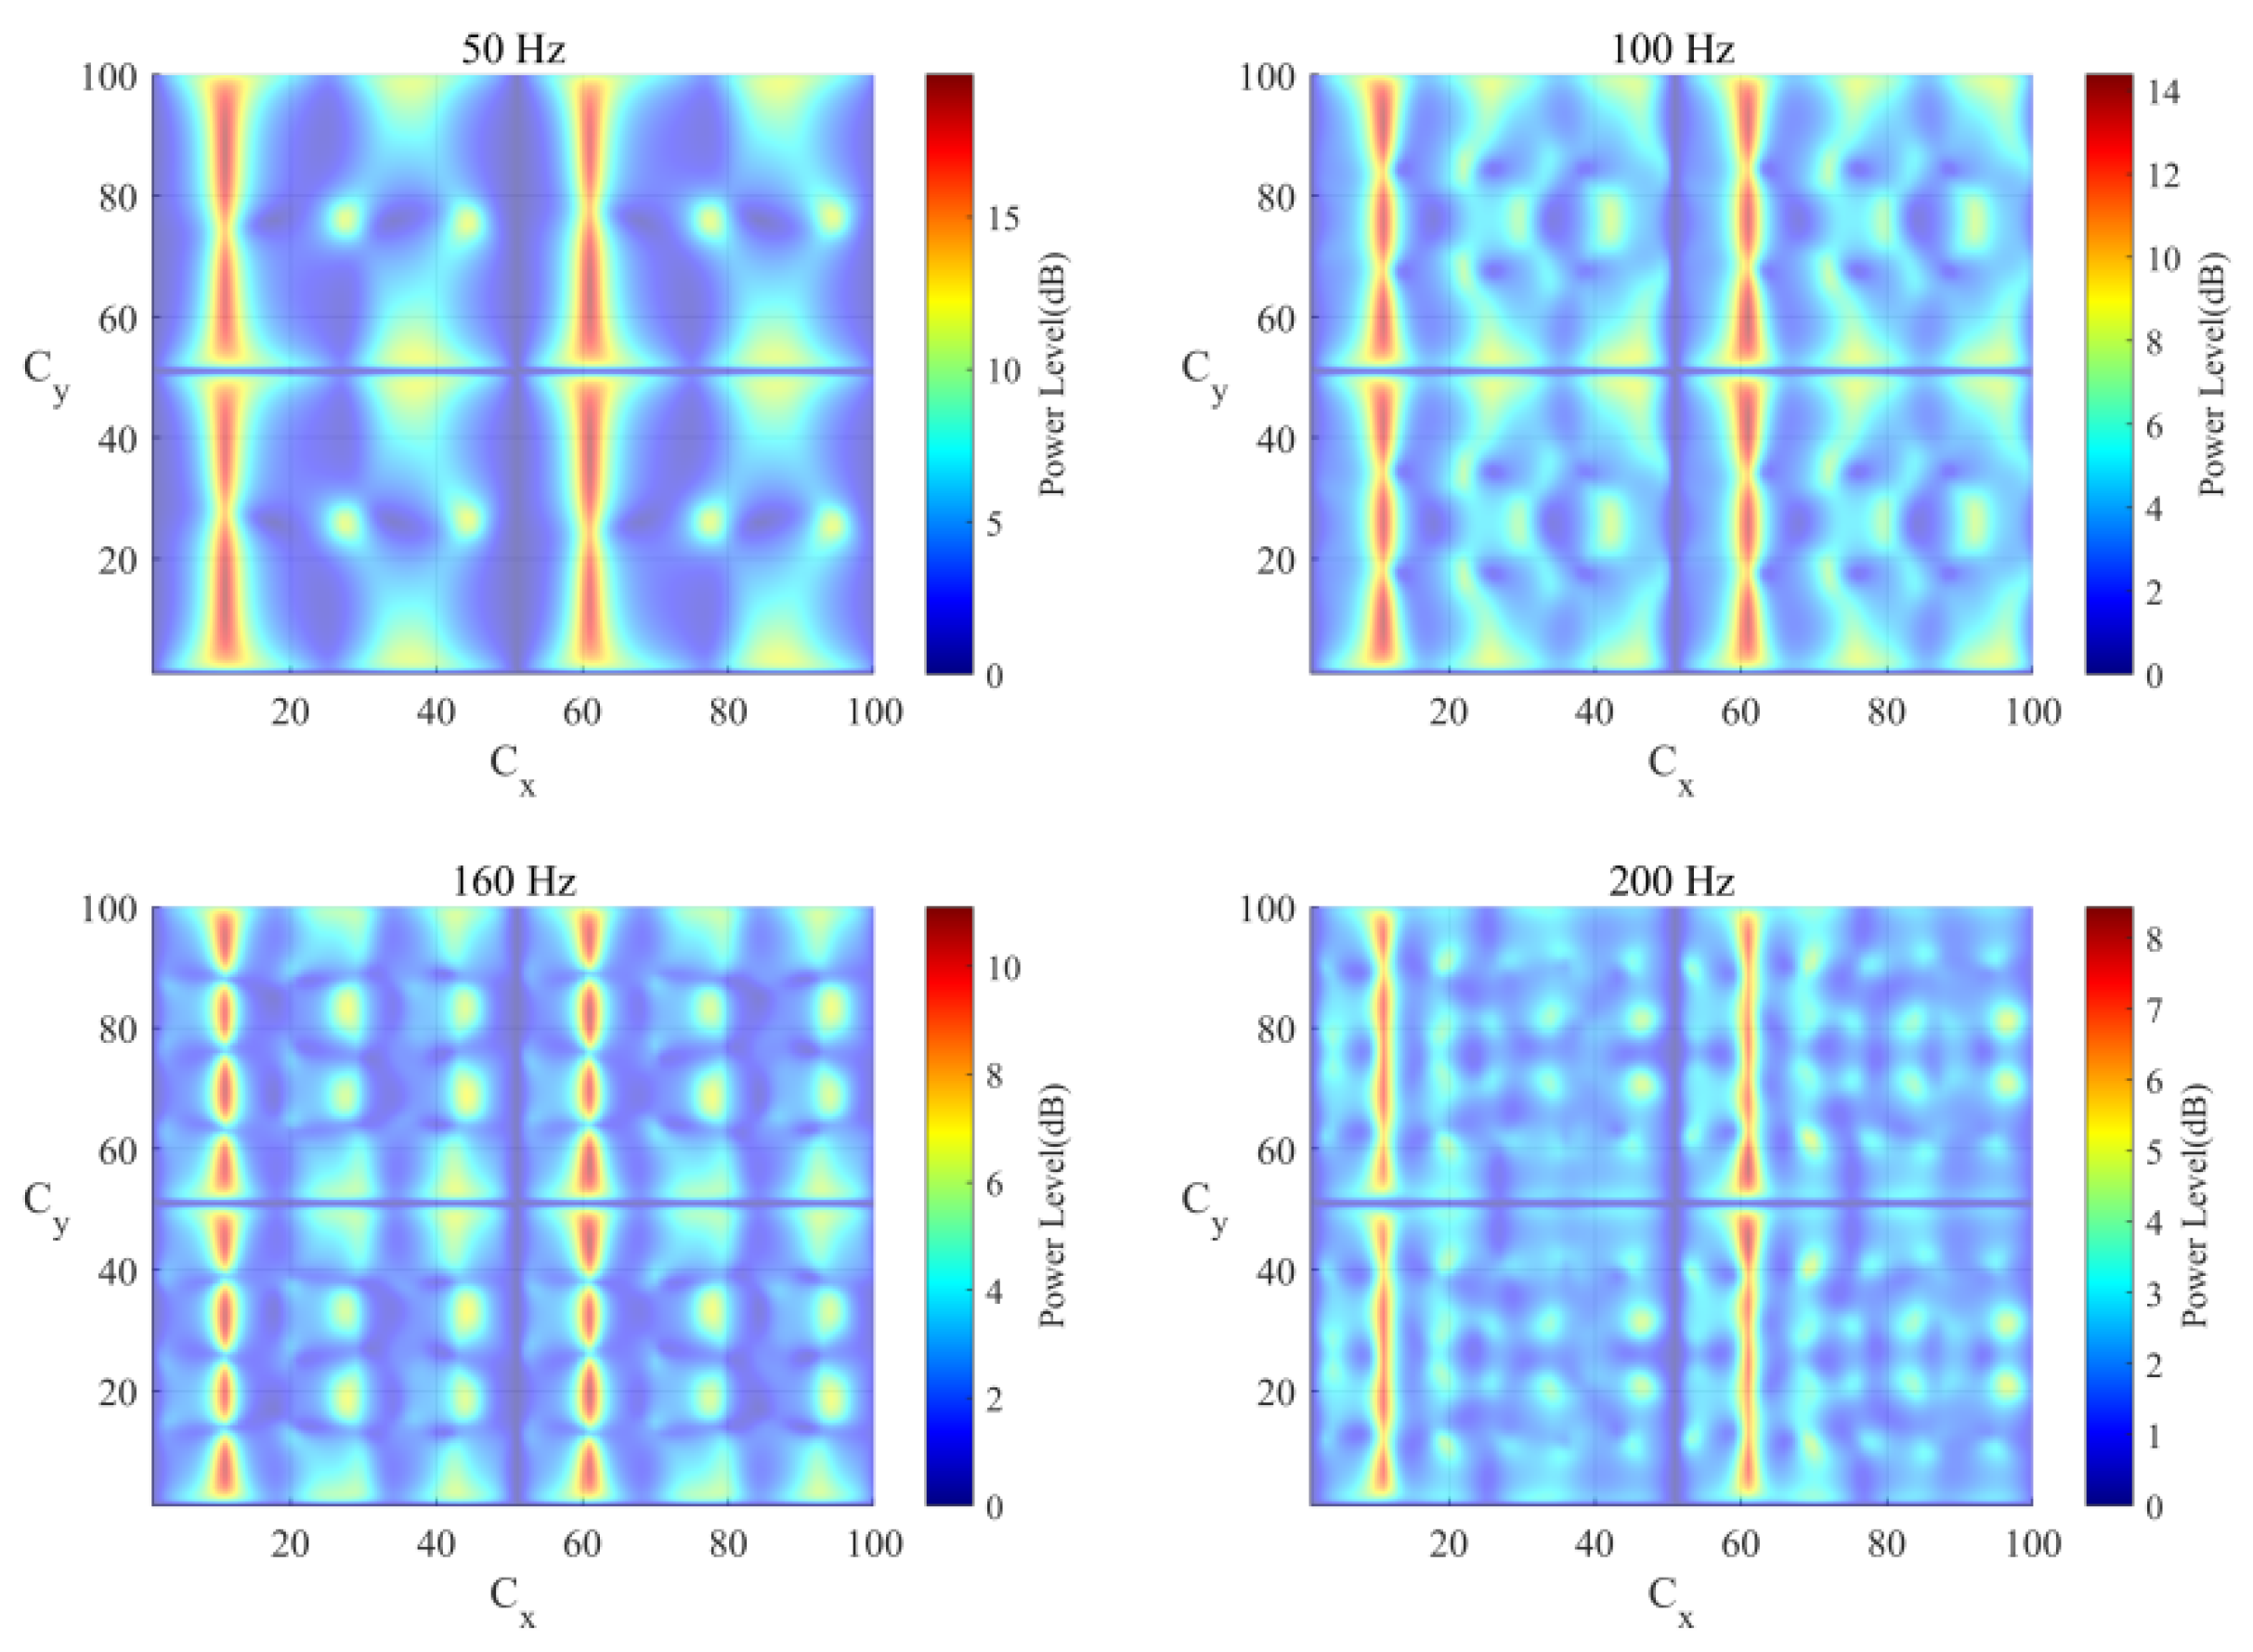
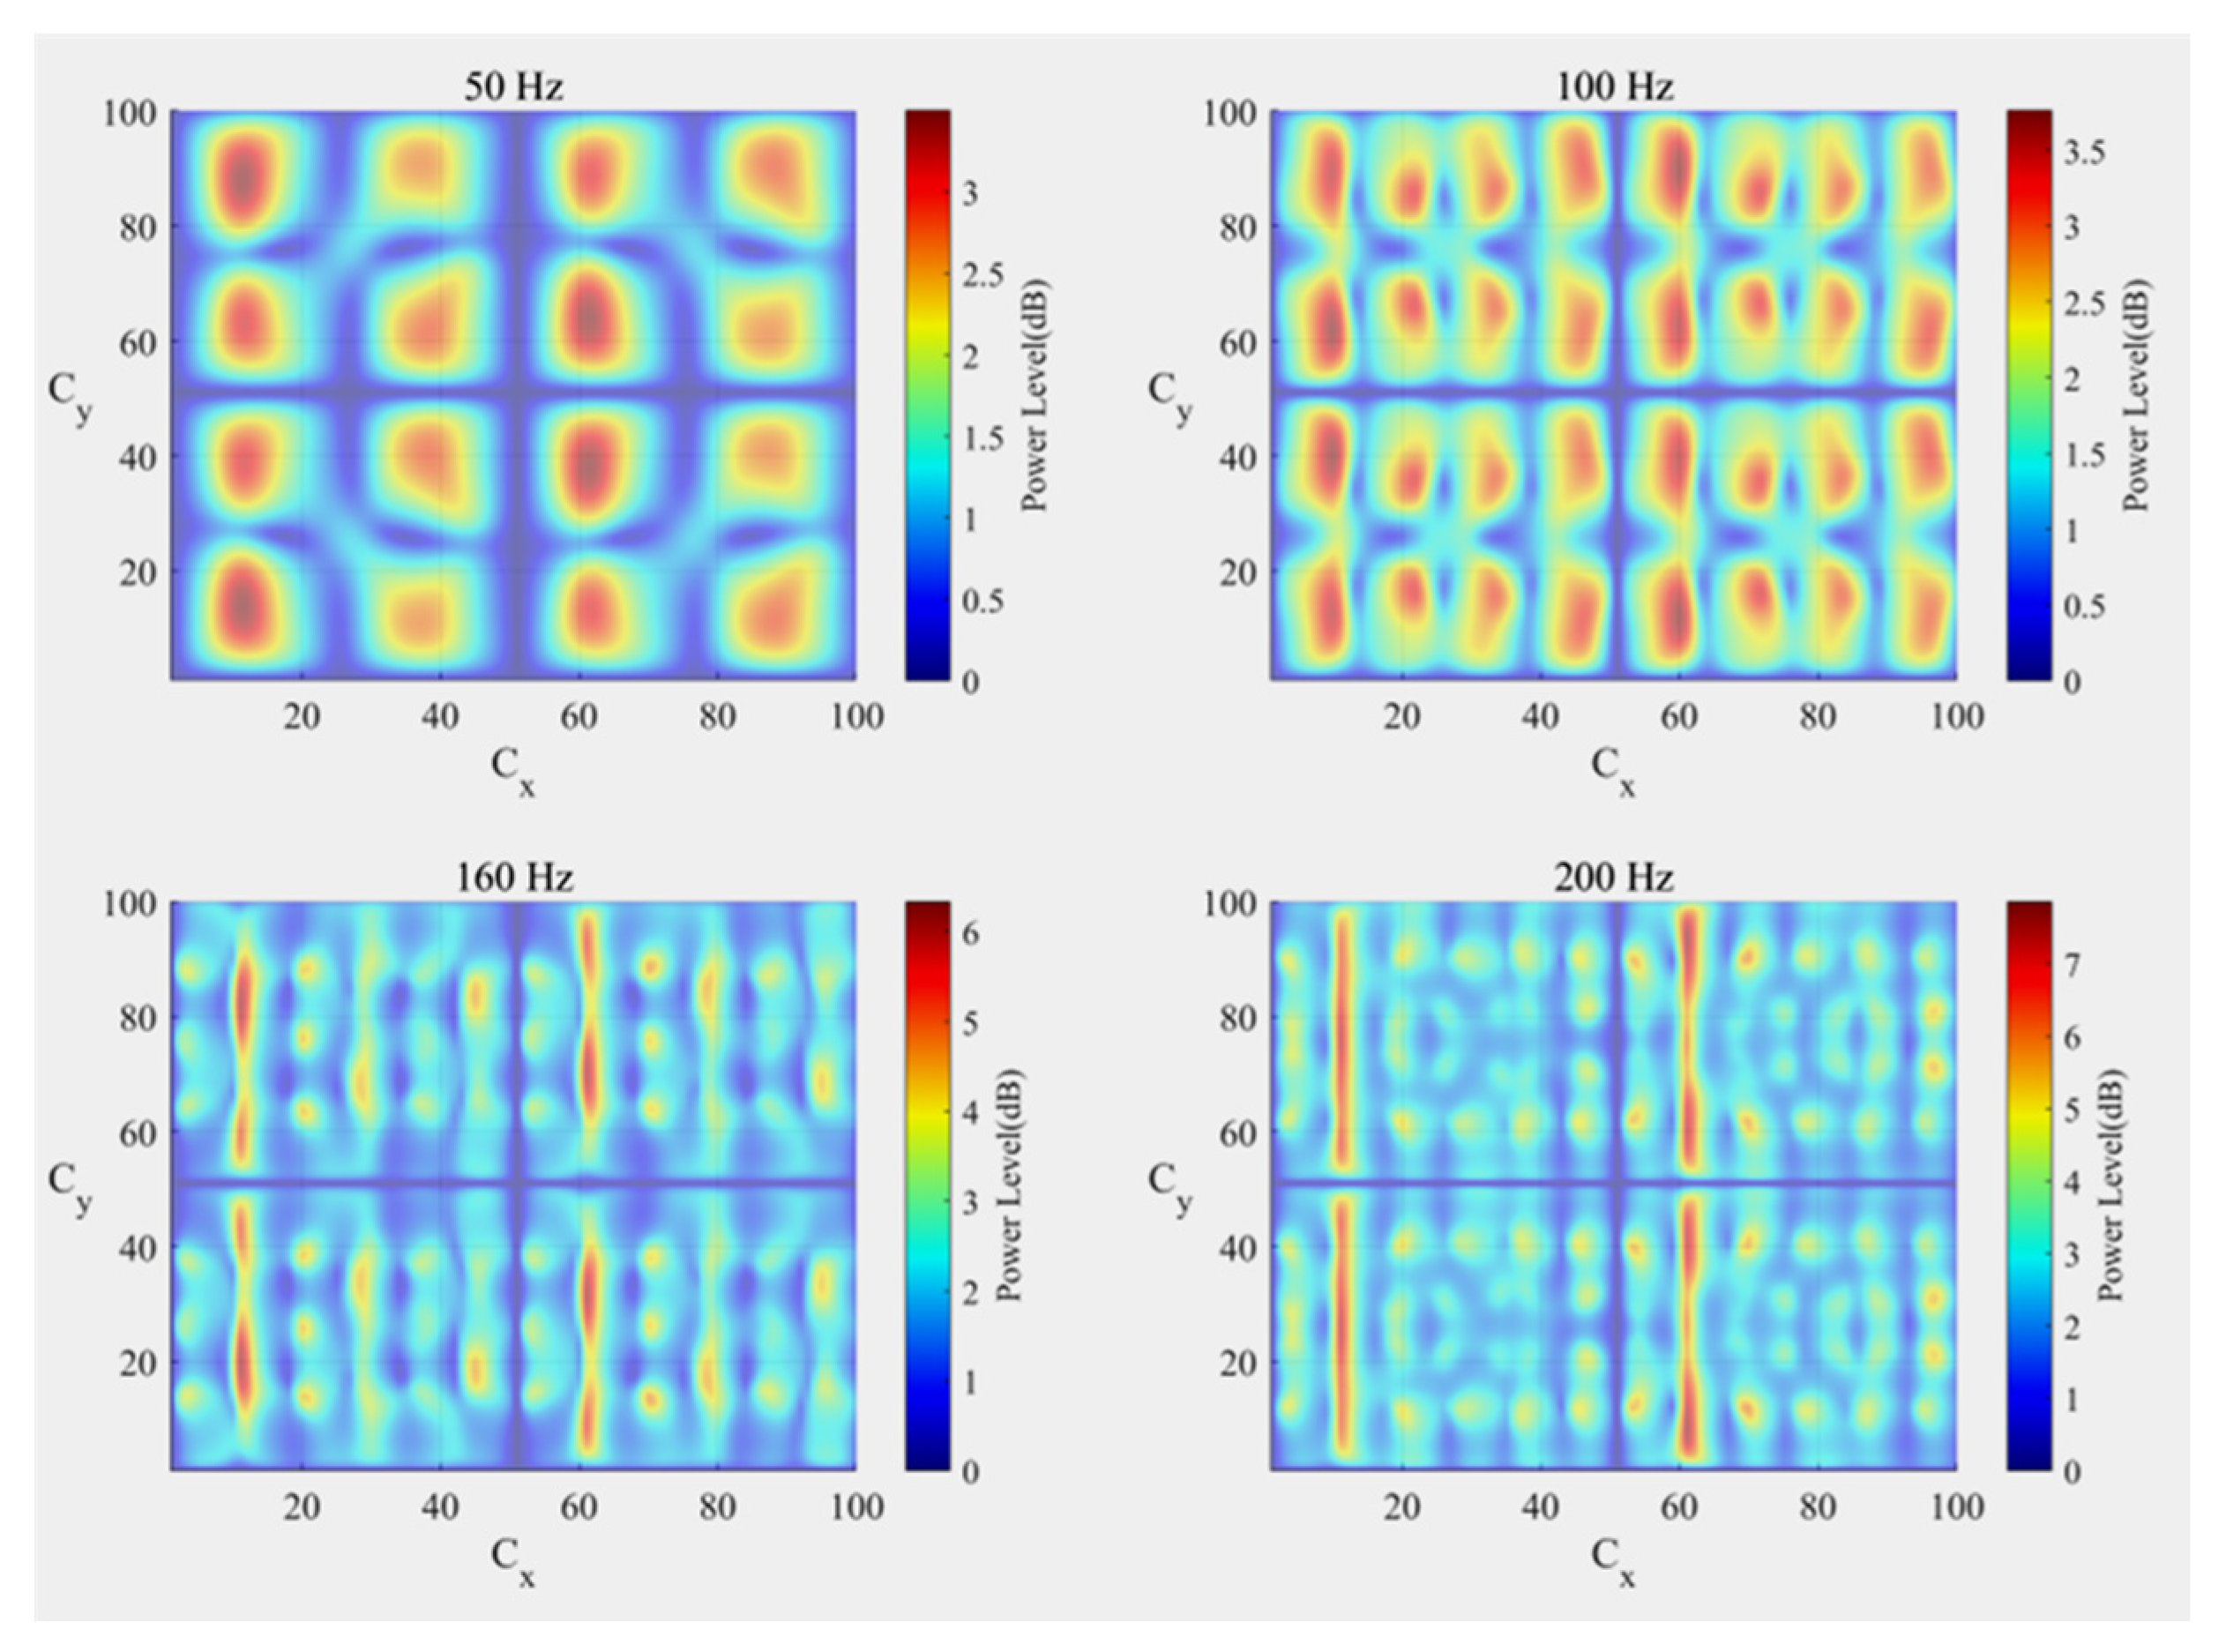
To compare the structure-borne sound power levels Lpc and Lps, their numerical differences were calculated. For the first installation scenario (Case 1), the differences between Lpc and Lps are presented in Figure 8, while Figure 9 presents the corresponding results for the second installation scenario (Case 2). Table 3 lists the range of differences between Lpc and Lps in the 1/3-octave bands centered at 50 Hz, 100 Hz, 160 Hz, and 200 Hz for both installation scenarios.
As shown in Figure 8 and Figure 9, when motor B is installed near the edges or central axes, the differences between structure-borne sound power level Lpc and Lps approach 0 dB. By contrast, the largest differences occur at positions around vertical (Y-axis) coordinates 10 and 60. This explains why these positions in Figure 8 and Figure 9 are optimal for minimizing power levels—their significant structure-borne sound power level differences between Lpc and Lps indicate distinct installation performance.
Table 3 indicates that Lpc values never fall below their corresponding Lps values. Notably, across all 1/3-octave bands, the minimum Lpc values exactly equal those of Lps, while the maximum differences between Lpc and Lps reach up to 19.65 dB.

4. Conclusions, Limitations, and Future Research Directions

4.1. Conclusions

This study investigates the optimal installation positions for two coherent motors, with the core objective of evaluating the total structure-borne sound power transmitted to a simply supported rectangular concrete floor in buildings. By analyzing two distinct installation scenarios (Case 1 and Case 2) and two structure-borne sound power level indices—Lpc (coupled) and Lps (decoupled)—across 1/3-octave bands (50 Hz to 200 Hz), several key conclusions can be drawn:
First, the structure-borne sound power transmission exhibits strong frequency dependence, peaking at 50 Hz and 100 Hz while remaining significantly lower at 160 Hz and 200 Hz. Notably, the difference between the minimum structure-borne sound power (at optimal positions) and the maximum (at worst-case positions) reaches 20.44 dB for Case 2 at 50 Hz. This substantial variation underscores the necessity of position optimization in engineering practice, confirming that strategic motor placement can yield a significant reduction in structure-borne sound power transmission.
Furthermore, the coupling effect between installation points was found to significantly influence the total structure-borne sound power transmission. While coupling does not alter the achievable minimum sound power, it amplifies transmission at non-optimal positions, with the maximum difference between Lpc and Lps reaching 19.65 dB (Case 2 at 50 Hz). These findings clarify the mechanism by which motor interaction influences structure-borne sound power transmission, providing a theoretical foundation for refining multi-motor installation strategies. The physical mechanism is governed by the coherent interference between the two coherent excitation sources: at optimal positions, the excitation forces of the two motors produce destructive interference, which effectively weakens the floor’s modal response and minimizes total excitation. At non-optimal positions, constructive interference superimposes excitation contributions, especially at resonant frequencies, causing significant amplification.
To facilitate the application of the proposed method, using motors as a representative example, the core methodological steps for optimizing the installation positions of coherent building services machines are summarized as follows:
(1) Measure the free velocity and source mobility of the machines;
(2) Simulate the transfer mobility of the supporting floor structure;
(3) Calculate the structure-borne sound power transmitted from the machines to the floor based on the measured and simulated data;
(4) Evaluate the transmitted sound power for different installation positions and comprehensively identify the optimal configuration that minimizes the total transmitted structure-borne sound power.
In summary, this research validates the feasibility of reducing structure-borne sound power transmission through spatial optimization and quantifies the regulatory role of coupling effects. The results offer practical technical guidance for the layout of coherent vibration sources on floor structures, contributing to the low-noise design of mechanical systems in buildings.

4.2. Limitations

First, in the current calculation model, the loss factor η of the concrete floor is set to a constant value of 0.03 across the analysis frequency band, without considering the inherent frequency dependence of floor loss factors in actual building structures. As stated in Section 2.3, complex modeling of this frequency dependency is beyond the scope of this paper, which focuses on the quantitative analysis of coupling effects between installation points. This simplification may introduce minor deviations in prediction accuracy near structural resonant frequencies, but it does not affect the validity of the core optimization method.
Second, this work is based on an idealized simply supported rectangular concrete floor model. In actual engineering scenarios, in situ floor structures usually exhibit more diverse and complex boundary conditions and structural forms, which are not fully covered in the current research framework.
Finally, the analysis in this work is limited to the 50 Hz to 200 Hz 1/3-octave bands, which represent the dominant frequency range of structure-borne sound transmission from building services equipment. The structure-borne sound transmission characteristics, the behavior of coupling effects, and spatial optimization strategies in higher frequency bands are not discussed in the paper.

4.3. Future Research Directions

To address the aforementioned limitations, the following targeted research directions are proposed for subsequent work to improve the robustness and engineering applicability of the methodology:
First, a refined calculation model incorporating an experimentally calibrated, frequency-dependent loss factor of the floor will be established to further improve the prediction accuracy of structure-borne sound power transmission while retaining the core optimization framework of this study.
Second, the research scope will be extended to floor structures with realistic in situ boundary conditions and complex structural forms to verify the universality of the proposed optimization method in more diverse engineering scenarios.
Third, the analysis frequency band will be expanded to the full frequency range relevant to building acoustic design to form a full-band design guideline for engineering practice.
These efforts will further consolidate the theoretical foundation of this work and broaden the applicability of the proposed method to practical acoustic and vibration engineering challenges.

Author Contributions

Conceptualization, Z.W. and C.M.M.; methodology, Z.W. and C.M.M.; software, Z.W.; validation, Z.W.; formal analysis, Z.W.; investigation, Z.W.; resources, C.M.M.; data curation, Z.W.; writing—original draft preparation, Z.W.; writing—review and editing, Z.W. and C.M.M.; visualization, Z.W.; supervision, C.M.M.; project administration, C.M.M. All authors have read and agreed to the published version of the manuscript.

Funding

This research received no external funding.

Data Availability Statement

The data that support the findings of this study are available from the corresponding author upon reasonable request. The data are not publicly available due to privacy restrictions and potential commercialization.

Conflicts of Interest

The authors declared no potential conflicts of interest with respect to the research, authorship, and/or publication of this article.

References

  1. Vogel, A.; Arnold, J.; Voelker, C.; Kornadt, O. Applicability of the Structure-borne Sound Source Characterisation Two-Stage Method as well as the Parameters Derived in Sound Pressure Level Predictions in Lightweight Constructions. Appl. Acoust. 2023, 205, 109242. [Google Scholar] [CrossRef]
  2. Broner, N. The Effects of Low Frequency Noise on People—A Review. J. Sound Vib. 1978, 58, 483–500. [Google Scholar] [CrossRef]
  3. Ou, D.Y.; Mak, C.M. A Review of Prediction Methods for the Transient Vibration and Sound Radiation of Plates. J. Low Freq. Noise Vib. Act. Control 2013, 32, 309–322. [Google Scholar] [CrossRef]
  4. Ou, D.Y. Low Frequency Sound Insulation Analysis and Evaluation of Stiffened Building Structures. Build. Environ. 2015, 94, 802–809. [Google Scholar] [CrossRef]
  5. Al Horr, Y.; Arif, M.; Kaushik, A.; Mazroei, A.; Katafygiotou, M.; Elsarrag, E. Occupant Productivity and Office Indoor Environment Quality: A Review of the Literature. Build. Environ. 2016, 105, 369–389. [Google Scholar] [CrossRef]
  6. Hongisto, V.; Varjo, J.; Leppämäki, H.; Oliva, D.; Hyönä, J. Work Performance in Private Office Rooms: The Effects of Sound Insulation and Sound Masking. Build. Environ. 2016, 104, 263–274. [Google Scholar] [CrossRef]
  7. Zhang, L.; Wang, Y.; Liu, H.; Chen, X. Experimental Investigation of Train-Induced Vibration Transmission to the High-Rise Building During Different Train Operations. J. Struct. Eng. 2023, 149, 04023025. [Google Scholar]
  8. Ouis, D.; Hassanain, M.A.; Alshibani, A.; Ghaithan, A.M. Noise from Heating, Ventilation, and Air Conditioning (HVAC) Systems: A Review of Its Characteristics, Effects and Control. J. Build. Eng. 2025, 112, 113770. [Google Scholar] [CrossRef]
  9. Bergamo, E.; Fasan, M.; Bedon, C. Efficiency of Coupled Experimental–Numerical Predictive Analyses for Inter-Story Floors Under Non-Isolated Machine-Induced Vibrations. Actuators 2020, 9, 87. [Google Scholar] [CrossRef]
  10. Huang, X.H.; Wang, Y.Y.; Sheng, L. Synchrophasing control in a multi-propeller driven aircraft. In Proceedings of the 2015 American Control Conference (ACC), Chicago, IL, USA, 1–3 July 2015; IEEE: Piscataway, NJ, USA, 2015; pp. 1836–1841. [Google Scholar]
  11. Valente, V.T.; Greenwood, E.; Johnson, E.N. Multirotor noise control using synchrophasing under nonstationary conditions. J. Sound Vib. 2026, 629, 119673. [Google Scholar] [CrossRef]
  12. Dench, M.R.; Brennan, M.J.; Ferguson, N.S. On the control of vibrations using synchrophasing. J. Sound Vib. 2013, 332, 4842–4855. [Google Scholar] [CrossRef]
  13. Yang, T.J.; Huang, D.; Li, X.H.; Brennan, M.J.; Zhou, L.B.; Zhu, M.G.; Liu, Z.G. Vibration Control of a Floating Raft System by Synchrophasing of Electrical Machines: An Experimental Study. J. Vib. Acoust. 2018, 140, 041005. [Google Scholar] [CrossRef]
  14. Yang, T.J.; Wu, L.; Li, X.H.; Liu, Z.G.; Brennan, M.J. Combining active control and synchrophasing for vibration isolation of a floating raft system: An experimental demonstration. J. Low Freq. Noise Vib. Act. Control 2021, 40, 1105–1114. [Google Scholar] [CrossRef]
  15. Olhoff, N.; Niu, B. Minimizing the vibrational response of a lightweight building by topology and volume optimization of a base plate for excitatory machinery. Struct. Multidiscip. Optim. 2016, 53, 567–588. [Google Scholar] [CrossRef]
  16. Zhou, P.Z.; Du, J.B.; Lü, Z.H. Hybrid optimization of a vibration isolation system considering layout of structure and locations of components. Struct. Multidiscip. Optim. 2018, 57, 1–15. [Google Scholar] [CrossRef]
  17. Kruse, T.; Schöpfer, F.; Mayr, A.; Schmidt, T.; Hanz, T. Building Service Equipment—From Source Characterization and Prediction to Validation in Buildings. In Proceedings of the 49th Annual Conference on Acoustics (DAGA 2025), Copenhagen, Denmark, 17–20 March 2025; Deutsche Arbeitsgemeinschaft für Akustik: Berlin, Germany, 2025; p. 161. [Google Scholar]
  18. Vastiau, J.; Van Hoorickx, C.; Reynders, E.P.B. Transfer Matrix Approaches for the Prediction of Impact Sound Radiation from Layered Floors. J. Sound Vib. 2024, 569, 117992. [Google Scholar] [CrossRef]
  19. Reynders, E.P.B.; Wang, P.C.; Van Hoorickx, C.; Lombaert, G. Prediction and Uncertainty Quantification of Structure-Borne Sound Radiation into a Diffuse Field. J. Sound Vib. 2019, 463, 114984. [Google Scholar] [CrossRef]
  20. Ma, K.W.; Mak, C.M.; Wong, H.M. Development of a Sound Quality Model for Noise Impact Prediction in Building Acoustics. J. Build. Eng. 2025, 111, 113183. [Google Scholar] [CrossRef]
  21. Kim, J.; Jung, D.; Jeon, K.; Ahn, Y.; Kim, W.; Kow, N. Physics-Regularized Deep Learning Framework for Floor Impact Sound Prediction in Residential Buildings: A Civil Engineering Approach. Results Eng. 2026, 29, 103737. [Google Scholar] [CrossRef]
  22. Mak, C.M.; Su, J.X. A Study of the Effect of Floor Mobility on Isolation Efficiency of Vibration Isolators. J. Low Freq. Noise Vib. Act. Control 2001, 20, 1–13. [Google Scholar] [CrossRef]
  23. Mak, C.M.; Su, J.X. A Study of the Effect of Floor Mobility on Structure-Borne Sound Power Transmission. Build. Environ. 2012, 47, 443–455. [Google Scholar] [CrossRef]
  24. Wu, W.W.; Yin, X.W.; Li, H.; Zhong, K. Power Flow Analysis of Built-Up Plate Structures Using the Dynamic Stiffness Method. J. Vib. Control 2018, 24, 2815–2831. [Google Scholar] [CrossRef]
  25. Mak, C.M.; Yun, Y. A Study of Power Transmissibility for the Vibration Isolation of Coherent Vibratory Machines on the Floor of a Building. Appl. Acoust. 2010, 71, 368–372. [Google Scholar] [CrossRef]
  26. Yun, Y.; Mak, C.M. Power Transmission from Two Coherent Machines to a Dual-Layer Coupling Floor Structure. J. Vib. Control 2011, 17, 711–720. [Google Scholar] [CrossRef]
  27. Zu, F.; Mak, C.M. Estimation of Best Mounting Positions for Vibratory Equipment in Buildings. J. Vib. Control 2011, 17, 301–310. [Google Scholar]
  28. Sun, H.L.; Zhang, K.; Zhang, P.Q.; Chen, H.B. Application of Dynamic Vibration Absorbers in Floating Raft System. Appl. Acoust. 2010, 71, 250–257. [Google Scholar] [CrossRef]
  29. Fahy, F.J.; Gardonio, P. Sound and Structural Vibration: Radiation, Transmission and Response, 2nd ed.; Academic Press: London, UK, 2007; pp. 1–73. [Google Scholar]
  30. Xiong, Y.P.; Xing, J.T.; Price, W.G. Power Flow Analysis of Complex Coupled Systems by Progressive Approaches. J. Sound Vib. 2001, 239, 275–295. [Google Scholar] [CrossRef]
  31. Song, Y.; Wen, J.; Yu, D.; Wen, X. Suppression of Vibration and Noise Radiation in a Flexible Floating Raft System Using Periodic Structures. J. Vib. Control 2015, 21, 217–228. [Google Scholar] [CrossRef]
  32. Nilsson, A.; Liu, B. Vibro-Acoustics, 2nd ed.; Springer: Heidelberg, Germany, 2015; pp. 301–362. [Google Scholar]
  33. ISO 7626-1:2011; Mechanical Vibration and Shock—Experimental Determination of Mechanical Mobility—Part 1: Basic Terms and Definitions and Transducer Specifications. International Organization for Standardization: Geneva, Switzerland, 2011.
  34. ISO 7626-5:1994; Mechanical Vibration and Shock—Experimental Determination of Mechanical Mobility—Part 5: Measurements Using Impact Excitation with an Exciter Which Is Not Attached to the Structure. International Organization for Standardization: Geneva, Switzerland, 1994.
  35. Heo, Y.; Kim, K.J. Characterization of a Water Pump for Drum-Type Washing Machine by Vibration Power Approach. Mech. Syst. Signal Process. 2015, 54–55, 367–376. [Google Scholar] [CrossRef]
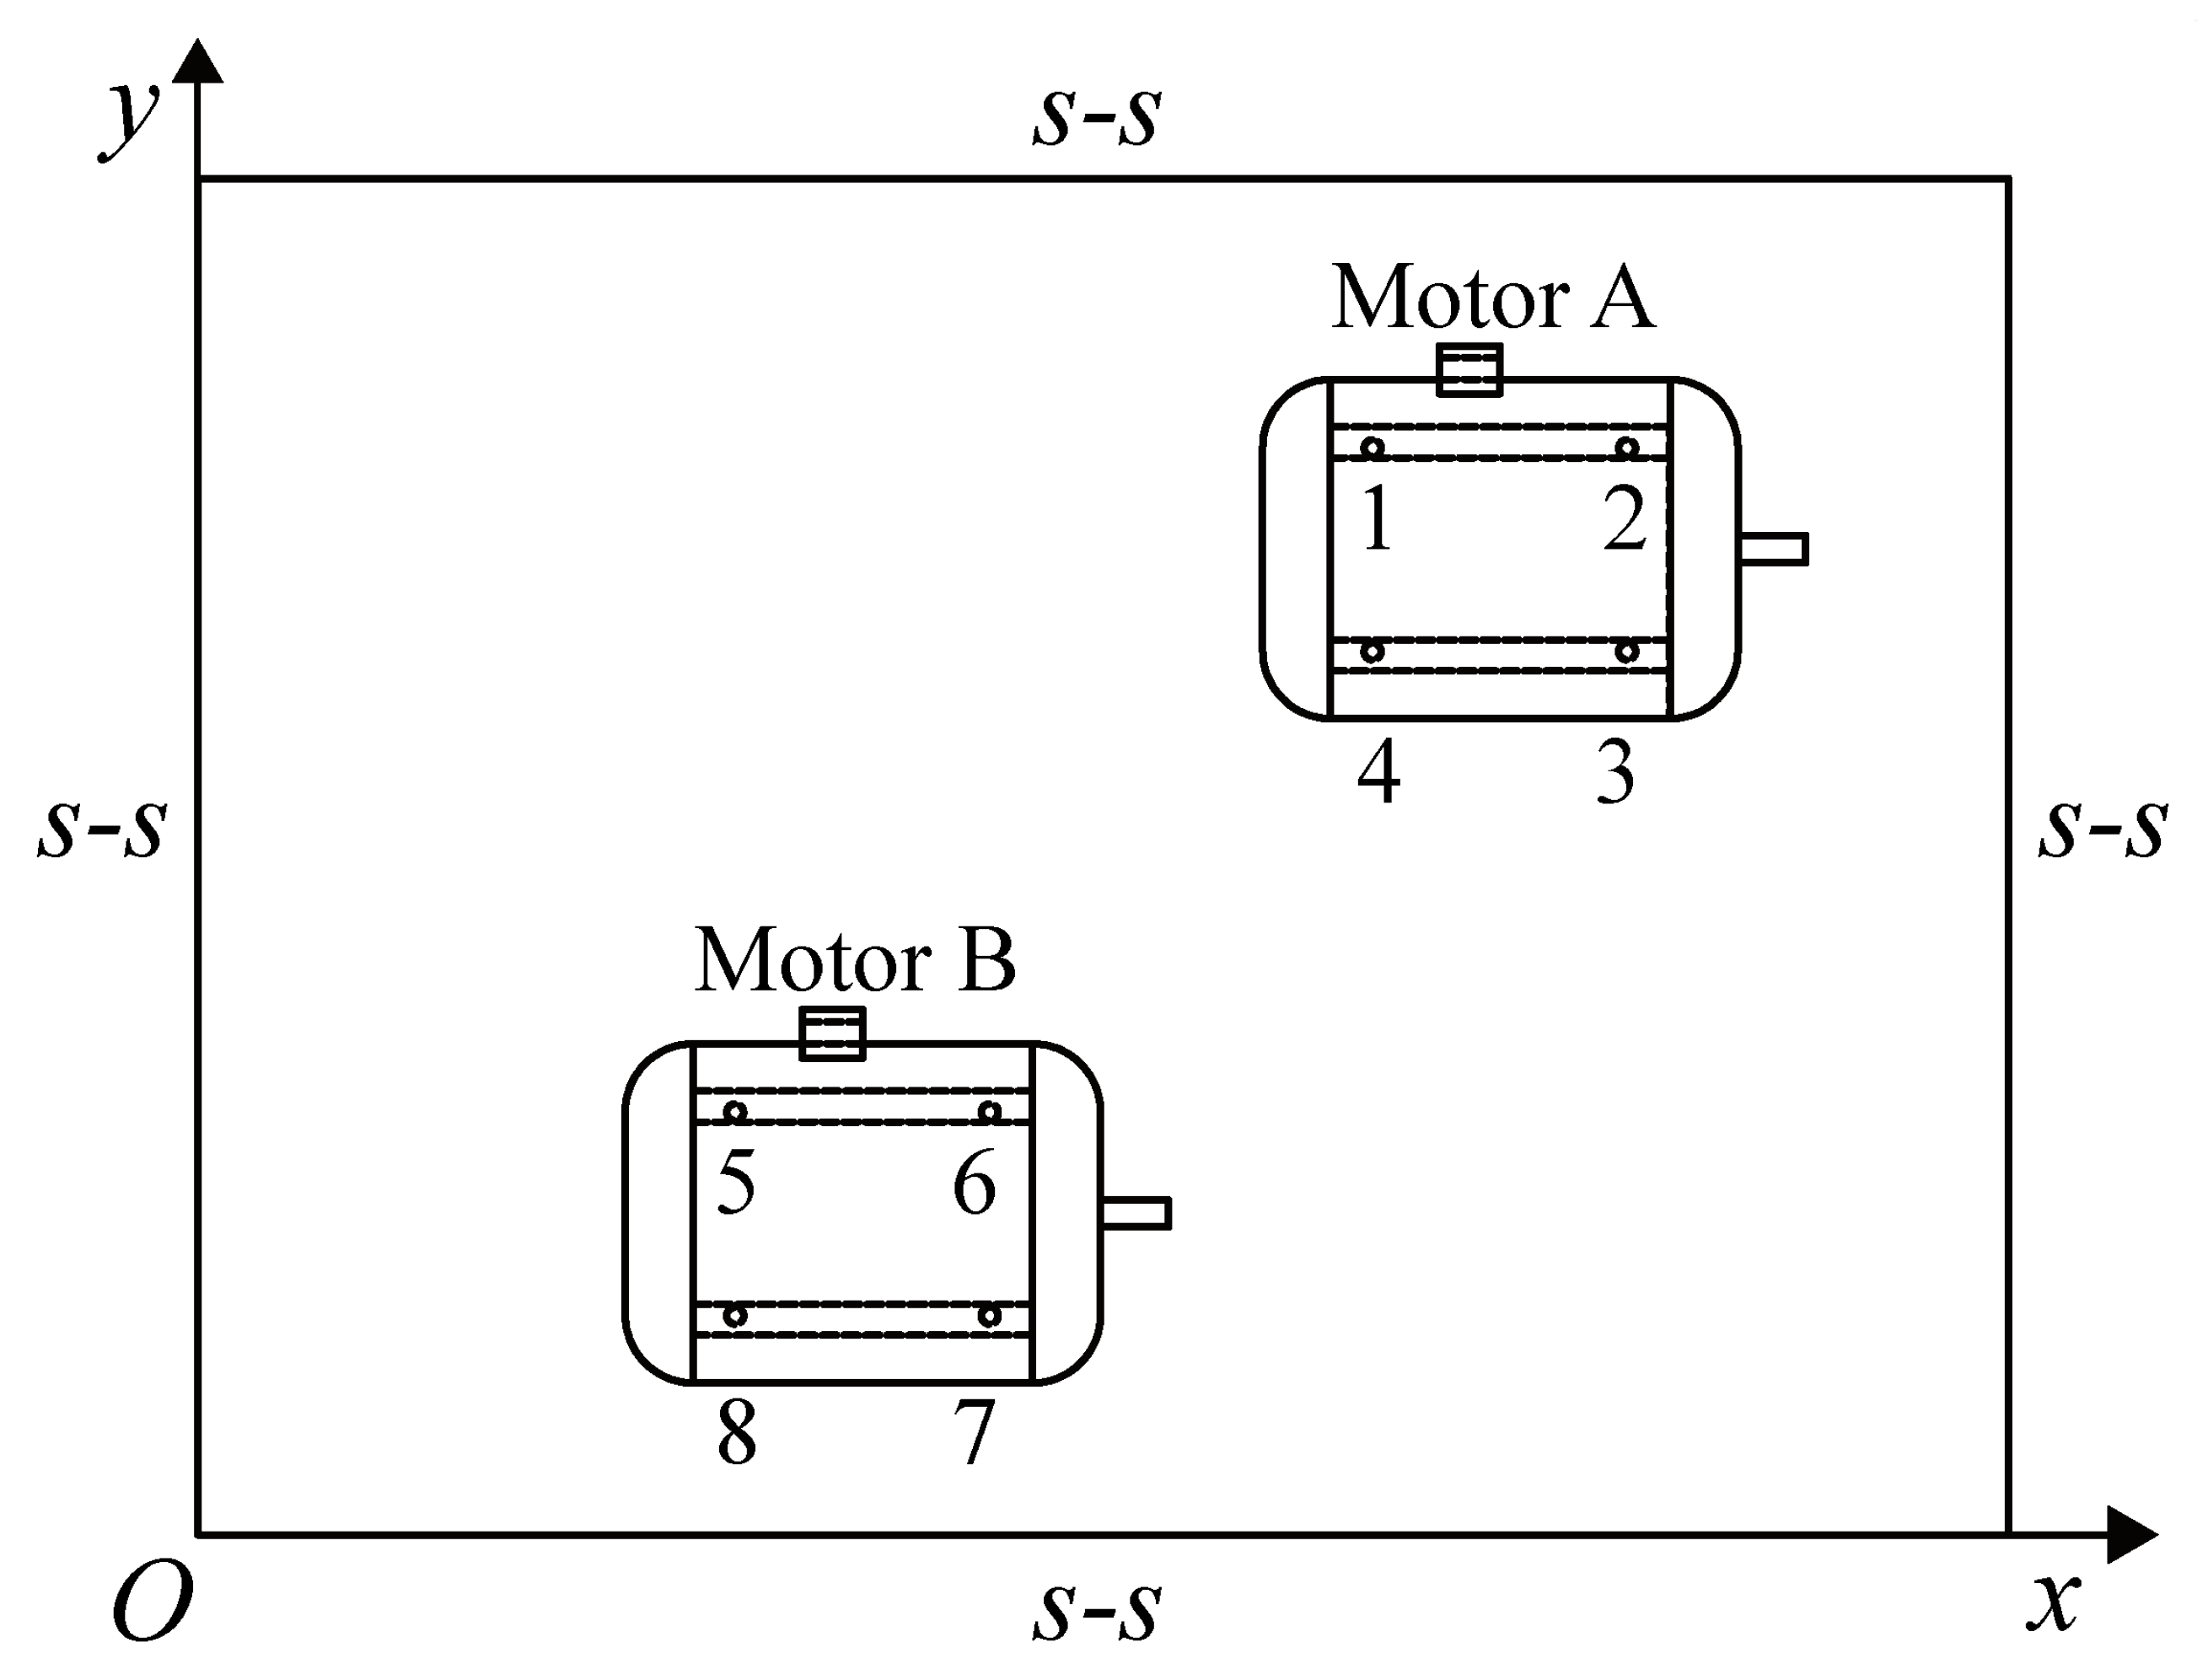
Figure 1. Schematic of the floor with two coherent motors installed (S-S denotes simply supported).
Buildings 16 01176 g001
Figure 2. Measured frequency-domain dynamic properties at the four mounting points of a single-phase motor: (a) velocity levels; (b) point mobility magnitudes.
Buildings 16 01176 g002
Figure 3. Schematic diagram showing the floor uniformly discretized into a 100 × 100 mesh of elements.
Buildings 16 01176 g003
Figure 4. Structure-borne sound power level (Lpc) in 1/3-octave bands centered at 50 Hz, 100 Hz, 160 Hz, and 200 Hz for the first installation scenario (Case 1).
Buildings 16 01176 g004
Figure 5. Structure-borne sound power level (Lpc) in 1/3-octave bands centered at 50 Hz, 100 Hz, 160 Hz, and 200 Hz for the second installation scenario (Case 2).
Buildings 16 01176 g005
Figure 6. Structure-borne sound power level (Lps) in 1/3-octave bands centered at 50 Hz, 100 Hz, 160 Hz, and 200 Hz for the first installation scenario (Case 1).
Buildings 16 01176 g006
Figure 7. Structure-borne sound power level (Lps) in 1/3-octave bands centered at 50 Hz, 100 Hz, 160 Hz, and 200 Hz for the second installation scenario (Case 2).
Buildings 16 01176 g007
Figure 8. Differences between structure-borne sound power level Lpc and Lps in 1/3-octave bands centered at 50 Hz, 100 Hz, 160 Hz, and 200 Hz for the first installation scenario (Case 1).
Buildings 16 01176 g008
Figure 9. Differences between structure-borne sound power level Lpc and Lps in 1/3-octave bands centered at 50 Hz, 100 Hz, 160 Hz, and 200 Hz for the second installation scenario (Case 2).
Buildings 16 01176 g009
Table 1. Maxima, minima, and ranges of structure-borne sound power level (Lpc) in 1/3-octave bands centered at 50 Hz, 100 Hz, 160 Hz, and 200 Hz for both scenarios.
Case 1Case 2
Max (dB)Min (dB)Range (dB)Max (dB)Min (dB)Range (dB)
50 Hz99.7895.494.2998.9178.4620.44
100 Hz106.44100.835.60105.6289.5916.03
160 Hz54.4343.7210.7154.6341.0713.56
200 Hz57.8946.6711.2257.2344.9212.31
Table 2. Maxima, minima, and ranges of structure-borne sound power level (Lps) in 1/3-octave bands centered at 50 Hz, 100 Hz, 160 Hz, and 200 Hz for both scenarios.
Case 1Case 2
Max (dB)Min (dB)Range (dB)Max (dB)Min (dB)Range (dB)
50 Hz98.5095.493.0196.2078.4617.74
100 Hz104.28100.833.45102.1589.5912.56
160 Hz52.0343.728.3151.6941.0710.62
200 Hz55.0546.678.3854.8044.929.88
Table 3. Ranges of differences between structure-borne sound power level Lpc and Lps in 1/3-octave bands centered at 50 Hz, 100 Hz, 160 Hz, and 200 Hz for both installation scenarios.
Case 1Case 2
Max (dB)Min (dB)Max (dB)Min (dB)
50 Hz3.50019.650
100 Hz3.76014.370
160 Hz6.33011.100
200 Hz7.8608.430
Disclaimer/Publisher’s Note: The statements, opinions and data contained in all publications are solely those of the individual author(s) and contributor(s) and not of MDPI and/or the editor(s). MDPI and/or the editor(s) disclaim responsibility for any injury to people or property resulting from any ideas, methods, instructions or products referred to in the content.