1. Introduction
Fortunately, unlike other cultural products that are rapidly changing in our constantly evolving global society, residential construction tends to change more slowly, which is why numerous historic residential buildings have been preserved [
1]. Contemporary houses in central Thailand express enduring and changeable characteristics that reflect the daily lives of their inhabitants and their cultural interpretations [
2]. Within the limits of the building materials available at the time, they are often perfectly adapted to the climatic conditions while embodying the prevailing social and cultural values.
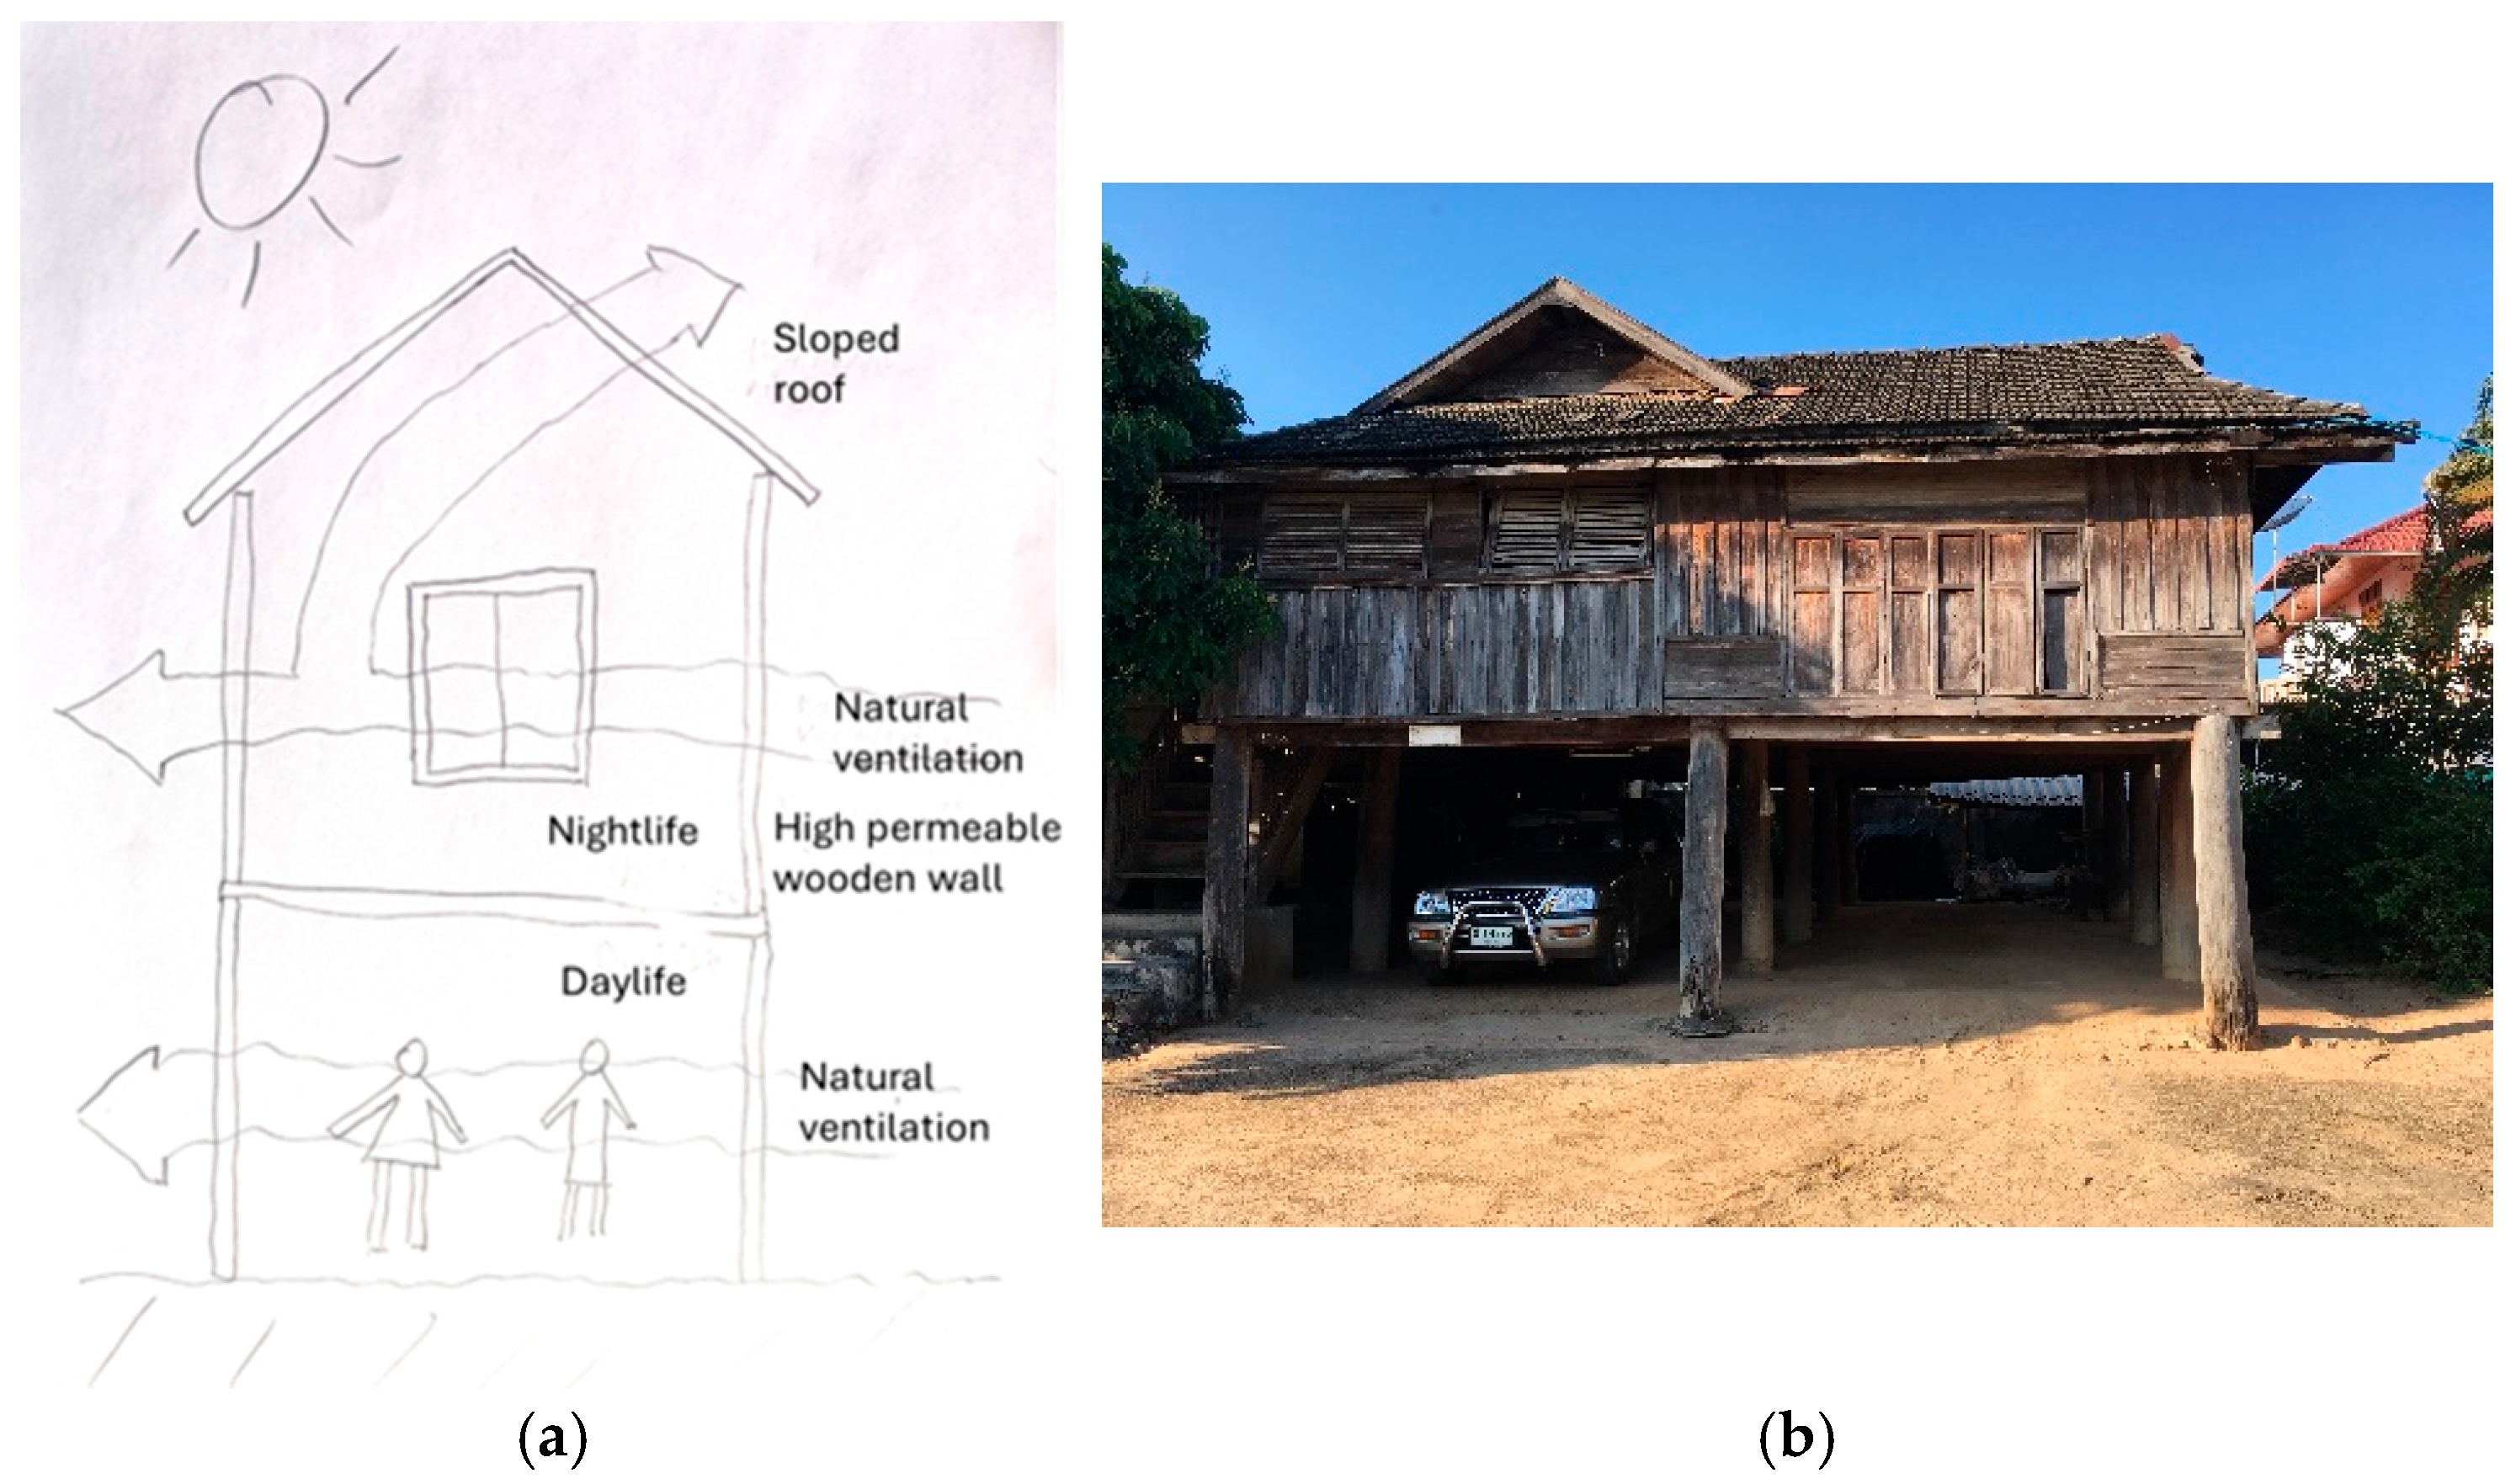
Traditional Thai wooden houses are characterized by an open construction style and high air permeability (
Figure 1). From a building physics perspective, this passive method avoids overheating. Open joints and openings allow natural ventilation of the room, enabling warm air to escape easily and cool air to flow in. This natural air circulation can effectively protect buildings from overheating. “Most of the structure is made of teak wood or strong, laminated local wood. The roof is usually more modern; made of prefabricated tiles whose bright colors indicate modernity and the owner’s social status” [
3]. However, studies conducted in 2019 showed that the utility value that residents of Chiang Mai attribute to traditional wooden residential buildings is affected by the unsatisfactory indoor comfort provided by these buildings. This is because of inhabitants’ significantly increased comfort demands in a satisfactory indoor climate. On the other hand, the boundary conditions for this concept, which is well adapted to humid–hot climates, are altered due to climate change, severe air pollution during the haze season (burning season), and changes in the local microclimate. Low comfort leads to the increased use of electric air conditioning, resulting in enormous energy consumption and the formation of urban heat islands. To preserve the heritage of traditional wooden houses, it is necessary to find alternative solutions that allow preserving the historical character of these houses while simultaneously improving their comfort and energy efficiency. It will also be important in the future to significantly reduce the consumption of non-renewable resources and CO
2 emissions from rural homes [
4].
As part of a master’s thesis (Klingler [
6]), the results of which are summarized in Krus et al. [
7], various renovation measures, including the installation of Typha boards, were investigated and evaluated for their effectiveness. The installation of internal insulation allows for improving the thermal insulation and energy efficiency of houses without altering the external appearance and character of historical buildings, while also reducing leaks, thus contributing to improved indoor air quality. By insulating only single rooms, which also feature indoor cooling via HVAC, cold zones can be created without interfering with the entire building. Thus, the original appearance of the Thai House was also respected.
To validate the results obtained from initial computational investigations through practical tests, a demo and experimental building was constructed on the campus of King Mongkut’s University Ladkrabang (KMITL) in Bangkok and equipped with measuring sensors. The measurements serve both to compare the two rooms and for use in the hygrothermal calculations as boundary conditions and validation. The hygro-thermal behavior of this experimental building was simulated using the hygrothermal room model WUFI
®-Plus and compared with the measurement results. Following this simulation, various renovation options have been examined (Akay [
8]).
The aim of this work is, on the one hand, to attempt to solve the frequently occurring problem of missing measurement data by determining the unknown variables approximately through iterative adjustment and comparison of the simulation results with the measured data. This applies in particular to missing measurements of infiltration air exchange. On the other hand, subsequent hygrothermal simulations are used to comparatively evaluate the energy saving potential of different measures.
2. Materials & Methods
2.1. Typha as a Raw Material for the Development of Magnesium-Bonded Typha Board
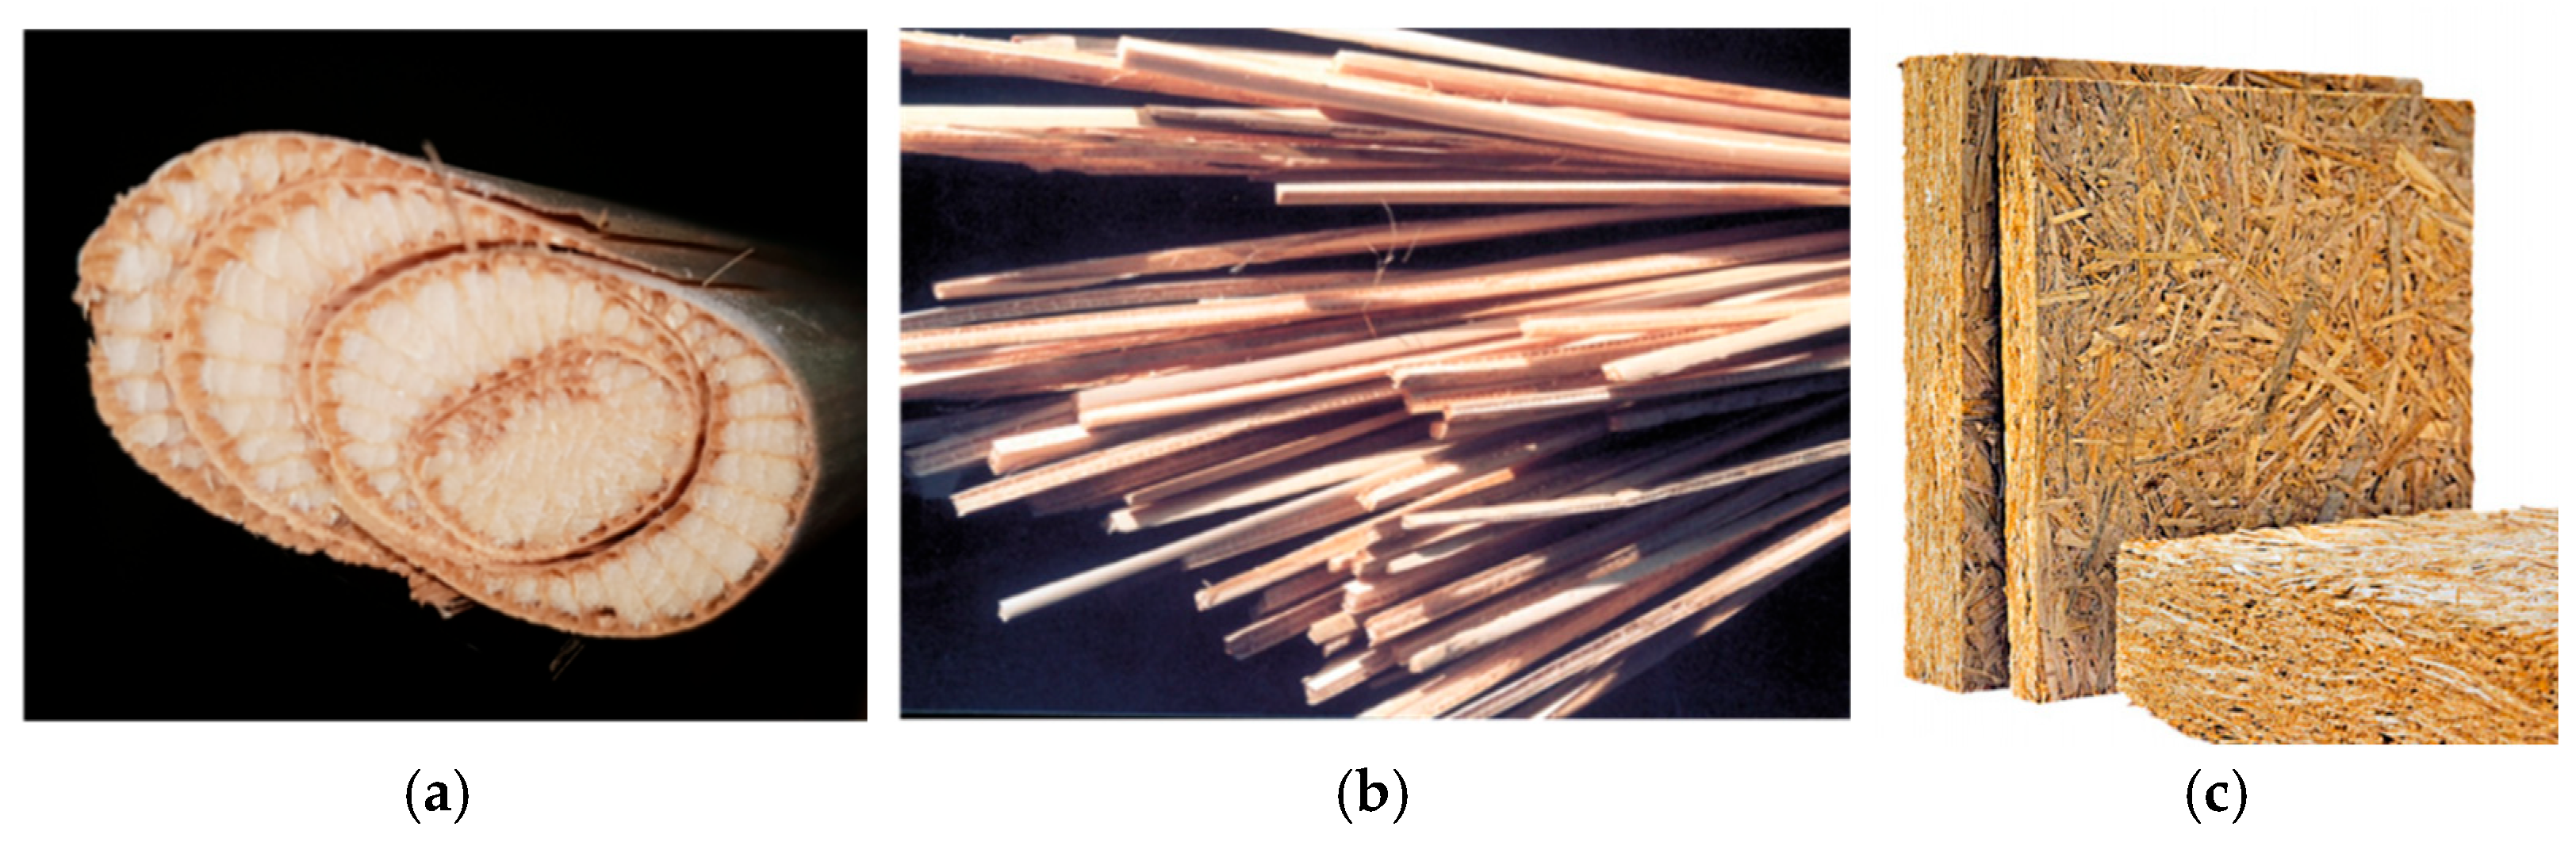
The basis for the Typha Board, developed by Dipl.-Ing. Werner Theuerkorn, in collaboration with the Fraunhofer Institute for Building Physics IBP (manufactured at typha technik Naturbaustoffe; Wichtleiten 3; 84389 Postmünster, Germany), is the renewable raw material Typha angustifolia (narrow-leaved cattail), which is used due to its special structural properties. The structure of the plant determines the suitability of the leaf mass of Typha. The leaves have a fiber-reinforced and stable support tissue filled with a soft, open-celled sponge tissue (see
Figure 2). This results in both remarkable statics and excellent insulation properties, which are listed in
Table 1.
To manufacture the boards, relatively large particles are first produced with a specially developed cutting device, without fibrillation, but rather by maintaining the leaf structure. Thus, both of the plant’s positive properties, its strength and its insulation effect, are transferred into the product. These particles are then bonded with a mineral adhesive (e.g., magnesium) under low pressure and energy input to form boards. Through the procedure described, the so-called magnesium-bonded Typha board can be manufactured as a building material with the following advantages:
By installing the boards, good thermal insulation and sealing of the very leaky wooden structure can be achieved in historical wooden houses, thereby increasing the efficiency of electric cooling.
2.2. Construction of the Demo Building
The demo building, constructed to be as comparable as possible to the design of a historical wooden house, was planned and built in cooperation with the Fraunhofer Center for International Management and Knowledge Economy IMW and King Mongkut’s Institute of Technology Ladkrabang (KMITL). It was conceived as a typical traditional Thai house with two equally sized rooms and was implemented on the campus of KMITL in Bangkok. The difference between the rooms is that one room is cladded inside with thermally insulating Typha boards, whereas the other room is built according to the model of a traditional Thai house without insulation, featuring a correspondingly leaky construction. Both rooms have two windows (uncoated single glazing with an U
w value of 5 W/m
2K) and a door. One window was located next to the door (west-facing wall), and the second was placed on the opposite side (east-facing wall). This arrangement was the same in both rooms. Each room was equipped with an air conditioner and identical sensors.
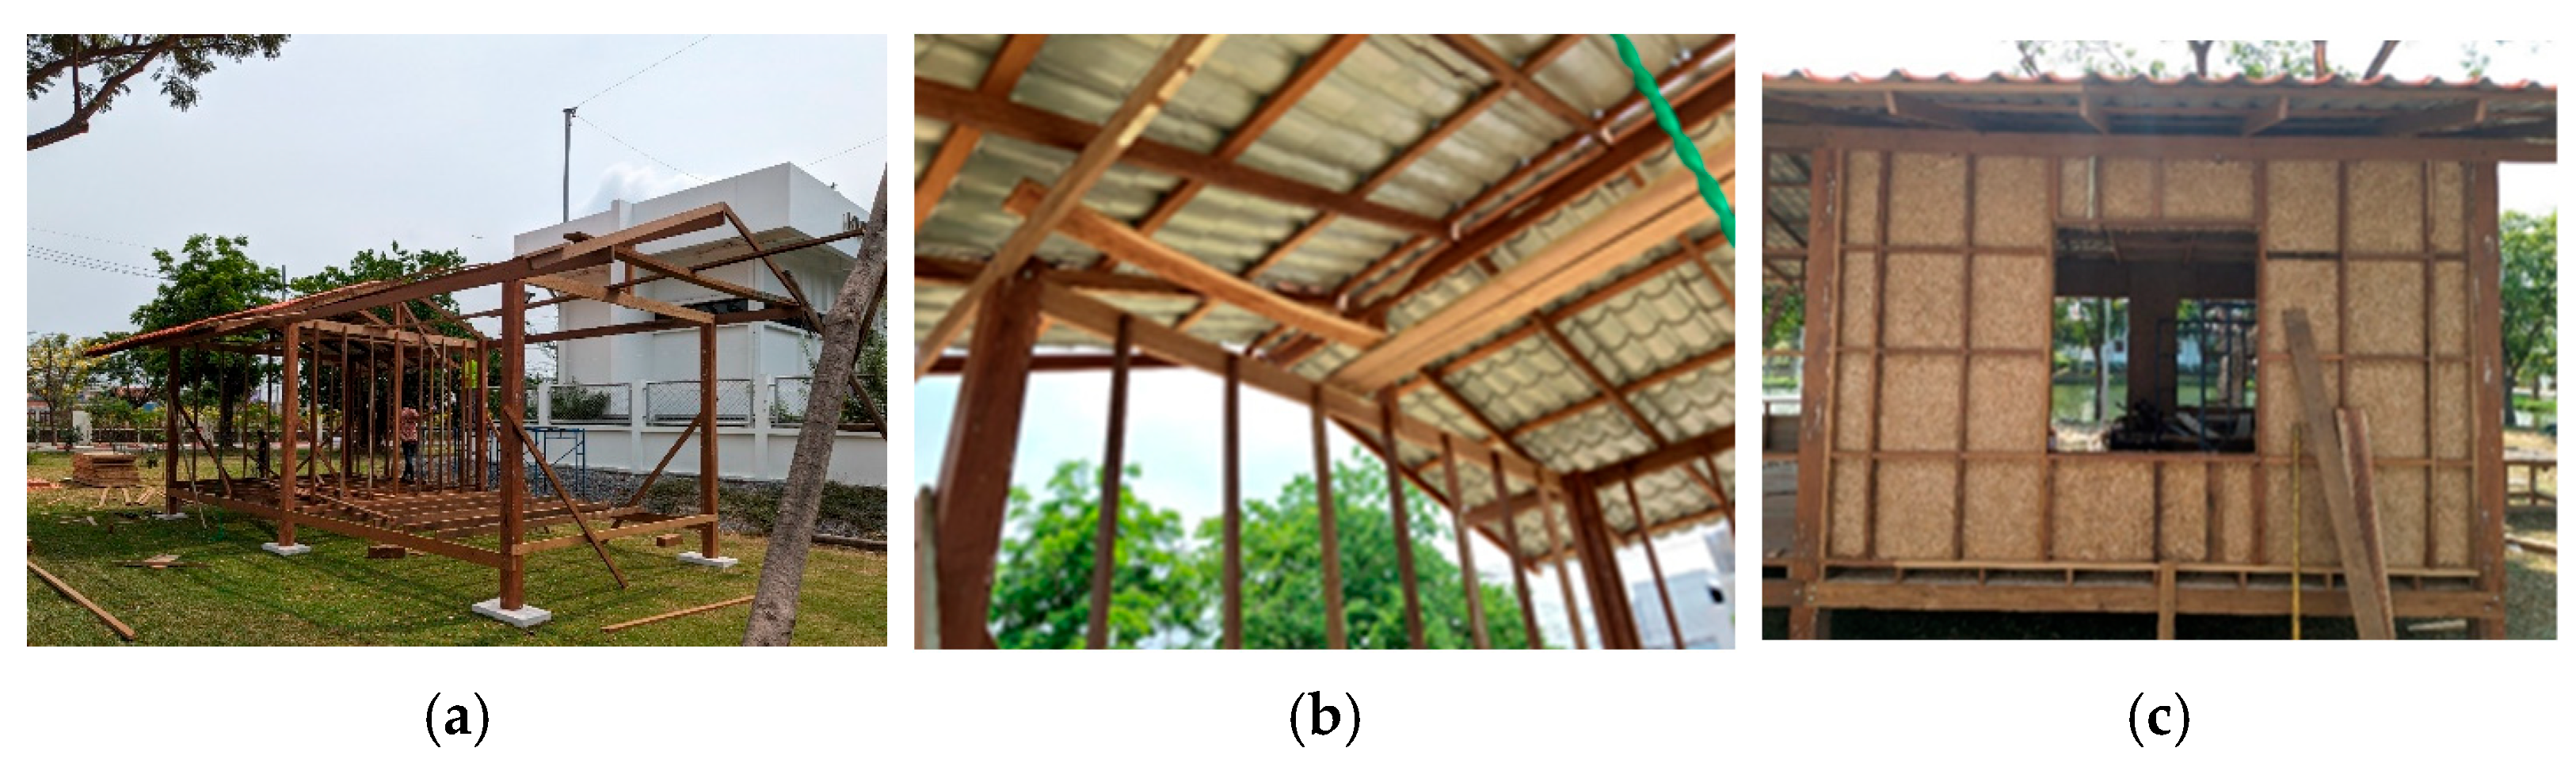
Figure 3 shows the building at various stages of construction.
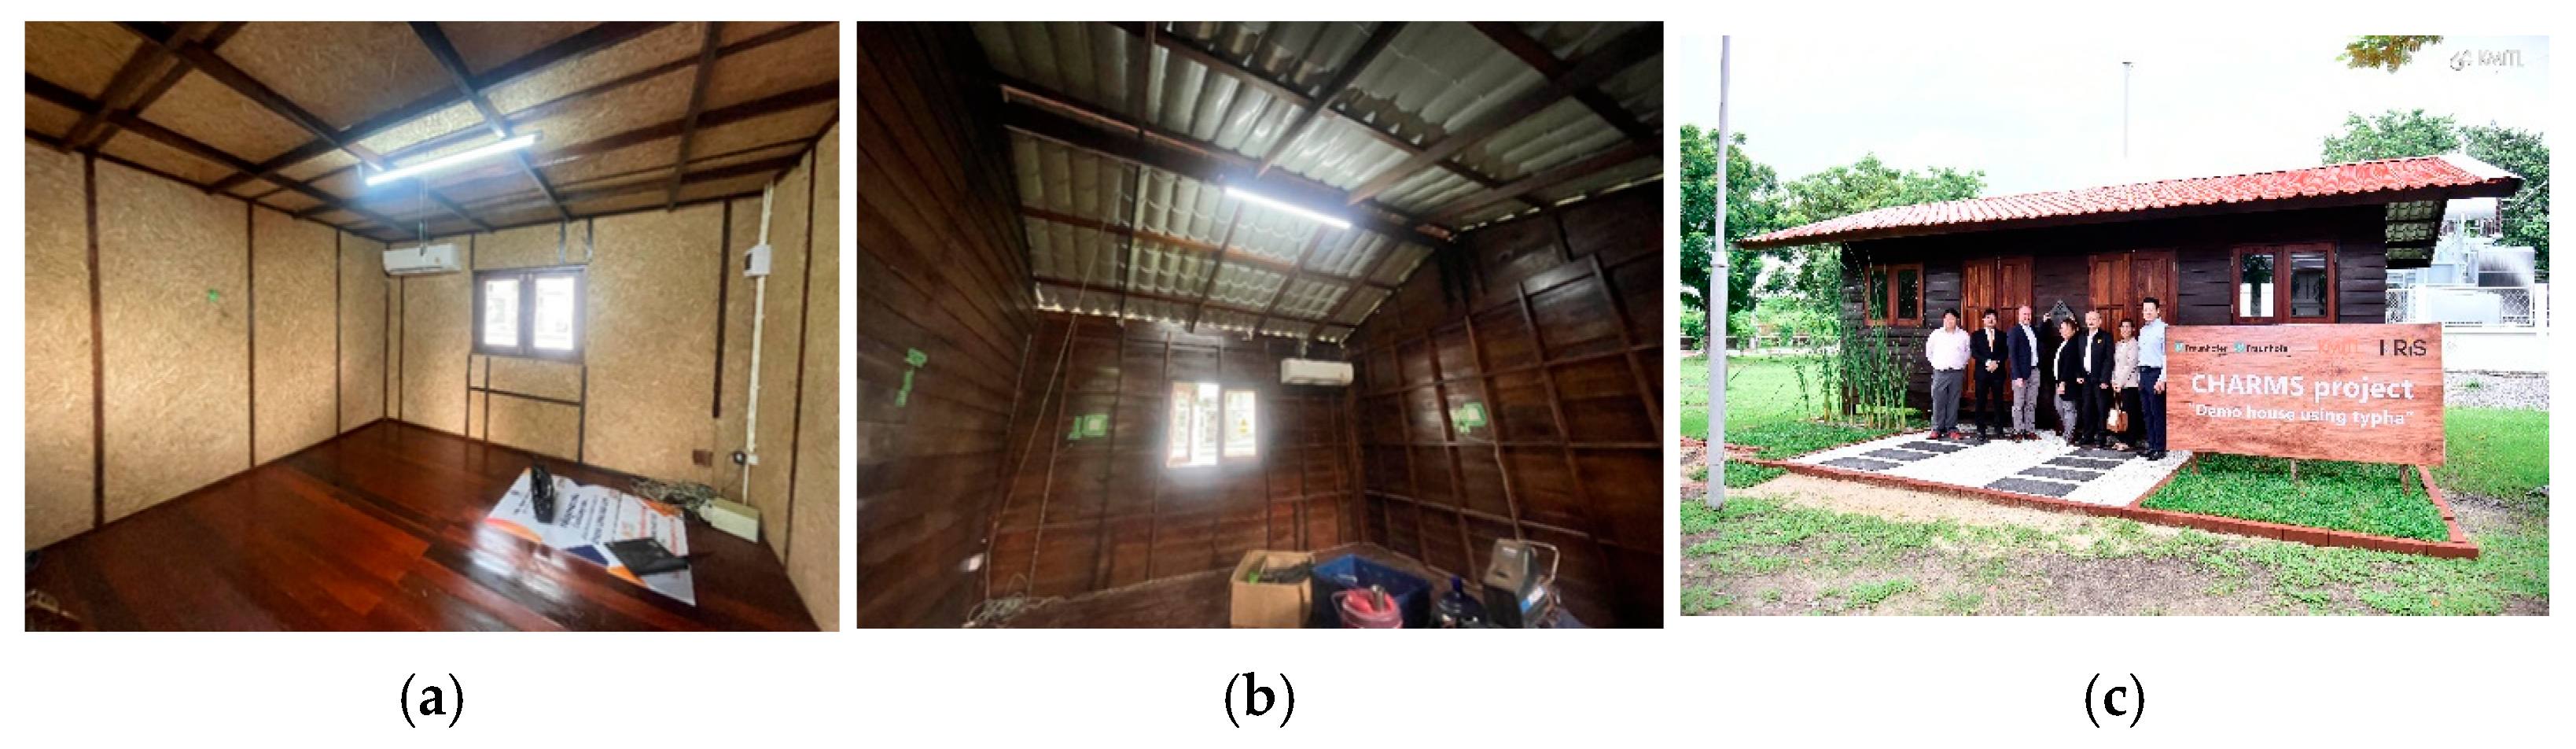
Figure 4 presents interior shots of the insulated room (a) and the uninsulated room (b). Meanwhile, the test house in Bangkok was visited by the BMBF, the project sponsor DLR (German Aerospace Center), and the German embassy (
Figure 4c), with consistently positive feedback. The building features a common metal roof covering in Thailand without an under-roof, with a roof inclination of 15°. Each room is approximately 4.0 m long and 4.0 m wide. The insulation in the Typha room is located on all walls, the ceiling, and under the wooden floor. Both rooms were equipped with the same air conditioner and separated by an insulated partition wall.
2.3. Sensors and Data Collection
The test building was equipped with measuring sensors to determine temperature, heat flux, and humidity. Three different sensor types were installed: temperature sensor (T), combined sensor (temperature + relative humidity) (K), and heat flux sensor (H). The measurement interval for all sensors is one minute. The combined sensors have an accuracy of ±3% in the range from 10 to 90% RH and ±5% in the range from 5 to 98% RH. The accuracy of the temperature sensors is typically ±0.2 K (max. ±0.4 K) in the range from 5 to 60 °C. These sensors are factory calibrated by the manufacturer. The accuracy of the heat flow sensor is 5%, also with factory calibration by the manufacturer. The Pt100 temperature sensors comply with class AA according to DIN EN 60751:2023-06 [
12]. These sensors were calibrated shortly before their use for the demo house at the IBP (in-house calibration).
In the uninsulated room, the sensors are located on the ceiling, partition wall, and exterior walls. Additional sensors are located between the insulation and the outer construction in the insulated room. In each room, the room climate is recorded using a combined sensor.
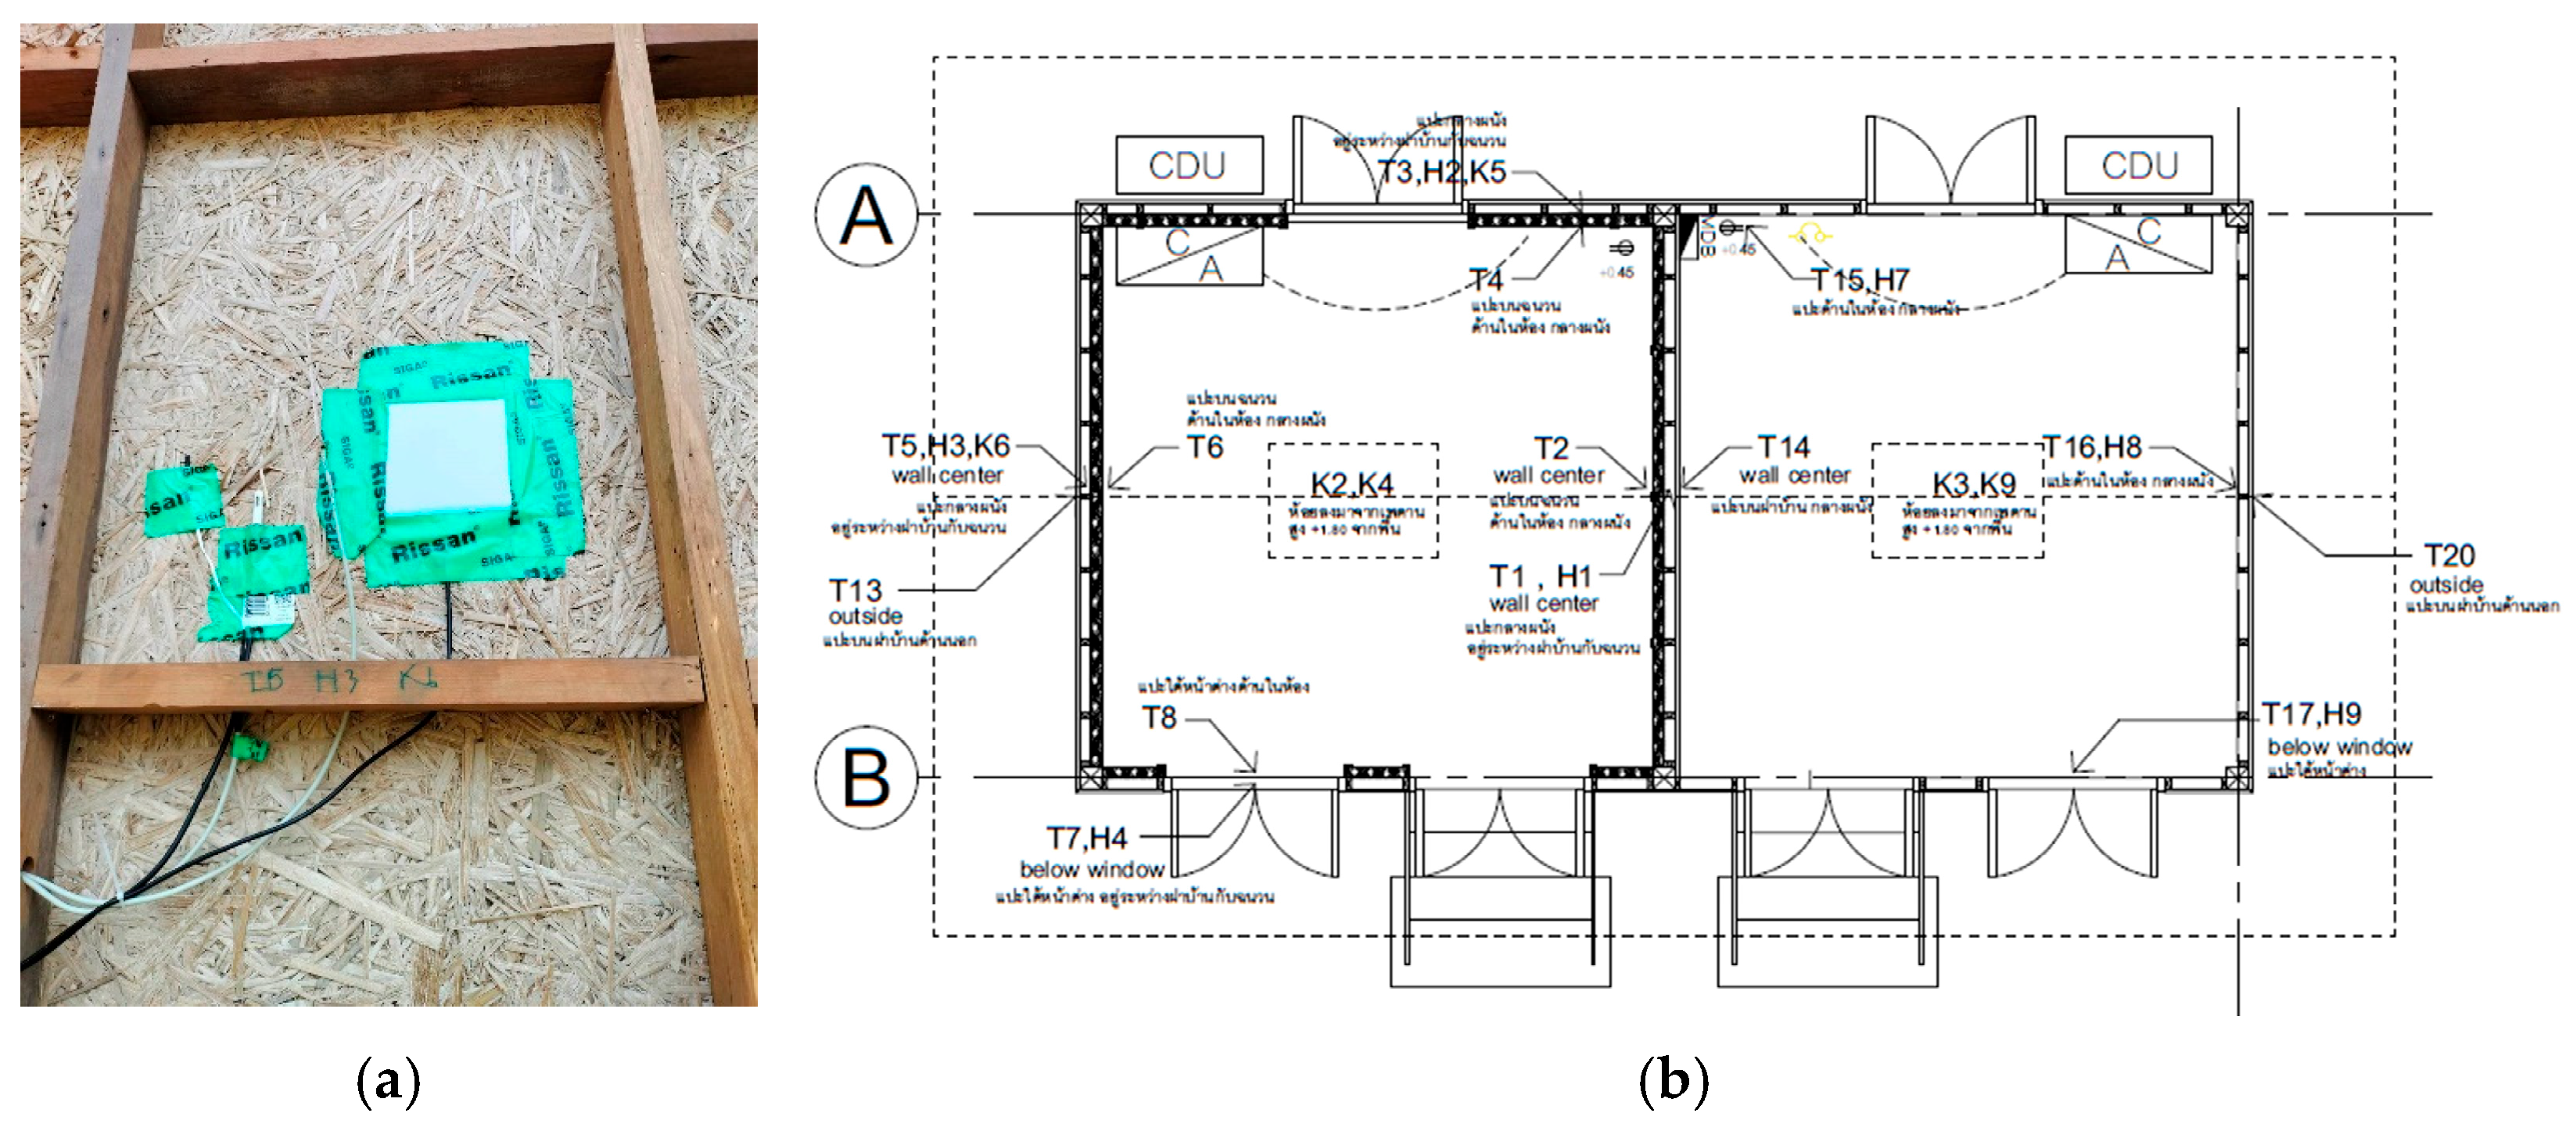
Figure 5a shows an example of applying a temperature sensor, a combined sensor, and a heat flux sensor on the backside of the Typha insulation. The floor sketch shows the locations of the installed sensors distributed in the building (
Figure 5b). In addition, the outdoor climate is recorded with a combined sensor. The measurement data are recorded with a data logger, locally stored, and saved in a database via the Internet. This allows for the online monitoring of measurements and makes them available for evaluation.
2.4. Hygrothermal Simulation with the Room Model WUFI®-Plus Implementation of the Building
The WUFI
®-Plus program (Version 3.5) is based on a hygrothermal whole-building model [
13]. The room-enclosing components (such as walls, ceilings, windows, etc.) are considered one-dimensional. With the calculation of all the heat and moisture flows, the individual components enter the calculation of the room climate according to their surface areas [
14]. In addition to calculating the heat and moisture transport at the component level, sources and sinks, such as internal loads generated by users, climate control with heating, cooling, dehumidifying, or mechanical ventilation, can also be considered. Thus, in addition to questions regarding the damage-free condition of the components, investigations into the comfort and energy demand for heating and cooling can be conducted [
15].
For the calculations, the entire building structure, including the materials used along with their hygrothermal material properties and respective thicknesses, must first be implemented into WUFI
® Plus. A good option is to create the whole building model with the freely available software tool SketchUp (Version 2024;
www.sketchup.com; access date 14 June 2024) and import the defined model into WUFI
® Plus.
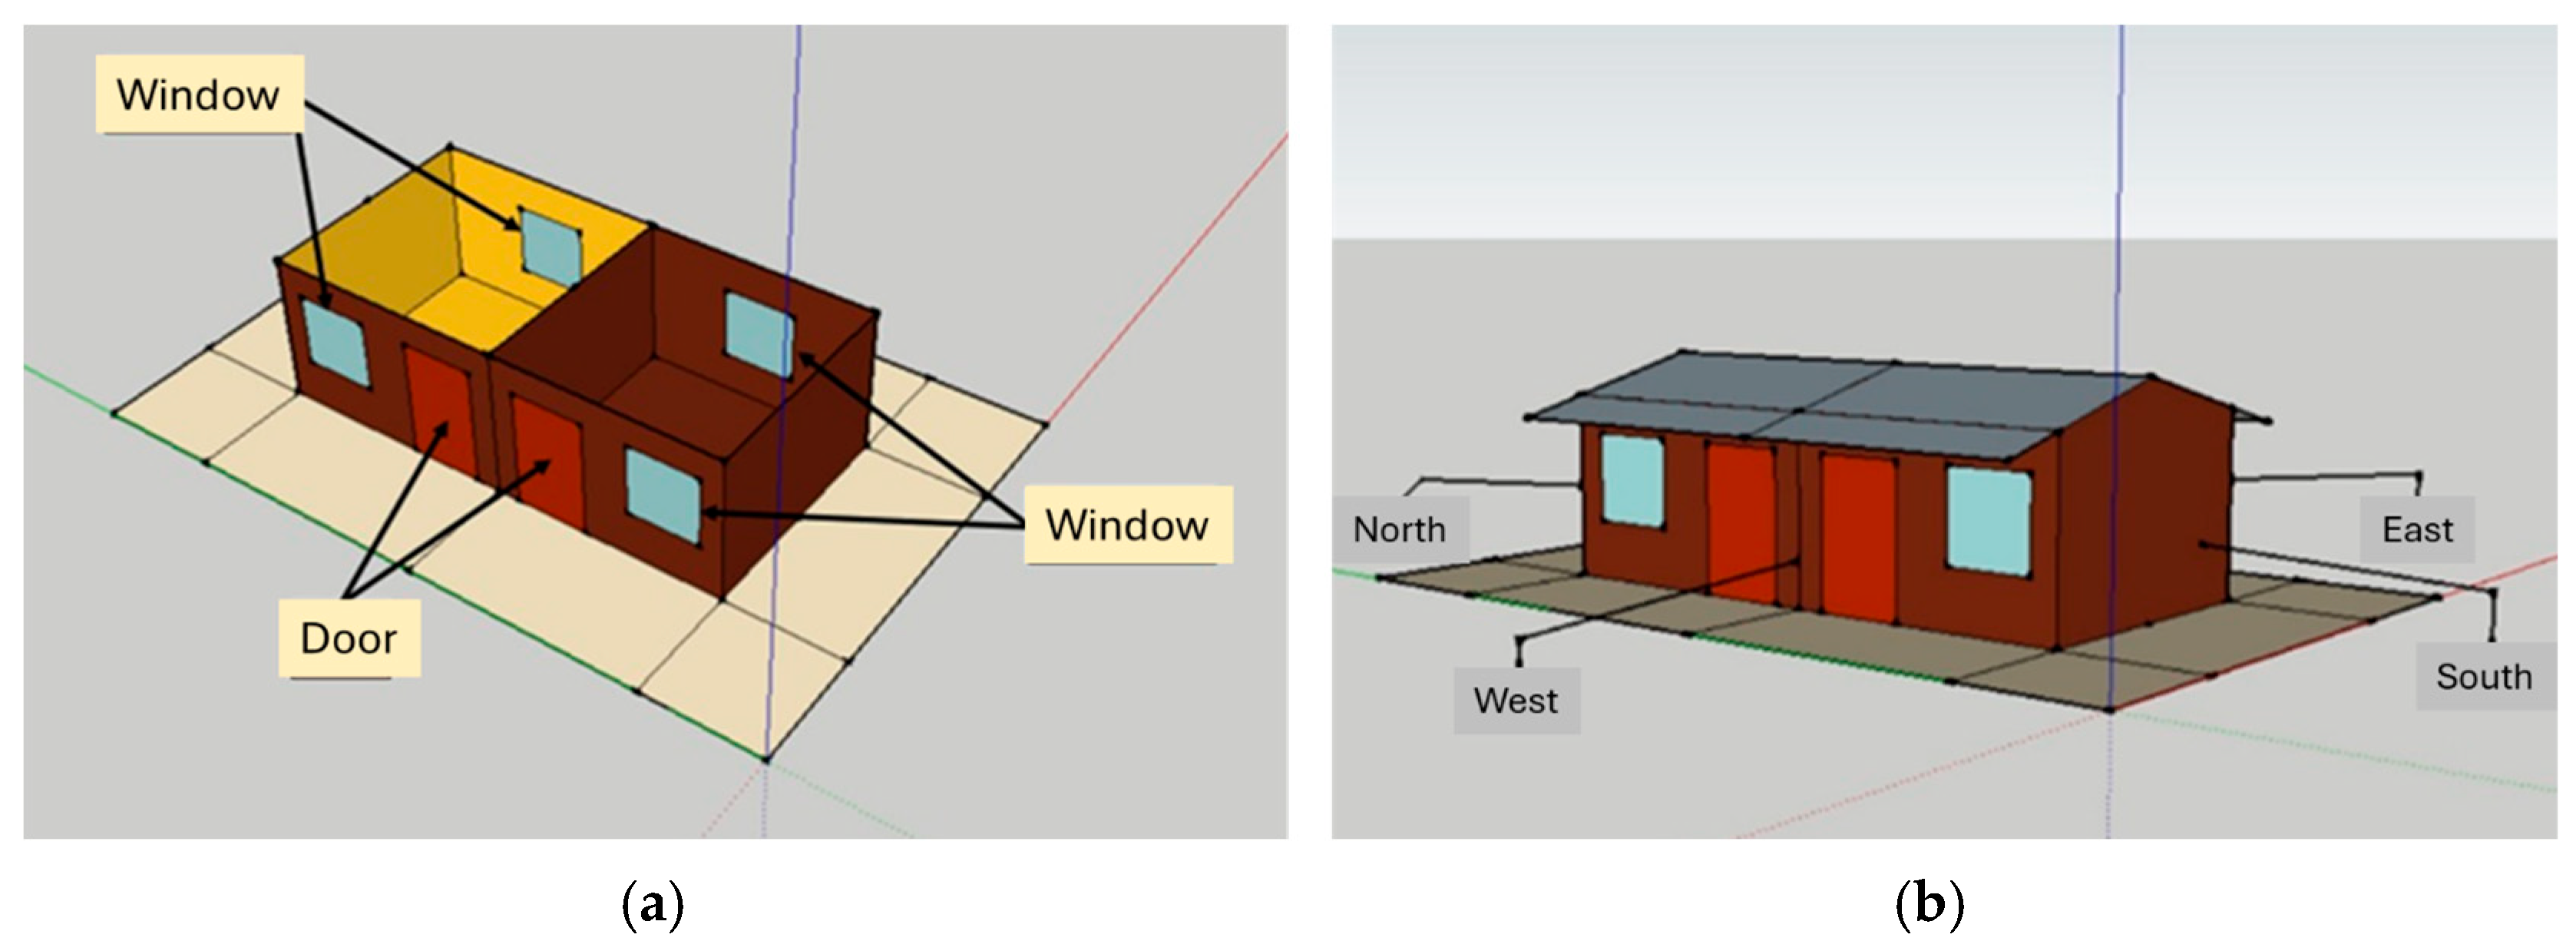
Figure 6 shows the model of the building created using SketchUp.
3. Results
3.1. Measurement Results
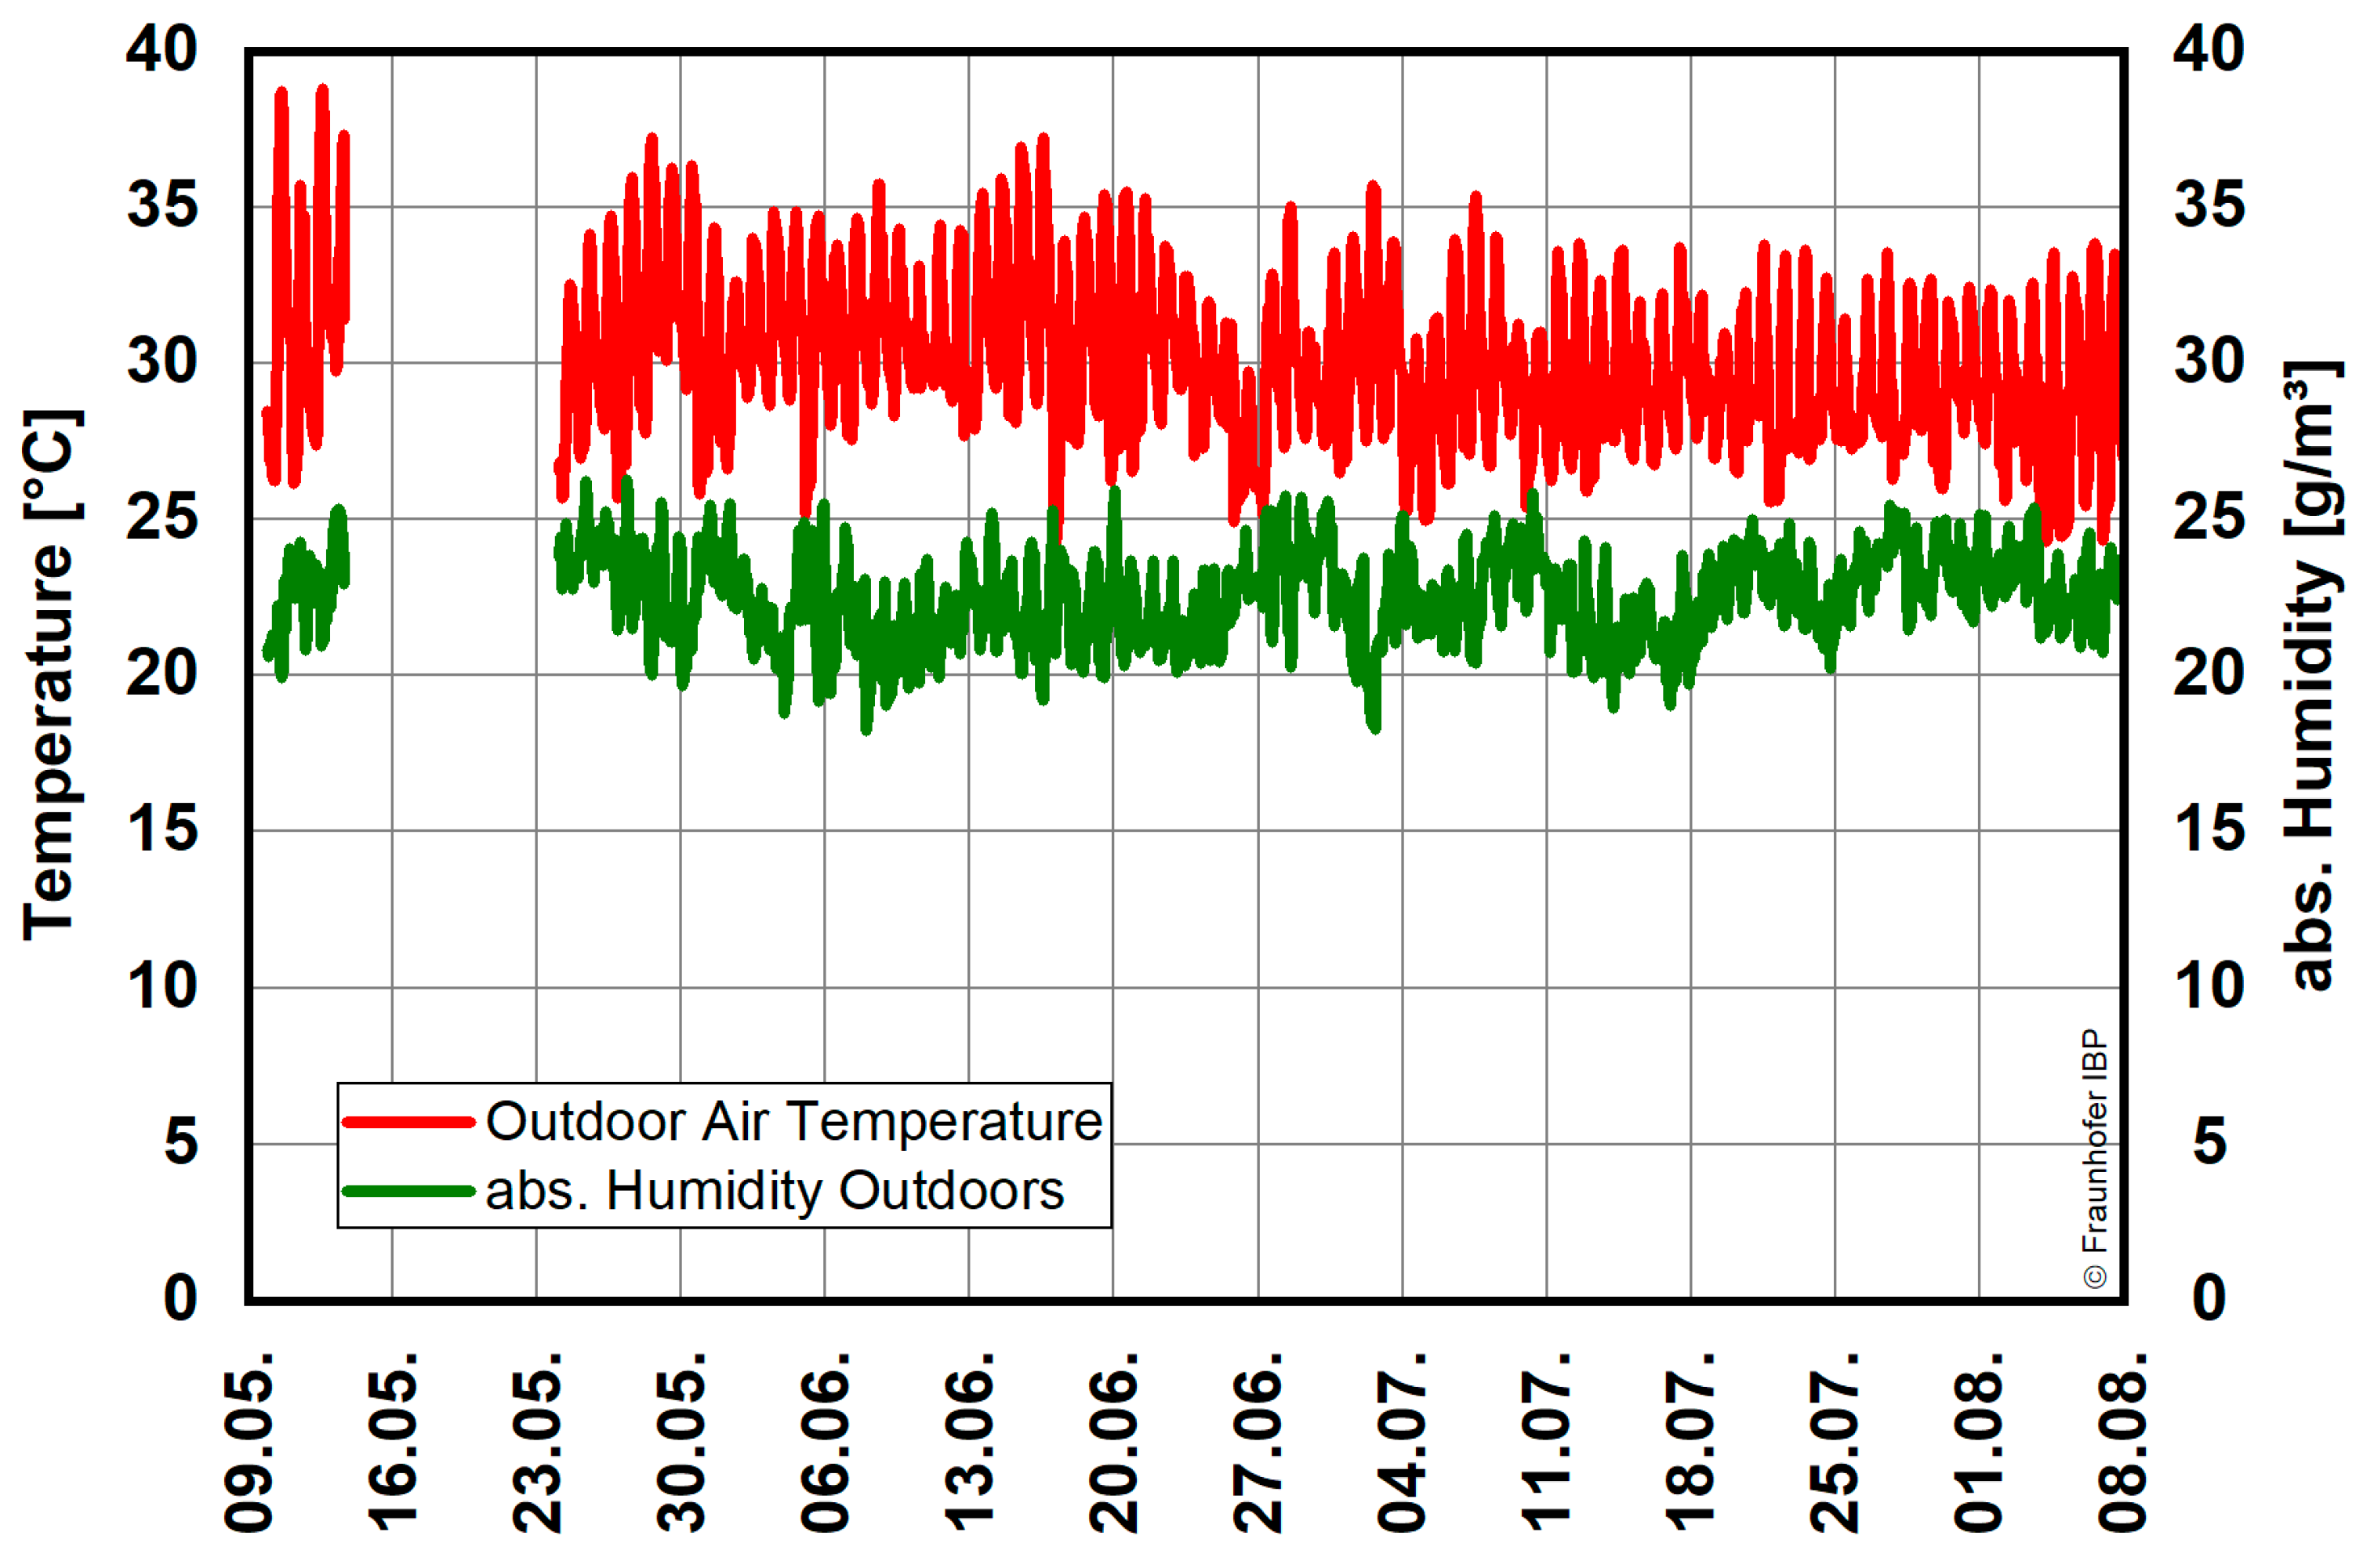
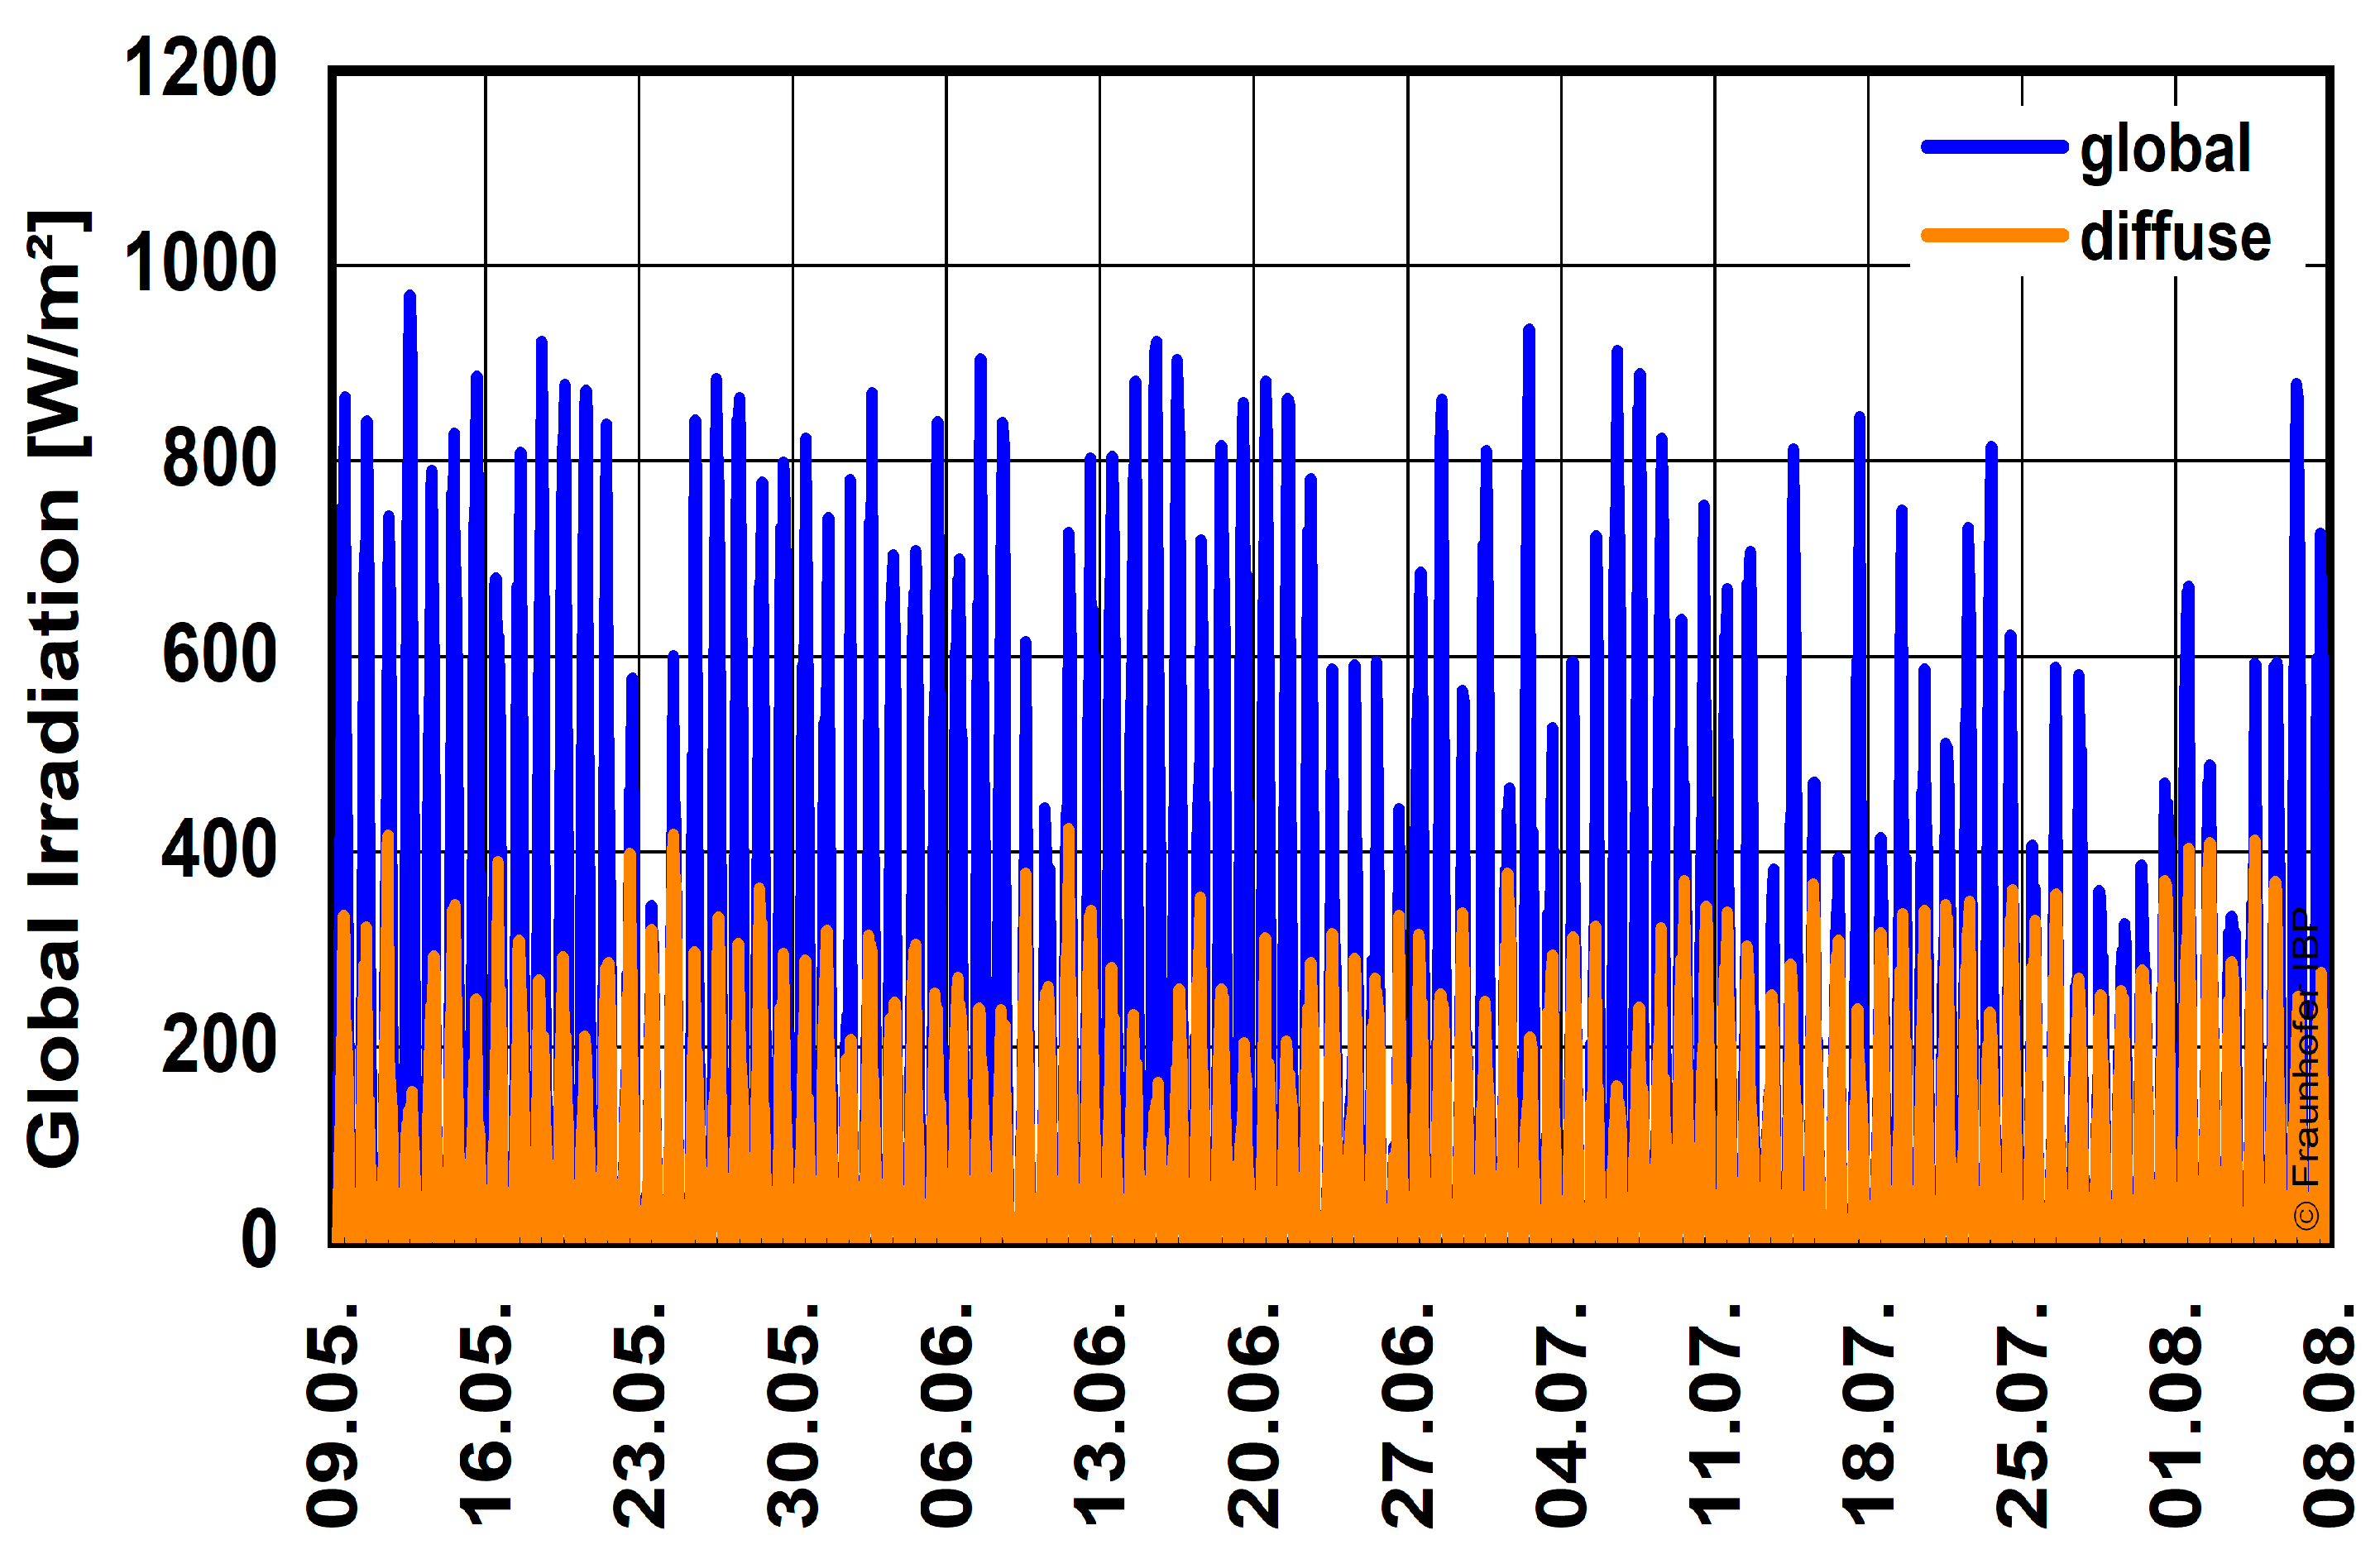
Figure 7 shows the measured outdoor climate of the test house from May 9th to August 4th, 2024. The absolute humidity (green line) was calculated from the temperature (red line) and the relative humidity. As can be seen from the gap in the diagram, there was a measurement failure between May 13th and 23rd. Fluctuations in outdoor temperature are evident, with clearly recognizable day–night cycles. During the observation period, the temperature rose significantly during the day and fell again at night, indicating typical tropical heat during the day and cooler nights. The temperature regularly reached its peak values during the day. It is notable that, particularly at the beginning of the measurements, peak temperatures of over 38 °C were reached. In June, daytime peak temperatures often exceed 35 °C. From the beginning of July, the temperature course shows a slight decrease; however, daytime temperatures remain above 30 °C. Day and night cycles also occur in absolute humidity, but with significantly lower fluctuations. The irradiation at the test house location for the period from May 9th to August 4th, 2024, is shown in
Figure 8.
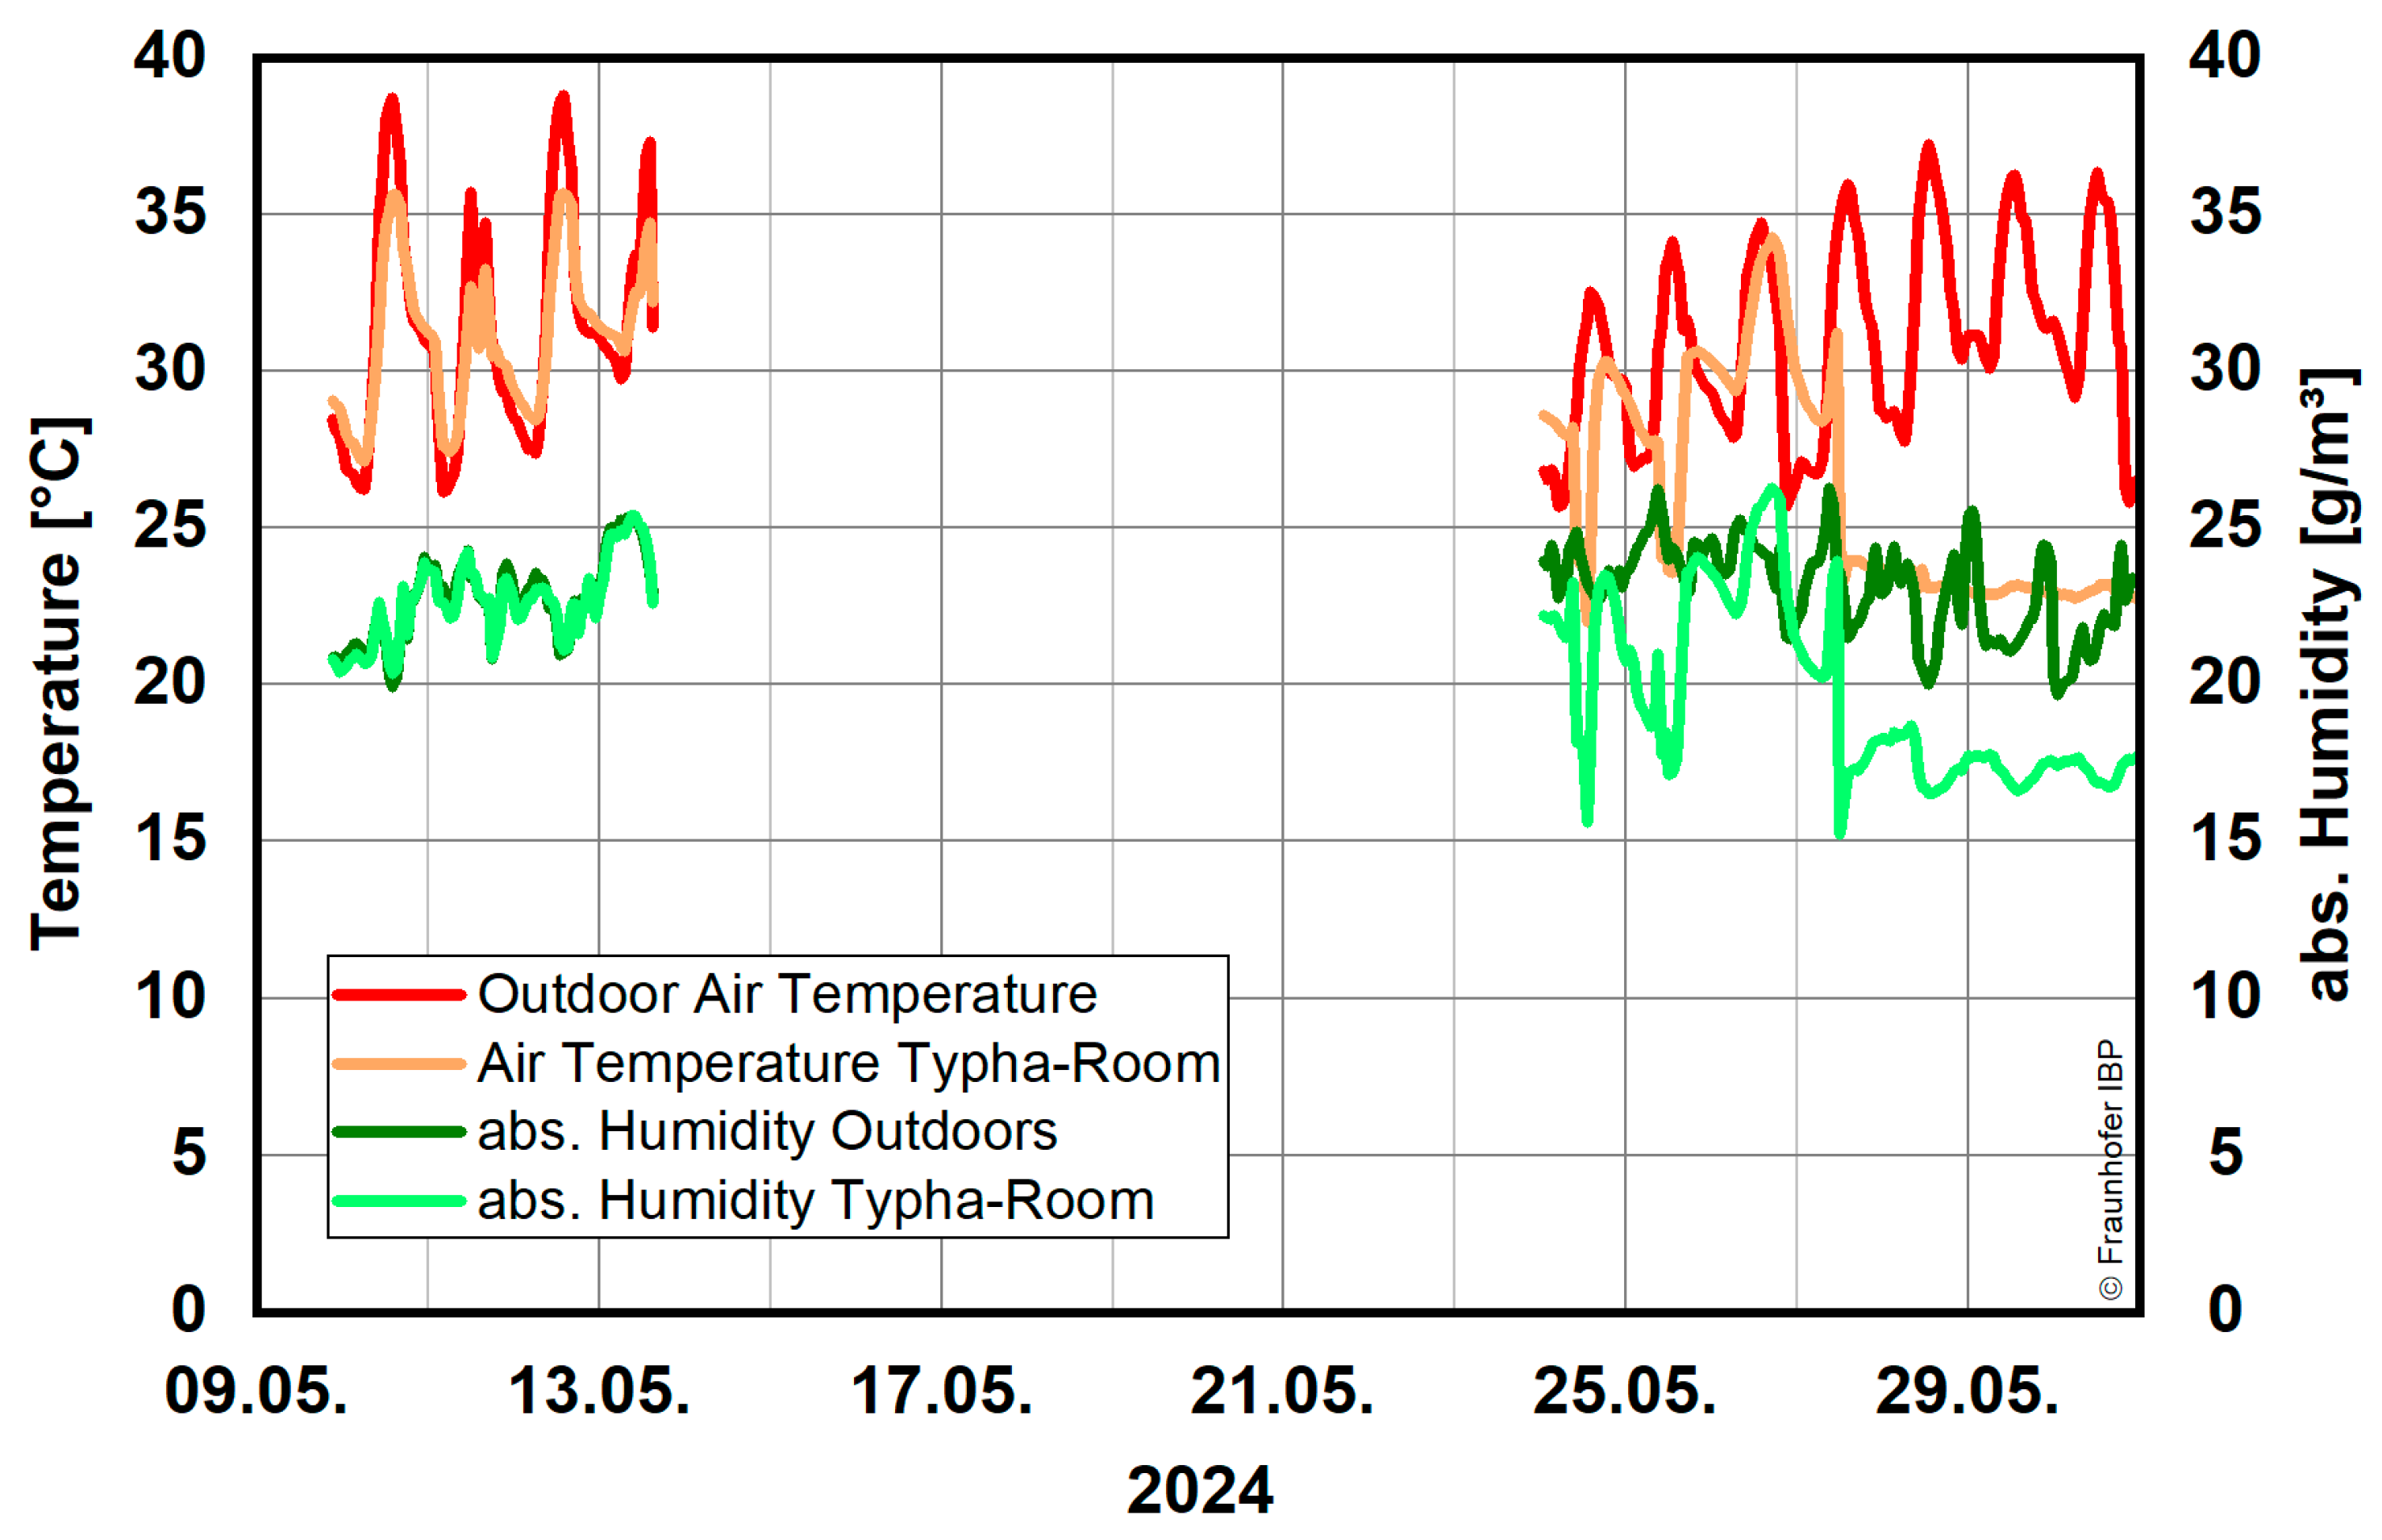
Figure 9 shows a comparison between the outdoor climate and the climate in the Typha room in May. Despite the relatively long measurement failure period, this timeframe was chosen for representation, as it clearly shows the difference in the room climatic conditions before and after the installation and operation of the air conditioning. In the period from May 9th to May 13th, significant fluctuations in climate in the Typha room were noticeable, and it was established that the indoor temperature nearly corresponded to the outdoor air temperature, with slightly lower maximum temperatures compared to the outdoor climate. The absolute humidity also largely follows that of outdoor air. When the air conditioning was turned on May 27th, a significantly more stable indoor climate with very low fluctuations was achieved. The set room air temperature of 23 °C was maintained almost constant.
The drying effect of the air-conditioning operation is also clearly visible. The absolute humidity of the indoor air was reduced by an average of approximately 5 g/m3 compared to that of the outdoor air. Measurements from the months following, June and August, yielded very similar results to those from May 27th, which is why separate representations for these months and the uninsulated room are omitted.
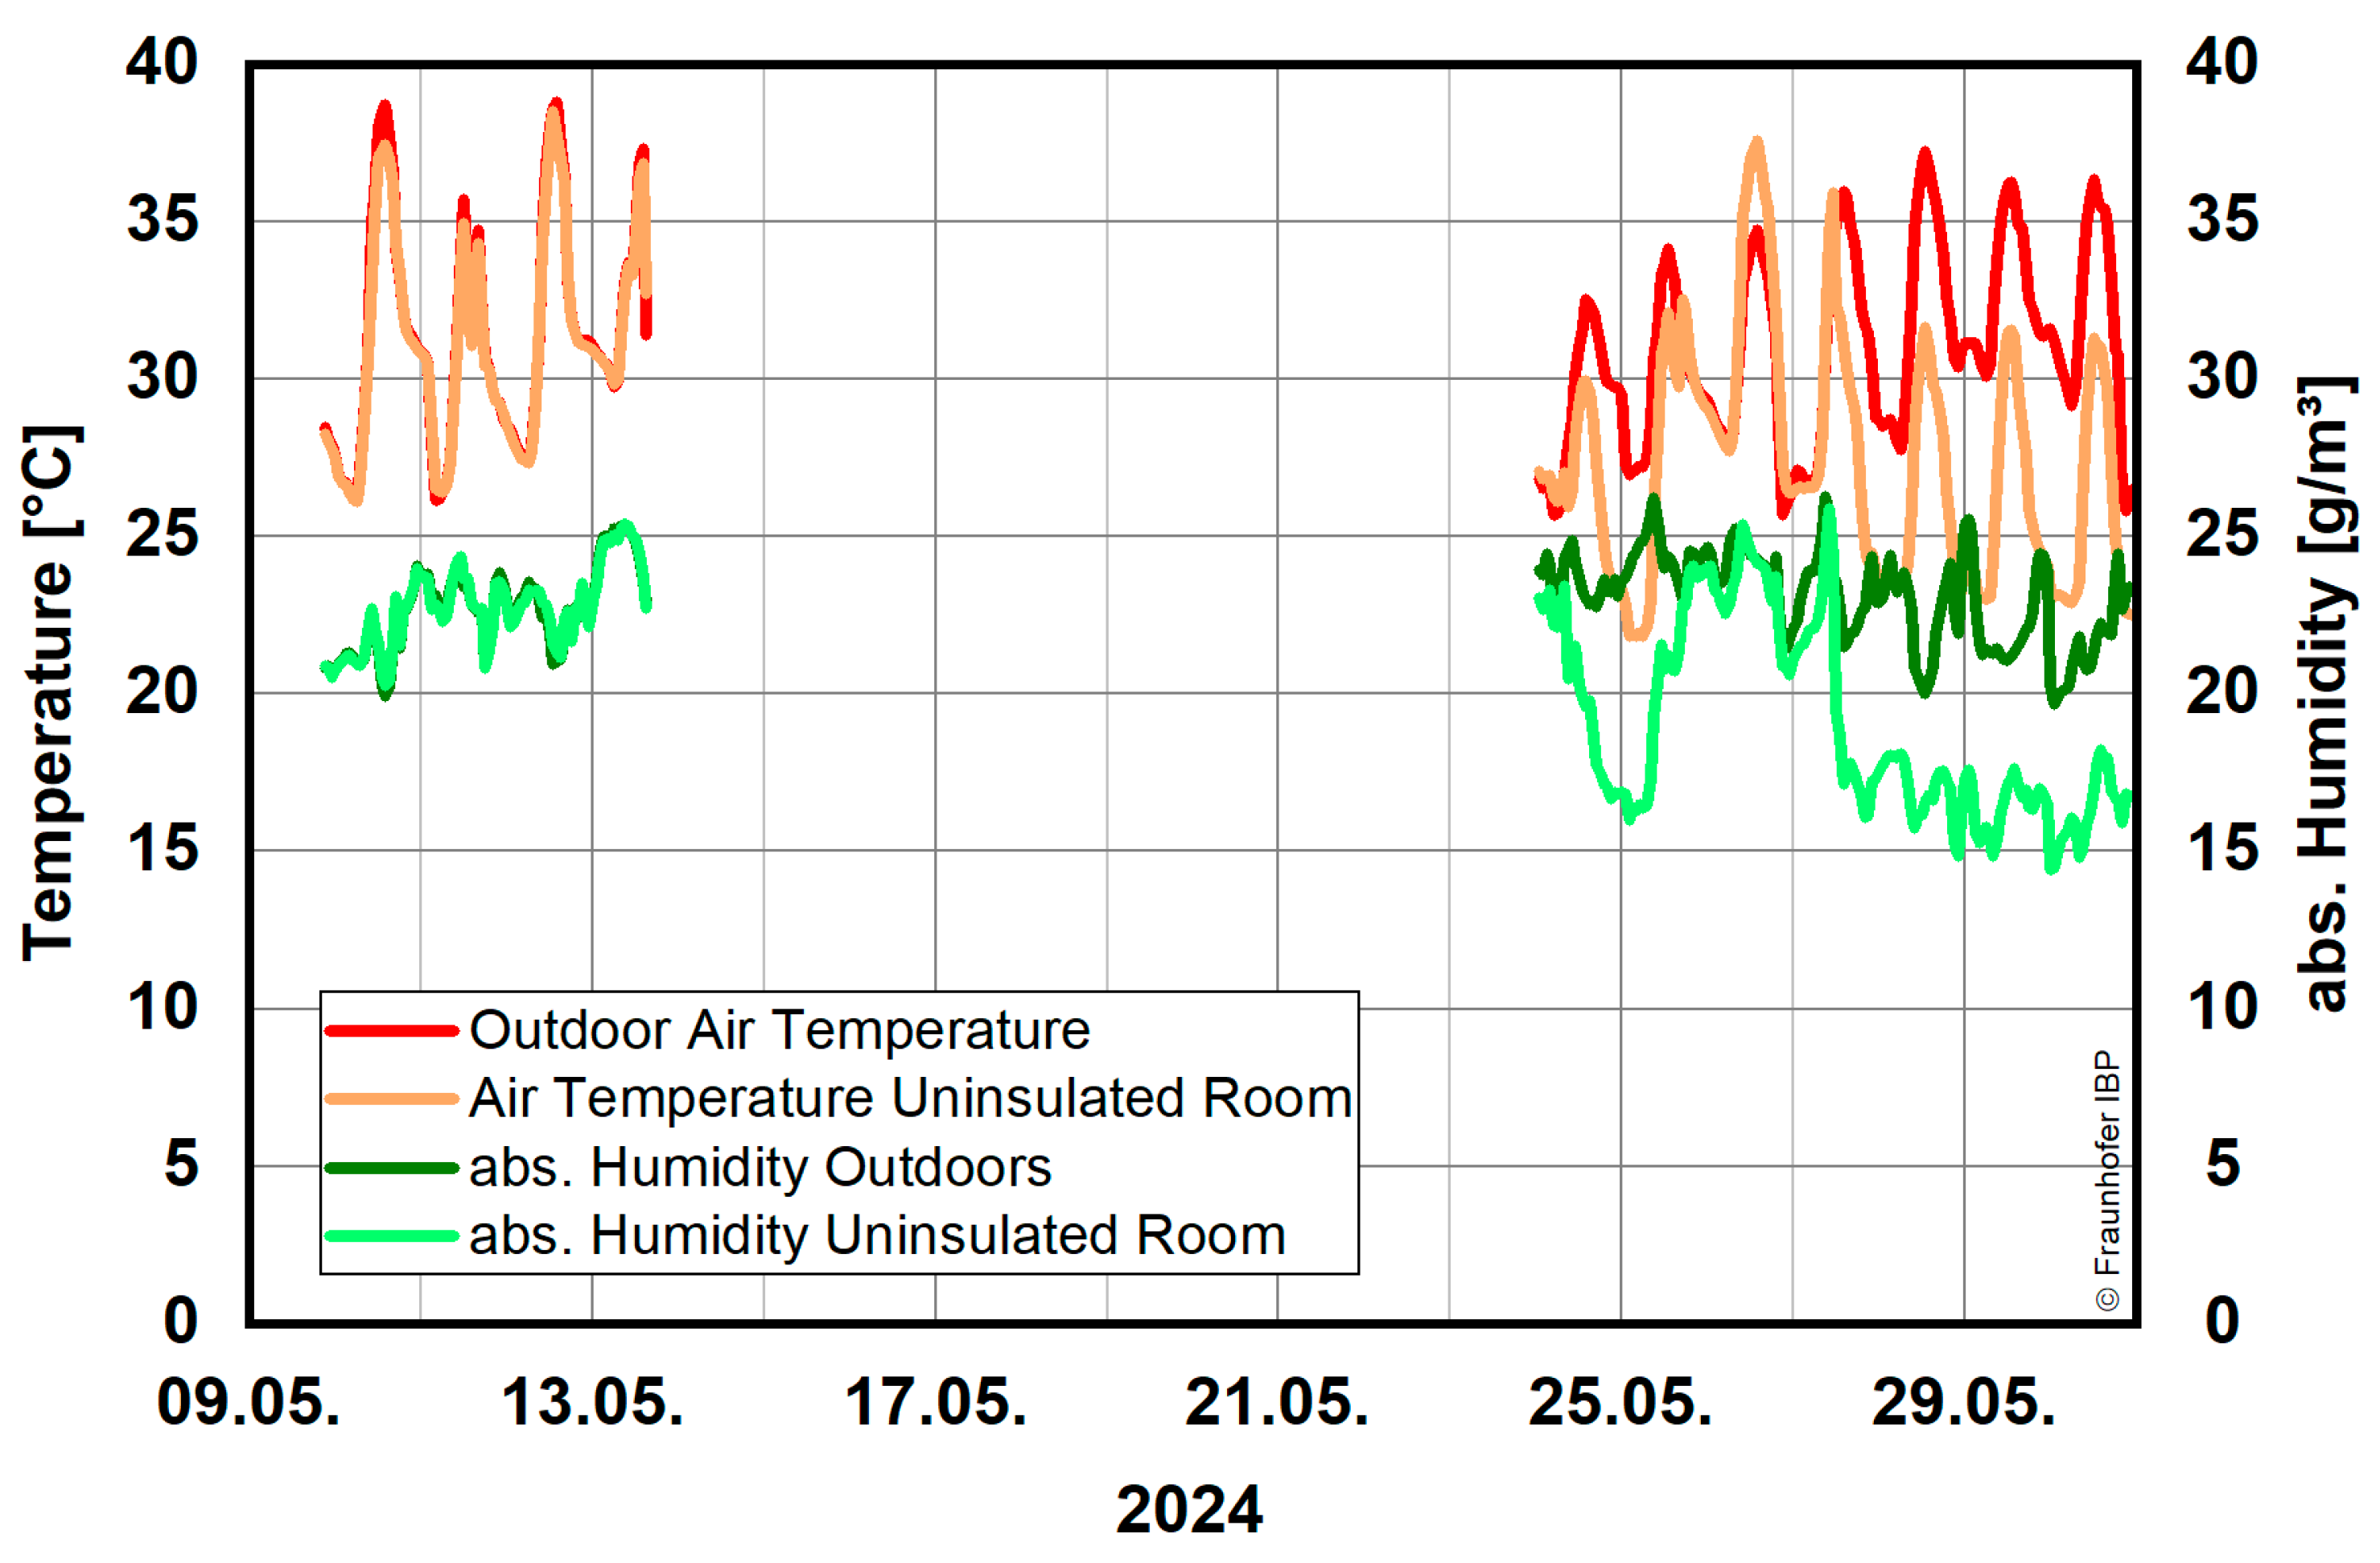
Figure 10 shows the measurement data of the outdoor climate compared to the room climate of the room without thermal insulation for May, similar to
Figure 9. Before the air conditioning was turned on, the indoor temperature and absolute humidity in the uninsulated room were almost identical to the outdoor air. When the air conditioning was turned on, the indoor temperature dropped significantly, but only reached the target values of 23 °C at night. During the day, the indoor temperatures decreased by only 5 to 6 °C to just over 30 °C, despite air conditioning. This indicates that, unlike in the Typha room, the air conditioning performance is not sufficient for this uninsulated, traditionally built room. Because the air conditioning runs almost continuously at maximum capacity, greater dehumidification of the indoor air occurs in this room, which is evident from the slightly lower absolute humidity level compared to the Typha room in
Figure 9.
3.2. Hygrothermal Simulation with the Room Model WUFI®-Plus
Since within this project no climate measuring station was set up for the demo building, the simulation used the radiation data from a nearby measuring station in addition to the temperature and relative humidity readings measured at the building.
3.2.1. Simulation of the Current State
The air exchange rates of the test house are unknown because corresponding measurements have not yet been carried out. However, this is of great importance for hygrothermal simulation, as the air exchange rate influences moisture transport within a building. A simulation was conducted with various air exchange rates to determine the air exchange rate until a good match between the calculated course and the measured values was achieved. This approach is possible because relative humidity and air exchange rate are closely linked. The period of the air conditioning operation, which significantly influences the air exchange rate, was of particular interest.
In the simulation, an air exchange rate of 0.3 1/h, a cooling capacity of 2.1 kW, and a dehumidification of 0.05 kg/h yield the best agreement between the calculated relative humidity and the measured data.
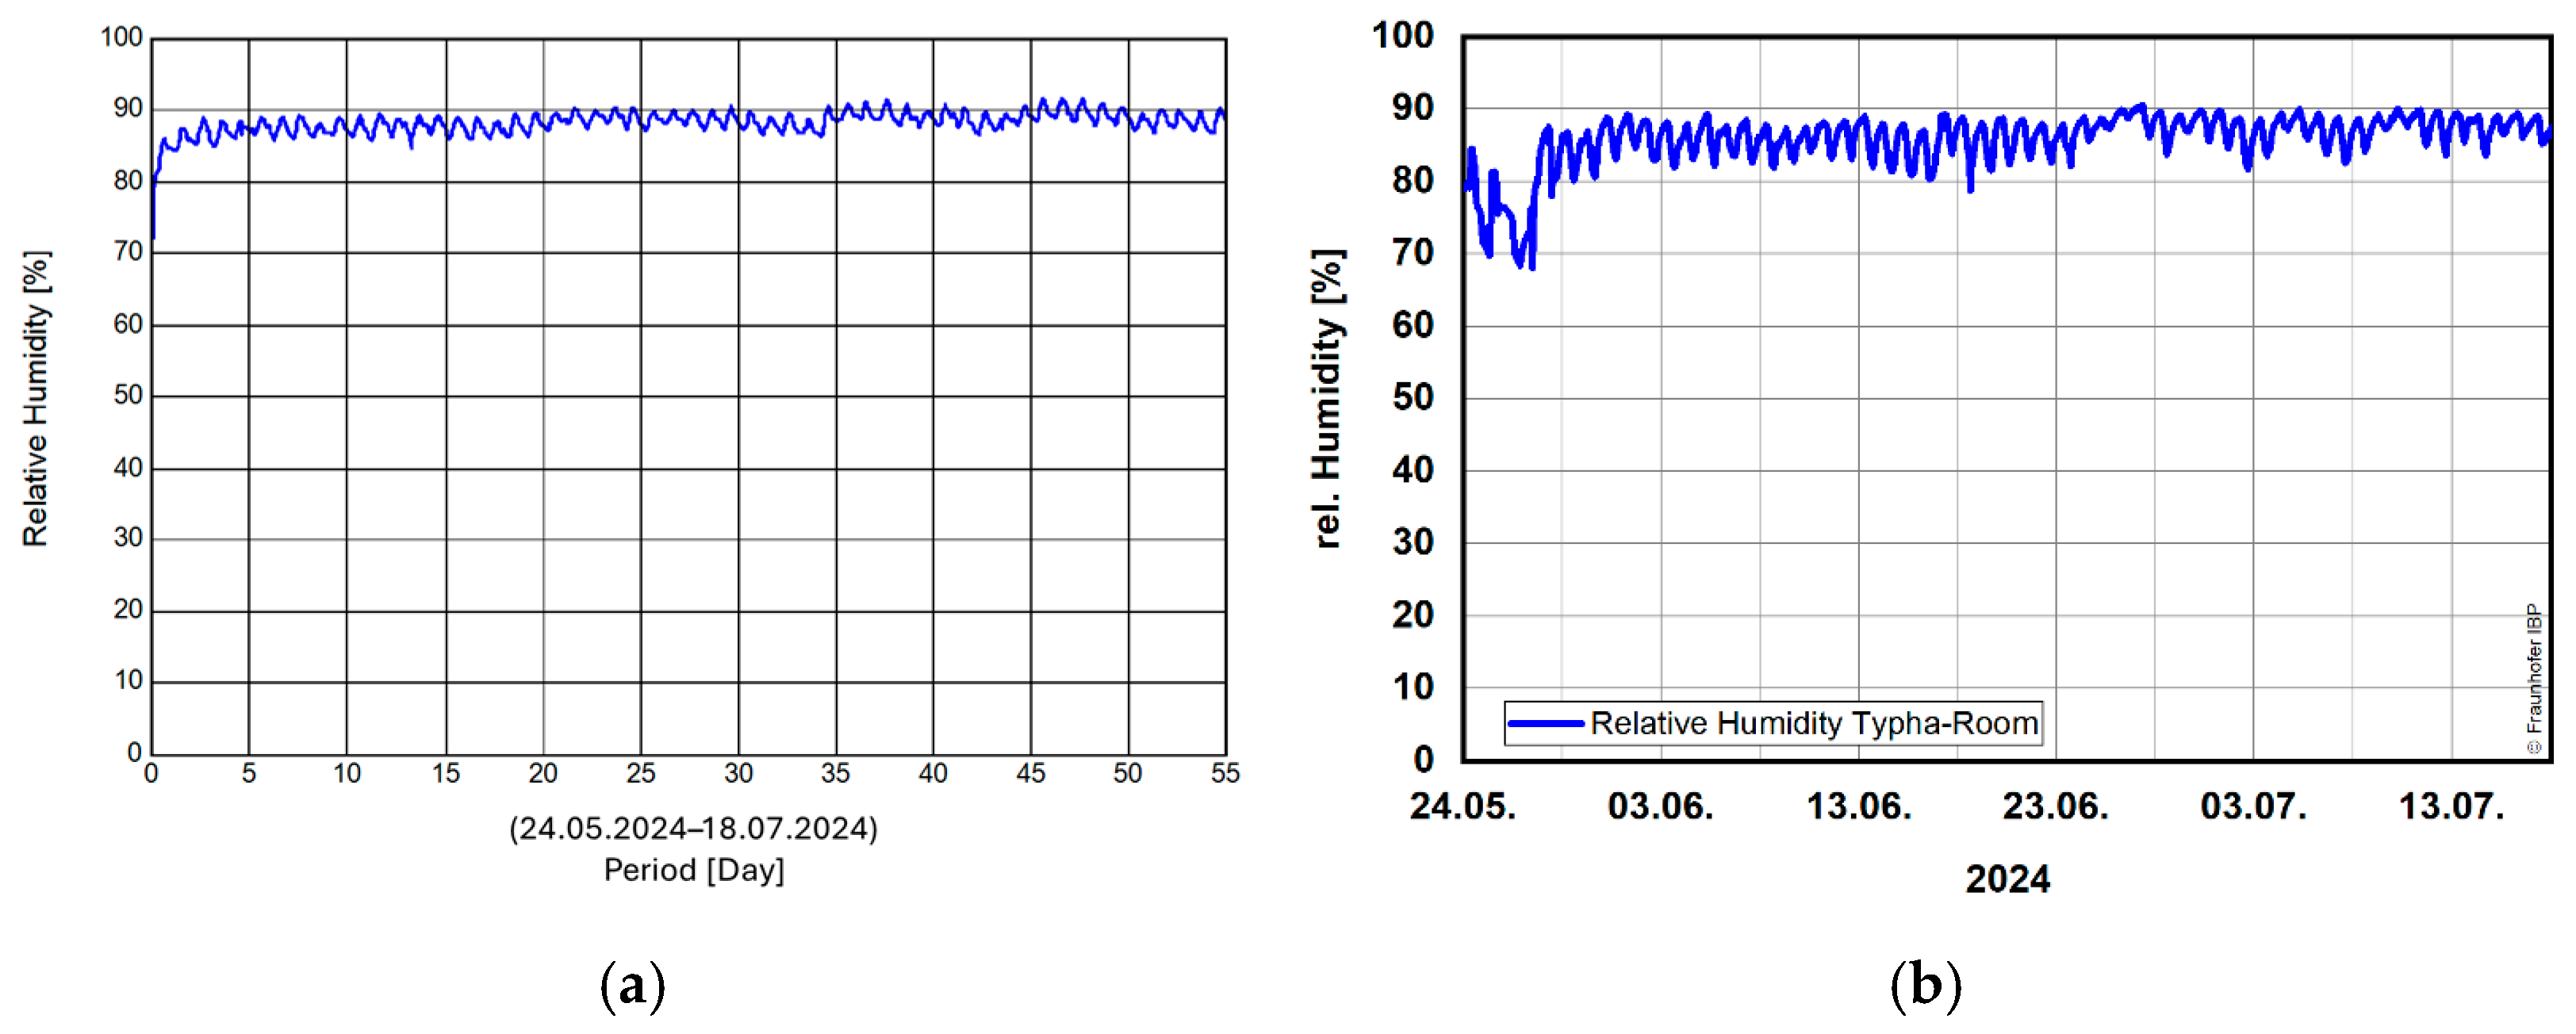
Figure 11 shows the results of the relative humidity from the measurement data
(b) and the evaluation from WUFI
®-Plus
(a). Both time courses also showed no extreme fluctuations. By adjusting the air exchange rate to 0.3 1/h and the dehumidification to 0.05 kg/h, the simulation for the Typha room was adapted to reflect the real measurement data as accurately as possible. The close agreement between the two diagrams confirms that the chosen parameters simulate realistic conditions in the room. Regarding the room air temperature, both the measurements and calculations show that the target temperature of 23 °C is maintained almost constantly with only very slight fluctuations, which is why a separate representation is omitted.
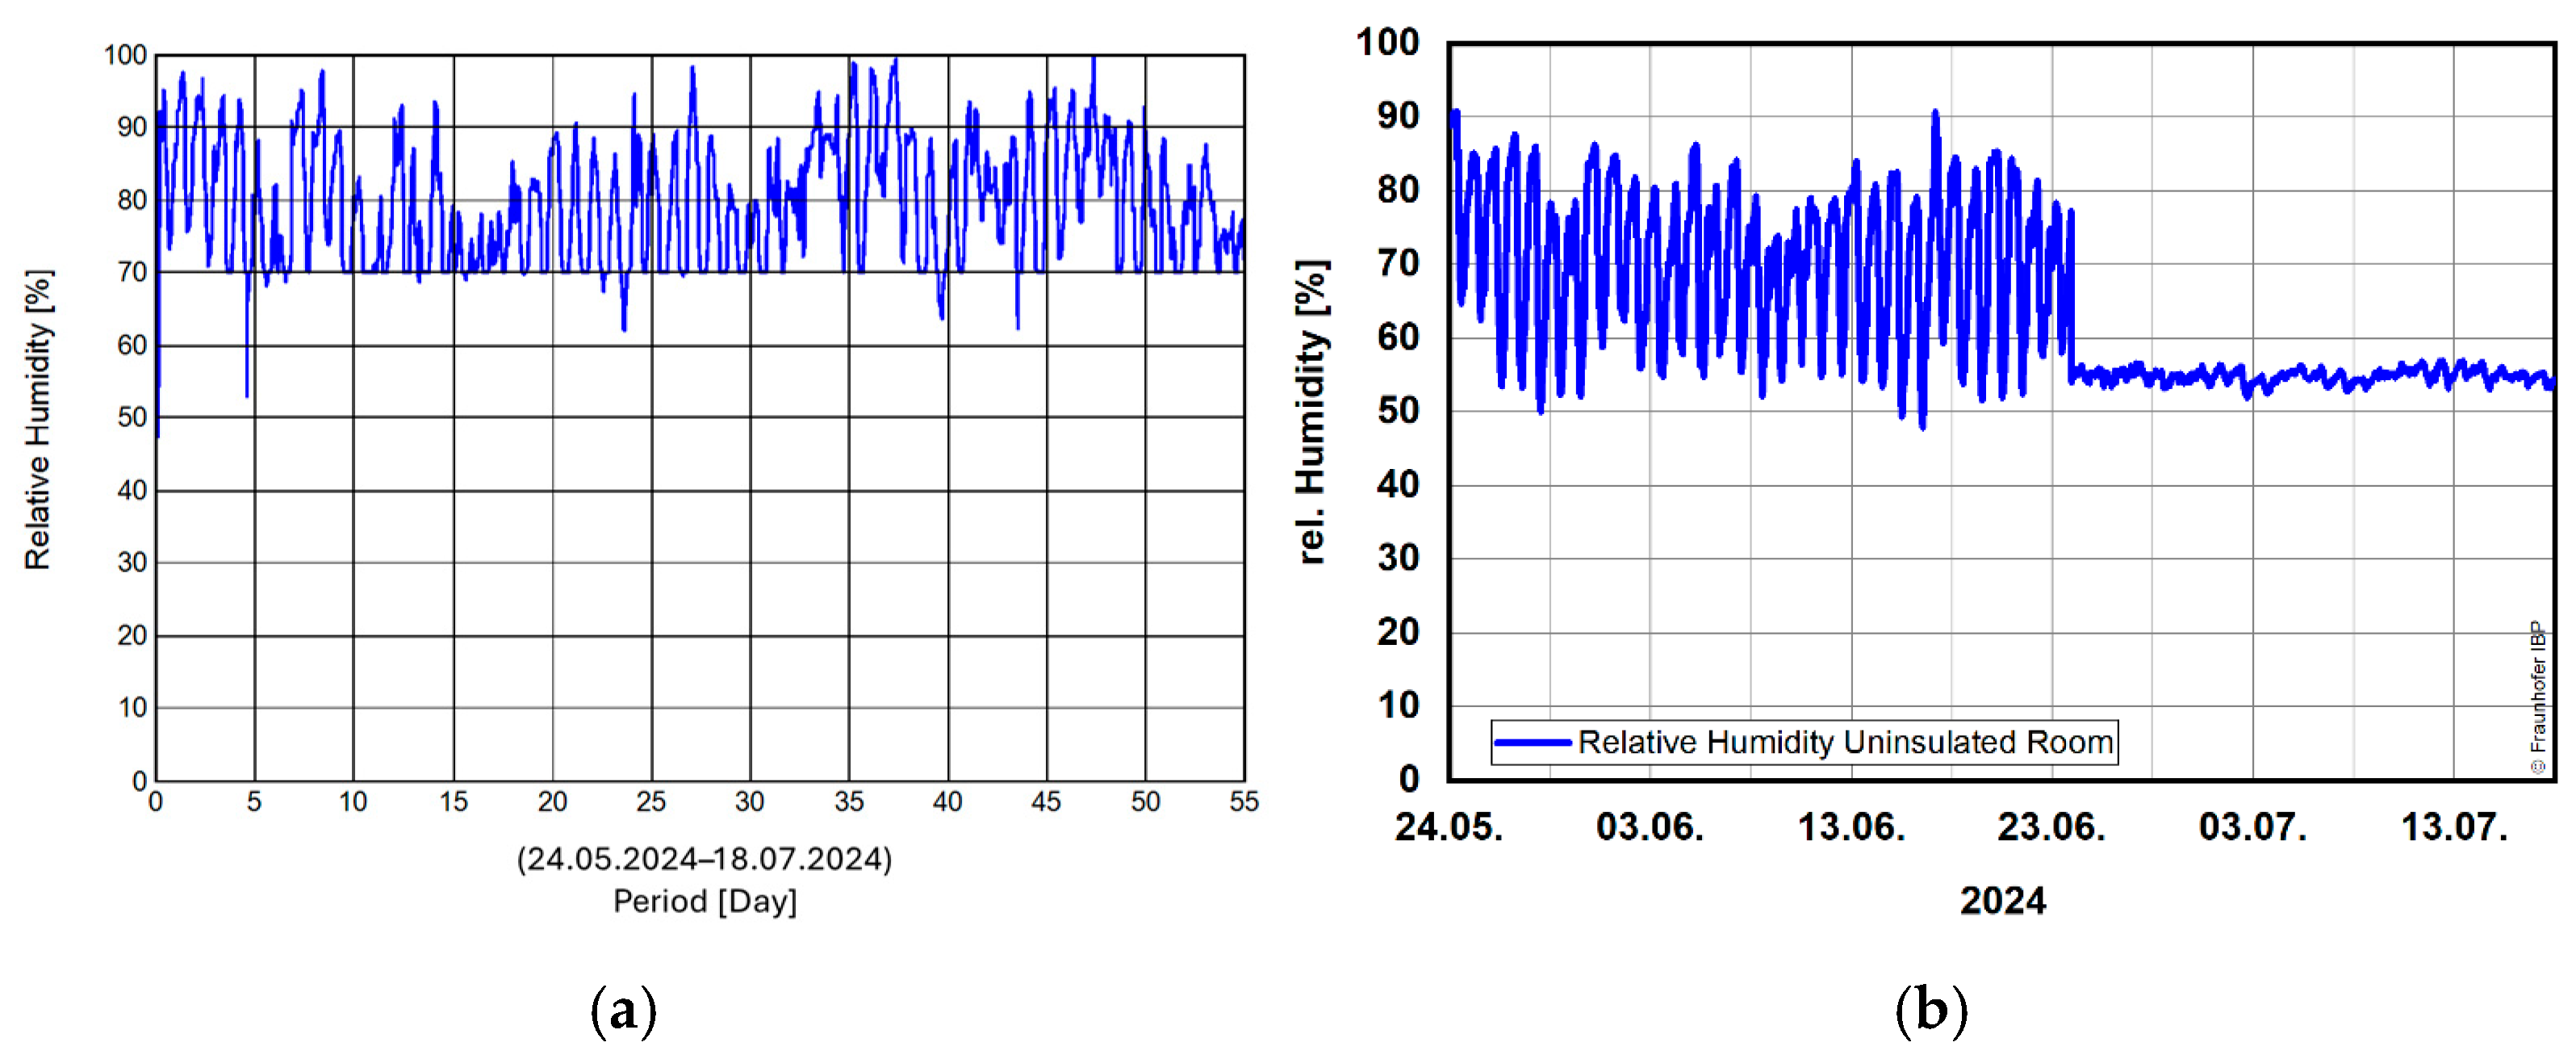
For the uninsulated room, the validation with the measurement data is significantly more difficult, as this room is much leakier. A good approximation of the measurement results of the test house assumes an air exchange rate of 10 1/h, a dehumidification of 2.87 kg/h, and a cooling capacity of 2.1 kW.
Figure 12 shows the relative humidity in the uninsulated room from the measurement data
(b) (from June 23rd, measurement failure of the humidity sensor), and the evaluation of the simulation from WUFI
®-Plus
(a). Both curves exhibit roughly similar fluctuations over the observed period. Even if the deviation could be decreased, this indicates that the changes in room air humidity captured by the assumptions in the simulation were well represented.
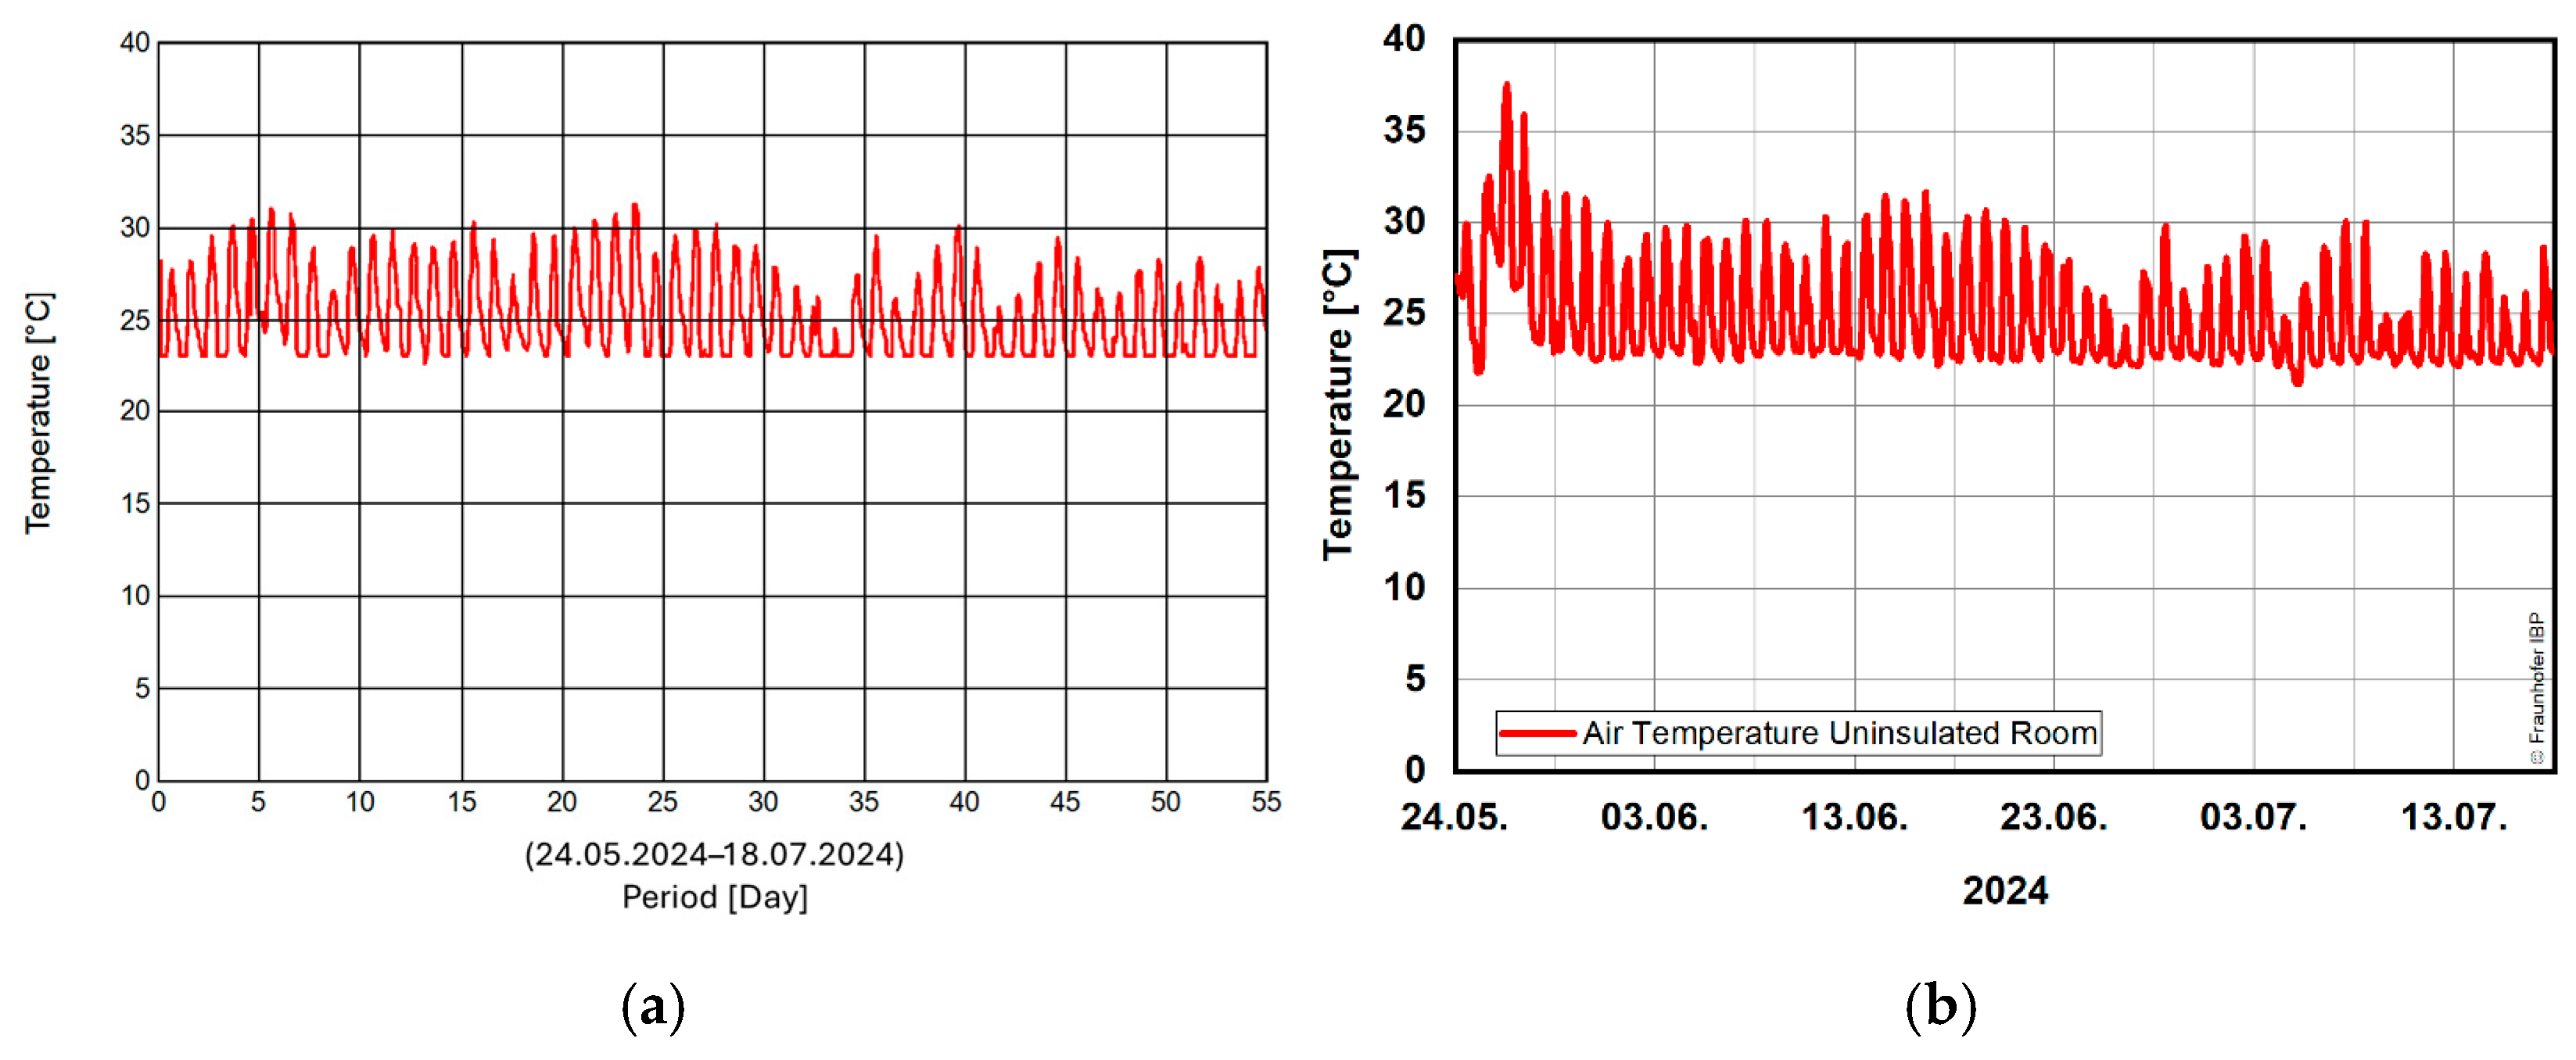
Figure 13 shows the measured and simulated temperature courses of the uninsulated room. In particular, good agreement is observed because of the assumption of an air exchange rate of 10 1/h.
As shown in
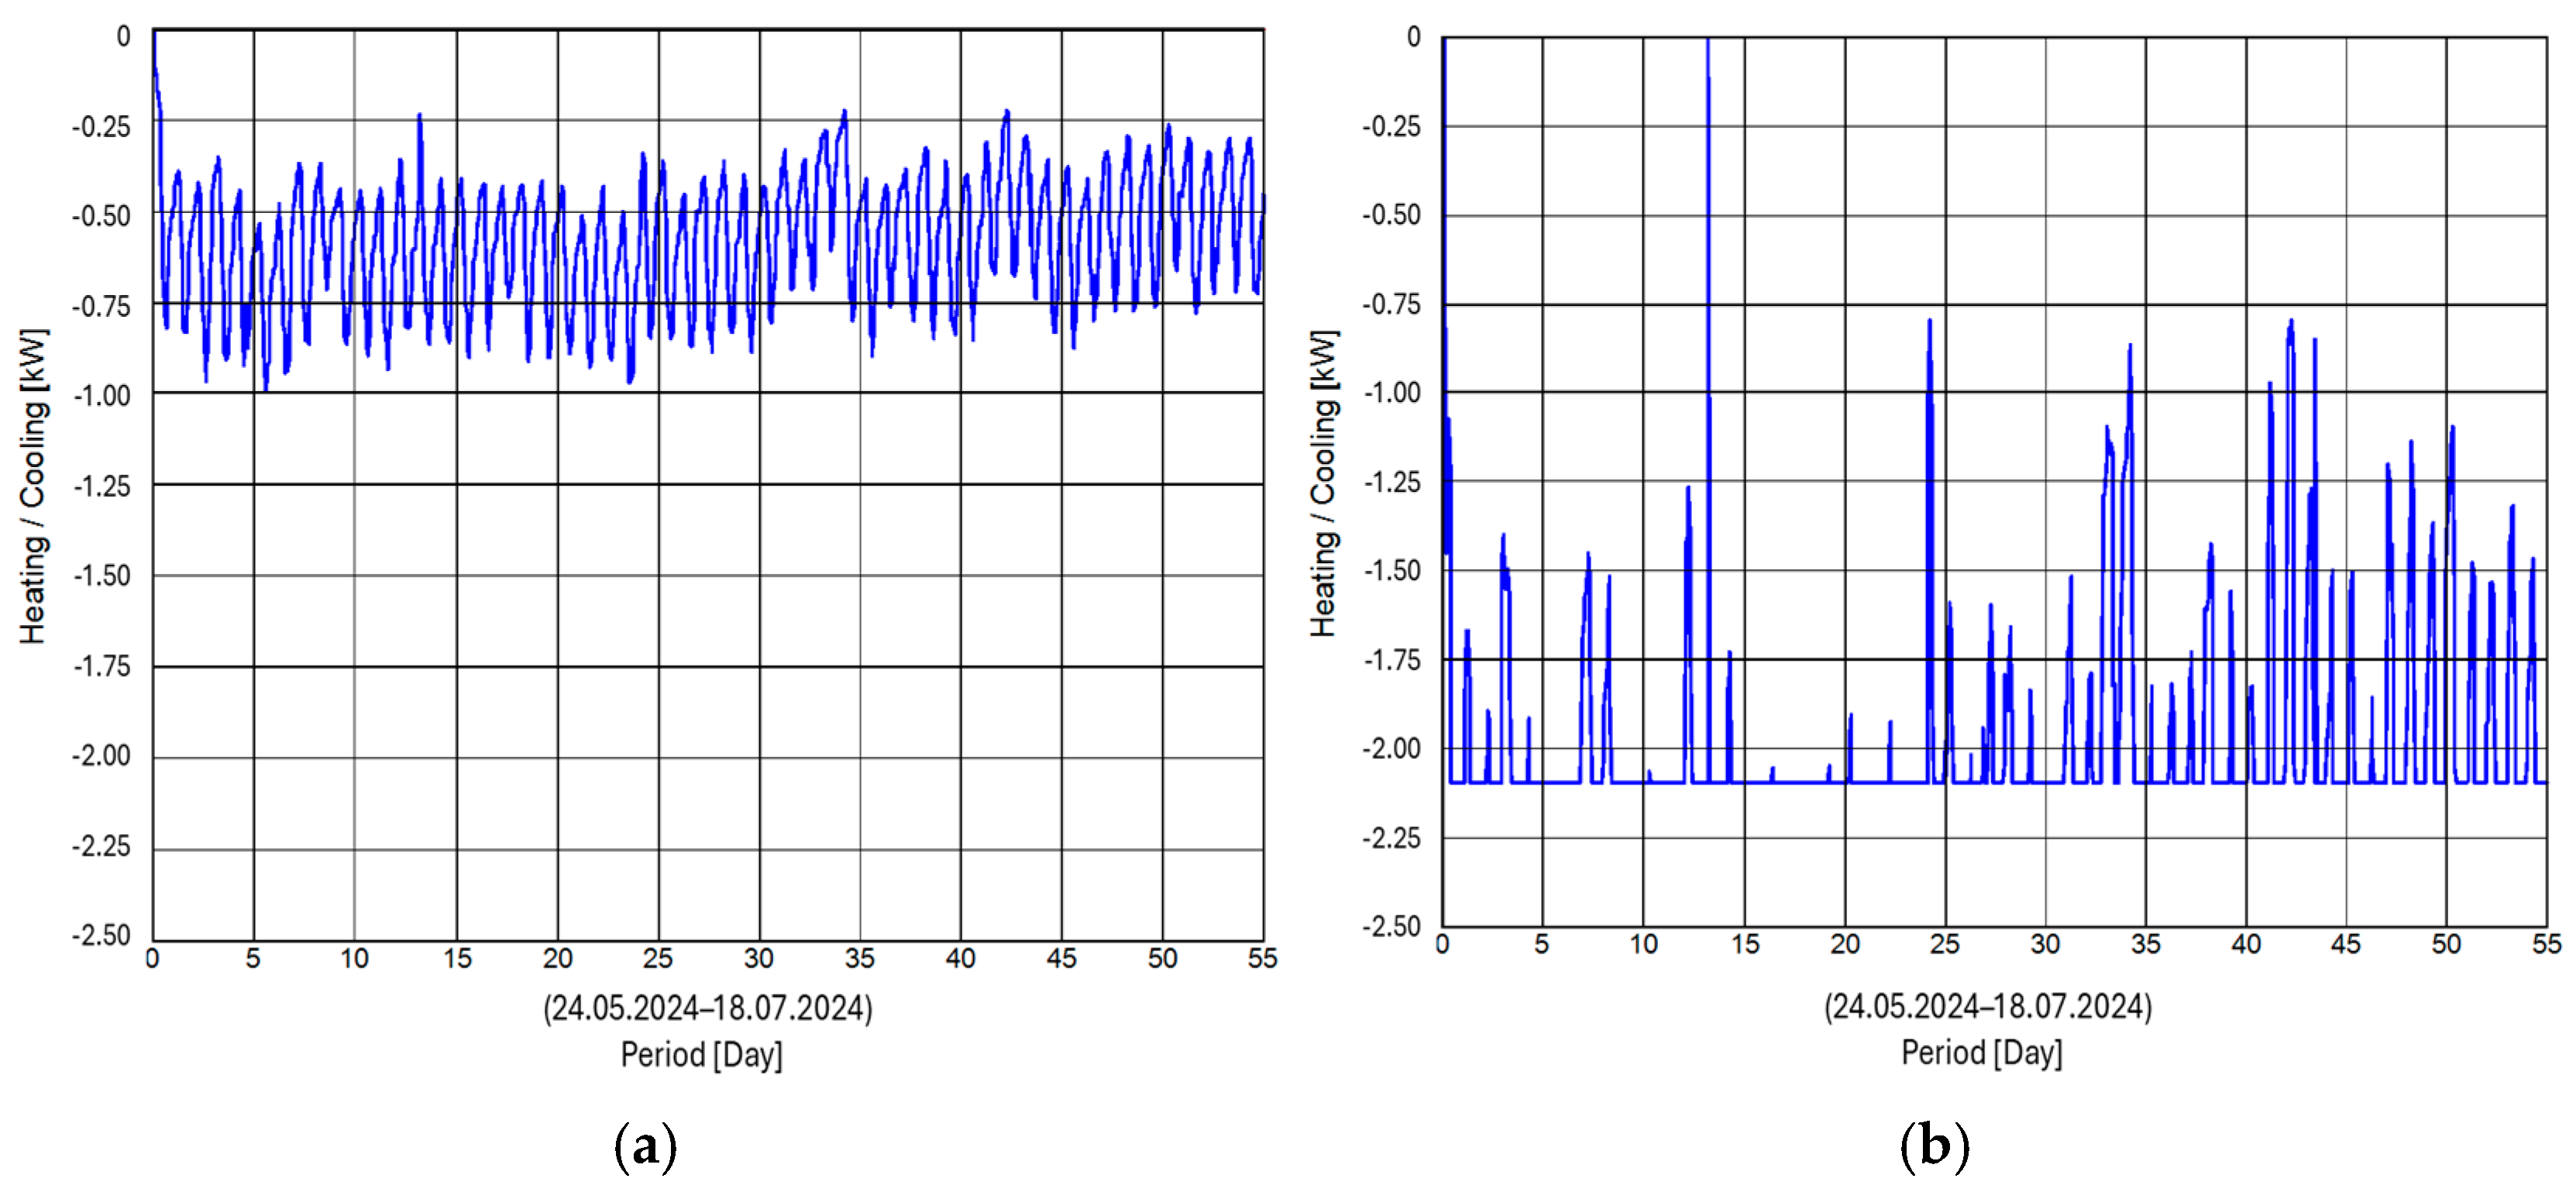
Figure 14, the insulated Typha room does not require a maximum capacity of 2.1 kW of the air conditioning system, unlike the uninsulated room. Accordingly, the room temperature in the Typha room was maintained nearly constantly, whereas in the other room, owing to the performance limit of the air conditioning, the target temperature was frequently exceeded.
3.2.2. Calculation Variants and Results
After achieving a relatively good agreement between the calculation results and measurement data, the following variants were calculated:
Both rooms are not air-conditioned.
A wooden ceiling is installed in the uninsulated room without air-conditioning.
Both rooms are inhabited by two people who leave for work in the morning and return home in the evening.
Variant 1: Both Rooms Are Not Air-Conditioned
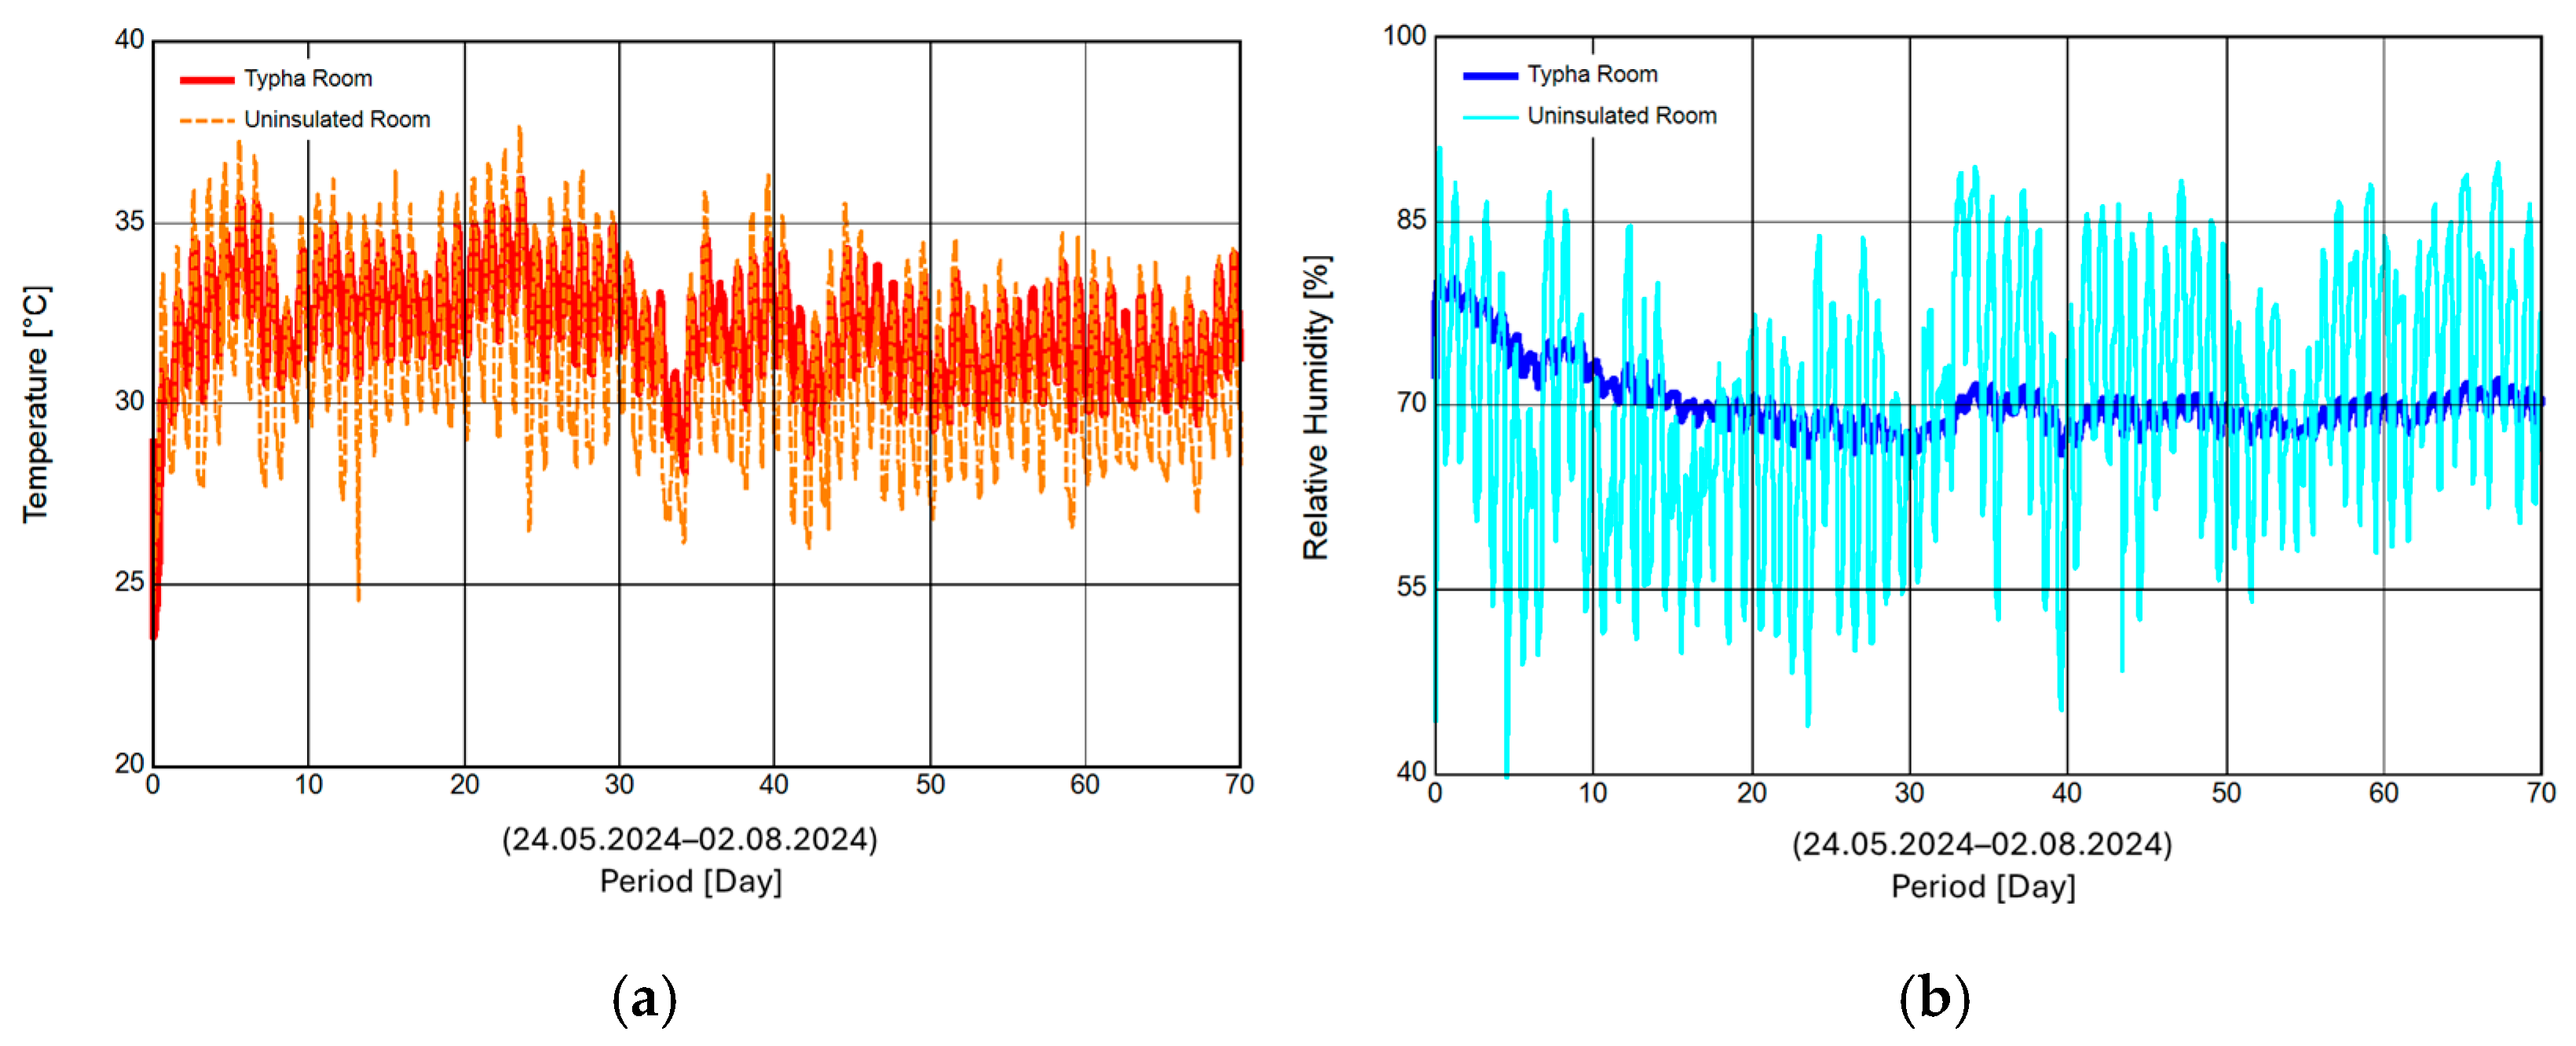
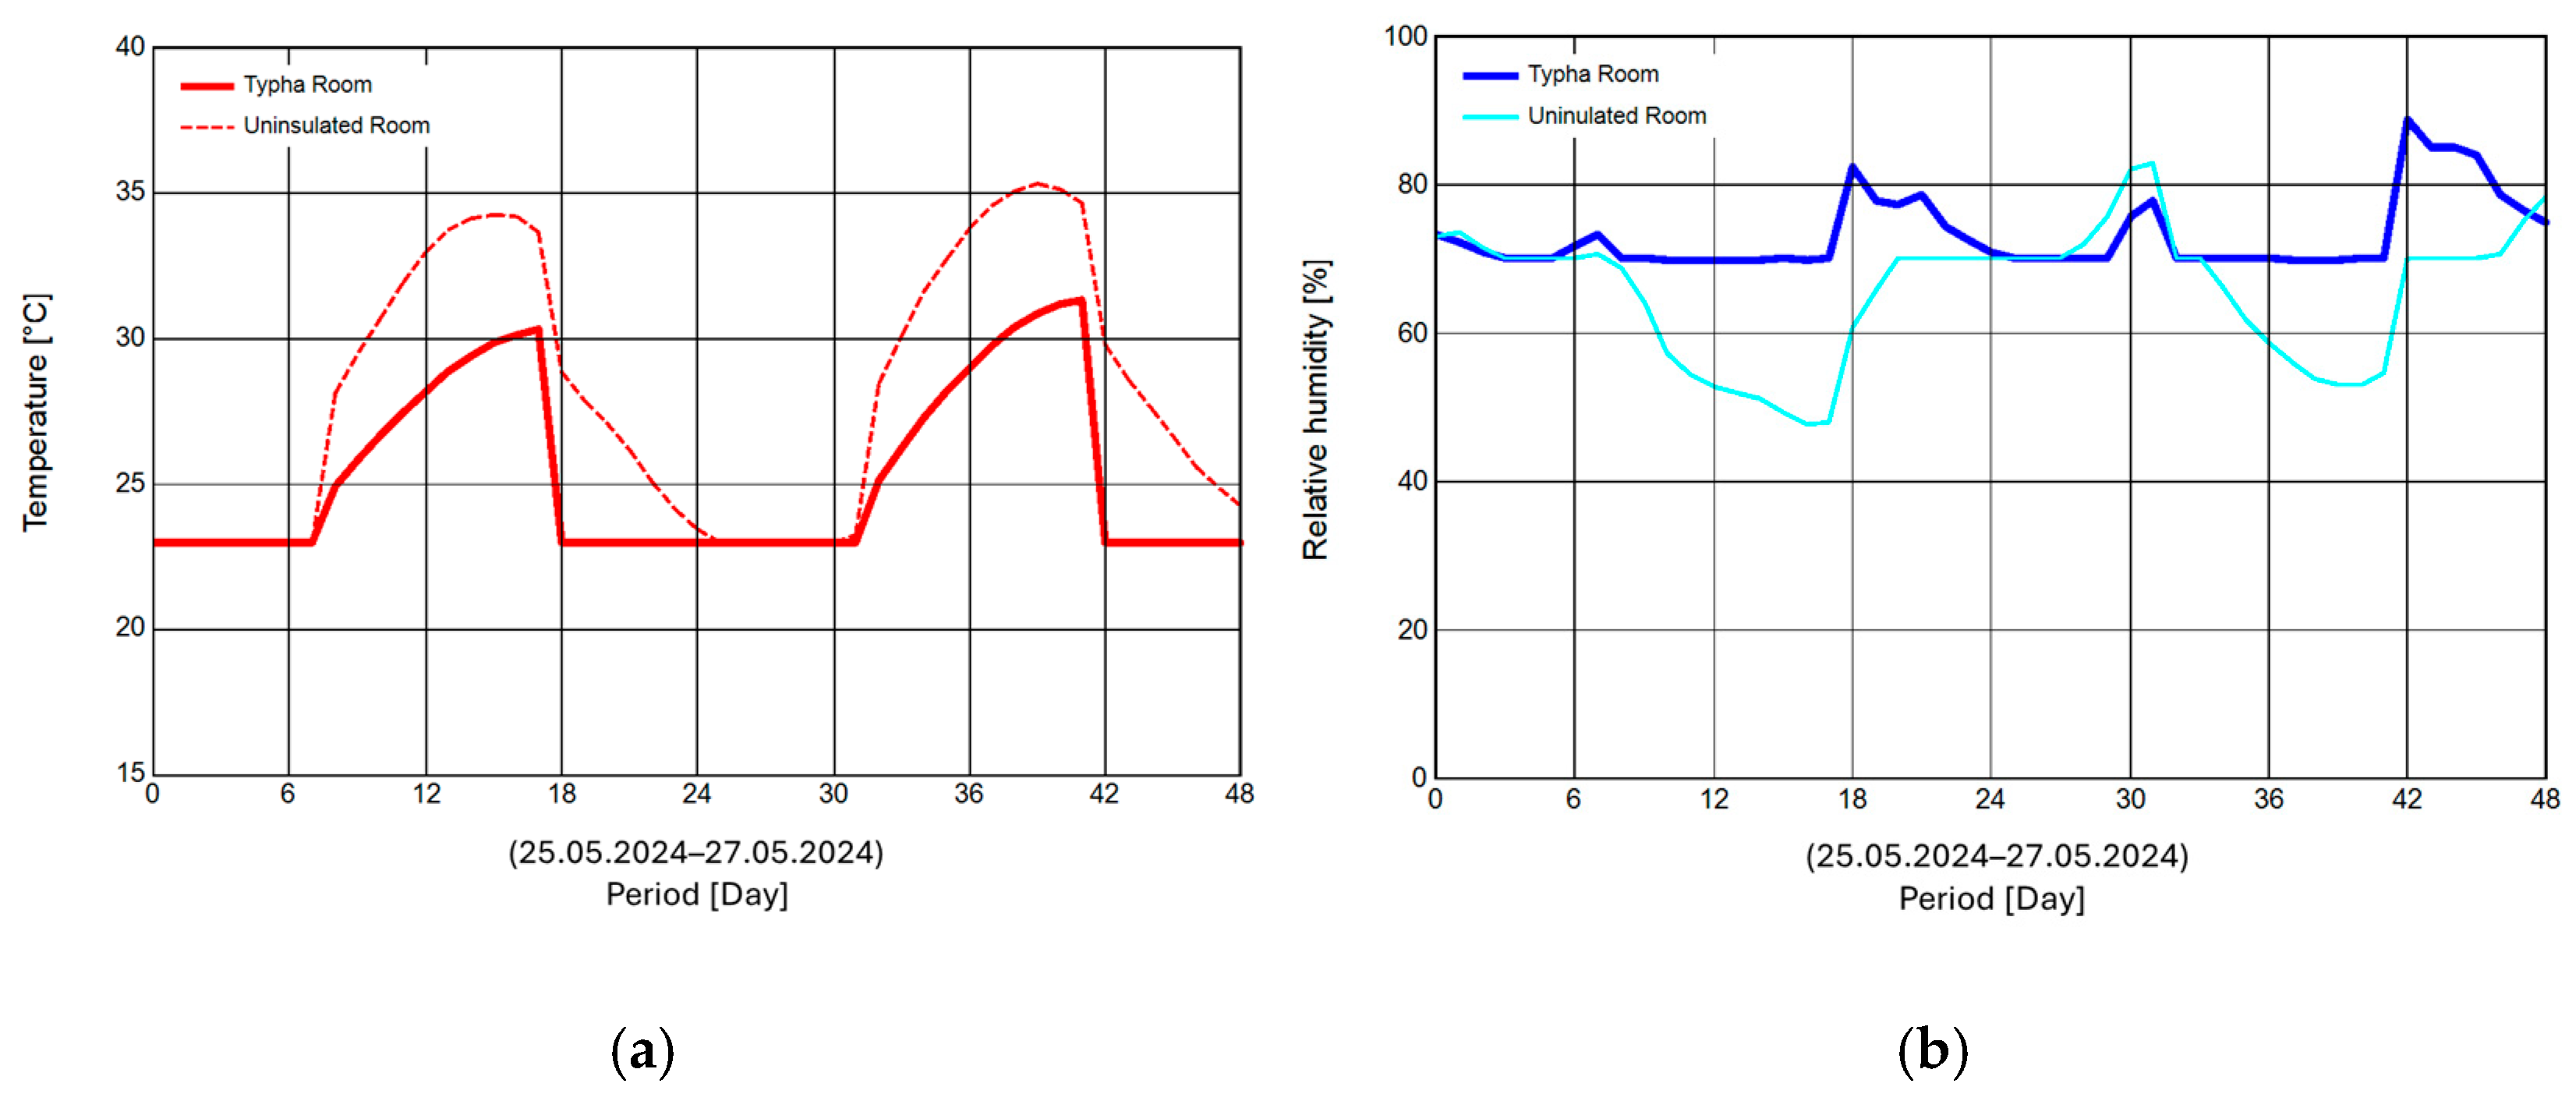
Figure 15a shows that the temperature in the Typha room (thick red line) can rise to approximately 36 °C without air conditioning. The fluctuations indicate the daily temperature increase and nightly temperature drop. Comparing this temperature profile with the outdoor temperature in
Figure 7, it can be observed that the indoor temperature also exhibits fluctuations, but these are less extreme than the outdoor temperature and exhibit a more stable course. In the uninsulated room (thin line), the indoor temperatures fluctuate daily between 24.5 °C and 39 °C. A large amount of heat is absorbed during the day and released at night. This is expected in a room without insulation and with high air exchange rates.
The relative humidity of the uninsulated room in
Figure 15b (thin blue line) fluctuates between 40% RH and exceptionally high 90% RH. In contrast, because of the lower temperature fluctuations and the high sorption capacity of the Typha building material, the fluctuations in the Typha room (thick line) are very small, although on average the same indoor air humidity is present.
Variant 2: Wooden Ceiling in the Uninsulated Room
Through the metal roof covering, a considerable amount of heat energy enters the uninsulated room during the day due to solar radiation. The installation of a wooden false ceiling, assumed to be 4 cm thick for the calculation, could significantly reduce this effect, which will be demonstrated through hygrothermal simulation for this room.
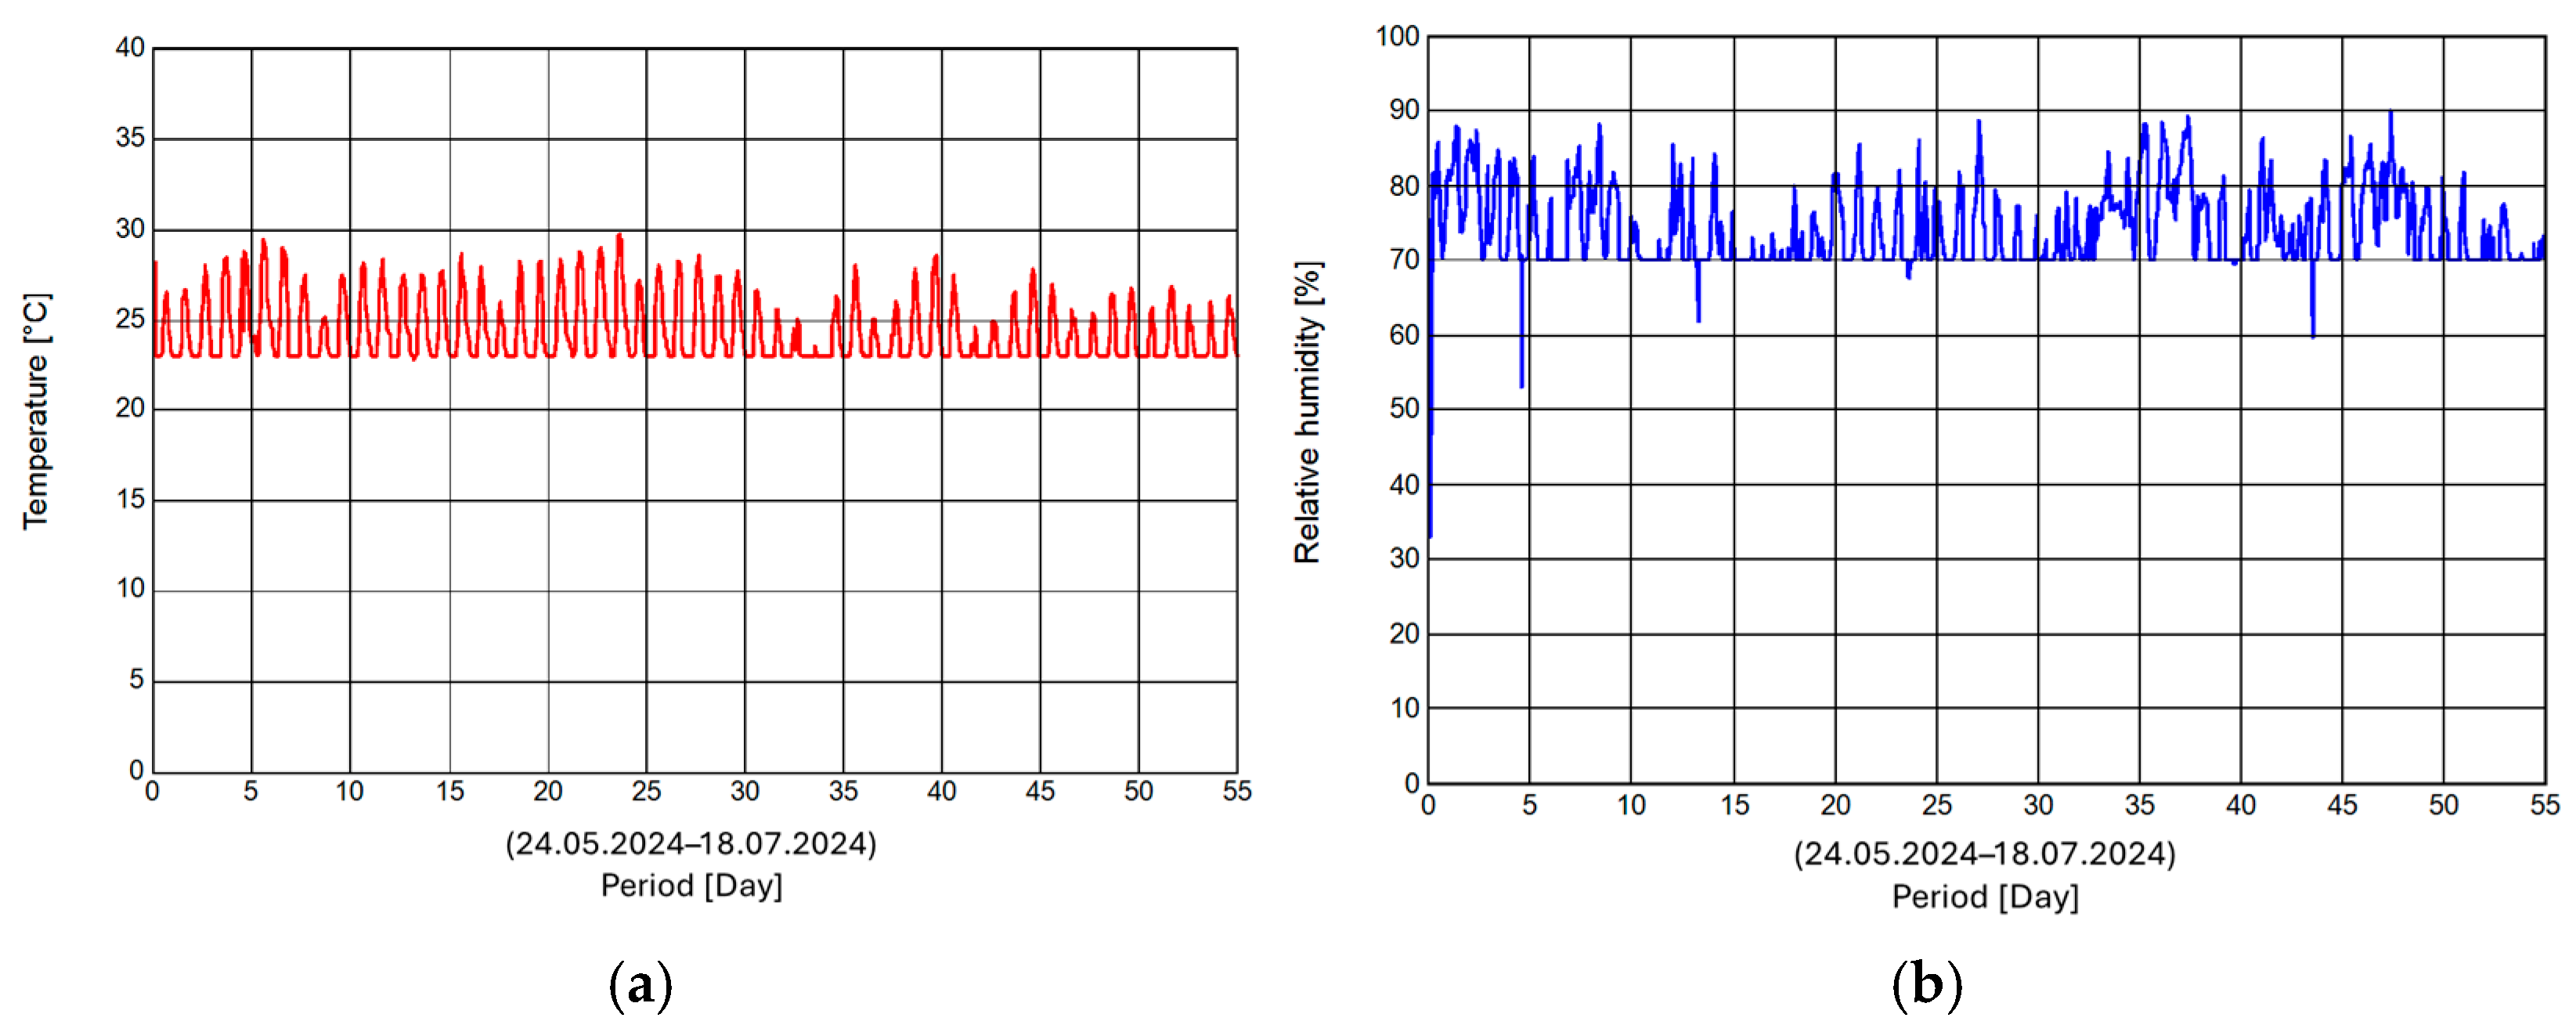
Figure 16a shows the indoor temperature profile with the wooden ceiling installed in the uninsulated room. It can be seen that the temperature profile with the wooden ceiling is somewhat more stable, whereas without the wooden ceiling, the temperature fluctuations are more pronounced (compared to
Figure 13a). With the installation of the wooden ceiling, temperatures of approximately 29 °C are only reached once during the observation period, while the temperatures otherwise settle between 23 °C and approximately 27 °C. With the current state, without the wooden ceiling, temperatures exceeding 30 °C are reached several times. It is clear that the installation of a wooden ceiling results in less extreme and more uniform temperature fluctuations. Although a more constant indoor temperature compared to the current state is achieved, the general peak load during extreme heat cannot be completely prevented. Fluctuations in relative humidity are also significantly reduced (
Figure 16b, compared to
Figure 12a). The relative humidity now remains below 90%.
Variant 3: Inhabited Rooms in Daily Life
To see how the Typha room behaves climatically in daily life compared to the uninsulated room, this variant was conducted, in which both rooms are inhabited by two people each from 6 p.m. to 8 a.m. To obtain a realistic depiction of room behavior, it must be considered that in the presence of individuals, windows and doors are opened from time to time. It is assumed that both rooms are ventilated between 6 a.m. and 8 a.m. and between 6 p.m. and 8 p.m. During these times, the air exchange rate is 20 1/h. During the remaining time, the air exchange rate in the uninsulated room is 10 1/h and that in the insulated room is 0.3 1/h. The air conditioning is controlled to operate only when individuals are present. Outside of these times, the air conditioning is turned off.
To show the effect of insulation on comfort,
Figure 17 illustrates the daily course over two consecutive days for a period with high nighttime outdoor temperatures of 28 to 30 °C (May 25th and 26th). In the insulated Typha room, after closing the windows, the room air temperature quickly drops to the target temperature and remains at this temperature until the air conditioning is turned off (
Figure 17a, thick red line). The temperature in the uninsulated room decreases slowly, reaching the desired room temperature of 23 °C shortly before the air conditioning is turned off (thin orange line). Even during the day, without people present, higher temperatures are reached in the uninsulated room.
Heat insulation has an even more pronounced effect on the course of room air humidity. While the relative humidity remains quite stable at 70% relative humidity with only a slight increase during ventilation in the insulated room, the uninsulated room exhibits an extensive fluctuation range for this period, ranging from 50 to 80% relative humidity.
As expected, the calculated cooling demand for the insulated room is 3413 kWh per year, which is significantly lower than that in the uninsulated room with 8374 kWh per year. Additionally, the condensation heat required for the dehumidification of the rooms in the respective air conditioning system is accounted for, which amounts to 2257 kJ or 0.627 kWh per liter of condensate. The simulation yields a calculated annual condensate amount of 1805 L for the insulated room and nearly ten times (16,964 L) for the uninsulated room. Summing the annual energy demand for dehumidification of 1132 kWh for the Typha room and 10,636 kWh for the uninsulated room to the cooling demand results in a total of 4545 kWh and 19,010 kWh, respectively. The fact that the uninsulated room requires more than four times the energy is attributed not only to the reduced heat transmission losses due to insulation but also to the significantly lower infiltration air exchange rates.
4. Summary
To demonstrate the positive impact of internal thermal insulation of typical Thai wooden houses (in this case with Typha boards), a test house consisting of two rooms was built on the campus of King Mongkut’s University in Bangkok: one room is insulated with Typha boards while the other room remains uninsulated. Using a whole-building simulation tool and measurements of room temperature and humidity, the thermal conditions in the two rooms were compared.
After successful validation of the calculations, various variants were computationally investigated with the following results:
Both rooms are not air-conditioned
On average, comparable temperatures are found in both rooms. However, the daily fluctuation in the insulated room is much lower than in the uninsulated room, resulting in significantly lower daily peak values. In addition, the nightly cooling is less pronounced, which can be counteracted and improved by night ventilation. An even greater difference is observed regarding relative room air humidity. While it remains largely constant at approximately 70% in the insulated room, the other room exhibits a significant fluctuation from 40% to over 90% relative humidity.
A wooden ceiling is installed in the uninsulated room
The installation of a wooden ceiling significantly reduces the temperature fluctuations because the solar energy input through the metal roof is considerably dampened. Although a more constant indoor temperature compared to the current state is achieved, the general peak load during extreme heat cannot be completely prevented. Overall, the installation of a wooden ceiling represents a significant improvement in comfort.
Both rooms are inhabited by 2 people during the night
In the insulated Typha room, after closing the windows, the room air temperature quickly drops to the target temperature with the operation of the air conditioning and remains at this temperature until the air conditioning is turned off. The temperature in the uninsulated room (without a wooden ceiling) decreases more slowly and reaches the desired 23 °C shortly before the air conditioning is turned off. Moreover, during periods of daytime absence, higher temperatures are recorded in the uninsulated room. Insulation has an even more pronounced influence on the course of room air humidity. While it remains nearly constant at 70% relative humidity in the insulated room, the uninsulated room exhibits a significant fluctuation range for this period, ranging from below 50% to over 80% relative humidity.
5. Conclusions
The simulation results demonstrate that the use of Typha insulation boards can not only improve thermal comfort in traditional Thai wooden houses but also drastically reduce energy consumption and associated costs. In the simulated use case, the energy consumption for HVAC for the insulated room is only ca. 20–25% of that for the uninsulated room. In the experimental setup of the Typha test house, the installed air conditioning was not powerful enough to maintain the target temperature in the uninsulated room. With an appropriately powerful system, the difference would be even larger. This is attributed not only to the reduced heat transmission losses due to insulation but also to the significantly lower infiltration air exchange rates. Especially in tropical regions like Thailand, where air conditioning is essential, Typha offers a sustainable and cost-effective solution for energy saving and improved indoor comfort.
The Typha board used here can be employed not only for existing structures [
10,
11,
16,
17], but also for simple, cost-effective buildings [
18] due to its combination of insulation properties and strength, while also providing good fire protection. With further developments in Typha-based building materials, a variety of additional applications are possible [
19]. In principle, for environmental protection reasons, building materials made from renewable resources, preferably sourced from the region, should be used on a significantly larger scale.
Overall, the studies show that historic buildings can be preserved if they are sufficiently adapted to today’s usage requirements. With the help of hygrothermal calculations, the most economical option can be determined in many cases, and renovation damage can be avoided.
In principle, the results can of course also be applied to other historic buildings [
20,
21]. Even though this example involves a special type of building constructed entirely of wood, the basic findings also apply to the energy-efficient renovation of other historic buildings, such as half-timbered houses and buildings made of mineral materials, with different energy issues depending on construction type and climatic location. Since every energy-efficient renovation also has a major impact on the moisture balance, it is essential to check the long-term suitability and damage-free condition of historic buildings in particular, e.g., by means of suitable hygrothermal calculations. Such calculations allow very different renovation measures to be compared and evaluated, not only in terms of damage-free construction but also in terms of achieving the desired results.
Preserving cultural heritage in general, and identity-forming local vernacular buildings in particular, is of great importance not only for tourism but also for the preservation of national identity. The best way to preserve these buildings in the long term is to continue using them. Not all historically important buildings can be converted into museums. The most common form of continued use will always be to continue using these buildings as private buildings, adapted as far as possible to current comfort requirements.
Unfortunately, experience shows that short- or long-term failures occur time and again during measurement data acquisition. However, this does not mean that the measurement data is unsuitable for validating the calculation, provided that there is a sufficiently long uninterrupted data acquisition period. In the present case, measurement data covering a period of more than 50 days could be used, with the exception of the measurement data for relative humidity in the uninsulated room, where only 4 weeks were available due to a sensor failure. Since there is good agreement over the respective measurement periods, it can be assumed that the simulation reflects reality with good accuracy.
6. Outlook
For hygrothermal calculations, the infiltration air exchange rates, which significantly influence the results, could only be estimated computationally. Future measurements should be conducted on-site to better adjust the calculations. Owing to the lack of measuring devices, no assessment of the actual energy consumption of the cooling devices, the dehumidification performance, as well as the air pollutants in the building, has yet been made. The latter is a crucial factor in regions such as Chiang Mai, which are exposed to high concentrations of fine dust during the “burning season”.
For a more comprehensive validation of the simulation, it is recommended that the measurement campaign should be continued, supplemented by the above-mentioned additional measurements.
Another central point is the durability and functionality of the insulation in humid climate zones. Because northern Thailand has a tropical monsoon climate with high humidity, the question arises as to how the Typha insulation will react to prolonged moisture influences, even though it shows good resistance to moisture.



 ,
,