1. Introduction
The operational domain of internal logistics within hospitals is increasingly complex, and efficiency, precision, and safety are of great importance. The need to autonomously manage the transportation processes of materials, such as drugs, biological samples, linens, meals, and special waste, is a strategic priority for modern healthcare facilities. Therefore, hospitals must find solutions to increase efficiency and productivity to be able to treat more patients without increasing costs. Optimizing and automating logistics processes is the best solution for increasing operational efficiency, reducing the risk of human error, and freeing healthcare workers from non-clinical tasks, allowing them to focus on patient care. In this context, automated guided vehicles (AGVs) are a key technology, capable of autonomously and reliably managing material flows within the hospital environment. Thanks to recent advances in autonomous navigation, AGV technology, originally developed for industrial plants, has been transferred to the healthcare sector, achieving positive results. And it is in this context that Pathfinder is introduced, a prototype self-driving vehicle for hospital logistics, which represents a combination of the latest cutting-edge technologies for autonomous navigation [
1].
To optimize the design of AGV systems, a multidisciplinary approach that integrates different disciplines would be useful. Hospitals are extremely complex organisms, subject to unpredictable variations such as restricted areas due to hazards, such as temporarily congested corridors, elevators under maintenance, or restricted access areas for sterilization procedures [
2]. For this reason, it is necessary to study paths that consider the three-dimensionality of the building rather than relying solely on a two-dimensional analysis of floor plans. However, the effective implementation of AGVs faces a fundamental computational challenge: defining trajectories that are not only cost-optimal but also optimal with respect to the dynamic nature of the hospital environment.
To overcome these limitations, this study leverages Building Information Modeling (BIM) and the interoperable Industry Foundation Class (IFC) standards to create a virtual representation enriched not only with geometric information, but also with semantic data describing the nature and function of each model element. This wealth of information is essential for creating an accurate navigation model that can be queried and updated in real time.
Several studies have investigated the integration of BIM and IFC models with path planning and optimization algorithms for indoor navigation and autonomous vehicles, including AGVs. Existing research has demonstrated the potential of BIM-based environments to support shortest path calculation, obstacle avoidance, and path optimization through graph- or grid-based representations. However, many of these approaches are limited to simplified spatial configurations, single-storey environments, or rely primarily on geometric proximity rather than fully exploiting the semantic structure of the IFC standard. The present study differs from existing contributions for the following reasons. First, it adopts an IFC-centric approach to graph construction, explicitly exploiting standardized semantic relationships to build scalable navigation networks in highly complex, multi-level hospital buildings, while remaining independent of proprietary BIM platforms. Secondly, particular attention is paid to the management of vertical connections, such as lifts, allowing for a consistent analysis of multistorey paths within a unified structure. Thirdly, the proposed workflow combines graph-based static path optimization with agent-based simulation, using Pathfinder as a validation environment. Thanks to the combination of IFC semantic modelling, scalable graphics and multi-level navigation analysis, the research contributes to the creation of an interoperable framework for planning the routes of AGVs in hospital logistics.
The study is divided into six sections.
Section 2 reviews the relevant literature on graph theory and path analyses and optimization metrics.
Section 3 highlights the critical issues that have emerged.
Section 4 presents the methodology applied to the case study and illustrates the tools used, namely Topologic for spatial modeling, IfcOpenshell [
3] in Bonsai for IFC data management, and Pathfinder for path simulation and analysis.
Section 5 reports the results obtained. Finally,
Section 6 reports the conclusions of the work.
2. State of the Art
2.1. Spatial Complexity and Indoor Navigation
The analysis of the spatial structure of a building is a significant topic for indoor navigation [
4]. The spatial complexity of large buildings such as hospitals, airports, or large shopping malls makes the management of internal pedestrian flows a critical issue. Efficiently managing routes is highly important, as it enables effective safety management for the people moving within the building, even in emergency situations. For this reason, BIM is an important tool, providing both spatial and semantic data sources about the building. Using graph theory, it is possible to exploit the information contained in the digital model to create navigable networks between spaces.
2.2. Graph Theory for Spatial Optimization
Path planning in complex indoor environments such as hospitals finds a solid foundation in graph theory. A graph consists of nodes, which represent entities, and edges, which connect pairs of nodes and represent their connections. Graph theory, therefore, provides a mathematical approach to modeling that allows the visualization of related concepts and their quantitative analysis. The origin of this approach date back to Euler [
5], and its contemporary application follows a principle analogous to the one he introduced. Mathematically, a graph can be formally described as an ordered pair
G = (
V,
E), where
V is the set of vertices and
E is the set of edges that define their connections. Edges can be directed, meaning they have direction, indicating a one-way link from one vertex to another; in this case the graph is referred to as directed. Otherwise, the connections may be bidirectional, and the graph is defined as undirected. In some cases, arcs are associated with a numerical value, called weight, which can represent quantitative characteristics of the connection, such as distance or cost.
2.3. Extraction and Definition of Paths in BIM and IFC Models
Graph theory therefore implies a representation of the model composed of two-dimensional elements: nodes that identify the location of spaces and lines that identify the connections, the interdependencies between the elements of the project. For this reason, the necessary information must be extracted from the model to improve the management and analysis of such building data. Transposing the geometric and spatial logic of a building into a graph structure is a crucial methodological step. Building Information Models (BIM), and particularly the IFC data, serves as a rich information container rich in data regarding the geometry of the elements and the spatial relations that interconnect them. IFC can play a dual role: on the one hand, it provides the nodes of the graph as spatial entities, on the other, it provides the edges as connection relationships between them. The effectiveness of path analysis is a cornerstone for smart building development, where the physical space and digital information are seamlessly synchronized to enhance user safety and operational efficiency.
2.3.1. Geometry-Based Methods (Topologic)
The geometry-based approach focuses on identifying spaces and their contiguity. This method involves generating navigation networks starting from the physical geometry of the building element. Within this approach, both grid-based maps and topological maps can be identified [
4]. The grid-based model is a well-established approach for indoor spatial representation and consists of creating a grid of regular cells each of which is assigned a binary state of “navigable” or “non-navigable” [
2]. Specifically, a cell is defined as “navigable” (or free) when it represents an empty space that can be safely traversed by the AGV, whereas a cell is “non-navigable” (or occupied) when it coincides with physical barriers, such as walls, columns, or permanent equipment, that prevent movement. Topological models, on the other hand, represent the building as an abstract graph, where nodes correspond to spaces or significant points and edges represent the connections or adjacencies between them. This approach is generally more efficient for computing paths in large spaces. Current technologies that extract the topological map are mainly based on several geometric manipulation techniques, including Visibility Graph [
6,
7,
8], Medial Axis Transformation (MAT) and Straight Skeletons (SS) [
4,
6], Generalized Voronoi Graphs (GVG), Delaunay Triangulation (DT) [
4] and Constrained Delaunay Triangulation (CDT) [
9].
To overcome the limitations of individual methods, research has moved towards hybrid approaches that combine the strengths of grid-based and topological models, or towards more advanced modeling paradigms. An example is the hybrid map called grid-topological map proposed by Zhou et al. [
4] where an algorithm is introduced to generate the topological map directly from the grid map. Through Non-Manifold Topology (NMT) Jabi and Chatzivasileiadi [
10] propose a library called Topologic that overcomes the intrinsic topological limitations of traditional BIM models. This approach has also been explored in synergy with Artificial Intelligence: Jabi et al. [
11] used Topologic with Reinforcement Learning (RL) for the dynamic and optimized assessment of fire escape routes in the early design stages.
Although BIM allows closed spaces to be indirectly inferred through the position of physical components, the accuracy of this inference depends on the correct connectivity between the components themselves. So, while BIM focuses primarily on the physical representation of building components, Topologic offers a topological model that prioritizes spatial definition and the relationship between interior and exterior spaces. This perspective reflects the approach of Aish and Pratap [
12] who consider architecture as the envelope of space, treating the interior of a solid body as an enclosed void to support early spatial analysis.
2.3.2. IFC-Based Data Management Methods (Data-Driven Approach)
A Data-Driven approach focuses on extracting and analyzing the semantics and relational structures contained in the IFC open standard to build navigable models, often in graph form, that facilitate information optimization and querying [
13,
14]. The main goal of this approach is to transform the IFC model into a directed graph
G(V, E), according to the hierarchical structure defined by the IFC EXPRESS scheme [
15,
16].
One of the first contributions in this direction is the work of Khalili and Chua [
17], who described a new scheme, called Graph Data Model (GDM), specifically designed to extract, analyze and present topological relationships between 3D objects based on the semantic content of the IFC. This model uses the principles of weighted graphs to automatically infer topological relationships. The literature also presents a methodology that enables the complete and automated transformation of IFC models into a labelled property graph, using Neo4j as the reference framework [
14]. Through this workflow, evacuation path analysis within a building is developed. Path construction can be achieved by exploiting two different relationships: the BoundedBy relationship that connects the IfcSpace and IfcDoor entities and the RelatingSpace relationship that defines the adjacency between two IfcSpace entities. Further contributions focus on the development of methodologies for converting IFC databases into graph structures, with particular attention to representing the spatial organization of building models. In this context, one research direction proposes guidelines for the transformation of BIM models into graphs through formalized conversion rules [
18], while another is oriented towards the definition of frameworks capable of extracting geometric and topological information from models developed in Autodesk Revit [
13]. Even without explicitly translating the model into a graph structure, these approaches place emphasis on representing relationships between construction elements through BIM and IFC data, contributing to a more structured and relational understanding of the building model. The IFC can be integrated with ontology to create a Semantic Geometric Network Model (SGNM) [
19]. This establishes a mapping relationship between IFC entity types and ontology classes. Ontology, as a tool based on the OWL (Web Ontology Language), provides powerful logical reasoning capabilities, which are used to dynamically update node accessibility based on real-time information from IoT sensors or fire simulations.
2.4. Path Analysis and Optimization Metrics
Path analysis is a fundamental problem that involves tracing the optimal path between two spatial points, avoiding collisions with obstacles. Path analysis methods are generally divided into global planning and local planning algorithms [
20]. Global algorithms, such as A* [
21] and Dijkstra [
22], are capable of identify the shortest path to the goal. Path analysis is based on graph search algorithms that exploit the connectivity and distance information provided by the model [
23].
Dijkstra’s algorithm is one of the most well-established solutions for finding the minimum path in weighted graphs. Starting from a source node, the algorithm systematically explores all reachable nodes, each assigned a distance value representing the known cumulative minimum cost to reach it. In each iteration, the unvisited node with the lowest cost is selected, and the values of adjacent nodes are updated based on the cost of the edge connecting them. The process continues until the destination node is reached or all nodes have been visited; in the latter case, the desired path does not exist [
4,
24].
The A* algorithm is a heuristic evolution of Dijkstra, designed to improve efficiency in finding the minimum path. It retains the progressive exploration approach but introduces an additional term in the search function: an estimate of the missing cost to reach the destination, called the heuristic. Soltani et al. [
25] in the context of route planning on construction sites, conducted a performance evaluation of the two algorithms highlighting how Dijkstra’s algorithm is the optimal solution, but it is slower than the A* algorithm, which is significantly more efficient and faster.
2.4.1. Enhanced A* Algorithms and BIM Integration for Autonomous Vehicles
In addition to traditional algorithms, literature has developed variants that improve performance. Xianwei et al. [
26] propose an improvement of the A* algorithm, introducing a weighting coefficient to modulate the relative contribution between the true path cost and the eucharistic estimate. An improved A* algorithm is also proposed with the aim of reducing energy consumption and path length and minimizing the number of turns, thanks to a weighting factor that favors the expansion of the nodes closer to the target, hereby accelerating algorithm convergence [
27].
Such optimizations are crucial in the context of route planning for self-driving vehicles (UGVs/AGVs) in complex environments. Research has explored the integration of these algorithms with BIM to increase navigation effectiveness. For navigation of construction robots, a method has been developed that uses Dynamo to extract essential BIM data and combines it with an Improved A* Algorithm that incorporates the dimensional constraints of the robot and building elements for obstacle avoidance [
28]. Similarly, a BIM-based global planning system has been proposed that employs a UGV-centered A* (UGV-centric A*) algorithm capable of considering vehicle configuration and mobility, demonstrating a 100% success rate in congested environments [
29]. Other improvements to A* focus on speed and route quality. The EBHSA* (Efficient and Robust Enhanced A*) algorithm uses Bidirectional Search and Expansion Distance to dramatically reduce execution time compared to traditional A* [
30]. Furthermore, to address issues of unstable speed and collisions caused by an excessive number of turns, the A* algorithm can be enhanced by incorporating path smoothing techniques, such as the use of Bézier curves [
31].
2.4.2. Simulation and Optimization for Fire Safety
In the field of emergency management and safety optimization, BIM provides the geometric knowledge base and the essential non-graphical metadata required for evaluating evaluate risk scenarios. For example, a simulation and evacuation assessment framework has been proposed based on the integration of BIM, Fire Dynamics Simulator (FDS), and Agent-Based Modeling (ABM) has been proposed to analyze critical parameters, improving fire safety in complex environments [
32]. The approach also extends to optimizing preventive measures at the design stage: Sabbaghzadeh et al. [
33] developed a BIM-based solution that employs a custom metaheuristic algorithm to identify the location and optimal combination of safety measures to maximize the percentage of surviving occupants while considering budget constraints.
2.4.3. Real-Time Navigation and Navigable Models Derived from BIM/IFC
Recent developments in modeling and path analysis extend to the use of real-time data for navigation in complex and dynamic environments, particularly during emergencies. At the data level, the IFC format is recognized as a rich source of 3D geometry, spatial semantics, and topological relationships essential for indoor navigation [
34]. To address the complexity of BIM buildings and reduce computational costs on portable devices, lightweight approaches have been proposed. For example, one method uses a multilayer network that decomposes the building into local interior spaces and portal nodes, limiting the online computation to path search only within the origin and destination spaces [
35]. Integration with real-time data is crucial for crisis management. A real-time navigation platform based on BIM has been proposed for disaster response. This methodology creates a dynamic weighted graph that combines the static semantic information of BIM with real-time dynamic data [
36].
2.4.4. BIM-IFC with IoT for Logistics Optimization
The integration of BIM, via the IFC standard, with the IoT represents an advanced frontier of Logistics 4.0, creating a responsive digital ecosystem that overcomes the limitations of isolated models. The addition of IoT sensors transforms BIM into a Digital Twin [
37], enabling real-time monitoring of AGVs, inventory, environmental conditions and occupancy levels. Thanks to efficient protocols such as MQTT, physical data are synchronized with the digital model, enabling immediate visualization, analysis and decision-making. This integration facilitates fast and efficient warehouse management systems, where RFID acts as a means of exchanging information for real-time inventory reporting and resource allocation. In the context of off-site construction, BIM and IoT enable real-time data synthesis, optimizing production processes and distributed logistics planning. The dynamic data collected allows for the application of optimization approaches based on graph theory. For example, a warehouse can be digitized as a network of nodes and arcs, where the nodes represent the intersections of the aisles and the arcs represent the paths that can be travelled by vehicles. Thanks to this representation, it is possible to calculate the optimal route for forklift trucks in real time, reducing distances travelled and overall operating times [
38]. The adoption of an integrated BIM-IoT approach for logistics offers concrete advantages in terms of Lean Construction, reducing waste, improving traceability and transparency, and optimizing costs and times [
39].
2.5. Agent-Based Simulations
Path analysis within a construction model can also be performed through agent-based simulations. ABM is a computational approach that plays a crucial role in dynamic simulations for path validation, particularly in complex scenarios such as fire evacuation analysis and indoor logistics planning [
40,
41]. The defining characteristic of an agent is its ability to make autonomous decisions; this requires agents to be active components rather than purely passive entities [
42]. Among the computational tools for path analysis, Pathfinder 2009 software is one of the most widely adopted, particularly in the fields of safety engineering and emergency management. It is especially used for evaluating escape routes and optimizing evacuation plans in complex buildings such as hospitals [
43,
44].
2.6. Design of an AGV System in Healthcare Environments
The flow system includes all those activities that connect different spaces within the facility, involving movements, interactions, and the transport of people, materials, and information. The management of this system is related to aspects such as accessibility, safety, comfort and functionality aimed at ensuring operational efficiency. In the case of a hospital, the flow system is particularly complex, as it includes distinct pathways for different categories of users: outpatients and inpatients, healthcare personnel, and visitors. Furthermore, these pathways are influenced not only by practical and logistical requirements, but also by human needs [
45]. Hospital logistics plays a fundamental strategic role in ensuring operational efficiency and improving the level of service offered to patients. The optimization of physical and informational flows of both sanitary and non-sanitary materials, from procurement to internal distribution, directly contributes to reducing operating costs and improving the quality and timeliness of care. In addition to pathways for patients, staff, and visitors, there are dedicated flows for transporting medications, medical devices, clean linens, meals, and waste. These movements must occur efficiently and safely, minimizing errors and delays. In recent years, an increasing number of hospitals have adopted automated transport systems such as AGVs [
46,
47]. These vehicles, programmed to move along pre-established routes, enable the transport of materials between warehouses, hospital pharmacies, departments, and operating rooms, reducing staff workload and ensuring timely deliveries. The introduction of automated transport systems therefore represents an important opportunity to streamline flow management within the hospital, contributing to improving both to an improvement in service quality and to the rationalization of operational costs.
2.7. Dynamic Route Planning for AGVs
Dynamic path planning represents a crucial element in logistics, aimed at optimizing the movement of goods within complex environments. It enables the integration of temporal information to respond effectively to operational changes, such as the sudden appearance of obstacles. The use of Deep Reinforcement Learning (DRL) allows AGVs to operate as intelligent agents capable of learning optimal paths through continuous interaction with the environment. Scalable models have been developed that integrate Reinforcement Learning (RL) with existing logistics systems, enabling the optimization of transport distances and the real-time management of AGV fleets, while accounting for practical constraints such as battery lifetime and internal traffic congestion [
48]. Beyond studies focused solely on identifying the shortest paths, literature also investigates trajectories that simultaneously minimize energy consumption, travel time, and collision risk. The resulting paths are not only efficient but also smooth [
49], reducing abrupt acceleration variations and improving both the mechanical efficiency and the lifespan of AGV components. For the coordination of multiple AGVs in complex environments, dynamic prioritization strategies based on a metric known as the “freedom index” have been introduced. This index quantifies the number of available movement options for each robot at each time step. Robots with lower maneuverability are assigned higher priority, thereby reducing the likelihood of conflicts and congestion in confined spaces. Furthermore, a dynamic multi-AGV route planning method based on the optimal time reuse strategy (OTRDP) is also proposed to overcome the limitations of existing dynamic route planning methods, thus optimizing the route as much as possible and avoiding delays due to prolonged calculations [
50].
3. Critical Issues
The methodologies described previously, based on graph theory, were developed to overcome the limitations arising from the constraints imposed by the use of BIM models, due to the proprietary format that affects querying, analysis, and interoperability possibilities. The adoption of graph structures provides an effective tool for representing the construction model, making information more accessible, particularly the relationships between components. This more flexible information management facilitates query operations, spatial analysis, and verification of relationships between components within the model. However, the research and methods analyzed in the framework of graph theory applied to the architectural context present some significant limitations. The first limitation lies in the lack of a three-dimensional analysis that considers the spatial distribution across multiple floors, a fundamental aspect in complex buildings such as hospitals. In particular, the presence of stairs, elevators and other vertical connections introduces complex spatial relationships that are not easily represented. Secondly, there is a lack of attention to the analysis of large buildings, which would require much more detailed spatial discretization to reduce the computational burden. This poses a significant obstacle to the scalability of smart building technologies in complex, large-scale contexts, where operational efficiency is directly linked to the building’s spatial performance. Finally, a critical issue concerns the definition and export of IFC relationships in a uniform manner according to a standard schema valid for any model. Although information is extracted according to the hierarchical structure defined by the standardized IFC EXPRESS scheme, the different modeling approaches adopted in BIM software (Revit 2024) compromise the uniformity of the exported data. This hinders the automation of analysis processes and the reusability of scripts, as each model may require specific adaptations to correctly identify and interpret relationships between components, thereby reducing the effectiveness and interoperability offered by the IFC open format. Promoting vendor-neutral workflows is not only a technical necessity but a strategic requirement for the long-term sustainability and resilience of digital building records.
Considering these challenges, this study aims to develop a method for analyzing AGV paths that takes into account the three-dimensional aspects of the building and its system of connections, including vertical links such as stairs and elevators. The analysis is applied to a hospital building, to evaluate the effectiveness of the method even in complex and large-scale contexts, characterized by high spatial articulation. Furthermore, the study aims to implement a script capable of standardizing, as much as possible, the process of extracting and analyzing information from IFC models, thus ensuring its applicability to a variety of different building models.
4. Methodology
To design an AGV system for managing the internal logistics in the new hospital in Cesena (Italy), which is the subject of study, it is essential to analyze and model the building’s network of pathways within the building. Graph theory proves to be an effective tool for simplifying this network, representing the built environment as a system composed of nodes and edges that describe, respectively, the spaces and connections between them. By focusing on an OpenBIM approach, the workflow ensures that logistical optimization can be integrated into the broader BIM strategy of complex healthcare facilities. A minimum-path analysis is conducted on this graph with the aim of identifying the most efficient solutions for the automated movement of AGV vehicles.
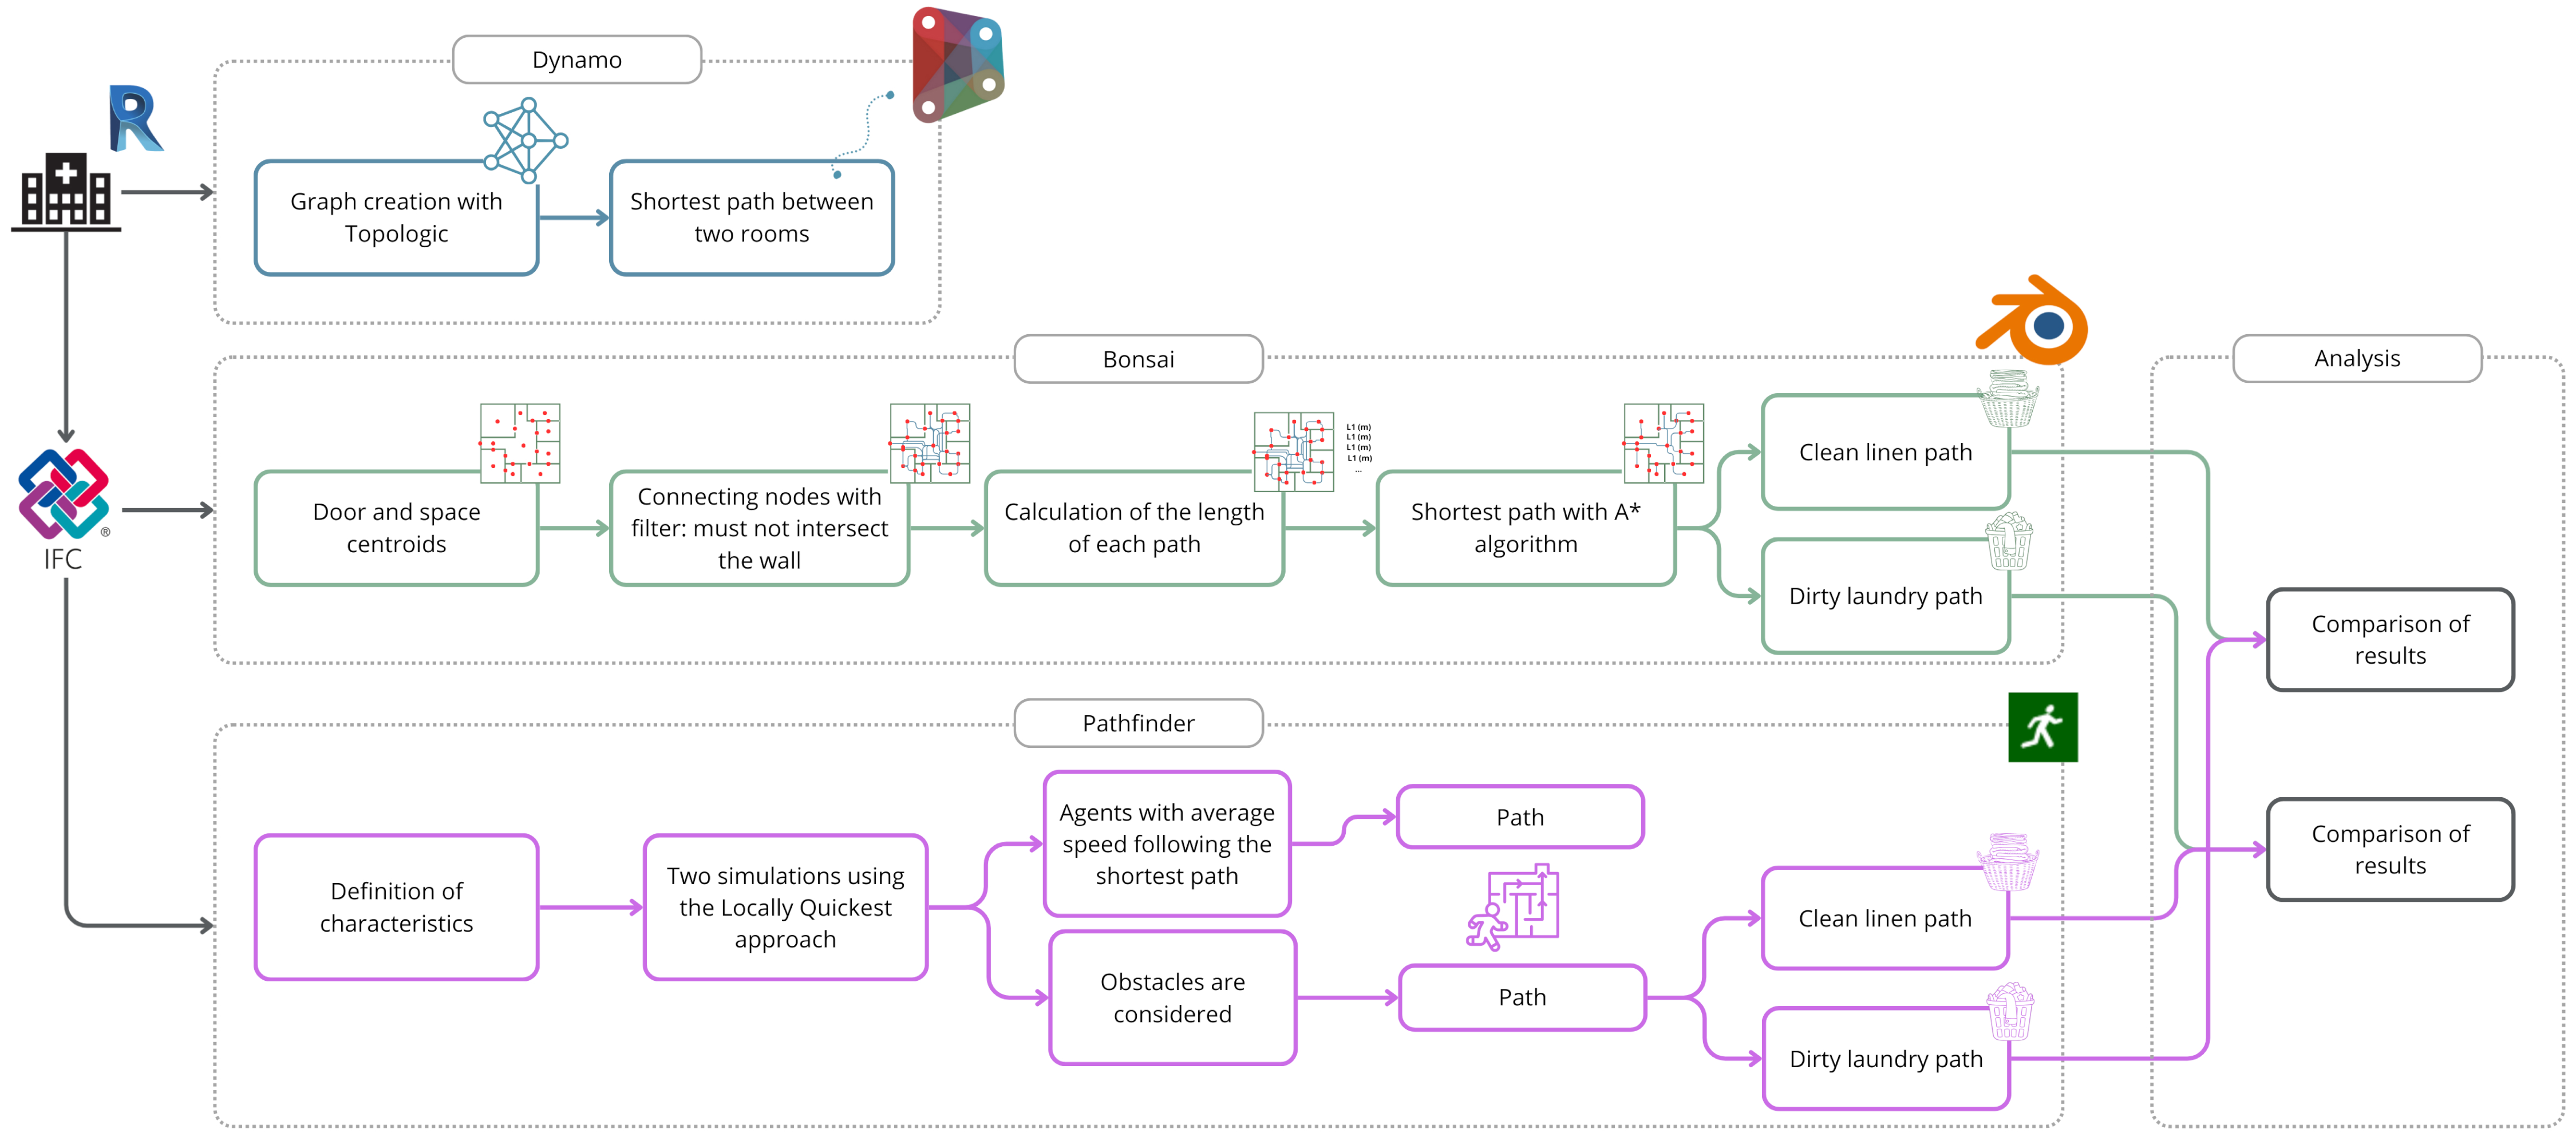
Two distinct approaches are adopted for the construction and analysis of the network (
Figure 1). The first uses Topologic software (version 2.19.3), in which the building model is imported and subsequently processed through a script developed in a visual programming language (VPL). The second is based on the direct analysis of the IFC model, from which spatial and topological information are extracted using a script developed with the IfcOpenShell library. The resulting data are then processed and displayed within Blender’s Bonsai environment, which allows the construction and graphical representation of the internal pathway network of the building.
To support and verify the results obtained with the graph model, Pathfinder, an agent-based simulation software, is also used to compare the calculated paths with those simulated in dynamic scenarios.
4.1. Case Study Description
The case study analyzed in this work is the project for the new hospital in Cesena (Italy). The area involved in the final project, intended to accommodate the hospital complex, covers approximately 18 hectares and is located in the Villa Chiaviche area, north-east of the urban center of Cesena. The building is organized over five floors, four above ground and one underground, along with the technical volumes on the roof and an area designated for the installation of photovoltaic panels on the roof of the central technical space, for a total of seven levels. The structure spans a plan area of approximately 160 × 150 m, allowing for a total capacity of 433 beds. These, integrated with the 33 beds of the current Bufalini Hospital, ensure compliance with the requirements defined by regional planning in terms of accommodation capacity. The building is composed of several buildings, for the purposes of the analyses and as an illustrative example, the methodology was applied to a single block while still maintaining the significance of the results.
4.2. Topologic
The first procedure was developed using Autodesk Revit 2024 as the primary modeling environment. The spatial analysis via Topologic was performed directly on the native .rvt file format through the Dynamo plugin, ensuring direct access to the BIM software’s internal database. In this approach, the traditional textual language of programming functions is translated into a graphical representation. Functions are represented by nodes and are executed through the graphical manipulation of elements, creating a flow of nodes that describes the logical procedure of the script.
Topologic allows simulations of the spatial dynamics of environments within a building by transforming the geometric elements constructed in Revit into non-manifold geometries. In the context of this research, Topologic is used to create a building mapping, transforming it into non-manifold geometry and subsequently applying graph theory. Using this software, a script was developed that could identify the shortest route between two rooms, with the aim of defining the optimal route for AGVs tasked with transporting materials within the hospital.
4.2.1. Identification of Rooms, Definition of Their Respective Geometric Boundaries, and Volume Creation
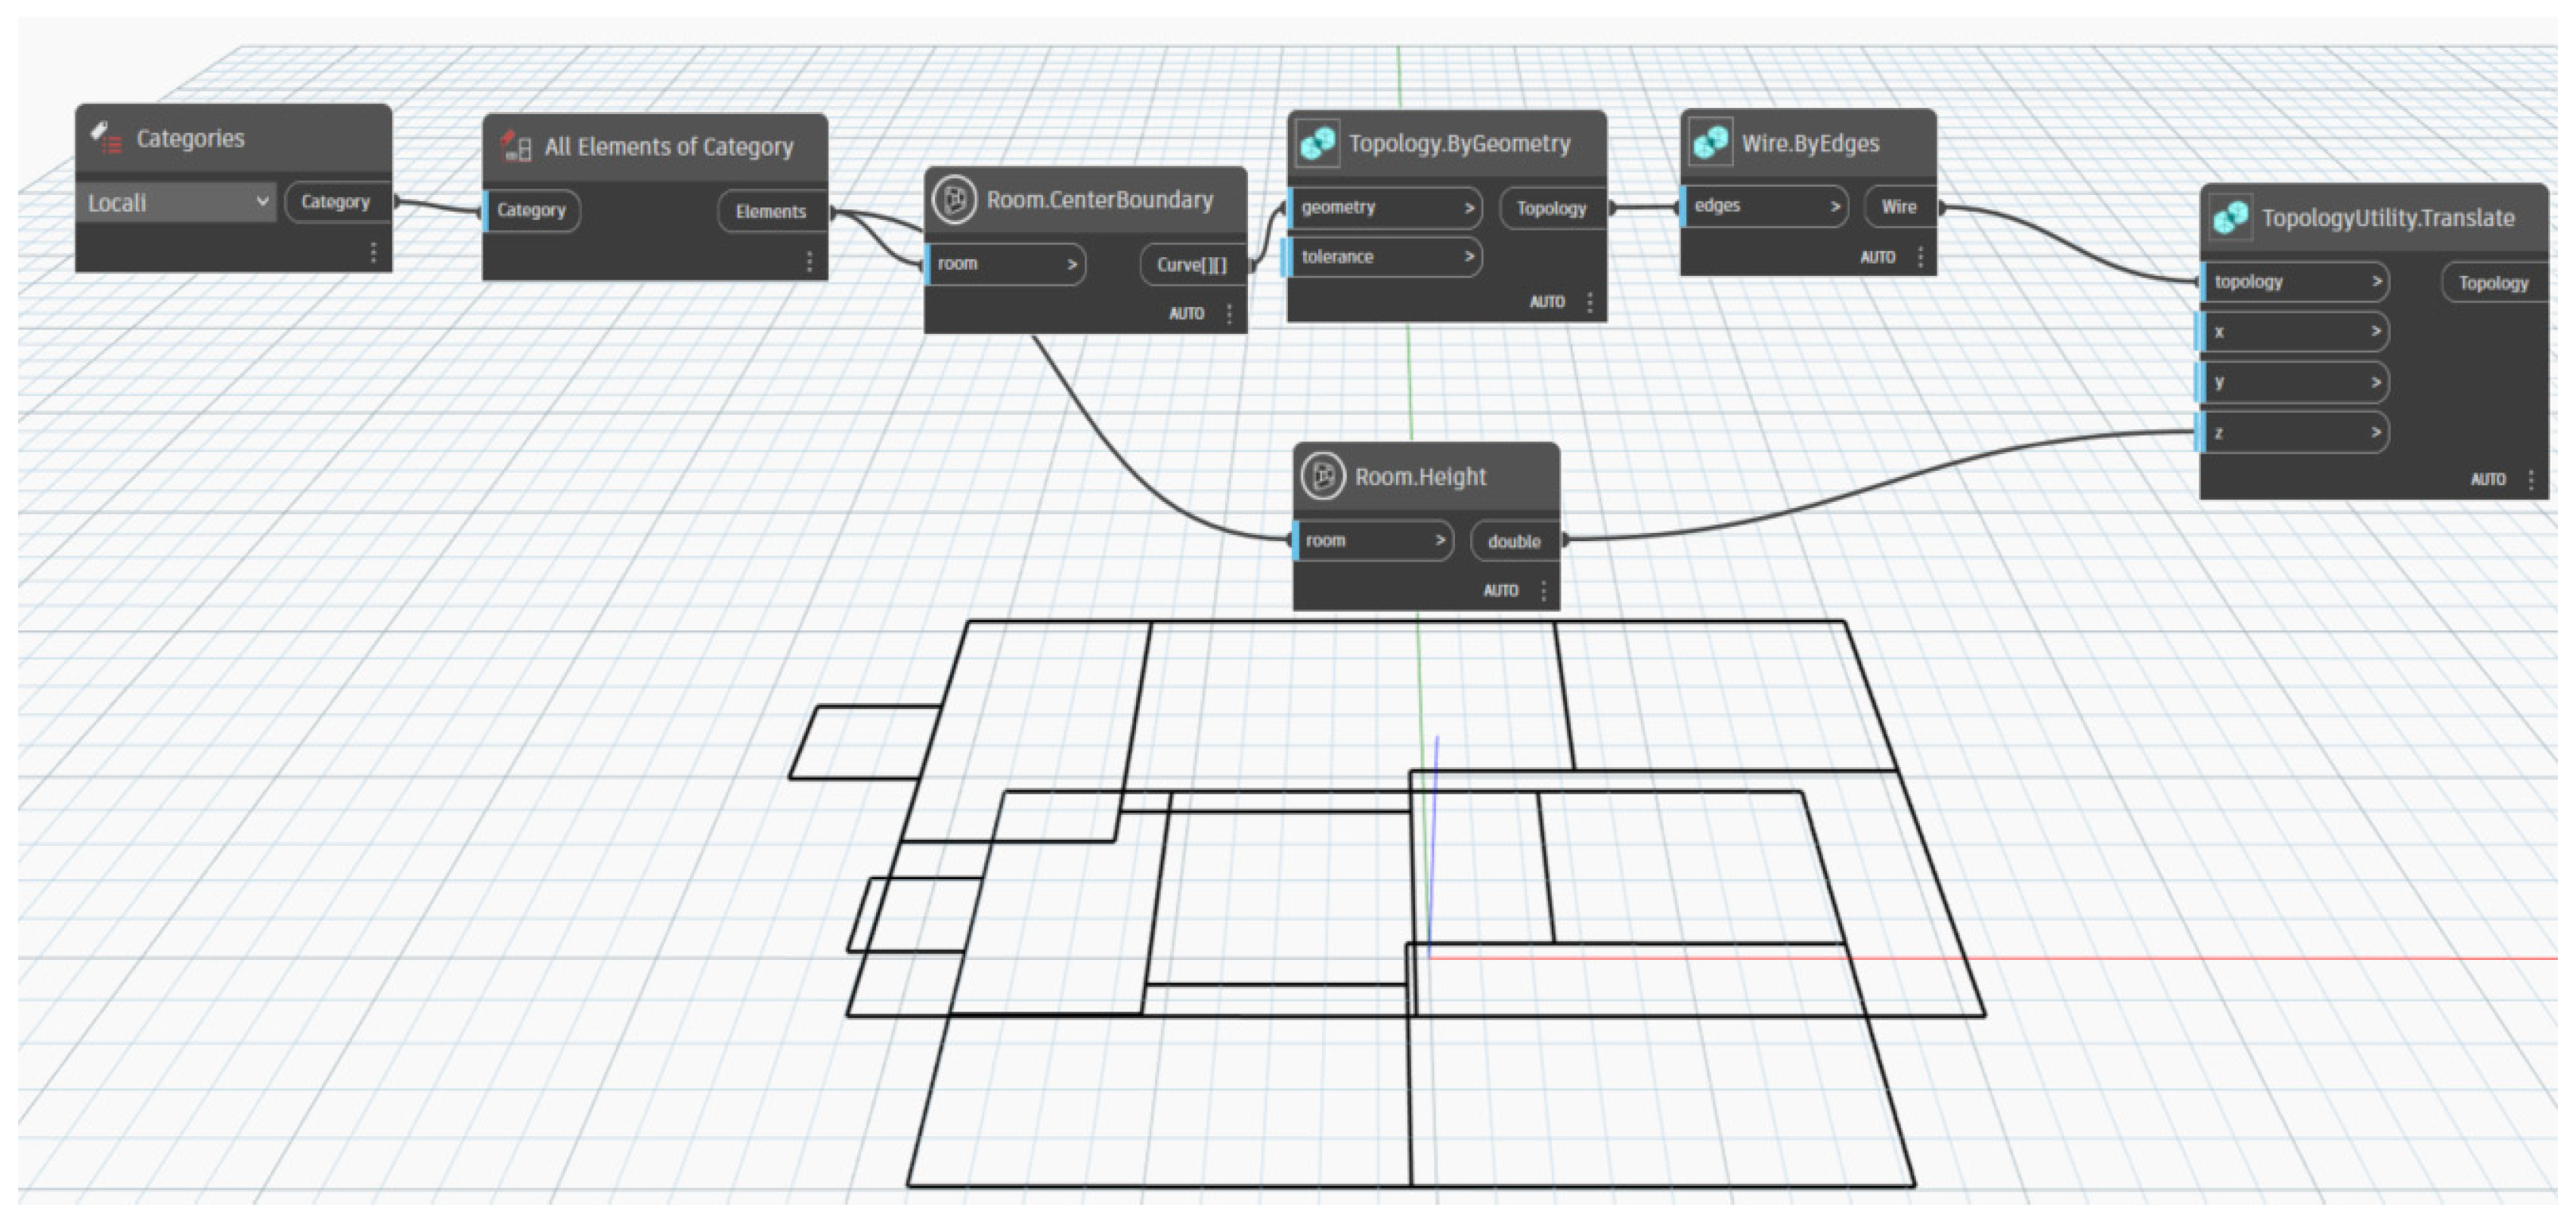
First, in Dynamo the rooms are identified, their respective geometric boundaries are defined, and the corresponding volume is calculated (see
Figure 2). Once room geometric contours are reconstructed, they can be converted into topological elements. This step allows the lines to be transformed into edges, which are then assembled to generate closed polylines representing the perimeters of the individual spaces. Finally, the three-dimensional volume of the rooms is defined by extruding the contours along the
Z-axis.
4.2.2. Creation of the CellComplex and the Final Graph
A unified list is generated, composed of two sets: the first containing the wires corresponding to the room boundaries at the base level, and the second consisting of the wires obtained by translation along the Z-axis. Next, the nesting levels related to the association of the wires with individual rooms are removed, resulting in a structure organized by height (or reference floor). The elements are then reorganized so that, for each room, a sub list containing a pair of wires, one at the base and one at the top, is obtained, thus defining the boundaries of the volume. Once this phase is completed, the three-dimensional cells of the rooms can be generated. Finally, these volumes are aggregated into a unified topology, in which the internal partitions are connected to each other.
To ensure connectivity between spaces within the model, openings must be integrated into the previously generated CellComplex. In this way, a list containing all the port instances present in the BIM model is extracted. The position of each door is identified by defining a reference plane, on which the geometry of the opening is generated. The perimeter of each opening is represented by a rectangle, with arbitrarily assigned dimensions. The openings are then inserted into the CellComplex.
In the present case study, the goal is to generate a network that connects the rooms exclusively through the openings. The resulting graph is topological, so further processing is required to visualize it. To make the graph visible within the modeling environment, it is necessary to transform topological elements into geometric entities. For a more precise estimate of the distances, the centroids of rooms and doors are translated to the floor level.
4.2.3. Simulation of Internal Paths Between Two Rooms on the Same Level
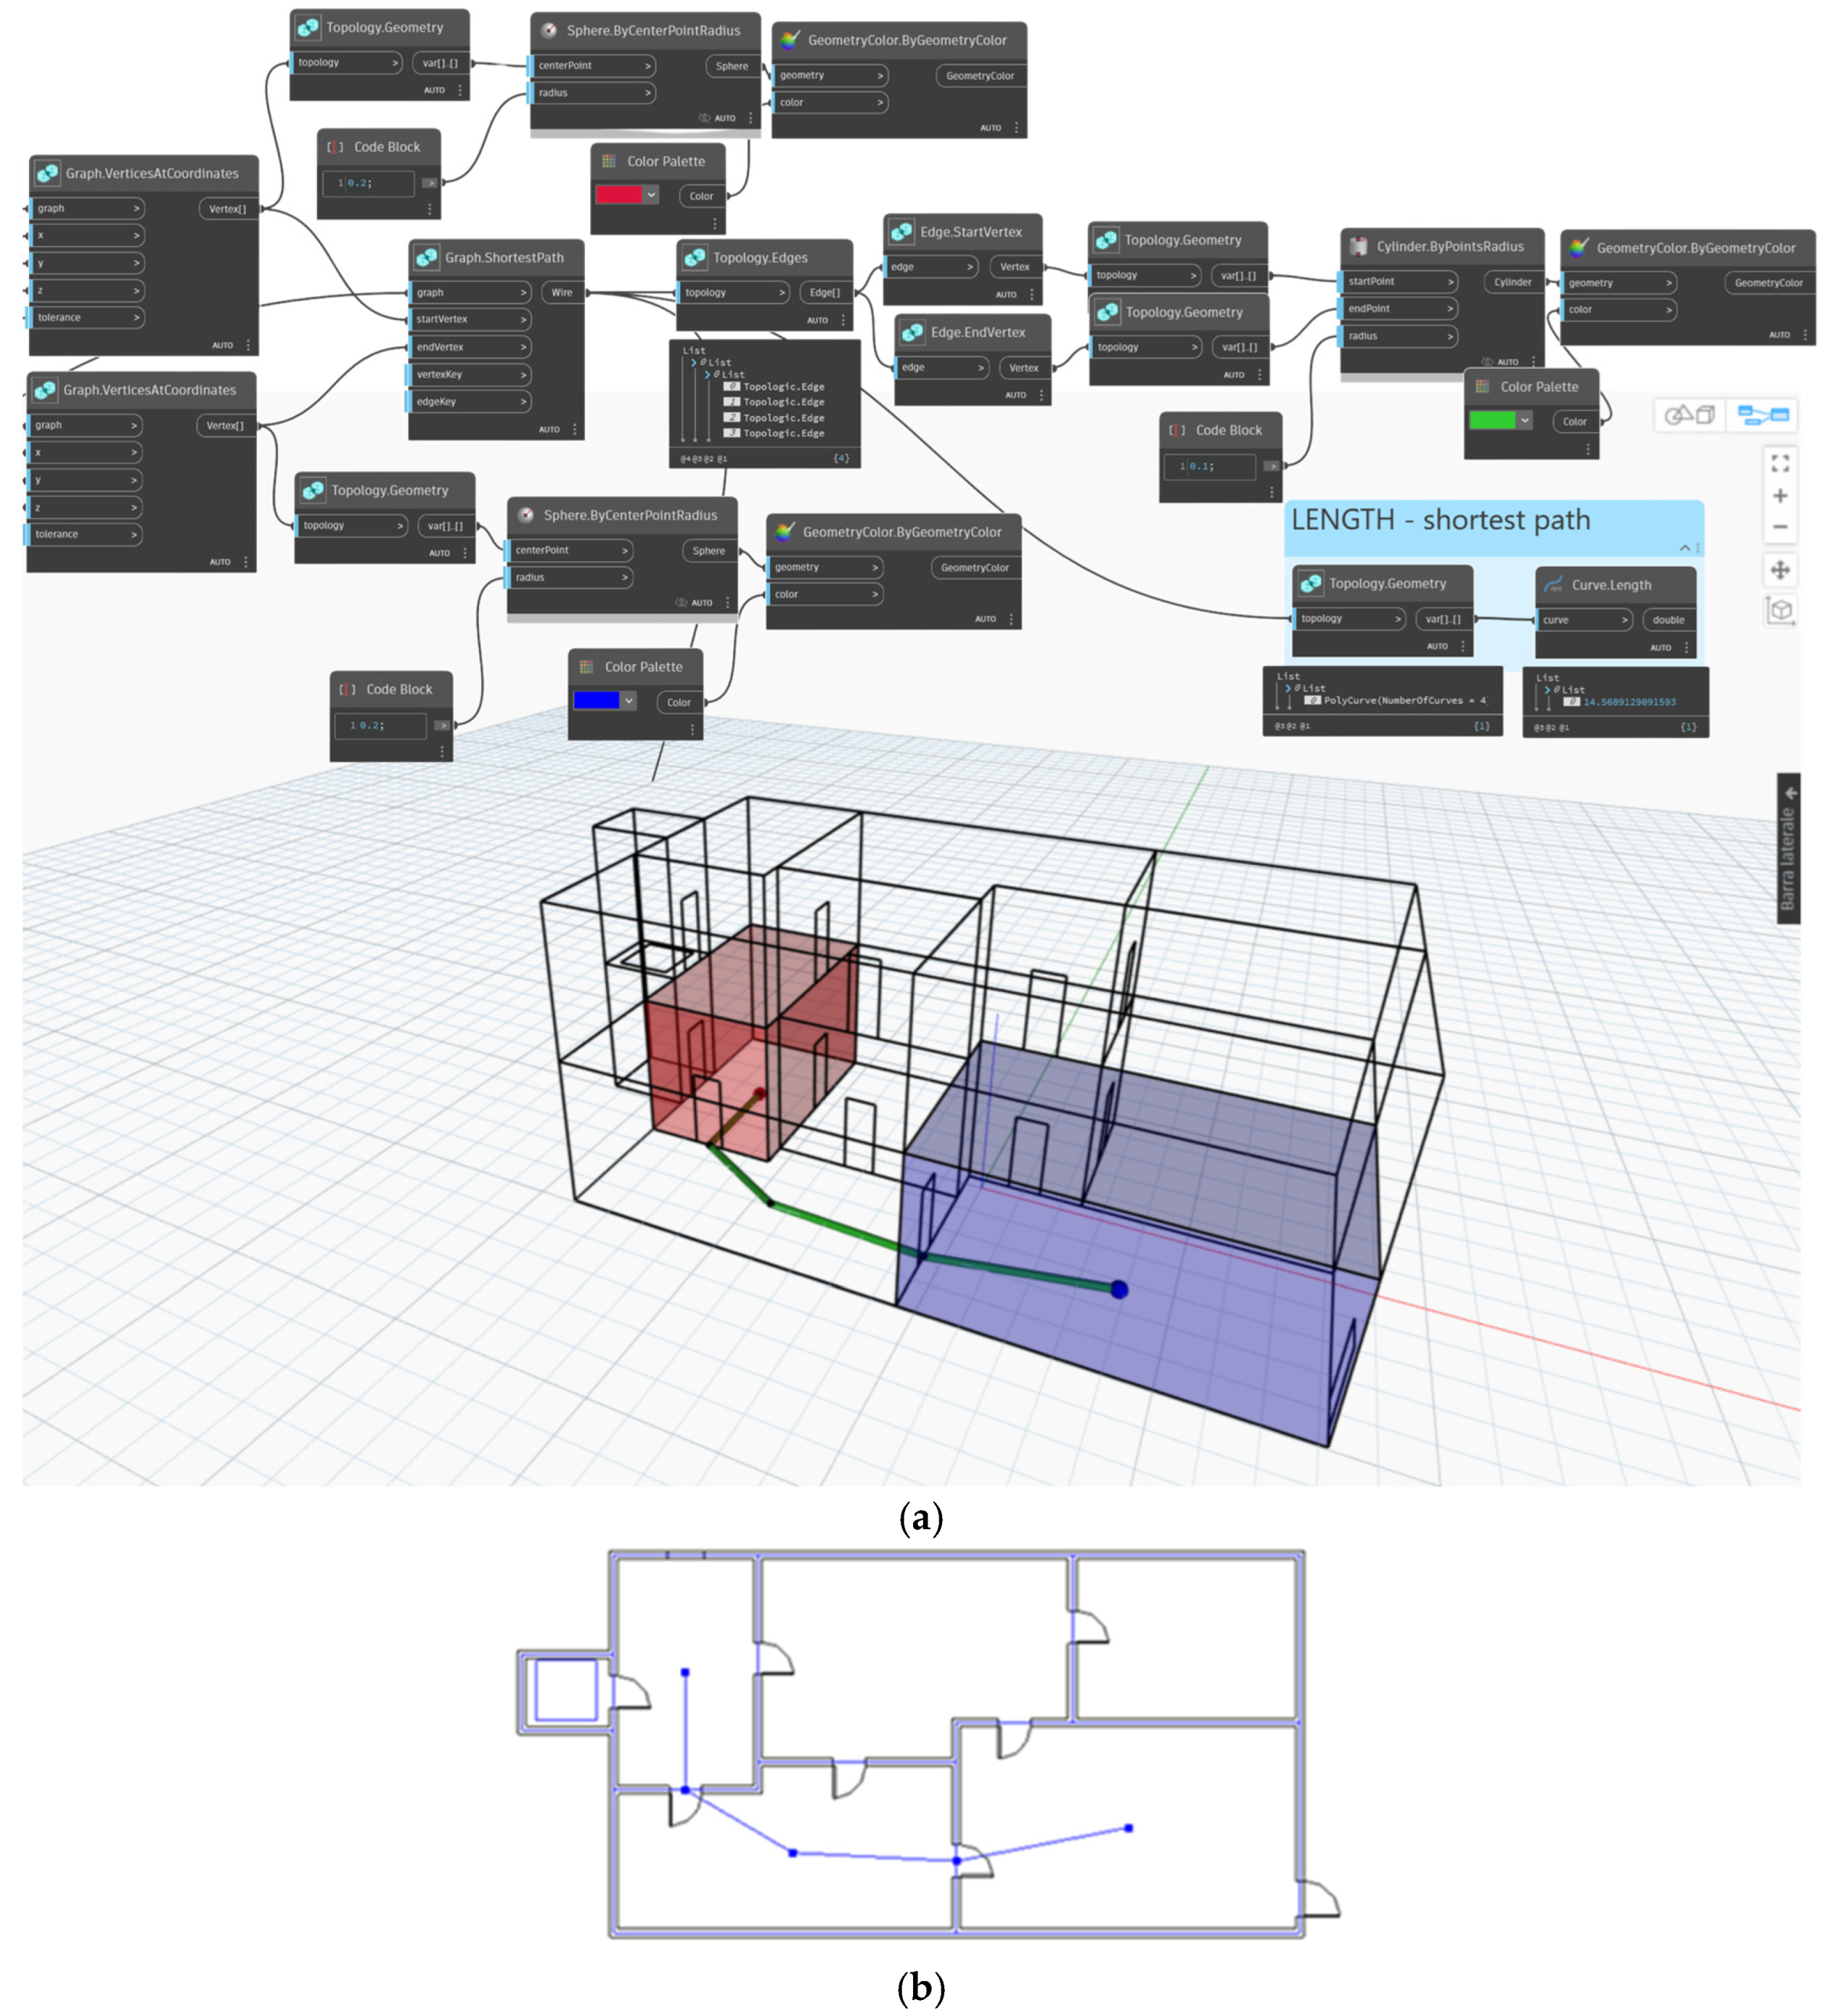
From the building mapping script, the inputs necessary for a simulation that identifies the shortest path between rooms can be extracted, and the length of this path is subsequently measured (
Figure 3). To facilitate the reading of the graph, and thus the simulation results, aesthetic processing was performed, highlighting the centroids of the selected rooms in two different colors to make them easily recognizable within the entire building. The Topologic software (version 2.19.3) also allows the results to be visualized within the Revit environment, where the paths found are displayed in a simplified manner.
4.2.4. Simulation of Internal Paths Between Two Rooms on Different Levels
In many cases, the paths to be analyzed also extend vertically, making it necessary to correctly model stairwells and elevator shafts. In the specific case of elevator shafts, the most appropriate approach consists of defining distinct volumes for each floor, horizontally bounded by the shaft’s perimeter walls and vertically by the height between floors. In this way, the entire elevator shaft is composed of the union of all inter-floor volumes corresponding to the different levels served. To ensure proper vertical connectivity within the graph, it is also necessary to insert an opening at each elevator stop level.
4.2.5. Simulation of Internal Paths with the Introduction of Private Rooms
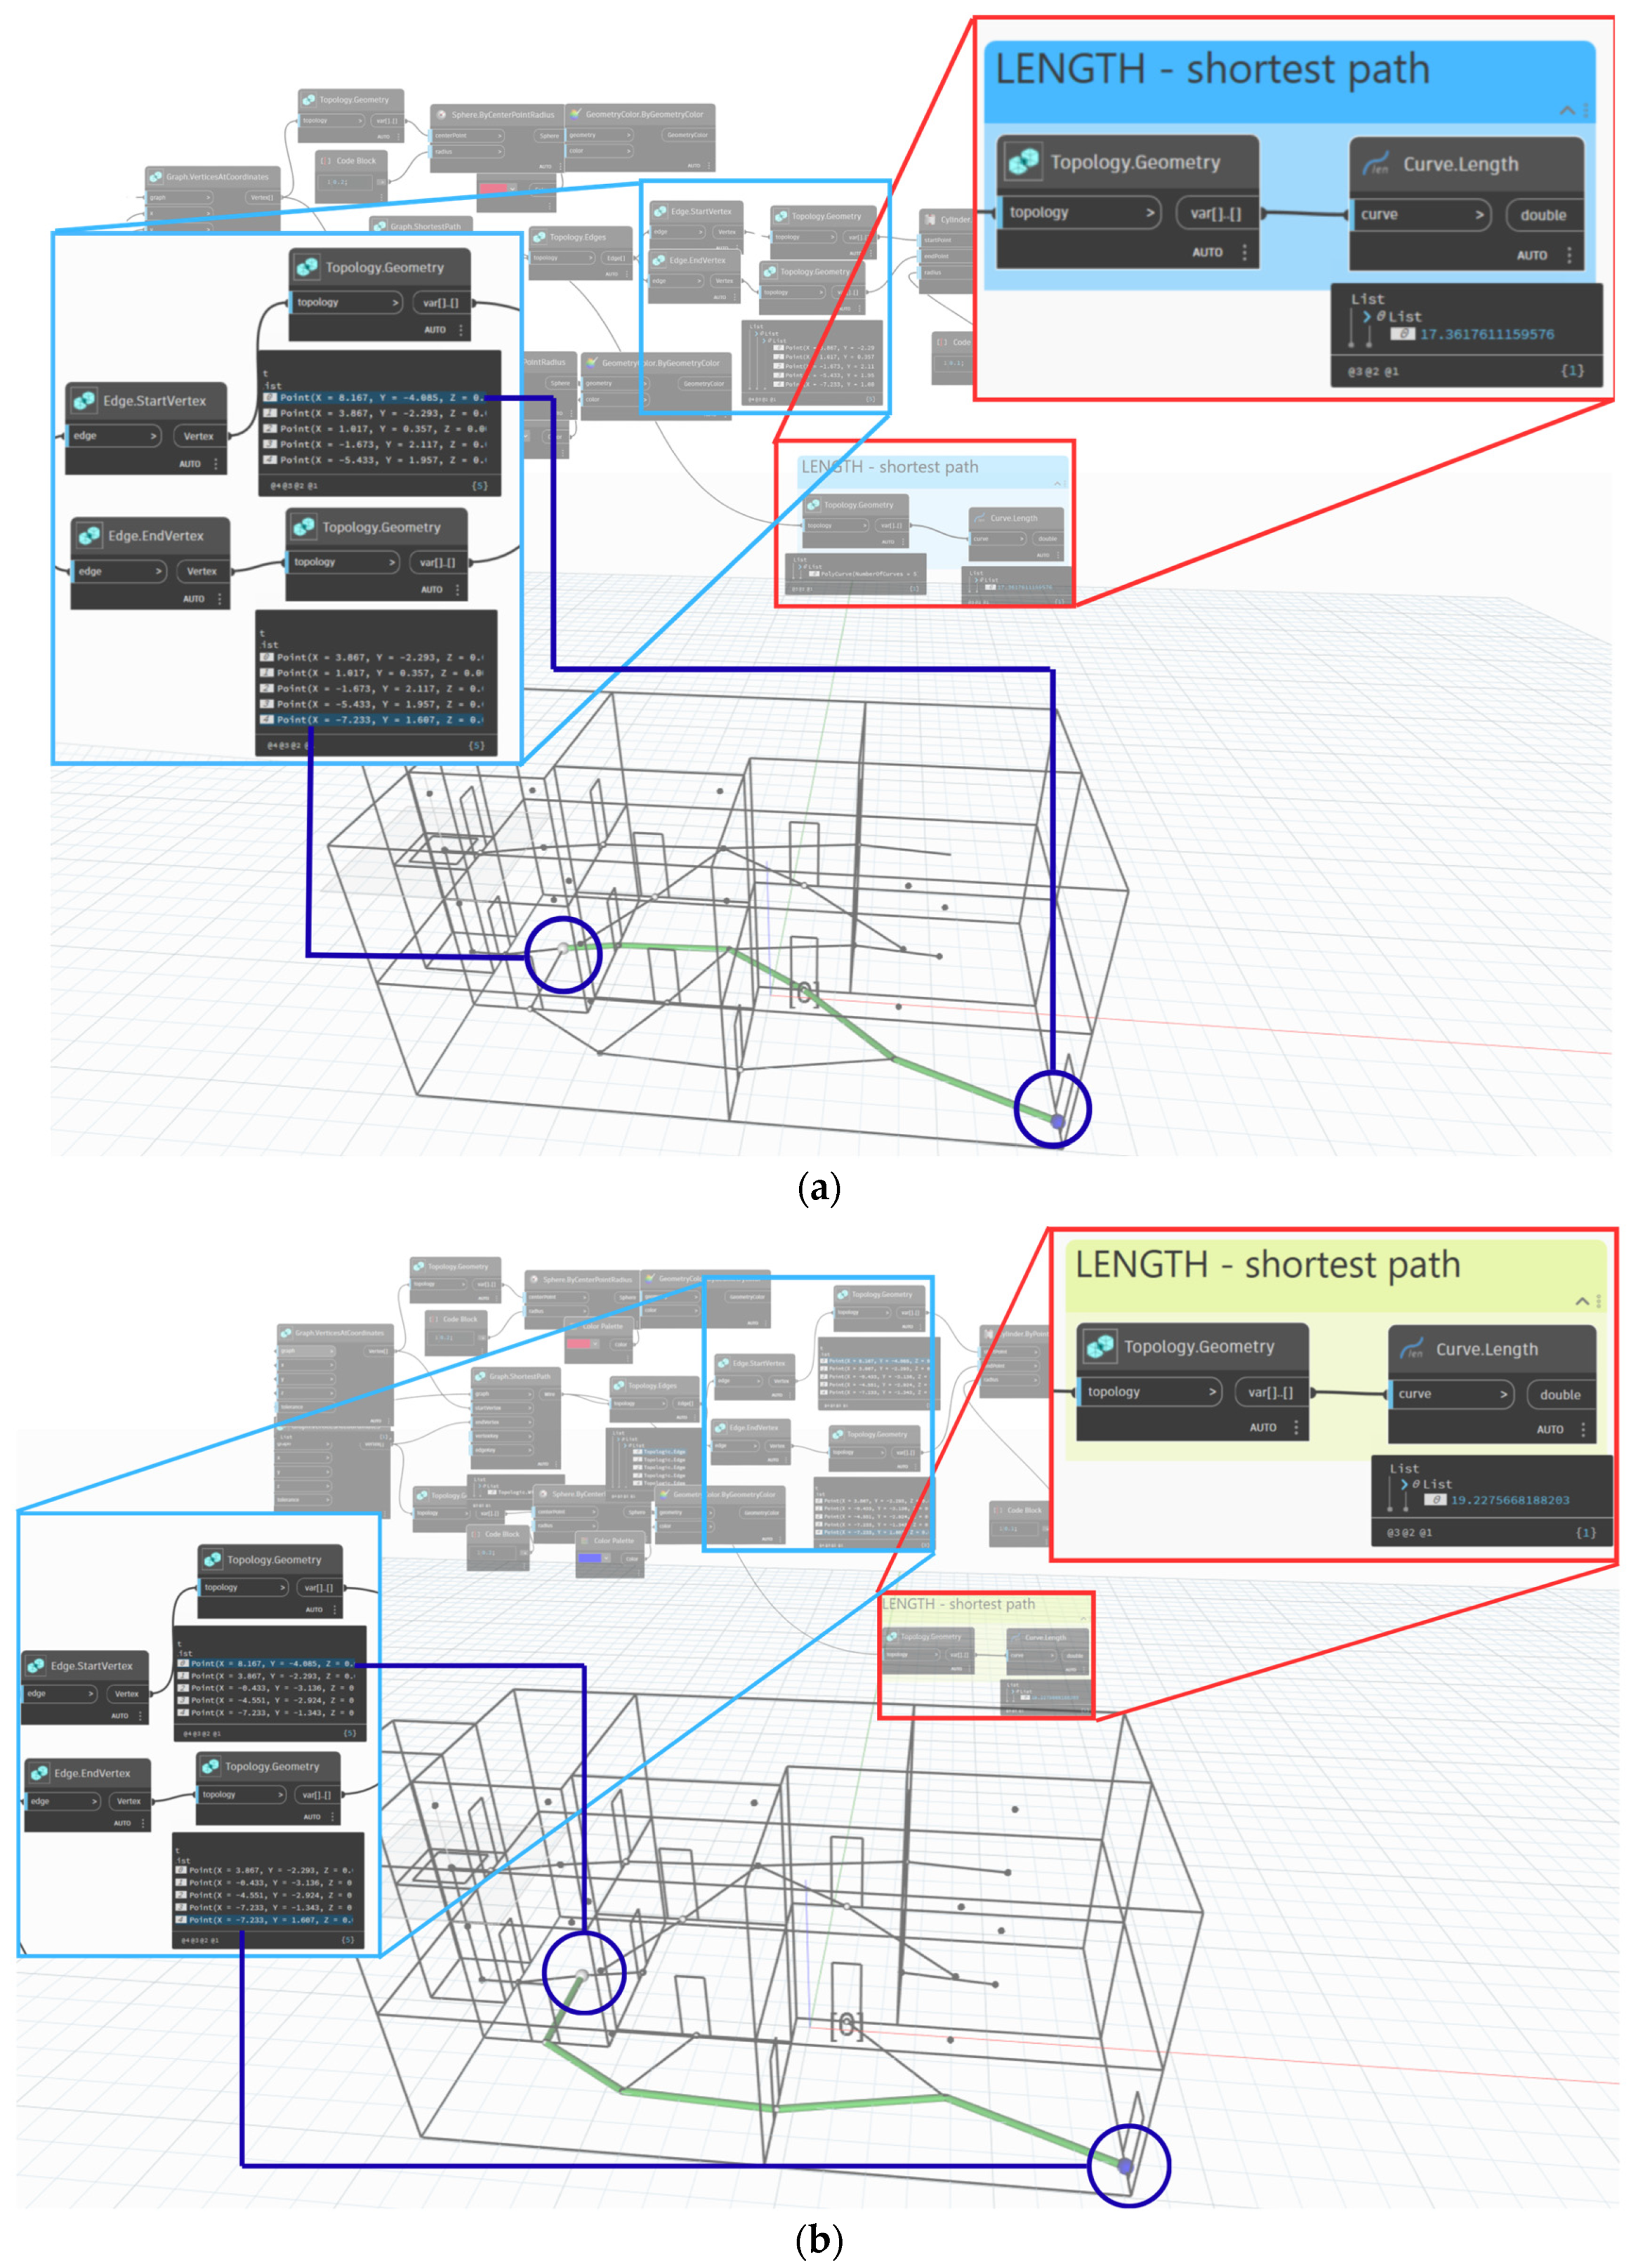
In some buildings, such as hospitals, not all rooms are accessible to everyone passing through. This condition must be taken into account when considering the paths in the constructed graph. To this end, a parameter called Department is introduced, associated with each room, which indicates its intended use as public or private. This parameter allows rooms to be filtered based on their designation, enabling the generation of a CellComplex composed exclusively of public rooms, thereby excluding private rooms from graph creation (
Figure 4). In this study, the definition of private room is based on functional and accessibility criteria rather than on a specific architectural typology. A private room is intended as a space with restricted access, primarily dedicated to individual use or controlled activities, such as patient rooms, staff offices, consultation rooms, or technical rooms. The proposed definition is therefore not limited to hospital buildings but can be generalized to other building types where spaces are characterized by limited accessibility and privacy requirements. The identification of private rooms relies on the semantic classification of spaces within the IFC model and their associated functional attributes.
4.3. IfcOpenshell in Bonsai (Blender)
The second procedure relies on the OpenBIM standard. The data was obtained by exporting the Revit model into the IFC 4 format. This export process was conducted using the Revit IFC manual exporter to ensure the preservation of semantic relationships. Using the IfcOpenShell library in Python (Version 3.12), spatial and topological information is extracted from the IFC model and then transformed into a visual form through the Bonsai graphical representation environment.
Since the reliability of computational analyses strongly depends on the quality of the IFC input, specific measures were adopted to ensure the suitability of the models. First, only semantically relevant IFC entities (e.g., spaces, doors, and their relationships) were selected, reducing noise and inconsistencies. Second, standard IFC relationships were exploited to derive topological connections, relying on the semantic structure of the schema rather than purely geometric proximity. Known issues related to geometric and semantic inconsistencies (e.g., missing reference directions or misaligned origins) were handled through additional processing within the script. Finally, the use of IfcOpenShell within the Bonsai environment allowed direct interaction with the IFC model without intermediate format conversions, preserving semantic integrity.
The objective of this work is to develop a generalizable script, applicable to different models regardless of the specific project. To achieve this, the extracted properties must be selected to remain consistent with the standard structure of the IFC format. In this context, the advantage of using the IFC format compared to a proprietary BIM model lies precisely in its nature as an open standard: its data organization, compliant with normative specifications, enables broader and more interoperable application of the developed script.
4.3.1. Creation of the Graph
To construct the movement graph, a spatial modeling approach of the building is adopted, where the nodes correspond to the centroids of the rooms (IfcSpace) and the doors (IfcDoor), while the edges represent the possible paths connecting these elements. The connections between elements are placed at floor height, corresponding to the walking surface, to obtain a more accurate estimation of horizontal routes. For this purpose, the floors (IfcBuildingStorey) are identified within the model, and the relevant geometries are projected onto the elevation of their respective level, making it possible to clearly distinguish the elements located on each floor.
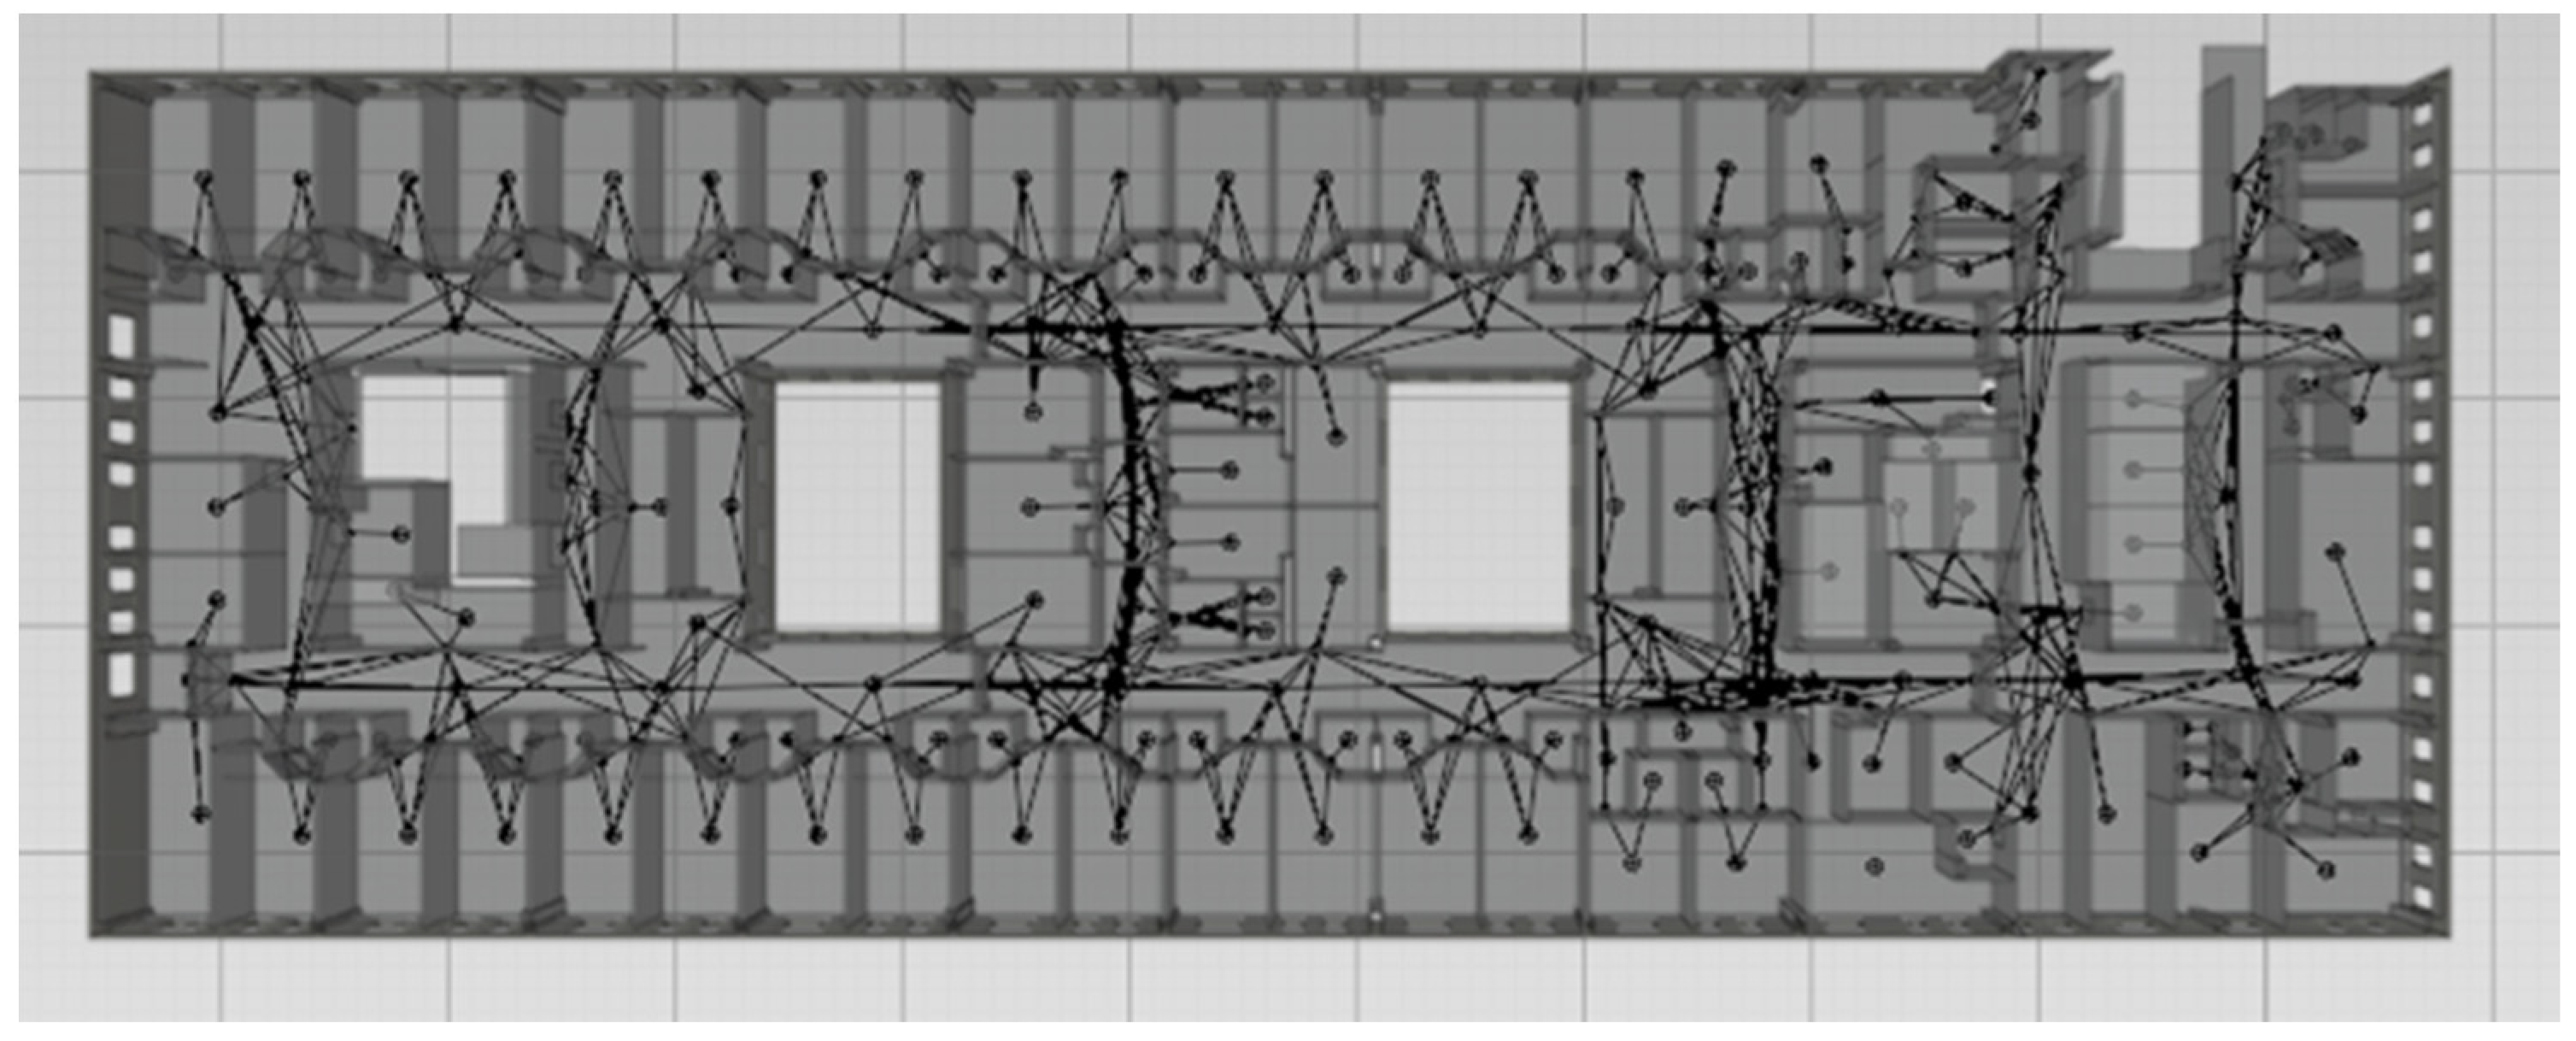
The first step is the identification of doors and rooms; for each of them, the centroid of the base is computed, representing its position in the graph. In the case of doors, the reference point is taken from the geometric origin of the IfcDoor and shifted along its direction by half its width, to obtain a point that truly corresponds to its center. Once the point has been correctly determined, it is translated along the identified direction and then assigned the z-coordinate corresponding to the elevation of the level to which the door belongs. Unlike doors, a room does not have a declared origin point, so its centroid must be derived from the geometry defining its boundaries. The horizontal projection of the volume is analyzed and, once the vertices of the base contour are extracted, the area is calculated using Gauss’s formula. Using the same points, the planimetric barycenter is then computed and taken as the room’s centroid. The vertical coordinate is finally set to the elevation of the corresponding level. Once the graph nodes have been identified, they must be connected through the possible paths linking them. To avoid generating indiscriminate connections between all nodes in the model, a filtering condition is introduced: a connection between two nodes is created only if the segment joining them does not intersect any wall. Otherwise, the route would be considered non-navigable. In multi-story buildings, vertical connections must also be modeled to ensure graph continuity across different levels. In this study, the focus is on elevators, which are recognized in the IFC model as rooms enclosed by walls and equipped with a door. For each floor, the nodes corresponding to the elevator room and its door are already present, and vertical connections are created between elevator rooms located on different floors, if they belong to the same shaft. This association is made possible by a common identifier, namely the elevator name in the IFC model. These connections ensure the integration of the navigation graph across the entire building. For each connection generated within the graph, the geometric length was computed using the Euclidean distance formula between two points in space, based on the three-dimensional coordinates of the nodes. This value represents essential information for path analysis, as it allows each edge to be assigned a weight proportional to the actual physical distance to be traveled. Once the nodes and their respective connections have been determined, the movement graph can be constructed. To support comprehension and visual validation of the graph, a graphical representation has been produced (
Figure 5).
4.3.2. Path Analysis Within the Graph
Once the system of connections has been defined, it becomes possible to perform shortest-path analysis within the graph. For this purpose, the A* algorithm was selected. This choice is motivated by the fact that A* significantly reduces computation time, improving computational efficiency without compromising the optimality of the resulting path. To develop the heuristic, the Euclidean distance was adopted, as it had already been used for calculating the length of the connections. Each connection (edge or link) is therefore assigned a weight equal to the Euclidean distance between the connected nodes. Based on these weights, the algorithm can determine the shortest path between any two nodes in the network. In addition to the graphical representation of the connection system, a text output file is generated containing a detailed list of all identified nodes and connections (
Table 1).
4.4. Pathfinder
To support and validate the analyses performed using the IfcOpenShell script, Pathfinder was subsequently employed. The simulated environment is represented through a navigation mesh, which defines the walkable surfaces (floors) and passage openings (doors), outlining the space within which agents can move. These agents generally represent people within the simulation, capable of interacting dynamically with the environment by adapting their path and actions according to the system’s conditions. In the case study, the navigation mesh is generated by importing an IFC model. Each instance of an IFC entity is imported as an object, if it contains three-dimensional geometry. Openings are automatically subtracted from the imported objects, as they are considered obstacles to movement. In this process, IfcFloor entities are converted into Rooms, thus identifying walkable surfaces and potential obstacles within them. IfcDoor entities, on the other hand, are converted into Doors, generating a two-dimensional geometry with a width corresponding to that defined in the IFC properties and a thickness sufficient to connect two adjacent spaces, thereby allowing agent navigation.
The occupants defined in the simulation correspond to the AGV vehicles used in the automated material transport system inside the hospital. Since these are automated guided vehicles with predefined trajectories, they are not subject to the behavioral variability typical of evacuation simulations in Pathfinder. It is therefore essential to configure the agents considering the operational specifications of the AGVs, which can be set using the software parameters divided into the following categories: Characteristics, Movement, Restrictions, Door Choice, Advanced Data. AGV agents are inserted into the simulation through occupant sources positioned at the origin rooms of the vehicles, based on the services they must perform. This approach allows vehicles to start sequentially, rather than all at once, and makes the simulation more realistic, since vehicles begin their activities at different times. Once the agents have been configured, each of them must be assigned a behavior. For AGV vehicles, the main task is to reach material pick-up areas according to operational needs and then transport the material to the corresponding storage or cleaning areas. To ensure correct routing, it is essential to identify and assign specific target points, representing the areas where material pick-up occurs. Once the destination point is reached, the vehicle switches to a waiting behavior.
Within the simulation, obstacles that influence AGV trajectories can be introduced, particularly those generated by the presence of people moving inside the hospital environment. To represent these dynamic obstacles, occupant triggers are used, i.e., agents whose behavior generates triggers capable of inducing changes in the behavior of the automated vehicles. When an AGV detects the presence of an occupant trigger within its field of view, the vehicle temporarily stops for a few seconds.
This momentary stop is intended to ensure an adequate level of safety and prevent potential collisions with pedestrians. The triggers are distributed unevenly along the route. Their specific characteristics are shown in
Table 2.
Simulation
In Pathfinder, route selection is based on the Locally Quickest approach, which updates the path in real time by taking congestion into account. For each door, a cost is calculated based on the travel time within the room and the waiting time due to queuing at the doorway. The occupant chooses the door with the lowest cost and recalculates this choice in every room encountered, dynamically adapting the strategy until reaching the destination. This makes it possible to simulate flexible behaviors that respond to obstacles and crowding. Unlike the A* algorithm, which defines a static path on a fixed map, the Locally Quickest method is more realistic in complex and variable scenarios. The shortest-path analysis in Pathfinder is carried out considering two distinct cases. In the first, a simplified scenario, it was assumed that agents move at an average speed, following the shortest path inside the modeled environment. The second case represents a worst-case scenario, in which a minimum speed is assigned to the agents and the presence of obstacles influencing movement is considered. The analyses show that the presence of obstacles, defined by the occupant triggers, modifies the travel times of the vehicles but does not significantly change the distances of the paths they follow. In fact, analyses show that the presence of dynamic obstacles, modelled using randomly placed triggers in the premises, affects operational efficiency mainly in terms of travel times rather than route geometry. Specifically, the AGV is programmed with 100% trigger sensitivity. This configuration ensures that when an obstacle is detected via line of sight within the awareness radius, a waiting behavior is activated.
As a result, the AGV remains on its optimized trajectory, based on a preference for the shortest path and a 100% preference for the chosen door so that it does not change course, and simply waits in its current position until the path is clear. Once the obstacle has been cleared, the vehicle returns to its designated route. This wait-and-resume strategy explains why there are no significant changes in route distance, while mission latency increases due to these temporary stops and queue times on the premises.
5. Results
The analysis of minimum paths inside the Cesena hospital was carried out using a sampling approach to verify the effectiveness of the proposed methodology. The selected sample refers to the routes travelled by the AGV vehicles for the laundry transport service. This sample is representative of the AGV handling system operating within the hospital, as it includes a varied set of routes involving all floors of the building. Like the other logistics flows, this service is also centralized on the basement level, which constitutes the operational core of hospital logistics, hosting the main storage areas and the AGV charging station.
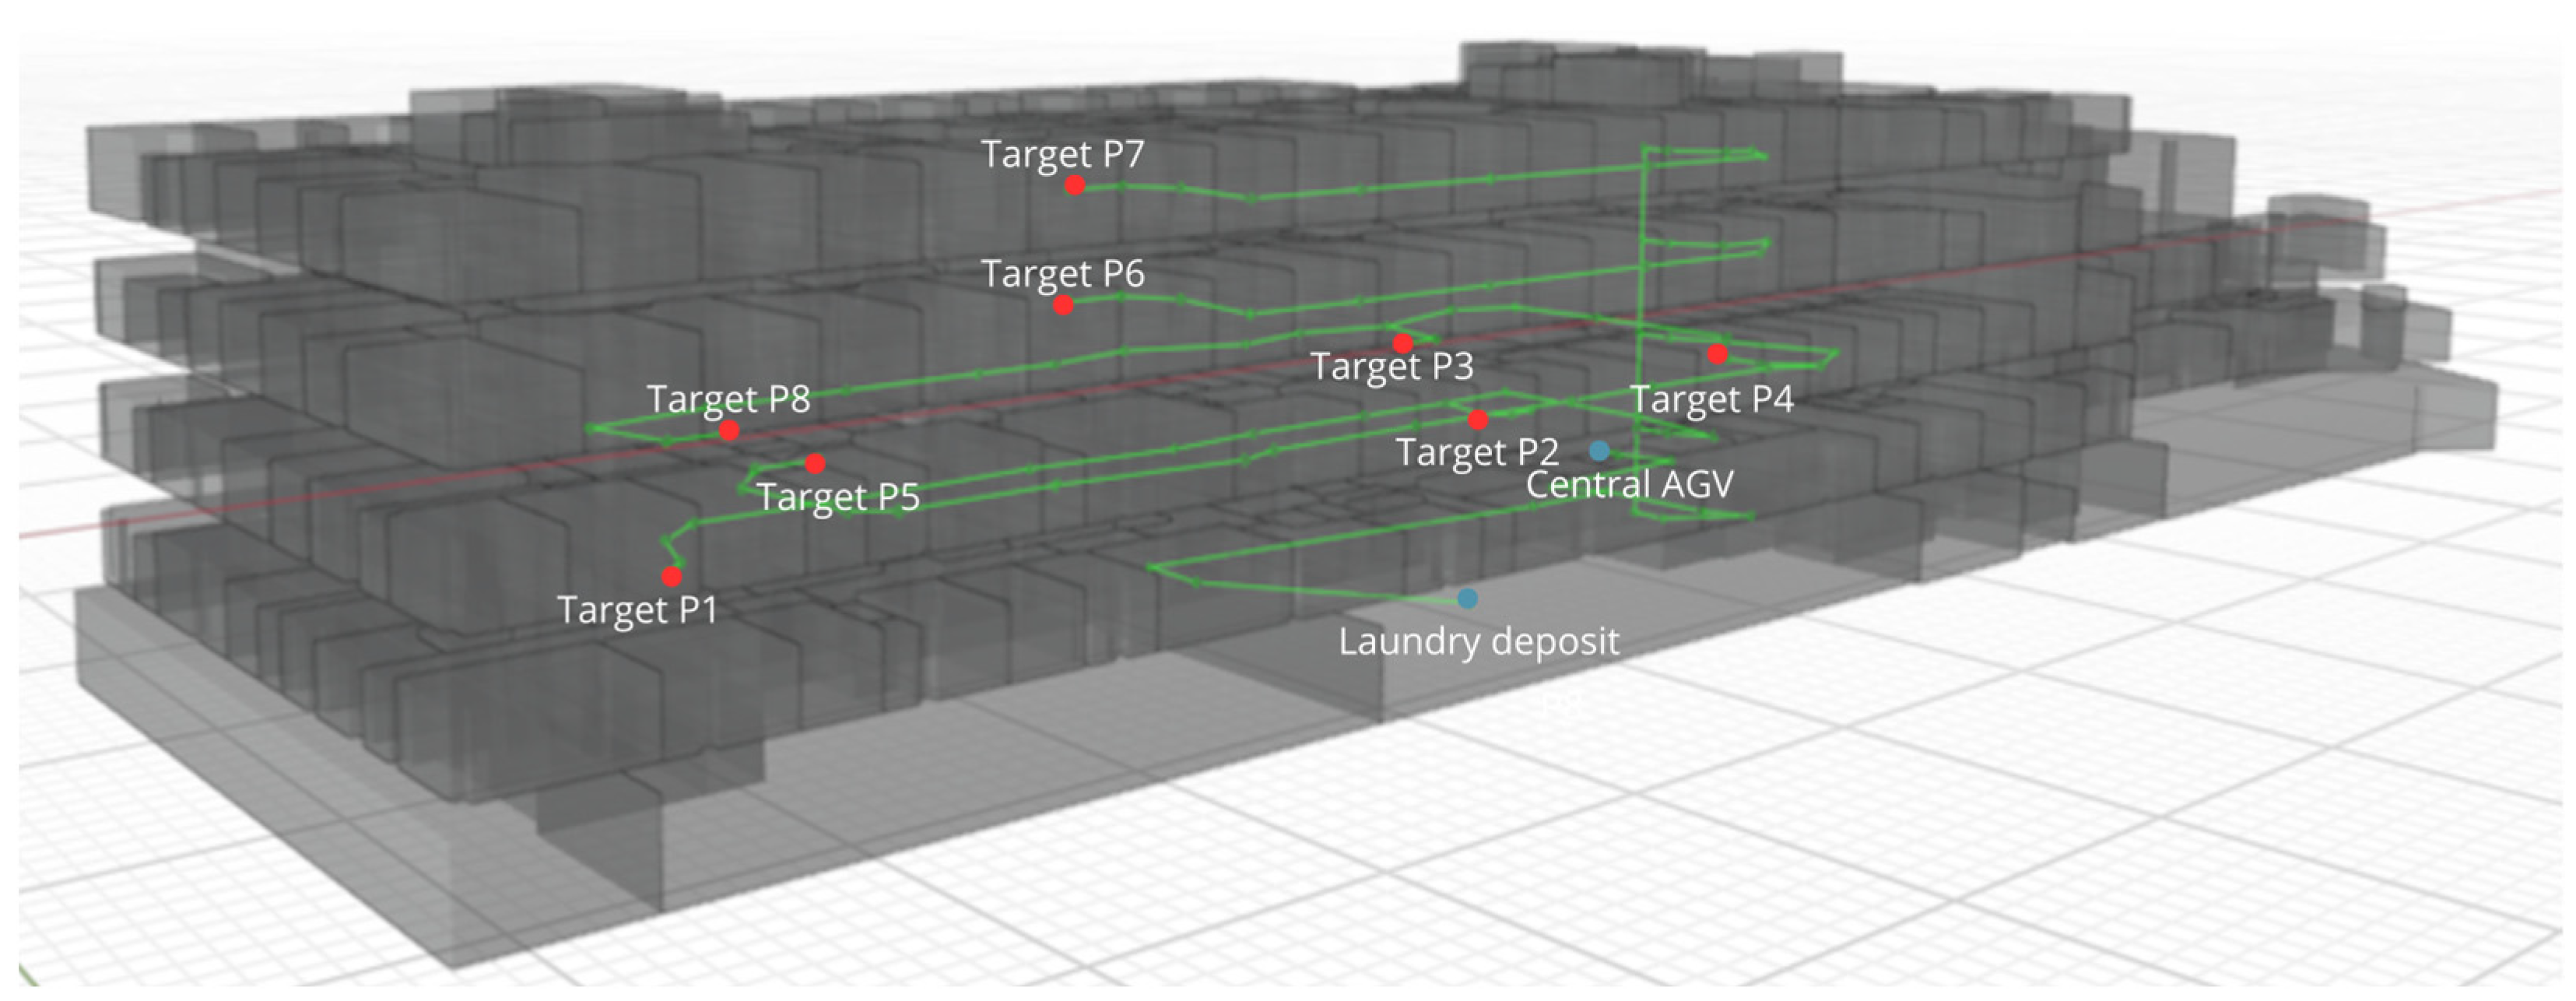
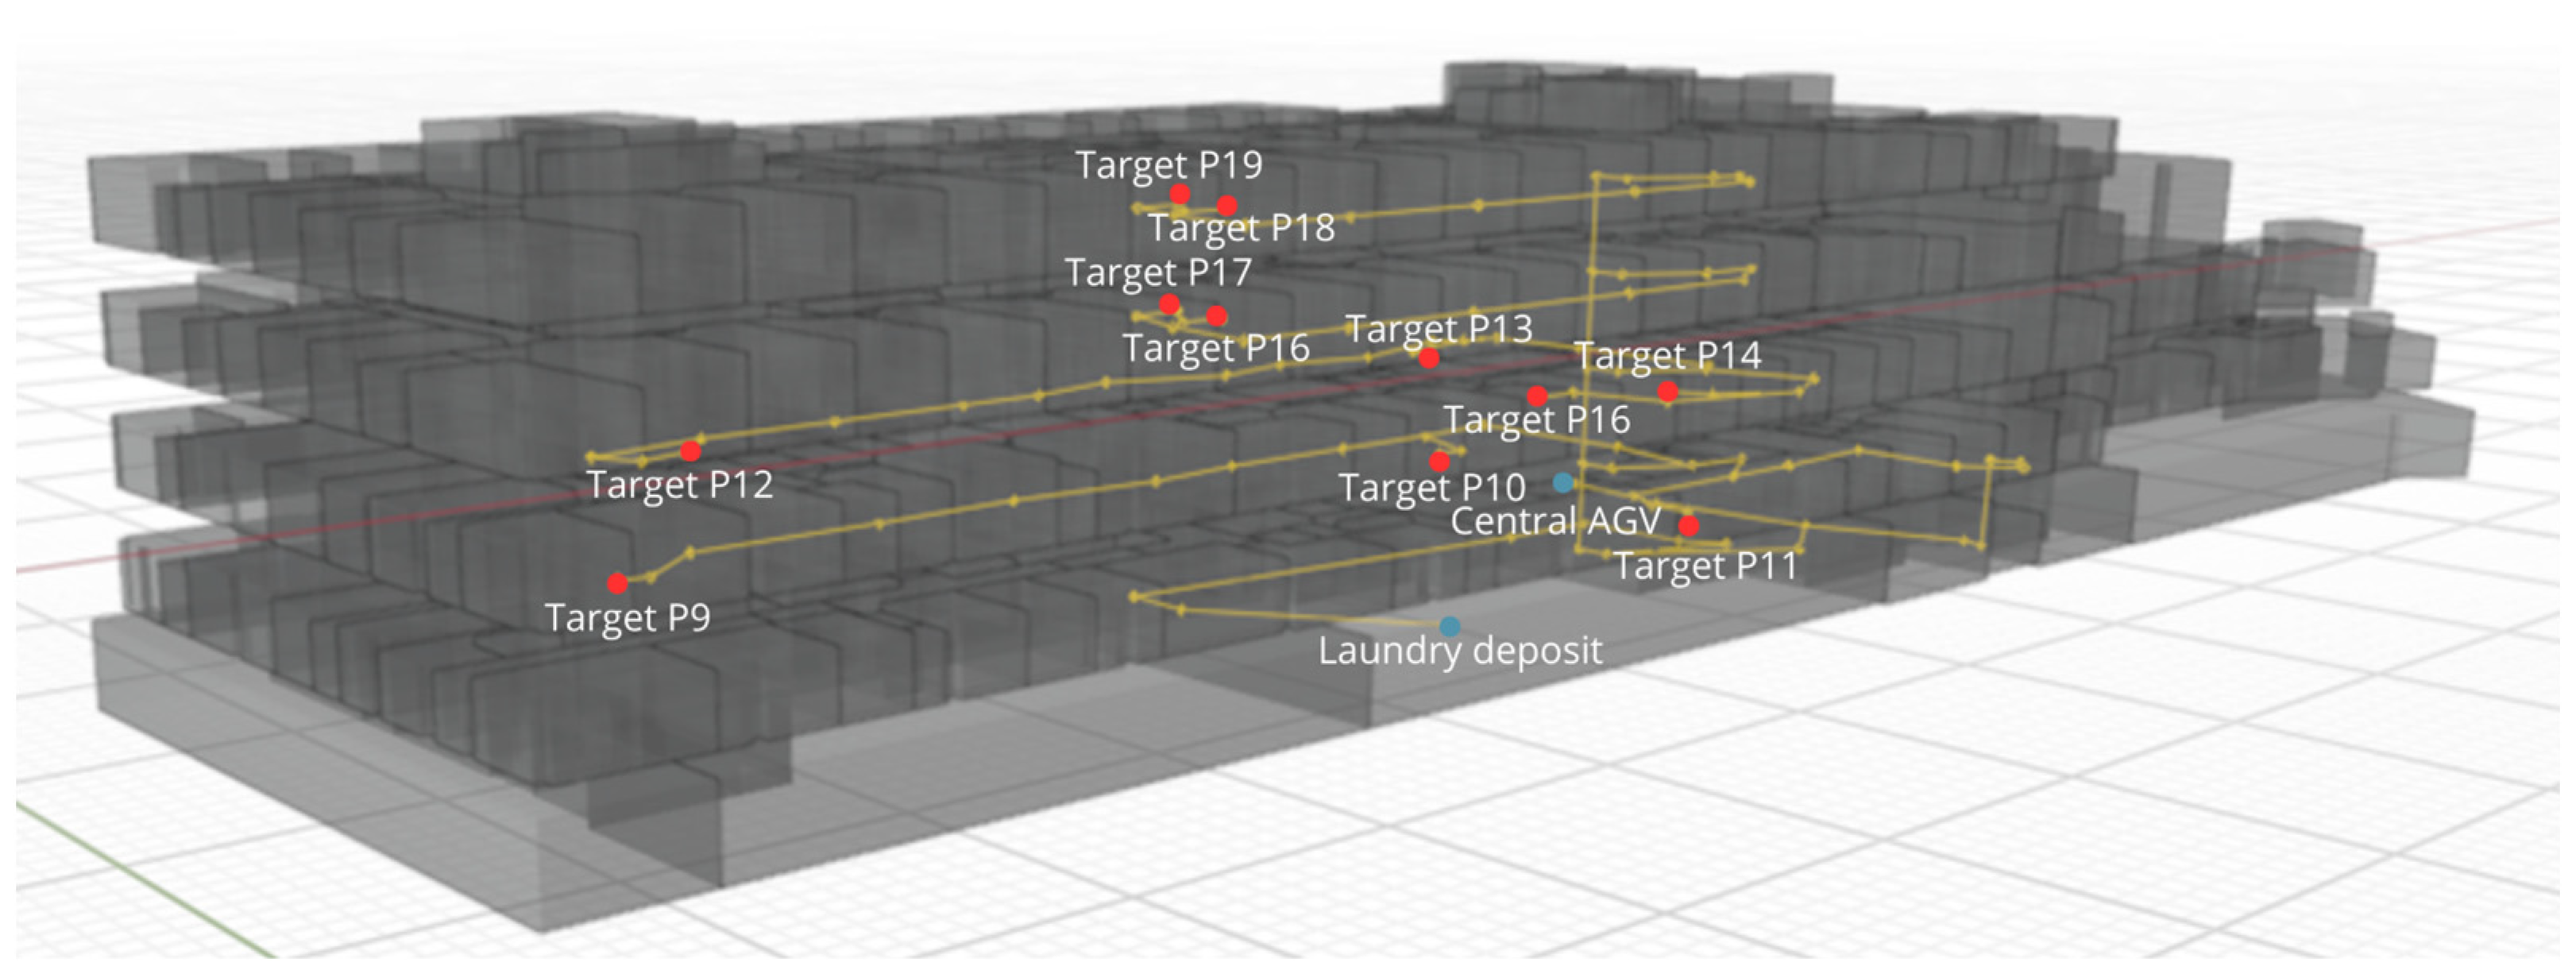
The analyzed routes are classified into two categories corresponding to the operational modes of the laundry transport service: one dedicated to the distribution of clean linen and the other to the collection of dirty linen. A total of 19 routes is identified, graphically distinguished by two colors: green for those related to clean linen and yellow for those referring to dirty linen. Each route is composed of two consecutive segments. For clean linen, the route starts from the central storage located on the basement level and reaches the floor-level storage area near inpatient or outpatient units. The trolley then proceeds to the AGV charging station, which is also located on the basement level. In the case of dirty linen, the route begins at the charging station, reaches the floor-level storage area for material collection, and concludes with the return to the central storage. In all routes, therefore, both the starting and ending points are located on the basement level, confirming the central role of this floor in the building’s logistics dynamics. In fact, this level hosts the strategic infrastructure required for the operation of automated services. Concentrating these logistics nodes on a single level makes it possible to optimize flows, reduce interference with clinical activities, and ensure more efficient management of automated transport. The complete set of analyzed routes, together with their characteristics and classification, is detailed in
Table 3.
5.1. Path Analysis in Bonsai
Below are the results of the path analysis for the clean laundry service, obtained through the execution of the script developed with IfcOpenShell. The results are presented both graphically (
Figure 6), showing the paths within the model, and numerically, with the measured distances along each path reported in
Table 4.
Similarly, the results of the distances calculated for the paths dedicated to the dirty laundry service are presented. In this case as well, the results are illustrated graphically in
Figure 7 and numerically in
Table 5.
5.2. Path Analysis in Pathfinder
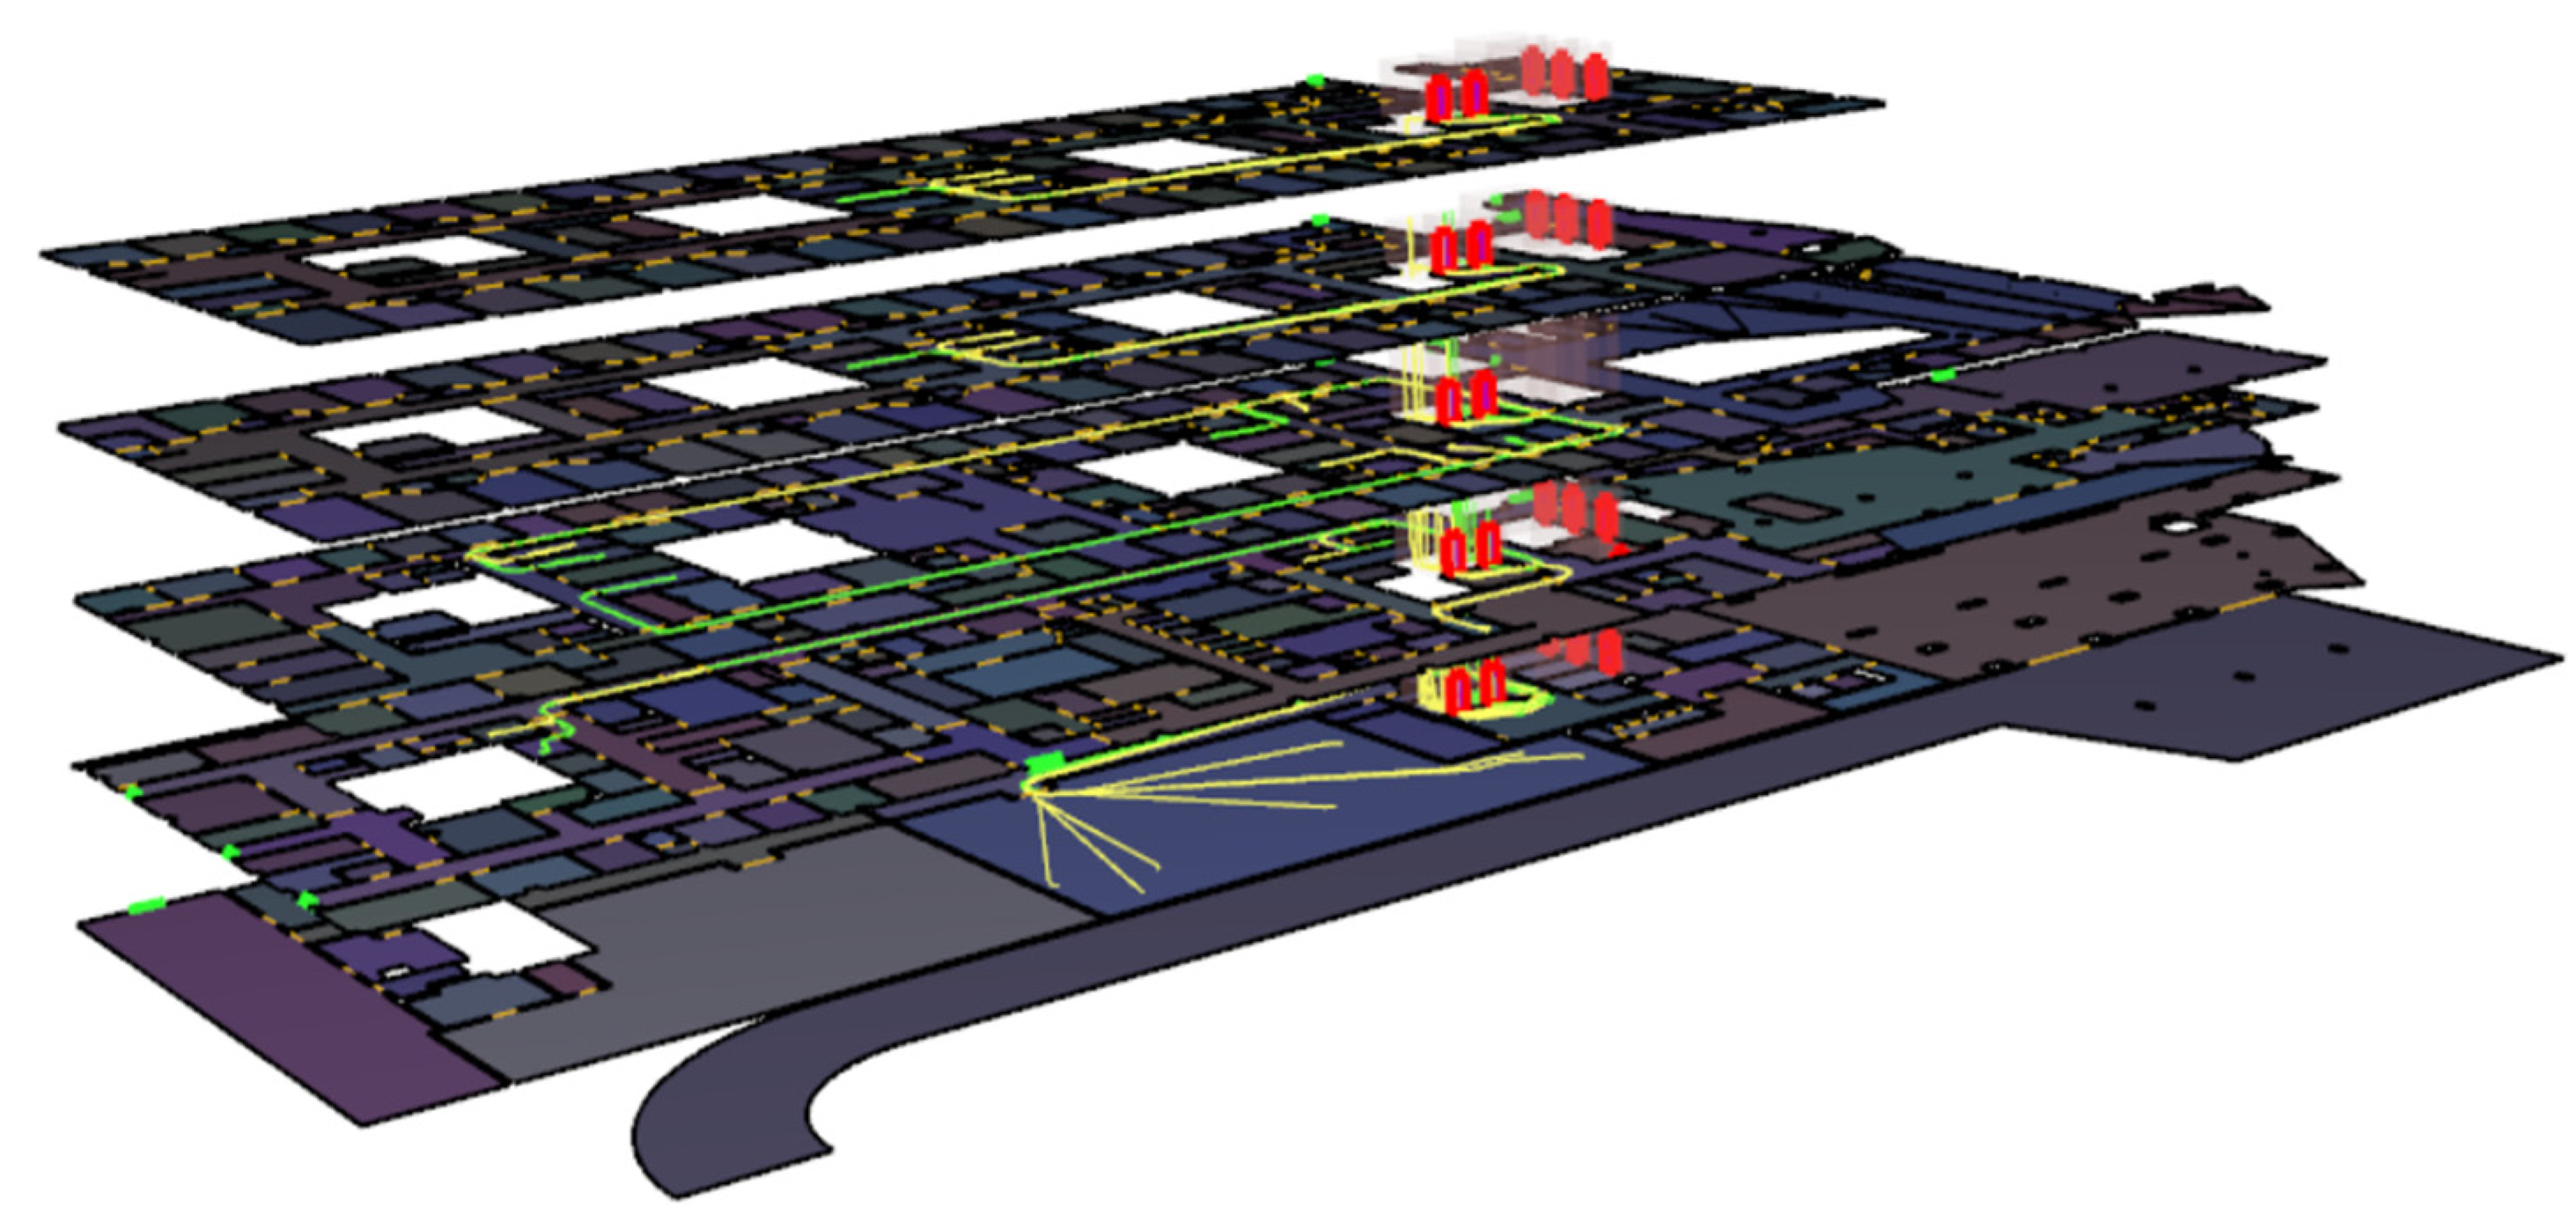
The same analysis was subsequently carried out within the Pathfinder environment. In this case, both the clean and dirty laundry services were analyzed simultaneously within the same simulation. The results were obtained both graphically (
Figure 8), through the visualization of the simulated paths, and in textual form, by exporting CSV files containing quantitative data, such as the distances traveled (
Table 6 and
Table 7), the rooms traversed, and the travel times.
5.3. Path Analysis in Topologic Dynamo
The analysis of the path system using Topologic in Dynamo environment did not yield satisfactory results, as it was not possible to generate the required graph structure. The critical issues emerged already during the CellComplex creation phase. To better understand the causes of these issues and to assess the robustness of the developed script, a comparison was made with the hospital model of Cuneo (in Italy). In this second case, characterized by lower complexity (312 rooms compared to the 746 present in the Cesena hospital model), the script operated effectively. The comparison highlighted that the problems encountered in the Cesena case are mainly due to the high number of rooms and the resulting computational complexity of the model. This complexity appears to be a limiting factor for the script developed in Dynamo, which cannot efficiently manage such a large volume of data.
5.4. Comparison of Results
The values obtained with each approach, along with the observed differences, are summarized in
Table 8 and
Table 9. The paths exhibit varying lengths, with deviations ranging from a minimum of approximately 30 cm to a maximum of 30 m. These discrepancies are particularly significant in some cases, as they substantially affect the determination of the optimal routes.
The percentage differences in path lengths were also calculated to provide a more comprehensive comparative overview of the two methods. This approach allows the magnitude of the discrepancies to be assessed proportionally to the overall path length, making the comparison more meaningful. For the calculation of these percentages, the calculated lengths in Bonsai were used as the reference denominator. This choice ensures a stable and consistent geometric baseline derived directly from the BIM model. In contrast, the calculated lengths in Pathfinder are influenced by the dynamic behavior of simulated agents, which can introduce minor variations due to steering adjustments, collision avoidance, or other simulation related effects. Using Bonsai lengths as the reference avoids these small inconsistencies, providing a more reliable and reproducible basis for evaluating graph-extraction accuracy. The analysis of path length differences in percentage terms highlights significant variability between the two considered methodologies. For clean linen service paths (
Table 10), the percentages range from a minimum of 5.20% to a maximum of 19.26%, with several values above 10%, indicating a substantial discrepancy between the methods regarding the calculated length. For dirty linen service paths (
Table 11), percentage differences are also significant, though generally lower: the percentages range from 0.29% to 11.52%, suggesting greater consistency between the methods, but still not negligible. Such differences, particularly when exceeding the 10% threshold, indicate that the paths obtained through the two methodologies are not directly superimposable in terms of spatial optimization of length, confirming the need for careful evaluation of the adopted methodology in route definition.
To verify the correctness of the graph-based analysis approach, a detailed comparison of the rooms traversed by the paths was performed. The objective of this comparison is to ensure that the observed differences in traveled distances are not due to errors in identifying the shortest path but are instead attributable to the different modes of geometric representation of the routes. In the graph network, paths are described using straight segments connecting the centroids of the spaces, whereas in Pathfinder the simulation produces more complex trajectories that follow the actual layout of the spaces, including curves and deviations. The analysis shows that the rooms traversed coincide for both approaches, confirming that the differences in length are solely due to the different geometric modeling of the paths and not to discrepancies in the calculation logic.
The observed differences are acceptable, as the shortest paths identified match in both analyses, confirming the correct functioning of the script. It should be noted that the distributive and geometric complexity of the model inevitably introduces a certain degree of approximation in distance estimation, particularly due to the simplifications adopted in constructing the graph. Specifically, the graphical representation is based on straight connections between the centroids of the spaces, which do not accurately reflect the actual path layout, often characterized by curves, articulated corridors, and spatial constraints. Nevertheless, the consistency of the obtained paths confirms the reliability of the script in correctly representing the movement logic within the building.
The differences in the lengths of the calculated paths can be attributed to both methodological and graphical representation factors. The main source of discrepancy between the methods lies in path modelling. The graph-based approach implemented via IfcOpenShell in Bonsai represents paths as sequences of straight segments connecting the centroids of rooms and doors, resulting in an abstract, linearized geometry. In contrast, Pathfinder uses an agent-based simulation on a navigation mesh, where trajectories follow the actual spatial configuration of corridors and rooms, including curves, local deviations, and dynamic avoidance behaviors. This means that, although both approaches identify the same sequence of spaces to traverse, the geometric representation of the paths differs, causing variations in the total distance. The differences found within the same method, particularly between different route segments, are mainly influenced by the spatial complexity of the environments passed through, as paths with long corridors with unusual geometries or vertical connections involving multiple levels can increase the differences. Conversely, paths characterized by simpler geometries and more direct connections show smaller deviations. It is important to note that consistency in the sequence of rooms traversed confirms that these differences do not stem from errors in the pathfinding logic, but rather from the level of geometric abstraction adopted in each method.
5.5. Evaluations on the IFC Methodology and the Results Obtained
The analysis of the results confirms the correct operation of the IfcOpenShell approach. Although the distances calculated using the script do not perfectly match those obtained from agent-based simulation software, the paths are nevertheless topologically consistent. The observed differences are due to the geometric simplification adopted, which structures the environment as a set of segments connecting the centroids of spaces and doors. In some cases, this simplification can lead to significant deviations from the actual path length. Despite this approximation, the methodology provides a coherent and readable representation of the spatial layout. Moreover, the graph construction is scalable and effective even for highly complex models, such as the hospital case study, which includes over 700 rooms distributed across multiple levels. The script has also been tested on simpler models, confirming the adaptability and generalizability of the methodology to a wide range of buildings. Additionally, in constructing the graph, the standard relationships provided by the IFC schema were used to extract the necessary information. This approach allows relying on the semantic structure of the model, avoiding dependence solely on geometrical proximity criteria, and is compatible with all models compliant with the open IFC format.
However, a critical issue emerged concerning the quality of the IFC input, which depends on the modeling and the complexity of the model itself. Since IFC models are generally generated through export procedures from BIM authoring software, the effectiveness of the proposed path analysis depends heavily on the quality, consistency, and completeness of the IFC input data. For the methodology to work correctly, a set of minimum requirements relating to geometric and semantic content must be met. Firstly, spaces must be explicitly modelled as IfcSpace entities and correctly associated with their corresponding IfcBuildingStorey, ensuring correct identification of walkable areas. Secondly, doors must be correctly modelled as IfcDoor, including their positioning within walls and their association with adjacent spaces through standard IFC relationships, so that the connection between spaces is correct. From a geometric point of view, the reliability of the analysis requires consistent object geometry and well-defined local coordinate systems. In particular, the origin point and orientation (RefDirection) of doors and spaces must be defined consistently. Ambiguities in geometric reference systems can affect the accurate calculation of node positions and connection directions. Finally, vertical connection elements must be modelled consistently. In this study, lifts are represented as closed IfcSpace entities connected across multiple floors; however, the methodology can be further generalized by adopting the IfcTransportElement entity provided by the IFC schema. Ensuring a clear and standardized representation of vertical connections is essential for reliable analysis of multi-level paths.
For example, it is observed that the origin point of the door family does not always coincide with the end of the extrusion representing it within the wall, compromising the correct positioning of the door centroid in the graph. This highlights how the reliability of the analysis strongly depends on the geometric and semantic consistency of the IFC model. Furthermore, it is found that the reference direction (RefDirection) of entities is not always explicitly defined as an attribute, but in some cases is inherited from the container element in which the entity is nested. Such a hierarchical structure, typical of more complex IFC models, requires an additional level of processing by the script. On the other hand, the chosen methodology for path analysis, through the integration of graphs and the informational structure of the models, uses the Bonsai software (version 0.8.1), which allows working directly on the IFC model without the need for intermediate exports or conversions to other formats, ensuring a more streamlined workflow without data loss. Although the results obtained are not fully comparable with those generated by agent-based simulation software such as Pathfinder 2009, the proposed methodology offers the advantage of greater adaptability to IFC files. The use of IfcOpenShell allows for a simplified analysis focused on the static calculation of distances but remains effective for functional spatial evaluation in the preliminary design phases. It enables an analysis of the distribution and organization of spaces within the IFC model, providing a quick and flexible tool for an initial verification of the spatial quality of the project.
Regarding Topologic, it emerged that its use within the Dynamo environment is not suitable for efficiently managing the high data load and complexity of the model adopted as a case study. The IfcOpenShell-based method, on the other hand, demonstrated greater effectiveness, being able to handle and analyze the same volume of data more smoothly and scalable. This performance difference is mainly attributable to the different nature of the formats and approaches used by the two tools. Topologic operates on BIM models rich in geometric information and attributes, which, once imported into Dynamo, significantly increase the computational load. Conversely, the integration between Blender and IfcOpenShell allows for more precise control over the data to be processed, also enabling selective operation on specific elements of the IFC model, limiting the loading to what is strictly necessary for the analysis. Moreover, the use of the IFC format represents an additional advantage: being of an open and widely interoperable standard, it allows us to work not only with models from Revit but also with other BIM software. This makes it possible to generate graph structures directly from the semantic hierarchy of the IFC model, leveraging standard relationships without the need for intermediate conversions.
6. Conclusions
In this study, the focus is primarily on the automated transportation of non-clinical materials that are characterized by high frequency, standardized handling requirements, and low interaction with patients and medical staff. In particular, the methodology is applied to the logistics of clean and dirty linen, which represents one of the most repetitive and spatially distributed internal flows in hospital facilities. Linen transport is a suitable use case for AGV-based systems, as it involves predictable routes, regular schedules, and centralized storage areas, making it ideal for testing and validating path optimization strategies in complex multi-level environments. Although the case study presented in this paper refers to laundry logistics, the proposed methodology is not limited to this specific application. The approach is inherently generalizable and can be extended to other internal hospital logistics scenarios, such as the transportation of medications, sterile medical supplies, meals, biological samples, and waste, provided that these flows are compatible with automated handling. By relying on BIM and IFC-based spatial and semantic information, the method can support the analysis and optimization of AGV routes across different operational scenarios, contributing to more efficient, safe, and scalable hospital logistics planning.
The paper aims to design and analyze an AGV system for managing internal logistics within the new Cesena hospital. A methodology is developed based on graph modeling of the internal connection network, derived from BIM models in the IFC format. This approach allows the spatial complexity of the building to be translated into a network of interconnected two-dimensional elements, functional for analyzing optimal routes for AGV vehicles. By integrating logistical optimization with architectural modeling, this research contributes to the digital transformation of the construction sector, aligning with the goals of high-performance building management.
Two methodologies for graph construction are compared: the first uses Topologic integrated into Dynamo, while the second is based on the IfcOpenShell library within the Bonsai environment in Blender. The analysis shows that the latter approach is more effective and scalable, especially for complex models like the one analyzed, containing over 700 rooms distributed across multiple levels. By enabling the direct selection of relevant entities within the IFC model and leveraging the semantic relationships provided by the standard, the computational load is significantly reduced while maintaining a coherent representation of the spatial structure. This allows the construction of informational graphs directly from the semantic hierarchy of the model, without the need for conversions or pre-processing, simplifying the workflow and ensuring interoperability with models generated by different BIM software. Promoting such vendor-neutral workflows is a strategic requirement for the long-term sustainability and resilience of digital building records.
Integration with the Pathfinder 2009 software provides a useful tool for comparison and verification. The paths generated through the graph, although simplified compared to those simulated, are topologically consistent. The differences observed are mainly due to the linear representation of the paths and the geometric simplification applied by the script, but do not compromise the validity of the analysis. However, the analysis highlights some critical issues related to the quality of the IFC input model, particularly regarding the geometric and semantic consistency of objects and the explicit definition of attributes. These factors directly influence the effectiveness of the script, sometimes requiring more complex recursive processing to obtain correct information on positioning and directionality. Another limitation concerns the simplification of the actual spatial complexity of the rooms and connections within the building, leading to approximations in estimating traveled distances, especially in irregular or structurally complex environments. A further critical point relates to the management of vertical transport devices. In this work, the focus is on elevators, modeled as rooms, while stairs and escalators are not considered. This represents a limitation in the generalizability of the method, which can be overcome by directly adopting the IfcTransportElement entity provided by the IFC schema, making the methodology less dependent on the naming of elements. A further limitation of the current implementation concerns the optimizations criterion adopted for route definition. In this study, route planning is mainly based on minimizing geometric distance, which represents a necessary reference basis for validating the proposed BIM-IFC-graph-based methodology. However, real hospital logistics scenarios are inherently multi-criteria, as the AGV route is influenced by additional factors such as transport timeliness, energy consumption, congestion levels, and the likelihood of conflicts with pedestrians or other vehicles. The proposed methodology can be extended towards a multi-objective optimization model. Travel time can be incorporated into delays related to vertical transport systems or congestion; energy consumption can be linked to route length, number of stops and slope, while the probability of conflict can be estimated using semantic information from the IFC model, such as functional zoning or expected pedestrian density. This may be a direction for future research, aimed at better aligning AGV routing strategies with the operational needs of hospital logistics.
Overcoming these challenges will further bridge the gap between building design and real-time facility management, offering a powerful framework to enhance the functional resilience and technological maturity of modern healthcare infrastructures.
Author Contributions
Conceptualization, B.M.T., G.D.C. and C.Z.; methodology, B.M.T., G.D.C. and C.Z.; software, B.M.T.; validation, B.M.T.; formal analysis, B.M.T.; investigation, B.M.T.; resources, C.Z.; data curation, B.M.T.; writing—original draft preparation, B.M.T.; writing—review and editing, G.D.C. and C.Z.; visualization, B.M.T., G.D.C. and C.Z.; supervision, G.D.C. and C.Z.; project administration, C.Z.; funding acquisition, C.Z. All authors have read and agreed to the published version of the manuscript.
Funding
This research received no external funding.
Data Availability Statement
The data supporting the findings of this study are not publicly available. No publicly archived datasets were generated during the research. Data may be made available from the corresponding author.
Acknowledgments
During the preparation of this manuscript, the authors used ChatGPT (OpenAI, GPT4, web platform) and DeepL Translator (web, accessed January 2026) for the purpose of language editing and text refinement. The authors reviewed and edited the output and take full responsibility for the content of this publication.
Conflicts of Interest
The authors declare no conflicts of interest.
References
- Bacik, J.; Durovsky, F.; Biros, M.; Kyslan, K.; Perdukova, D.; Padmanaban, S. Pathfinder-Development of Automated Guided Vehicle for Hospital Logistics. IEEE Access 2017, 5, 26892–26900. [Google Scholar] [CrossRef]
- Lin, Y.-H.; Liu, Y.-S.; Gao, G.; Han, X.-G.; Lai, C.-Y.; Gu, M. The IFC-based path planning for 3D indoor spaces. Adv. Eng. Inform. 2013, 27, 189–205. [Google Scholar] [CrossRef]
- IfcOpenShell—The Open Source IFC Toolkit and Geometry Engine. Available online: https://ifcopenshell.org/ (accessed on 27 November 2025).
- Zhou, X.; Xie, Q.; Guo, M.; Zhao, J.; Wang, J. Accurate and Efficient Indoor Pathfinding Based on Building Infor-mation Modeling Data. IEEE Trans. Ind. Inform. 2020, 16, 7459–7468. [Google Scholar] [CrossRef]
- Euler, Y.L. The solution of a problem relating to the geometry of position. Comment. Acad. Sci. Petropolitanae 1741, 8, 128–140. [Google Scholar]
- Chen, A.Y.; Chu, J.C. TDVRP and BIM Integrated Approach for In-Building Emergency Rescue Routing. J. Comput. Civ. Eng. 2016, 30, C4015003. [Google Scholar] [CrossRef]
- Hamieh, A.; Ben Makhlouf, A.; Louhichi, B.; Deneux, D. A BIM-based method to plan indoor paths. Autom. Constr. 2020, 113, 103120. [Google Scholar] [CrossRef]
- Liu, L.; Zlatanova, S.; Liu, L.; Zlatanova, S. A “Door-to-Door” Path-Finding Approach for Indoor Navigation. 2011. Available online: https://www.researchgate.net/publication/254908128 (accessed on 20 November 2025).
- Lin, W.Y.; Lin, P.H. Intelligent generation of indoor topology (i-GIT) for human indoor pathfinding based on IFC models and 3D GIS technology. Autom. Constr. 2018, 94, 340–359. [Google Scholar] [CrossRef]
- Jabi, W.; Chatzivasileiadi, A. Topologic: Exploring Spatial Reasoning Through Geometry, Topology, and Semantics. In Advances in Science, Technology and Innovation; Springer Nature: Berlin/Heidelberg, Germany, 2021; pp. 277–285. [Google Scholar] [CrossRef]
- Jabi, W.; Chatzivasileiadi, A.; Wardhana, N.; Lannon, S.; Aish, R. The Synergy of Non-Manifold Topology and Reinforcement Learning for Fire Egress. 2019. Available online: https://orca.cardiff.ac.uk/id/eprint/124949/ (accessed on 28 October 2025).
- Aish, R.; Pratap, A. Spatial Information Modeling of Buildings Using Non-Manifold Topology with ASM and DesignScript. In Advances in Architectural Geometry 2012; Springer: Vienna, Austria, 2013; pp. 25–36. [Google Scholar] [CrossRef][Green Version]
- Essawy, Y.A.S.; Abdullah, A.; Nassar, K. Graph Representation for Emergency Egress Code Analysis; Lecture Notes in Civil Engineering; Springer Nature: Cham, Switzerland, 2022; Volume 367, pp. 617–627. [Google Scholar] [CrossRef]
- Ismail, A.; Nahar, A.; Scherer, R. Application of Graph Databases and Graph Theory Concepts for Advanced Analysing of BIM Models Based on IFC Standard. 2017. Available online: www.neo4j.com (accessed on 20 November 2025).
- Tauscher, E.; Bargstädt, H.-J.; Smarsly, K. Generic BIM queries based on the IFC object model using graph theory. In Proceedings of the 16th International Conference on Computing in Civil and Building Engineering, Osaka, Japan, 6–8 July 2016. [Google Scholar]
- UNI EN ISO 16739-1:2024; Industry Foundation Classes (IFC) per La Condivisione Di Dati Nel Settore Delle Costruzioni. ISO: Geneva, Switzerland, 2024.
- Khalili, A.; Chua, D.K.H. IFC-Based Graph Data Model for Topological Queries on Building Elements. J. Comput. Civ. Eng. 2015, 29, 04014046. [Google Scholar] [CrossRef]
- Isaac, S.; Sadeghpour, F.; Navon, R. Analyzing Building Information Using Graph Theory. In Proceedings of the 30th International Symposium on Automation and Robotics in Construction and Mining, Montreal, QC, Canada, 11–15 August 2013. [Google Scholar]
- Deng, H.; Fan, Z.; Wei, X.; Deng, Y. An ontology-based approach to dynamic indoor fire emergency evacuation path planning with BIM integration. J. Build. Eng. 2025, 106, 112562. [Google Scholar] [CrossRef]
- Liu, N.; Hu, Z.; Wei, M.; Guo, P.; Zhang, S.; Zhang, A. Improved A* algorithm incorporating RRT* thought: A path planning algorithm for AGV in digitalised workshops. Comput. Oper. Res. 2025, 177, 106993. [Google Scholar] [CrossRef]
- Hart, P.E.; Nilsson, N.J.; Raphael, B. A Formal Basis for the Heuristic Determination of Minimum Cost Paths. IEEE Trans. Syst. Sci. Cybern. 1968, 19, 100–107. [Google Scholar]
- Dijkstra, E.W. A Note on Two Problems in Connexion with Graphs. Numer. Math. 1959, 1, 269–271. [Google Scholar] [CrossRef]
- Pang, B.; Shi, J.; Jiang, L.; Pan, Z. A Semantic Approach to Dynamic Path Planning for Fire Evacuation through BIM and IoT Data Integration. Adv. Civ. Eng. 2024, 2024, 8839865. [Google Scholar] [CrossRef]
- Xu, M.; Wei, S.; Zlatanova, S.; Zhang, R. BIM-based indoor path planning considering obstacles. ISPRS Ann. Photogramm. Remote Sens. Spat. Inf. Sci. 2017, IV-2/W4, 417–423. [Google Scholar] [CrossRef]
- Soltani, A.; Tawfik, H.; Goulermas, J.; Fernando, T. Path planning in construction sites: Performance evaluation of the dijkstra, a*, and GA search algorithms. Adv. Eng. Inform. 2002, 16, 291–303. [Google Scholar] [CrossRef]
- Wang, X.; Lu, J.; Ke, F.; Wang, X.; Wang, W. Research on AGV task path planning based on improved A* algorithm. Virtual Real. Intell. Hardw. 2023, 5, 249–265. [Google Scholar] [CrossRef]
- Hu, J.; Shang, W.; Lou, H. Research on AGV Path Based on Optimal Planning; ACM International Conference Proceeding Series; Association for Computing Machinery: New York, NY, USA, 2021; pp. 236–240. [Google Scholar] [CrossRef]
- Wang, D.; Liu, B.; Jiang, H.; Liu, P. Path Planning for Construction Robot Based on the Improved A* Algorithm and Building Information Modeling. Buildings 2025, 15, 719. [Google Scholar] [CrossRef]
- Chen, Z.; Chen, K.; Song, C.; Zhang, X.; Cheng, J.C.; Li, D. Global path planning based on BIM and physics engine for UGVs in indoor environments. Autom. Constr. 2022, 139, 104263. [Google Scholar] [CrossRef]
- Wang, H.; Qi, X.; Lou, S.; Jing, J.; He, H.; Liu, W. An efficient and robust improved a* Algorithm for path planning. Symmetry 2021, 13, 2213. [Google Scholar] [CrossRef]
- Liu, Y.; Wang, L. AGV Path Planning: An Improved A∗ Algorithm Based on Bézier Curve Smoothing. In Proceedings of the 2024 39th Youth Academic Annual Conference of Chinese Association of Automation (YAC 2024), Dalian, China, 7–9 June 2024; pp. 243–247. [Google Scholar] [CrossRef]
- Akter, J.; Sultana, S.; Hossain, M.; Datta, S.D.; Tutul, T.E. A BIM-based simulation and evacuation assessment to improve fire safety management. J. Build. Pathol. Rehabil. 2025, 11, 44. [Google Scholar] [CrossRef]
- Sabbaghzadeh, M.; Sheikhkhoshkar, M.; Talebi, S.; Rezazadeh, M.; Moghaddam, M.R.; Khanzadi, M. A BIM-Based Solution for the Optimisation of Fire Safety Measures in the Building Design. Sustainability 2022, 14, 1626. [Google Scholar] [CrossRef]
- Liu, L.; Li, B.; Zlatanova, S.; van Oosterom, P. Indoor navigation supported by the Industry Foundation Classes (IFC): A survey. Autom. Constr. 2021, 121, 103436. [Google Scholar] [CrossRef]
- Liu, X.; He, C.; Zhao, H.; Jia, J.; Liu, C. Building information modeling indoor path planning: A lightweight approach for complex BIM building. Comput. Animat. Virtual Worlds 2021, 32, e2014. [Google Scholar] [CrossRef]
- Dugstad, A.; Dubey, R.K.; Abualdenien, J.; Borrmann, A. BIM-based disaster response Facilitating indoor path planning for various agents. In ECPPM 2022-eWork and eBusiness in Architecture, Engineering and Construction 2022; CRC Press: Boca Raton, FL, USA, 2023. [Google Scholar]
- Mastino, C.C.; Vaičiūnas, J.; Possidente, R.; Frattolillo, A.; Zavari, M.; Da Pos, V. A Digital Twins Model Based on IFC Open BIM Models Managed on Web Platforms. In Building Digital Twins, Lecture Notes in Civil Engineering; Jurelionis, A., Fokaides, P.A., Mazzarella, L., Hartmann, T., Eds.; Springer Nature: Cham, Switzerland, 2026; pp. 26–39. [Google Scholar] [CrossRef]
- Félix-Cigalat, J.S.; Domingo, R. Towards a Digital Twin Warehouse through the Optimization of Internal Transport. Appl. Sci. 2023, 13, 4652. [Google Scholar] [CrossRef]
- Fatemifar, K.; Zeng, Q.; Pishdad, P. BIM and IoT Integration for Construction and Logistics Management: A State-of-the-Art Review. In Proceedings of the 32nd Annual Conference of the International Group for Lean Construction (IGLC 32), Auckland, New Zealand, 1–5 July 2024; pp. 633–647. [Google Scholar] [CrossRef]
- Mirahadi, F.; McCabe, B.; Shahi, A. IFC-centric performance-based evaluation of building evacuations using fire dynamics simulation and agent-based modeling. Autom. Constr. 2019, 101, 1–16. [Google Scholar] [CrossRef]
- Morvan, G. Multi-level agent-based modeling—A literature survey. arXiv 2013, arXiv:1205.0561. [Google Scholar]
- Macal, C.; North, M. Proceedings of the 2011 Winter Simulation Conference; IEEE: New York, NY, USA, 2011. [Google Scholar]
- De Cet, G.; Mancin, F.; Vianello, C.; Mocellin, P.; Murer, G.; Benedetti, S.; Mattè, M.; Ronchi, E. Evacuation of a Paediatric Hospital Ward in Italy: Lessons Learnt From an Announced Evacuation Drill. Collect. Dyn. 2024, 9, 1–8. [Google Scholar] [CrossRef]
- Wang, L.; Xiang, Z.; Chen, Y.; Li, D.; Wang, J. Simulation and Optimization of Emergency Evacuation of Hu-oshenshan Hospital Based on BIM and Pathfinder. SHS Web Conf. 2022, 151, 01004. [Google Scholar] [CrossRef]
- Setola, N. Percorsi, Flussi e Persone Nella Progettazione Ospedaliera; Firenze University Press: Firenze, Italy, 2013; Volume 150, ISBN 9788866553847. [Google Scholar]
- Fazlollahtabar, H.; Mehrabad, M.S. Optimising a multi-objective reliability assessment in multiple AGV manu-facturing system. Int. J. Serv. Oper. Manag. 2013, 16, 352. [Google Scholar] [CrossRef]
- Vis, I.F. Survey of research in the design and control of automated guided vehicle systems. Eur. J. Oper. Res. 2006, 170, 677–709. [Google Scholar] [CrossRef]
- Ho, G.; Tang, Y.M.; Leung, E.K.; Tong, P. Integrated reinforcement learning of automated guided vehicles dynamic path planning for smart logistics and operations. Transp. Res. Part E Logist. Transp. Rev. 2025, 196, 104008. [Google Scholar] [CrossRef]
- Dao, T.-K.; Ngo, T.-G.; Pan, J.-S.; Nguyen, T.-T.; Nguyen, T.-T. Enhancing Path Planning Capabilities of Automated Guided Vehicles in Dynamic Environments: Multi-Objective PSO and Dynamic-Window Approach. Biomimetics 2024, 9, 35. [Google Scholar] [CrossRef]
- Wang, K.; Liang, W.; Shi, H.; Zhang, J.; Wang, Q. Optimal time reuse strategy-based dynamic multi-AGV path planning method. Complex Intell. Syst. 2024, 10, 7089–7108. [Google Scholar] [CrossRef]
Figure 1.
Research methodological workflow. The diagram illustrates the data transition from BIM/IFC architectural modeling to topological graph generation and the final dynamic validation in Pathfinder, incorporating AGV technical constraints and occupant interaction logic.
Figure 1.
Research methodological workflow. The diagram illustrates the data transition from BIM/IFC architectural modeling to topological graph generation and the final dynamic validation in Pathfinder, incorporating AGV technical constraints and occupant interaction logic.
Figure 2.
Workflow for room reconstruction in Dynamo: room boundaries are identified and converted into topological elements, assembled into closed polylines representing individual room perimeters, and finally extruded along the Z-axis to define the three-dimensional room volumes. The lines shown in the figure represent the room boundaries of the ground floor and first floor of the model.
Figure 2.
Workflow for room reconstruction in Dynamo: room boundaries are identified and converted into topological elements, assembled into closed polylines representing individual room perimeters, and finally extruded along the Z-axis to define the three-dimensional room volumes. The lines shown in the figure represent the room boundaries of the ground floor and first floor of the model.
Figure 3.
Extraction of simulation inputs from the building mapping script to compute the shortest path between rooms; graph readability is enhanced through aesthetic processing by highlighting room centroids in different colors, and results are visualized both in Dynamo/Topologic (a) and within the Revit environment (b).
Figure 3.
Extraction of simulation inputs from the building mapping script to compute the shortest path between rooms; graph readability is enhanced through aesthetic processing by highlighting room centroids in different colors, and results are visualized both in Dynamo/Topologic (a) and within the Revit environment (b).
Figure 4.
Incorporation of accessibility constraints into the graph construction by introducing a Department parameter for each room, enabling the filtering of public and private spaces and the generation of a CellComplex composed exclusively of publicly accessible rooms: (a) path generated without filtering the Department parameter; (b) path obtained by applying the filtering of publicly accessible spaces.
Figure 4.
Incorporation of accessibility constraints into the graph construction by introducing a Department parameter for each room, enabling the filtering of public and private spaces and the generation of a CellComplex composed exclusively of publicly accessible rooms: (a) path generated without filtering the Department parameter; (b) path obtained by applying the filtering of publicly accessible spaces.
Figure 5.
Graphical representation of movements on floor L3.
Figure 5.
Graphical representation of movements on floor L3.
Figure 6.
Graphical representation in Bonsai of clean linen routes. The image shows the eight routes, which start from the laundry deposit in the basement, arrive at the target and return to the AGV charging station in the basement.
Figure 6.
Graphical representation in Bonsai of clean linen routes. The image shows the eight routes, which start from the laundry deposit in the basement, arrive at the target and return to the AGV charging station in the basement.
Figure 7.
Graphical representation in Bonsai of dirty linen routes. The image shows the eleven dirty routes, which start from the AGV charging station in the basement, arrive at the target and return to the laundry deposit in the basement.
Figure 7.
Graphical representation in Bonsai of dirty linen routes. The image shows the eleven dirty routes, which start from the AGV charging station in the basement, arrive at the target and return to the laundry deposit in the basement.
Figure 8.
Graphical representation in pathfinder of linen routes. The lines crossing the floor plans represent the agents’ trajectories. The red elements are the AGVs.
Figure 8.
Graphical representation in pathfinder of linen routes. The lines crossing the floor plans represent the agents’ trajectories. The red elements are the AGVs.
Table 1.
Door, space and wall represent nodes; arc represents the segment that connects two nodes of the graph.
Table 1.
Door, space and wall represent nodes; arc represents the segment that connects two nodes of the graph.
| | Door | Space | Wall | ARC |
|---|
| L3 | 148 | 179 | 1022 | 855 |
| L2 | 137 | 167 | 899 | 776 |
| L1 | 161 | 189 | 950 | 905 |
| L0 | 223 | 249 | 1080 | 1271 |
| B1 | 58 | 50 | 205 | 187 |
| Elevator | - | - | - | 24 |
| Total | 1550 | 4174 | 4018 |
Table 2.
Occupant trigger’s properties.
Table 2.
Occupant trigger’s properties.
| Trigger Properties | Value | Description |
|---|
| Rank | - | No specific priority has been assigned to the triggers, so that their influence remains equally relevant to the movement of each of the AGVs. |
| Behavior | Wait at trigger | When an AGV interacts with a trigger, it modifies its behavior, performing awaiting action until the trigger leaves the pre-set range of action. |
| Wait area radius | 0.5 m | |
| Wait time | 10 s | |
| Allowed occupants | All | All AGVs must be affected by triggers. |
| Decision time | Automatic | If the agent is moving towards the destination (seeking), it immediately detects the presence of the trigger. |
| Remain aware | Yes | When an agent is moving towards its destination (seeking), it immediately detects the presence of the trigger and remains aware of it even after leaving its region of influence. |
| Awareness | Awareness | The trigger’s area of influence is defined as a circular region, centered on the trigger itself, within which the AGV trolley detects its presence. |
| Influence timeline | Global | The trigger’s influence on the agent’s behavior is active from the start of the simulation, resulting in continuous and unconditional interaction with AGV vehicles. |
| Ignore occupant susceptibility | Yes | The AGV is affected by the presence of the trigger in an unconditional manner. |
Table 3.
Laundry service routes.
Table 3.
Laundry service routes.
| | Start | Target | End |
|---|
| CLEAN | LAUNDRY DEPOSIT
RA0-I10-001 | CLEAN DEPOSITS | CENTRAL AGV
CA2-I10-011 |
| P1 | CA2-P00-056 |
| P2 | CA2-P00-113 |
| P3 | CA2-P10-114 |
| P4 | CA2-P10-030 |
| P5 | CA2-P10-071 |
| P6 | CA2-P20-103 |
| P7 | CA2-P30-103 |
| P8 | CA2-P10-073 |
| DIRTY | CENTRAL AGV
CA2-I10-011 | DIRTY DEPOSITS | DIRTY LAUNDRY DEPOSIT
RA0-I10-001 |
| P9 | CA2-P00-052 |
| P10 | CA2-P00-111 |
| P11 | CA2-P00-004 |
| P12 | CA2-P10-074 |
| P13 | CA2-P10-110 |
| P14 | CA2-P10-031 |
| P15 | CA2-P10-119 |
| P16 | CA2-P20-107 |
| P17 | CA2-P20-106 |
| P18 | CA2-P30-107 |
| P19 | CA2-P30-106 |
Table 4.
Calculated lengths in Bonsai for clean linen routes.
Table 4.
Calculated lengths in Bonsai for clean linen routes.
| | Segment 1 [m] | Segment 2 [m] | Segment Tot [m] |
|---|
| P1 | 115.7829 | 142.9137 | 258.6966 |
| P2 | 67.6984 | 94.8292 | 162.5276 |
| P3 | 79.8901 | 107.0209 | 186.9110 |
| P4 | 60.9354 | 88.0662 | 149.0016 |
| P5 | 121.0694 | 148.2002 | 269.2696 |
| P6 | 103.1106 | 130.2414 | 233.3520 |
| P7 | 104.9554 | 132.0862 | 237.0416 |
| P8 | 125.7035 | 152.8343 | 278.5378 |
Table 5.
Calculated lengths in Bonsai for dirty linen routes.
Table 5.
Calculated lengths in Bonsai for dirty linen routes.
| | Segment 1 [m] | Segment 2 [m] | Segment Tot [m] |
|---|
| P9 | 144.8417 | 115.7496 | 260.5913 |
| P10 | 98.7120 | 69.6199 | 168.3319 |
| P11 | 91.1783 | 64.0333 | 155.2116 |
| P12 | 154.7885 | 125.6965 | 280.4850 |
| P13 | 120.1690 | 73.0769 | 193.2459 |
| P14 | 93.9894 | 64.8974 | 158.8868 |
| P15 | 102.4025 | 73.3104 | 175.7129 |
| P16 | 135.3113 | 106.2192 | 241.5305 |
| P17 | 132.9141 | 103.8220 | 236.7361 |
| P18 | 136.9668 | 107.7747 | 244.7415 |
| P19 | 134.5130 | 105.4209 | 239.9339 |
Table 6.
Calculated lengths in pathfinder for clean linen routes.
Table 6.
Calculated lengths in pathfinder for clean linen routes.
| | Segment 1 [m] | Segment 2 [m] | Segment Tot [m] |
|---|
| P1 | 116.1650 | 129.0756 | 245.2406 |
| P2 | 69.7743 | 79.2331 | 149.0074 |
| P3 | 78.9263 | 82.9596 | 161.8859 |
| P4 | 52.1296 | 70.2068 | 122.3364 |
| P5 | 120.2493 | 131.5982 | 251.8475 |
| P6 | 86.2741 | 108.6009 | 194.8750 |
| P7 | 87.0841 | 104.3106 | 191.3947 |
| P8 | 123.3500 | 138.3748 | 261.7248 |
Table 7.
Calculated lengths in pathfinder for dirty linen routes.
Table 7.
Calculated lengths in pathfinder for dirty linen routes.
| | Segment 1 [m] | Segment 2 [m] | Segment Tot [m] |
|---|
| P9 | 114.3387 | 140.8044 | 255.1431 |
| P10 | 100.8751 | 66.5845 | 167.4596 |
| P11 | 91.9294 | 57.2102 | 149.1396 |
| P12 | 165.3553 | 115.9317 | 281.2870 |
| P13 | 108.6552 | 62.3272 | 170.9824 |
| P14 | 92.6770 | 62.3278 | 155.0048 |
| P15 | 119.0817 | 66.0874 | 185.1691 |
| P16 | 136.0367 | 87.2299 | 223.2666 |
| P17 | 133.2432 | 84.5986 | 217.8418 |
| P18 | 133.6176 | 87.0197 | 220.6373 |
| P19 | 126.4826 | 86.3276 | 212.8102 |
Table 8.
Comparison of the calculated lengths for clean linen service routes.
Table 8.
Comparison of the calculated lengths for clean linen service routes.
| | Segment 1 [m] | | Segment 2 [m] |
|---|
| | Bonsai | Pathfinder | Difference | Bonsai | Pathfinder | Difference |
|---|
| P1 | 115.7829 | 116.1650 | 0.3821 | 142.9137 | 129.0756 | 13.8381 |
| P2 | 67.6984 | 69.7743 | 2.0759 | 94.8292 | 79.2331 | 15.5961 |
| P3 | 79.8901 | 78.9263 | 0.9638 | 107.0209 | 82.9596 | 24.0613 |
| P4 | 60.9354 | 52.1296 | 8.8058 | 88.0662 | 70.2068 | 17.8594 |
| P5 | 121.0694 | 120.2493 | 0.8201 | 148.2002 | 131.5982 | 16.6020 |
| P6 | 103.1106 | 86.2741 | 16.8365 | 130.2414 | 108.6009 | 21.6405 |
| P7 | 104.9554 | 87.0841 | 17.8713 | 132.0862 | 104.3106 | 27.7756 |
| P8 | 125.7035 | 123.3500 | 2.3535 | 152.8343 | 138.3748 | 14.4595 |
Table 9.
Comparison of the calculated lengths for dirty linen service routes.
Table 9.
Comparison of the calculated lengths for dirty linen service routes.
| | Segment 1 [m] | | Segment 2 [m] |
|---|
| | Bonsai | Pathfinder | Difference | Bonsai | Pathfinder | Difference |
|---|
| P9 | 144.8417 | 114.3387 | 30.5030 | 115.7496 | 140.8044 | 25.0548 |
| P10 | 98.7120 | 100.8751 | 2.1631 | 69.6199 | 66.5845 | 3.0354 |
| P11 | 91.1783 | 91.9294 | 0.7511 | 64.0333 | 57.2102 | 6.8231 |
| P12 | 154.7885 | 165.3553 | 10.5668 | 125.6965 | 115.9317 | 9.7648 |
| P13 | 120.1690 | 108.6552 | 11.5138 | 73.0769 | 62.3272 | 10.7497 |
| P14 | 93.9894 | 92.6770 | 1.3124 | 64.8974 | 62.3278 | 2.5696 |
| P15 | 102.4025 | 119.0817 | 16.6792 | 73.3104 | 66.0874 | 7.2230 |
| P16 | 135.3113 | 136.0367 | 0.7254 | 106.2192 | 87.2299 | 18.9893 |
| P17 | 132.9141 | 133.2432 | 0.3291 | 103.8220 | 84.5986 | 19.2234 |
| P18 | 136.9668 | 133.6176 | 3.3492 | 107.7747 | 87.0197 | 20.7550 |
| P19 | 134.5130 | 126.4826 | 8.0304 | 105.4209 | 86.3276 | 19.0933 |
Table 10.
Differences in the calculated lengths of clean linen service routes in percentage terms.
Table 10.
Differences in the calculated lengths of clean linen service routes in percentage terms.
| | Segment 1 [m] | Segment 2 [m] | Total | Percentage |
|---|
| P1 | 0.3821 | 13.8381 | 13.4560 | 5.20% |
| P2 | 2.0759 | 15.5961 | 13.5202 | 8.32% |
| P3 | 0.9638 | 24.0613 | 25.0251 | 13.39% |
| P4 | 8.8058 | 17.8594 | 26.6652 | 17.90% |
| P5 | 0.8201 | 16.6020 | 17.4221 | 6.47% |
| P6 | 16.8365 | 21.6405 | 38.4770 | 16.49% |
| P7 | 17.8713 | 27.7756 | 45.6469 | 19.26% |
| P8 | 2.3535 | 14.4595 | 16.8130 | 6.04% |
Table 11.
Differences in the calculated lengths of dirty linen service routes in percentage terms.
Table 11.
Differences in the calculated lengths of dirty linen service routes in percentage terms.
| | Segment 1 [m] | Segment 2 [m] | Total | Percentage |
|---|
| P9 | 30.5030 | 25.0548 | 5.4482 | 2.09% |
| P10 | 2.1631 | 3.0354 | 0.8723 | 0.52% |
| P11 | 0.7511 | 6.8231 | 6.0720 | 3.91% |
| P12 | 10.5668 | 9.7648 | 0.8020 | 0.29% |
| P13 | 11.5138 | 10.7497 | 22.2635 | 11.52% |
| P14 | 1.3124 | 2.5696 | 3.8820 | 2.44% |
| P15 | 16.6792 | 7.2230 | 9.4562 | 5.38% |
| P16 | 0.7254 | 18.9893 | 18.2639 | 7.56% |
| P17 | 0.3291 | 19.2234 | 18.8943 | 7.98% |
| P18 | 3.3492 | 20.7550 | 24.1042 | 9.85% |
| P19 | 8.0304 | 19.0933 | 27.1237 | 11.30% |
| Disclaimer/Publisher’s Note: The statements, opinions and data contained in all publications are solely those of the individual author(s) and contributor(s) and not of MDPI and/or the editor(s). MDPI and/or the editor(s) disclaim responsibility for any injury to people or property resulting from any ideas, methods, instructions or products referred to in the content. |