Article

Designing Lighting Master Plans in Historical City Centers: A Structured Approach and Case Study from Adana

Department of Architecture, Faculty of Architecture, Çukurova University, 01330 Adana, Turkey
*
Author to whom correspondence should be addressed.
Buildings 2026, 16(5), 1030; https://doi.org/10.3390/buildings16051030

Submission received: 19 January 2026 / Revised: 19 February 2026 / Accepted: 3 March 2026 / Published: 5 March 2026
(This article belongs to the Special Issue Lighting Design for the Built Environment)

Abstract

Urban lighting is a fundamental element of the built environment, enabling the perception of both living and built components of the city at night. In historic city centers, effective lighting strategies play a pivotal role in enhancing visibility, legibility, and continuity while reinforcing cultural identity. This study introduces a typology-based, data-driven framework for developing sustainable lighting master plans tailored to the spatial, morphological, and heritage characteristics of historic urban environments. The methodology was applied to the historic core of Adana (Turkey), a Roman-era urban fabric with multi-layered cultural heritage, including significant assets such as the Tepebağ Mound and its surrounding structures. The proposed five-stage process—comprising analysis, definition, design, planning, and implementation—integrates on-site observations, horizontal illuminance measurements, thematic spatial mapping, and a Lighting Demand Index (LDI) based on six spatial criteria, for which equal weighting was adopted and validated using the Analytic Hierarchy Process (AHP). Lighting design proposals were developed according to defined typologies, and their compliance with international lighting standards was tested and verified through simulation. The framework provides a structured approach for reintegrating under-illuminated heritage zones into the contemporary nightscape in a sustainable and identity-focused manner, offering practical guidance for municipalities, planners, and lighting designers.

1. Introduction

Over time, evolving patterns of urban use and changing social habits have generated diverse lighting needs in cities. Since the 15th century, urban lighting has been employed primarily as a means of reducing crime and regulating nighttime activity [1]. With the expansion of cities and the intensification of nocturnal life—particularly during industrialization—street lighting became a critical urban infrastructure element. In major European cities such as London, Berlin, and Paris, early oil and gas lighting systems transformed public spaces and extended urban activity beyond daylight hours [2,3].
In the post-war period, urban lighting gradually expanded beyond its strictly functional role. While safety and visibility remained central objectives, lighting increasingly contributed to social interaction and spatial experience [4]. Advancements in lighting technologies further diversified outdoor applications, reinforcing the importance of nighttime usability in public spaces [2,5]. Contemporary urban lighting is therefore expected not only to ensure visual performance and safety but also to enhance spatial quality and user experience [6]. Particularly in culturally sensitive contexts, research emphasizes the importance of considering cognitive and emotional perception alongside technical criteria [7].
Lighting plays a crucial role in shaping urban readability and reinforcing a sense of place. By contributing to surveillance, perceived safety, and social trust, it supports both functional and symbolic dimensions of urban life [1]. Moreover, the integration of identity-based elements into nighttime environments strengthens what Norberg-Schulz defines as the “genius loci” of a place [8]. Consequently, lighting quality is closely linked to spatial perception, aesthetic coherence, and overall urban livability.
Recent studies highlight that lighting significantly influences the perceived image of cities and contributes to destination attractiveness [9,10]. Beyond safety and functionality, urban lighting actively shapes cultural infrastructure and nighttime identity [11]. In historic city centers, carefully coordinated lighting strategies can enhance visibility, support cultural tourism, and strengthen the experiential value of heritage environments.
However, despite this growing recognition, urban lighting in historic contexts is often addressed either through technically driven standard compliance or through isolated architectural interventions. Comprehensive master planning approaches that systematically integrate spatial morphology, conservation priorities, functional diversity, and performance validation remain limited. As a result, many heritage-sensitive environments lack a transparent, data-driven framework for prioritizing and implementing lighting interventions.
In response to this need, this study proposes a structured, typology-based lighting master planning framework tailored to historic urban contexts. Applied to the historic city center of Adana, the framework organizes and adapts established lighting design principles into a spatially explicit and performance-validated decision-support approach.
The study does not claim novelty in the individual analytical tools employed, such as spatial mapping, AHP, or lighting simulation. Rather, its contribution lies in their systematic integration into a coherent planning framework specifically developed for heritage-sensitive urban environments. By operationalizing spatial and cultural parameters within a transparent Lighting Demand Index (LDI) and translating prioritization results into simulation-verified design proposals aligned with international standards, the study advances a transferable and methodologically explicit model for historic city centers.

Theoretical Background

Lighting in historic urban environments presents a fundamentally different challenge from conventional street lighting practice. Unlike contemporary urban districts, historic city centers are composed of layered morphological structures, protected buildings, archeological remains, and culturally significant public spaces that require both visibility and interpretive sensitivity. While lighting can enhance legibility, safety, and nighttime activity, inappropriate or uncoordinated interventions may distort architectural character, flatten spatial depth, or weaken cultural identity.
Research highlights that many historic environments remain inadequately illuminated despite modernization efforts. In numerous cases, lighting installations prioritize general brightness across urban surfaces while neglecting architectural articulation and heritage value. As a result, façades and landmarks are either under-emphasized or excessively illuminated, producing visual imbalance and contributing to light pollution [12]. Such conditions not only compromise aesthetic coherence but may also diminish the cultural narrative embedded within historic urban fabrics.
Studies on nighttime tourism further demonstrate that lighting significantly shapes experiential perception in historic cities. Night atmospheres—formed through carefully calibrated brightness levels, contrasts, and spatial hierarchy—contribute to destination image and visitor experience [13]. However, existing research also notes that the integration of cultural tourism objectives with systematic lighting planning remains limited. Many interventions focus on individual monuments rather than addressing the broader urban network as a coherent nighttime system [13,14].
Another recurring issue in historic contexts concerns the absence of structured master planning approaches. While technical standards provide measurable criteria for illuminance and uniformity, they rarely account for conservation priorities, urban morphology, or symbolic value. Consequently, lighting decisions are often driven either by isolated aesthetic ambitions or by technical compliance alone, without a transparent framework for prioritization across different spatial layers [15]. This fragmentation limits the long-term sustainability and transferability of lighting strategies in heritage-sensitive areas.
Moreover, the transformation of public lighting systems—although frequently justified through energy efficiency goals—can significantly alter the perceived night image of cultural landscapes [16]. Even technically improved systems may unintentionally disrupt historic character if spatial hierarchy, façade articulation, and contextual coherence are not systematically considered.
Overall, the literature reveals a gap between technical lighting standards, heritage conservation principles, and experiential urban design. There is a clear need for structured, multi-layered planning frameworks that integrate spatial morphology, conservation value, functional hierarchy, and measurable performance criteria within a unified master planning approach. Addressing this gap forms the basis of the present study.

2. Materials and Methods

Advances in lighting technologies and simulation tools have facilitated the development of context-responsive lighting master plans, particularly in sensitive urban environments [17]. To address the specific requirements of historic urban areas, this study adopts a structured methodology grounded in established urban lighting standards and conservation principles. The framework integrates best practices from lighting design, urban morphology, and heritage planning into an applied decision-support system.
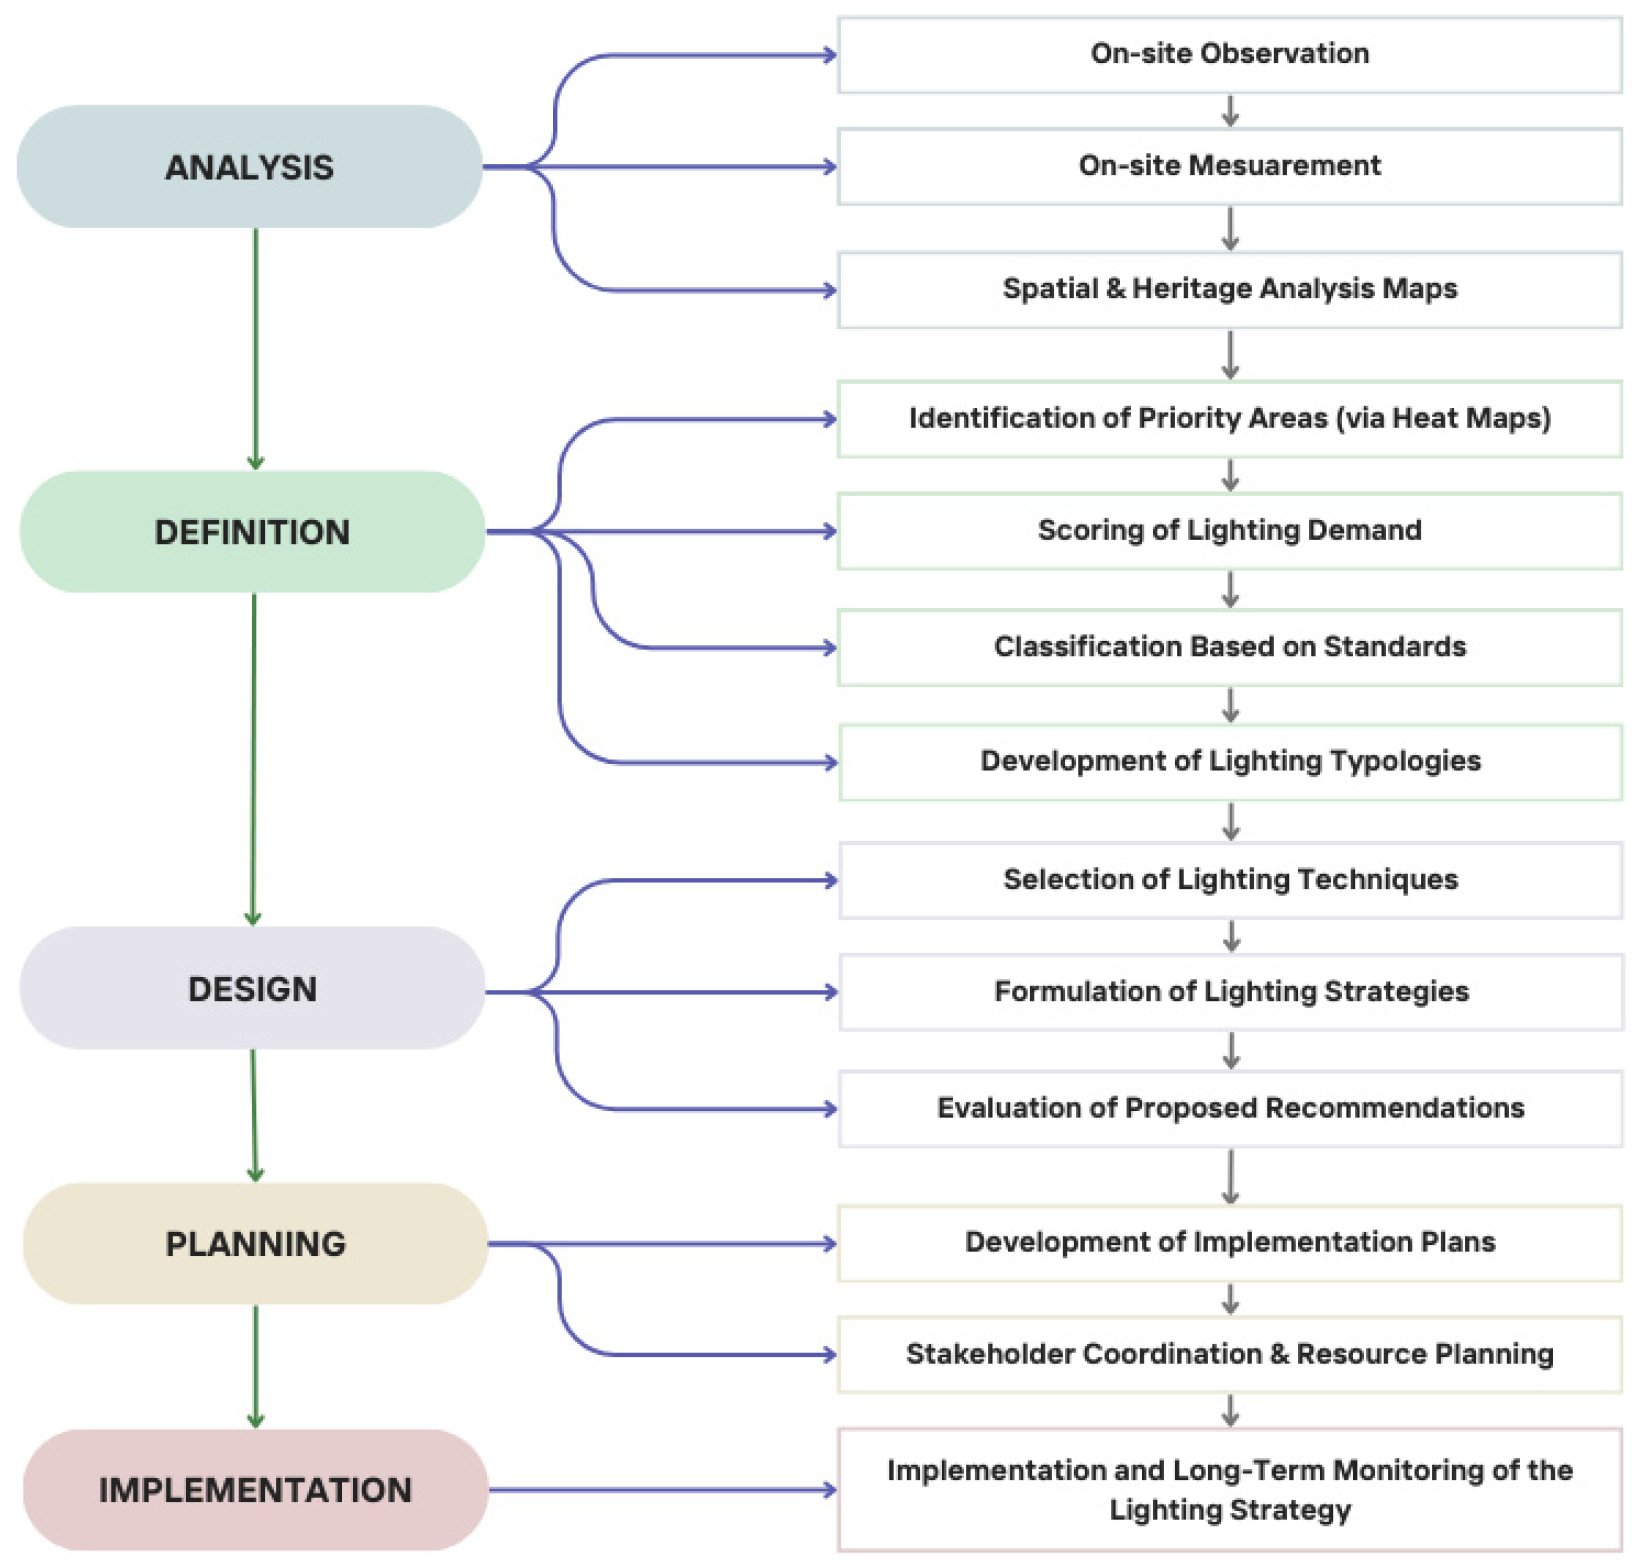
The methodological process is organized into five sequential stages—analysis, definition, design, planning, and implementation—structured to translate spatial evaluation into implementable lighting strategies for heritage-sensitive urban contexts.
The approach was used in the historic city center of Adana, Turkey, with an emphasis on typology-based classification, simulation-based performance evaluation, and spatial analysis of lighting requirements. The methodological process, tools, and standards employed at each step are described in this section.
Within the definition stage, the prioritization of lighting demand was structured as a multi-criteria decision-making problem. Because the entire study area represents a homogeneous heritage-sensitive environment, all six criteria were initially treated as equally important. AHP pairwise comparisons were used as a validation/consistency check (CR < 0.10), confirming that no single criterion dominated; therefore, equal weights were retained in the LDI calculation [18,19,20].

2.1. Steps for Developing a Lighting Master Plan

The concept of lighting master plans first gained traction in the 1980s, when lighting designers and other specialists began to use them as strategic tools to enhance the nighttime urban landscape and create functionally and aesthetically cohesive urban environments [21]. The primary aim of a lighting master plan is to offer consistent, efficient, and well-integrated solutions that improve the quality of urban lighting. A lighting master plan should strive to strike a balance between aesthetics, safety, comfort, and energy efficiency—enhancing the urban nighttime experience for its users [22].
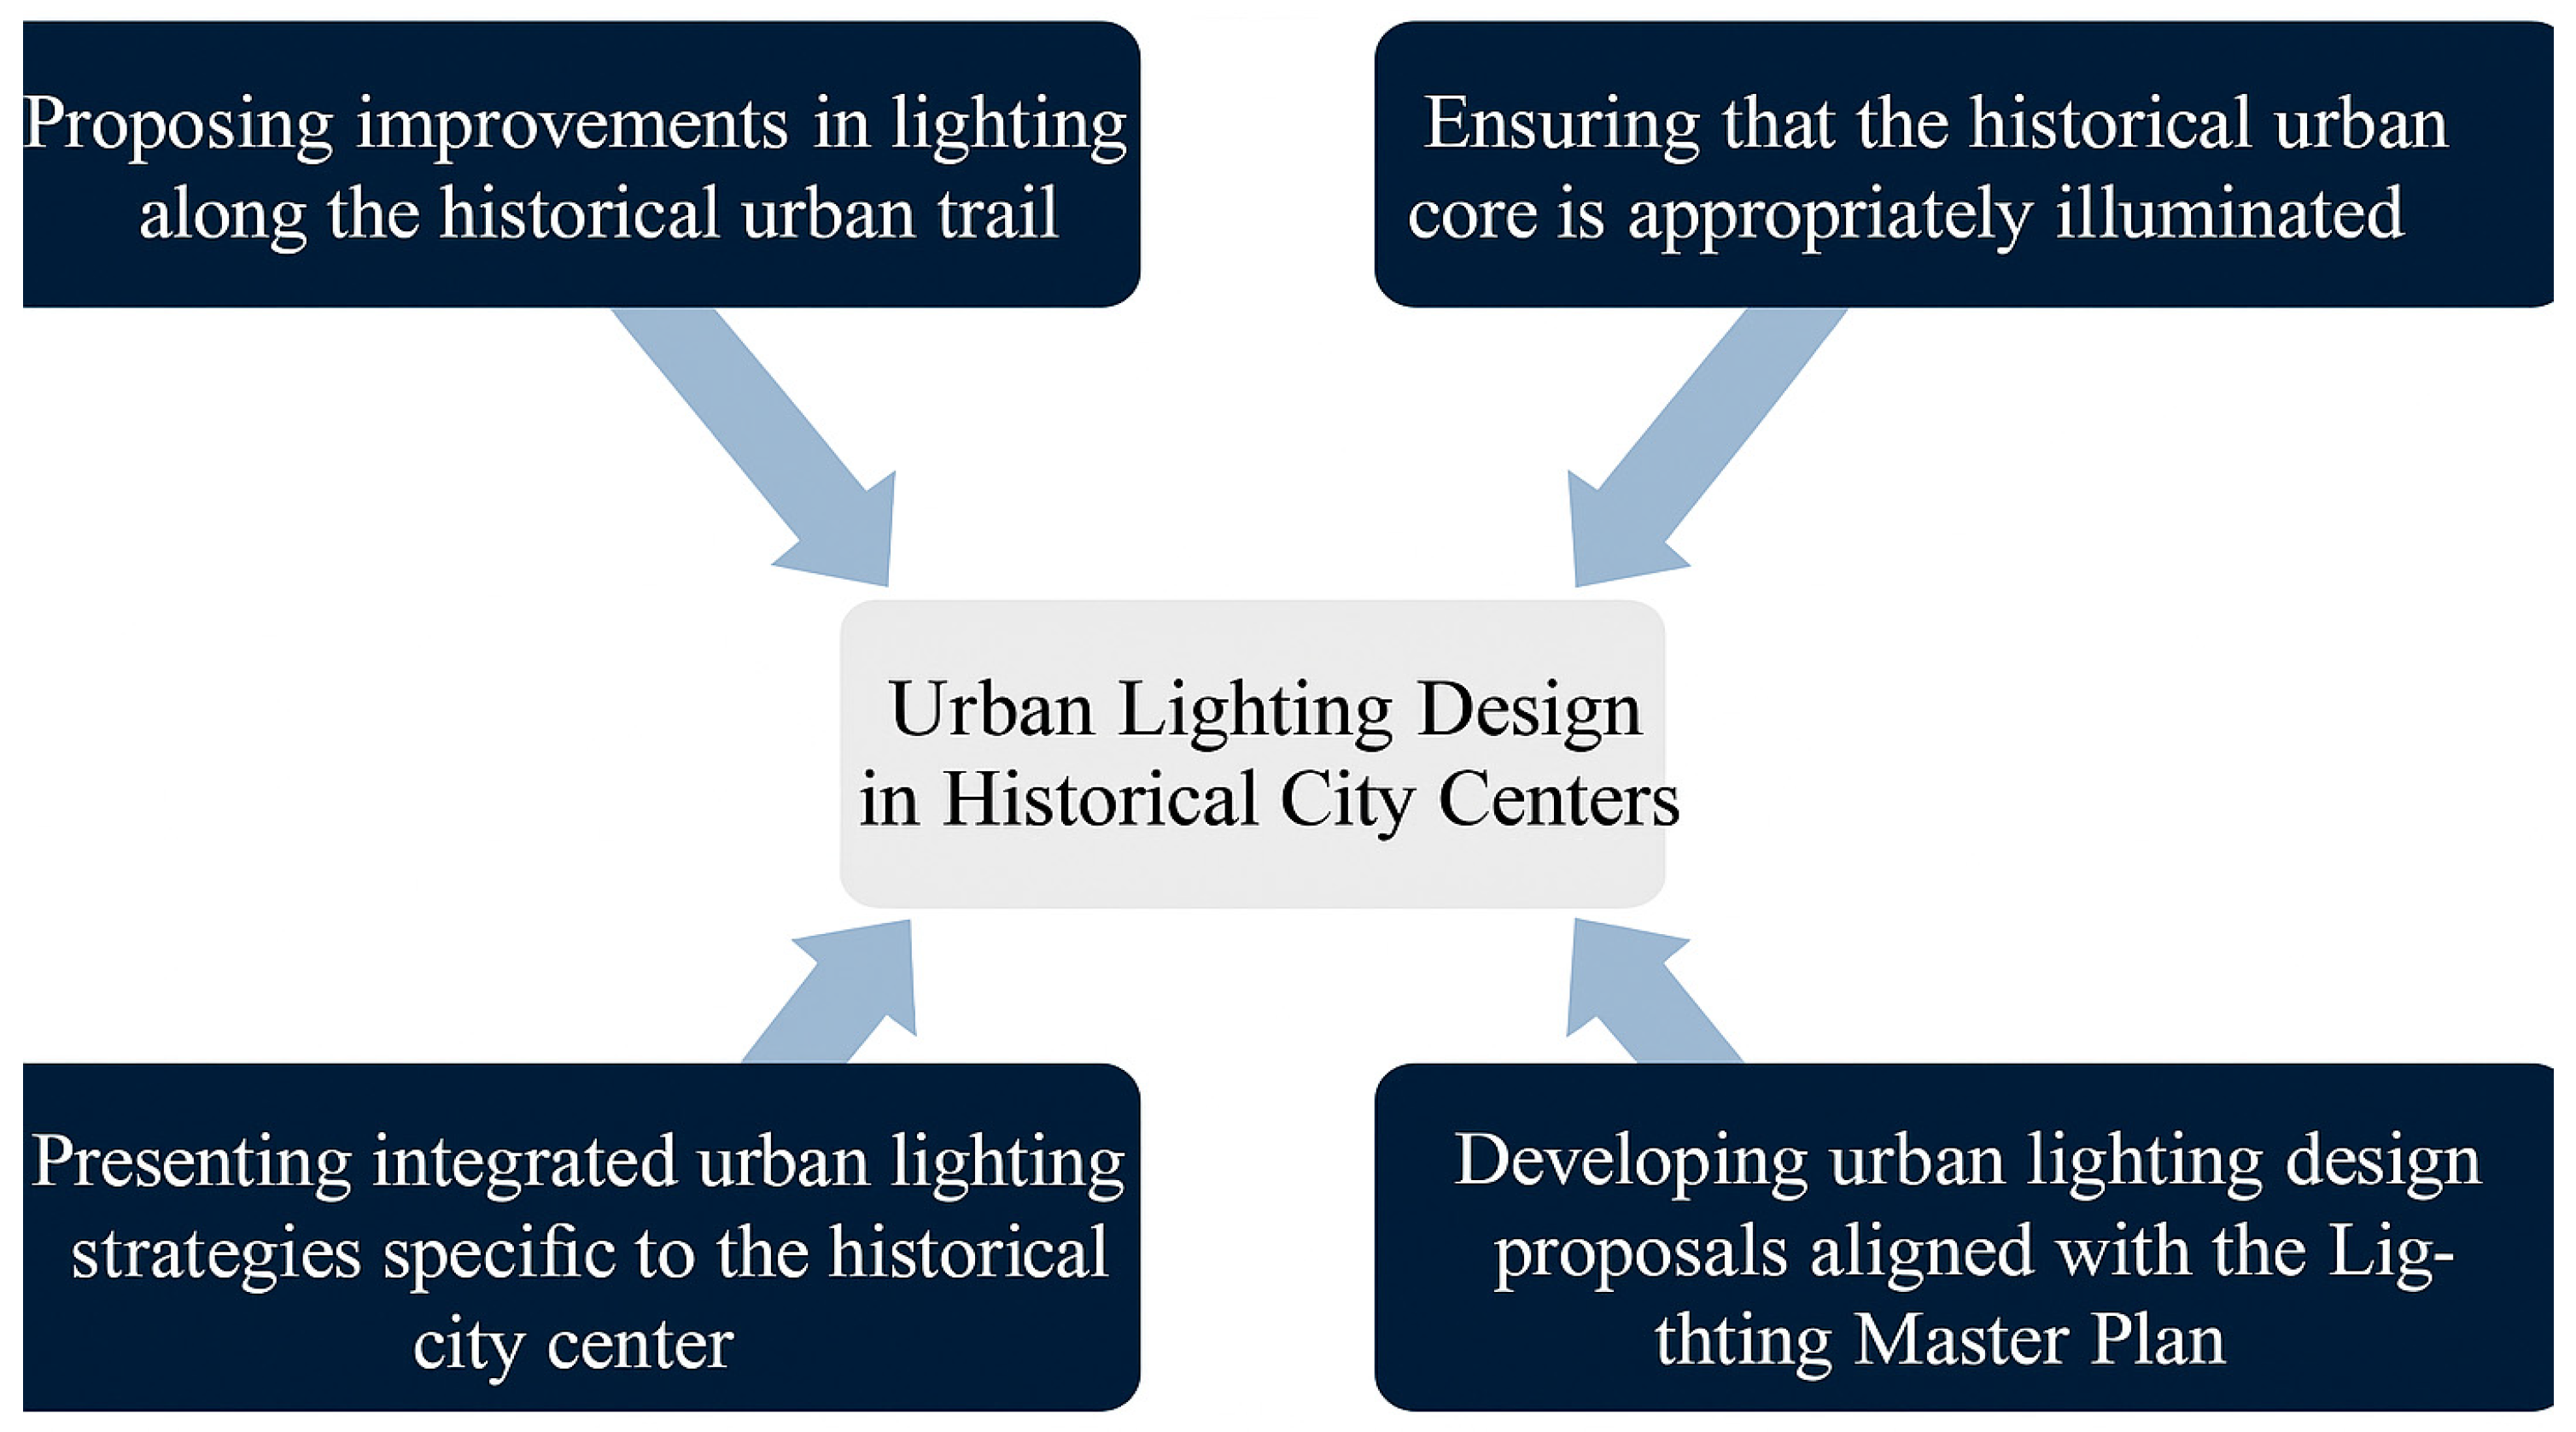
Over time, lighting master plans have evolved to not only meet functional needs but also to highlight key urban landmarks, contributing to the preservation or reinforcement of urban identity. Accordingly, lighting strategies shaped by a master planning approach can serve both utilitarian and symbolic functions. The proposed urban lighting design framework for historic areas is presented in Figure 1.
Designing urban lighting within a planning framework facilitates the development of coherent and practical solutions throughout the city. Within the scope of this study, a structured set of action steps was formulated to guide the development of a lighting master plan specifically for historic urban areas, considering urban characteristics and lighting needs (Figure 2). The methodology comprises five primary stages: Analysis, Definition, Design, Planning, and Implementation, each containing relevant sub-steps. Using this systematic framework, lighting design proposals were developed for the historical urban core of Adana, and the methodology was applied directly to this specific context. The holistic approach adopted here aims to serve as a model for similar lighting initiatives in other historical urban environments.
Below is a brief description of the main stages and sub-steps proposed in the Historical City Center Lighting Master Plan Framework:

2.1.1. Analysis

The analysis phase, which constitutes the first step of developing a lighting master plan, involves a comprehensive assessment of the selected urban area and its architectural features. The goal is to collect detailed data on elements such as building morphology, street networks, registered (heritage) buildings, and critical urban landmarks to determine existing lighting needs. Site observations and measurement campaigns are also conducted to assess current lighting conditions and identify areas where lighting is inadequate.
Through in situ observation and photographic documentation, the placement and visual impact of current lighting elements are evaluated, and major problems related to light pollution, disorganization, and lack of coherence are identified.
Field measurements are then carried out to assess horizontal illuminance levels for both pedestrian and vehicular circulation. These measurements are compared against applicable lighting standards to determine their adequacy.
In the spatial analysis phase, thematic maps were developed to reflect historical significance, functional land use, and spatial lighting demand across the study area. These include:
  • Archeological and Urban Conservation Areas
  • Registered Roads, Parcels, and Buildings
  • Lynch Analysis (urban imageability and landmarks)
  • Street Hierarchies and Functional Classifications
  • Building Density and Height Distributions
These maps serve as a basis for spatial prioritization, ranking areas from highest to lowest lighting demand.

2.1.2. Definition

The definition phase aims to establish a hierarchy among the areas to be illuminated, based on lighting demand intensity. Scores are assigned to specific zones, and the data obtained from the analysis maps are converted into heat maps reflecting lighting demand. These areas are then categorized according to their illuminance requirements and prioritized accordingly. By overlaying the heat maps, a single composite map is created to visualize the spatial hierarchy of lighting needs.
Key steps in this phase include:
Area Identification: Determining which streets, alleys, and public spaces will be targeted for lighting design.
Scoring: Assigning scores based on analysis map findings, which reflect the relative urgency of lighting needs.
Classification: Grouping streets into lighting categories in accordance with relevant standards, regulations, and guidelines.
Typology Development: Forming lighting typologies for streets and spaces based on their specific physical and functional characteristics.

2.1.3. Design

In the design phase, lighting proposals are developed based on the outcomes of the analysis and definition stages. The design strategies respond both to quantified lighting demand and to broader urban identity considerations within the historic context.
The performance of the proposed lighting scenarios was modeled and evaluated using DIALux evo 10 (DIAL GmbH, Lüdenscheid, Germany). For representative street typologies, average illuminance (Ēavg), maximum illuminance (Emax), and overall uniformity (Uo) values were calculated. The simulation results were compared with the performance requirements defined in TS EN 13201 (Parts 1–4) [23,24,25,26] and the SLL Code for Lighting (2022) [27] to verify compliance with the corresponding CE and S lighting classes.
This phase lays the groundwork for the subsequent planning and implementation phases and is intended to produce lighting designs that meet both technical requirements and symbolic objectives aligned with the city’s character.
Key considerations in this phase include:
Lighting Techniques: Selecting appropriate lighting technologies for each typology.
Luminaires: Determining the type, mounting height, spatial arrangement, color rendering index (CRI), and correlated color temperature (CCT).
Proposal Evaluation: Validating proposed lighting scenarios using simulation software and comparing results with field observations to ensure feasibility.

2.1.4. Planning

Once lighting performance and feasibility have been confirmed, the planning phase focuses on the practical implementation of proposals. This includes:
  • Developing detailed lighting plans,
  • Identifying stakeholders involved in the execution,
  • Planning resources, timelines, and coordination efforts.

2.1.5. Implementation

The final phase involves the technical execution of the proposed lighting designs within the urban context. To ensure long-term success, periodic monitoring and maintenance protocols are also recommended. Adhering to the methodological steps outlined above ensures that the specific lighting needs of historical urban areas are accurately assessed, efficiently categorized, and translated into implementable designs.

3. Field Study

To demonstrate the implementation of the proposed steps in the Historical City Center Lighting Master Plan Framework, a study area was selected within the historical urban fabric of Adana—a city located in southern Turkey that has hosted various civilizations throughout its history. The field study focuses on the first three phases of the methodology: Analysis, Definition, and Design. The subsequent phases of Planning and Implementation are intended to follow in future work.

3.1. Study Area

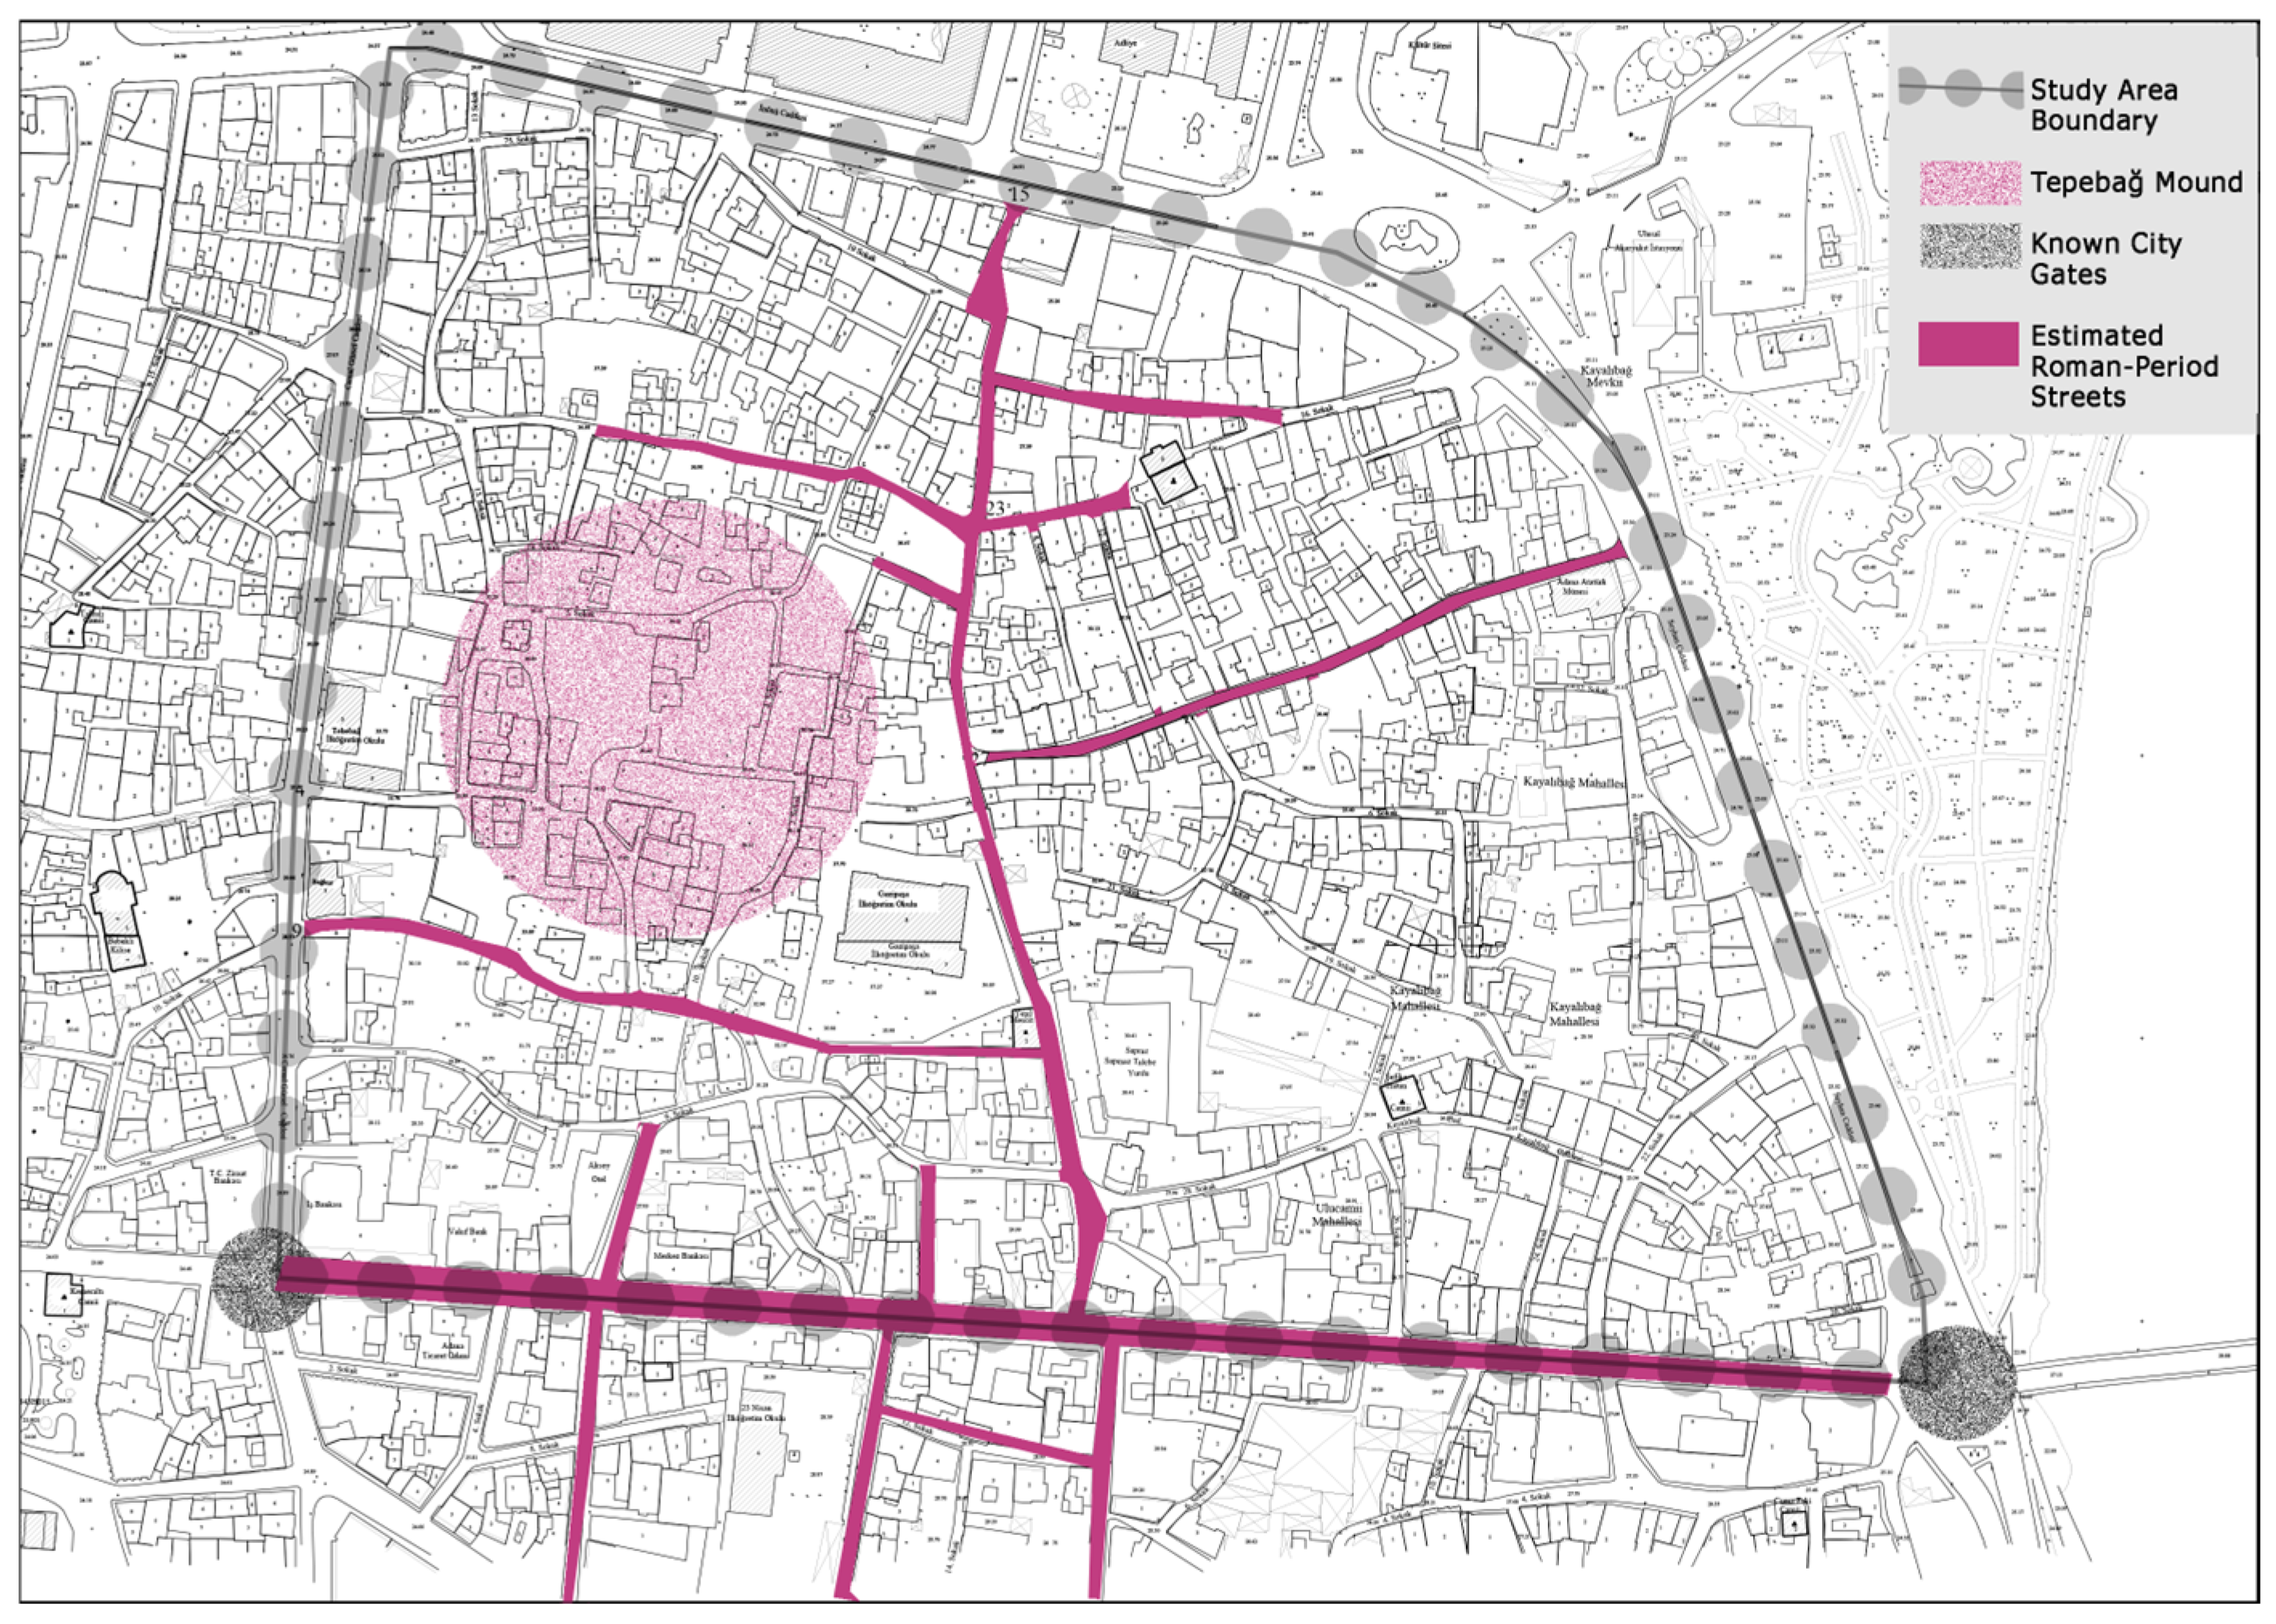
The historical roots of Adana are believed to date back to around 1900 BCE. The city is known to have had Roman-era fortifications, which were later utilized during the Byzantine and Medieval periods. Historical records indicate the existence of an inner fortress at the western end of Taşköprü (Stone Bridge), near today’s Seyhan district, until the late Ottoman period [28]. As shown in Figure 3. Historical Urban Development Map of Adana, a key urban axis connects Taşköprü to one of the central public squares of Adana—Küçük Saat Square—via Abidinpaşa Avenue [28].
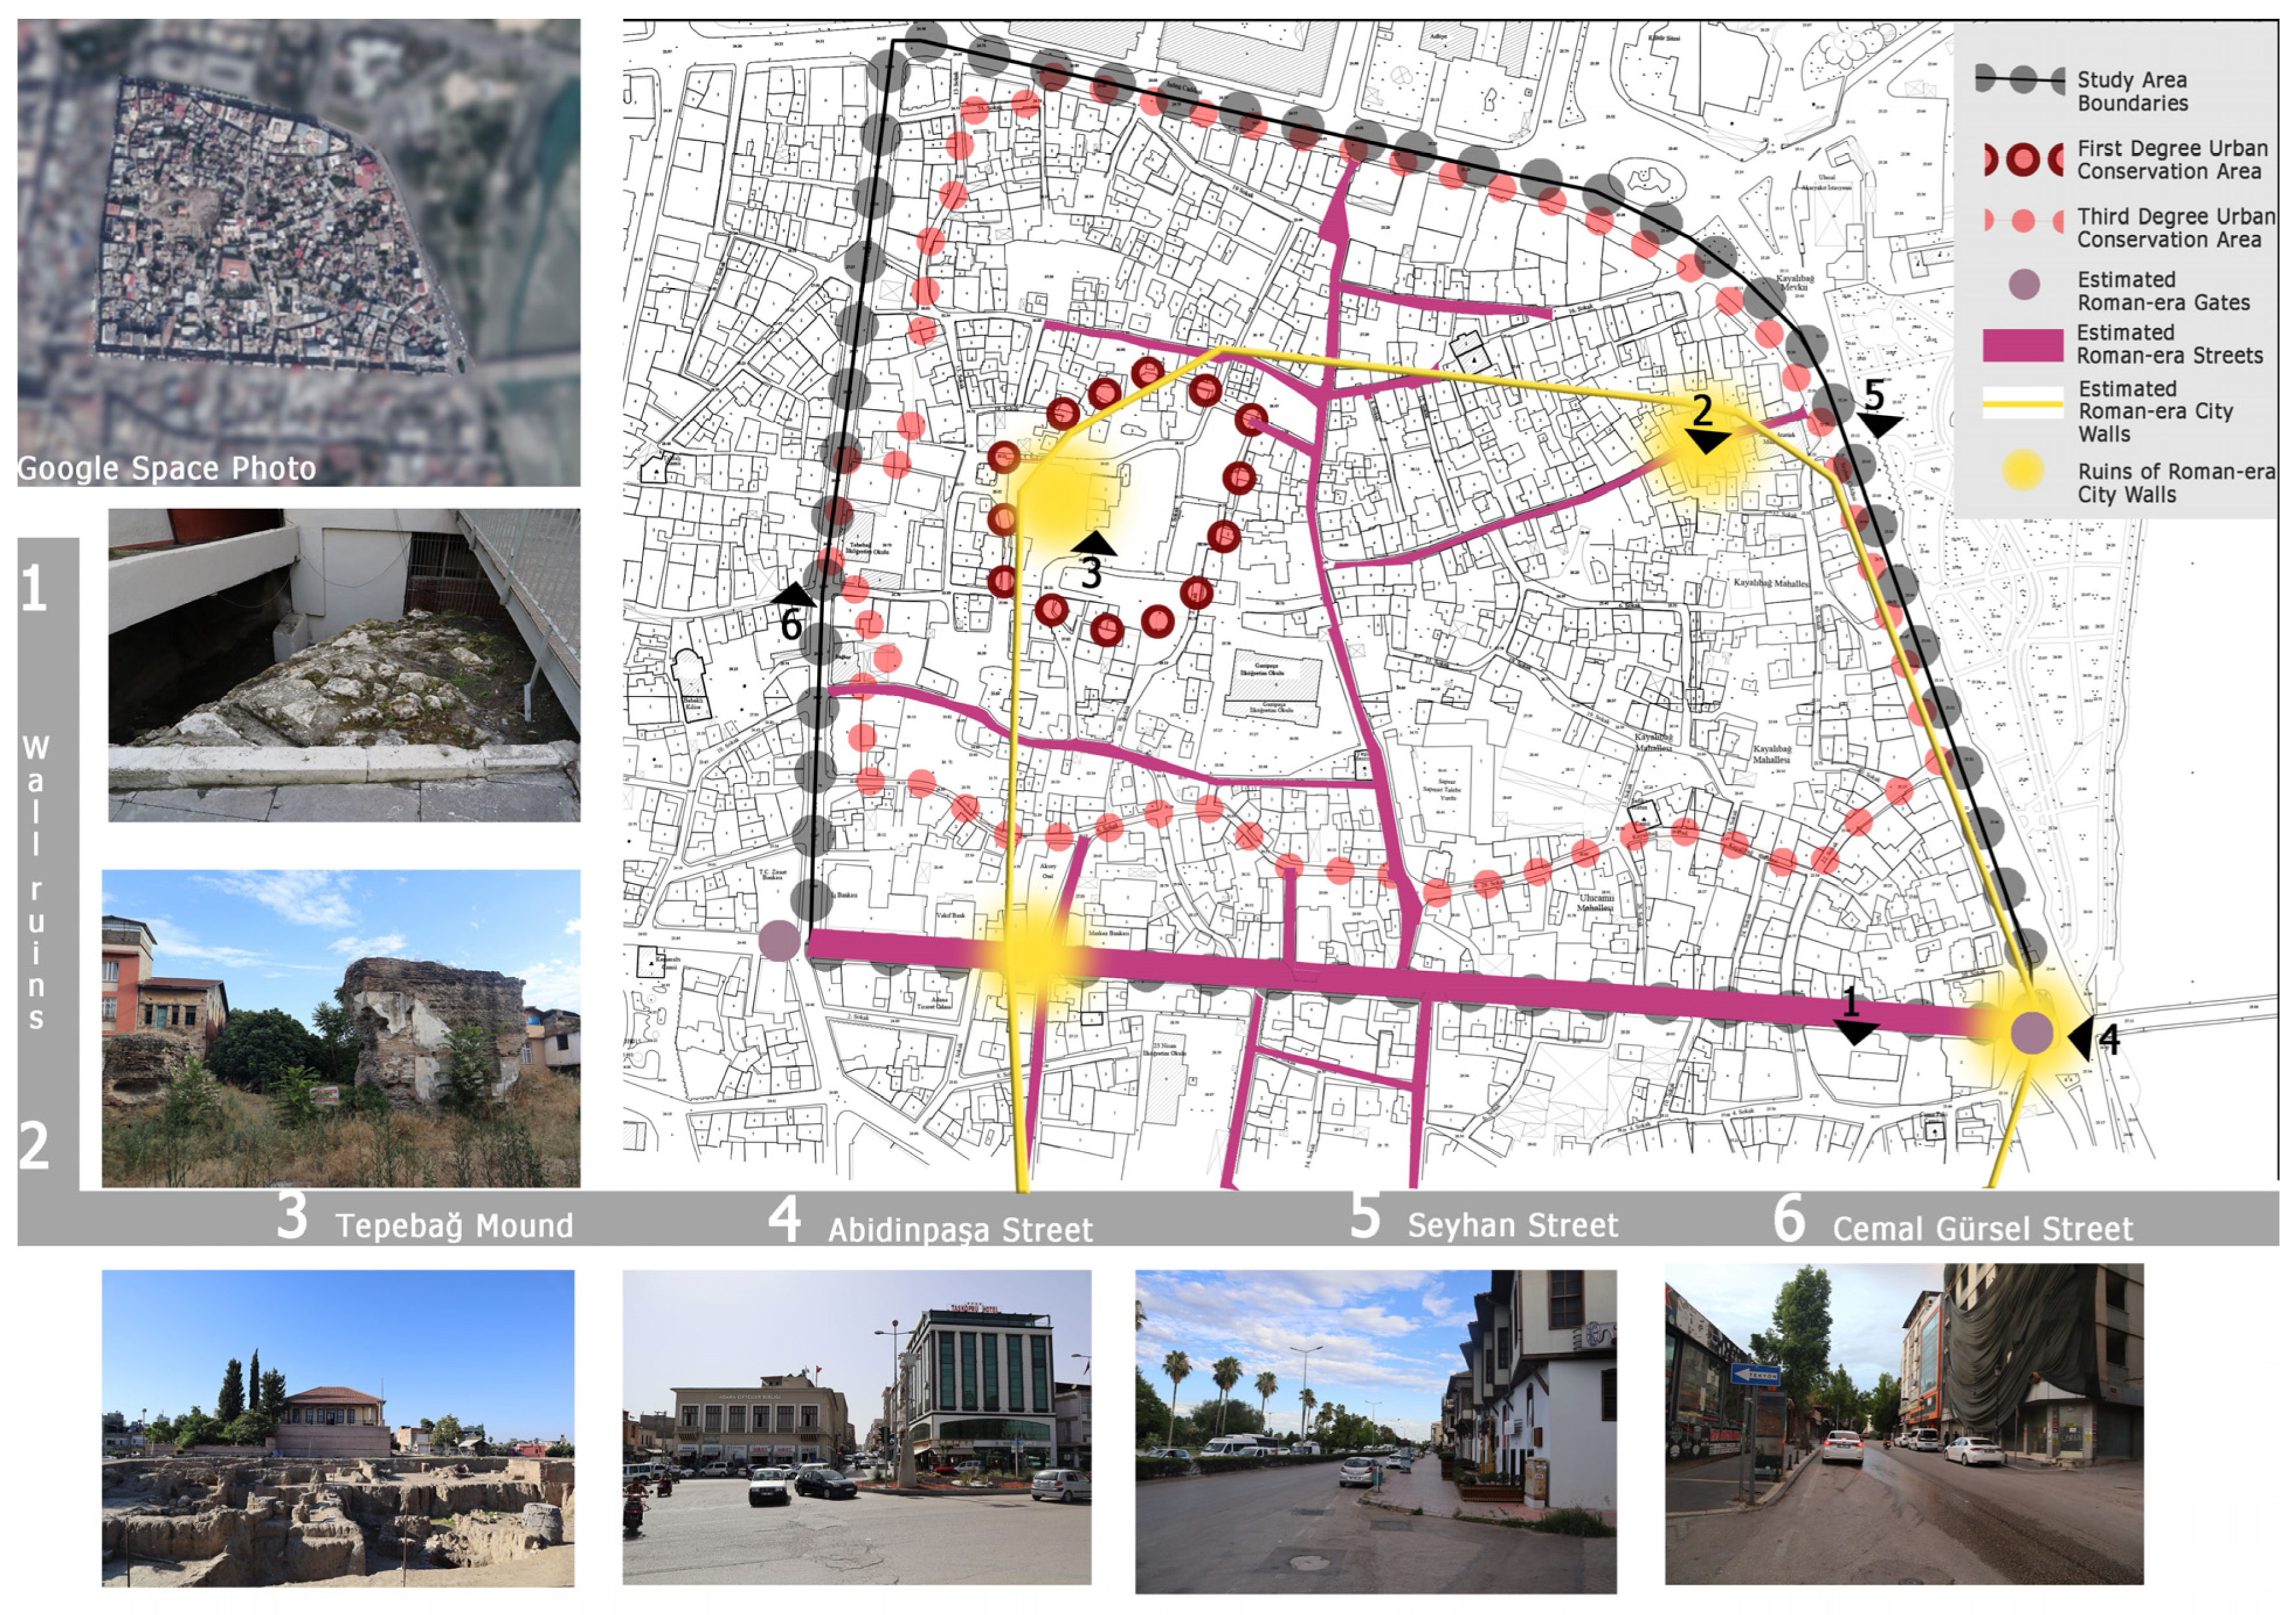
Considering its historical significance, the area surrounding Tepebağ Mound, which contains traces of Roman urban infrastructure, was selected as the study area. The region includes neighborhoods such as Tepebağ, Kayalıbağ, and Ulucami, and is bounded by four major roads: Abidinpaşa, Cemal Gürsel, İnönü, and Seyhan Avenues. The boundaries of the selected study area in Adana are presented in Figure 4.
Although the study area is primarily composed of residential buildings, commercial structures are also present along the major boundary roads. Given the historical significance and tourism potential of the site, identifying areas with insufficient lighting and proposing suitable design solutions are critical to increasing the site’s visibility and integration into the city’s nighttime life. The ultimate goal is to ensure that the historical fabric of the area is not only preserved during the day but also made visible and accessible at night.

3.2. Analysis

3.2.1. On-Site Observations

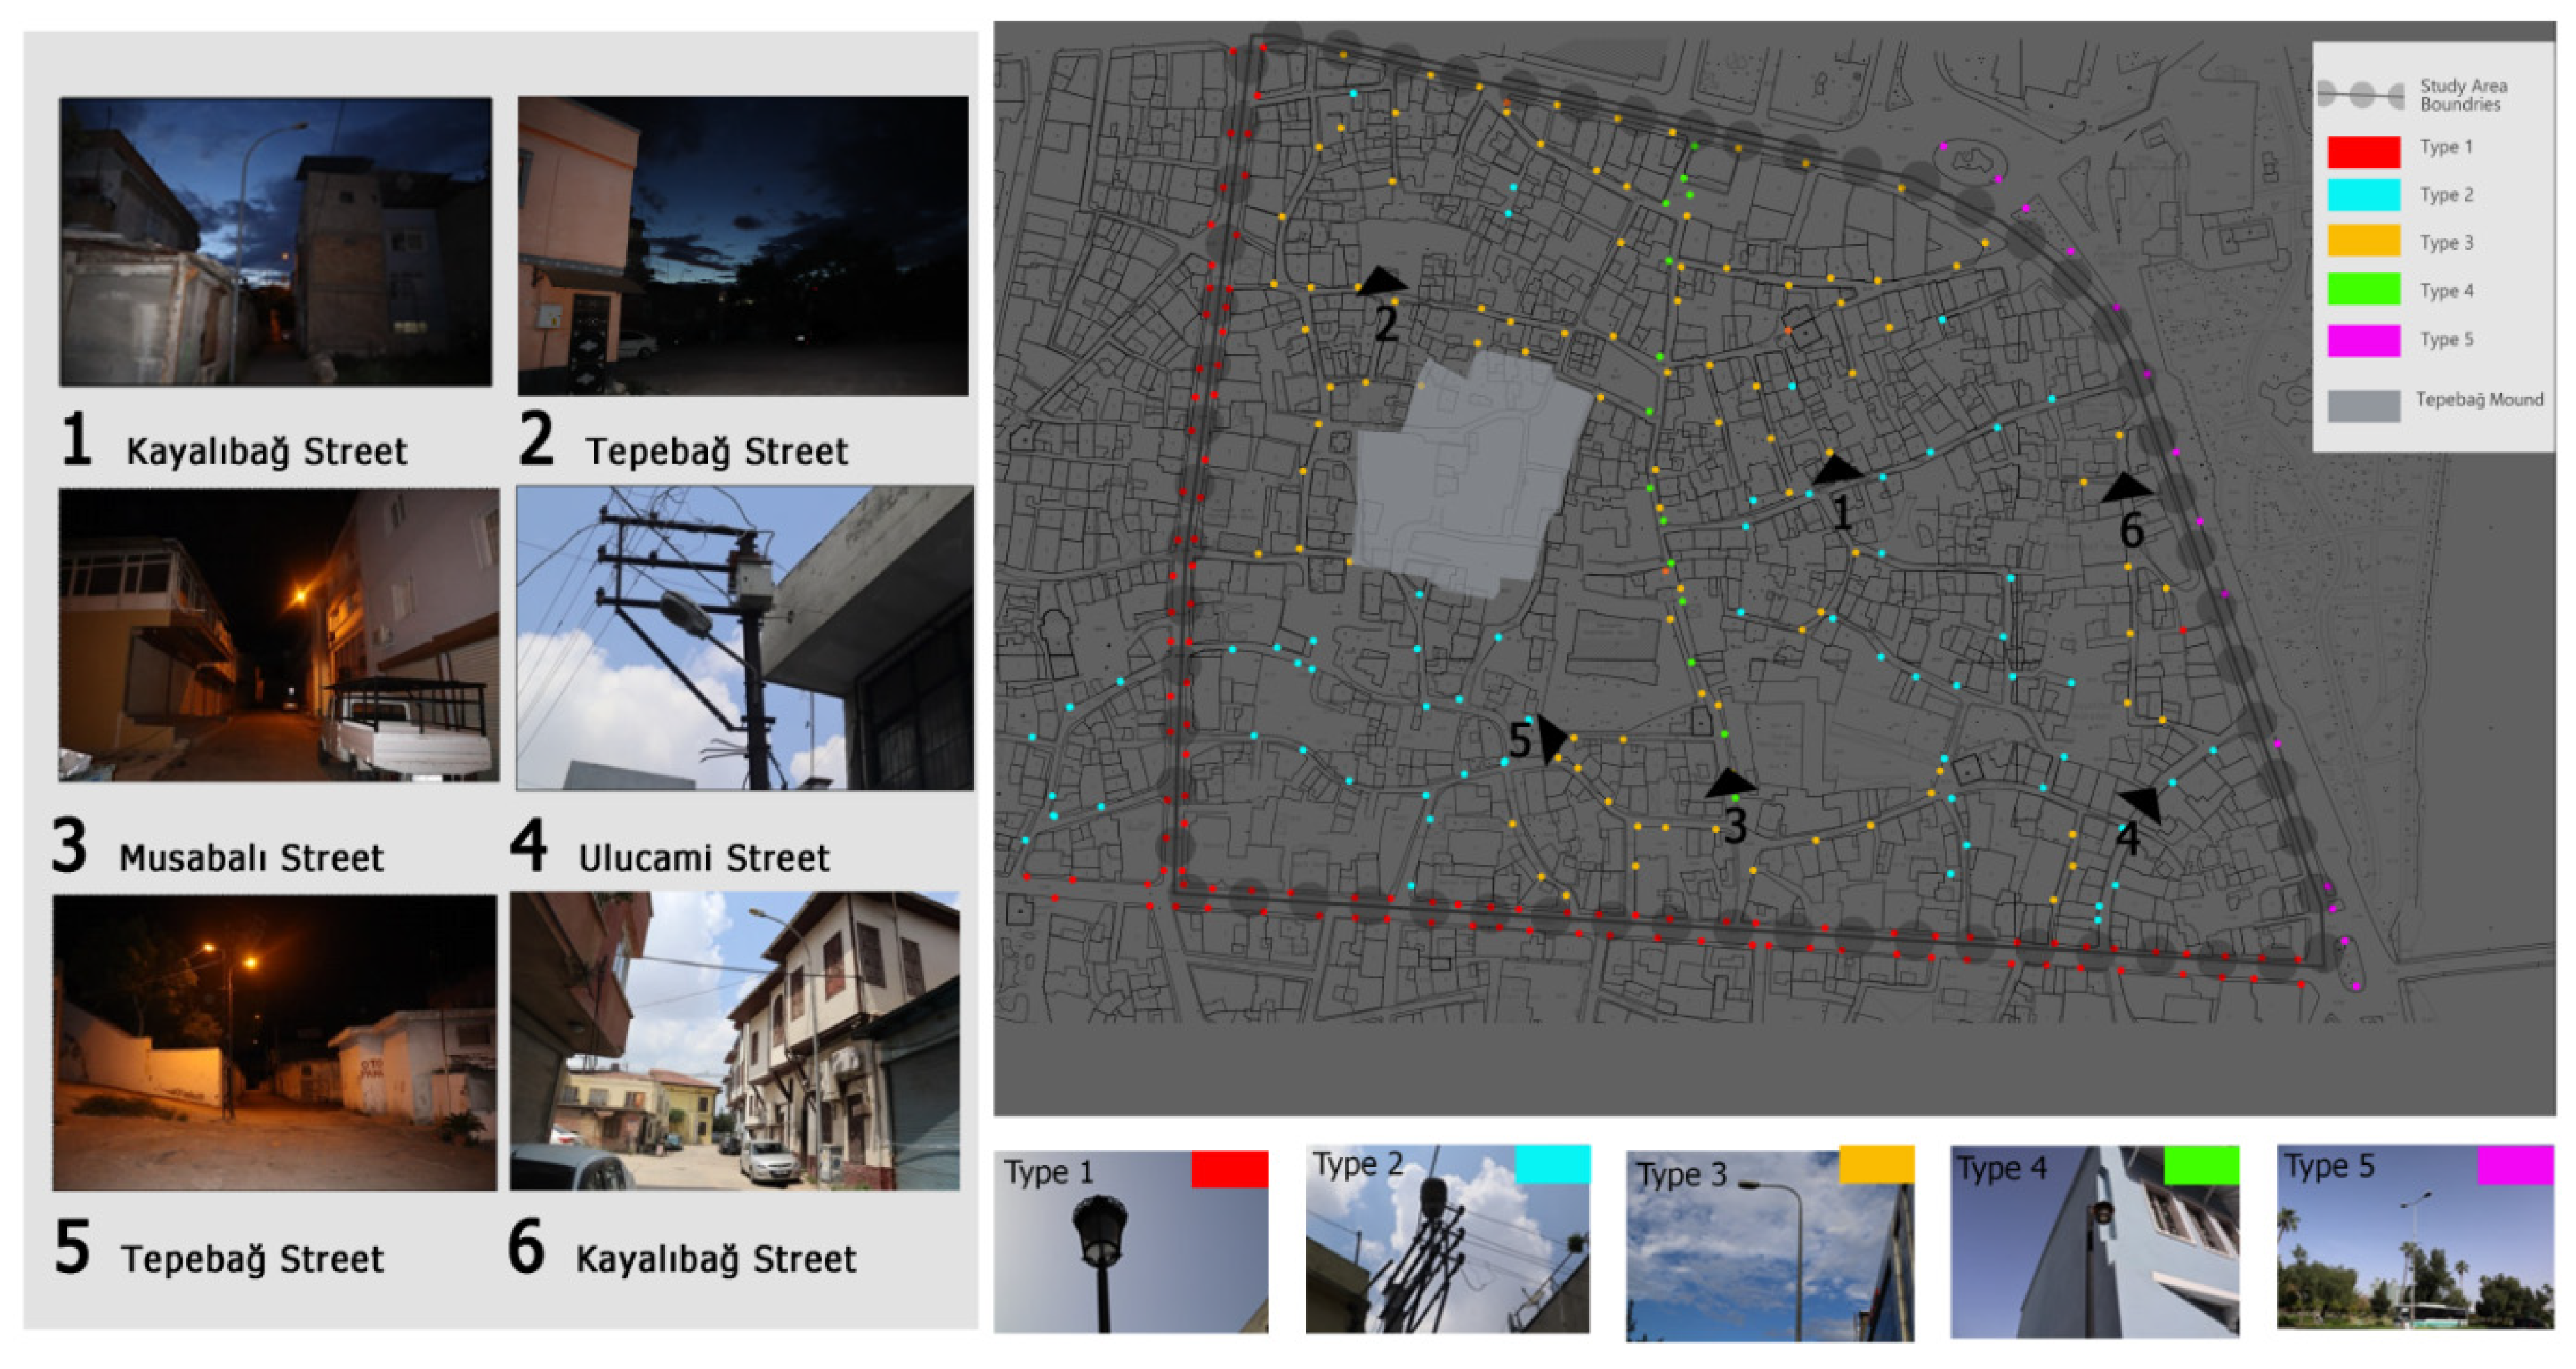
Field observations were conducted to assess the existing lighting elements and their spatial deployment. It was noted that lighting installations lacked a coherent design language, were randomly distributed, and contributed to visual clutter and light pollution. The distribution of light across the area was uneven and inconsistent. Most street lighting relied on high-pressure sodium lamps with low color rendering capabilities. The use of lighting poles taller than adjacent buildings reduced visual comfort for both pedestrians and drivers and contributed to light spill. Furthermore, measured horizontal illuminance levels in several street segments were below the minimum values required by the relevant lighting classes, indicating deficiencies in both visual performance and perceived safety. The existing lighting fixture types and their spatial distribution are presented in Figure 5.
Moreover, the absence of a comprehensive lighting master plan in the historic city center has resulted in fragmented and inconsistent lighting applications. Inadequate illumination, poor fixture selection, improper placement near historic buildings, and light pollution negatively affect safety, visual comfort, and heritage preservation, highlighting the need for an integrated lighting strategy (Table 1).

3.2.2. On-Site Measurements

Illuminance values (lux) were measured using a calibrated Extech Environmental Meter 45170 (Extech Instruments, Nashua, NH, USA) under stable night-time conditions. Field measurements were conducted between February and April 2022, during the time interval of 8:00 PM–12:00 AM.
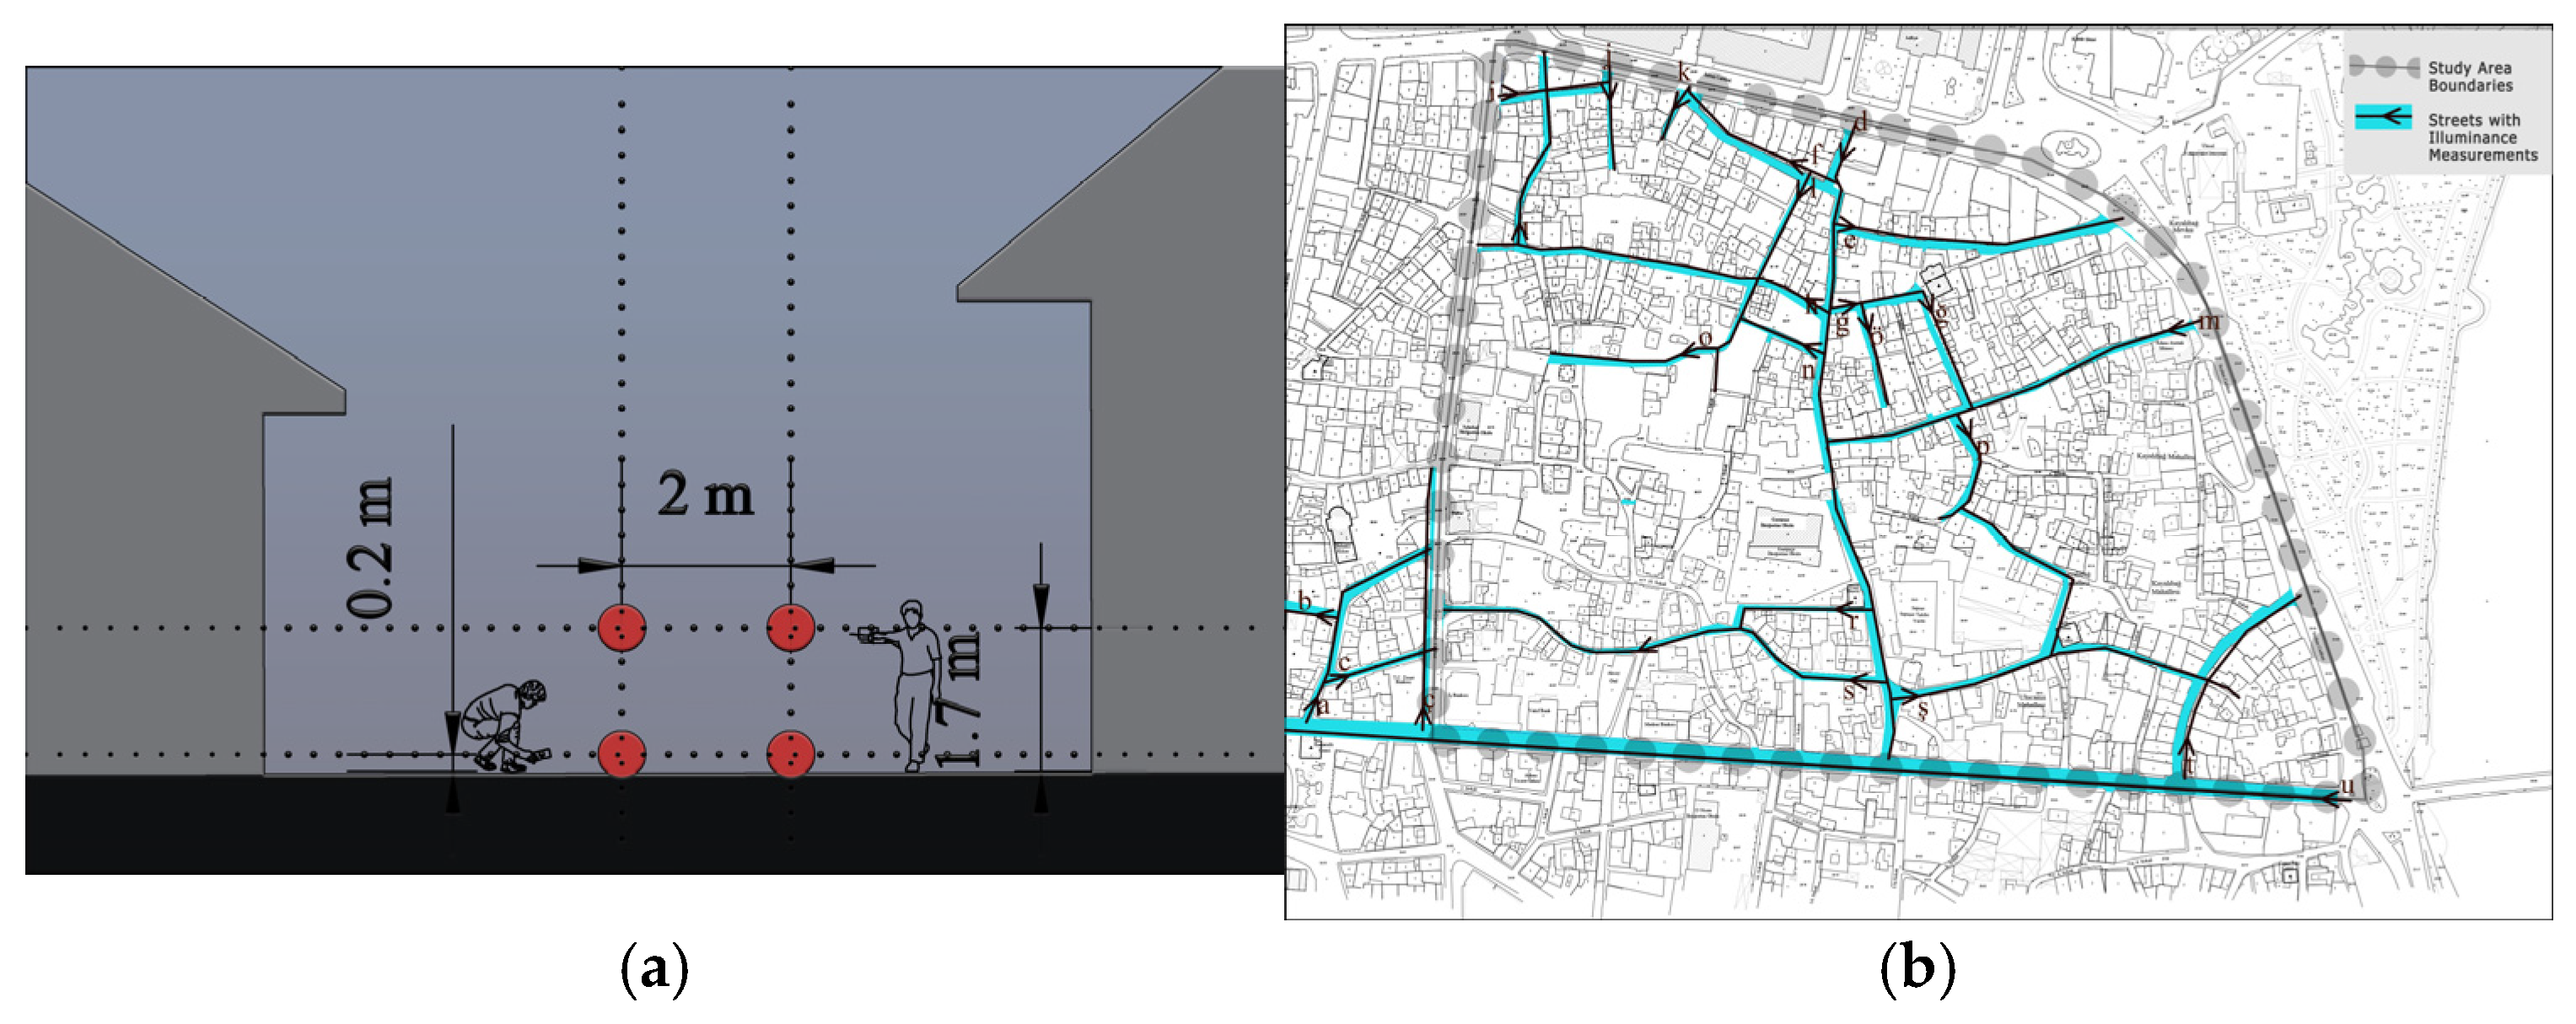
To quantify existing lighting performance, horizontal illuminance (Eh) measurements were carried out at predefined grid points within selected street segments (Figure 6). Measurements were taken at 0.2 m above ground level to represent road surface conditions for CE-class streets and at 1.7 m above ground level to represent pedestrian-level horizontal illuminance for S-class streets.
For CE-class streets, average illuminance (Ēavg), maximum illuminance (Emax), and overall uniformity (Uo = Emin/Ēavg) were calculated and compared with the performance requirements defined in EN 13201-2. For S-class streets, measured illuminance values were evaluated according to the SLL Code for Lighting, which incorporates the EN 13201 framework for road and pedestrian lighting classification.
Multiple readings were recorded at each point and averaged to improve measurement reliability, and care was taken to minimize observer shadowing and reflective interference.
Roads and pathways within the study area were classified according to the SLL Code for Lighting, which is aligned with CIE recommendations and the EN 13201 road lighting framework. Based on their functional characteristics and traffic conditions, the following lighting classes were applied [27]:
  • Class M: Major traffic roads (driver-dominant),
  • Class S: Minor roads and pedestrian-dominant urban centers,
  • Class CE: Conflict areas with potential interaction between vehicles and pedestrians.
A summary of the measurement results is presented in Table 2. The complete illuminance dataset, including the number of measurement points, target average illuminance (Ēavg), required overall uniformity (Uo), and measured performance indicators for each location, is provided in Appendix A (Table A1). This detailed dataset constitutes the quantitative basis for identifying spatial inconsistencies and performance deficiencies within the existing lighting system.
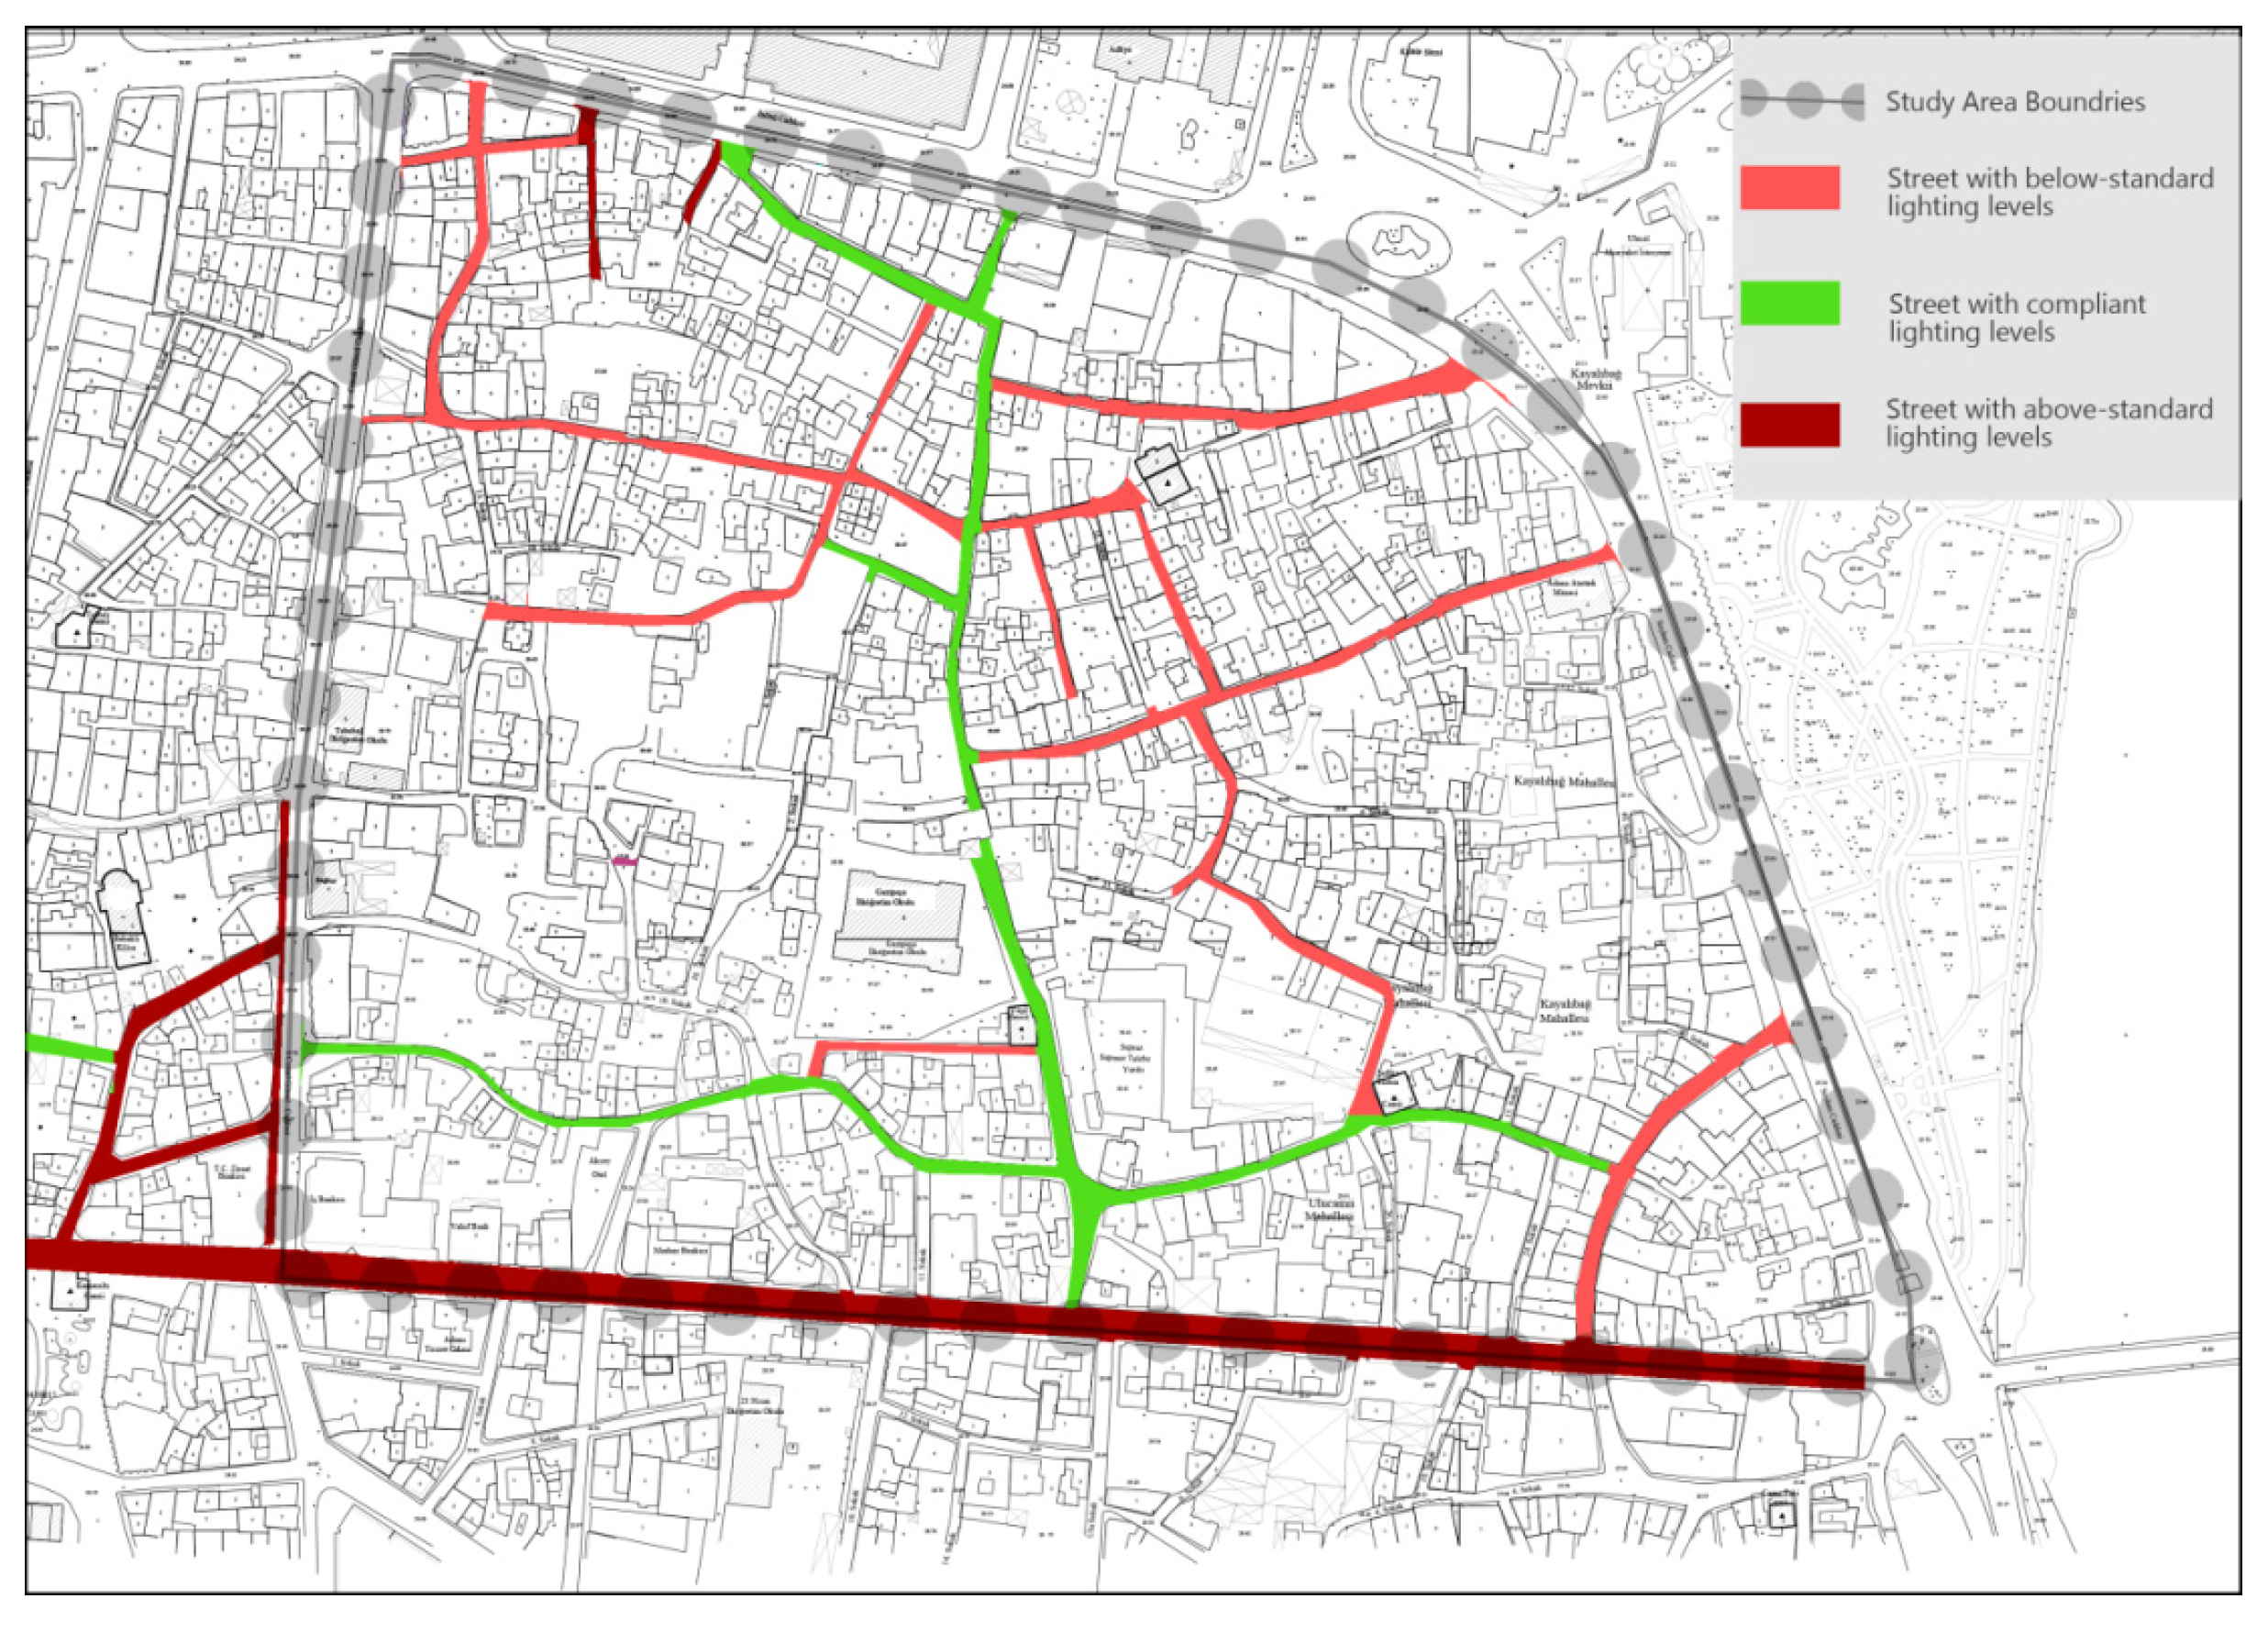
Figure 7 illustrates the spatial distribution of measured illuminance levels across the study area, highlighting variations in lighting performance at both pedestrian and carriageway levels.
The measurement results confirm the findings derived from on-site observations in Adana’s historic city center. The data indicate that the existing lighting technique is insufficient for the historical urban context, particularly in terms of uniformity, spatial coherence, and compliance with standard performance thresholds. These deficiencies reveal the need for a more context-sensitive and performance-oriented lighting strategy tailored to the heritage fabric.

3.2.3. Analysis Maps

Following the illuminance measurements and the identification of existing lighting conditions, analysis maps were created to determine lighting priorities within the study area. These maps were generated using the conservation-oriented zoning plan provided by the Seyhan Municipality Conservation, Implementation, and Supervision Bureau (KUDEB) of Adana. They include evaluations based on both urban identity elements and lighting requirements, focusing on the following spatial variables:
  • Archeological and urban conservation zones
  • Registered roads, parcels, and buildings
  • Lynch analysis (urban imageability)
  • Street and road classifications
  • Functional diversity
  • Building density and height distribution
A total of six spatial analysis maps (Map1–Map6) were produced and are shown in Table 3. Thematic Maps Used in the Analysis Phase. The goal of this mapping effort was to identify historically significant structures and regions within the study area and evaluate their relationship with current urban functions, imageability, and structural characteristics. These maps enable a balanced hierarchy to be established among areas requiring lighting interventions.
Archeological and Urban Conservation Areas Map (Map1): Within the conservation plan, three distinct conservation zones are proposed for Adana’s historic city center. The most prominent among them is the Tepebağ region, located north of the third-degree archeological site. Due to the presence of the mound, the area is partially classified as a first-degree archeological site, encompassing large parts of the Tepebağ and Kayalıbağ neighborhoods, which are predominantly residential but surrounded by commercial zones and transportation corridors [29]. The boundaries of these conservation zones are indicated on the Map1.”
Registered Roads, Parcels, and Buildings Map (Map2): This map reveals that registered historical structures and parcels are concentrated within the inner parts of the study area. According to Körlü, the area includes 12% registered, 10% proposed for registration, 1% demolished, 63% compatible new, and 13% incompatible new buildings [30]. These structures, spanning multiple historical periods, are illustrated in Map2.
Lynch Map (Map3): Based on Kevin Lynch’s theory of “urban image,” a Lynch analysis was conducted to highlight key elements such as boundaries, districts, paths, nodes, and landmarks [31]. These elements are visualized in Map M3 and contribute to understanding the spatial identity of the study area.
Street and Road Classification Map (Map4): Using lighting standards, the roads and streets within the study area were categorized according to their hierarchy and functional roles. The boundary streets of the area experience high traffic flow, whereas inner roads are less traffic-intensive and often not designed for vehicles. Usage intensities and road classifications are illustrated in Map4.
Functional Land Use Map (Map5): As one moves toward the center of the study area, the dominance of residential buildings increases. In contrast, commercial structures are primarily located along the major peripheral streets. The area also includes a mix of religious, touristic, educational, lodging, and public buildings. These functional classifications are detailed in Map5.
Building Density and Height Distribution Map (Map6): Peripheral areas of the study zone generally feature taller buildings, while the central portions contain lower-rise structures. However, the distribution of building heights is irregular. The density and height patterns are shown in Map6.
The information gathered through these analysis maps confirms the historical significance of the study area, particularly within the boundaries of Adana’s historic city center. The current condition of the area, as depicted in the maps, clearly demonstrates the need to reintegrate the historical core into the city’s nighttime identity through appropriate lighting strategies.

3.3. Definition

In the definition phase, regions within the study area were evaluated based on data derived from analysis maps and transformed into heat maps representing lighting demand intensity. A structured scoring system was developed to rank areas according to relative lighting demand.

3.3.1. Area Identification

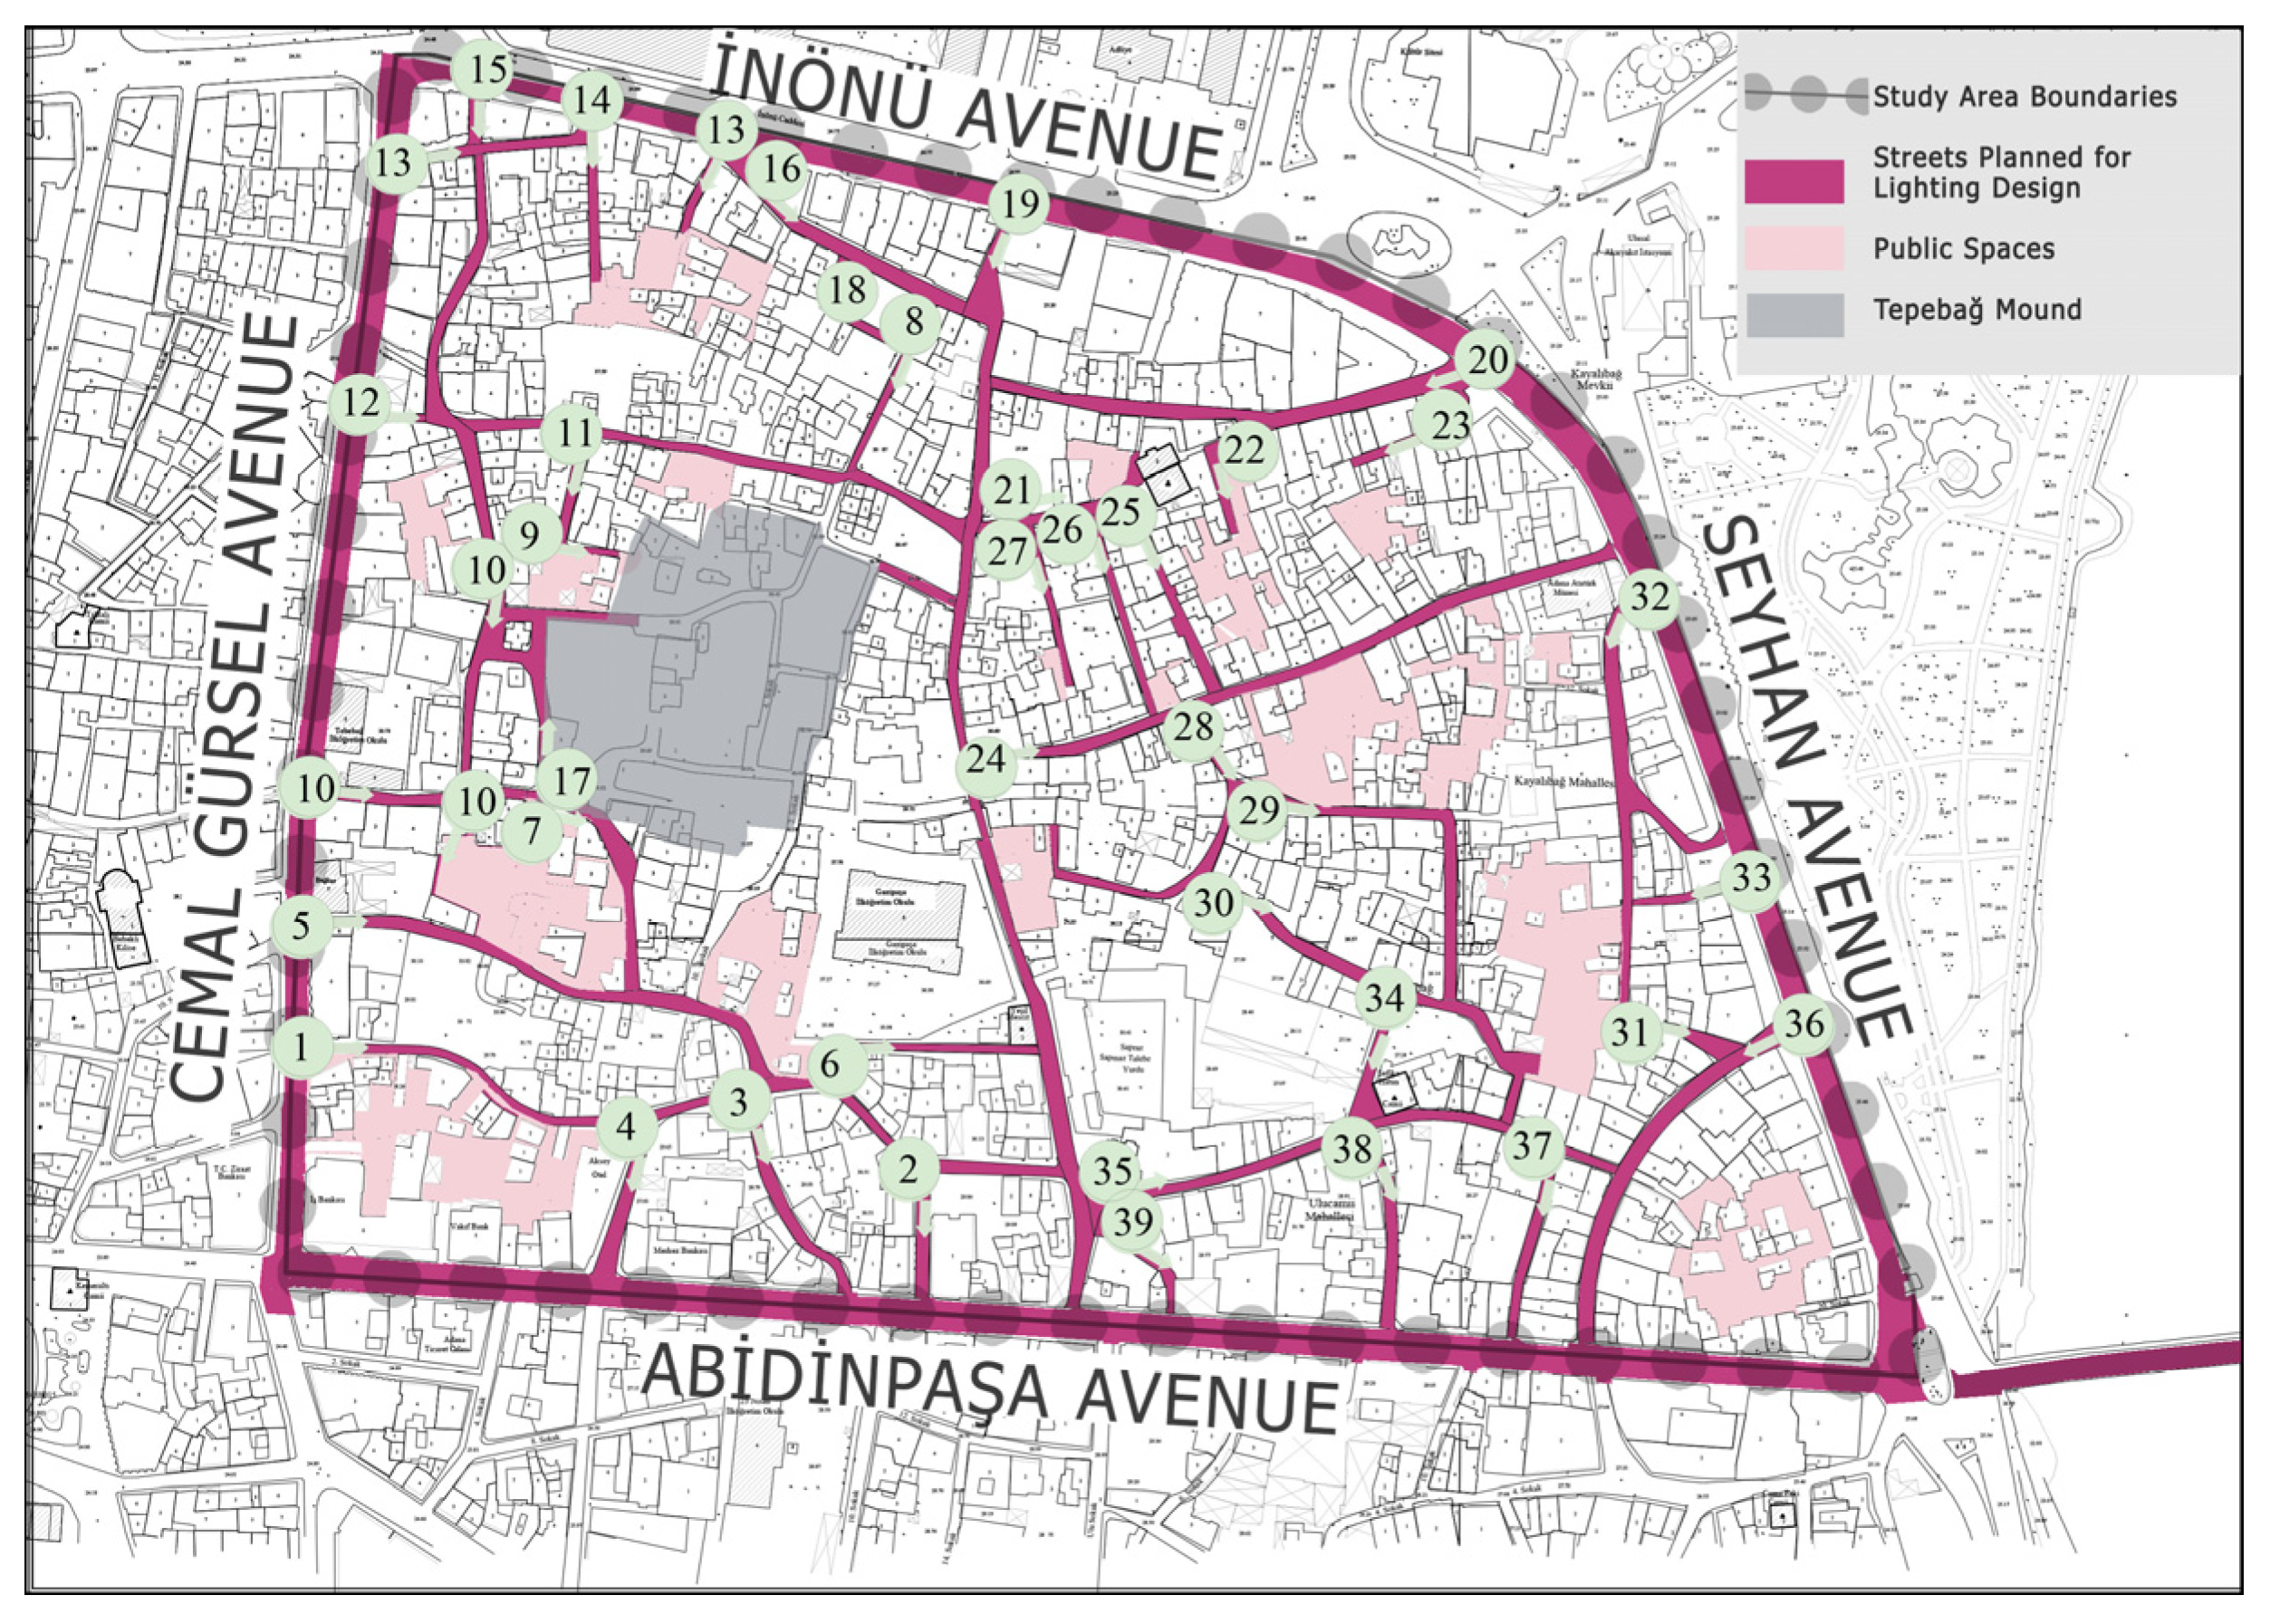
At this stage, specific streets, roads, and public spaces targeted for lighting design were identified. The study area encompasses three neighborhoods—Tepebağ, Kayalıbağ, and Ulucami—containing a total of 39 streets and 4 main avenues, as shown in Figure 8.

3.3.2. Scoring

The Lighting Demand Index (LDI) is a composite indicator representing the relative need for lighting interventions across urban streets, derived from the integration of multiple spatial analysis maps.
In this study, the evaluation criteria were defined as six spatial analysis maps (Map1–Map6), each representing a thematic layer produced during the analysis phase. These maps were treated as independent decision layers within a multi-criteria decision-making framework.
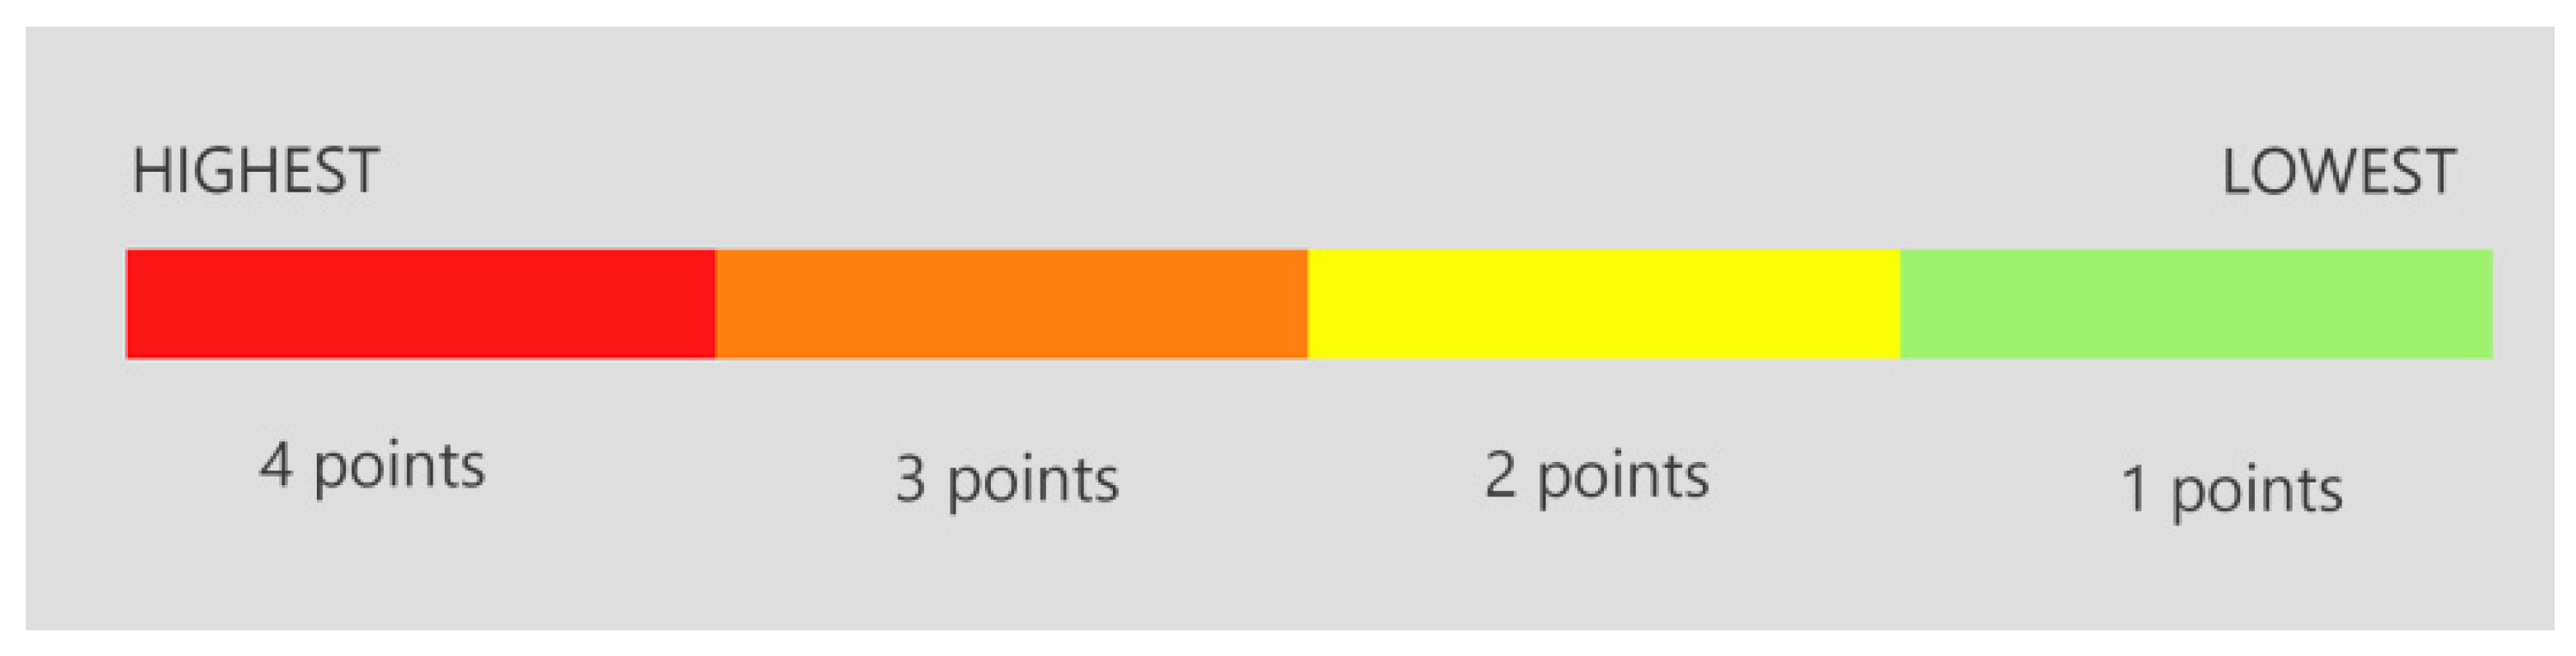
To quantify lighting needs for the selected streets and avenues, a scoring methodology was applied based on the results obtained from the spatial analysis maps. Each street segment was evaluated in terms of lighting demand and subsequently represented through color-coded heat maps, enabling a visual interpretation of spatial variations in lighting priority (Figure 9).
Each street and avenue was assessed across the six thematic maps, which reflect key spatial and cultural parameters relevant to heritage-sensitive urban lighting, including historical and conservation value, urban imageability, functional hierarchy, and built environment characteristics. Rather than relying on user surveys, the evaluation process was grounded in spatial data interpretation, expert judgment, and on-site observations to ensure methodological consistency.
To ensure methodological transparency, the Analytic Hierarchy Process (AHP) was employed as a validation tool to examine whether a hierarchical dominance existed among the six spatial criteria. Pairwise comparisons were conducted using the Saaty fundamental scale. The Consistency Ratio (CR) remained below the acceptable threshold (CR < 0.10), confirming the reliability of expert judgments.
The resulting weight vector converged toward a uniform distribution (wi = 0.167), indicating comparable contribution of each criterion. Therefore, equal weights were adopted as an AHP-validated outcome rather than a predefined assumption. Based on this validated weighting structure, the Lighting Demand Index (LDI) for each street segment was calculated as follows:
L D I = j = 1 6 ( w j × M a p j )
where w j represents the AHP-derived weight of each spatial criterion and M j denotes the corresponding map score. Given the AHP-validated equal-weight distribution, the LDI corresponds to the cumulative contribution of Map1–Map6 scores for each street segment.
The resulting individual heat maps for each thematic criterion are presented in Table 4. The following scoring criteria were used to create the heat maps:
Zoning and Conservation Priority Heat Map (Map1*): Areas with high historical value, such as the Tepebağ Mound and surrounding urban conservation zones, were identified as priority zones due to their high heritage value and limited nighttime integration.
Registered Buildings and Parcels Heat Map (Map2*): Regions surrounding officially registered buildings were scored higher. A hierarchical scoring system was used to differentiate between registered, unregistered, and incompatible structures.
Lynch Analysis Heat Map (Map3*): Emphasis was placed on urban nodes and landmarks—such as the Tepebağ Mound and intersections of main arteries—which are critical for tourism and orientation, and thus require enhanced visibility.
Street and Road Classification Heat Map (Map4*): Roads were prioritized based on their traffic intensity and functional importance:
Primary roads (first-degree, high-traffic): highest priority
Secondary connectors: moderate priority
Tertiary roads and cul-de-sacs: lower priority
Functional Use Heat Map (Map5*): Areas with commercial and touristic functions were scored highest due to higher user intensity. Religious, educational, governmental, and lodging facilities were rated next. Residential zones were given lower scores to preserve privacy and reduce excessive lighting.
Building Density and Height Heat Map (Map6*): Zones with taller and denser building configurations—typically located along the boundary streets—were considered to require higher levels of lighting than sparsely built interior areas.
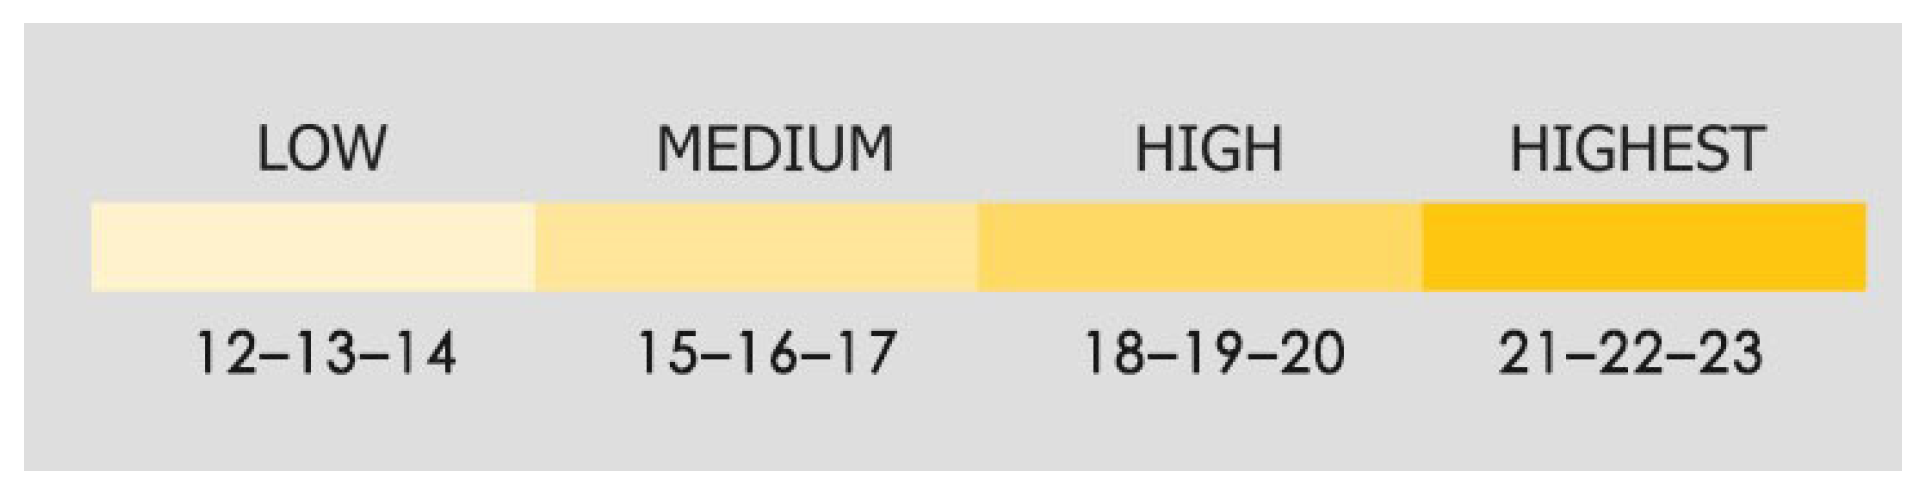
For each street segment, weighted scores derived from the six spatial analysis maps were aggregated to calculate an AHP-based Lighting Demand Index (LDI). The resulting values ranged from 12 to 23 and were categorized into four lighting demand levels to support decision-making:
  • Low Demand (12–14): Areas with sufficient lighting or low heritage and functional priority, requiring minimal intervention.
  • Moderate Demand (15–17): Streets with moderate deficiencies or contextual importance, suitable for selective improvements.
  • High Demand (18–20): Routes with pronounced spatial or cultural significance where lighting upgrades would substantially enhance visibility and identity.
  • Very High Demand (21–23): Strategically critical zones requiring immediate and intensive lighting interventions due to their role in cultural representation, tourism, and safety.
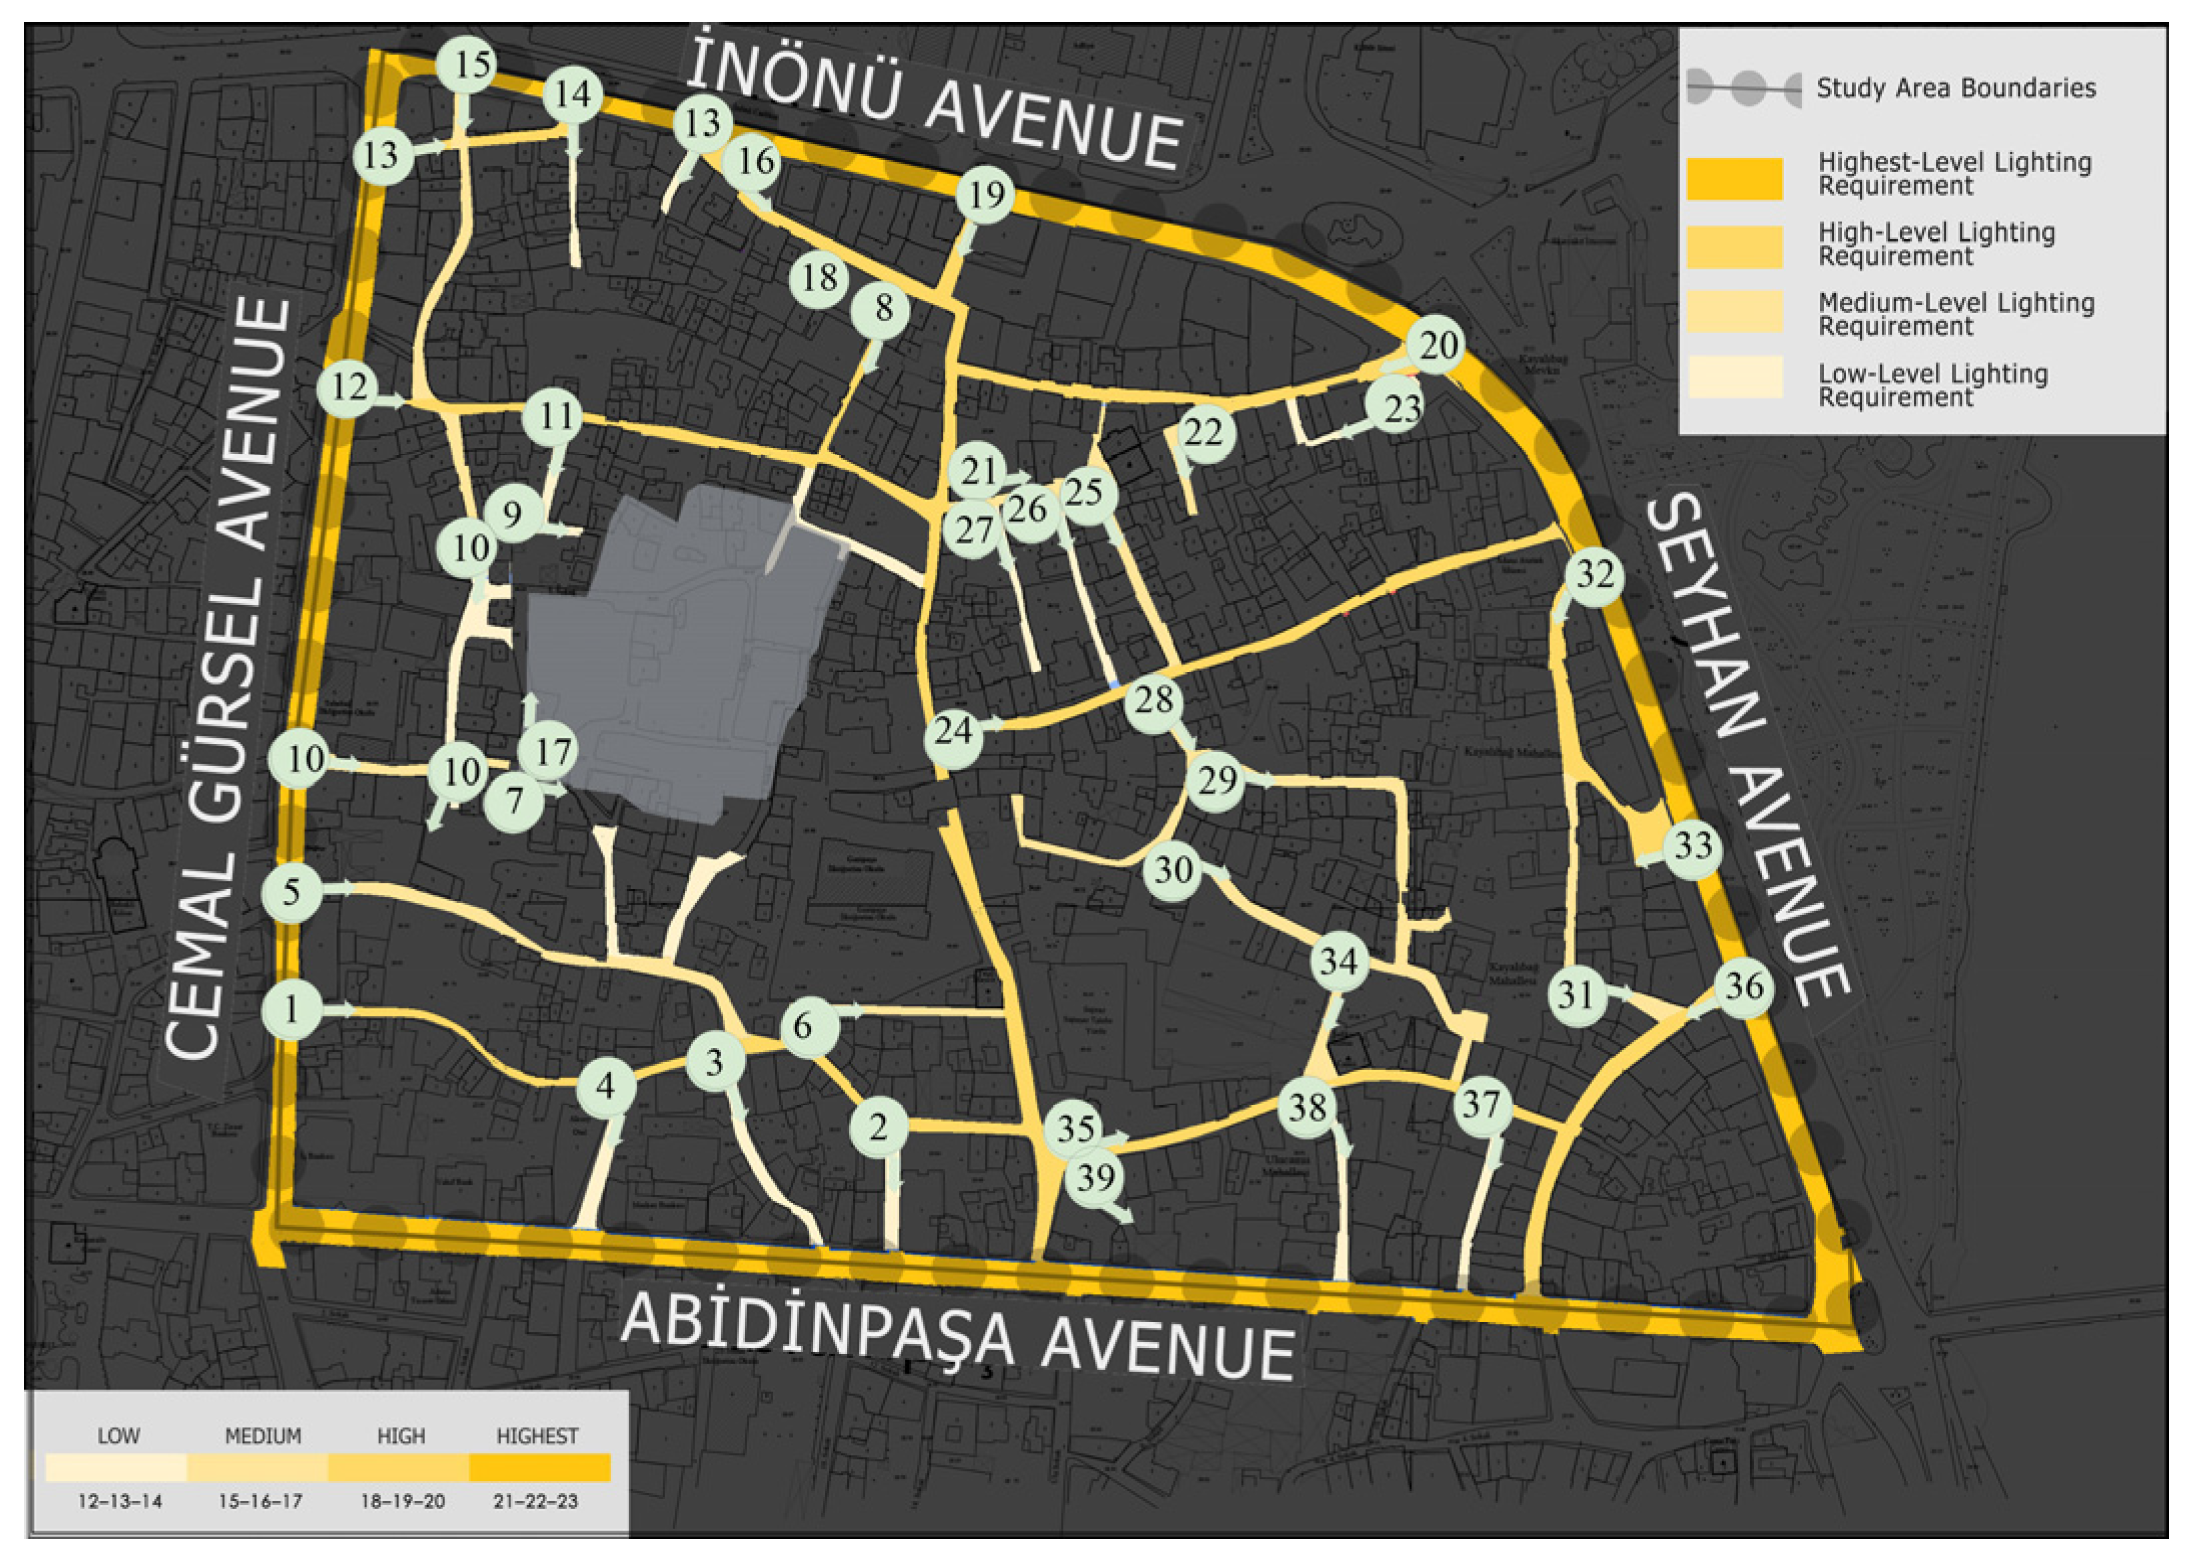
The resulting lighting demand distributions are visualized in Figure 10, while the integrated prioritization outcome is presented in the final composite map (Figure 11).
This AHP-validated, map-driven scoring framework provides a transparent, reproducible, and methodologically robust basis for prioritizing lighting interventions in historic urban environments (Table 5).
Since the entire study area possesses historic urban environment characteristics, all spatial and physical environmental parameters were evaluated with equal significance. The equal weighting was not predetermined but emerged from consistent pairwise comparisons (CR < 0.10), reflecting the homogeneous conservation value and morphological integrity of the area.
By organizing the urban network according to standardized lighting classes, a structured basis was established for the development of typology-specific lighting proposals in the subsequent phase. The summarized Lighting Demand Index (LDI) results for neighborhood streets and major avenues are presented in Table 6 and Table 7, respectively.
The complete LDI dataset, including all evaluated street segments and major avenues, is provided in Appendix B (Table A2 and Table A3).
The results indicate that major avenues exhibit consistently very high lighting demand due to their traffic intensity and strategic role within the urban structure. In contrast, neighborhood streets demonstrate more differentiated demand levels, reflecting variations in conservation value, functional use, and spatial morphology.

3.3.3. Classification

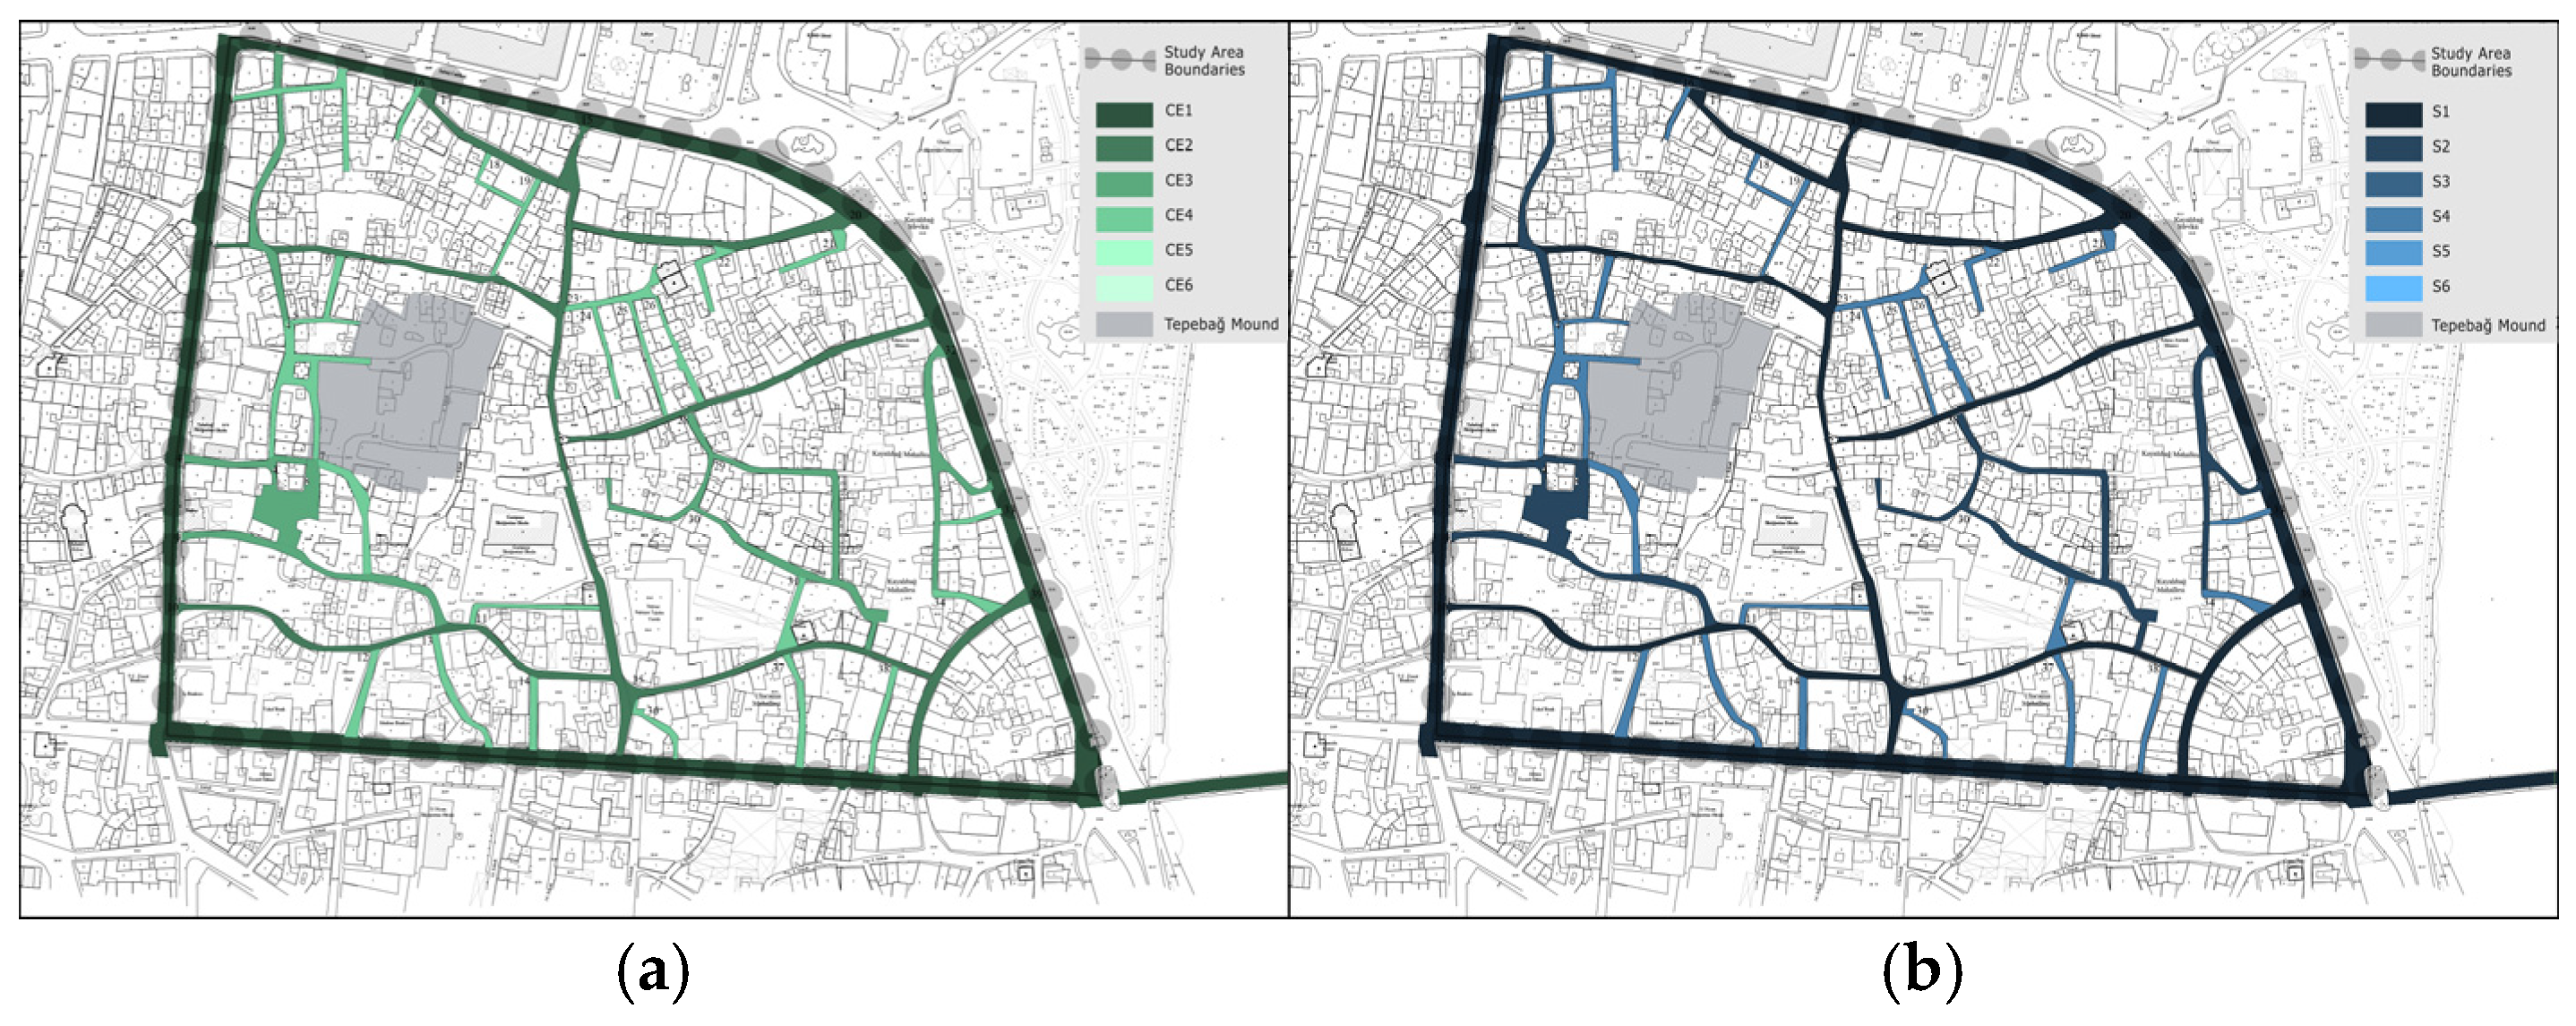
The streets and avenues identified for lighting design within the study area were classified according to international lighting standards. Specifically, two major road lighting categories were utilized:
CE Class (Conflict Areas): Includes zones such as commercial streets, intersections, and mixed-use pedestrian–vehicular routes, where lighting must accommodate complex traffic and human activity patterns.
S Class (Subsidiary Roads): Covers access roads, residential streets, pedestrian paths, and cycleways where lighting is primarily intended for pedestrian safety and comfort.
This classification was made in alignment with the SLL Code for Lighting (2022) and the TS EN 13201-2 (2016) standard. Streets and avenues within the study area were categorized according to their usage characteristics and lighting performance requirements, as shown in Figure 12.
Typology Development for Lighting Design
At this stage, lighting typologies were developed for the areas within Adana’s historic city center that were planned for urban lighting design, based on their specific lighting requirements. Utilizing both the analysis maps and the heat maps illustrating lighting demand intensity, seven different area typologies—labeled A, B, C, D, E, F, and G—were defined for the streets, avenues, and spaces within the study area. These typologies, representing varying levels of illuminance needs, are described as follows (Table 8).
Type A: Represents avenues with the highest level of lighting demand. These roads carry heavy vehicular traffic, and pedestrian and vehicular circulation occur on separate surfaces.
Type B: Also represents areas with the highest lighting demand, but lighting design is developed only for pedestrian walkways, as vehicular lighting already exists. The surfaces for vehicles and pedestrians are separate.
Type C: Refers to streets with high lighting demand. These are typically streets that connect to the boundary avenues of the study area. Pedestrian and vehicular circulation occur on the same surface.
Type D: Includes streets with a moderate level of lighting demand. Pedestrian and vehicular use is shared on a single surface.
Type E: Refers to streets with a low level of lighting demand, where pedestrian and vehicular circulation is also on the same surface. These are the areas with the least lighting need.
Type F: Designates dead-end spaces within blocks, where pedestrian and vehicular surfaces are shared.
Type G: Refers to special areas where pedestrian and vehicular movement occurs on the same surface, and which require customized lighting solutions.
Table 9 and Table 10 present a summarized version of the typology assignments for neighborhood streets and major avenues within the study area, based on their corresponding lighting classes and calculated demand levels.
The complete street-level typology dataset is provided in Appendix B (Table A4), and the full major avenue classification is presented in Appendix B (Table A5).

3.4. Design

The areas classified according to lighting demand and assigned to specific typologies must be illuminated using lighting elements with appropriate technical characteristics. In this stage, lighting proposals were developed based on the specific lighting requirements of each area.

3.4.1. Lighting Technique

Based on the data obtained, lighting design proposals were prepared for streets, avenues, and public spaces categorized under specific typologies. To ensure the efficient and appropriate use of lighting fixtures, the following technical criteria were taken into consideration in the design process:
  • Light source
  • Position and height of the lighting fixture
  • Type of luminaire
  • Chromatic quality of the light
  • Color impression
  • Color temperature (CCT)
  • Color rendering index (Ra)
These parameters guided the selection and configuration of lighting elements for each typology to ensure visual comfort, functionality, and energy efficiency.

3.4.2. Lighting Design Proposal

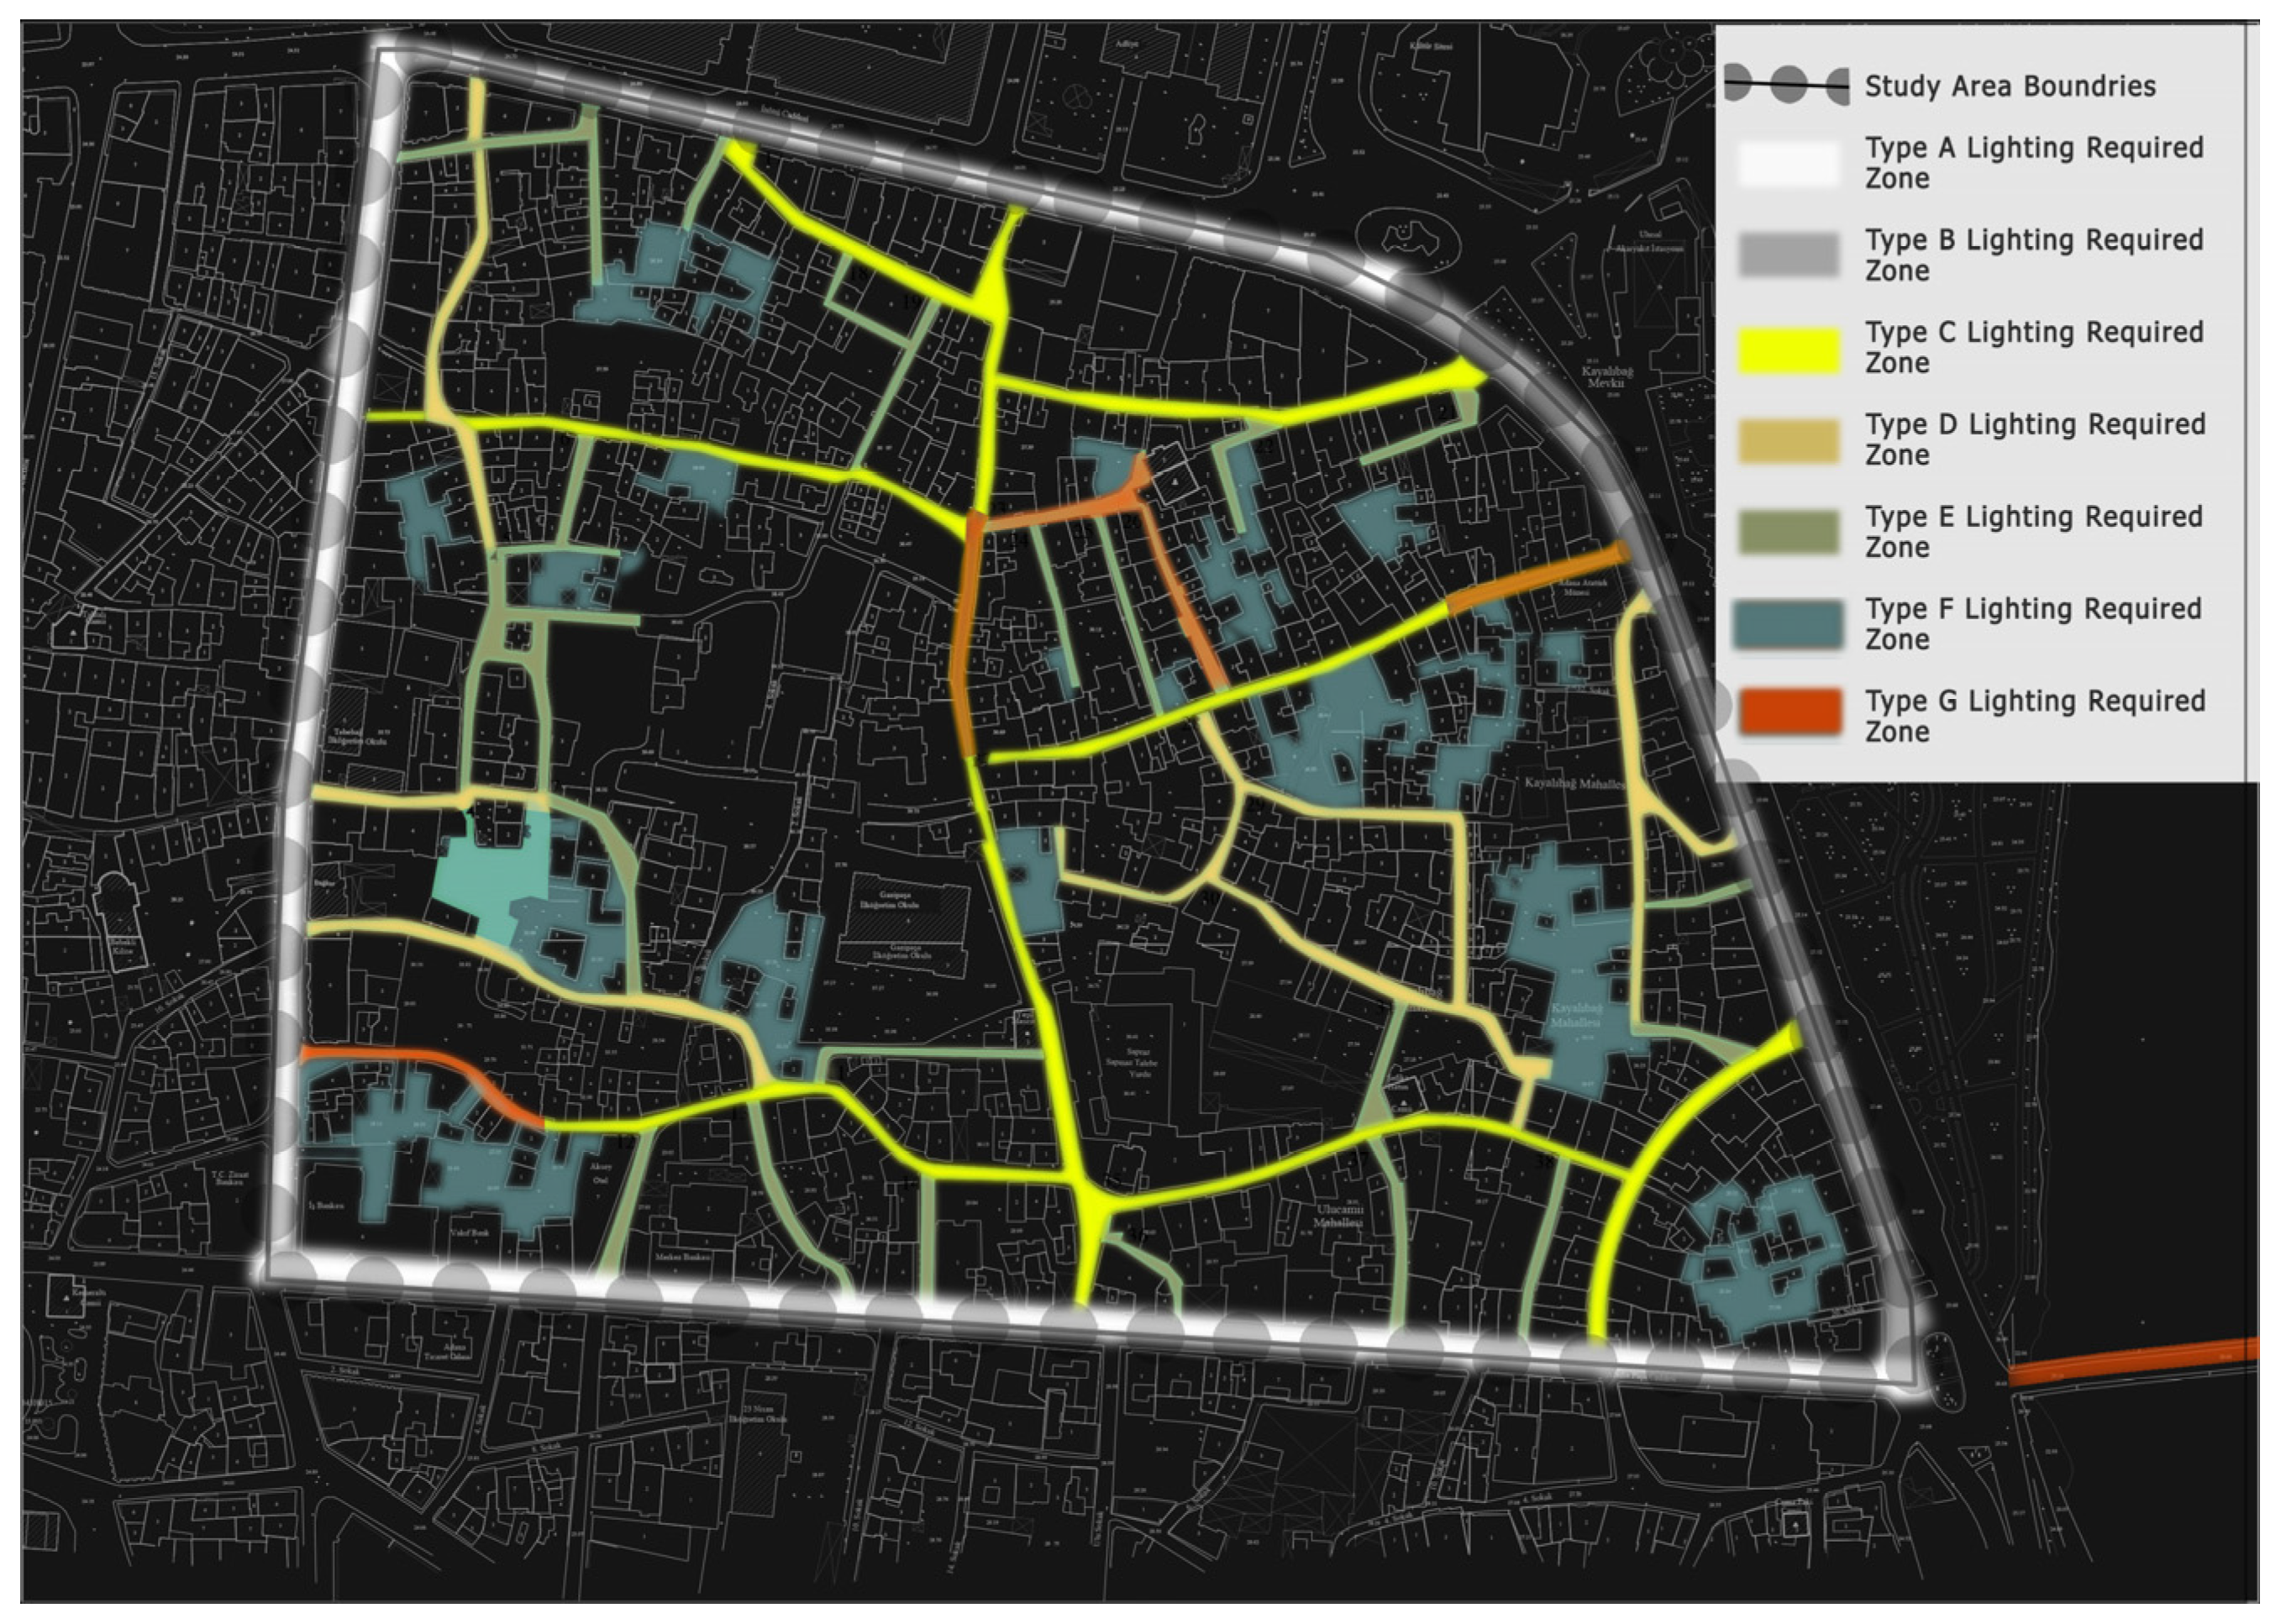
Following the analytical and classification phases, a comprehensive lighting design strategy was developed for Adana’s historic city center. The assignment of typologies (A–G) was derived from the cumulative Lighting Demand Index (LDI) results in combination with street hierarchy, surface configuration, and standardized lighting class requirements. Accordingly, a Lighting Design Proposal Map was generated, assigning context-specific lighting strategies to each street and public space (Figure 13).
  • Type A and B areas, which correspond to primary roads with heavy traffic located along the perimeter of the study area, were identified as having the highest lighting demand.
  • Type C areas represent streets that connect to these main avenues.
  • Type D and E areas are located in the interior parts of the study area, with moderate and low lighting demand, respectively.
  • Type F areas are dead-end spaces within urban blocks, where safety is prioritized for users.
  • Type G areas—which include the Tepebağ Mound and surrounding historical structures—require special lighting strategies to highlight and integrate the historical fabric into the city at night.
Lighting design proposals were formulated according to the quantified performance requirements of each typology.
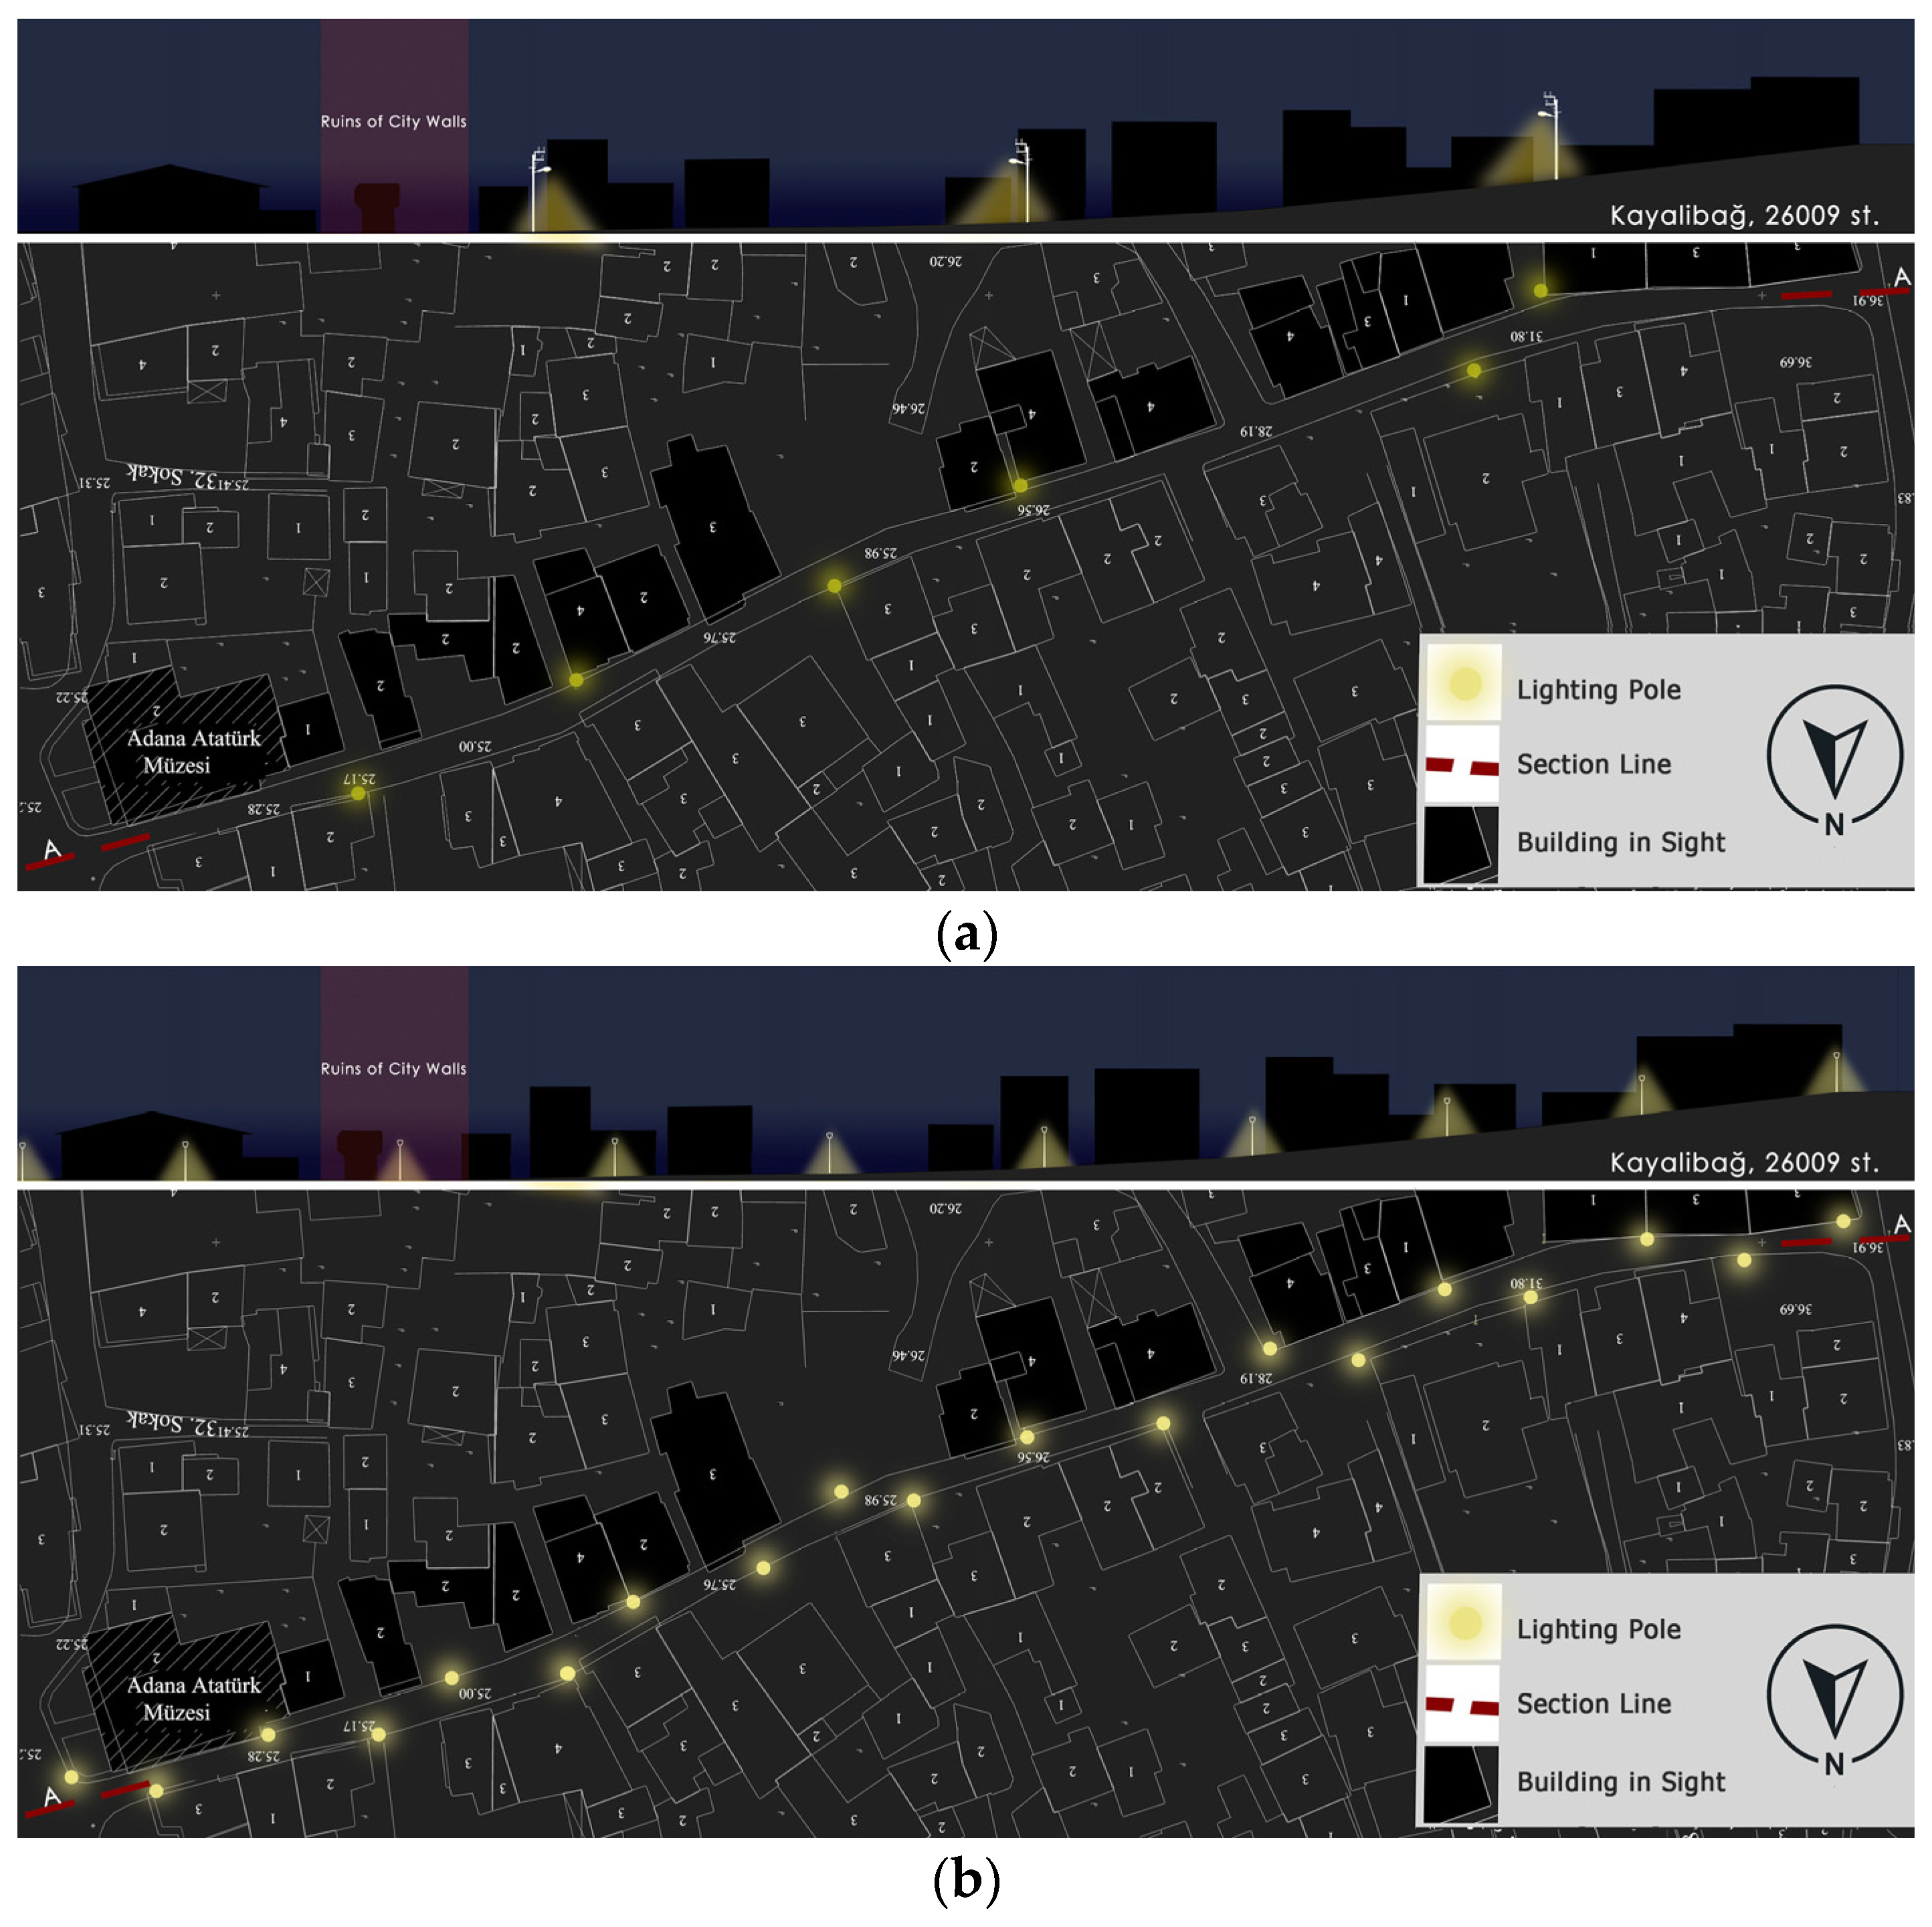
To demonstrate the operational applicability of the proposed typology-based system, a representative example was developed for Type C streets. Type C was selected as it represents a transitional condition between primary avenues and interior streets, combining vehicular and pedestrian use within shared surface configurations. This typology therefore provides a suitable test case for evaluating both functional performance and spatial integration within the historic fabric.
Table 11 presents the technical lighting parameters developed for Type C streets. These recommendations translate the quantified Lighting Demand Index (LDI) results into implementable design configurations aligned with CE2 and S1 performance criteria under EN 13201.
To further validate the effectiveness of the proposed configuration, simulation-based performance analyses were conducted using Dialux Evo, 10 (DIAL GmbH, Lüdenscheid, Germany), and a comparative before-and-after visualization was prepared. The simulation results and visual comparison (Figure 14) illustrate the improvement in average horizontal illuminance, uniformity, and spatial coherence, demonstrating that the typology-based proposal not only satisfies regulatory requirements but also enhances nighttime legibility within the historic urban context.

3.4.3. Simulation-Based Evaluation of Lighting Performance

The performance of the proposed lighting schemes was evaluated using Dialux Evo simulations for representative segments of each typology. Three-dimensional models were developed for selected streets, and horizontal illuminance (Eh) was calculated for vehicular carriageways at 0.2 m above ground level and for pedestrian zones at 1.7 m above ground level.
Simulated results were quantitatively assessed against the performance requirements defined in EN 13201-2 for CE classes and the SLL Code for Lighting criteria for S classes.
For the representative Type C street (Street 26009, Kayalıbağ neighborhood), the simulation yielded an average horizontal illuminance (Ēavg) of 20 lux with an overall uniformity (Uo) of 0.40 for the CE2 carriageway, meeting the prescribed threshold values. The adjacent S1 pedestrian zone achieved illuminance levels consistent with the required class criteria (Table 12).
Comparable simulation analyses conducted for the remaining typologies (A–G) confirmed that the proposed configurations can achieve regulatory compliance when dimensioned according to the typology-specific parameters. These results demonstrate that the typology-based framework not only responds to spatial and heritage constraints but also satisfies quantitative lighting performance standards.

3.4.4. Evaluation of Lighting Design Proposals

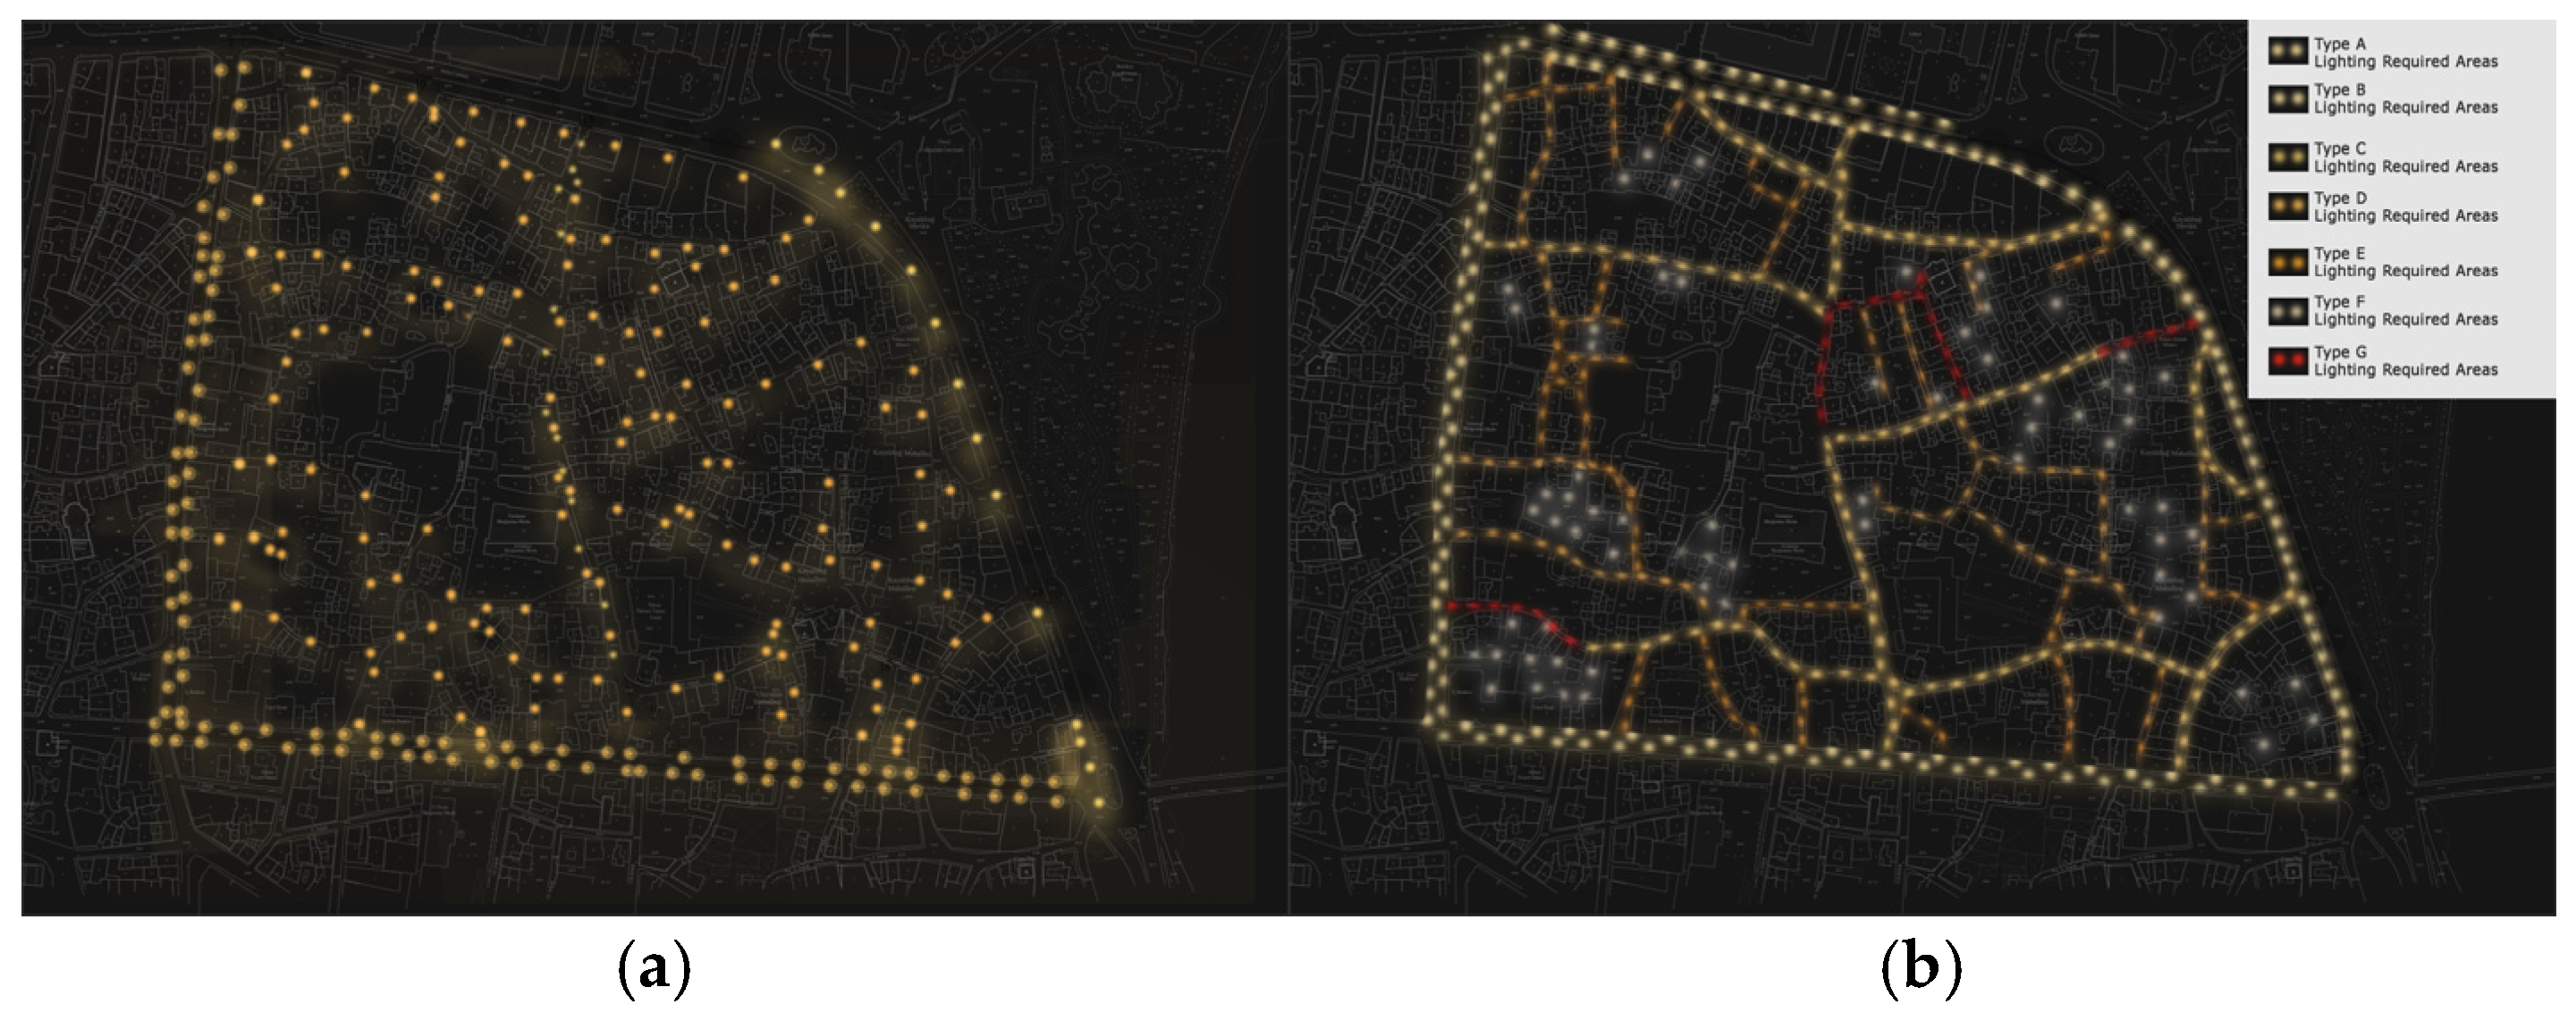
The spatial distribution of lighting needs based on typology was visualized on a map, comparing existing conditions and proposed designs. Ultimately, a comprehensive urban lighting proposal was developed for the entire study area (Figure 15).

4. Discussion

In the proposed urban lighting design for Adana’s historic city center, a holistic design language was adopted to establish spatial continuity across heterogeneous street conditions and layered heritage structures. Unlike fragmented interventions frequently observed in historic contexts [14,16], the typology-based approach ensured that lighting strategies were not applied as isolated aesthetic gestures but as components of a structured master planning framework.
The integration of spatial analysis maps with the Lighting Demand Index (LDI) provided a systematic prioritization mechanism that addresses a gap identified in the literature. Previous studies have emphasized the experiential and cultural dimensions of nighttime environments [10,13], yet many lighting interventions remain monument-focused rather than network-oriented [13,14]. By aggregating conservation value, urban imageability (Lynch [31]), functional hierarchy, and built morphology into a composite index, the present framework extends beyond object-based illumination and reframes lighting as a spatial planning instrument.
Field measurements revealed that acceptable average illuminance values often coincided with inadequate uniformity (Uo), confirming that compliance with average lux levels alone does not guarantee perceptual comfort or spatial coherence. This finding resonates with Pellegrino’s emphasis on visual comfort parameters [6] and supports critiques of technically driven yet perceptually insufficient lighting upgrades in historic settings [14,16]. The results therefore reinforce the need to interpret performance standards such as EN 13201 not as isolated technical benchmarks, but as components within a broader spatial and cultural framework.
The alignment between high LDI scores and measured deficiencies further demonstrates the operational validity of the multi-criteria approach. Streets identified as High or Very High demand frequently corresponded to segments where lighting distribution lacked consistency or failed to reinforce functional clarity. However, the LDI extends beyond corrective assessment. By incorporating conservation zones [29], registered heritage structures [30], and imageability elements [31], the framework operationalizes what Norberg-Schulz describes as the preservation of genius loci [8] within the nighttime urban condition. In this sense, prioritization serves both performance optimization and identity reinforcement.
Simulation-based validation confirmed that typology-specific proposals can achieve regulatory compliance under EN 13201 and SLL criteria [27], while simultaneously enhancing spatial hierarchy. This addresses the fragmentation identified in the literature, where technical standards and heritage-sensitive design are often treated as separate domains [15]. The framework demonstrates that performance compliance and contextual sensitivity are not mutually exclusive but can be structurally integrated through typology-driven planning.
The AHP results, which converged toward equal weighting across spatial criteria [18,19,20], suggest that in historically homogeneous urban fabrics, conservation value, morphology, functional intensity, and imageability operate in interdependent balance. Rather than indicating methodological redundancy, the equal-weight outcome reflects the multidimensional character of heritage environments, where no single parameter dominates the spatial logic of lighting demand.
Nevertheless, the framework’s transferability depends on the availability of reliable spatial datasets and institutional coordination, particularly with conservation authorities. Furthermore, while this study validates technical performance and spatial prioritization, it does not yet incorporate user perception assessments, experiential evaluations, or long-term post-implementation monitoring. Given the emphasis in recent research on experiential and destination-based nighttime identity [9,13], future research should integrate perceptual and socio-cultural metrics to complement the current spatial-technical model.

5. Conclusions

Urban lighting, when guided by a strategic and comprehensive master plan, plays a pivotal role in enhancing the functional, aesthetic, and symbolic dimensions of city spaces—particularly within historically significant contexts. Recent studies emphasize the importance of integrating cultural symbolism and architectural typology into lighting design for heritage sites with distinct historical identities [32]. Well-designed lighting master plans contribute not only to nighttime visibility and safety but also to the preservation of cultural identity, reinforcement of spatial legibility, and revitalization of heritage environments. These strategies must extend beyond technical compliance and energy efficiency, requiring a deeper understanding of urban morphology, cultural values, and user experience.
This study introduced a typology-based methodological framework for developing lighting master plans tailored to historic urban centers. Using the historic core of Adana—a Roman-era urban fabric with rich archeological and architectural heritage—as a case study, the research implemented a five-stage process consisting of analysis, definition, design, planning, and implementation. The methodology integrated field observations, thematic spatial mapping, and a Lighting Demand Index (LDI) based on six spatial criteria, for which equal weighting was adopted due to the homogeneous heritage character of the study area and validated using the Analytic Hierarchy Process (AHP) as a consistency check. Based on the defined typologies, lighting design recommendations were developed and their compliance with lighting standards was tested and verified through simulation.
The findings highlight the value of combining typology-based classification with a transparent, map-driven multi-criteria decision-support approach in bridging the gap between regulatory lighting standards and the spatial realities of historic environments. By translating spatial analysis results into prioritized lighting demand zones, the proposed framework supports informed decision-making while reinforcing urban identity and nighttime legibility.
Nonetheless, the study has certain limitations. The implementation and post-occupancy evaluation phases remain outside the scope of this research and are designated for future collaboration with local authorities. While the framework is designed to be transferable, its effectiveness in different urban and cultural contexts requires further empirical testing and adaptation.
Overall, this study offers a scalable and replicable framework for municipalities, urban designers, and conservation authorities aiming to enhance the nighttime visibility and identity of historic city centers. Grounded in spatial data, typological analysis, and multi-criteria evaluation, the proposed approach has the potential to transform underutilized heritage zones into safer, more legible, and culturally expressive public spaces after dark.

Author Contributions

Conceptualization, N.A. and K.Ç.; methodology, N.A.; formal analysis, N.A.; investigation, N.A.; data curation, N.A.; visualization, N.A.; writing—original draft preparation, N.A.; writing—review and editing, N.A. and K.Ç.; supervision, K.Ç.; project administration, K.Ç.; funding acquisition, K.Ç. All authors have read and agreed to the published version of the manuscript.

Funding

This research was supported by the Scientific Research Projects Coordination Unit (BAP) of Çukurova University under project number FYL-2021-13697.4 (Master’s Thesis Project), titled: ‘’Kentsel Aydınlatma Açısından Aydınlatma Master Planının Önemi—Adana Örneği (The Importance of Lighting Master Plans in Terms of Urban Lighting: The Case of Adana)’’.

Data Availability Statement

Most of the data supporting the findings of this study—such as field observations, illuminance measurements, scoring results, and generated spatial maps—are available from the corresponding author upon reasonable request. One base map used as the foundation for spatial visualizations was obtained from the Adana KUDEB (Conservation Implementation and Supervision Bureau) and was modified and overlaid with original data by the authors. This base map cannot be publicly shared due to institutional usage restrictions.

Acknowledgments

This article is derived from the Master’s thesis titled “Urban Lighting Design Proposal for Historical City Center: The Case of Adana” prepared by Nursel Aydin under the supervision of Kasım Çelik at Çukurova University, Institute of Natural and Applied Sciences, Department of Architecture, as part of the requirements for the Master’s Degree, completed in 2023. The authors gratefully acknowledge the institutional and academic support provided during the thesis process. The authors also thank the Conservation Implementation and Supervision Bureau (KUDEB) of Adana Municipality for providing the base map used during the spatial analysis phase.

Conflicts of Interest

The authors declare no conflicts of interest.

Abbreviations

The following abbreviations are used in this manuscript:
AHPAnalytic Hierarchy Process
CCTCorrelated Color Temperature
CEConflict Area Lighting Class
CRIColor Rendering Index
Eavg (Ēavg)Average Horizontal Illuminance
EmaxMaximum Horizontal Illuminance
EhHorizontal Illuminance
LDILighting Demand Index
SSubsidiary Road Lighting Class
SLLSociety of Light and Lighting
UoOverall Uniformity

Appendix A

Table A1. Integrated Lighting Measurement Results at Pedestrian (1.7 m) and Carriageway (0.2 m) Levels (lux).
LocationNo. of PointsS ClassTarget Ēavg (lux)Measured Ēavg
(1.7 m, lux)
CE ClassTarget Ēavg (lux)Target UoMeasured Ēavg
(0.2 m, lux)
Measured Uo
Tepebağ 27046/a56S21030.5CE3150.426.00.03
Tepebağ 27048/b24S21022.0CE4100.416.50.05
Tepebağ 27047/c23S21022.0CE4100.420.00.05
Cemal Gürsel/ç86S11527.00.4
Musabalı/d150S11516.5CE3150.415.00.06
Kayalıbağ 26004/e37S11513.5CE3150.411.5
Tepebağ 27044/f40S11524.0CE3150.420.50.15
Kayalıbağ 26005/g20S2103.0CE4100.42.00.50
Kayalıbağ 26012/ğ26S2108.5CE4100.47.00.14
Tepebağ 27027/h74S11510.5CE2200.48.50.13
Tepebağ 27032/ı42S1154.0CE3150.43.00.30
Tepebağ 27031/i23S2108.5CE4100.46.50.16
Tepebağ 27031/j17S21029.0CE4100.424.00.04
Tepebağ 27030/k9S21044.5CE4100.437.50.36
Tepebağ 27013/l56S2105.0CE3150.43.50.30
Kayalıbağ 26009/m79S11515.0CE2200.412.00.08
Musabalı/n15S21012.0CE4100.410.00.20
Musabalı/o14S2107.5CE4100.46.00.16
Kayalıbağ 26014/ö15S2103.0CE4100.42.00.50
Kayalıbağ 26019/p57S21014.5CE3150.411.00.09
Tepebağ 27009/r30S21013.0CE4100.410.00.10
Tepebağ 27001/s90S11521.0CE2150.418.00.05
Kayalıbağ/s50S11526.5CE2200.422.50.05
Ulucami 25030/t44S21015.5CE3150.412.50.08
Abidin Paşa/u196S11531.50.4

Appendix B

Table A2. Complete Lighting Demand Index (LDI) Results for Street Segments.
#NeighborhoodStreet No.Map1Map2Map3Map4Map5Map6AHP-Based
LDI
Lighting Demand
1Tepebağ2700134333319High
22700222214314Low
32700322214314Low
42700422214314Low
52700834222215Moderate
62700934212113Low
72701134112112Low
82701333111211Low
92702144112113Low
102702344123115Moderate
112702634212113Low
122702734333218High
132703023124214Low
142703133212213Low
152703223423317Moderate
162704434333218High
172705134212113Low
182705233112212Low
19Musabalı34434220High
20Kayalıbağ2600434333218High
212600534123215Moderate
222600734114215Moderate
232600834112213Low
242600934333218High
252601234112213Low
262601334112213Low
272601434112213Low
282601934222215Moderate
292602133223215Moderate
302602334123215Moderate
312602434112213Low
322602534424320High
332602632414317Moderate
342602734114316Moderate
35Kayalıbağ34234319High
36Ulucami2503024334319High
372503222214314Low
382503422214314Low
392503822214314Low
Table A3. Complete Lighting Demand Index (LDI) Results for Major Avenues.
#Major Avenue NameMap1Map2Map3Map4Map5Map6AHP-Based LDILighting Demand
1Abidinpaşa Avenue24444422Very High
2Cemal Gürsel Avenue24444422Very High
3İnönü Avenue34444423Very High
4Seyhan Avenue34444423Very High
Table A4. Proposed Urban Lighting Design Typologies and Street Assignments (Street segments are classified based on CE and S lighting classes, lighting demand levels, and assigned typologies accordingly).
#NeighborhoodStreet No.CE ClassS ClassLighting DemandLighting Typology
1Tepebağ27001CE2S1HighC
2 27002CE4S2LowE
3 27003CE4S2LowE
4 27004CE4S2LowE
5 27008CE3S1ModerateD
6 27009CE4S2LowE
7 27011CE4S2LowE
8 27013CE4S2LowE
9 27021CE4S2LowE
10 27023CE3S1ModerateD
11 27026CE4S2LowE
12 27027CE2S1HighC
13 27030CE4S2LowE
14 27031CE4S2LowE
15 27032CE3S1ModerateD
16 27044CE2S2HighC
17 27051CE4S2LowE
18 27052CE4S2LowE
19 MusabalıCE2S1HighC
20Kayalıbağ26004CE2S1HighC
21 26005CE4S2ModerateD
22 26007CE4S2ModerateD
23 26008CE4S2LowE
24 26009CE2S1HighC
25 26012CE4S2LowE
26 26013CE4S2LowE
27 26014CE4S2LowE
28 26019CE3S1ModerateD
29 26021CE3S1ModerateD
30 26023CE3S1ModerateD
31 26024CE4S2LowE
32 26025CE3S1HighC
33 26026CE4S2ModerateD
34 26027CE4S2ModerateD
35 KayalıbağCE2S1HighC
36Ulucami25030CE2S2HighC
37 25032CE4S2LowE
38 25034CE4S2LowE
39 25038CE4S2LowE
Table A5. Lighting Class and Typology Assignments for Major Avenues.
#Major Avenue NameCE ClassS ClassLighting DemandLighting Typology
1Abidinpaşa AvenueCE1S1HighA
2Cemal Gürsel AvenueCE1S1HighA
3İnönü AvenueCE1S1HighA
4Seyhan AvenueCE1S1HighB

References

  1. Boyce, P. Human Factors in Lighting, 3rd ed.; CRC Press: Boca Raton, FL, USA, 2014. [Google Scholar] [CrossRef] [Scilit]
  2. Şatır, S. Dış mekan aydınlatma armatürlerinin tarihi gelişimi. Tasarım 1999. [Google Scholar]
  3. Batu, B. İstanbul’da Elektrik Öncesi ve Sonrası Mekan Aydınlatmaları Üzerine bir Inceleme. Master’s Thesis, Fatih Sultan Mehmet Vakıf University, Istanbul, Türkiye, 2020. [Google Scholar]
  4. Ritter, J. Master planlar—Durum değerlendirmesi. Prof. Light. Des. Türkiye 2006, 12, 56–61. [Google Scholar]
  5. Atkins, S.; Husain, S.; Storey, A. Influence of Street Lighting on Crime and Fear of Crime; Research Report; Great Britain Home Office: London, UK, 1991.
  6. Pellegrino, A. Assessment of artificial lighting parameters in a visual comfort perspective. Light. Res. Technol. 1999, 31, 107–115. [Google Scholar] [CrossRef] [Scilit]
  7. Liu, S.; Zhou, Y.; Wang, F.; Wang, S.; Wang, Z.; Wang, Y.; Qin, G.; Wang, P.; Liu, M.; Huang, L. Lighting characteristics of public space in urban functional areas based on SDGSAT-1 glimmer imagery: A case study in Beijing, China. Remote Sens. Environ. 2024, 306, 114137. [Google Scholar] [CrossRef] [Scilit]
  8. Norberg-Schulz, C. Genius Loci: Towards a Phenomenology of Architecture; Academy Editions: London, UK, 1980. [Google Scholar]
  9. Hidalgo, M.C.; Berto, R.; Galindo, M.P.; Getrevi, A. Identifying attractive and unattractive urban places: Categories, restorativeness and aesthetic attributes. Medio Ambiente Comport. Hum. 2006, 7, 115–133. [Google Scholar]
  10. Achsani, R.A.; Ornam, K.; Kusuma, H.E.; Wonorahardjo, S.; Triyadi, S. Attractive urban lighting as a new destination branding. ARTEKS J. Tek. Arsit. 2022, 7, 117–125. [Google Scholar] [CrossRef] [Scilit]
  11. Talebian, K.; Riza, M. Mashhad, city of light. Cities 2020, 101, 102674. [Google Scholar] [CrossRef] [Scilit]
  12. Tayhuadong, L.; Inkarojrit, V. Lighting Design for Lanna Buddhist Architecture: A Case Study of Suan Dok Temple, Chiang Mai, Thailand. Sustainability 2024, 16, 7494. [Google Scholar] [CrossRef] [Scilit]
  13. Ruan, W.-Q.; Jiang, G.-X.; Li, Y.-Q.; Zhang, S.-N. Night Tourscape: Structural Dimensions and Experiential Effects. J. Hosp. Tour. Manag. 2023, 55, 108–117. [Google Scholar] [CrossRef] [Scilit]
  14. Zielinska-Dabkowska, K.; Xavia, K. Historic Urban Settings, LED Illumination and Its Impact on Nighttime Perception, Visual Appearance, and Cultural Heritage Identity. In Proceedings of the 5th SGEM International Multidisciplinary Scientific Conferences on Social Sciences and Arts (SGEM2018), Florence, Italy, 23 October 2018; Volume 5, pp. 277–292. [Google Scholar] [CrossRef] [Scilit]
  15. IESNA. Lighting Handbook; Illuminating Engineering Society of North America: New York, NY, USA, 2000. [Google Scholar]
  16. Valetti, L.; Floris, F.; Pellegrino, A. Renovation of Public Lighting Systems in Cultural Landscapes: Lighting and Energy Performance and Their Impact on Nightscapes. Sustainability 2021, 14, 509. [Google Scholar] [CrossRef] [Scilit]
  17. Mansfield, K.P. Architectural lighting design: A research review over 50 years. Light. Res. Technol. 2018, 50, 80–97. [Google Scholar] [CrossRef] [Scilit]
  18. Saaty, T.L. The Analytic Hierarchy Process; McGraw-Hill: New York, NY, USA, 1980. [Google Scholar]
  19. Saaty, T.L. Decision making with the analytic hierarchy process. Int. J. Serv. Sci. 2008, 1, 83–98. [Google Scholar] [CrossRef] [Scilit]
  20. Malczewski, J. GIS and Multicriteria Decision Analysis; John Wiley & Sons: New York, NY, USA, 1999. [Google Scholar]
  21. Enginöz, Y. Kenti aydınlatmak. Yirmi Bir Mimar. Tasarım Kent Derg. 2004, 29. [Google Scholar]
  22. Paskovic, A. Urban Lighting: Planning for Public Spaces in Vancouver’s Southeast False Creek. Master’s Thesis, Queen’s University, Kingston, ON, Canada, 2012. [Google Scholar]
  23. TS EN 13201:EN 13201-1:2015; Road Lighting—Part 1: Guidelines on Selection of Lighting Classes. European Committee for Standardization (CEN): Brussels, Belgium, 2015.
  24. EN 13201-2:2015; Road Lighting—Part 2: Performance Requirements. European Committee for Standardization (CEN): Brussels, Belgium, 2015.
  25. EN 13201-3:2015; Road Lighting—Part 3: Calculation of Performance. European Committee for Standardization (CEN): Brussels, Belgium, 2015.
  26. EN 13201-4:2015; Road Lighting—Part 4: Methods of Measuring Lighting Performance. European Committee for Standardization (CEN): Brussels, Belgium, 2015.
  27. Society of Light and Lighting (SLL). SLL Code for Lighting; CIBSE: London, UK, 2022. [Google Scholar]
  28. Saban, D. Geleneksel Adana: Mahalleler, Sokaklar, Binalar; Akademisyen Yayınları: Ankara, Türkiye, 2017. [Google Scholar] [CrossRef] [Scilit]
  29. Yıldırım, T. Kentsel ve Arkeolojik Sit Alanında Adana/Tepebağ Höyüğü ve Planlama Sürecinde Kentsel Arkeoloji. Master’s Thesis, Çukurova University, Adana, Türkiye, 2012. [Google Scholar]
  30. Körlü, E. Kentsel Sit Alanlarında Sürdürülebilir Koruma-Geliştirme Için bir Model Önerisi: Adana Tepebağ-Kayalıbağ Mevkii. Doctoral Dissertation, Konya Technical University, Konya, Türkiye, 2020. [Google Scholar]
  31. Lynch, K. The Image of the City; MIT Press: Cambridge, MA, USA, 1960. [Google Scholar]
  32. Bista, D.; Bista, A.; Shrestha, A.; Doulos, L.T.; Bhusal, P.; Zissis, G.; Topalis, F.; Chhetri, B.B. Lighting for cultural and heritage site: An innovative approach for lighting in the distinct pagoda-style architecture of Nepal. Sustainability 2021, 13, 2720. [Google Scholar] [CrossRef] [Scilit]
Figure 1. Proposed urban lighting design framework for historic city centers.
Buildings 16 01030 g001
Figure 2. Five-stage typology-based lighting master planning methodology for historic urban contexts.
Buildings 16 01030 g002
Figure 3. Historical Urban Development Map of Adana (redrawn by the author based on [28]).
Buildings 16 01030 g003
Figure 4. Boundaries of the Selected Study Area in Adana.
Buildings 16 01030 g004
Figure 5. Current Lighting Fixture Types and Their Spatial Distribution.
Buildings 16 01030 g005
Figure 6. Illuminance measurement framework in the study area: (a) horizontal measurement setup and sensor heights (0.2 m and 1.7 m) where the red dots indicate the measurement points; (b) street segments included in the field measurement campaign.
Buildings 16 01030 g006
Figure 7. Measured Illuminance Levels and Their Spatial Distribution.
Buildings 16 01030 g007
Figure 8. Streets, Avenues, and Public Spaces Planned for Lighting Design.
Buildings 16 01030 g008
Figure 9. The scoring system used to generate the heat maps.
Buildings 16 01030 g009
Figure 10. Heat Maps Depicting Lighting Demand Intensity by Criterion.
Buildings 16 01030 g010
Figure 11. Final Composite Lighting Demand Map Based on Cumulative Scores (Numbers indicate street segments corresponding to Table A2).
Buildings 16 01030 g011
Figure 12. Lighting classifications of the study area based on standardized lighting classes: (a) CE lighting classifications; (b) S lighting classifications.
Buildings 16 01030 g012
Figure 13. Urban Lighting Design Proposal Map.
Buildings 16 01030 g013
Figure 14. Existing and proposed lighting conditions for Kayalıbağ Street (26009): (a) existing lighting layout; (b) proposed Type C lighting configuration. The numbers shown on the buildings indicate the number of floors of each structure.
Buildings 16 01030 g014
Figure 15. Comparison of lighting conditions in the study area: (a) existing lighting layout; (b) proposed lighting design layout based on typology.
Buildings 16 01030 g015
Table 1. Lighting Problems Identified Through On-Site Observations in the Historic Environment.
Buildings 16 01030 i001
Tepebağ and Kayalıbağ Neighborhoods’ lighting elements that lack language consistency
Buildings 16 01030 i002
Low color rendering index in Musabalı Street and Kayalıbağ Neighborhood
Buildings 16 01030 i003
Insufficient lighting on Abidinpaşa Street and Seyhan Street
Buildings 16 01030 i004
Insufficient lighting in Kayalıbağ Neighborhood and Musabalı Street
Buildings 16 01030 i005
Misplaced lighting poles in front of the Cinema Museum and Atatürk House
Buildings 16 01030 i006
Excessive lighting in Tepebağ Neighborhood as seen from Abidinpaşa Street
Table 2. Summary of Integrated Lighting Measurement Results at Pedestrian (1.7 m) and Carriageway (0.2 m) Levels (lux).
LocationNo. of PointsS ClassTarget Ēavg (lux)Measured Ēavg
(1.7 m, lux)
CE ClassTarget Ēavg (lux)Target UoMeasured Ēavg
(0.2 m, lux)
Measured Up
Tepebağ 27046/a56S21030.5CE3150.426.00.03
Tepebağ 27048/b24S21022.0CE4100.416.50.05
Tepebağ 27047/c23S21022.0CE4100.420.00.05
Table 3. Thematic maps used in the analysis phase.
Map1. Archeological and Urban Conservation AreasMap2. Registered Roads, Parcels, and Buildings
Buildings 16 01030 i007Buildings 16 01030 i008
Map3. Lynch MapMap4. Street and Road Classification
Buildings 16 01030 i009Buildings 16 01030 i010
Map5. Functional Land UseMap6. Building Density and Height Distribution
Buildings 16 01030 i011Buildings 16 01030 i012
Table 4. Thematic Heat Maps Illustrating Lighting Demand Intensity by Criterion.
Map1. Archeological and Urban Conservation Areas Heat MapMap2. Registered Roads, Parcels, and Buildings Heat Map
Buildings 16 01030 i013Buildings 16 01030 i014
Map3. Lynch Heat MapMap4. Street and Road Classification Heat Map
Buildings 16 01030 i015Buildings 16 01030 i016
Map5. Functional Land Use Heat MapMap6. Building Density and Height Distribution Heat Map
Buildings 16 01030 i017Buildings 16 01030 i018
Table 5. AHP-Derived Weight Distribution and Consistency Assessment.
Map CodeSpatial Analysis LayerAHP Weight (wi)
Map1Zoning and Conservation Priority0.167
Map2Registered Buildings and Parcels0.167
Map3Lynch Analysis (Urban Imageability)0.167
Map4Street and Road Classification0.167
Map5Functional Land Use0.167
Map6Building Density and Height0.167
Consistency Ratio (CR)<0.10
Note: Equal weights emerged from consistent pairwise comparisons (CR < 0.10) and were not predefined.
Table 6. Example Results from Lighting Demand Needs Assessment (Scores calculated based on analysis maps representing historical, functional, and spatial attributes.).
#NeighborhoodStreet No.Map1Map2Map3Map4Map5Map6AHP-Based LDILighting Demand
1Tepebağ2700134333319High
2 2700222214314Low
3 2700322214314Low
20Kayalıbağ2600434333218High
21 2600534123215Moderate
22 2600734114215Moderate
36Ulucami2503024334319High
37 2503222214314Low
38 2503422214314Low
Table 7. Lighting Demand Scores for Major Avenues.
#Major Avenue NameMap1Map2Map3Map4Map5Map6AHP-Based LDILighting Demand
1Abidinpaşa Avenue24444422Very High
2Cemal Gürsel Avenue24444422Very High
3İnönü Avenue34444423Very High
Table 8. Typologies Representing the Lighting Needs of Urban Areas Planned for Lighting Design.
TypologyLighting DemandApplication TypeSurface Condition
AVery HighPedestrian + VehicularSeparate surfaces
BVery HighPedestrian onlySeparate surfaces
CHighPedestrian + VehicularShared surface
DModeratePedestrian + VehicularShared surface
ELowPedestrian + VehicularShared surface
FCul-de-sacPedestrian + VehicularShared surface
GSpecialPedestrian + VehicularShared surface
Table 9. Summary of lighting class and typology assignments for selected neighborhood streets.
#NeighborhoodStreet No.CE ClassS ClassLighting DemandLighting Typology
1Tepebağ27001CE2S1HighC
2 27002CE4S2LowE
3 27003CE4S2LowE
20Kayalıbağ26004CE2S1HighC
21 26005CE4S2ModerateD
22 26007CE4S2ModerateD
36Ulucami25030CE2S2HighC
37 25032CE4S2LowE
38 25034CE4S2LowE
Table 10. Summary of lighting class and typology assignments for major avenues.
#Major Avenue NameCE ClassS ClassLighting DemandLighting Typology
1Abidinpaşa AvenueCE1S1HighA
2Cemal Gürsel AvenueCE1S1HighA
3İnönü AvenueCE1S1HighA
Table 11. Lighting Design Recommendations—Type C Example.
Illumination Type: CBuildings 16 01030 i019Buildings 16 01030 i020Buildings 16 01030 i021Buildings 16 01030 i022
RecommendationOption 1Option 2Option 3Option 4
Light SourceLEDLEDLEDLED
Fixture Height4–6 m4–6 m4–6 m4–6 m
Luminaire TypePole-mountedPole-mountedPole-mounted with bracketSuspended (Catenary)
Color Temperature4000 K3000 K3000 K3000 K
Light DirectionSingle-sidedSingle-sidedSingle-sidedSingle-sided
Fixture Spacing8–10 m8–10 m4–5 m4–5 m
PositioningOpposed staggeredOpposed staggeredSingle-sidedSingle-sided
CRI (Ra)80808080
Table 12. Lighting Simulation Table: Dialux Evo simulation output comparing calculated and required illuminance levels for a sample Type C street.
Lighting Simulation for Type C Location: 26009 Street, Kayalıbağ Neighborhood
Selected AreaPlan View (Unscaled/Scaled)
Buildings 16 01030 i023Buildings 16 01030 i024
The red line indicates the selected street, and the yellow highlighted area represents the measurement/simulation area.
3D Visualization via Dialux
Buildings 16 01030 i025
Illuminance Calculation Surfaces
Vehicular Road Surface (0.2 m above ground)Pedestrian Path Surface (1.7 m above ground)
Buildings 16 01030 i026Buildings 16 01030 i027
Horizontal Illuminance Measurement Results
CE classS class
ClassU0EavEmaxM.U0M. EavClassEavEmaxM. Eav
CE20.420300.420S11522.521
Disclaimer/Publisher’s Note: The statements, opinions and data contained in all publications are solely those of the individual author(s) and contributor(s) and not of MDPI and/or the editor(s). MDPI and/or the editor(s) disclaim responsibility for any injury to people or property resulting from any ideas, methods, instructions or products referred to in the content.