1. Introduction
1.1. Research Background and Significance
Secondary school laboratories are among the highest-risk locations on school campuses [
1]. Compared to regular classrooms, laboratories are typically equipped with open flames, compressed gases, high-power electrical equipment, and various flammable, explosive, or corrosive chemicals. In the event of a fire, explosion, or hazardous chemical leak, the accident spreads more rapidly, and the consequences are more severe than in typical teaching environments. Furthermore, secondary school students have limited safety awareness and emergency response experience, often exhibiting collective, imitative, and sometimes even panicked reactions under pressure. Previous research has shown that prolonged indoor evacuation times, even when following national evacuation strategies, can still lead to significant casualties [
2]. Therefore, the actual safety level of a laboratory depends not only on building codes or material properties but also on the behavior of students and teachers in emergency evacuation scenarios. Thus, research on laboratory layout based on evacuation behavior is essential.
1.2. Literature Review
1.2.1. Secondary School Laboratory
Laboratory spaces in secondary schools serve as core environments for interactive and inquiry-based science education. As teaching models shift towards active learning and hands-on experimentation, furniture design and spatial layout become crucial in supporting safety, usability, and teaching effectiveness [
3]. Therefore, previous research on secondary school laboratories has largely focused on exploring the matching of furniture with ergonomics [
4,
5] and the optimization of the laboratory environment [
6,
7]. However, most studies treat laboratories as static workspaces under normal teaching conditions, primarily focusing on “daily usability,” such as seating comfort, ease of operation, and environmental quality. These studies pay insufficient attention to students’ evacuation behavior in emergency situations and lack systematic research on “dynamic evacuation performance evaluation” that considers different laboratory layout schemes in conjunction with student behavioral characteristics under specific layout conditions. Therefore, it is necessary to construct simulation models tailored to the behavioral characteristics of secondary school students to dynamically evaluate and compare the emergency evacuation efficiency of different laboratory layouts, providing a quantitative basis for safety-oriented optimization of building space layouts.
1.2.2. Application of Pedestrian Simulation Models in Emergency Evacuation Behavior Simulation
Pedestrian simulation models are computational representations of pedestrian movement and crowd dynamics that aim to reproduce how individuals and groups navigate within a given spatial environment under different conditions [
8]. According to the level of detail at which pedestrians are described, these models can be broadly classified into macroscopic, mesoscopic, and microscopic approaches: macroscopic models treat pedestrian flow analogously to fluids or gases and focus on aggregate variables such as flow, density, and speed [
9]; mesoscopic models describe pedestrians at an intermediate level, emphasizing route choice and spatial configuration while simplifying individual interactions [
10]; microscopic models represent pedestrians as discrete, decision-making agents, explicitly accounting for inter-individual interactions and enabling the detailed depiction of complex behaviors such as congestion, self-organization, and emergent crowd patterns [
11].
Currently, research on the application of pedestrian simulation models in emergency evacuation behavior simulation mainly focuses on evacuation effectiveness evaluation, supplemented by architectural environment optimization design [
12,
13]. Research on architectural environment optimization centered on evacuation performance is still in its early stages, with applications primarily concentrated in transportation hubs [
14] and large public buildings [
15]. Limited attention is paid to primary and secondary school buildings, especially high-risk, densely furnished, and student-concentrated teaching spaces such as laboratories. Existing work on school environments largely focuses on parameter analysis of overall traffic spaces or local components such as staircases [
16], lacking systematic research that combines pedestrian simulation models with specific furniture layouts and student behavioral characteristics to conduct dynamic evacuation performance evaluation and layout optimization for special spaces like secondary school laboratories.
1.2.3. Optimization Design
Recent research has demonstrated the remarkable effectiveness of intelligent data-driven modeling methods in the optimal design of complex engineering systems. For example, machine learning-based models have been used to predict and optimize the performance of CO
2 laser cutting of fused deposition modeling (FFF) thermoplastics by capturing the nonlinear relationships between multiple process parameters and performance results [
17]. Simultaneously, artificial neural networks have been applied to multi-input multi-output modeling of clay-bonded sand mold systems to support both forward and backward predictions [
18]. These studies highlight the potential of data-driven optimization frameworks in handling strongly coupled and nonlinear processes.
In contrast, this study extends the optimization paradigm to indoor space layout design. This paper selects the social force model based on the AnyLogic platform for simulation analysis and uses it for the first time to evaluate and optimize common laboratory layouts in emergency evacuation scenarios. The social force model can reproduce the self-organizing phenomenon of current pedestrian flow and provides a foundation for simulating pedestrian evacuation behavior in secondary school laboratories [
19]. The core advantage of the social force model lies in its more reasonable and flexible behavior analysis, which is more in line with the characteristics of pedestrian movement. AnyLogic’s pedestrian simulation module uses a social force model as its basis for pedestrian motion, aiming to further simplify the modeling process of the simulation environment and pedestrian behavior. The core advantage of the social force model lies in its more reasonable and flexible behavior analysis, which is more in line with the characteristics of pedestrian movement [
20]. AnyLogic supports the interaction of multiple models on the same platform, and combined with its pedestrian database and agent database, it can improve the simulation accuracy of pedestrian behavior intelligence, evacuation behavior characteristics, and spatial environment characteristics. Several studies have already verified the accuracy of the AnyLogic simulation platform and the effectiveness of the social force model in reproducing the characteristics of evacuation pedestrian flow [
21,
22].
1.3. Research Aim
Against this backdrop, this paper uses the AnyLogic simulation software to model and simulate pedestrian evacuation behavior in secondary school laboratory layouts. By introducing parameters such as walking speed, shoulder width, and reaction time, the evacuation performance of typical laboratory layouts is simulated. Key performance indicators include total evacuation time, spatial density, and detour distance. The research results provide evidence-based recommendations for improving the safety, space utilization, and behavioral adaptability of secondary school laboratories, and can provide a basis for revising educational building codes, school laboratory construction standards, and guidelines for laboratory furniture and safety facility configuration. This paper focuses on the following three questions:
To what extent does the spatial layout of laboratory furniture influence evacuation performance, and which layout configuration exhibits the most favorable overall evacuation efficiency?
What specific evacuation advantages and limitations are associated with each type of laboratory layout?
How can the identified limitations of each layout be systematically improved through layout adjustment and optimization strategies?
2. Materials and Methods
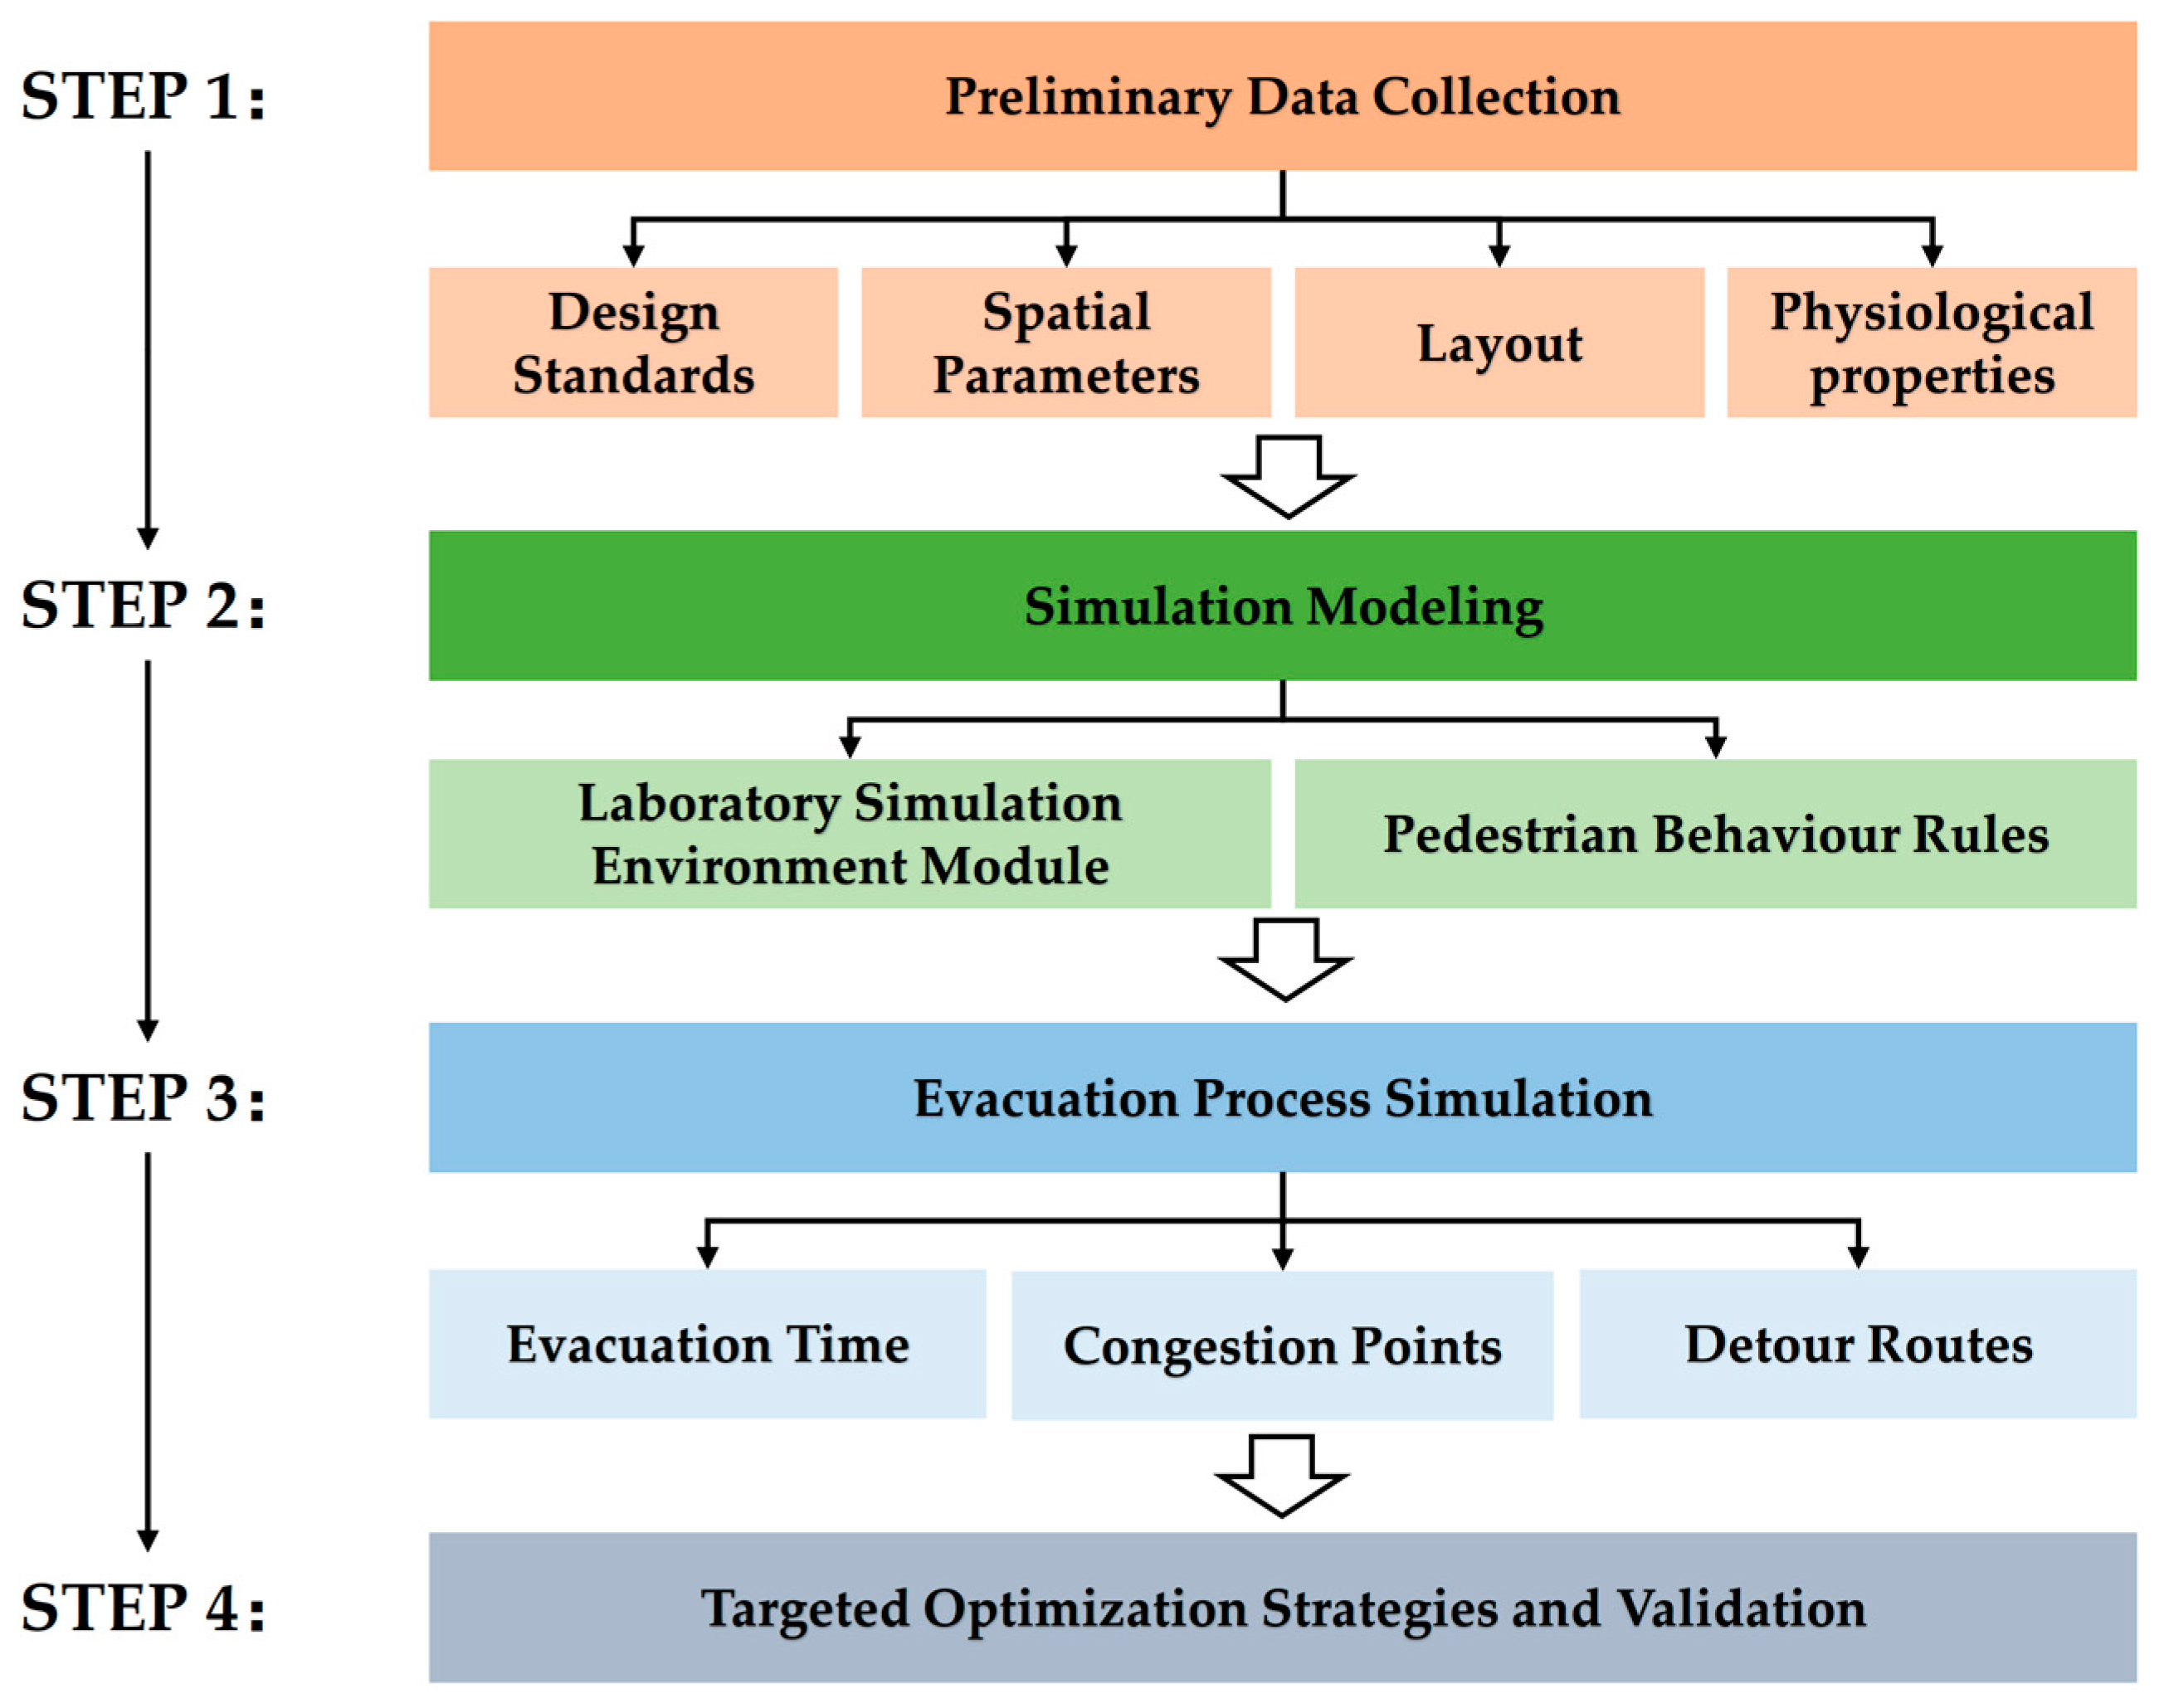
The framework of this study is shown in
Figure 1 [
23]. First, based on field surveys and literature reviews, the most common layout types of middle school laboratories, the specific layout dimensions and spatial specifications, and the physiological characteristics of middle school students were determined. Second, based on the data obtained from the preliminary survey, a laboratory simulation environment module and pedestrian behavior rules were constructed using AnyLogic version 8.9. Next, the evacuation performance of typical layouts under different configurations was simulated. Finally, targeted optimization strategies for the corresponding layouts were proposed and validated.
2.1. Design Standards and Spatial Parameters
Secondary school science laboratories must meet national design regulations to ensure safety, functionality, and space efficiency [
24]. According to GB50099-2011 [
25] and JYT-0385-2006 [
26], each student should be allocated no less than 1.8 m
2 of working area, with an ideal of 1.92 m
2. The laboratory must be at least 90 m
2 for a class of 50 students, and its height should not be below 2.2 m to ensure proper ventilation.
Laboratory furniture configuration is a key factor affecting space efficiency and emergency response capabilities. Common furniture includes student laboratory tables, teacher demonstration tables, side cabinets, lockers, stools and chairs. Among them, the size and layout of the student laboratory table have a decisive influence on the overall spatial layout. According to the GB50099-2011 [
25] standard, typical furniture sizes include: a four-person double-sided laboratory table (1.5 m × 0.9 m), an island-type six-person laboratory table (1.8 m × 1.25 m), and a teacher demonstration table (2.4 m × 0.7 m).
Aisle spacing is crucial for safety and ease of use. Depending on the type of laboratory table, the minimum clear distance between two tables is 0.60 m to 1.50 m. The horizontal aisle behind the rear seats shall not be less than 1.20 m; the central longitudinal main aisle shall not be less than 0.70 m when two people operate on one side, and shall not be less than 0.90 m when four or more people operate on both sides; an evacuation passage of at least 0.60 m shall be reserved between the end of the laboratory table along the wall and the wall. The distance between the front and rear rows of laboratory tables and the blackboard should be controlled within the range of 2.5–11 m, and the horizontal viewing angle between the front row students and the blackboard shall not be less than 30°.
2.2. Laboratory Layout Typologies
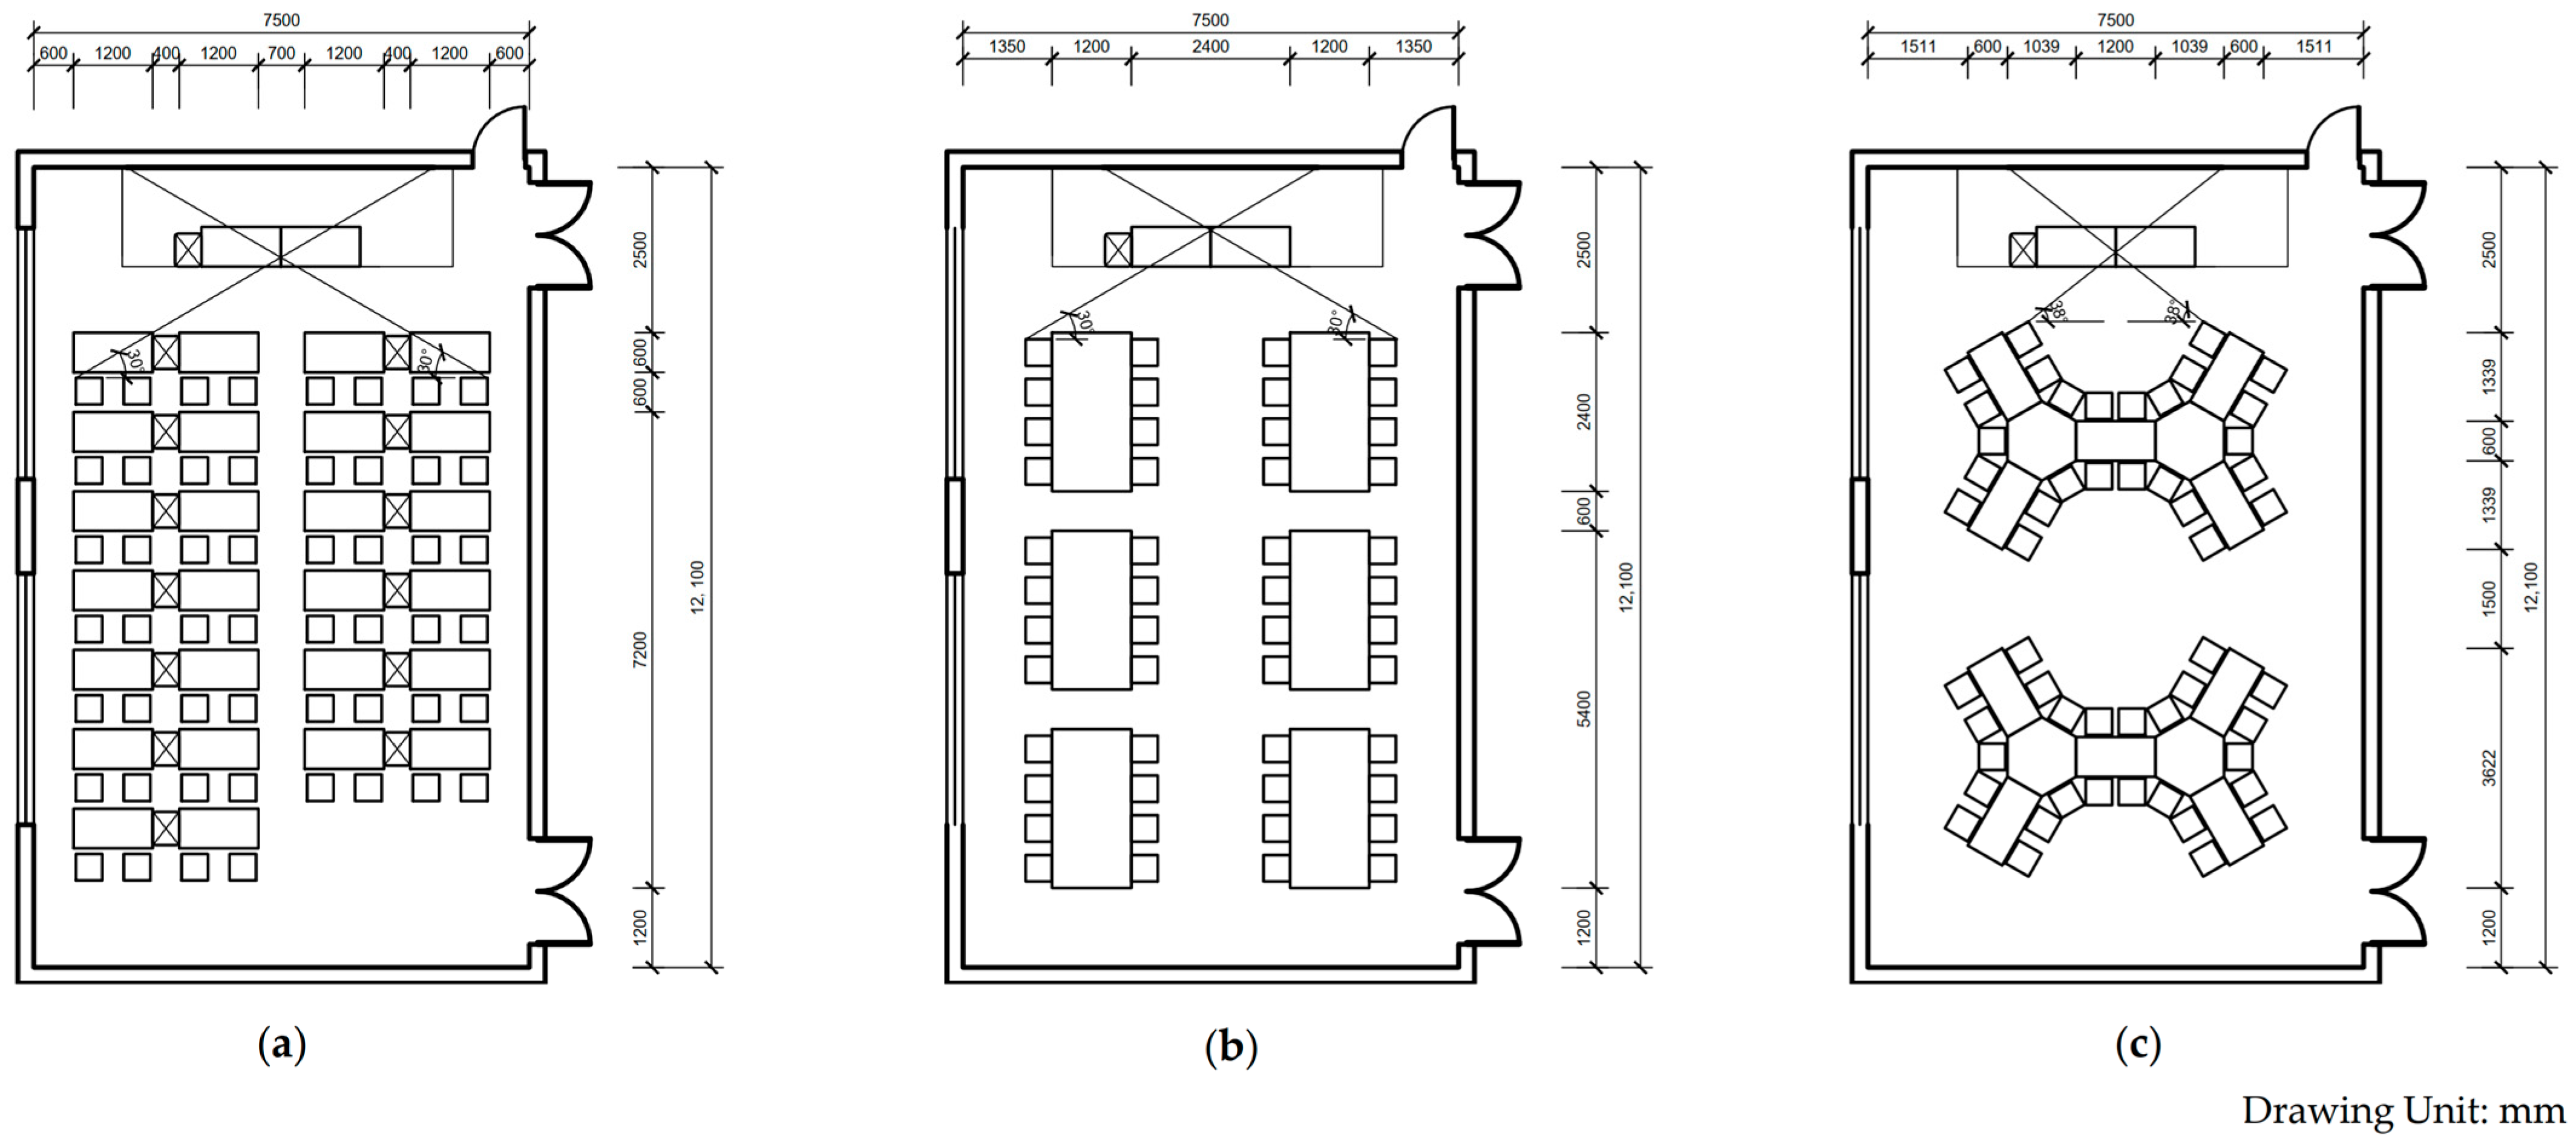
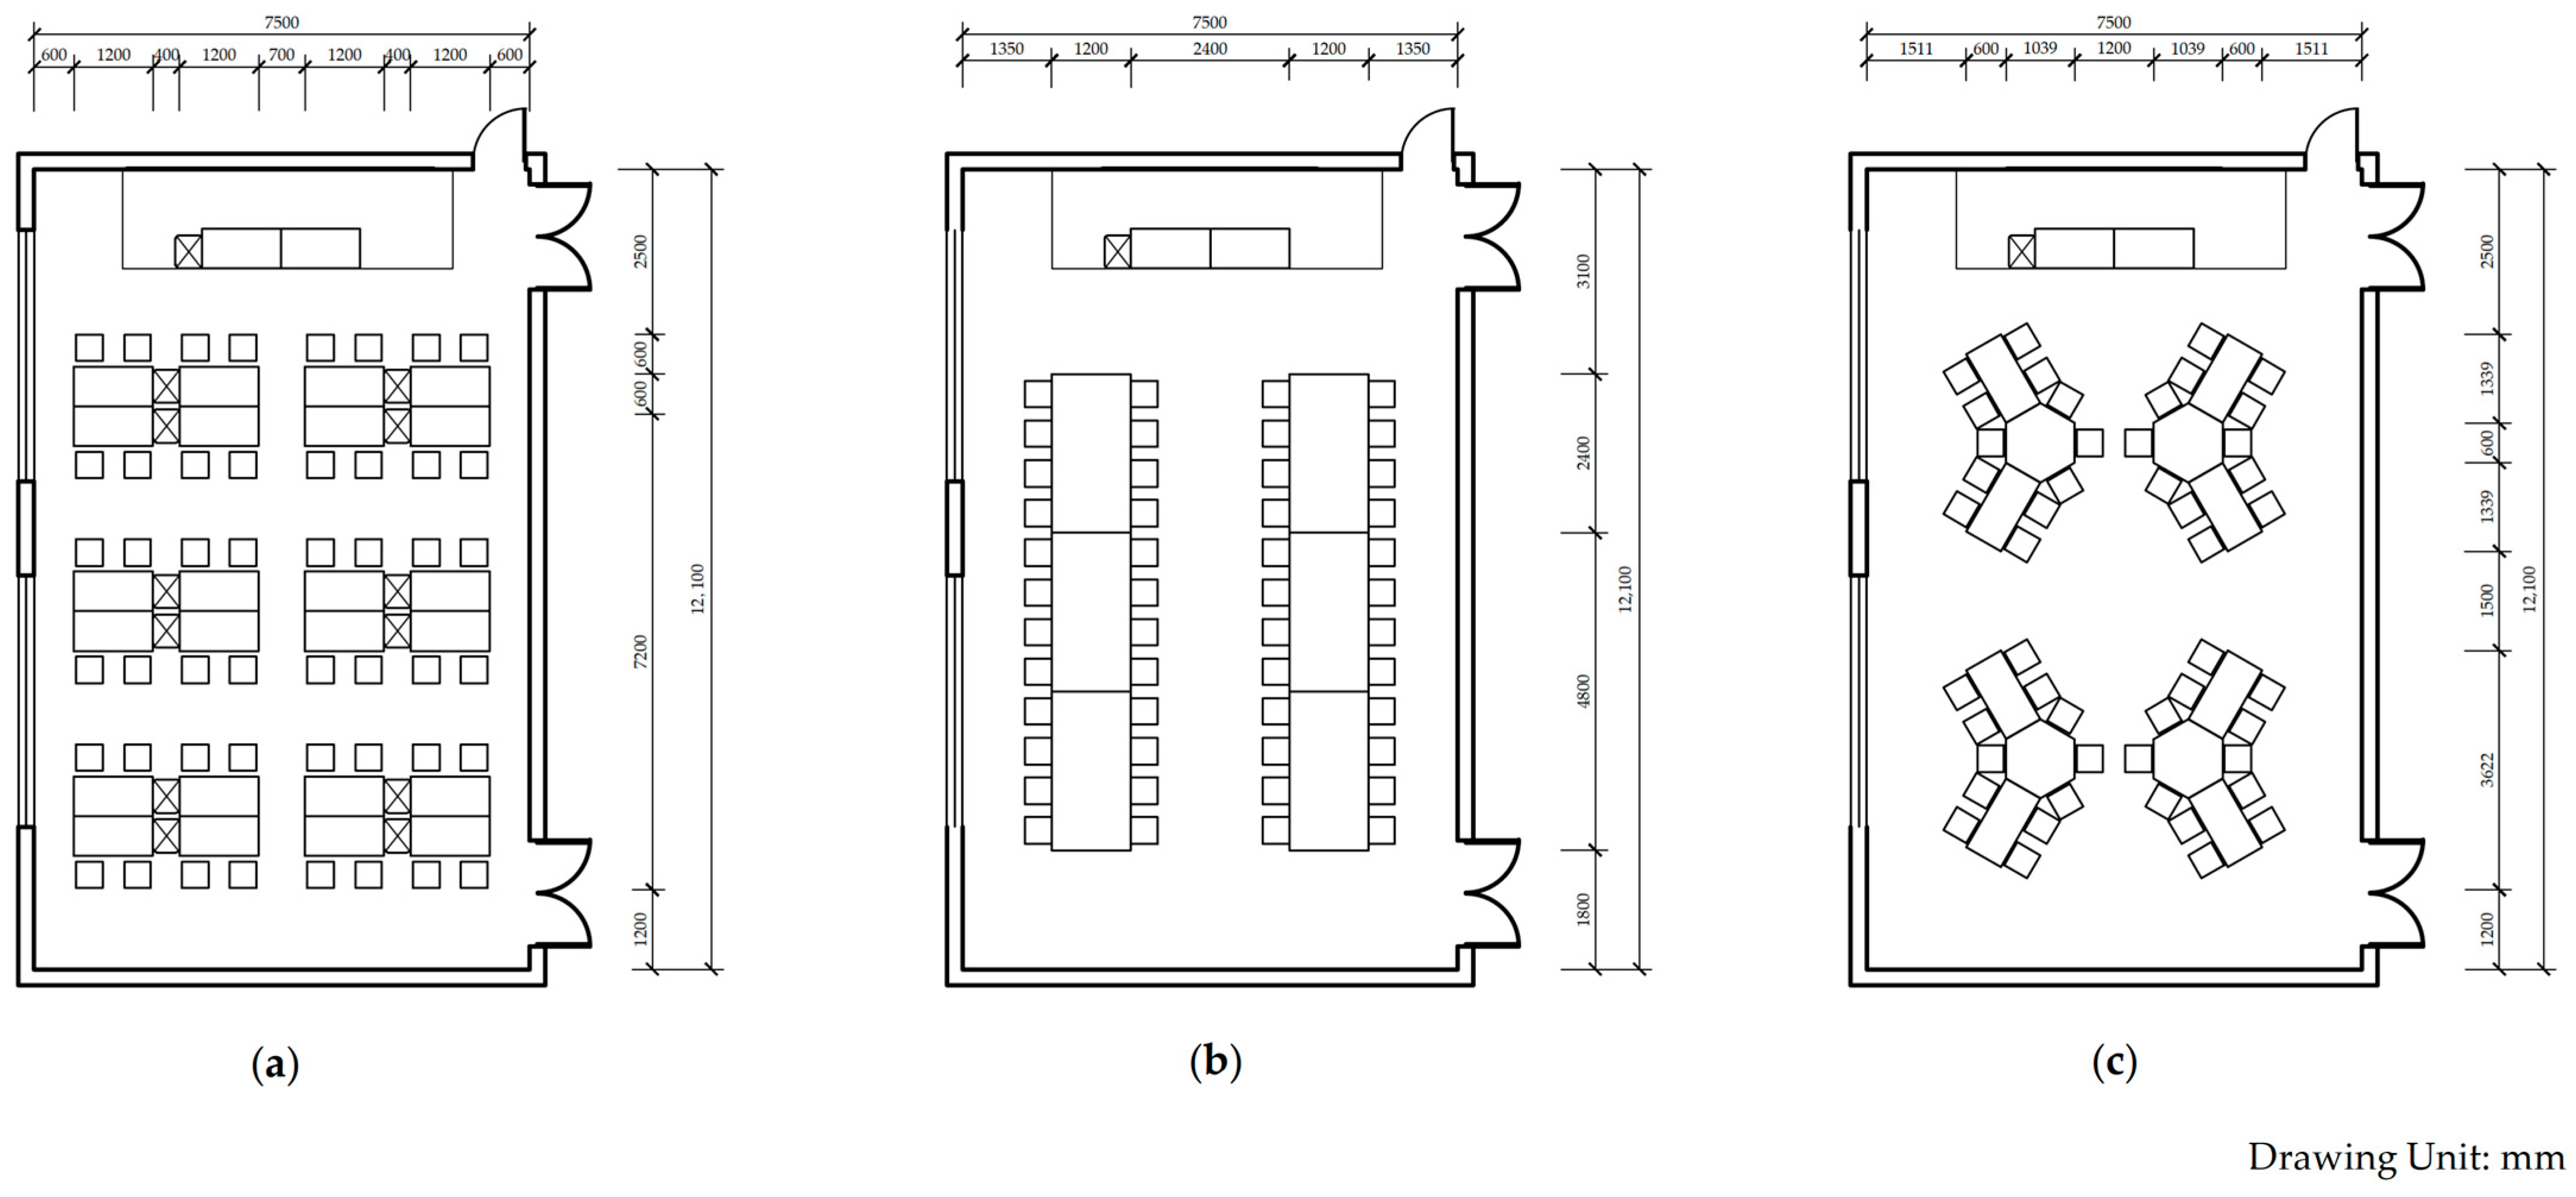
Based on the functional requirements and teaching practices, this study selected three representative layout schemes [
27]:
Parallel Layout—the experimental tables are arranged in neat rows and columns, with the same direction, all facing the teacher’s demonstration table or podium;
Island Layout—the experimental tables are surrounded by several groups to form independent “islands” to form multiple group experimental areas;
Hybrid Layout—this configuration flexibly arranges tables and chairs by integrating the strengths of both parallel and island layouts, adapting to diverse experimental content and pedagogical requirements.
Figure 2 summarizes the minimum space allocation and major furniture dimensions for these typical configurations, providing a geometric basis for simulation modeling.
2.3. Modeling Process of Evacuation Behavior Simulation
The construction of the pedestrian evacuation model mainly consists of two parts: the construction of the physical environment and the construction of the pedestrian behavior flowchart [
28]. For a middle school laboratory, the physical environment is mainly reflected in the spatial structure of the laboratory and the layout of the experimental tables. The construction of the pedestrian behavior flowchart is mainly reflected in the pedestrian flow design in the evacuation routes [
23]. The main steps of physical environment modeling are as follows:
Import CAD drawings: Import the CAD drawings of the actual scene into AnyLogic software as the base map of the model. The basic physical environment data for this study were obtained and compiled in AutoCAD 2019 software.
Draw graphics: Create geographical boundaries such as walls and columns in the model and delineate them using spatial markers (such as “wall”, “circular wall”, “rectangular wall”, etc.) in the pedestrian database.
Set exit locations: Set the exit locations of the classroom using the target lines in the pedestrian database.
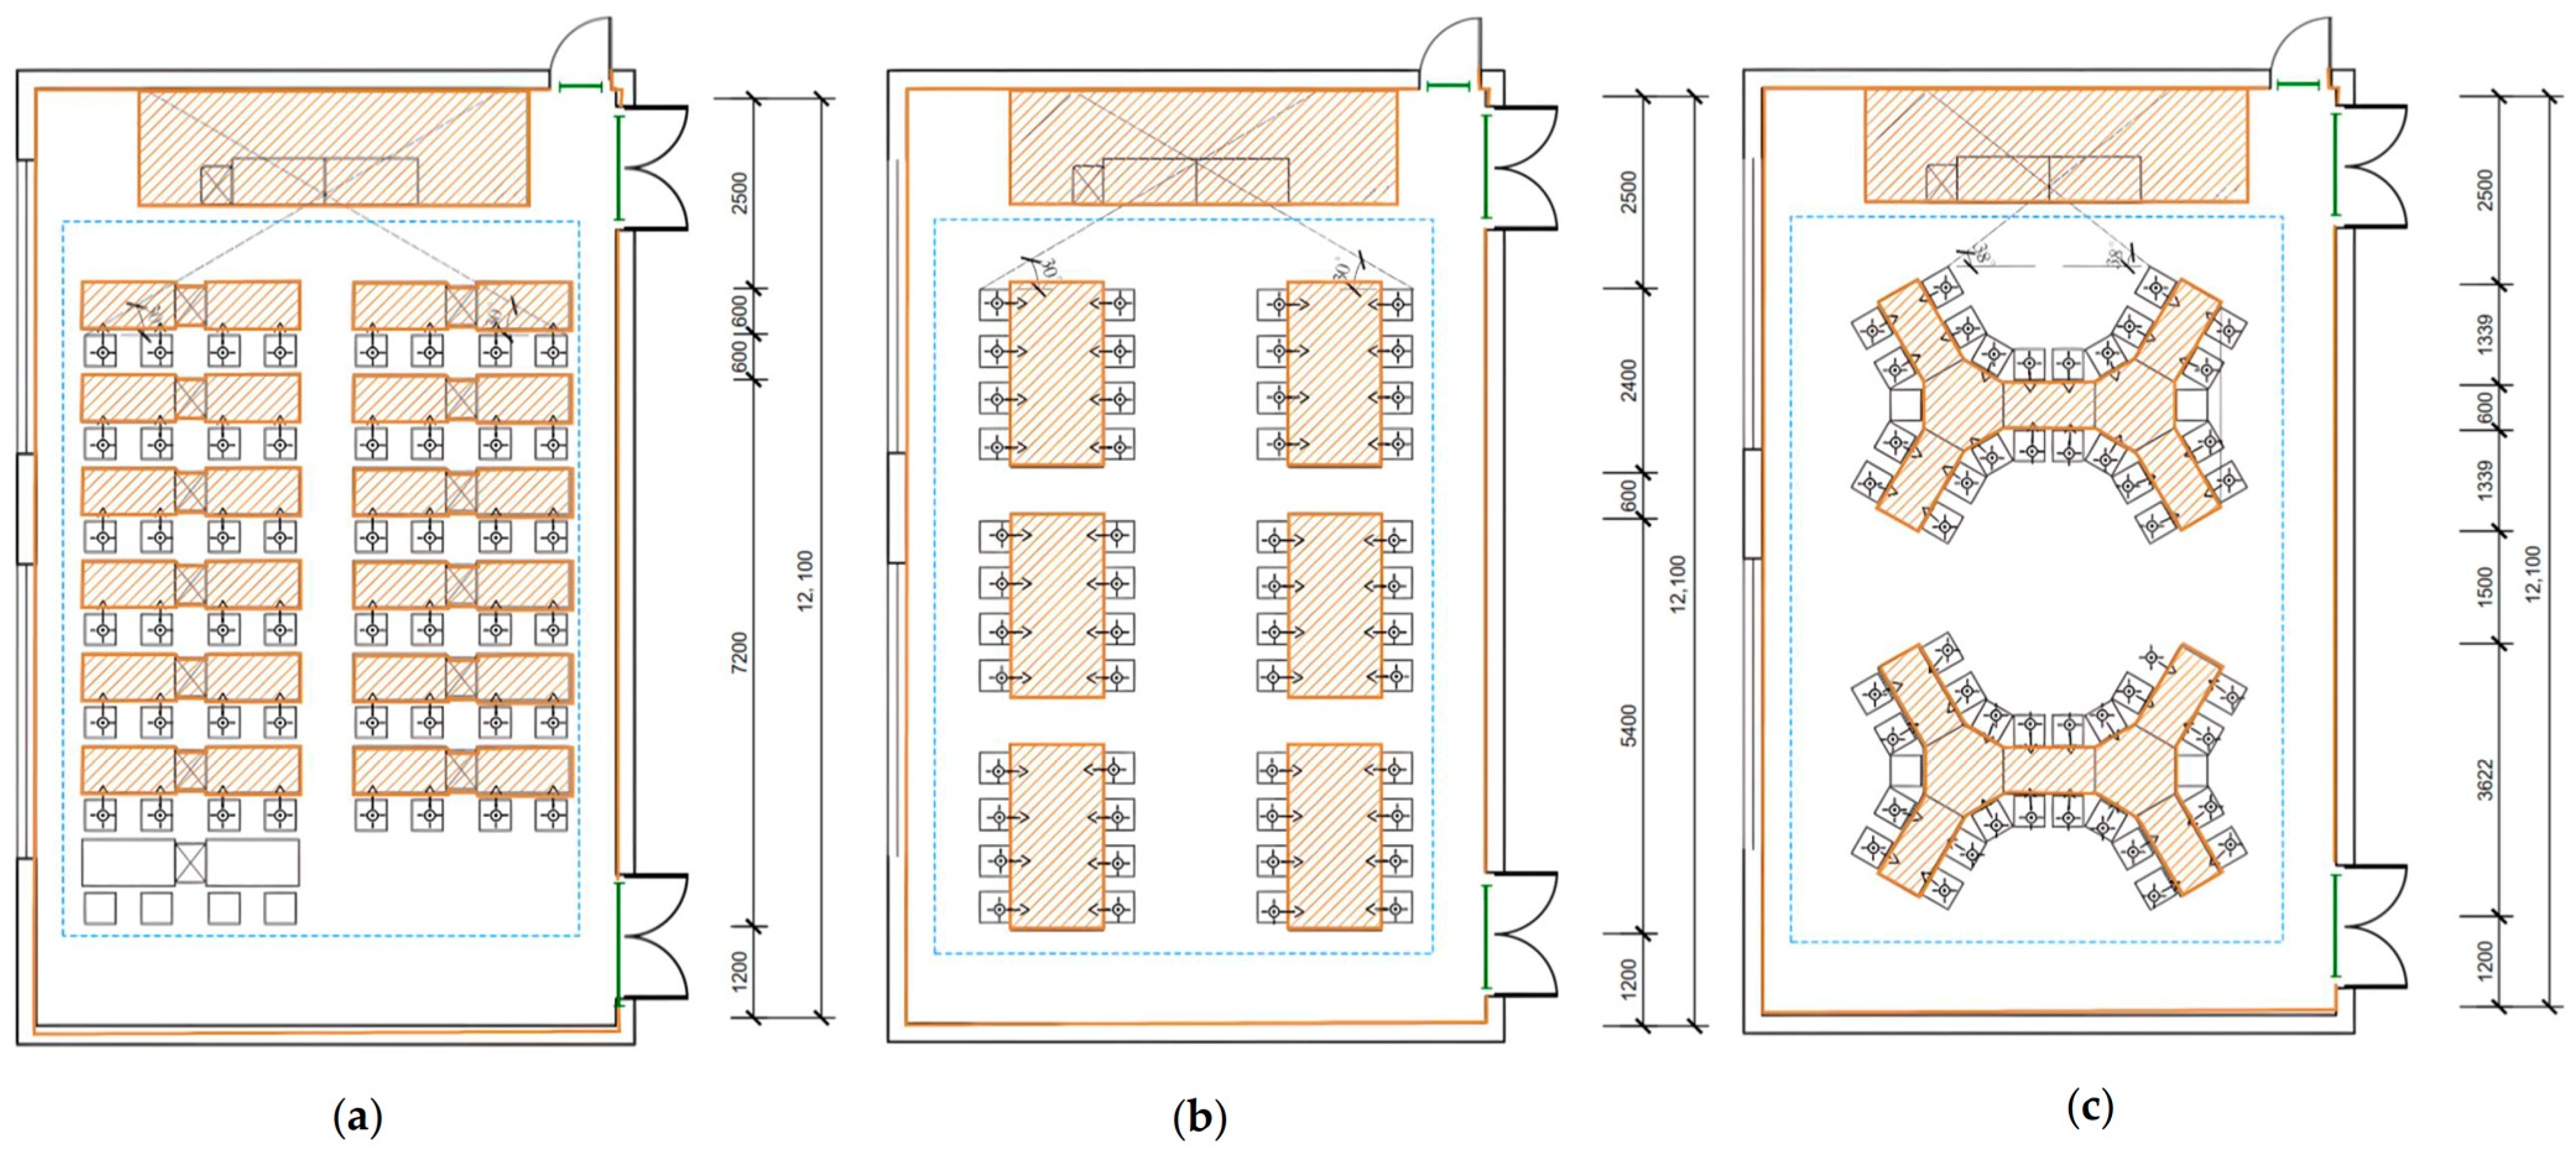
The constructed physical model is shown in
Figure 3, and the spatial marker modules used and their functions are explained in detail in
Table 1.
Pedestrian behavior modeling simulates the dynamic behavior of pedestrians in a simulation environment, defining the entire process from pedestrian generation to disappearance using a flowchart design. This is mainly achieved through the following steps:
Defining pedestrian parameters: Parameters in the model (such as the number of students, student speed, reaction time, etc.) are calibrated, and parameter values are adjusted based on actual data to achieve high simulation accuracy.
Pedestrian generation: The initial position of each student is determined using Source and attractors from the flow modeling library.
Establishing a target line: This defines the evacuation path for students, selecting evacuation exits based on proximity during the evacuation process.
Defining flow logic: The behavioral logic of students in the simulation environment is designed using a flowchart, including reaction time, start of evacuation, and completion of evacuation.
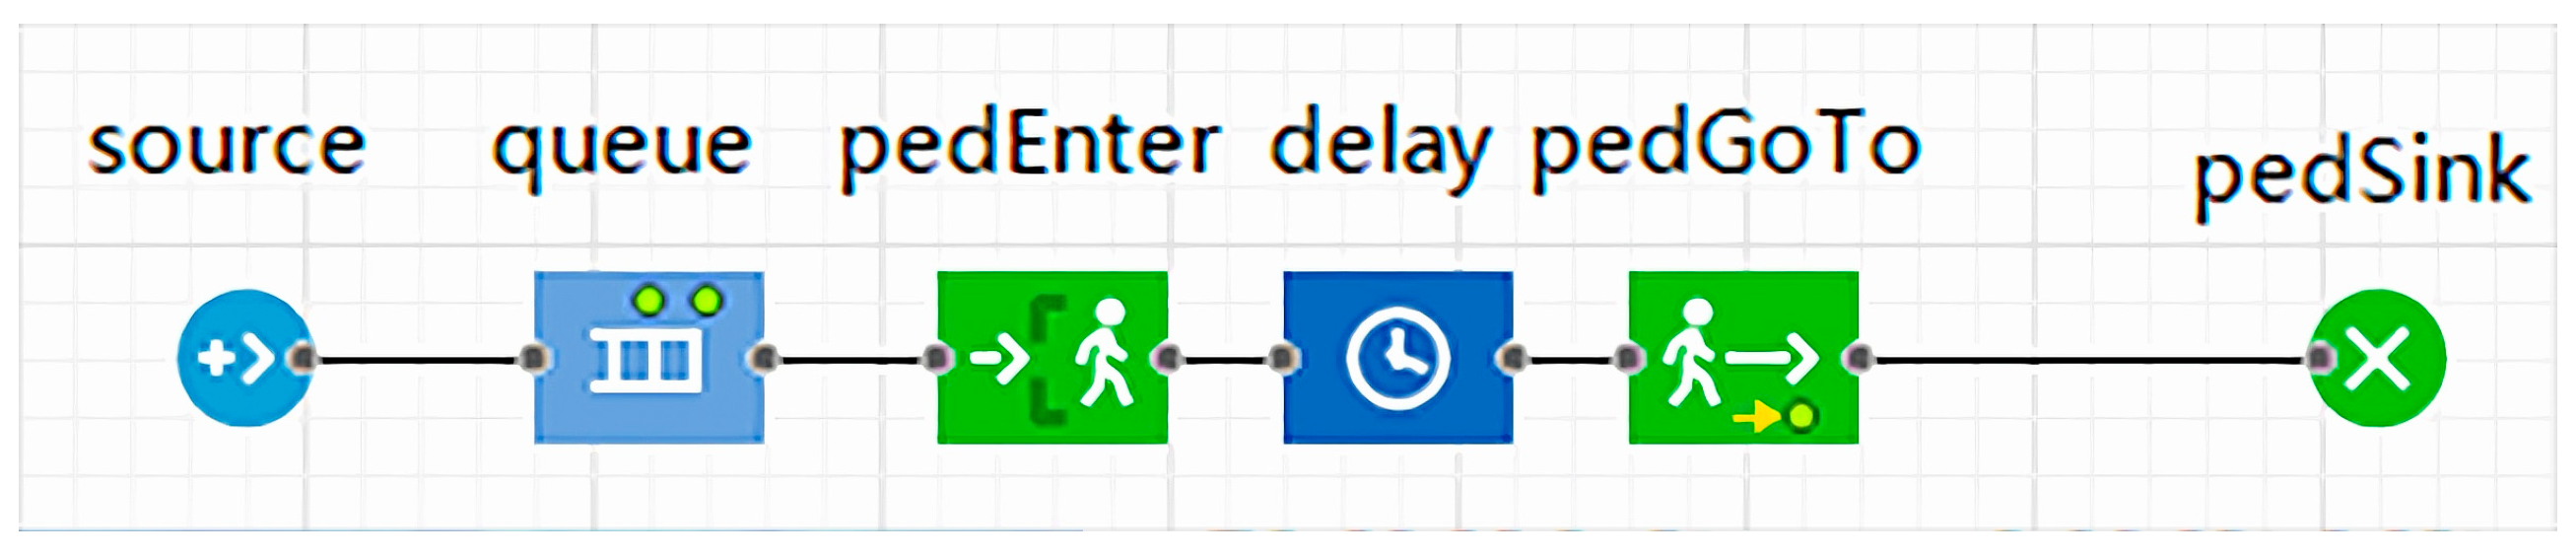
The simulation modules used in this study include source, queue, pedEnter, delay, pedGoTo, and pedSink. The constructed student evacuation flow logic diagram is shown in
Figure 4. The relevant modules of the pedestrian library and modeling flow library used, and their functions, are explained in detail in
Table 2.
2.4. Parameter Settings in AnyLogic
The simulation focuses on layout-induced spatial constraints under controlled behavioral conditions, rather than modeling extreme panic or irrational behaviors. Simulating pedestrian evacuation behavior in a built environment requires setting the number of people to be evacuated, the comfortable speed of the agents, the initial speed, and the diameter of a single agent. The relevant parameters are set based on the following:
Evacuation numbers: Under a uniform building area of 90.75 m2, the parallel layout can meet the lower limit of the standard for 50 people (1.80 m2 per student). The island layout, using standard minimum furniture sizes and retaining necessary safety passages, can accommodate a maximum of 48 people (1.89 m2 per student). While the hybrid layout can accommodate 52 people, its per-student area is only 1.75 m2, lower than the standard requirement. To simultaneously meet the per-student area standard of the “Design Code for Primary and Secondary Schools” and ensure that all three layouts have feasible and comparable seating configurations under the same building area, this study determined 48 people as the uniform sample size for subsequent emergency evacuation simulations.
Diameter: According to the results in
Table 3, the shoulder width distribution range of underage males and underage females aged 13 to 17 is 297–430 mm and 298–402 mm, respectively, concentrated in the range of 312–416 mm and 314–382 mm. Therefore, the pedestrian size was set in the range of 312–416 mm during the model construction process.
Table 3.
Statistics of shoulder width of people aged 12–17 in my country [
29].
Table 3.
Statistics of shoulder width of people aged 12–17 in my country [
29].
| Percentile | P1 | P2.5 | P5 | P10 | P25 | P50 | P75 | P90 | P95 | P97.5 | P99 |
|---|
| Male minors aged 13–15 years old | 297 | 305 | 312 | 322 | 339 | 357 | 376 | 392 | 400 | 406 | 415 |
| Male minors aged 16–17 years old | 326 | 336 | 346 | 354 | 369 | 383 | 398 | 409 | 416 | 423 | 430 |
| Female minors aged 13–15 years old | 298 | 307 | 314 | 320 | 332 | 343 | 356 | 368 | 376 | 383 | 392 |
| Female minors aged 16–17 years old | 309 | 315 | 322 | 328 | 340 | 351 | 364 | 375 | 382 | 389 | 402 |
Speed: As shown in
Table 4, the average speed of middle school students walking or jogging in an emergency is about 2 m/s. Therefore, the comfortable speed for pedestrians should be set in the range of 1.5–2.5 m/s, and the initial speed should be in the range of 0.5–1.5 m/s.
Table 4.
Walking speed chart for secondary school students [
30].
Table 4.
Walking speed chart for secondary school students [
30].
| Distance Traveled (m) | 25 | 50 |
|---|
| Male students | 2.08 m/s | 2.07 m/s |
| Female students | 2.05 m/s | 2.01 m/s |
Delay time: The time from when personnel discover a hazard to when evacuation begins is called the personnel reaction time, or delay time. Based on students’ familiarity with the laboratory and their level of alertness, the delay time is set to 10–15 s [
31]. The personnel reaction time in the study represents pre-movement delay. Pre-movement delay is the time between perceiving the alarm and initiating evacuation movement. This delay can vary substantially depending on occupant alertness, training, and available cues, and is often a dominant source of uncertainty in evacuation assessments [
32]. The 10–15 s range was selected to represent an alerted, supervised school setting.
After completing the physical environment modeling and pedestrian behavior modeling, the constructed simulation model is run, allowing for a direct visual view of the 2D model. During model operation, pedestrian behavior dynamics are observed to check for any issues. If problems are found, the model is adjusted accordingly to improve its accuracy and reliability.
2.5. Evacuation Performance Metrics
To quantitatively evaluate the emergency response performance of different layouts, the following three core evaluation dimensions are established [
33]:
Evacuation Efficiency: Refers to the time required to complete the evacuation of all personnel (total evacuation time) and the trend of personnel numbers over time during the evacuation process, used to measure overall response speed and rhythm stability.
Area Density Distribution: Utilizes heatmaps generated by the AnyLogic platform to reflect personnel density per unit area, identify potential congestion hotspots, and assess the load capacity of passageways and exits.
Detour Distance and Fairness: Calculates the deviation between an individual’s actual walking path and the theoretical shortest path and evaluates the impact of spatial layouts on passage efficiency and individual fairness by analyzing the average detour distance, standard deviation, and coefficient of variation.
3. Results
To reflect inter-individual heterogeneity in indoor evacuation, student–agent attributes were specified using distribution functions in AnyLogic, including uniform (1.5, 2.5) for initial walking speed, uniform (0.5, 1.5) for comfortable speed, uniform (0.312, 0.416) for body diameter, and a reaction-delay time defined by triangular (10, 12.5, 15). To ensure a fair and fully reproducible comparison across layout scenarios, the experiment was executed with a fixed seed [
34]. In addition, agents were injected in an identical order at the start of each run, which means that the sequence of random draws from these distributions is reproduced exactly. Therefore, repeated runs of the same scenario will produce the same proxy attribute implementations and the same evacuation times and detour distances. Subsequent results discussions will only analyze and compare fixed-seed runs for each scenario; performance differences are attributed to layout rather than randomness between runs.
It should be noted that the fixed-seed protocol prioritizes deterministic reproducibility and strict comparability by holding the stochastic realization constant, but it does not directly quantify variability across alternative random realizations. Therefore, five replicate experiments were added to each layout using random seeds for supplementary analysis. Determinism, repeatability, and the authenticity of the randomness were weighed by evaluating data such as variance. The resulting dispersion is summarized in
Table 5. Overall, the variability was modest, and the relative comparisons were generally stable across seeds.
3.1. Evacuation Time Analysis
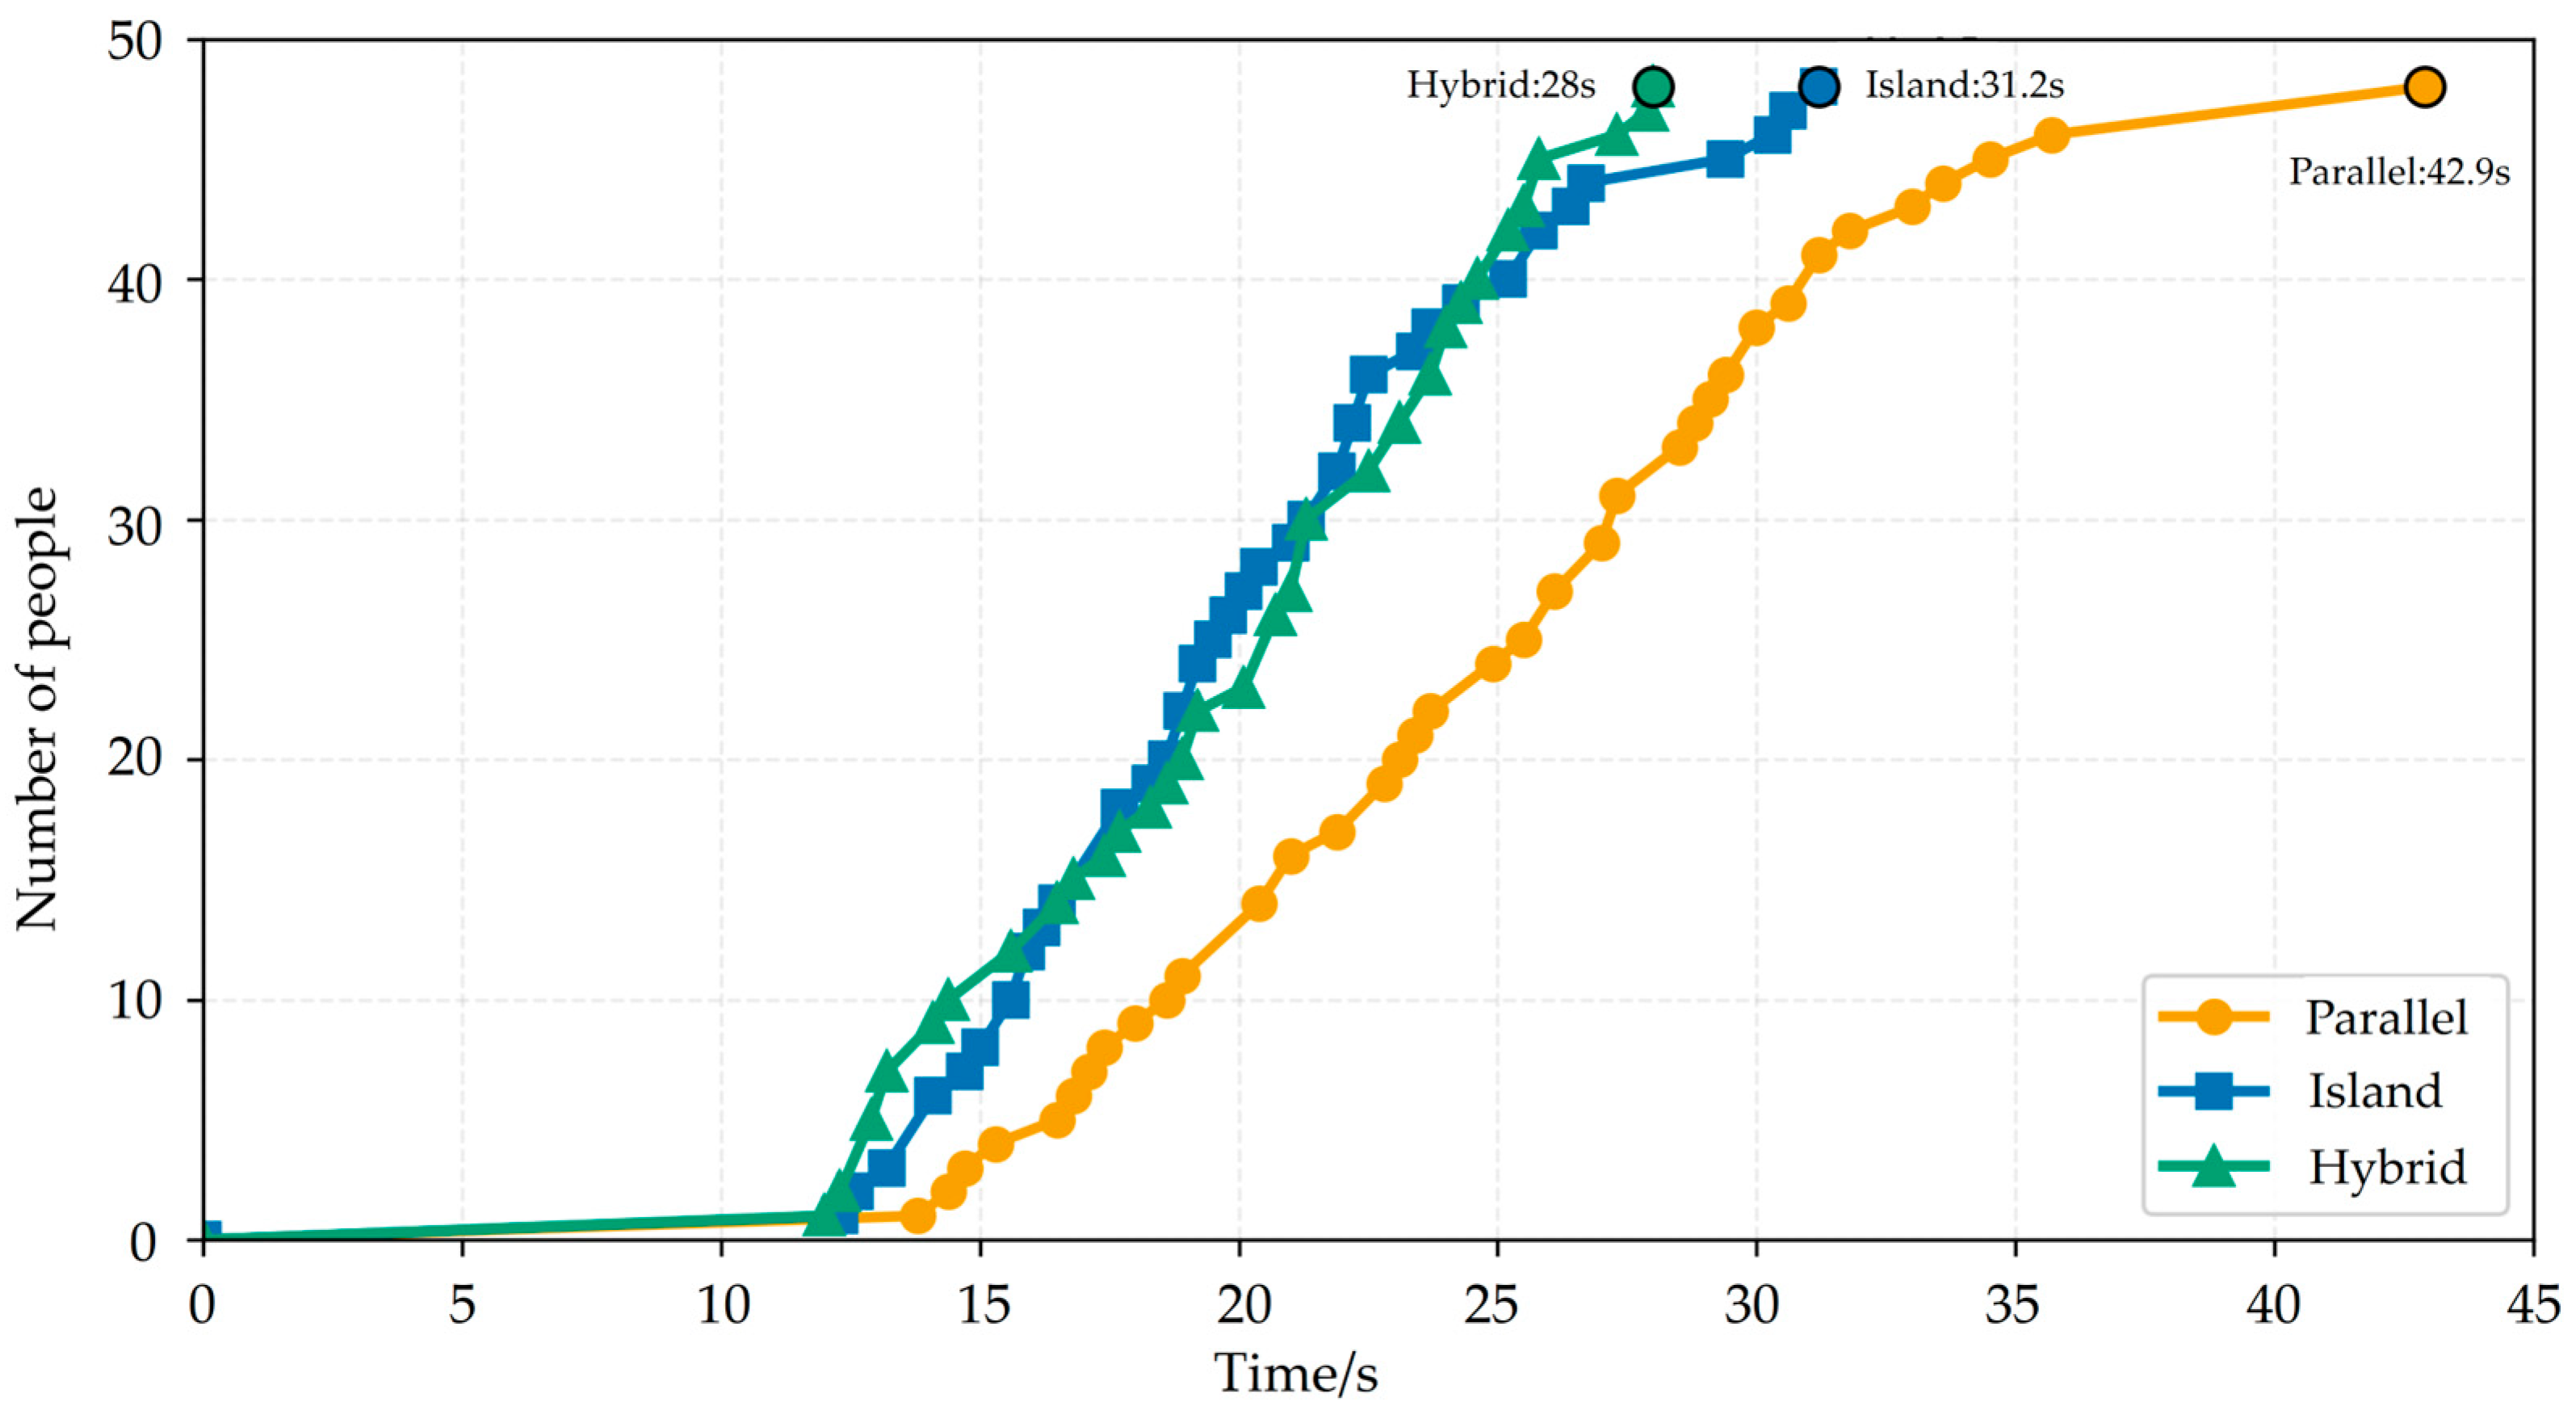
Figure 5 illustrates the evacuation curves for the three laboratory layout types, showing the cumulative number of evacuees over time. The hybrid layout achieved the fastest complete evacuation, clearing all 48 agents within 28.0 s, with an average evacuation rate of 1.71 persons per second. In comparison, the island layout required 31.2 s (1.54 persons/s), while the parallel layout took the longest at 42.9 s (1.12 persons/s). The hybrid configuration reduced total evacuation time by 10.3% compared to the island layout and by 34.7% compared to the parallel layout.
The population–time curve for the hybrid layout demonstrated an almost linear increase, indicating balanced flow, low bottleneck effects, and efficient use of multiple exits. The island layout showed higher early-stage efficiency but experienced noticeable congestion in later stages, suggesting a localized bottleneck near exits. The parallel layout displayed the slowest initial response and a steady but delayed progression, likely due to limited routing options and inefficient linear aisle arrangements.
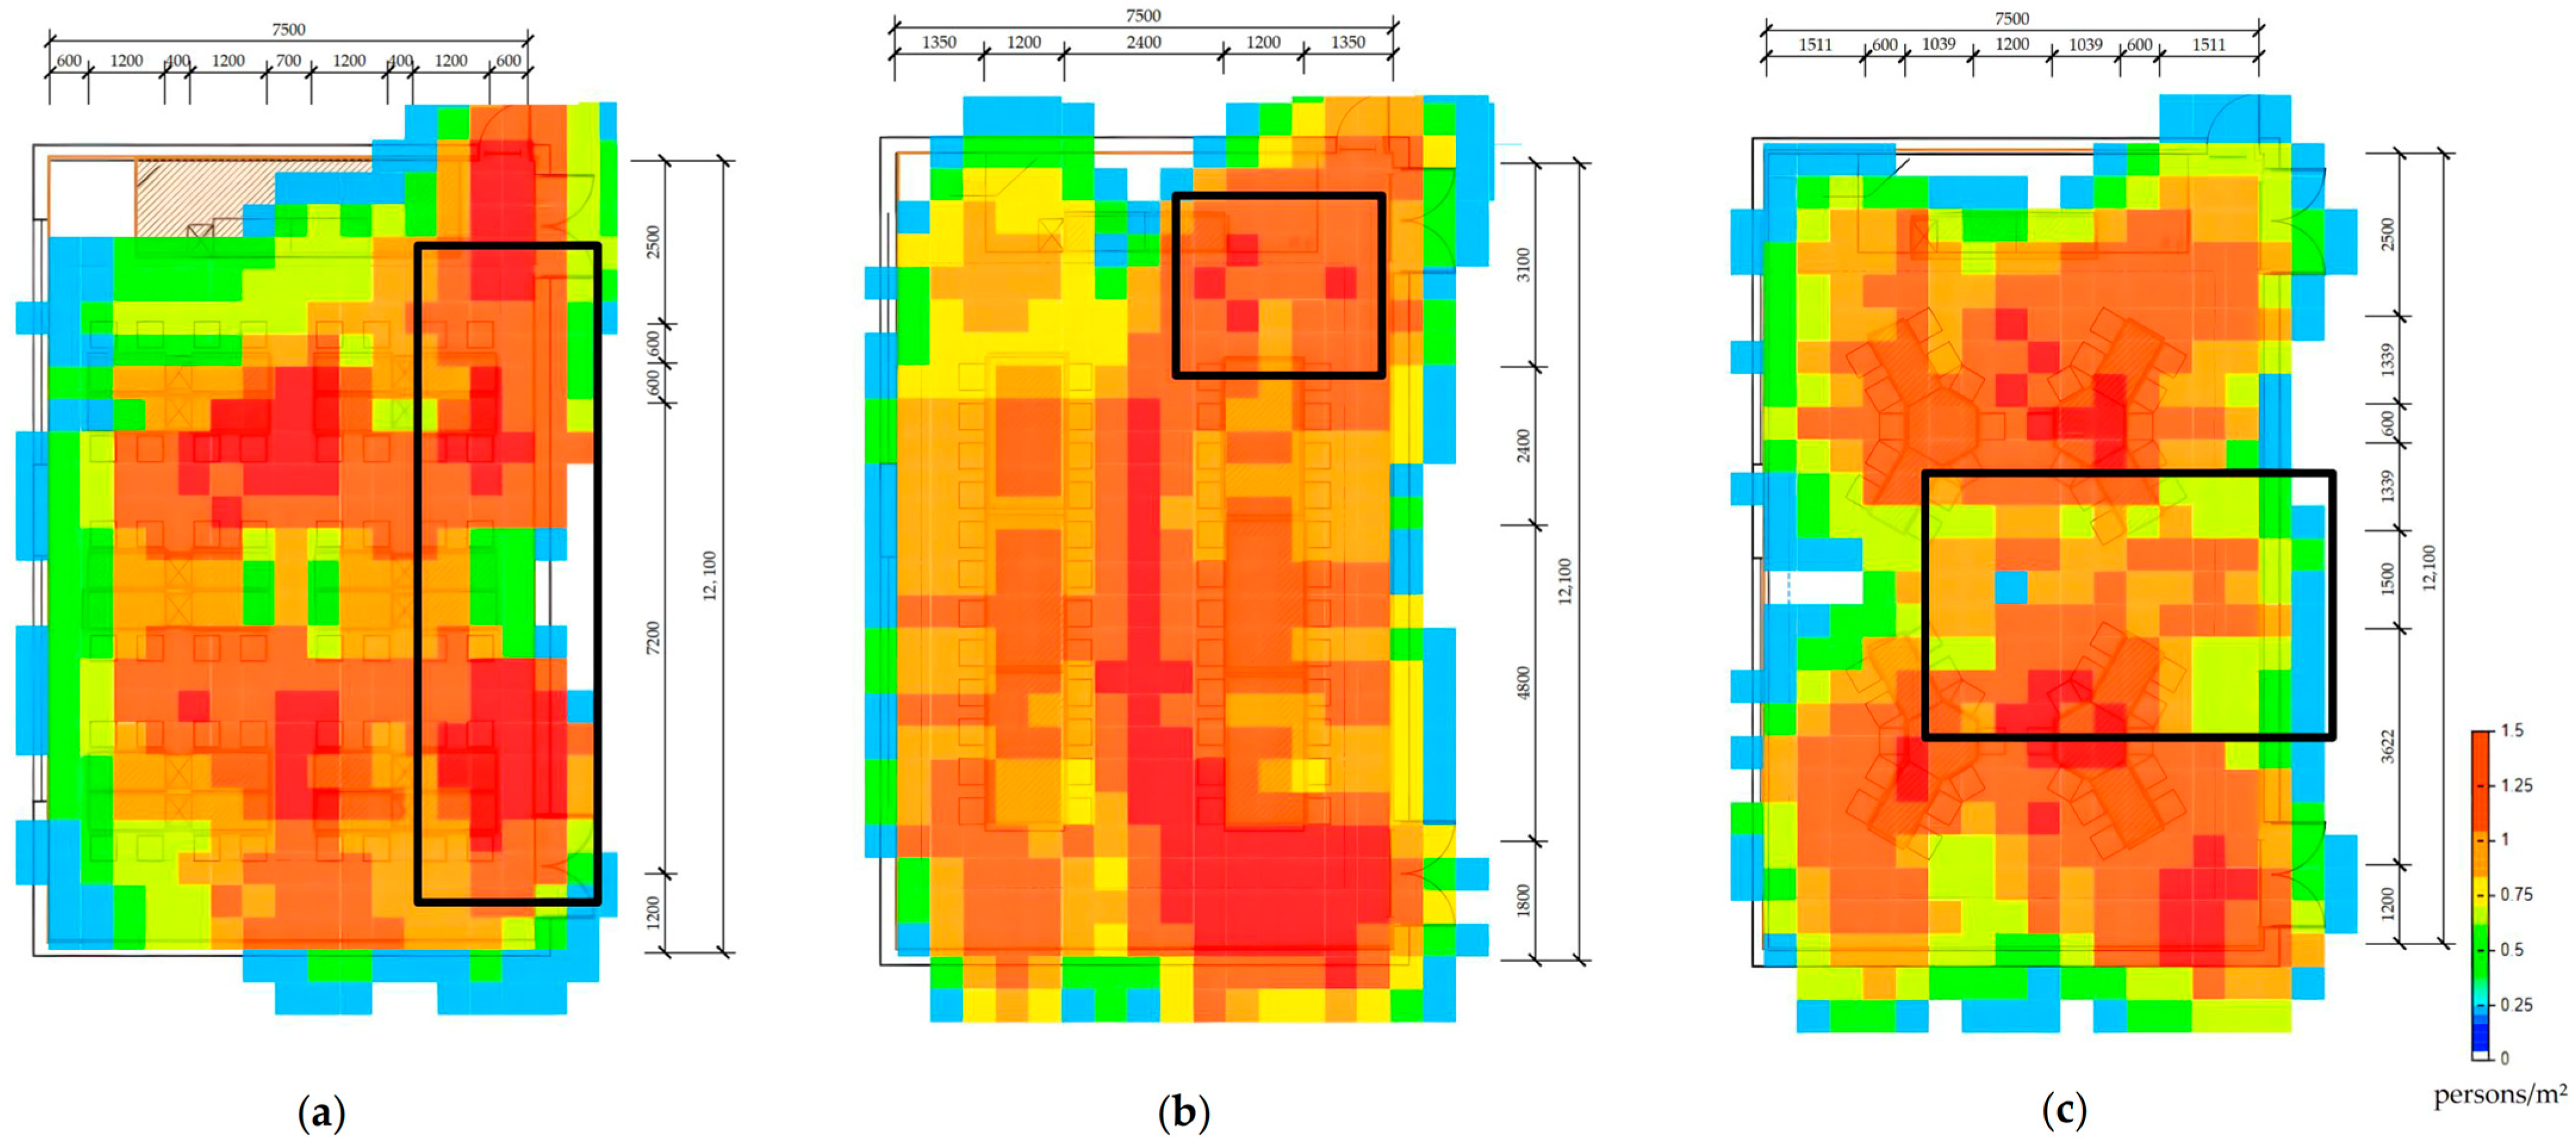
3.2. Density Mapping and Congestion Zones
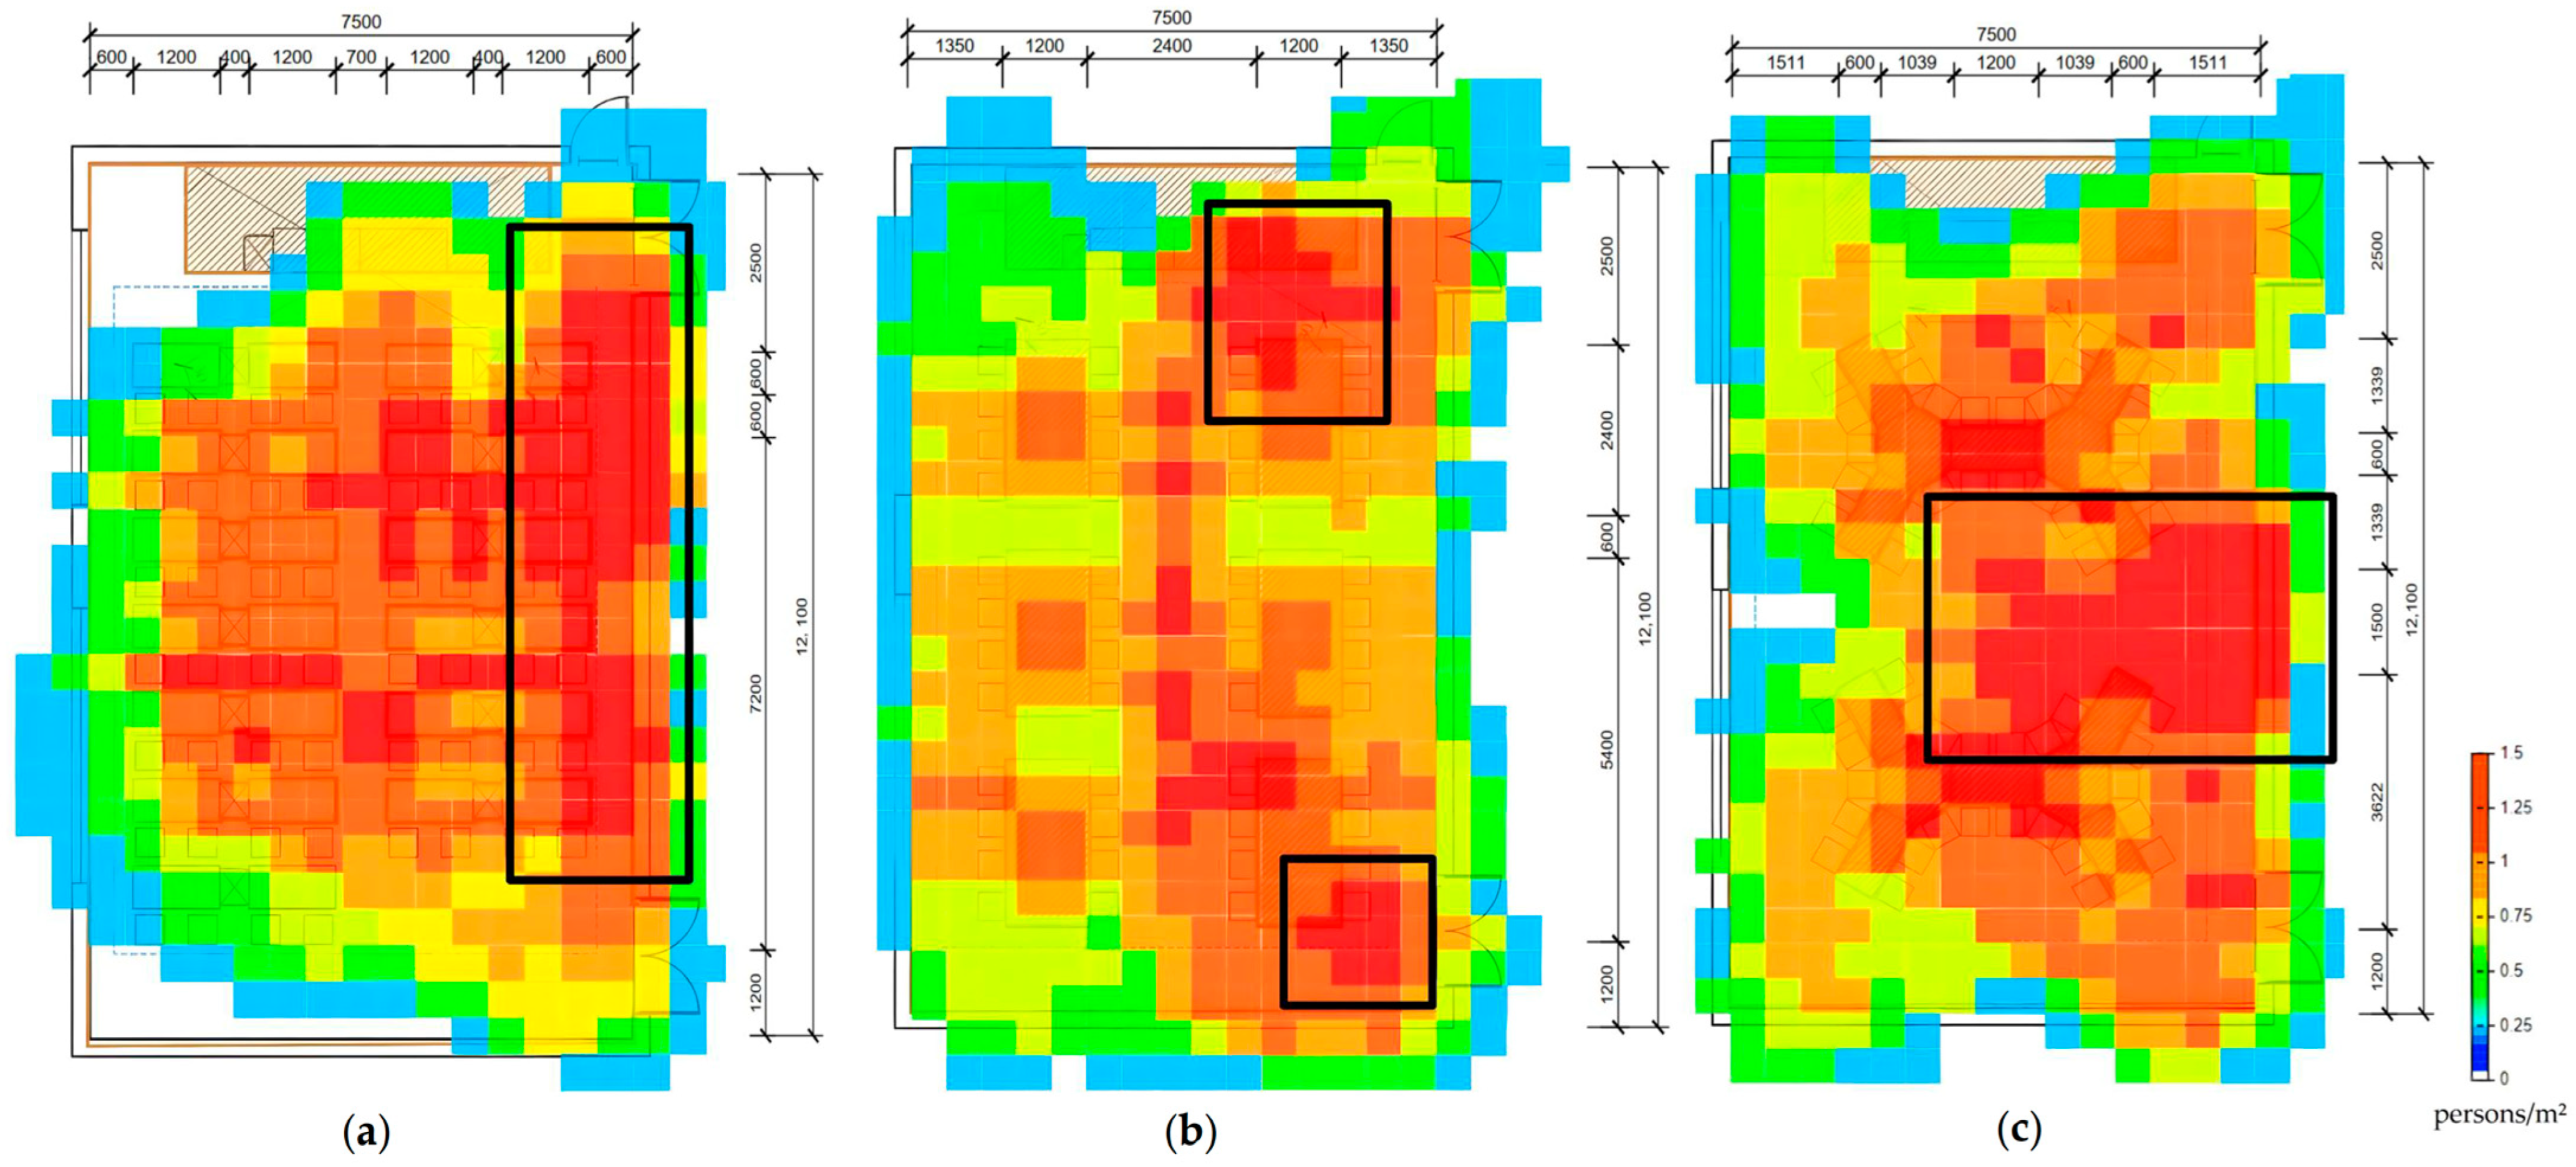
Figure 6 shows the heat map of the personnel density of the three layouts. Darker areas indicate higher congestion levels. The wireframe area is a high-density area. Density analysis revealed that the parallel layout suffered from concentrated crowding along right-side aisles and the front exit due to limited exit access and lack of cross-aisle flow. Although the island layout featured multiple paths, students predominantly funneled toward central corridors, and the remoteness of some island tables exacerbated intersection congestion. The hybrid layout exhibited more dispersed density distributions, with the main bottleneck located at the central convergence point. Its radial multi-path structure effectively diverted flow, reducing pressure on exits and improving adaptability and safety.
3.3. Detour Distance Distribution and Flow Equity
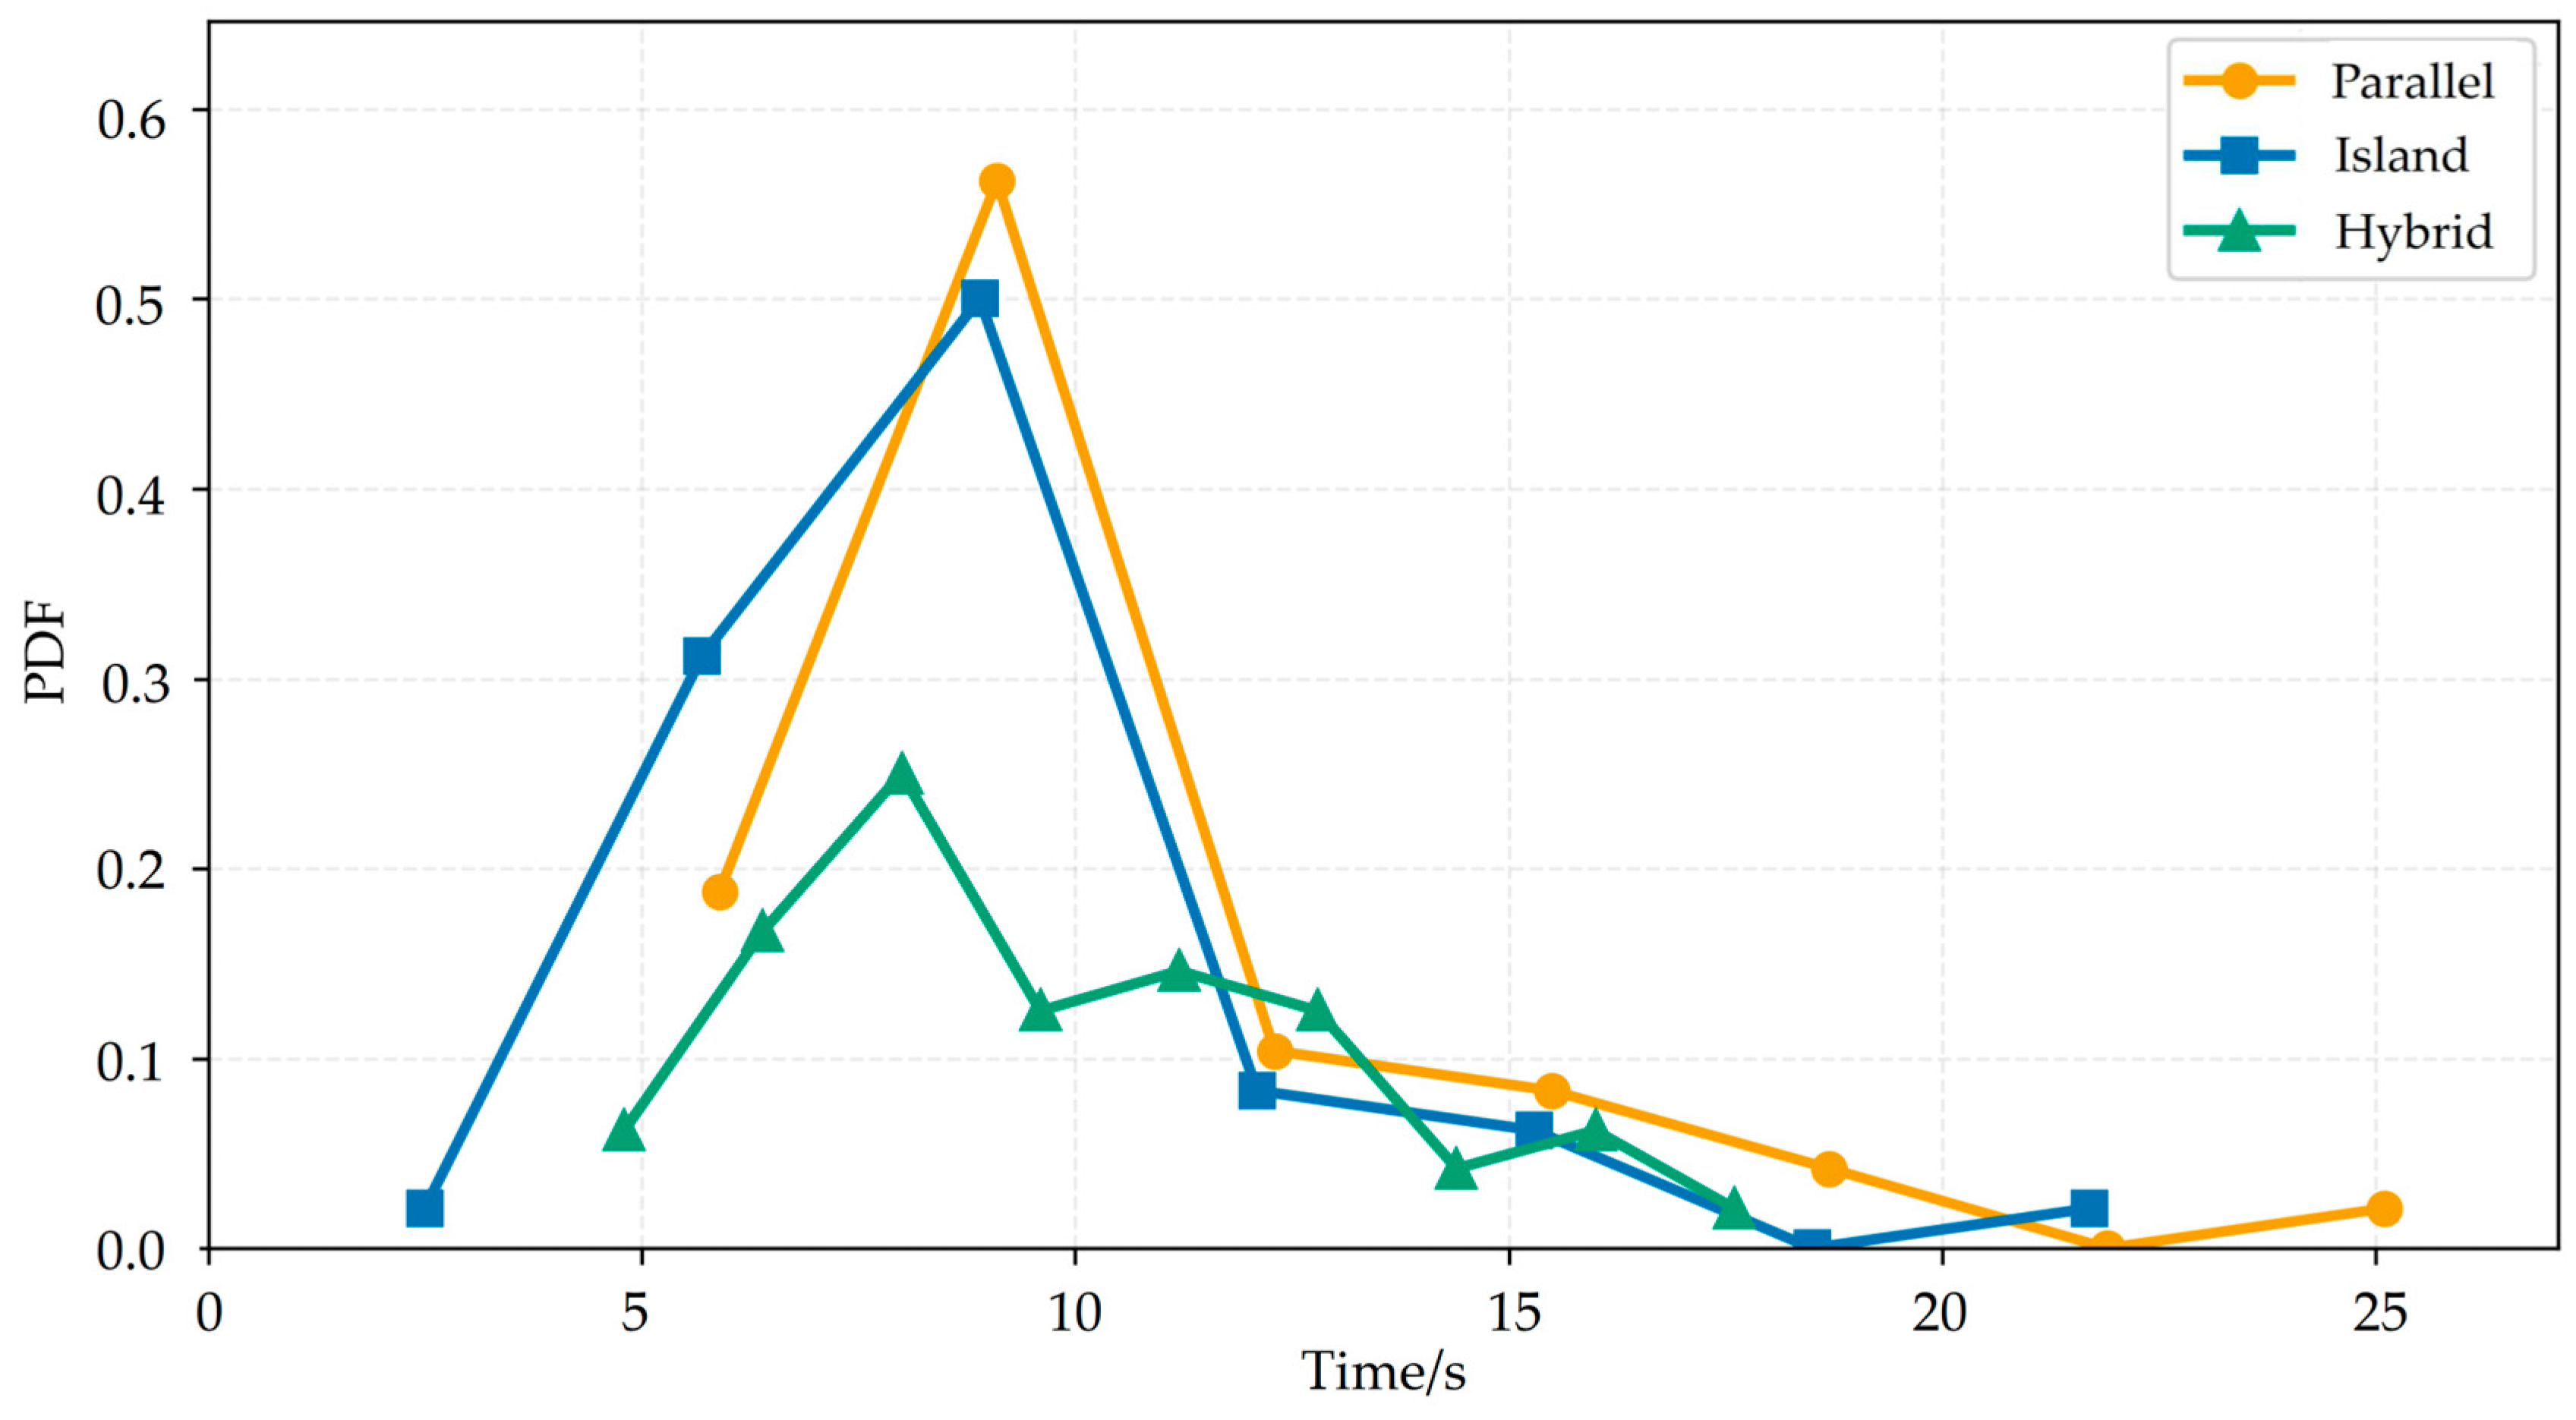
Figure 7 shows the probability density functions of detour distances across the three layouts. To evaluate both efficiency and equity in path distribution, three indicators were introduced, as explained below.
Average Detour Distance (
): This metric reflects the overall efficiency of evacuation paths, calculated as the weighted average of detour distances across all intervals.
where
- ∗
is the center value of interval ;
- ∗
is the probability density for interval ;
- ∗
is the total number of intervals.
Standard Deviation (
): This indicator captures the variability of detour distances, measuring the degree of dispersion from the mean.
where
- ∗
is the average detour distance as defined above;
- ∗
Other terms are as previously defined.
Coefficient of Variation (
CV): The
CV provides a normalized measure of dispersion, enabling comparison across layouts with different mean detour distances.
A lower CV indicates a more equitable path distribution, while a higher CV suggests increased variability and potential spatial inequality in evacuation routes.
Table 6 summarizes the comparative metrics. The island layout achieved the shortest average detour distance (8.61 m), outperforming the hybrid (9.78 m) and parallel (9.98 m) layouts. However, it shared the highest
CV value (0.38) with the parallel layout, indicating uneven flow. The hybrid layout demonstrated balanced performance, combining relatively short detours (9.78 m) with the lowest SD (3.20 m) and lowest
CV (0.33), thus offering the best trade-off between efficiency and equity.
3.4. Optimization Strategies and Validation
Drawing from the simulation results, three layout-specific optimization strategies were proposed and tested through simulation:
For parallel layouts, high-density areas are concentrated near the right-side passage and exits. Since longitudinal passages cannot be widened, it is recommended to increase the number and width of transverse evacuation routes. This can be achieved by adjusting some tables and chairs from a “two-person-one-side” arrangement to a “four-person-two-side” arrangement, creating multiple transverse passages with a width ≥ 90 cm. Simultaneously, evacuation buffer zones should be reserved in the front and rear exit areas to reduce the bottleneck risk caused by crowding at the exits [
35].
In island layouts, the main problem is the narrow passages between islands, leading to concentrated evacuation towards the front exit and severe congestion on the right side. This can be addressed by merging islands and eliminating the existing 0.6 m narrow passages to widen the front and rear longitudinal passages, enhancing traffic flow and reducing upstream congestion and localized bottlenecks caused by single-row passages [
36].
Regarding the high-density problem in the central and right-side intersection area of hybrid layouts, removing some tables and chairs in the central area can create a continuous longitudinal main passage to alleviate the intersection bottleneck and improve diversion efficiency. This strategy not only optimizes evacuation routes but also enhances teachers’ ability to observe and guide the entire class’s evacuation process, taking into account both daily teaching and emergency response needs.
The optimized layout based on the above suggestions is shown in
Figure 8.
Figure 9 shows the optimized layout and the simulated density heatmap. As can be seen from the figure, the previously high-density areas circled in the wireframe have been significantly improved, but a large area of high density has reappeared in the back door area of the island layout, providing direction for future research.
For the optimized layouts, five independent simulation runs were conducted to assess numerical robustness. The relevant data is shown in
Table 7. Overall, the observed variances are modest, indicating stable evacuation performance under repeated simulations.
Table 8 compares pre- and post-optimization evacuation times and average detour distances. The parallel layout saw the most significant improvement, reducing evacuation time by 17.5% and detour distance by nearly 2 m. The island layout improved moderately (time reduced by 9.6%), while the hybrid layout further enhanced its already strong performance with a 1.4 m reduction in detour distance and greater path centralization. Overall, the strategies proved effective in enhancing evacuation performance, particularly for linearly constrained layouts.
4. Discussion
4.1. Applicability of AnyLogic Modeling in Middle School Teaching Spaces
This study is the first to introduce the AnyLogic platform into the furniture layout and evacuation analysis of a middle school physics, chemistry, and biology laboratory. Through multi-agent simulation, it visualizes individual behavior, spatial movement, and group evacuation processes. Compared to traditional two-dimensional diagrams and static evaluation methods, AnyLogic modeling not only possesses high spatial reconstruction accuracy but also dynamically presents key characteristics such as density changes, path evolution, and bottleneck formation during personnel flow, significantly enhancing the analytical depth and empirical capabilities of middle school teaching space research [
37]. During the modeling process, the platform performed well in setting behavioral parameters, constructing logical flows, and ensuring consistency in output data, guaranteeing the stability and interpretability of the simulation results. The results further validate the practicality of this modeling method in identifying spatial movement characteristics, comparing layout efficiency, and assisting in evacuation strategy formulation, demonstrating the feasibility and promotional value of applying the AnyLogic platform in the safety design and layout optimization of educational spaces.
4.2. The Architectural Significance of Differences in Laboratory Layouts
A systematic comparison of three typical laboratory layouts—parallel, island, and hybrid—revealed that laboratory furniture systems not only serve a teaching function but also directly impact evacuation efficiency. Differences in their spatial structure alter effective passageway width, path connectivity, congestion point range, and pedestrian flow distribution mechanisms, thus affecting emergency evacuation performance and spatial operational safety. Specific findings are as follows:
Parallel layouts are characterized by clear passageway structures and open views. From a building evacuation performance perspective, the linear passageway structure of this layout restricts evacuation routes, resulting in lower freedom of path selection. Once queues form at the main passageway or exit, congestion spreads inward along the passageway, leading to a rapid increase in local density and significantly prolonging the total evacuation time. Therefore, in safety design, parallel layouts rely more heavily on the continuous effective width of the main passageway, the size of the buffer zone before exits, and the setting of diversion nodes to reduce bottleneck risks.
Island layouts have more complex passageways and more intersections, resulting in higher local connectivity. However, the increased conflicts at intersections and turning points make them prone to localized and short-term congestion at intersections, narrow passageways, and island boundaries. Evacuation efficiency is more sensitive to path guidance and traffic continuity. Therefore, island layouts should control intersection density, ensure the continuous width of main evacuation routes, and reduce conflict losses through clear evacuation guidance in spatial design.
Hybrid layouts combine openness and flexibility. Their multi-channel design improves spatial accessibility and diversion capacity in emergency situations, offering significant safety advantages. This allows people to disperse more fully in emergency situations, avoiding single bottlenecks and demonstrating superior overall safety performance. However, multi-channel structures also require more refined spatial guidance and operational management; otherwise, multiple paths may evolve into multiple conflicts. Therefore, this integrated layout is more suitable for fine-tuning under performance-based assessment support to achieve comprehensive optimization of safety and spatial efficiency.
The impact of laboratory layouts on emergency evacuation efficiency is reflected not only in total evacuation time but also in safety performance dimensions such as peak density, congestion duration, and distribution of key risk points [
38]. Therefore, layout selection should not be based solely on teaching preferences or furniture arrangement experience, but should achieve synergistic optimization between safety, flexibility, and teaching effectiveness through performance-based simulation evaluation, while meeting the requirements of daily teaching.
4.3. Limitations and Areas for Improvement
Although this study revealed the impact mechanism of layout differences on evacuation performance through simulation analysis, the following limitations remain, requiring further improvement in engineering applicability to the building sector in future research:
Relatively simplistic assumptions about behavioral parameters: the current model fails to consider panic behavior and herding effects; it also lacks teacher guidance as a dynamic factor influencing flow.
Overly idealistic control of environmental factors: The control of environmental factors is overly simplified. The model does not incorporate dynamic obstacles such as experimental equipment, power lines, and overturned furniture, potentially underestimating the complexity of real-world evacuation processes.
Limited simulation sample: Only one instance was tested for each layout type, and only fixed area and number of students were selected, failing to cover adaptive analysis under different capacity conditions, such as small classes, large classes, or flexible spaces.
Parameter processing and model validation: The parameter values are based on reasonable ranges reported in existing evacuation behavior literature to support comparative analysis between different layout schemes, but no quantitative benchmarking validation is performed for specific evacuation drills or real events.
Lack of quantitative characterization of the minimum adjustment range: Without stepwise parametric scan analysis of individual design variables, it is impossible to clearly define the minimum design adjustment range required to achieve a significant improvement in evacuation performance.
Future work should enhance behavioral and environmental realism and broaden scenario coverage.
Richer behavioral mechanisms could be incorporated, including panic escalation and herding influence, as well as teacher guidance represented as dynamic agents influencing flow organization.
The indoor laboratory environment could be modeled with time-varying obstacles and clutter to reflect disruptions commonly observed in real evacuations.
The robustness of the model can be improved by evaluating multiple geometric implementation schemes in each layout type and analyzing them for different regions and class sizes, thereby extending the applicability of the research results beyond a single fixed scenario.
By combining school evacuation drills, video trajectory data, or on-site observation data, key behavioral parameters are further calibrated, and the system model is validated through quantitative indicators.
A more systematic framework for parameter perturbation and sensitivity analysis could be introduced, systematically evaluating the impact of stepwise adjustments on evacuation time, congestion levels, and route distribution by adjusting key design parameters.
It should be further noted that the evacuation design of secondary school laboratories is also constrained by dedicated facilities such as fume hoods, safety showers, and eyewash stations, which typically have fixed locations and safety distance requirements. Although this paper does not explicitly model these facilities, they can be implemented in AnyLogic by setting them as impassable static obstacles or functional nodes with safety buffer zones. Introducing such constraints may further limit the available evacuation space and local passage width, thus quantitatively affecting the extent to which layout optimization improves evacuation time. However, the core mechanisms targeted by the optimization strategy, such as bottleneck reduction and path dispersion, remain applicable. Future research will incorporate laboratory specifications to explicitly model these dedicated facilities in order to systematically evaluate the feasibility and performance benefits of the optimization scheme under real design constraints.
5. Conclusions
This study used AnyLogic software to evaluate and optimize the layout of middle school laboratories based on pedestrian evacuation behavior simulation. Under uniform building conditions, the emergency evacuation performance of three typical middle school laboratory furniture layouts (parallel, island, and hybrid) was assessed. The model integrated multiple behavioral parameters, and comparative analysis was conducted using total evacuation time, spatial density distribution, and fairness of detour distance as core indicators. The results show that furniture configuration has a significant impact on emergency evacuation routes. The hybrid layout performed best overall, with a total evacuation time of only 28.0 s, a more balanced pedestrian flow distribution, and the lowest variability in detour distance (CV = 0.33). In contrast, the parallel layout tended to create persistent bottlenecks in the single linear main passage and the area before exits, while the island layout caused local congestion at key nodes where multiple paths intersect. This indicates that the laboratory furniture system is not only a teaching facility but also a key spatial boundary condition affecting the indoor traffic safety performance of educational buildings.
Based on the above mechanism identification, this study further proposed and verified targeted optimization measures for building space, including widening the main passage, rearranging laboratory bench clusters, and setting up buffer zones before exits. Simulation results show that such planar adjustments can bring significant safety performance benefits, with the parallel layout showing the most significant improvement: the total evacuation time is reduced by 17.5%, and detour distance is reduced by nearly 20%. This result has clear architectural implications: in the renovation of existing campus buildings, evacuation capacity and safety redundancy can be effectively improved by optimizing indoor passageway organization and furniture boundaries, without relying on large-scale structural modifications.
Overall, this study demonstrates the value of combining behavioral modeling with interior space planning, providing a quantifiable and reproducible performance evaluation path and implementable planar optimization strategies for educational building laboratories. Future research can further incorporate richer behavioral heterogeneity (such as conformity, panic, and differences in teacher guidance) and realistic constraints (dynamic obstacles, door opening impacts, equipment and pipeline occupancy, etc.) to enhance the model’s applicability to different school conditions and multi-scenario emergency situations, and provide stronger data support for relevant educational building codes and laboratory construction standards.
Author Contributions
Conceptualization, X.L.; methodology, X.L.; software, X.L.; validation, X.L.; formal analysis, X.L.; investigation, X.L.; resources, X.L.; data curation, X.L.; writing—original draft preparation, X.L.; writing—review and editing, Y.C. and X.L.; visualization, X.L.; supervision, Y.C. All authors have read and agreed to the published version of the manuscript.
Funding
This research received no external funding.
Institutional Review Board Statement
Not applicable.
Informed Consent Statement
Not applicable.
Data Availability Statement
Data are contained within the article.
Conflicts of Interest
The authors declare no conflicts of interest.
References
- Richards-Babb, M.; Bishoff, J.; Carver, J.S.; Fisher, K.; Robertson-Honecker, J. Keeping it safe: Chemical safety in the high school laboratory. J. Chem. Health Saf. 2010, 17, 6–14. [Google Scholar] [CrossRef] [Scilit]
- León, J.; Catalán, P.A.; Gubler, A. Assessment of Top-Down Design of Tsunami Evacuation Strategies Based on Drill and Modelled Data. Front. Earth Sci. 2021, 9, 744193. [Google Scholar] [CrossRef] [Scilit]
- Espinosa Andrade, A.; Padilla, L.; Carrington, S.J. Educational spaces: The relation between school infrastructure and learning outcomes. Heliyon 2024, 10, e38361. [Google Scholar] [CrossRef] [Scilit]
- Saha, A.K.; Jahin, M.A.; Rafiquzzaman, M.; Mridha, M.F. Ergonomic design of computer laboratory furniture: Mismatch analysis utilizing anthropometric data of university students. Heliyon 2024, 10, e34063. [Google Scholar] [CrossRef] [Scilit]
- Dianat, I.; Karimi, M.A.; Asl Hashemi, A.; Bahrampour, S. Classroom furniture and anthropometric characteristics of Iranian high school students: Proposed dimensions based on anthropometric data. Appl. Ergon. 2013, 44, 101–108. [Google Scholar] [CrossRef] [Scilit]
- Dziabenko, O.; Budnyk, O. GO-LAB ecosystem: Using online laboratories in a primary school. In Proceedings of the 11th International Conference on Education and New Learning Technologies, Palma, Spain, 1–3 July 2019. [Google Scholar] [CrossRef] [Scilit]
- Mylonas, G.; Amaxilatis, D.; Pocero, L.; Markelis, I.; Hofstaetter, J.; Koulouris, P. An educational IoT lab kit and tools for energy awareness in European schools. Int. J. Child-Comput. Interact. 2019, 20, 43–53. [Google Scholar] [CrossRef] [Scilit]
- Zhou, Y.; Zhao, Q. Simulation Study on Age-Friendly Design of Community Park Activity Spaces Based on AnyLogic: A Case Study of Qiaokou Park in Wuhan. Buildings 2025, 15, 3419. [Google Scholar] [CrossRef] [Scilit]
- Qin, J.; Liu, C.; Huang, Q. Simulation on fire emergency evacuation in special subway station based on Pathfinder. Case Stud. Therm. Eng. 2020, 21, 100677. [Google Scholar] [CrossRef] [Scilit]
- Muramatsu, M.; Irie, T.; Nagatani, T. Jamming transition in pedestrian counter flow. Phys. A Stat. Mech. Its Appl. 1999, 267, 487–498. [Google Scholar] [CrossRef] [Scilit]
- Lim, H.; Lee, H.; Hwang, J. Multi-Agent Simulation on Staff Evacuation Behavior in Elderly Nursing Home Fire Emergencies. Buildings 2023, 13, 400. [Google Scholar] [CrossRef] [Scilit]
- Elsayed, P.; Mostafa, H.; Marzouk, M. BIM based framework for building evacuation using Bluetooth Low Energy and crowd simulation. J. Build. Eng. 2023, 70, 106409. [Google Scholar] [CrossRef] [Scilit]
- Gao, S.; Chang, C.; Liu, Q.; Zhang, M.; Yu, F. Study on the optimization for emergency evacuation scheme under fire in university building complex. Heliyon 2023, 9, e14277. [Google Scholar] [CrossRef] [Scilit]
- Mandal, T.; Rao, K.R.; Tiwari, G. Study of exit choice behaviour in metro station using partial immersive virtual reality. IATSS Res. 2022, 46, 290–296. [Google Scholar] [CrossRef] [Scilit]
- Huang, Z.; Fan, R.; Fang, Z.; Ye, R.; Li, X.; Xu, Q.; Gao, H.; Gao, Y. Performance of occupant evacuation in a super high-rise building up to 583 m. Phys. A Stat. Mech. Its Appl. 2022, 589, 126643. [Google Scholar] [CrossRef] [Scilit]
- Lian, H.; Zhang, S.; Li, G.; Zhang, Y. Pedestrian Simulation on Evacuation Behavior in Teaching Building of Primary School Emergencies and Optimized Design. Buildings 2023, 13, 1747. [Google Scholar] [CrossRef] [Scilit]
- Der, O.; Tasci, M.; Basar, G.; Ercetin, A. Intelligent modeling and prediction of CO2 laser cutting performance in FFF-printed thermoplastics using machine learning algorithms. Proc. Inst. Mech. Eng. Part B J. Eng. Manuf. 2025, 239, 09544089251366429. [Google Scholar] [CrossRef] [Scilit]
- Chandran, N.P.; Patel, G.C.M.; Chate, G.R.; Der, O.; Selvan, C.P. Multi-input multi-output modeling of anthill clay-bonded sand mold system using artificial neural networks: Forward and reverse predictions. Eng. Rep. 2024, 7, e70224. [Google Scholar] [CrossRef] [Scilit]
- Sun, H.; Han, G.; Zhang, X.; Ruan, X. Grass emergency dynamics: A review of group evacuation techniques and strategies in major emergencies. J. Saf. Sci. Resil. 2025, 6, 1–20. [Google Scholar] [CrossRef] [Scilit]
- Tan, V.; Au, C. Simulation of herding behaviour in panic evacuation from a room with two exits. Int. J. Digit. Hum. 2016, 1, 295–304. [Google Scholar] [CrossRef] [Scilit]
- Gao, J. Emergency Evacuation Simulation of Teaching Building No. 3 Based on AnyLogic. Master’s Thesis, Shandong University of Science and Technology, Qingdao, China, 2018. (In Chinese) [Google Scholar] [CrossRef]
- Li, M.; Zhao, Y.; He, L.; Chen, W.; Xu, X. The parameter calibration and optimization of social force model for the real-life 2013 Ya’an earthquake evacuation in China. Saf. Sci. 2015, 79, 243–253. [Google Scholar] [CrossRef] [Scilit]
- Zhang, Z.; Ling, W.; Yang, Z.; Wei, X.; Wang, H. A congestion prediction model for optimizing emergency evacuation design of university libraries in China. J. Build. Eng. 2025, 99, 111537. [Google Scholar] [CrossRef] [Scilit]
- Watch, D.; Duluth, W. Building Type Basics for Research Laboratories; John Wiley & Sons: Hoboken, NJ, USA, 2001. [Google Scholar]
- GB/T 50099-2011; Design Code for Primary and Secondary Schools. China Architecture & Building Press: Beijing, China, 2011. (In Chinese)
- JY/T-0385-2006; Equipment Standards for Science Laboratories in Primary and Secondary Schools. Educational Equipment Research and Development Center, Ministry of Education of China: Beijing, China, 2006. (In Chinese)
- Sun, Y. Research on the Design of Furniture in Middle School Chemistry Laboratories. Master’s Thesis, Nanjing Forestry University, Nanjing, China, 2022. (In Chinese) [Google Scholar] [CrossRef]
- Muravev, D.; Hu, H.; Rakhmangulov, A.; Mishkurov, P. Multi-agent optimization of the intermodal terminal main parameters by using AnyLogic simulation platform: Case study on the Ningbo-Zhoushan Port. Int. J. Inf. Manage. 2021, 57, 102133. [Google Scholar] [CrossRef] [Scilit]
- GB/T 26158-2010; General Administration of Quality Supervision, Inspection and Quarantine of the People’s Republic of China. Body Dimensions of Chinese Minors. National Technical Committee for Standardization of Ergonomics of Human Work: Beijing, China, 2011. (In Chinese)
- Huang, J.-H.; Chen, C.-C. A study on evacuation speed of schoolchildren. J. Archit. 2012, 80, 71–87. (In Chinese) [Google Scholar] [CrossRef]
- Kinateder, M.T.; Kuligowski, E.D.; Reneke, P.A.; Peacock, R.D. Risk perception in fire evacuation behavior revisited: Definitions, related concepts, and empirical evidence. Fire Sci. Rev. 2015, 4, 1–26. [Google Scholar] [CrossRef] [Scilit]
- Gwynne, S.; Galea, E.R.; Parke, J.; Hickson, J. The collection of pre-evacuation times from evacuation trials involving a hospital outpatient area and a university library facility. Fire Saf. Sci. 2003, 7, 877–888. Available online: https://publications.iafss.org/publications/fss/7/877/view (accessed on 8 January 2026). [CrossRef] [Scilit]
- Zhong, G.; Zhai, G.; Chen, W. Optimization on spatial distribution of shelter through dynamic evacuation simulation of high density urban area—Xinjiekou case. KSCE J. Civ. Eng. 2022, 26, 4760–4776. [Google Scholar] [CrossRef] [Scilit]
- Chen, Y.; Dong, Y.; Deng, L. Comparison of Agent-based Simulation Platforms. J. Syst. Simul. 2011, 23, 110–116. (In Chinese) [Google Scholar] [CrossRef]
- Zuo, J.; Shi, J.; Li, C.; Mu, T.; Zeng, Y.; Dong, J. Simulation and optimization of pedestrian evacuation in high-density urban areas for effectiveness improvement. Environ. Impact Assess. Rev. 2021, 87, 106521. [Google Scholar] [CrossRef] [Scilit]
- Huang, S.; Lu, S.; Lo, S.; Li, C.; Guo, Y. Experimental study on occupant evacuation in narrow seat aisle. Phys. A 2018, 502, 506–517. [Google Scholar] [CrossRef] [Scilit]
- Pförringer, D.; Breu, M.; Crönlein, M.; Kolisch, R.; Kanz, K. Closure simulation for reduction of emergency patient diversion: A discrete agent-based simulation approach to minimizing ambulance diversion. Eur. J. Med. Res. 2018, 23, 32. [Google Scholar] [CrossRef] [Scilit]
- Wang, K.; Fu, Z.; Li, Y.; Qian, S. Influence of human–obstacle interaction on evacuation from classrooms. Autom. Constr. 2020, 116, 103234. [Google Scholar] [CrossRef] [Scilit]
| Disclaimer/Publisher’s Note: The statements, opinions and data contained in all publications are solely those of the individual author(s) and contributor(s) and not of MDPI and/or the editor(s). MDPI and/or the editor(s) disclaim responsibility for any injury to people or property resulting from any ideas, methods, instructions or products referred to in the content. |