Article

Subjectively Preferred Surface Scattering Coefficients in Performance Venues for Traditional Inner Mongolian Instruments

1
Green Building Autonomous Region Key Laboratory of Higher Education, School of Architecture, Inner Mongolia University of Technology, Hohhot 010051, China
2
Key Laboratory of Cold Region Urban and Rural Human Settlement Environment Science and Technology, Ministry of Industry and Information Technology, Harbin Institute of Technology, School of Architecture and Design, 92 Xidazhi Street, Nangang District, Harbin 150000, China
*
Author to whom correspondence should be addressed.
Buildings 2026, 16(2), 324; https://doi.org/10.3390/buildings16020324
Submission received: 19 November 2025 / Revised: 2 January 2026 / Accepted: 9 January 2026 / Published: 12 January 2026
(This article belongs to the Section Building Energy, Physics, Environment, and Systems)

Abstract

At performance venues, a well-recognized factor-shaping sound quality is surface scattering. However, how scattering coefficients relate to auditory perception remains underexplored. This study mapped surface scattering coefficients to listening preferences under numerous conditions. Specifically, it used traditional Mongolian instruments in two simulated environments: a theater-type space and a rectangular performance space. Impulse responses were generated under four scattering coefficients (0.1, 0.3, 0.6, and 0.9) and convolved with dry recordings to produce experimental audio samples. Forty-eight participants of varying musical expertise completed paired-comparison listening tests to identify preferred coefficients. The results showed that a scattering coefficient of 0.6 consistently yielded the highest preference across spatial, surface, listener, and tempo variations. Side-wall scattering had a stronger perceptual impact than ceiling scattering, and listener expertise significantly influenced preference. Non-professionals favored lower scattering values, while instrumental specialists preferred moderate-to-high diffusion. This study provides empirical evidence and design guidance for optimizing acoustic diffusion in theaters and auditoriums.

1. Introduction

Performance venues, including theaters, concert halls, and auditoriums, are purpose-built for artistic presentations. In these indoor spaces, the acoustic environment plays a major role in shaping the audience’s experience. Among the parameters used to evaluate room acoustics, reverberation time (RT) has been a fundamental metric since Sabine (1898) introduced the first objective method for its calculation [1]. However, Sabine’s formula was derived for an ideal, fully diffused sound field in which sound energy was uniformly distributed and propagated isotropically [2]. This simplified assumption rarely holds in real-world performance spaces, whose complex surface geometries and material properties produce non-uniform sound diffusion and reduce the accuracy of RT estimation [3]. When appropriately applied, diffusers systematically alter sound energy distribution and enhance perceived sound quality [4,5,6]. Recent research in performance space acoustics has focused on clarifying how surface scattering influences acoustic parameters and how these parameters relate to listener perception.
Theoretically, variations in surface geometry influence sound-scattering strength and, in turn, affect room-acoustic performance. In the domain of acoustic research, the concepts of scattering and diffusion, while related, are distinct physical phenomena. The term “scattering” specifically denotes the spatial redistribution property whereby incident energy at a single interface is reallocated away from the specular reflection direction. This property is typically quantified using the “scattering coefficient (s),” defined as the ratio of non-specular reflected energy to total reflected energy [7]. Meanwhile, the term ‘diffusion’ describes the uniformity of reflected sound energy distribution within a given space. Its assessment does not exclude components of specular reflection and is commonly characterized by the ‘diffusion coefficient (range 0–1),’ with higher values indicating superior spatial diffusion performance. An interface’s scattering capability is primarily determined by its surface geometry (e.g., undulations, texture). Consequently, the present study investigates the impact of variations in scattering coefficients on the listener’s subjective perception [8]. In room acoustics, the scattering coefficient (s), calculated as the ratio of diffusely reflected energy to total reflected energy, is commonly used to characterize surface-scattering performance [9,10]. Extensive research has examined how scattering coefficients influence acoustic parameters. Ryu et al. demonstrated, through scale-model experiments, that introducing diffusers decreased sound pressure level (SPL) by approximately 1 dB on average, with more pronounced reductions in rear seating and areas near the diffusers [11]. Similarly, Suzumura et al. showed that adding cylindrical diffusers to stage and side-wall surfaces reduced interaural cross-correlation (IACC), enhancing spatial impression [12].
Using a 1:10 scale concert hall model, Kim et al. observed that increasing side-wall scattering led to reduced RT, with modifications to audience area side walls producing a greater effect than modifications to stage area walls [13,14]. Jeon et al. further found that installing diffusers on side walls and beneath balconies increased clarity (C80) at the front of the orchestra seating area while reducing C80 at the rear. They further observed that RT decreased substantially when diffusers covered a larger area, were more numerous, and were positioned closer to receivers. Although scattering may produce modest changes in objective acoustic metrics, subjective evaluations become more favorable, particularly when diffusion is added to side walls and ceilings [15,16]. Wang’s scale model results indicated that variations in early decay time (EDT) depended on diffuser placement and receiver position [17], and related studies showed decreases in sound strength (G) when diffusers were incorporated [16].
With advances in computational acoustic modeling, scattering coefficients have increasingly been incorporated into simulations, substantially improving prediction accuracy. Simultaneously, these modeling techniques have provided new approaches for examining how scattering affects sound quality [18,19,20,21]. Kang demonstrated that, in elongated spaces, greater scattering was associated with increasing T30 as source-receiver distance increased, while EDT initially increased and then decreased [22,23]. Using three acoustic-simulation platforms to model a fan-shaped hall, Shtrepi et al. observed that EDT increased in proportion to surface-scattering values of the ceilings and walls [24,25].
In the acoustic design of performance spaces, a critical step is understanding how objective acoustic parameters relate to subjective listening experience. To examine how variations in acoustic parameters affect subjective perception, researchers conduct controlled listening tests in which participants evaluate auditory samples. From an acoustic design perspective, subjective auditory judgments should correlate with objective parameters and fall within certain optimal ranges. Santika et al. employed computer simulation and subjective surveys to comprehensively evaluate the acoustic properties of the Gugak Hall, a venue for traditional Korean music, examining reverberation, clarity, spatial impression, and audience preference [26]. Yang identified an optimal RT range of 0.2–0.6 s and a preferred loudness level of 70–73 dB for Peking Opera halls through a subjective preference listening test, in which clarity, richness, and brilliance were the most valued perceptual attributes by the audience [27]. Xu et al. used virtual reality simulation and subjective evaluation to study how musical tempo influences visitor dwell time in exhibition spaces. Their findings showed that visitors stayed approximately 30 s longer when slow-tempo music was played, with tempo exerting greater influence in crowded conditions and serving as the dominant factor [28]. These studies reveal contextual differences in audience preferences for acoustic parameters and offer valuable insight into subjective listening preferences. Nevertheless, the role of surface scattering in shaping objective acoustic parameters and, in turn, influencing subjective perception, has been less explored.
In recent years, subjective listening tests have been extensively applied in spatial audio research. Numerous studies have employed higher-order ambisonics systems to evaluate listeners’ perceptions of sound field diffusion, directional accuracy, and the degree of immersion experienced within controlled listening environments. Pawlak et al. provided a comprehensive evaluation of the performance of spatial decomposition methods (SDMs), binaural SDM, and higher-order Ambisonics in audible representation within the confines of a critical listening room. They sought to identify the differences in spatial and timbral fidelity across the methods examined and explore potential pathways for optimization [29]. In a separate study, Noisternig et al. proposed a novel framework for real-time architectural acoustics audible representation. This framework employed beam tracing and higher-order ambisonics, with the objective of facilitating high-fidelity spatial audio rendering in interactive virtual reality (VR) environments [30]. McCormack et al. systematically investigated the impact of spherical harmonic order, dedicated diffusion sound fields, and frequency resolution on perceived fidelity in higher-order ambisonics using formal listening experiments [31]. The aforementioned studies provide a crucial foundation for understanding spatial auditory perception and offer valuable insights for designing subjective listening experiments.
Existing studies have focused on either how surface scattering affects objective acoustic parameters or how such parameters relate to subjective listening experience. A smaller but growing body of work evaluates how listener-to-surface distance and scattering variation influence subjective perception of sound diffusion. In a classical theater concert hall, Haan categorized surface relief depth into high, medium, and low levels and asked 35 musicians to rate the acoustics. The results indicated that scattering on walls and ceilings positively correlated with perceived acoustic quality [32,33]. Takahashi et al. found, through subjective tests, that as surface roughness increased, listeners were able to easily distinguish between specular and diffuse reflections, particularly when seated near reflective surfaces [34]. Shtrepi et al. identified a maximum perceptual distance of approximately 2.15 m between a receiver and a diffusing surface, beyond which the presence of diffusion became imperceptible [35,36]. Follow-up experiments showed that although objective acoustic parameters varied when diffusers were positioned in the front, middle, or rear zones, listeners struggled to perceive these differences [36]. In a virtual concert hall, Vitale et al. reported a just-noticeable-difference (JND) range of 0.27–0.49 s for scattering-coefficient changes. Additional listening tests conducted in the variable acoustics hall at IRCAM in Paris highlighted that changes in scattering coefficients were often imperceptible, and surfaces with different scattering values could be interchanged without affecting perceived quality [37]. Other studies using simulation-based stimulus generation suggested that scattering coefficients must vary by at least 0.4–0.5 s for listeners to detect differences [25,37,38]. Together, these findings clarify the perceptual characteristics of diffusion and define threshold ranges for perceptual sensitivity.
However, several gaps can be identified. While studies have established perceptual thresholds for diffusion, quantitative identification of optimal subjective preference values remains limited. Moreover, prior work has not examined the relative weighting of factors influencing perceptual judgments under varying scattering conditions. A systematic understanding is lacking regarding how subjective perception varies across different conditions affecting surface scattering. Hence, this study focuses on cultural and acoustic contexts in Inner Mongolia, employing traditional Mongolian musical instruments as auditory stimuli. Using subjective preference-based listening methods, it systematically examines how space type, surface type, listener group, and musical tempo influence perceptual judgments under varying scattering conditions. It conducts a comprehensive and structured analysis of influencing factors and listener preferences. Specifically, it addresses the following research questions:
  • What are the optimal subjective preference ranges for surface scattering in typical performance spaces?
  • How do variations in space type, surface type, listener group, and musical tempo influence subjective judgments under changing surface scattering conditions?
  • What are the preferred subjective ranges of scattering coefficients under different influencing factors?

2. Methods

2.1. Experimental Design

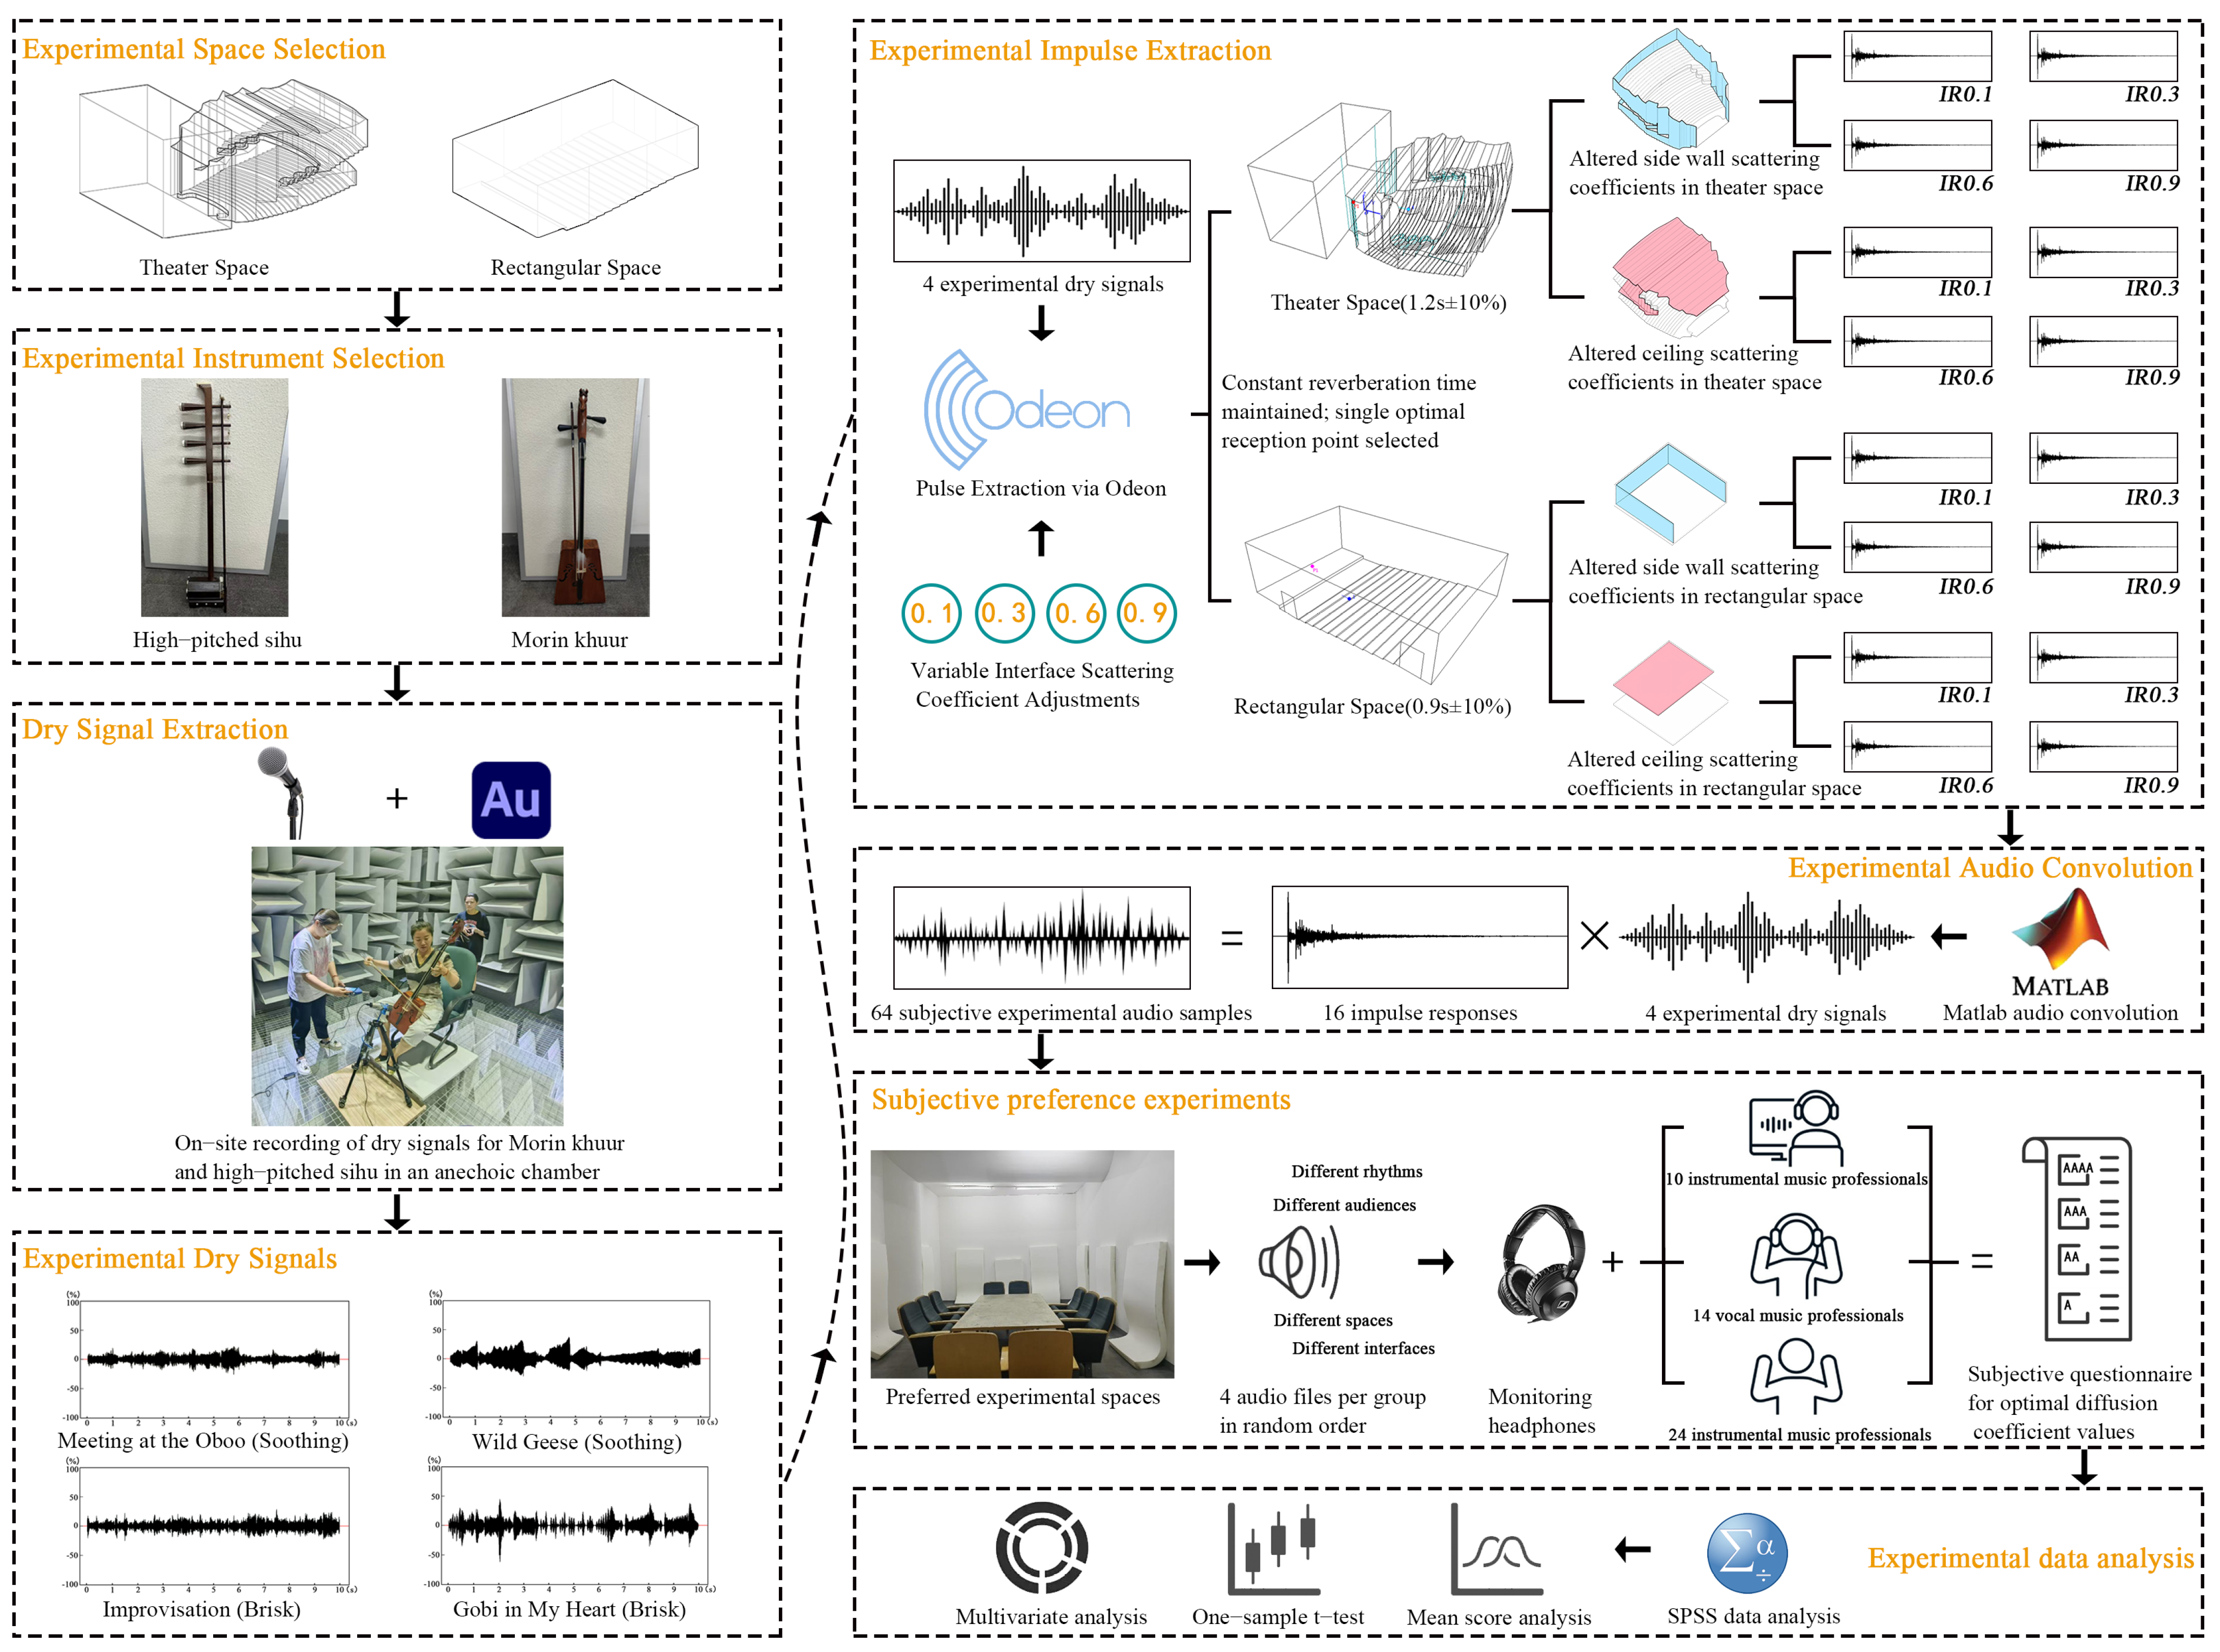
The experimental framework of this study is illustrated in Figure 1 and consists of three stages. First, acoustic simulation models were constructed in a computer environment, where the scattering coefficients of different surfaces were varied to generate impulse responses under varied acoustic conditions. Second, the simulated impulse responses were convolved with dry recordings collected from field measurements to produce experimental audio samples. Third, these audio samples were presented to participants from different demographic groups in a subjective preference listening test.

2.2. Computer Simulation

2.2.1. Model Construction

A survey and analysis of existing performance venues indicate that contemporary spaces generally fall into two morphological categories: theater-type and rectangular-type. Large-scale performance venues adopt a theater configuration, while smaller venues are often rectangular. Representative examples of four theater-type and four rectangular-type venues were analyzed (Appendix A Table A1 and Table A2). The simulated space was selected for this study on the basis of relevant literature [39]. In modern performance venues, factors such as spatial dimensions (length, width, height, and proscenium width), surface materials and geometry, and seating arrangements influence acoustic performance.
Among the four theater-type venues, Heze Theater was selected as the representative simulation model because its spatial proportions are moderate and its architectural design is typical. It has a proscenium width of 14.8 m (12 < x < 16) and a per-seat volume of 7.8 m3 (5 < x < 8), meeting design code requirements while reflecting common characteristics of contemporary theaters. Among the four rectangular-type venues, Space 2 was selected as the representative model. It has a stage width of 15.4 m (12 < x < 16) and a per-seat volume of 7.9 m3 (5 < x < 8), with balanced proportions representative of typical rectangular halls. Its design parameters—volume, geometry, and seating layout—fall within the ranges specified by relevant codes, making it an appropriate simulation model.
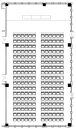
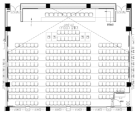
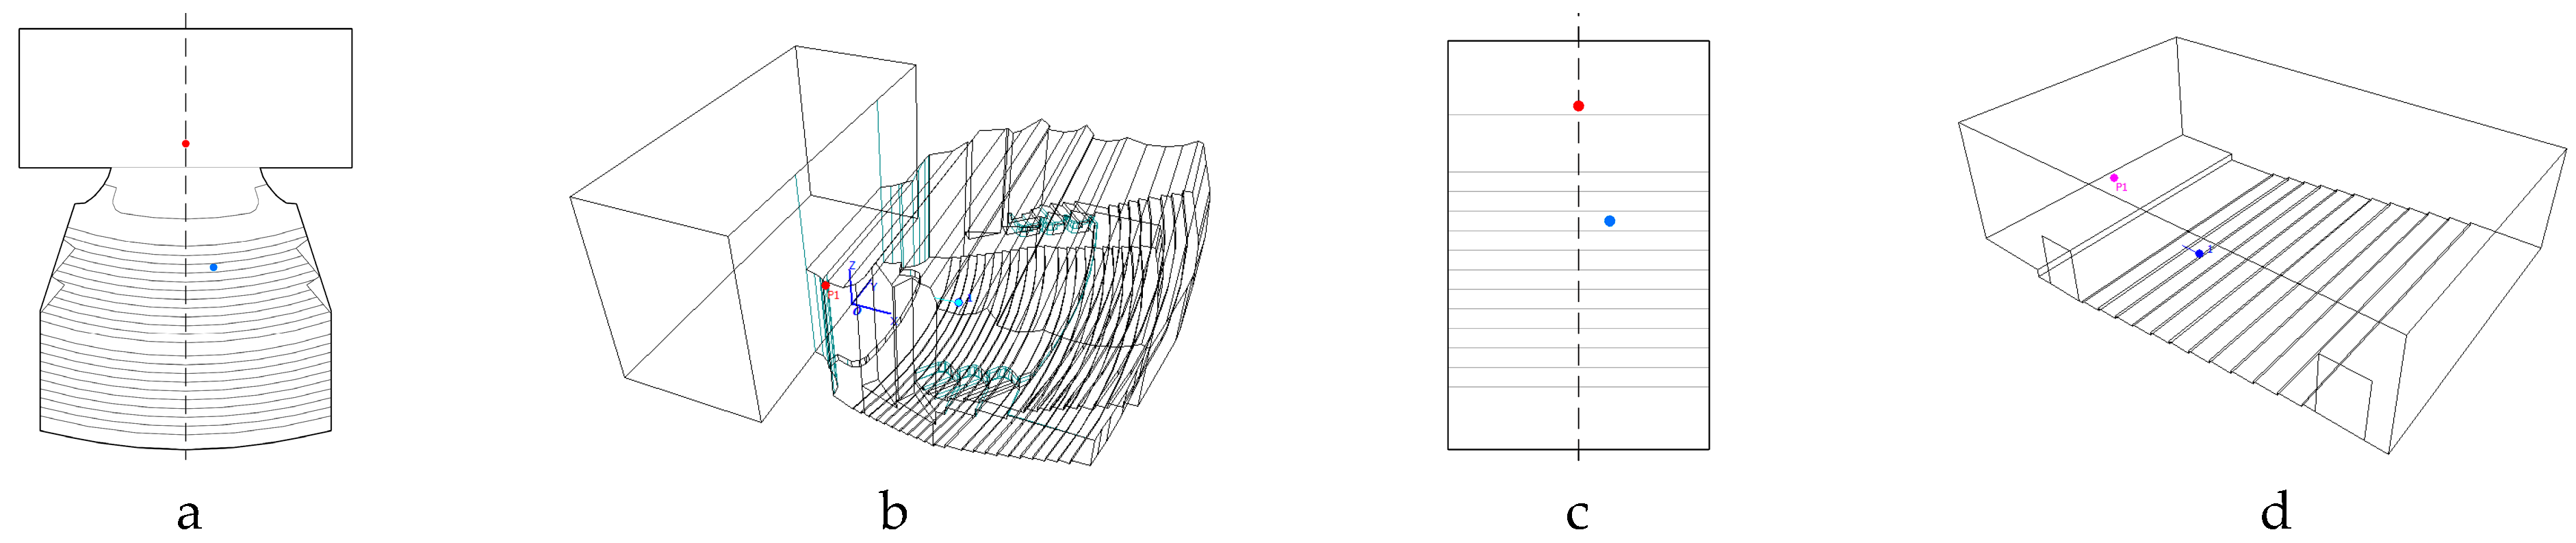
In the present study, the arrangement of the sound source and receiving points was determined in accordance with the relevant provisions of ISO 3382-1:2009 [40]. This incorporation of the typical configurations in existing literature, based on computational acoustics simulations, aimed to ensure the reliability and validity of the research findings. In the theater model, the sound source was placed 3 m behind the proscenium, along the stage centerline, at a height of 1.5 m, and the receiver was positioned 1.5 m to a side of the centerline and 0.9 m high, corresponding to the third row of the central audience area. In the rectangular model, the source was located on the central axis at the podium, at a height of 1.5 m, and the receiver was placed 1.5 m from the axis, at a height of 0.9 m, corresponding with the third-row seating in the central area. In both configurations, the sound source locations reflect those commonly used in live performances, and receiver locations correspond to optimal audience listening positions. The source and receiver heights simulate ear levels in standing and seated postures, respectively. Model data and the corresponding source-receiver configurations used in the Odeon9 acoustic simulation software are summarized in Figure 2.

2.2.2. Classification of Surface Scattering Coefficients

To isolate the influence of surface scattering on subjective auditory perception, the RT of the simulated spaces was kept constant across all scattering conditions. In accordance with Clause 3.3 of the Building Acoustics Design Code for Theatres, Cinemas and Multipurpose Halls (GB/T 50356-2005) [41], the reverberation time simulation values for the two spaces under consideration in this study were determined based on their audience hall volumes [42,43]. The auditorium volume of the theater space is measured at 11,860 m3, exhibiting a reverberation time T20 value of 1.2 s ± 10% (at 500 Hz and 1000 Hz). Similarly, the auditorium volume of the rectangular space is found to be 2480.6 m3, demonstrating a reverberation time T20 value of 0.9 s ± 10% (at 500 Hz and 1000 Hz).
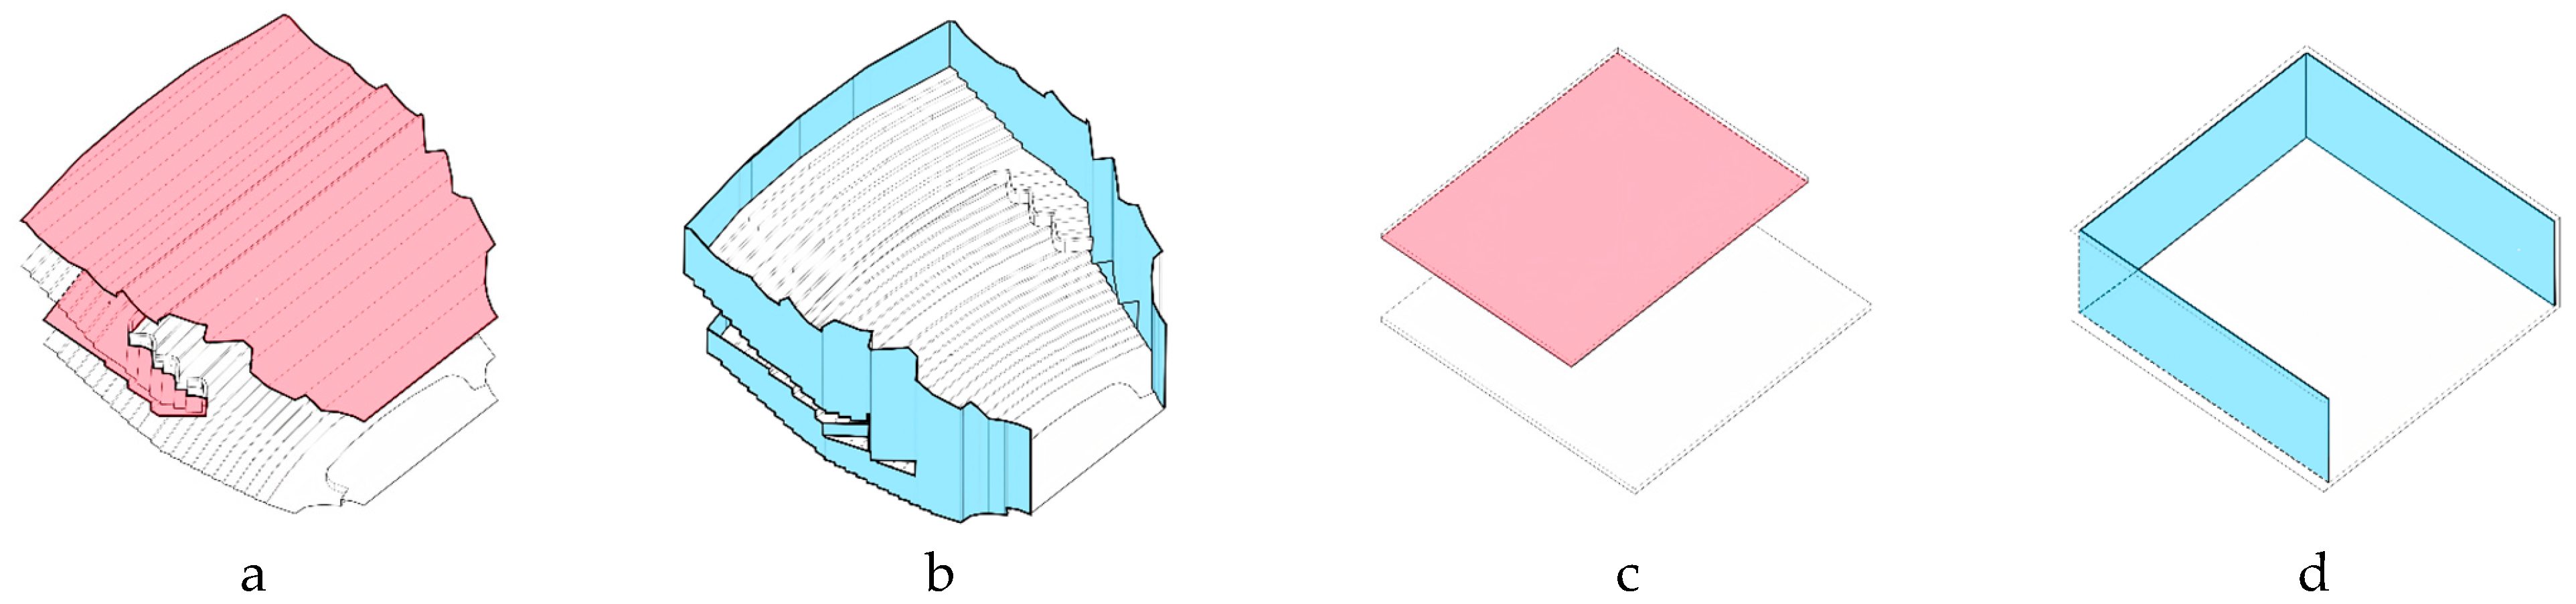
These reference values were used to calibrate the two simulated acoustic models, yielding two baseline configurations with equivalent reverberation characteristics. As established in previous studies, side walls and ceilings exerted the greatest influence on sound quality, providing critical lateral reflections that shaped listeners’ spatial impression and immersion [44,45]. Therefore, this study selected side walls and ceilings as the variable surfaces for simulation experiments. The distribution of surface-scattering variations is illustrated in Figure 3.
In a related 2015 study, Shtrepi divided scattering coefficients into six intervals (0.1, 0.3, 0.5, 0.6, 0.7, and 0.9) to examine perceptual sensitivity to surface scattering [25]. To closely approximate real-world conditions in performance venues, based on preliminary tests and previous findings [46], this study fixed all surface scattering coefficients at 0.3, varying either the ceiling or side-wall scattering coefficients at four levels: 0.1, 0.3, 0.6, and 0.9. Pan Lili et al. found that the scattering coefficients for diffusers employed in practical engineering applications can reach 0.7–0.9 under specific conditions [47]. This study adopted a scattering coefficient of 0.9 for investigation, holding significant value in theoretical research concerning fundamental physical mechanisms and perceptual upper limits.
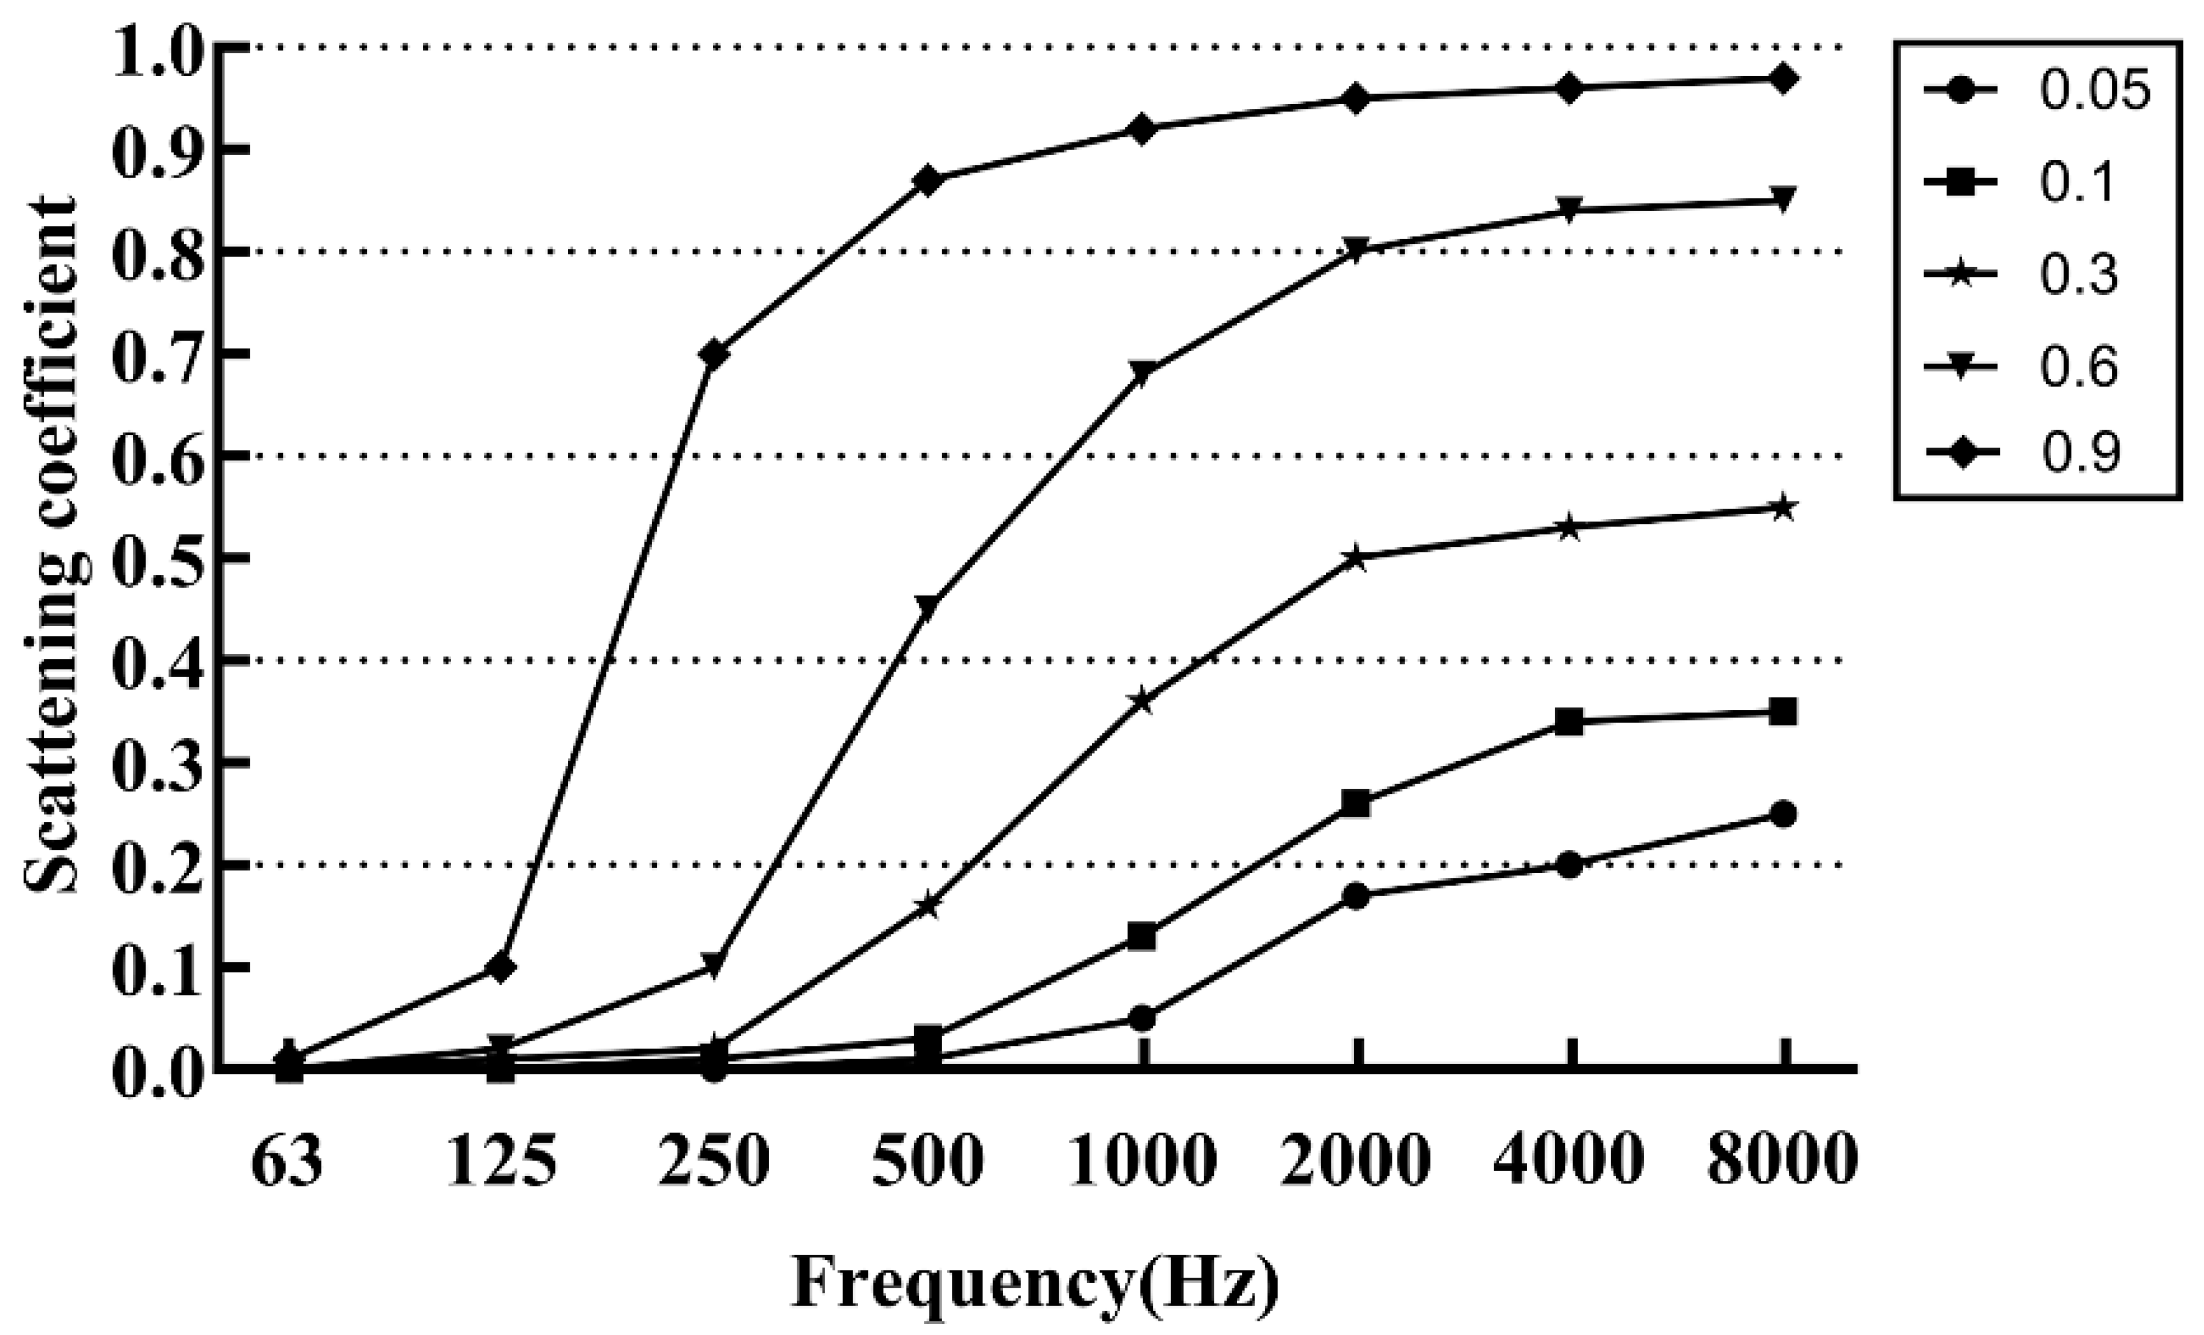
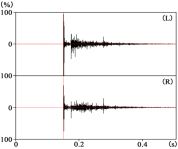
In this study, the Odeon9 computer acoustic simulation software was employed for computational analysis. The software utilizes a hybrid algorithm that combines the ray tracing and mirrored source methods. The scattering coefficients that are set within the software use the 707 Hz value as the input reference; scattering coefficient values for other frequency bands are automatically generated via correlation based on the software’s built-in frequency response calculation curve [48]. The specific correspondence is illustrated in Figure 4. This study utilized computer simulation in Odeon9 to obtain binaural impulse responses for two spatial configurations, two interface variations, and four scattering coefficients, yielding a total of sixteen responses. Table 1 presents these sixteen impulse signals.

2.3. Preparation of Experimental Samples

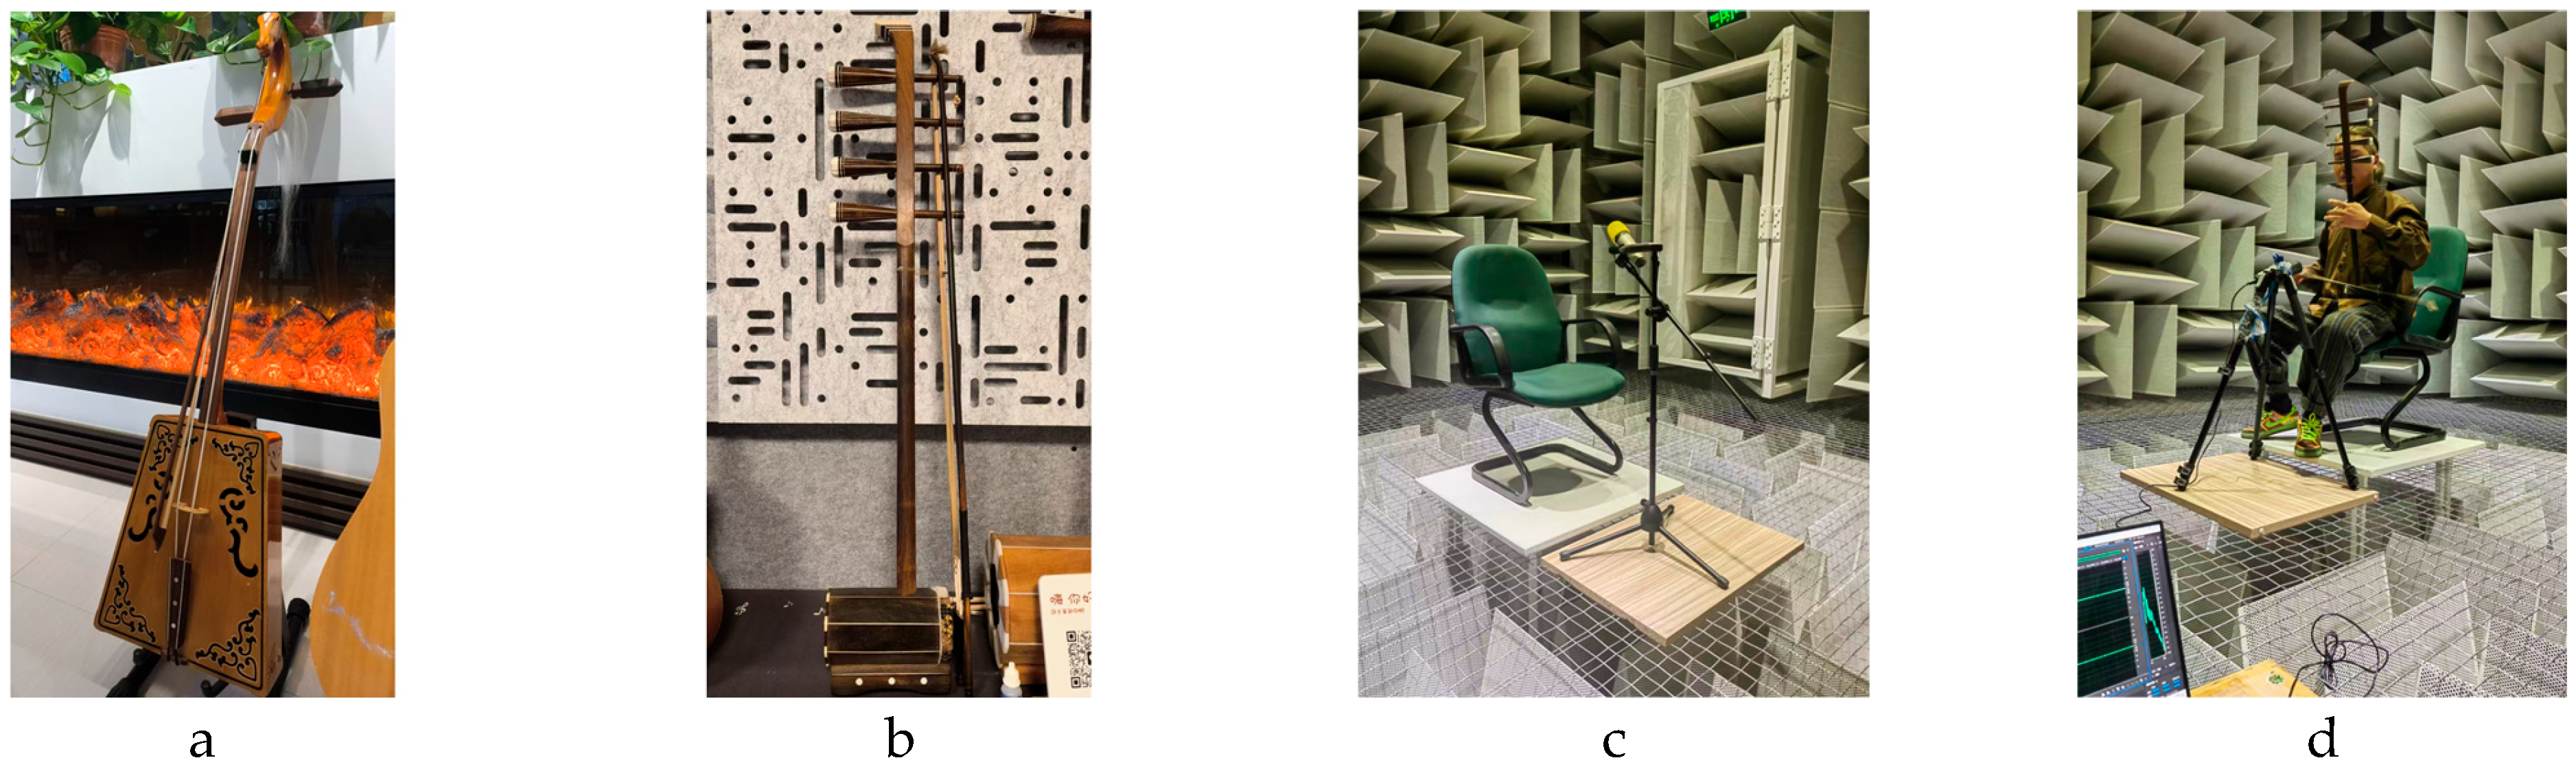
Based on a systematic review of literature, such as 《Records of Chinese Quyi: Inner Mongolia Volume》 and 《Traditional Mongolian Musical Instruments》, and field research on local performance ensembles [49,50,51]. two representative Mongolian instruments were selected: the morin khuur (horsehead fiddle) and the gaoyin sihu (high-pitched four-string fiddle) (Figure 5a,b). Both are traditional bowed string instruments indigenous to Inner Mongolia, commonly used in solo and ensemble contexts.
Through interviews and consultations with professional musicians across Inner Mongolia, several widely recognized Mongolian compositions were chosen as test materials. To ensure comparability, the repertoire included both slow-tempo and fast-tempo pieces. Professional performers from the Inner Mongolia Folk Orchestra recorded all the selections. Specifically, the morin khuur recordings included “Hongyan” (slow tempo) and “Gobi in My Heart” (fast tempo), and the gaoyin sihu recordings included “Meeting at the Aobao” (slow tempo) and “Sihu Improvisation” (fast tempo).
Dry recordings were made in the anechoic chamber of Inner Mongolia University of Technology. The chamber’s inner dimensions are 3.9 m (L) × 3.65 m (W) × 3.25 m (H), with background noise meeting the NR-15 standard (Figure 5c). Recordings were captured using a SAMSON C03U microphone, positioned 10 cm in front of each instrument’s sound cavity while the performer was seated (Figure 5d). The dry signal was meticulously recorded in mono at a sampling rate of 44.1 kHz with a depth of 32-bits, and stored as a.wav file. During the recording process, no interference from ambient noise was observed.
From this, a 10-s segment exhibiting the richest tonal variation was selected as the dry signal for convolution. This dry signal was convolved with the binaural impulse response within the Matlab platform to generate experimental audio for subjective listening tests and was saved in .wav format. The experimental audio was subjected to loudness normalization, with the calibrated average sound pressure level at the earphone output reaching approximately 65 dB(A). This method preserves the spatial distribution characteristics of early reflections while simulating the listener’s auditory perception in a real acoustic environment through high-fidelity headphone playback. The use of headphones eliminates room acoustic interference, ensuring the integrity of the binaural signal reception. With four music pieces and 16 impulse responses, 64 audio samples were produced and saved in .wav format for listening experiments.

2.4. Subjective Preference Test

A subjective paired-comparison listening test was conducted to evaluate perceptual preferences under different acoustic conditions. In each trial, the participants were presented with two audio samples and required to make a forced-choice judgment, selecting the one they personally preferred. This allowed the assessment of perceptual differences and preferences between sample pairs [52]. The experiment identified the optimal scattering coefficients for the instruments across distinct space types. Following established studies [37,46], four scattering coefficients—0.1, 0.3, 0.6, and 0.9—were used for each surface type. Each coefficient pair was compared in six paired conditions, resulting in 96 paired comparisons per participant. Participants were blind to the scattering coefficient values of the presented samples. Each audio pair was played only once, and the participants were required to choose within five seconds after listening to both clips. Listening tests were conducted using Sennheiser HD650 Hi-Fi over-ear headphones (Sennheiser electronic GmbH & Co. KG, Wedemark, Germany). The background noise level in the listening laboratory was 35 dB(A), with no other sources of interference.
A total of 48 participants, aged 18–26 years, were recruited from the College of Music at Inner Mongolia Normal University and the School of Architecture at Inner Mongolia University of Technology. All the participants reported normal hearing and good health. They were divided into three groups based on their musical expertise: Group I: ordinary listeners (non-professionals), Group II: vocal majors (semi-professionals), and Group III: instrumental majors (professionals) (Table 2).
This study was conducted in accordance with the Declaration of Helsinki. The protocol was approved by the IMUT-ARCH-2025-011 Ethics Committee on 14 November 2025.
The experiment was organized into 12 sessions, with four participants per session. Each participant received a pair of headphones and a printed listening questionnaire. After each pair of samples, they marked the option they perceived as “sounding better” on the questionnaire. To minimize psychological bias, the order of playback within each pair was randomized. To prevent listening fatigue, participants were given 2-min breaks after every six comparisons and 5-min breaks after every twelve. The total duration of the experiment was approximately 50 min. The experimental questionnaire is available in Appendix B.

2.5. Data Analysis

All the completed questionnaires were screened for reliability and validity. Five randomly embedded repeated pairs were included to assess response reliability. A reliability threshold of 0.6 was adopted; questionnaires showing consistent judgments in at least three repetitions were considered valid. For the paired-comparison data, average consistency analysis was used to evaluate the internal validity of each dataset, with a validity threshold of 0.75 [53]. Questionnaires failing to meet either criterion were excluded from further analysis.
This study employed a ‘0–1’ binary preference scale to consolidate reliable data, whereby a preference for sample A was documented as +1, and no preference for sample B was reported as 0. Scores for the same sample were then aggregated, with elevated scores denoting a subjectively more favorable auditory experience. This methodology effectively augments statistical power in acoustic preference research while mitigating ambiguous judgements [53]. A one-sample t-test was applied to assess the significance of differences among the four scattering coefficients under varying conditions. For each subgroup, the population mean was defined as the maximum mean preference score across coefficients. A significance level of 0.05 was used to determine whether the most preferred coefficient differed significantly from the other three [53]. This analysis was used to identify the optimal scattering coefficient perceived by participants under each experimental condition. All statistical analyses were performed using SPSS 27 software.

3. Results

After reliability and validity screening, 36 valid questionnaires were retained: 18 from the ordinary listener group, 9 from the instrumental group, and 9 from the vocal group. The coded preference data were analyzed to evaluate the effects of space type, scattering coefficient, scattering surface type, and musical tempo on listener preference, and determine the optimal scattering coefficient under different experimental conditions.

3.1. Selection of Preferred Scattering Coefficients Based on t-Tests

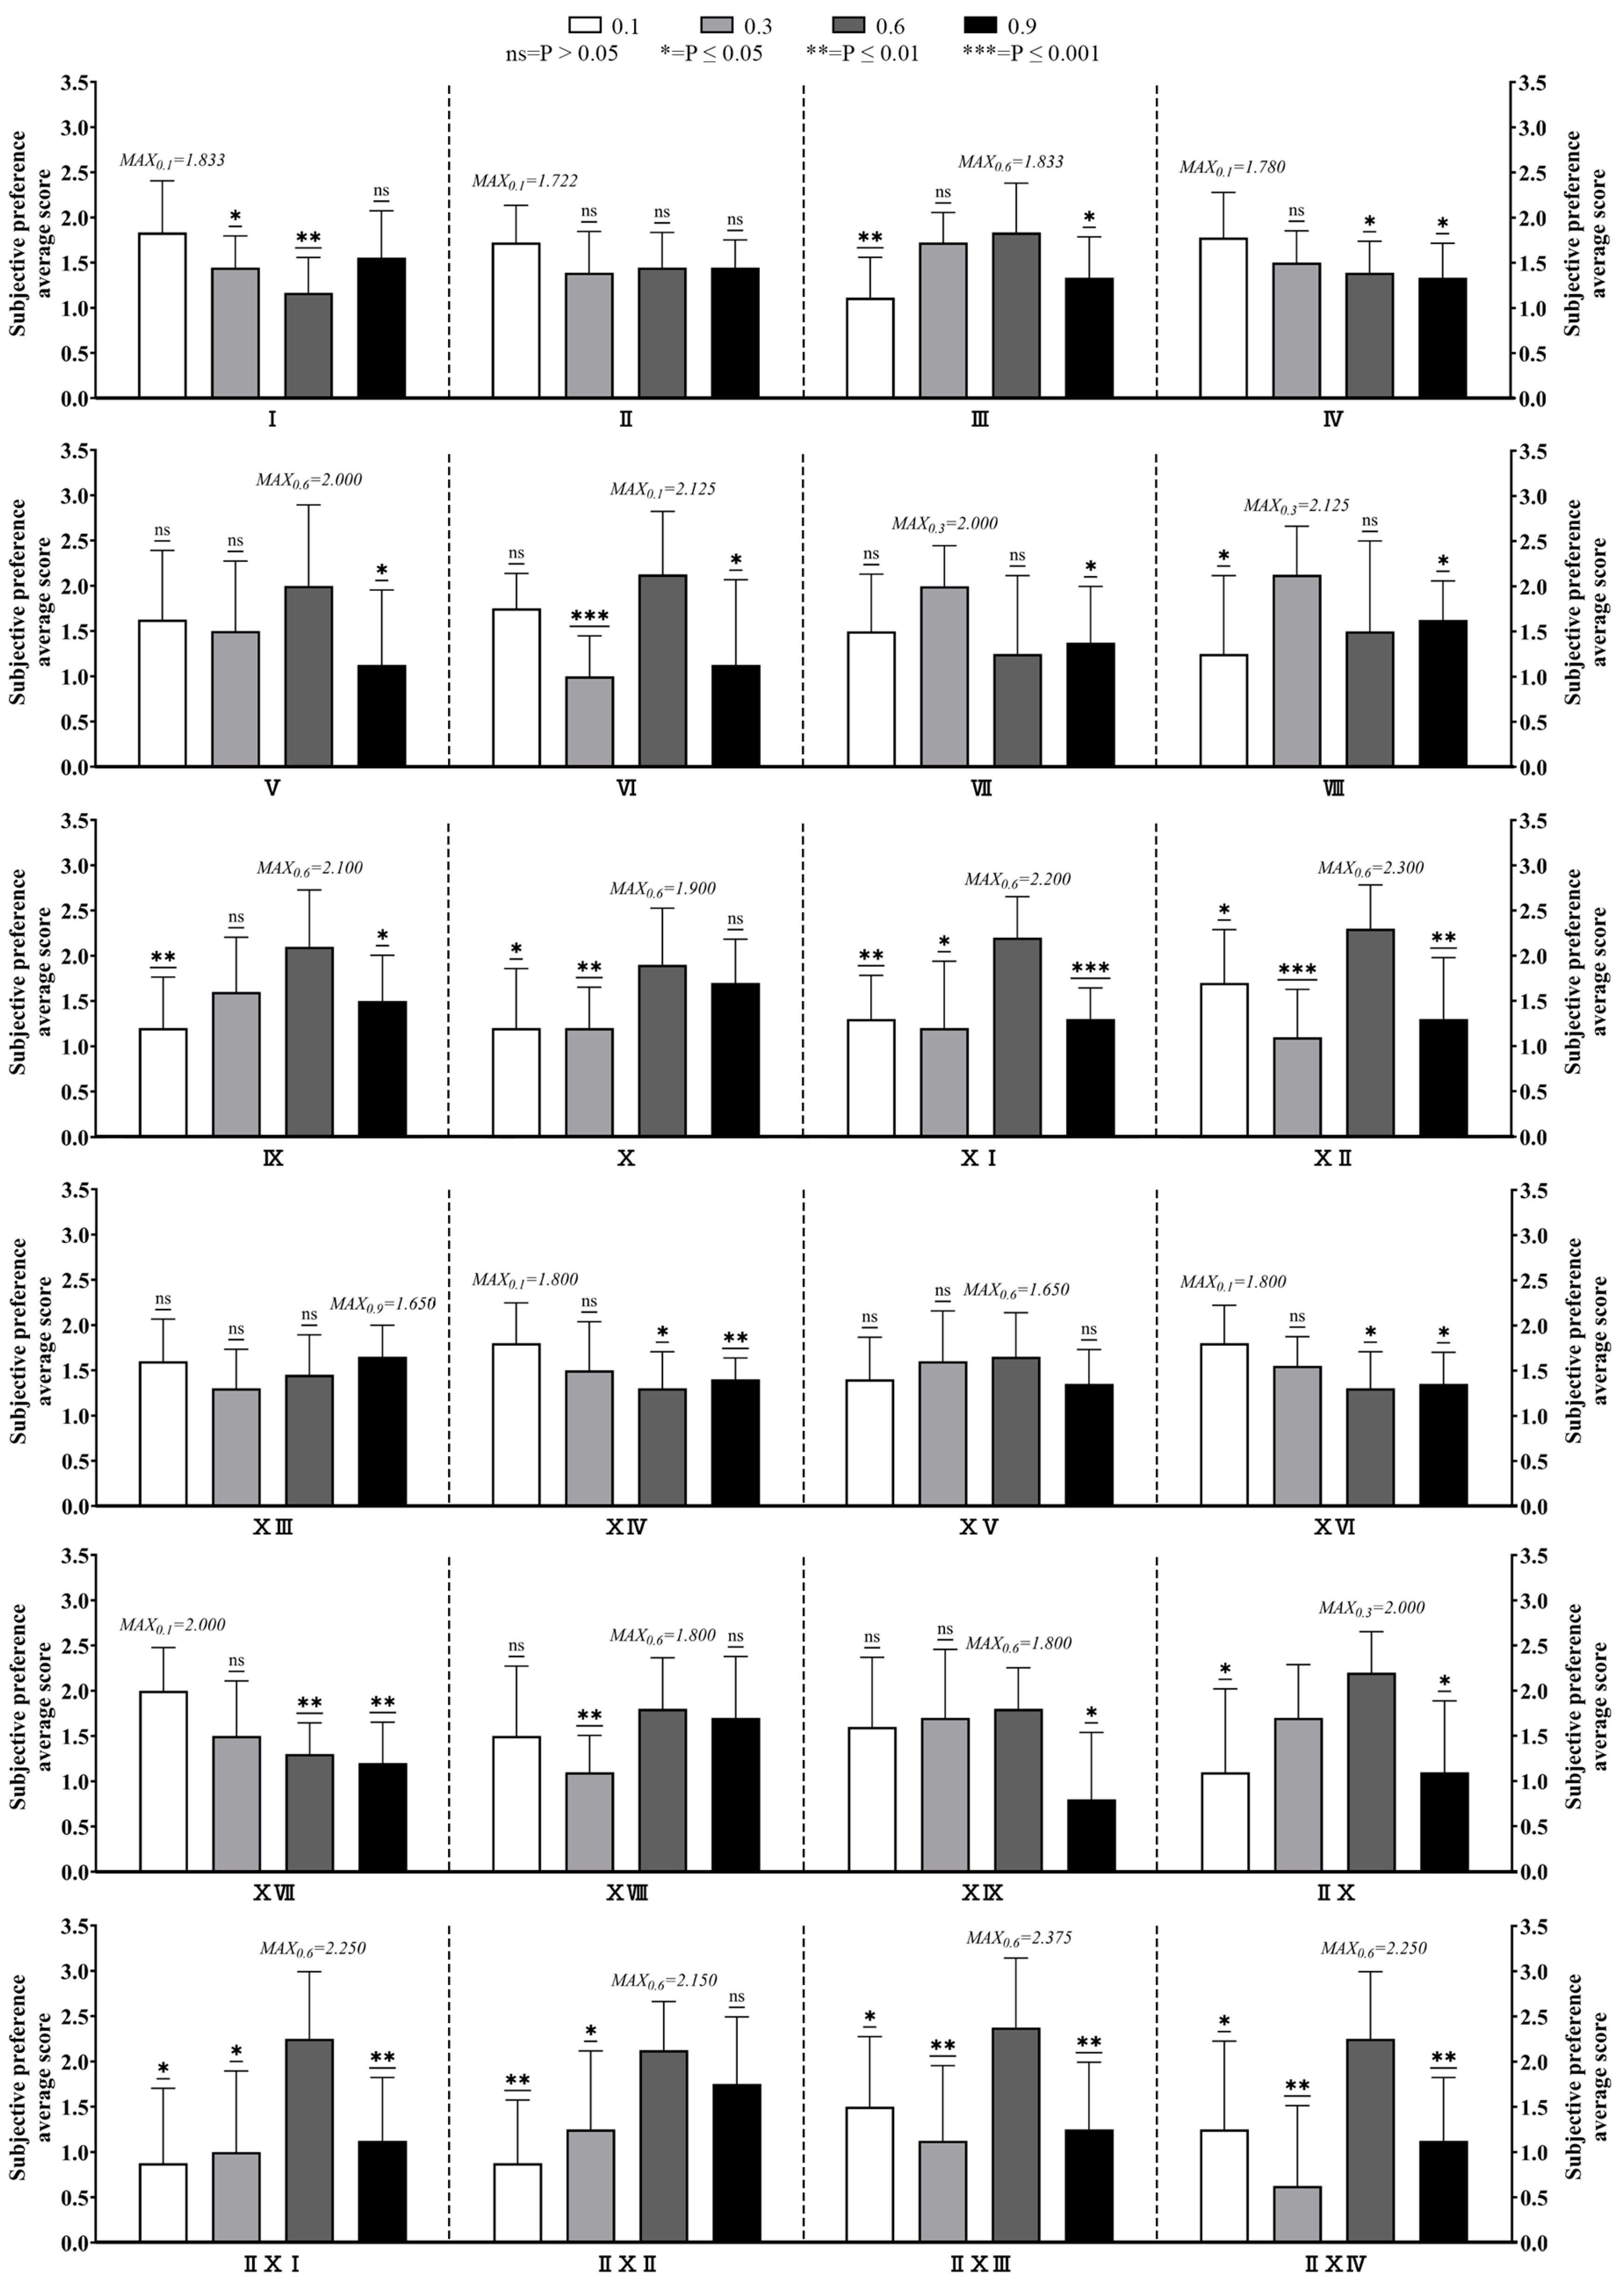
A one-sample t-test was conducted for each combination of space type and experimental condition. Considering “Theater–Instrumental Group–Ceiling–Brisk (IX)” as an example, when the ceiling scattering coefficient was 0.6, the sample mean reached the highest value (2.100). Comparative t-tests between the mean preference score at 0.6 and those at 0.1 and 0.9 yielded p-values of 0.005 < 0.05 and 0.025 < 0.05, respectively. These results indicated significant differences in preference, implying that listeners distinguished between these scattering conditions. However, the p-value for the comparison between 0.3 and 0.6 was 0.093 > 0.05, suggesting no significant difference between the two conditions. Hence, for the “Theater–Instrumental Group–Ceiling–Brisk (IX)” condition, the preferred scattering coefficients were 0.3 and 0.6.
The same analytical procedure was applied to all other test conditions. Table 3 summarizes the subjective preference outcomes, while Figure 6 presents the overall t-test results for the two simulated spaces. Groups I–XII corresponded to the t-test results for the theater-type space, while groups XIII–XXIV represented the rectangular space. Table 3 summarizes the optimal scattering coefficients across 24 combinations of space type (Theater/Rectangular), listener group (Ordinary/Vocal/Instrumental), surface type (Ceiling/Side wall), and tempo (Brisk/Soothing). Among these combinations, a scattering coefficient of 0.6 appeared most frequently as the optimal value (19 occurrences, 79.16%), considerably more than 0.1 (13, 54.17%), 0.3 (13, 58.33%), and 0.9 (7, 29.16%). Therefore, 0.6 can be regarded as the most preferred scattering coefficient across listener groups, space types, surface types, and musical tempos.

3.2. Optimal Scattering Coefficients Based on Spatial Variation

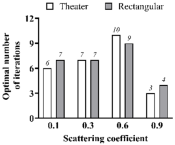
The theater-type space, representing a complex architectural form, and the rectangular-type space, representing a simpler form, are two typical configurations of performance venues. Results show that, in the theater space, the 0.6 scattering coefficient was preferred 10 times, followed by 0.3 (7 occurrences), which was close to 0.1 in frequency. In the rectangular space, the pattern was consistent: 0.6 had the highest count (9 occurrences), followed by 0.3 and 0.1. Notably, 0.9 received the fewest selections in both spaces, showing a significant difference compared to the other coefficients (Table 4).
Overall, both theater and rectangular spaces exhibited the same optimal scattering coefficient of 0.6. Although space type influenced subjective preference to some degree, the participants in both environments demonstrated a consistent pattern: preference values showed a non-symmetrical “middle-high, edge-low” distribution, with mid-range scattering conditions rated highest. Specifically, listeners showed a markedly stronger preference for the 0.6 condition compared to the high-scattering (0.9) condition, while acceptance of the low-scattering (0.1) condition was slightly below the moderate-scattering (0.3) condition. In general, the participants favored moderate diffusion over excessive or insufficient diffusion.

3.3. Optimal Scattering Coefficients Based on Surface Variation

Previous studies have demonstrated that variations in surface scattering coefficients at different surface locations within performance spaces can differently affect acoustic parameters in the audience area. Table 5 summarizes the preference frequencies for different scattering coefficients across surface types. For the ceiling, the highest number of preferences occurred at a scattering coefficient of 0.6 (9 occurrences), followed by 0.1 (8 occurrences). The coefficients 0.9 and 0.3 were each preferred 6 times, showing relatively small differences from the top-ranked values. For the side-wall, the preference for 0.6 was the highest (10 occurrences), followed by 0.3 (8 occurrences). In contrast, 0.1 and 0.9 received significantly fewer preference, with only 5 and 1 occurrences, respectively.
These results indicated that for both ceiling and side-wall, the optimal scattering coefficient was consistently 0.6, and surface variation exerted a notable effect on subjective preference across scattering coefficients. Preferences for side-wall scattering were more concentrated than for ceiling scattering, suggesting that participants were more perceptually sensitive to side-wall scattering variations. In both surfaces, participants showed a stronger preference for mid-to-high scattering levels (0.6) than for lower or higher values.

3.4. Optimal Scattering Coefficients Based on Listener Group Variation

Perceptual sensitivity to sound quality varied among different listener groups. Table 6 summarizes the preference frequencies by participant group. Among ordinary listeners, the 0.1 and 0.3 conditions were most frequently preferred (7 occurrences each), followed by 0.6 and 0.9 (4 occurrences each). In the vocal group, 0.6 had the highest preference frequency (7 occurrences), closely followed by 0.1 and 0.3 (6 occurrences each), while 0.9 was the least preferred (1 occurrence). For the instrumental group, the preference for 0.6 was strongest (8 occurrences), significantly exceeding that for 0.9 (2 occurrences) and 0.3 (1 occurrence).
These findings reveal significant differences in subjective preference across expertise levels. As professional expertise increased, participants’ preferences for scattering coefficients became more consistent and clearly defined. Both professional groups—vocal and instrumental—favored moderate-to-high diffusion (0.6), whereas the ordinary group preferred lower diffusion levels (0.1–0.3). Ordinary listeners primarily focused on overall visual and auditory comfort during performances and exhibited lower sensitivity to scattering coefficient variations. As shown in Table 5, this group frequently selected all four coefficients (0.1, 0.3, 0.6, and 0.9) as equally acceptable, indicating uncertainty in determining an optimal value.
For vocal participants, the key concern was the compatibility between reflected sound and vocal frequency range. A moderate-to-high scattering coefficient (0.6) offered a desirable balance between sufficient loudness and clarity, making it the optimal choice, while lower coefficients (0.1, 0.3) remained acceptable. In contrast, instrumental performers required more precise acoustic conditions to accommodate the diverse frequency characteristics of instruments and maintain spatial uniformity in sound distribution. Both overly high and overly low scattering coefficients could disrupt the spectral balance of the sound field, leading to less favorable acoustic conditions. Consequently, instrumental participants consistently preferred a scattering coefficient of 0.6.

3.5. Optimal Scattering Coefficients Based on Musical Tempo

Regarding musical tempo, the summarized results of participant preferences are shown in Table 7. In both brisk and soothing musical conditions, a scattering coefficient of 0.6 received the highest number of preferences, 10 and 9 times, respectively. This was followed by coefficients of 0.3 and 0.1, while 0.9 was selected the least frequently and showed a significant difference compared with the other coefficients.
For tempo variation, the most preferred scattering coefficient was 0.6 in both brisk and soothing conditions, although surface type exerted some influence on listener preference. These findings are consistent with the results of spatial variation, indicating that participants generally favored moderate scattering over excessive or insufficient scattering when evaluating samples with different musical tempos.
Taken together, listener preferences for scattering coefficients varied across space types, surface types, listener groups, and musical tempos. Across all experimental conditions, a scattering coefficient of 0.6 emerged as the most preferred value, while 0.1 was relatively favored among non-professional listeners as well.

4. Discussion

Through the subjective preference experiment, this study found that in performance scenarios featuring traditional Mongolian instruments, a scattering coefficient of 0.6 consistently yielded the highest listener preference across varied space types, surface types, listener groups, and musical tempos [23,33]. In contemporary engineering practice, the maximum attainable diffusion coefficient is 0.7. When utilizing a quadratic residue diffusion (QRD) type diffuser, achieving the diffusion coefficient of 0.6 investigated in this study necessitates an interface depth ranging from 50 mm to 100 mm, which aligns with the high diffusion range identified in Hann’s research [47]. In his work, Concert Halls and Opera Houses, Bärnacka documented subjective acoustic ratings of 76 Western concert halls by professional musicians. The Vienna Golden Hall (rectangular hall) and Boston Symphony Hall (rectangular hall) received the highest ratings, with all musicians awarding them top marks. It was observed that both concert halls employed textured surfaces (e.g., coffered ceilings and ornamental walls). These surfaces functioned as highly diffusive interfaces, yielding scattering coefficients within the 0.5–0.7 range [39]. This outcome aligned with the optimal scattering coefficient value of 0.6 that was identified in this study.

4.1. The Influence of Variable Factors on Subjective Preferences

This result confirmed the broadly adaptive value of the scattering coefficient in optimizing sound-field quality [23,33]. Previous studies have shown that changes in surface scattering within performance spaces affect the impulse response at the listening position. From an auditory perspective, the sequence of reflected sounds in the impulse response influences key acoustic parameters, and different spatial geometries further modify these effects. These findings are consistent with the present study’s results regarding spatial and surface variations.
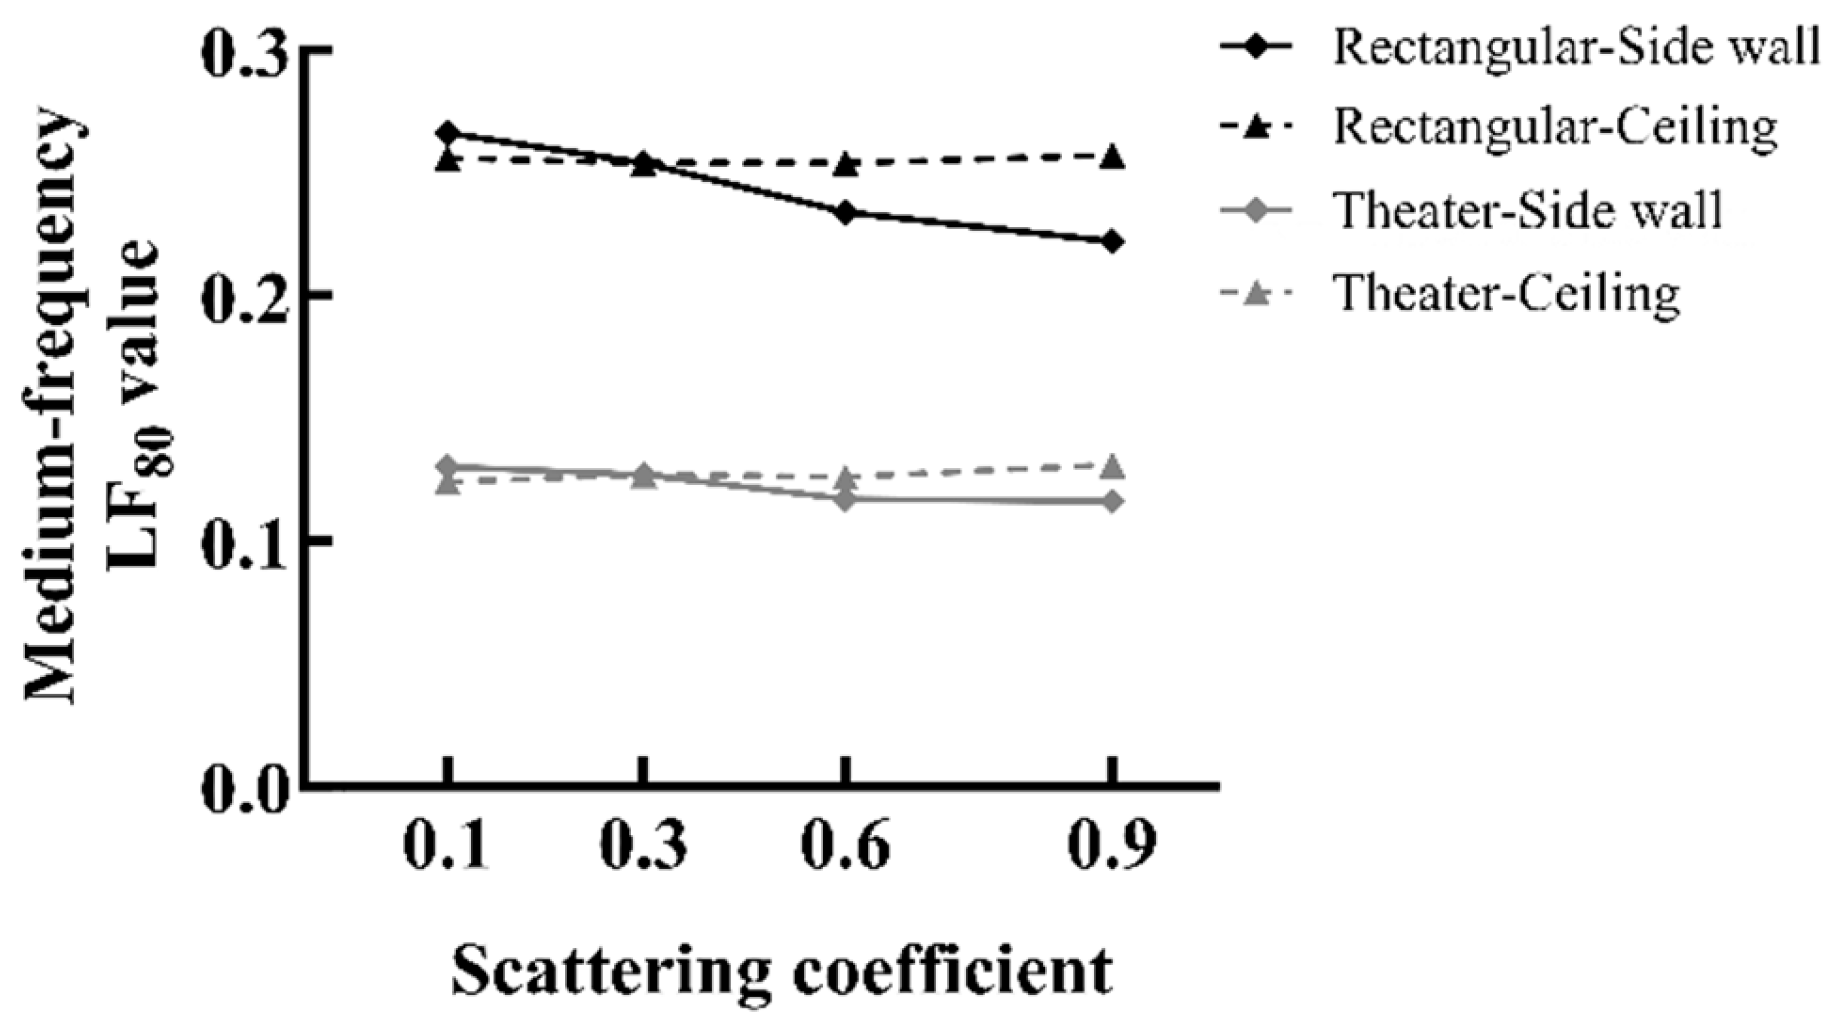
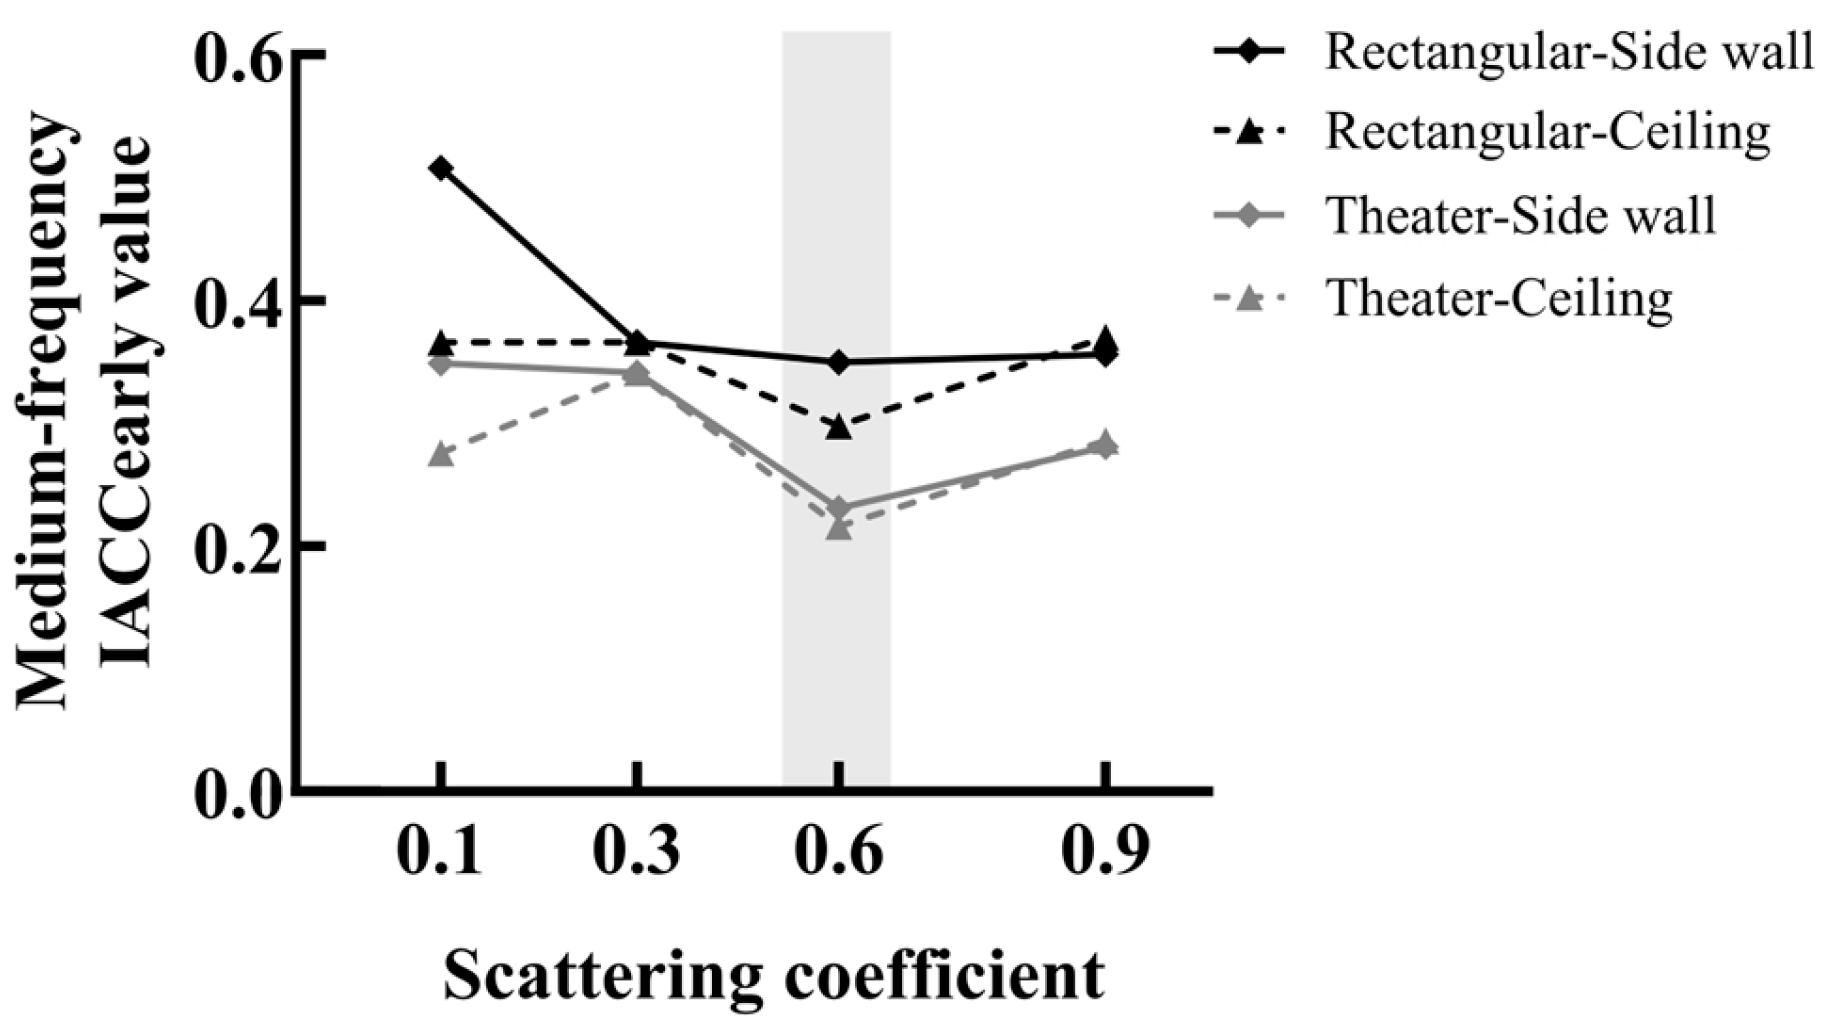
When examining the influence of scattering on individual surfaces, the current study found that changes in side-wall scattering produced more perceptually distinguishable audio samples than ceiling scattering, suggesting that side-wall diffusion had a stronger impact on room-acoustic quality. This aligned with Zhu [46]. A literature review reveals that the lateral sound energy fraction (LF80) and the early interaural cross-correlation coefficient (IACCearly) emerge as the most salient objective measures for characterizing apparent source width (ASW) and spatiality. The most critical objective acoustic parameters for characterizing ASW and spatiality are IACCearly. Lower IACCearly values have been found to correspond to a more pronounced spatial perception experience [47,54]. This study collated mid-frequency LF80 and IACCearly values for binaural impulse responses under four scattering coefficient conditions, as illustrated in Figure 7 and Figure 8. Analysis indicates that as the scattering coefficient increases, enhanced sidewall scattering capability leads to a significant rise in LF80 values across both spatial configurations, with a notably pronounced variation amplitude. In contrast, fluctuations in ceiling scattering capacity exhibited a comparatively negligible effect on LF80 values. Concurrently, IACCearly values demonstrated an initial decline, followed by an increase; the decrease was attributed to side walls being more significant than that from the ceiling. Both reached their minimum values at a scattering coefficient of 0.6. These findings confirm that alterations in side wall scattering characteristics exert a more dominant influence on listeners’ spatial perception than those of the ceiling. Furthermore, they indicate that a scattering coefficient of 0.6 represents a critical threshold for optimizing spatial auditory experiences. The conclusions drawn from this objective parameter analysis align with the results of the subjective listening experiments conducted in this study, thereby further substantiating the validity of the findings.
Furthermore, the study revealed that musical tempo affected participants’ subjective judgments, a pattern comparable to Xu, who investigated the influence of musical tempo on visitors’ dwell time in exhibition environments [28].
The present experiment tested four scattering coefficients (0.1, 0.3, 0.6, and 0.9). Participants were able to make discernible preference judgments within this range of variation, consistent with previous research identifying perceptual thresholds for scattering coefficients between 0.27 and 0.5 [25,37,44]. Unlike earlier studies that primarily focused on the perceptual detectability or audibility thresholds of scattering variation, this work determined an optimal scattering coefficient within the tested spaces using a subjective preference approach. The analysis revealed that consistency in selecting the optimal value decreased with lower levels of listener expertise. Non-professional participants frequently identified multiple coefficients as equally preferred and generally favored lower scattering levels. Vocal specialists made more focused judgments; however, some selected up to three preferred coefficients. Instrumental specialists consistently demonstrated a preference for the 0.6 scattering condition. These differences likely reflect varying perceptual sensitivities and evaluation criteria associated with musical training, suggesting that long-term musical practice enhances one’s sensitivity and preference differentiation for sound-field diffusion.

4.2. Limitations and Outlook

Despite its contributions, the current study has certain limitations. First, the research employed high-fidelity acoustic simulation methods. While it is reasonable to posit that simulations can reflect real acoustic scenarios, the accuracy of simulations is constrained by the number of sound rays employed, leading to discrepancies between simulated and actual spaces. Nevertheless, the conclusions drawn from these simulations provide valuable reference points for the acoustic design and analysis of real auditoriums. Second, while this study proposes a scattering coefficient of 0.6 as a reference value for subjective listening preference, the current scarcity of test samples for diffuser scattering coefficients means that engineering practice requires substantial empirical scattering coefficient data to establish clear correspondences between diffuser values and design approaches. Finally, the present study employed headphones for the administration of subjective listening tests. However, this approach may influence spatial perception in comparison with natural listening in actual rooms. Nonetheless, the aforementioned limitations do not undermine the validity of the core trends and design principles revealed by this research. Rather, they can offer constructive directions for subsequent in-depth investigations.

4.3. Applications

Overall, this research demonstrates how space type, surface type, listener group, and musical tempo collectively shape audience preference for different scattering coefficients, with 0.6 emerging as the most favored value. Since the simulation models were based on real-world performance spaces, the findings may serve as a design reference prototype for future auditorium and theater acoustics. They provide a benchmark for assessing sound-quality design. Moreover, the differing preferences observed across listener groups offer useful theoretical guidance for practical acoustic design: for general audience spaces or semi-professional venues, slightly lower scattering coefficients may be appropriate, whereas professional performance environments can adopt 0.6 as a reference value. This study contributes to improving acoustic design strategies, enabling designers to better control room-acoustic quality and enhance the listening experience for audiences.


5. Conclusions

Through a subjective preference survey conducted across two selected performance spaces, this study evaluated how variations in surface type, listener group, and musical tempo influence participants’ preferences for traditional Inner Mongolian instrumental music under four different scattering coefficients. Based on the analysis of the listening test results, the following key conclusions were obtained:
  • In this study, the subjects most frequently selected a scattering coefficient of 0.6 as the optimal value, accounting for 79.16% of cases. This proportion was significantly higher than those reported for 0.1 (54.17%), 0.3 (58.33%), and 0.9 (29.16%). Consequently, it can be deduced that, in the design of viewing spaces, the optimal value for the interface scattering coefficient is 0.6.
  • Within the selected spaces, surface type and listener group exerted the strongest influence on subjective preference, whereas the effects of space type and musical tempo were comparatively minor.
  • Changes in side-wall scattering had a more pronounced impact on listener preference than changes in ceiling scattering.
  • Listener preferences varied by expertise: Non-professional participants preferred audio with lower scattering coefficient ts (0.1 or 0.3). Vocal specialists favored moderate-to-high scattering (around 0.6) but accepted lower coefficients with relatively small perceptual differences. Instrumental specialists showed a clear and consistent preference for 0.6.
Hence, the findings reveal how space type, surface type, listener group, and musical tempo interact with scattering coefficient to shape musical preference within typical performance space environments. Concurrently, the study determined that the optimal diffuse reflection coefficient for an optimal listening experience in performance spaces is approximately 0.6. Hence, future acoustic designs should incorporate appropriately textured decorative surfaces with undulating reliefs on side walls and ceiling areas, integrated with interior finishes. Based on comparative subjective experiments documented in the publication Concert Halls and Opera Theatres [39], it is advised that the protrusion depth range between 50 mm and 100 mm to ensure that the interface diffuse reflection coefficient achieves the aforementioned recommended value. These findings may be applied directly to inform acoustic design in halls, theaters, and analogous spaces, thereby enhancing the musical experience within such environments and advancing the standardization and innovative application of acoustic design. Nevertheless, further research is needed to expand and refine the current framework by incorporating additional influencing factors and exploring a broader range of architectural forms. A more comprehensive understanding of how variations in surface scattering affect listeners’ subjective judgments and how these factors interact will contribute to developing nuanced design guidelines for performance space acoustics.

Author Contributions

Conceptualization, S.N. and X.Z.; Formal analysis, S.N. and X.Z.; Funding acquisition, X.Z.; Investigation, S.N., X.Y., Z.X. and Z.Q.; Methodology, S.N. and D.Y.; Supervision, X.Z.; Visualization, S.N.; Writing—original draft, S.N.; Writing—review and editing, S.N. All authors have read and agreed to the published version of the manuscript.

Funding

This study was supported by the National Natural Science Foundation of China [Grant No. U24A20160], National Natural Science Foundation of China [Grant No. 52568018], Natural Science Foundation of Inner Mongolia, China (NSFC) [Grant No. 2023LHMS05025].

Data Availability Statement

The datasets generated during and/or analyzed during the current study are available from the corresponding author on reasonable request.

Acknowledgments

We would like to thank the students from the School of Music at Inner Mongolia Normal University and the School of Architecture at Inner Mongolia University of Technology for their active cooperation in conducting subjective experiments.

Conflicts of Interest

The authors declare no conflicts of interest.

Appendix A

Table A1. Basic Parameters of Selected Theater Spaces.
Jinchang TheatrePinglu TheatreHeze TheatreLuoyang Theatre
Floor PlanBuildings 16 00324 i021Buildings 16 00324 i022Buildings 16 00324 i023Buildings 16 00324 i024
Cross-SectionBuildings 16 00324 i025Buildings 16 00324 i026Buildings 16 00324 i027Buildings 16 00324 i028
V (m3)9365946411,86012,760
Rectangular S (m2)3718.73897.34349.34652.0
Seating Qty (seats)1009130915211420
Each volume (m3)9.37.27.89.0
Stage opening width (m)162214.818
Aspect ratio33.0/25.0 = 1.3230.5/30.2 = 1.00931.5/30.8 = 1.01634.9/32.8 = 1.064
Table A2. Basic Parameters of the Selected Rectangular Space.
Space 1Space 2Space 3Space 4
Floor PlanBuildings 16 00324 i029Buildings 16 00324 i030Buildings 16 00324 i031Buildings 16 00324 i032
Cross-SectionBuildings 16 00324 i033Buildings 16 00324 i034Buildings 16 00324 i035Buildings 16 00324 i036
V (m3)5691.62480.61867.3791.6
Land area S (m2)1108.8408.5373.5212.6
Seating Qty (seats)612314204300
Each volume (m3)9.37.99.152.63
Aspect ratio32.9/32.6 = 1.00121.5/19.0 = 1.13126.3/14.2 = 1.83917.8/14.4 = 1.236

Appendix B

Table A3. Experimental Table for Subjective Selection of Optimal Scattering Coefficient Values for Mongolian Musical Instruments.
Participants are administered audio signals via headphones. Each participant is tasked with evaluating 96 pairs of audio segments, with each pair comprising two 10-s clips featuring differing scattering coefficients. Following the presentation of each pair, participants are instructed to select their preferred clip from the two. Following every six pairs evaluated, a five-minute break is provided. The experiment is expected to last approximately 50 min.
Age GroupUnder 1818–40 Years40–60 Years
GenderMaleFemale
Exp. GroupAu. AAu. BExp. GroupAu. AAu. BExp. GroupAu. AAu. BExp. GroupAu. AAu. B
OneSevenThirteenNineteen
144973
8115680
15186387
22197094
TwoEightFourteenTwenty
255074
9125781
16136488
23207195
ThreeNineFifteenTwenty-one
365175
1075882
17146589
24217296
FourTenSixteenTwenty-two
4525276
11595983
18666690
19676791
FiveElevenSeventeenTwenty-three
5535377
12606084
13616185
2068 6892
SixTwelveEighteenTwenty-four
6545478
7555579
14626286
21696993

References

  1. Beranek, L.L. Concert hall acoustics—1992. J. Acoust. Soc. Am. 1992, 92, 1–39. [Google Scholar] [CrossRef]
  2. Polack, J.D. Playing billiards in the concert hall: The mathematical foundations of geometrical room acoustics. Appl. Acoust. 1993, 38, 235–244. [Google Scholar] [CrossRef]
  3. Kuttruff, H. Room Acoustics; CRC Press: Boca Raton, FL, USA, 2016. [Google Scholar] [CrossRef]
  4. Zhao, Y.Z.; Zhang, R. Advances in acoustic diffusers and interfacial acoustic scattering. South Archit. 2012, 2, 90–94. [Google Scholar]
  5. Wang, J.D.; Zhao, Y.Z. Analysis of the influence of stepped diffuser array configurations on diffusion performance. J. Tsinghua Univ. (Sci. Technol.) 2021, 61, 261–268. [Google Scholar]
  6. Mo, F.S.; Sheng, S. Research progress on evaluation and measurement of acoustic scattering characteristics of indoor interfaces. Acoust. Technol. 2004, 1, 49–53. [Google Scholar]
  7. Hargreaves, T.J.; Cox, T.J.; Lam, Y.W.; D’Antonio, P. Surface diffusion coefficients for room acoustics: Free-field measures. J. Acoust. Soc. Am. 2000, 108, 1710–1720. [Google Scholar] [CrossRef]
  8. ISO 17497-1; Acoustics—Sound-Scattering Properties of Surfaces—Part 1: Measurement of the Random-Incidence Scattering Coefficient in a Reverberation Room. International Organization for Standardization: Geneva, Switzerland, 2004.
  9. Ducourneau, J.; Faiz, A.; Khanfir, A.; Chatillon, J. Measuring sound scattering coefficients of uneven surfaces in a reverberant workplace–Principle and validation of the method. Appl. Acoust. 2013, 74, 653–660. [Google Scholar] [CrossRef]
  10. Vorländer, M.; Mommertz, E. Definition and measurement of random-incidence scattering coefficients. Appl. Acoust. 2000, 60, 187–199. [Google Scholar] [CrossRef]
  11. Ryu, J.K.; Jeon, J.Y. Subjective and objective evaluations of a scattered sound field in a scale model opera house. J. Acoust. Soc. Am. 2008, 124, 1538–1549. [Google Scholar] [CrossRef]
  12. Suzumura, Y.; Sakurai, M.; Ando, Y.; Yamamoto, I.; Iizuka, T.; Oowaki, M. An evaluation of the effects of scattered reflections in a sound field. J. Sound Vib. 2000, 232, 303–308. [Google Scholar] [CrossRef]
  13. Kim, Y.H.; Kim, J.H.; Jeon, J.Y. Scale model investigations of diffuser application strategies for acoustical design of performance venues. Acta Acust. United Acust. 2011, 97, 791–799. [Google Scholar] [CrossRef]
  14. Kim, Y.H.; Jang, H.S.; Jeon, J.Y. Characterizing diffusive surfaces using scattering and diffusion coefficients. Appl. Acoust. 2011, 72, 899–905. [Google Scholar] [CrossRef]
  15. Jeon, J.Y.; Kwak, K.H.; Jang, H.S.; Lim, H. Perceptual aspects of sound diffuseness in concert halls. In ICSV 2016–23rd International Congress on Sound and Vibration: From Ancient to Modern Acoustics; International Institute of Acoustics and Vibrations: Auburn, AL, USA, 2016; pp. 1–4. [Google Scholar]
  16. Jeon, J.Y.; Jang, H.S.; Kim, Y.H.; Vorländer, M. Subjective and objective evaluations of scattered sounds in concert halls. In International Symposium on Room Acoustics; ISRA: Toronto, ON, Canada, 2013. [Google Scholar]
  17. Wang, Y.-Y. Preliminary Study on the Influence of Surface Sound Diffusion on the Acoustic Quality of Concert Halls. Doctoral Dissertation, South China University of Technology, Guangzhou, China, 2013. [Google Scholar]
  18. Jeon, J.Y.; Jo, H.I.; Seo, R.; Kwak, K.H. Objective and subjective assessment of sound diffuseness in musical venues via computer simulations and a scale model. Build. Environ. 2020, 173, 106740. [Google Scholar] [CrossRef]
  19. de Bree, H.E.; Leussink, P.; Korthorst, T.; Jansen, H.; Lammerink, T.S.J.; Elwenspoek, M. The μ-flown: A novel device for measuring acoustic flows. Sens. Actuators A 1996, 54, 552–557. [Google Scholar] [CrossRef]
  20. Bork, I. A comparison of room simulation software—The 2nd round robin on room acoustical computer simulation. Acustica 2000, 86, 943–956. [Google Scholar]
  21. Gade, A.C.; Lynge, C.; Lisa, M.; Rindel, J.H. Matching simulations with measured acoustic data from Roman theatres using the ODEON programme. In Proceedings of the Forum Acusticum, Budapest, Hungary, 29 August–2 September 2005; Volume 29. [Google Scholar]
  22. Kang, J. Scale modelling for improving the speech intelligibility from multiple loudspeakers in long enclosures by architectural acoustic treatments. Acta Acust. United Acust. 1998, 84, 689–700. [Google Scholar]
  23. Kang, J. Reverberation in rectangular long enclosures with diffusely reflecting boundaries. J. Acoust. Soc. Am. 1999, 105, 1315–1316. [Google Scholar] [CrossRef]
  24. Shtrepi, L.; Astolfi, A.; Rychtáriková, M. The influence of a volume scale-factor on scattering coefficient effects in room acoustics. Build. Acoust. 2014, 21, 153–166. [Google Scholar] [CrossRef]
  25. Shtrepi, L.; Astolfi, A.; Pelzer, S.; Vitale, R.; Rychtáriková, M. Objective and perceptual assessment of the scattered sound field in a simulated concert hall. J. Acoust. Soc. Am. 2015, 138, 1485–1497. [Google Scholar] [CrossRef]
  26. Santika, B.B.; Lee, H.; Jeon, J.Y. Investigation of acoustic attributes based on preference and perceptional acoustics of Korean traditional halls for optimal design solutions. Build. Simul. 2024, 17, 723–738. [Google Scholar] [CrossRef]
  27. Yang, J. Research on the Optimal Selection of Reverberation Time and Loudness in Theater Halls. Master’s Thesis, Tianjin University, Tianjin, China, 2014. [Google Scholar]
  28. Xu, X.; Kang, J.; Kang, J.; Yasin, I. Effect of music tempo on duration of stay in exhibition spaces. Appl. Acoust. 2023, 207, 109353. [Google Scholar] [CrossRef]
  29. Pawlak, A.; Lee, H.; Mäkivirta, A.; Lund, T. Spatial analysis and synthesis methods: Subjective and objective evaluations using various microphone arrays in the auralization of a critical listening room. IEEE/ACM Trans. Audio Speech Lang. Process. 2024, 32, 3986–4001. [Google Scholar] [CrossRef]
  30. Noisternig, M.; Katz, B.F.G.; Siltanen, S.; Savioja, L. Framework for real-time auralization in architectural acoustics. Acta Acust. United Acust. 2008, 94, 1000–1015. [Google Scholar] [CrossRef]
  31. McCormack, L.; Pulkki, V.; Politis, A.; Scheuregger, O.; Marschall, M. Higher-order spatial impulse response rendering: Investigating the perceived effects of spherical order, dedicated diffuse rendering, and frequency resolution. J. Audio Eng. Soc. 2020, 68, 338–354. [Google Scholar] [CrossRef]
  32. Haan, C.; Fricke, F.R. An evaluation of the importance of surface diffusivity in concert halls. Appl. Acoust. 1997, 51, 53–69. [Google Scholar] [CrossRef]
  33. Hann, C.H.; Fricke, F. Surface diffusivity as a measure of the acoustic quality of concert halls. In Mech 94: International Mechanical Engineering Congress and Exhibition; Preprints of Papers; Resource Engineering Conference 3; Noise and Vibration; Institution of Engineers (Australia): Barton, Australia, 1994; Volume 3, pp. 79–84. [Google Scholar]
  34. Takahashi, D.; Takahashi, R. Sound fields and subjective effects of scattering by periodic-type diffusers. J. Sound Vib. 2002, 258, 487–497. [Google Scholar] [CrossRef]
  35. Shtrepi, L.; Astolfi, A.; D’Antonio, G.; Guski, M. Objective and perceptual evaluation of distance-dependent scattered sound effects in a small variable-acoustics hall. J. Acoust. Soc. Am. 2016, 140, 3651–3662. [Google Scholar] [CrossRef]
  36. Shtrepi, L.; Di Blasio, S.; Astolfi, A. Listeners sensitivity to different locations of diffusive surfaces in performance spaces: The case of a shoebox concert hall. Appl. Sci. 2020, 10, 4370. [Google Scholar] [CrossRef]
  37. Vitale, R. Perceptual Aspects of Sound Scattering in Concert Halls; Logos Verlag Berlin GmbH: Berlin, Germany, 2015; Volume 21. [Google Scholar]
  38. Shtrepi, L. Investigation on the diffusive surface modeling detail in geometrical acoustics based simulations. J. Acoust. Soc. Am. 2019, 145, EL215–EL221. [Google Scholar] [CrossRef]
  39. Beranek, L.L. Concert hall and opera house acoustics: 2000. In Proceedings of the 7th International Congress on Sound and Vibration, Garmisch-Partenkirchen, Germany, 4–7 July 2000. [Google Scholar]
  40. ISO 3382-1:2009; Acoustics—Measurement of Room Acoustic Parameters—Part 1: Performance Spaces. International Organization for Standardization: Geneva, Switzerland, 2009.
  41. GB/T 50356-2005; Code for Building Acoustics Design of Theatres, Cinemas and Multipurpose Halls. China Planning Press: Beijing, China, 2005.
  42. JGJ 57-2000; Code for Design of Theatre Buildings. Southwest Architectural Design and Research Institute of China; China Architecture & Building Press: Beijing, China, 2005.
  43. GB/T 5007-2013; Specification for Measurement of Indoor Reverberation Time. Tsinghua University School of Architecture; China Architecture & Building Press: Beijing, China, 2014.
  44. Luo, D.; Qin, Y. Five stages in the developmental relationship between Chinese Opera and ancient theatres. Anc. Archit. Gard. Technol. 2002, 3, 54–58. [Google Scholar]
  45. Luo, D.; Qin, Y. Reverberation characteristics and analysis of two theatre stages. Cent. China Archit. 2001, 19, 62–63. [Google Scholar]
  46. Zhu, X. The Influence of Interface Scattering in Performance Spaces on Acoustic Quality Parameters. Doctoral Dissertation, Tianjin University, Tianjin, China, 2020. [Google Scholar]
  47. Pan, L.; Zhao, Y. An experimental investigation into the scattering properties of maximum length sequence diffusers and quadratic residue diffusers. Appl. Acoust. 2022, 185, 108347. [Google Scholar] [CrossRef]
  48. Christensen, C.L. Industrial, Auditorium and Combined Editions: Version 9.0 User Manual; Odeon Room Acoustics Program; Odeon A/S: Kgs: Lyngby, Denmark, 2007. [Google Scholar]
  49. Le, Q.G. A Study on the Distribution Patterns and Stylistic Schools of Contemporary Traditional Instrumental Ensembles Among the Mongolian Ethnic Group. Doctoral Dissertation, China Conservatory of Music, Beijing, China, 2019. [Google Scholar]
  50. Cai, Y.L. Reflections on compiling the Inner Mongolia volume of Chinese folk art. Inn. Mong. Arts 2002, 2, 2. [Google Scholar]
  51. Zhao, Y. The Mongolian Traditional Instrument Si Hu: A Case Study of the Ordos “Nairi”. Win Future, 000(002); Music Time: Guizhou, China, 2018; p. 252. [Google Scholar]
  52. Mao, D.X.; Yu, W.Z.; Wang, Z.M. Data verification and criteria for paired-comparison subjective evaluation of sound quality. Acta Acust. 2005, 30, 469. [Google Scholar]
  53. Otto, N.; Amman, S.; Eaton, C.; Lake, S. Guidelines for jury evaluations of automotive sounds. SAE Trans. 1999, 108, 3015–3034. [Google Scholar] [CrossRef]
  54. Panton, L.; Holloway, D.; Cabrera, D. Effect of a chamber orchestra on direct sound and early reflections for performers on stage: A boundary element method study. J. Acoust. Soc. Am. 2017, 141, 2461–2472. [Google Scholar] [CrossRef]
Figure 1. Research Framework.
Buildings 16 00324 g001
Figure 2. Plan and model drawings of the acoustic simulation of the theater space and rectangular space in odeon9 software. Figure (a) shows the floor plan of the theater space, Figure (b) shows the model of the theater space, Figure (c) shows the floor plan of the rectangular space and Figure (d) shows the model of the rectangular space. The red dots are the sound source points and the blue dots are the sound reception points.
Buildings 16 00324 g002
Figure 3. Figure (a,b) show the variation zones of the ceiling and side wall scattering coefficients in the theater space. Figure (c,d) show the variation zones of the ceiling and side wall scattering coefficients in the rectangular space.
Buildings 16 00324 g003
Figure 4. The graph represents the scattering coefficient curves at a frequency of 707 Hz for five distinct states: 0.05, 0.1, 0.3, 0.6, and 0.9.
Buildings 16 00324 g004
Figure 5. Figure (a): Photo of a Morin khuur; Figure (b): Photo of a High-pitched sihu; Figure (c): Photo of an anechoic chamber; Figure (d): Photo of the recording environment.
Buildings 16 00324 g005
Figure 6. Subjective preference results of participants with varying levels of expertise under four scattering conditions at different interfaces and rhythms within the Rectangular space and Rectangular Space (MAX value is the highest mean value among the comparisons in this group).
Buildings 16 00324 g006
Figure 7. Medium-frequency LF80 values under different scattering coefficients.
Buildings 16 00324 g007
Figure 8. Medium-frequency IACCearly values under different scattering coefficients.
Buildings 16 00324 g008
Table 1. 16 binaural pulse diagrams under 2 spatial configurations, 2 interfaces, and 4 scattering coefficients.
TheaterRectangular
Buildings 16 00324 i001Buildings 16 00324 i002Buildings 16 00324 i003Buildings 16 00324 i004
Theater ceiling-0.1Theater side wall-0.1Rectangular ceiling-0.1Rectangular side wall-0.1
Buildings 16 00324 i005Buildings 16 00324 i006Buildings 16 00324 i007Buildings 16 00324 i008
Theater ceiling-0.3Theater side wall-0.3Rectangular ceiling-0.3Rectangular side wall-0.3
Buildings 16 00324 i009Buildings 16 00324 i010Buildings 16 00324 i011Buildings 16 00324 i012
Theater ceiling-0.6Theater side wall-0.6Rectangular ceiling-0.6Rectangular side wall-0.6
Buildings 16 00324 i013Buildings 16 00324 i014Buildings 16 00324 i015Buildings 16 00324 i016
Theater ceiling-0.9Theater side wall-0.9Rectangular ceiling-0.9Rectangular side wall-0.9
Table 2. Participant Information.
Grouping of CrowdMaleFemaleGrouping Criteria
Ordinary listeners1113No formal music training background
Vocal majors68Received professional vocal training for ≥2 years
Instrumental majors46Received professional training in musical instruments for ≥4 years
Research focus of the professional groupVocal majorsZhongruan\pipa\violin\piano\morin khuur
Instrumental majorsVocal Performance\Composition\Music Performance
Table 3. Summary of Optimal Scattering Coefficient Values Under Different Factors.
PaceCrowdInterfaceRhythmt-Test ChartScattering Coefficient Preferred Values
TheaterOrdinary person GroupCeilingBriskI0.1, 0.9
SoothingII0.1, 0.3, 0.6, 0.9
Side wallBriskIII0.3, 0.6
SoothingIV0.1, 0.3
Vocal GroupCeilingBriskV0.1, 0.3, 0.6
SoothingVI0.1, 0.6
Side wallBriskVII0.1, 0.3, 0.6
SoothingVIII0.3, 0.6
Instrumental GroupCeilingBriskIX0.3, 0.6
SoothingX0.6, 0.9
Side wallBriskXI0.6
SoothingXII0.6
RectangularOrdinary person GroupCeilingBriskXII0.1, 0.3, 0.6, 0.9
SoothingXIV0.1, 0.3
Side wallBriskXV0.1, 0.3, 0.6, 0.9
SoothingXVI0.1, 0.3
Vocal GroupCeilingBriskXVII0.1, 0.3
SoothingXVIII0.1, 0.6, 0.9
Side wallBriskXIX0.1, 0.3, 0.6
SoothingIIX0.3, 0.6
Instrumental GroupCeilingBriskIIXI0.6
SoothingIIXII0.6, 0.9
Side wallBriskIIXIII0.6
SoothingIIXIV0.6
Table 4. Spatially variable scattering coefficient subjective optimal values.
Spatial ChangeOptimal Order of Scattering Coefficient (Order)Preferred Frequency Distribution Chart
Theater0.6 (10) 0.3 (7) 0.1 (6) 0.9 (3)Buildings 16 00324 i017
Rectangular0.6 (9) 0.3 (7) 0.1 (7) 0.9 (4)
Table 5. Interface variable scattering coefficient subjective optimal values.
Interface ChangeOptimal Order of Scattering Coefficient (Order)Preferred Frequency Distribution Chart
Ceiling0.6 (9) 0.1 (8) 0.9 (6) 0.3 (6)Buildings 16 00324 i018
Side wall0.6 (10) 0.3 (8) 0.1 (5) 0.9 (1)
Table 6. Crowd variable scattering coefficient subjective optimal values.
Crowd ChangeOptimal Order of Scattering Coefficient (Order)Preferred Frequency Distribution Chart
Ordinary person Group0.1 (7) 0.3 (7) 0.6 (4) 0.9 (4)Buildings 16 00324 i019
Vocal Group0.6 (7) 0.1 (6) 0.3 (6) 0.9 (1)
Instrumental Group0.6 (8) 0.9 (2) 0.3 (1) 0.1 (0)
Table 7. Rhythm variable scattering coefficient subjective optimal values.
Rhythm ChangeOptimal Order of Scattering Coefficient (Order)Preferred Frequency Distribution Chart
Brisk0.6 (10) 0.3 (8) 0.1 (7) 0.9 (3)Buildings 16 00324 i020
Soothing0.6 (9) 0.3 (6) 0.1 (6) 0.9 (4)
Disclaimer/Publisher’s Note: The statements, opinions and data contained in all publications are solely those of the individual author(s) and contributor(s) and not of MDPI and/or the editor(s). MDPI and/or the editor(s) disclaim responsibility for any injury to people or property resulting from any ideas, methods, instructions or products referred to in the content.