1. Introduction
The construction sector supports economic growth by providing housing and infrastructure, but it also creates substantial environmental pressures through resource use, energy consumption, emissions, and waste generation. Sustainable construction aims to reduce these impacts while creating economic and social value throughout the building life cycle. It therefore extends beyond the selection of environmentally appropriate materials to include energy efficiency, water management, waste minimization, renewable energy use, and improved life-cycle performance. These dimensions are commonly interpreted through the Triple Bottom Line (TBL), which considers environmental, economic, and social performance [
1,
2].
Despite its importance, sustainable construction adoption is constrained by financial, institutional, human, and technological factors [
3,
4,
5,
6,
7]. Common barriers in developing economies include high costs, limited incentives, weak policy implementation, low awareness, and insufficient local expertise. Limited knowledge and practical capacity can impede the translation of sustainability concepts into project-level action, whereas access to suitable technologies and technical expertise can facilitate adoption [
6,
8]. Financial constraints also remain prominent because initial costs often influence project decisions [
5,
7].
Financial conditions can act as both constraints and enablers. High costs and limited budgets may impede adoption, whereas incentives, subsidies, green finance, and perceived benefits of green technologies may encourage it. Financial Barriers and Economic Support are therefore modeled as conceptually distinct mechanisms rather than as a single financial dimension. Regulatory conditions are also relevant, but their practical influence depends partly on the presence of trained personnel, implementation capacity, and professional expertise [
5,
7,
8].
Technological Readiness refers to an organization’s access to appropriate technologies, equipment, and technical skills, together with its capacity to implement energy, water, waste, and resource-management measures [
9]. In developing economies, adoption may be constrained by limited technical capabilities, infrastructure, finance, and institutional support. Jordan is a particularly relevant context because severe water and energy constraints coexist with uneven implementation of sustainable construction practices. Previous Jordanian studies have identified financial constraints [
10], low awareness and limited technical expertise [
11], weak stakeholder coordination [
12], limited monetary and non-monetary incentives [
13], and ineffective regulation [
14].
While previous Jordanian studies provide valuable evidence, most have focused on identifying or ranking barriers. Less attention has been given to whether the barriers most frequently reported by practitioners are also those most strongly associated with adoption when financial, regulatory, human, and technological dimensions are considered simultaneously. Previous research has not consistently distinguished financial barriers from economic support or linked adoption determinants to perceived sustainability value within a single explanatory model for Jordan [
15]. To address this gap, the present study employs the TOE framework as its primary organizing framework, supported by institutional theory, the Resource-Based View (RBV), and Triple Bottom Line (TBL) concepts [
1,
16,
17,
18].
The paper investigates the associations of financial barriers, economic support, regulatory support, human capacity, and technological readiness with the adoption of sustainable construction practices. It also assesses the association between reported adoption and Perceived Sustainability Value. Stakeholder type is examined exploratorily to identify possible patterns or differences among contractors, consultants, developers, and other construction professionals.
The contributions of this study are threefold. First, it applies the TOE framework to sustainable construction adoption in Jordan through an integrated model of technological, organizational, and environmental factors. Second, it models Financial Barriers and Economic Support as theoretically distinct mechanisms: financial barriers may constrain adoption, whereas economic support may facilitate it. Third, it distinguishes between barriers perceived as important by practitioners and organizational capabilities statistically associated with adoption when the determinants are considered simultaneously. Because the data are cross-sectional and perception-based, all relationships are interpreted as associations rather than causal effects; empirical distinctness among the modeled constructs is also interpreted in light of the discriminant-validity results.
3. Methodology
3.1. Hypotheses Development
This section develops the research hypotheses based on the proposed conceptual model, the TOE framework, and previous studies of sustainable construction adoption.
The model treats the adoption of sustainable construction practices as a process associated with financial, economic, regulatory, human, and technological factors and then examines whether adoption is positively associated with Perceived Sustainability Value.
3.1.1. Financial Barriers and Sustainable Construction Practices
Financial barriers are among the most frequently cited obstacles in the literature on sustainable construction. They relate to the initial cost of sustainable materials, limited budgets, and the perception of cost as a deterrent to adoption.
Darko and Chan [
3] showed that high costs, limited incentives, and weak market demand were among the most common barriers to green building adoption. Hwang et al. [
6] found that small contractors were particularly affected by additional costs and long payback periods. Similarly, Eze et al. [
7] identified cost and market barriers as important obstacles to the adoption of sustainable building materials.
In Jordan, Zeadat [
13] identified financial barriers as important constraints on the implementation of sustainable construction practices. These findings suggest that financial barriers may limit stakeholders’ ability to adopt sustainable practices. Therefore, the following hypothesis is proposed:
H1. Financial barriers are negatively associated with the adoption of sustainable construction practices.
3.1.2. Economic Support and Sustainable Construction Practices
Economic Support includes conditions that may make sustainable-practice adoption easier, such as financial incentives, subsidies, green loans, and positive perceptions of investment in green technology. It is conceptually distinguished from Financial Barriers because barriers constrain adoption, whereas economic support may reduce perceived risk and make sustainable solutions more attractive.
Darko et al. [
5] showed that promotional strategies and economic incentives could facilitate green-technology adoption in developing countries, while Hwang et al. [
6] identified lack of incentives as a major barrier for small contractors.
Thus, the following hypothesis is stated:
H2. Economic support is positively associated with the adoption of sustainable construction practices.
3.1.3. Regulatory Support and Sustainable Construction Practices
Regulatory support refers to clarity of regulations, government support, effectiveness of rule enforcement, and sustainability standards. The dimension is related to the environmental perspective of the TOE framework.
Previous studies supported this relationship. Darko et al. [
5] found that weak government support could hinder green-technology adoption, whereas regulations and incentives could facilitate it. In Jordan, Aljboor et al. [
12] showed that sustainability in road projects required an appropriate legislative framework, and Badran et al. [
14] identified limited regulations, standards, and incentives as barriers to off-site construction.
Clear regulatory support can therefore reduce uncertainty. It can also create favorable pressure for the adoption of sustainable practices. Thus, the following hypothesis is proposed:
H3. Regulatory support is positively associated with the adoption of sustainable construction practices.
3.1.4. Human Capacity and Sustainable Construction Practices
Human capacity encompasses training, the availability of skilled professionals, internal communication, and continuous learning. It represents an important organizational resource.
The Resource-Based View provides a theoretical basis for this relationship. Barney [
18] argued that valuable internal resources can contribute to organizational performance and competitive advantage. In sustainable construction, skills, training, communication, and technical expertise represent resources that can support implementation.
Durdyev et al. [
4] showed that insufficient awareness and knowledge hindered sustainable construction adoption in a developing-country context. Mogaji et al. [
8] identified lack of expertise and experience as barriers to adopting innovative building materials. In Jordan, Jaradat et al. [
10] found that awareness did not always translate into practice, while Zeadat [
13] also emphasized knowledge-related constraints.
Thus, the following hypothesis is proposed:
H4. Human capacity is positively associated with the adoption of sustainable construction practices.
3.1.5. Technological Readiness and Sustainable Construction Practices
Technological readiness refers to an organization’s capacity to use innovative technologies, equipment, and solutions that promote sustainability. This corresponds to the technological dimension of the TOE framework.
Durdyev et al. [
4] showed that resistance to new technologies limited sustainable construction adoption. Oke et al. [
9] likewise found that technical, economic, regulatory, and organizational barriers hindered the adoption of digital technologies for sustainable construction.
Thus, the following hypothesis is proposed:
H5. Technological readiness is positively associated with the adoption of sustainable construction practices.
3.1.6. Sustainable Construction Practices and Perceived Sustainability Value
The adoption of sustainable construction practices may be associated with perceived environmental, economic, and social value, including environmental-goal achievement and project efficiency. This relationship is interpreted through the TBL concept [
1,
2]. Client demand is retained as a market-related value item rather than treated as a verified project outcome.
In this study, sustainable practices include water management, renewable energy use, on-site waste recycling, and environmentally preferable materials. Their adoption is therefore expected to be positively associated with Perceived Sustainability Value.
Thus, the following hypothesis is proposed:
H6. The adoption of sustainable construction practices is positively associated with perceived sustainability value.
3.1.7. Stakeholder Type and Differences in Adoption Relationships
Perceptions of sustainable construction can vary among different stakeholder categories. Contractors, consultants, developers, and other professionals do not occupy the same roles in projects. Consequently, they do not face the same constraints.
Elnaklah et al. [
15] showed that perceptions of sustainable construction barriers varied among stakeholder groups in the Middle East. Hwang et al. [
6] also showed that some business types, particularly small contractors, faced specific implementation constraints.
Stakeholder type is therefore used as the basis for exploratory multi-group analysis to examine whether the model’s structural relationships differ across stakeholder categories.
Accordingly, the following exploratory research question is examined:
RQ1. Do the structural relationships differ across stakeholder groups?
Finally,
Table 1 summarizes the hypotheses and the exploratory research question.
3.2. Measurement Instrument and Construct Operationalization
The questionnaire was originally developed as a broad practitioner survey of barriers, enabling conditions, reported sustainable practices, and perceived sustainability-related value in the Jordanian construction sector, and it was administered before the present PLS-SEM model was specified. The present analysis is therefore a retrospective, theory-guided reanalysis rather than a prospective validation of a newly designed TOE scale.
The instrument was informed by previous studies of sustainable construction adoption and adapted to the Jordanian context [
3,
4,
7,
10,
13,
14,
15]. It captures financial, economic, regulatory, human, and technological conditions, reported sustainable practices, and Perceived Sustainability Value. The questionnaire was administered bilingually in Arabic and English. The available study records do not document a formal independent-expert content-validity exercise, pilot test statistics, or a formal translation/back-translation protocol; this limitation is stated explicitly rather than reconstructed retrospectively.
All items were measured on a five-point Likert scale ranging from 1 (strongly disagree) to 5 (strongly agree). This scale was used to capture the degree of agreement with statements concerning organizational conditions, implementation practices, and perceived outcomes.
To distinguish the original questionnaire numbering from the variables used in the PLS-SEM model, items were recoded by construct: FB for Financial Barriers, ES for Economic Support, RS for Regulatory Support, HC for Human Capacity, TR for Technological Readiness, SCP for Sustainable Construction Practices, and PSV for Perceived Sustainability Value. The initial mapping of the questionnaire items to the theoretical constructs was conducted jointly by A.Y. and F.A. based on the TOE framework and relevant literature. The remaining co-authors subsequently reviewed the proposed mapping, and any discrepancies or concerns were discussed and resolved by consensus before the PLS-SEM analysis.
The coding scheme ensures consistency among the questionnaire, conceptual model, hypotheses, and statistical analysis. Financial Barriers capture high costs, budget limitations, and cost-related concerns. Economic Support captures incentives and the perceived benefits of investment in green technologies. Regulatory Support covers regulatory clarity, government support, enforcement, and standards. Human Capacity includes training, skilled personnel, internal communication, and continuous learning. Technological Readiness includes access to modern technologies, innovation, equipment, and technical expertise. Sustainable Construction Practices reflect the reported integration of water management, renewable energy, on-site recycling, and environmentally preferable materials. Perceived Sustainability Value captures perceived environmental achievement, efficiency, and market-related value.
Table 2 summarizes the operationalization of the constructs.
Respondent profile variables were analyzed separately. Organization type was used to describe and compare contractors, consultants, developers, and other stakeholders and to support the exploratory multi-group analysis. Company size and years of experience were used as contextual variables.
The questionnaire also contained supplementary items addressing lack of awareness, regulation, and expertise. These items were not specified as separate latent constructs because they overlap conceptually with Human Capacity, Technological Readiness, and Regulatory Support.
The supplementary items were therefore used only in the descriptive and qualitative analyses. This allowed the study to report the barriers most frequently perceived by respondents without duplicating the constructs included in the structural model.
Perceived Sustainability Value is interpreted as perception-based sustainability value rather than as verified project performance. The environmental-goal and efficiency items reflect perceived project-level benefits, while the client-demand item captures a related market-value dimension. This distinction is maintained throughout the interpretation of the results.
This operationalization establishes a consistent link among the instrument, conceptual model, and hypotheses while distinguishing the latent constructs from profile variables and supplementary descriptive items. It is also consistent with prior questionnaire-based studies of sustainable construction adoption [
4,
5,
10,
13].
3.3. Research Design
A quantitative cross-sectional research design was used to evaluate a theoretical model containing multiple latent constructs and hypothesized relationships related to sustainable construction adoption in Jordan.
The study followed a deductive, hypothesis-based strategy. The hypotheses were derived from the sustainable construction literature and the TOE framework, with institutional theory, RBV, and TBL used to support interpretation of specific constructs and relationships.
A cross-sectional survey design was adopted. Data were collected once from professionals working in the Jordanian construction industry. This design is appropriate for examining contemporaneous perceptions and reported practices, but it does not establish temporal order or causality.
The design enables simultaneous assessment of the associations of Financial Barriers, Economic Support, Regulatory Support, Human Capacity, and Technological Readiness with sustainable construction adoption, together with the association between adoption and Perceived Sustainability Value.
3.4. Population, Recruitment, Screening, and Statistical Power
The target population comprised professionals involved in the Jordanian construction industry, including contractors, consultants, developers, and other participants engaged in construction projects.
These stakeholder categories were included because they perform different functions across the project life cycle. Contractors are primarily involved in implementation, consultants in design and supervision, and developers in investment and development decisions. Their inclusion provides a range of professional perspectives on sustainable construction adoption.
The final dataset comprised 192 usable responses. This sample supported the descriptive and explanatory objectives of the PLS-SEM model, which included several latent constructs measured by multiple indicators [
24]. Because the study used a non-probability professional sample recruited through network-based and snowball procedures, the findings are interpreted as evidence from the participating respondents rather than as statistically representative estimates for the entire Jordanian construction sector.
All 27 closed Likert items were complete for the 192 usable cases, so no item-level imputation was required. A post-hoc screen found no exact duplicate records across the respondent-profile variables and the closed survey items. For stakeholder analysis, the Arabic response “مكتب هندسي” (engineering office) was classified as Consultant, giving Contractor (n = 85), Consultant (n = 53), Developer (n = 45), and Other (n = 9); the Other group was excluded from separate group models because of its small size.
An a priori power analysis for the most complex endogenous regression (five predictors; α = 0.05, power = 0.80, f2 = 0.15) indicated a minimum sample of 92. The available sample (N = 192) exceeded this benchmark. Statistical power does not imply representativeness because the professional sample is non-probability based.
Organization type, firm size, and years of professional experience were collected to describe the sample and support the interpretation of the exploratory group comparisons.
3.5. Data Collection Instrument
Data were collected using the bilingual structured questionnaire described in
Section 2. The instrument had been developed and administered before the present PLS-SEM specification; existing items were therefore recoded and aligned with the latent constructs for this retrospective theory-guided analysis.
The questionnaire contained four main components. The first recorded respondent and organizational characteristics, including organization type, firm size, and years of experience. The survey was distributed online in second half of 2026 to professionals involved in construction projects in Jordan and able to evaluate sustainable construction practices. Recruitment was initiated through the professional network of a coauthor with academic and professional experience in Jordan (A.Y.), including personal and family contacts working in the construction sector. The questionnaire link was initially shared via WhatsApp with eligible professionals and was then extended through snowball recruitment as participants shared it with other relevant professionals. The available study records do not provide a verifiable number of invitations distributed or a pre-screening response count, so a response rate is not reported. The second component measured financial, economic, regulatory, human, and technological conditions associated with adoption. The third measured reported Sustainable Construction Practices, including water management, renewable energy, on-site recycling, and environmentally preferable materials. The fourth measured Perceived Sustainability Value through environmental-goal achievement, project efficiency, and client demand for sustainable solutions.
The questionnaire also included an open-ended question asking respondents to identify the main challenges affecting sustainable construction in Jordan. These responses were not included in the PLS-SEM model but were used to contextualize the quantitative findings. All closed items were measured on a five-point Likert scale from 1 (strongly disagree) to 5 (strongly agree).
3.6. Measurement of Constructs
The questionnaire items were recoded and mapped to the latent variables of the proposed PLS-SEM model. The coding scheme described in
Table 2 was used to maintain consistency among the instrument, conceptual model, and statistical analysis.
The Financial Barriers were measured using items concerning the high cost of sustainable materials, budget constraints, and the perception of cost as a major obstacle. Economic Support was measured through items concerning financial incentives and the perceived benefits of investing in green technologies. Regulatory Support covered regulatory clarity, government support, enforcement, and the availability of sustainability standards.
Human Capacity was measured through employee training, the availability of skilled professionals, internal communication, and continuous professional development. Technological Readiness covered modern technologies, innovation, appropriate equipment, and technical expertise. Sustainable Construction Practices were measured through water management, renewable energy use, on-site waste recycling, and the use of environmentally preferable materials.
Perceived Sustainability Value was measured through respondents’ perceptions of environmental-goal achievement, project efficiency, and client demand for sustainable solutions. Because PSV3 represents a market-related dimension rather than verified project performance, it is retained in the primary three-item specification but interpreted cautiously. A sensitivity analysis excluding PSV3 was conducted to examine whether its inclusion materially affected reliability, validity, and the SCP → PSV path (
Section 4;
Supplementary Table S4).
Items concerning lack of awareness, regulation, and expertise were retained for descriptive and qualitative interpretation but were not modeled as separate latent constructs because of their conceptual overlap with Human Capacity, Technological Readiness, and Regulatory Support.
3.7. Data Analysis Strategy
The analysis proceeded in four stages. First, descriptive statistics were used to summarize respondent characteristics, including organization type, company size, and years of experience, and to report the means and standard deviations of the principal constructs.
Second, the measurement model was assessed using individual indicator loadings, Cronbach’s α, Dijkstra-Henseler’s rho_A, composite reliability (rho_C), average variance extracted (AVE), the Fornell-Larcker criterion, and HTMT [
24,
25,
26,
27]. Mode A PLS estimation with a path-weighting scheme was used. Individual loadings and HTMT statistics were bootstrapped using 5000 nonparametric resamples, with 95% percentile confidence intervals reported in the
Supplementary Material.
Third, the structural model was assessed using predictor VIFs, standardized path coefficients, 5000-resample bootstrap inference, R
2, adjusted R
2, and f
2 [
24]. Sensitivity analyses re-estimated the model after removing PSV3 and, separately, after removing the lowest-loading RS1 and TR1 indicators.
Finally, stakeholder comparisons were treated as exploratory. Measurement invariance was assessed using the MICOM procedure before group-path comparison. Group-specific paths were estimated for contractors, consultants, and developers, and pairwise coefficient differences were evaluated using 5000-permutation tests. The Other group was excluded because n = 9.
3.8. Common Method Bias
Because all principal variables were collected through the same self-reported questionnaire, the study was potentially exposed to common method bias, whereby observed associations may partly reflect the measurement procedure rather than the constructs themselves.
Procedural precautions included assuring respondents of confidentiality and using clearly worded questions intended to reduce ambiguity and automatic response patterns.
Harman’s one-factor diagnostic was reproduced using an unrotated principal-components extraction of the 24 modeled indicators; the first component explained 28.1% of total variance. The predictor VIFs reported for the structural model (1.52–1.90) are structural-collinearity diagnostics, not a common-method test. A separate full-collinearity assessment regressed each construct score on all remaining construct scores; VIFs ranged from 1.63 to 2.06, below 3.3. No marker variable was included in the original questionnaire. These diagnostics reduce, but do not eliminate, concern about common method bias, particularly for the SCP–PSV association.
3.9. Ethical Considerations
Participation was voluntary, respondents were informed of the study purpose before completing the questionnaire, and responses were analyzed confidentially and in aggregate. No directly identifying personal information is reported. In accordance with the institutional procedures of the American University of the Middle East (AUM), the survey was reviewed and approved under Survey Application No. SV-02-2025-2026, titled “Sustainable Construction Practices in Jordan.” All authors are currently institutionally affiliated with the American University of the Middle East in Kuwait; however, some authors are Jordanian, and the empirical setting and survey respondents are from the Jordanian construction sector. This distinction is disclosed for transparency.
4. Results
4.1. Respondents’ Profile
The final sample comprised 192 respondents from several categories of the Jordanian construction industry. Contractors were the largest group, with 85 respondents (44.3%), followed by consultants (53; 27.6%), developers (45; 23.4%), and other respondents (9; 4.7%).
Medium-sized companies were the most common, comprising 64 respondents (33.3%). Small firms represented 26.6% of the sample, micro-companies 20.3%, and large companies 19.8%.
Regarding professional experience, 38.0% of respondents had less than 5 years of experience, 30.7% had 5–10 years, and 31.3% had more than 10 years.
4.2. Descriptive Statistics
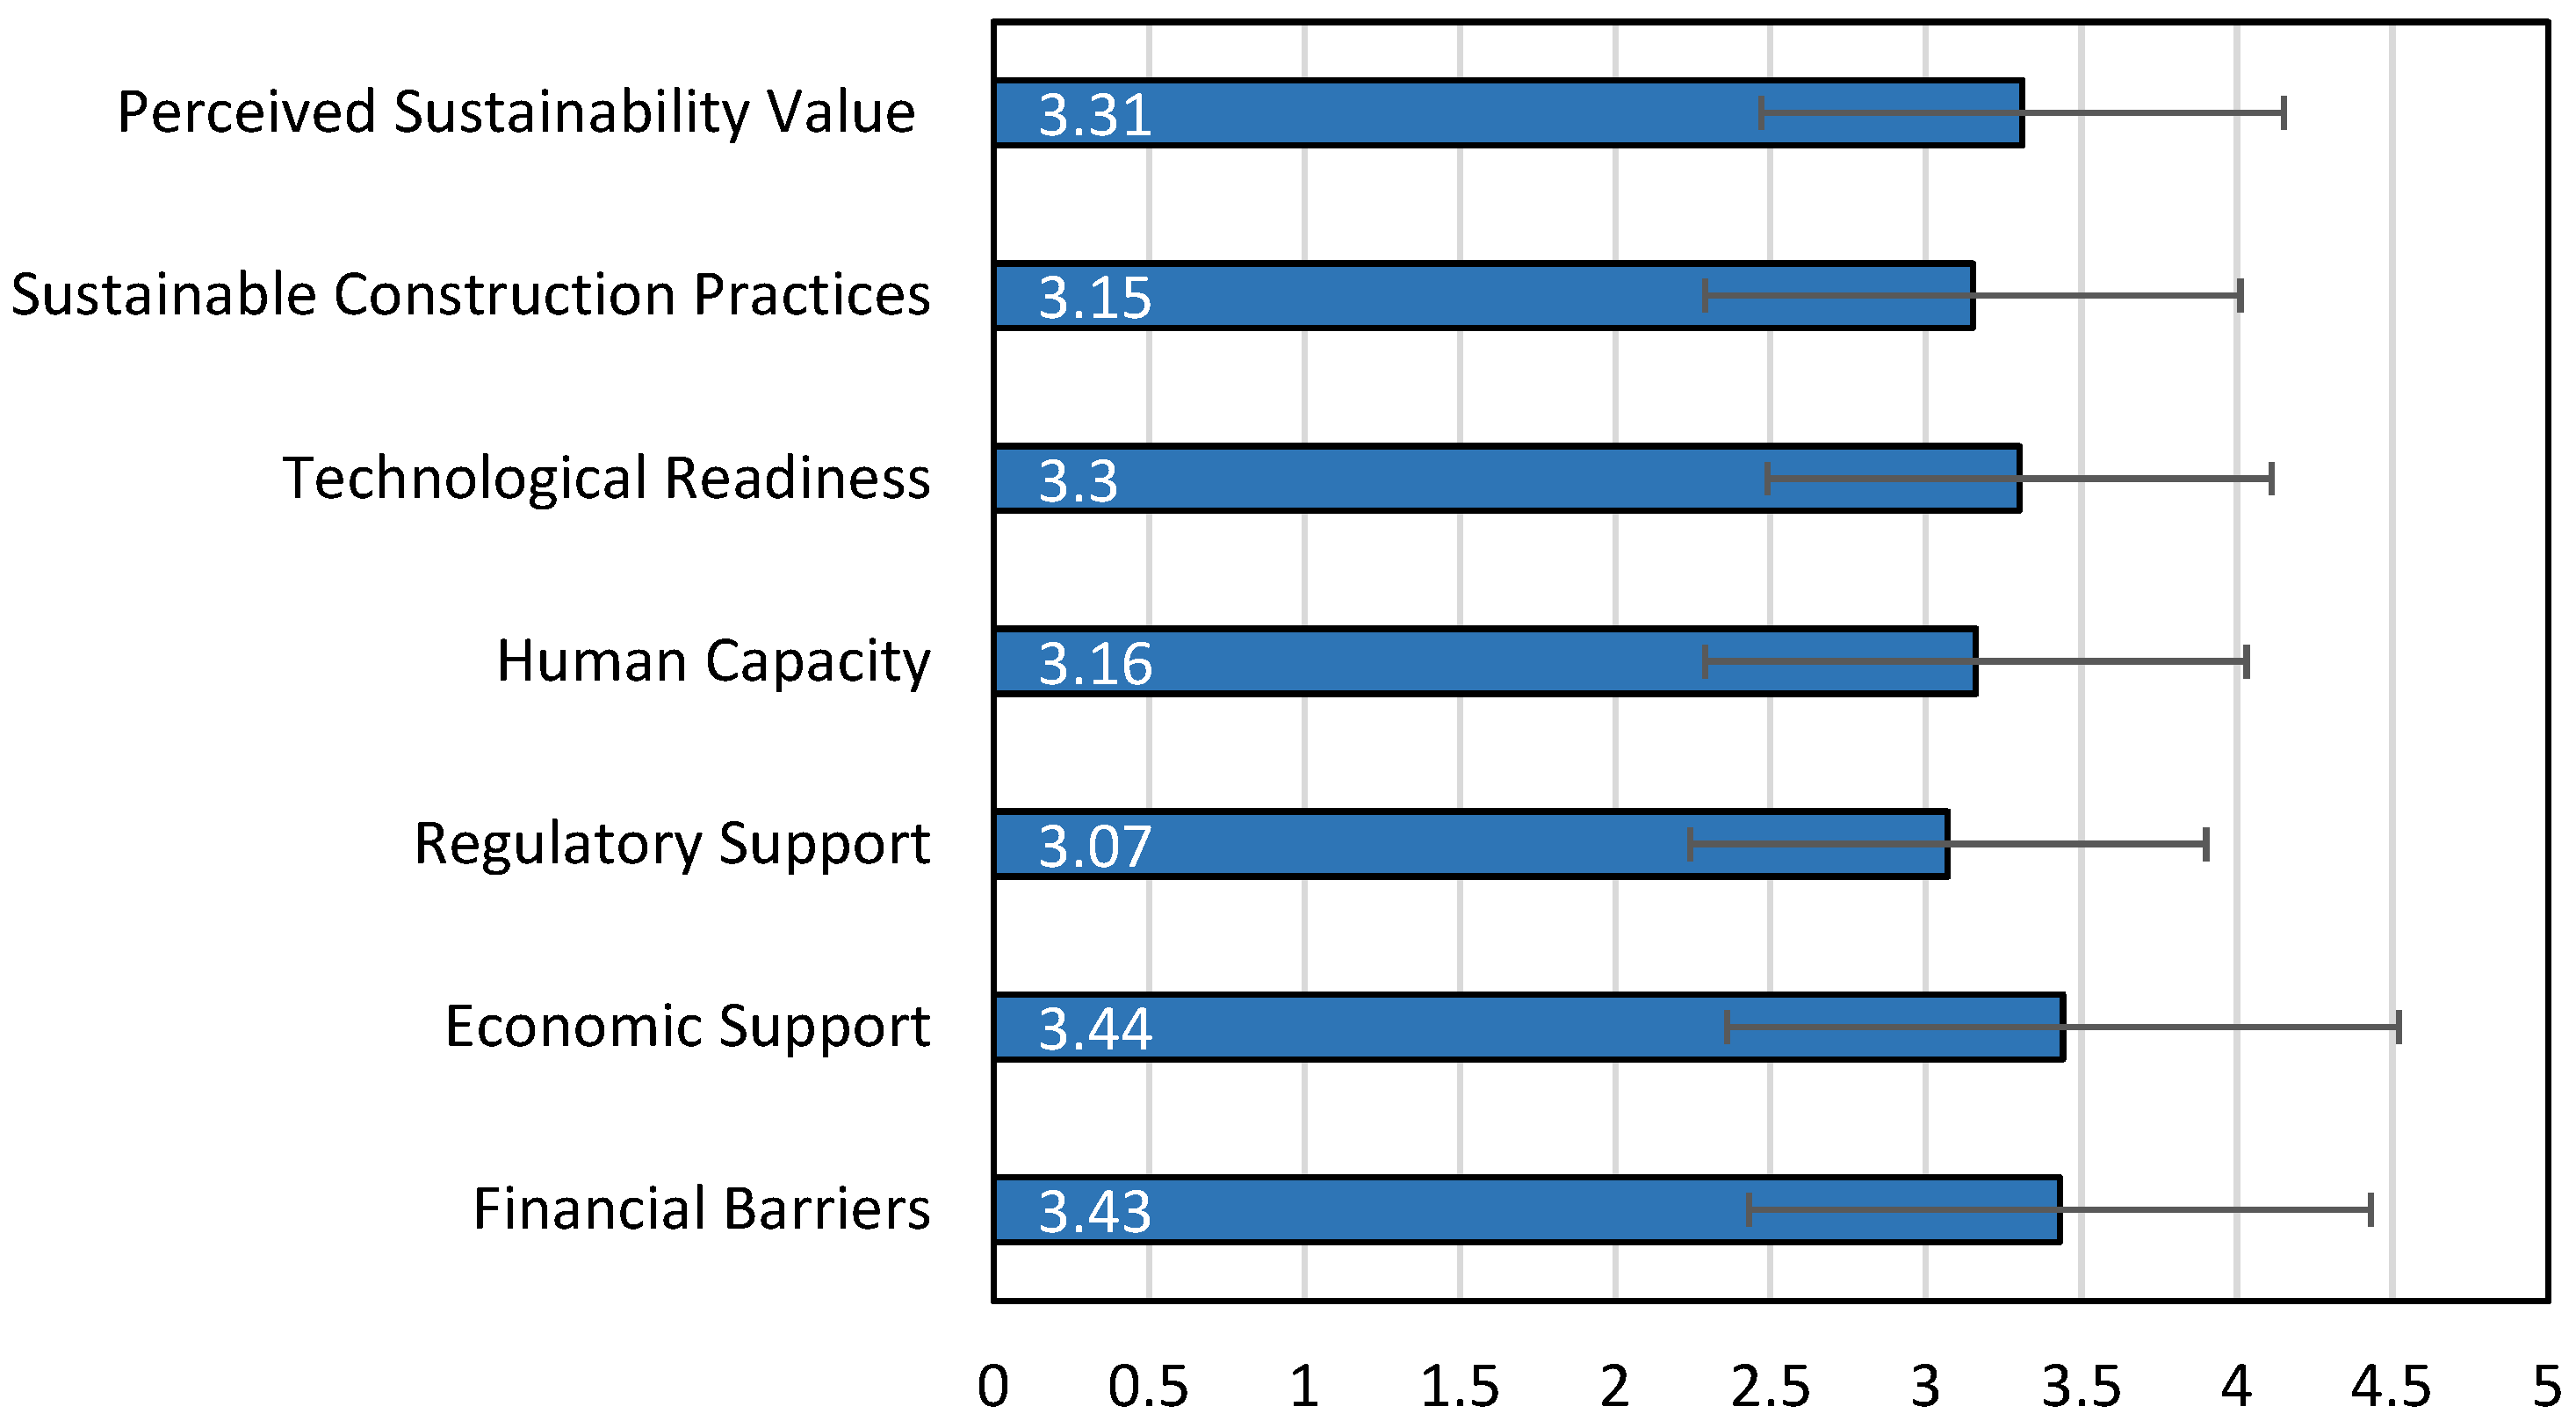
The descriptive statistics shown in
Figure 1 indicated that construct means were generally close to the midpoint of the five-point scale, suggesting moderate levels of both perceived constraints and reported adoption conditions.
Economic Support had the highest mean score (3.44), indicating moderate agreement regarding the value of incentives and green investment. Financial Barriers had a similar mean (3.43), showing that cost-related concerns remained prominent among respondents.
Perceived Sustainability Value had a mean of 3.31, followed by Technological Readiness at 3.30. Human Capacity and Sustainable Construction Practices had means of 3.16 and 3.15, respectively, while Regulatory Support had the lowest mean (3.07).
As shown in
Table 3, lack of awareness was the highest-ranked supplementary barrier (mean = 3.63), followed by lack of expertise (3.59) and lack of regulation (3.45). These descriptive results indicate that human and institutional constraints remained salient to respondents.
4.3. Measurement Model Assessment
The measurement model was assessed for indicator reliability, internal consistency, convergent validity, and discriminant validity. Indicator loadings were generally acceptable, although several constructs showed marginal values, as reported in
Table 4.
Composite reliability exceeded 0.70 for all constructs. AVE exceeded 0.50 for most constructs, while Regulatory Support (AVE = 0.489) and Technological Readiness (AVE = 0.459) were marginal. The theoretically specified main model was retained, and the sensitivity analysis removing RS1 and TR1 increased AVE to 0.582 and 0.537, respectively. The substantive support decisions for H2–H6 were unchanged; the Financial Barriers coefficient became positive and statistically significant in that sensitivity model but remained opposite to the negative direction hypothesized in H1 (
Supplementary Table S4). For PSV, removing PSV3 increased AVE from 0.507 to 0.619 but reduced Cronbach’s alpha from 0.518 to 0.387; the SCP → PSV path remained positive and statistically significant (β = 0.453,
p < 0.001). The three-item primary specification was therefore retained because it preserves the full outcome content of the administered instrument and its theory-guided mapping, while the sensitivity analysis showed that deleting PSV3 did not provide an unambiguous reliability improvement. The construct is interpreted cautiously.
Individual loadings with bootstrap confidence intervals, rho_A, the Fornell-Larcker matrix, the complete HTMT matrix, and bootstrapped HTMT confidence intervals are provided in
Supplementary Tables S2 and S3.
Cronbach’s alpha exceeded 0.70 for Human Capacity and Sustainable Construction Practices, while several other constructs were slightly below 0.70. Given the acceptable composite reliability values and the limited number of indicators for some constructs, particularly the two-item Economic Support construct, the measures were considered usable for the exploratory PLS-SEM analysis, although the marginal values are acknowledged.
Discriminant validity was assessed using HTMT. The highest point estimates were observed between Sustainable Construction Practices and Perceived Sustainability Value (HTMT = 0.897; 95% bootstrap CI = 0.727–1.146) and between Financial Barriers and Economic Support (HTMT = 0.885; 95% CI = 0.683–1.105). Although most HTMT point estimates were below 0.90, bootstrapped 95% confidence intervals included 1.0 for FB–ES, FB–PSV, RS–HC, RS–TR, RS–PSV, HC–TR, HC–PSV, TR–SCP, TR–PSV, and SCP–PSV (
Supplementary Table S3c). Discriminant validity was therefore not unequivocally established for these construct pairs. The constructs were retained because they represent theoretically distinct dimensions and the sensitivity analyses did not identify a clearly superior alternative specification; however, structural coefficients involving these overlapping constructs are interpreted cautiously. In particular, the distinction between Financial Barriers and Economic Support should be understood as a theoretical distinction rather than unequivocal empirical separation in this sample, and the SCP–PSV path should not be interpreted as objective project-performance evidence.
4.4. Structural Model Assessment
Structural predictor VIF values ranged from 1.52 to 1.90, indicating no serious collinearity concern. As shown in
Table 5, the revised Mode A PLS model explained 44.5% of the variance in Sustainable Construction Practices (adjusted R
2 = 0.430) and 31.7% of the variance in Perceived Sustainability Value (adjusted R
2 = 0.313).
4.5. Hypothesis Testing
Hypotheses were tested using standardized path coefficients. As shown in
Table 6, Human Capacity and Technological Readiness were the two statistically significant predictors of Sustainable Construction Practices.
Human Capacity was positively associated with Sustainable Construction Practices (β = 0.273, p = 0.001); therefore, H4 was supported. Respondents reporting stronger training, skills, internal communication, and continuous learning also reported higher adoption of sustainable practices.
Technological Readiness was positively associated with Sustainable Construction Practices (β = 0.300, p = 0.002); therefore, H5 was supported. Access to appropriate technologies, equipment, innovation, and technical expertise was associated with higher reported adoption.
Financial Barriers were not significantly associated with adoption (β = 0.159, p = 0.062); therefore, H1 was not supported. Although a negative relationship had been expected, the coefficient was positive and non-significant in the main model. Accordingly, cost remained a salient perceived barrier but did not independently distinguish adoption levels once the other constructs were included.
Economic Support was not significantly associated with adoption (β = −0.046, p = 0.575); therefore, H2 was not supported. Within the tested model, perceived incentives and investment benefits did not distinguish reported adoption levels.
Regulatory Support had a positive but statistically non-significant association with adoption (β = 0.156, p = 0.094); therefore, H3 was not supported. The positive direction suggests that regulatory support may remain contextually relevant, but the present sample does not provide sufficient evidence of a direct association.
Sustainable Construction Practices were positively associated with Perceived Sustainability Value (β = 0.563, p < 0.001); therefore, H6 was supported. Respondents reporting higher adoption also reported stronger perceived sustainability-related value.
4.6. Exploratory Multi-Group Analysis
MICOM was assessed before stakeholder path comparisons. Configural invariance was satisfied because identical indicators, coding, data treatment, and model specification were used across groups. MICOM Step 2 compositional invariance was supported for every construct in all three pairwise comparisons (
Supplementary Table S5), establishing partial measurement invariance for exploratory path comparison.
Table 7 reports all group-specific path coefficients, 95% bootstrap confidence intervals, and
p-values for Contractors (
n = 85), Consultants (
n = 53), and Developers (
n = 45). The SCP → PSV path was positive and significant in each group, whereas other path patterns varied and confidence intervals were wide because of the smaller group samples.
Pairwise 5000-permutation tests found no statistically significant difference between corresponding structural paths across Contractor–Consultant, Contractor–Developer, or Consultant–Developer comparisons (all
p > 0.05;
Supplementary Table S5).
RQ1 therefore yields no evidence that the structural relationships differ statistically across the three stakeholder groups in this sample; the observed group patterns are interpreted descriptively only.
The group-specific R2 values for SCP were 0.489, 0.474, and 0.584 for contractors, consultants, and developers, respectively; corresponding R2 values for PSV were 0.433, 0.269, and 0.325. These within-group estimates do not imply statistically significant between-group differences.
4.7. Qualitative Analysis of Open-Ended Responses
The open-ended question was used to contextualize the quantitative findings (
Table 8). A total of 170 respondents (88.5% of the sample) provided an answer. The thematic coding followed a mixed deductive–inductive approach: initial categories were informed by the literature and the survey structure and were then refined as the responses were reviewed. All authors contributed to the thematic coding and subsequently reviewed the resulting categories. Any coding differences were discussed and resolved by consensus. No formal inter-coder reliability statistic was calculated; accordingly, the analysis is presented as descriptive contextual evidence rather than as a formal qualitative study. The most frequent theme was high initial cost and financial constraints (48 responses).
Low awareness and market culture were identified in 42 responses. Lack of expertise and training was mentioned 35 times, consistent with the importance of Human Capacity in the structural model. Limited availability of materials, technologies, or suppliers was also mentioned 35 times, supporting the relevance of Technological Readiness. Weak regulation or monitoring was identified in 26 responses, while water, energy, and environmental resource constraints formed a further theme. Illustrative anonymized responses included “ارتفاع تكلفة المواد المستدامة” (“high cost of sustainable materials”), “قلة الوعي والحوافز والكفاءات” (“lack of awareness, incentives, and competencies”), “محدوديه توفير المواد المستدامة محلياً” (“limited local availability of sustainable materials”), and “ضعف تطبيق القوانين” (“weak enforcement of regulations”).
The qualitative findings show that financial limitations, awareness, expertise, technology availability, and regulation remained highly salient to respondents. At the same time, the structural model identified Human Capacity and Technological Readiness as the factors most strongly associated with adoption. This contrast between perceived barrier salience and statistical association is central to the interpretation of the study.
5. Discussion
5.1. Discussion of Main Findings
The results indicated that Human Capacity and Technological Readiness were positively and statistically associated with the adoption of Sustainable Construction Practices in Jordan, whereas Financial Barriers, Economic Support, and Regulatory Support were not significantly associated with adoption in the full model. Adoption was also positively associated with Perceived Sustainability Value. These findings are interpreted as relationships among reported perceptions and practices rather than as causal effects.
Human Capacity reflects training, expertise, internal communication, and continuous learning. Its positive association with adoption indicates that awareness alone may be insufficient: organizations also require personnel with the practical knowledge and skills needed to translate sustainability principles into project-level practices.
This result is consistent with RBV, which emphasizes the strategic importance of internal organizational resources [
18]. In the present context, trained staff and effective internal learning appear to support the implementation of water management, renewable energy, on-site recycling, and environmentally preferable materials.
Technological Readiness was also positively associated with adoption. Access to suitable technologies, equipment, innovation, and technical expertise appears to strengthen an organization’s capacity to implement sustainable practices and to translate sustainability intentions into action.
This finding supports the technological dimension of the TOE framework, under which the availability and suitability of technology influence organizational innovation adoption [
16]. Construction organizations may recognize the value of sustainability but remain unable to implement it when appropriate tools, equipment, and technical competencies are unavailable.
The positive association between Sustainable Construction Practices and Perceived Sustainability Value supported H6. Respondents who reported greater use of sustainable practices also reported higher Perceived Sustainability Value; however, the measurement-overlap evidence requires cautious interpretation.
This result is consistent with TBL principles, which frame sustainability in environmental, economic, and social terms [
1,
2]. Because PSV is self-reported, includes a market-related item, and does not show unequivocal discriminant validity with several constructs, the association should not be interpreted as verified project performance.
The findings for Financial Barriers require a more nuanced interpretation. Cost was prominent in the descriptive statistics and open-ended responses, but Financial Barriers were not significantly associated with adoption in the structural model; therefore, H1 was not supported.
This contrast suggests a distinction between barrier salience and adoption-related capacity. Respondents may regard cost as an important general constraint, while differences in reported implementation are more closely associated with human and technological capabilities when the determinants are considered simultaneously.
Economic Support was not significantly associated with adoption; therefore, H2 was not supported. This finding may indicate that available incentives or perceived investment benefits were not sufficiently visible, accessible, or influential to distinguish adoption levels in the participating organizations. This interpretation remains tentative.
Regulatory Support had a positive but non-significant association with adoption, and H3 was not supported. Regulations may remain relevant as contextual conditions, but the present results do not establish a statistically significant direct association after the other predictors are considered.
The multi-group analysis did not identify statistically significant differences between stakeholder types, and RQ1 did not identify significant between-group differences. The observed contractor, consultant, and developer patterns are therefore descriptive and should not be treated as confirmed group effects.
5.2. Comparison with Previous Studies
The descriptive and qualitative findings were consistent with previous research that identified high costs, limited incentives, weak regulation, low awareness, and lack of expertise as important barriers in developing economies [
3,
4,
5,
6,
7] as presented in
Table 9. Respondents in the present study likewise emphasized financial constraints, awareness, expertise, technology availability, and regulation.
The structural model, however, added an important distinction. The factors most frequently identified as barriers were not necessarily those most strongly associated with reported adoption when all predictors were considered together. Human Capacity and Technological Readiness, rather than the financial and regulatory constructs, emerged as significant adoption-related factors.
5.3. Contextual Interpretation of Results for Jordan
The results should be interpreted within Jordan’s resource-constrained context. Water, energy, and natural-resource pressures make sustainable construction particularly important [
28], yet implementation remains uneven. Within the tested model, Human Capacity and Technological Readiness were the factors most strongly associated with reported adoption, indicating that practical implementation capability may be central to converting sustainability awareness into action.
This interpretation is consistent with previous Jordanian evidence showing that stakeholders may be aware of sustainability concerns without consistently applying sustainable practices [
10]. The present findings suggest that the transition from awareness to implementation is associated with access to trained personnel, technical expertise, equipment, and appropriate technologies.
The absence of statistically significant stakeholder differences suggests that the broad adoption challenges may be shared across contractors, consultants, and developers. Although their operational priorities differ, they function within the same technical and institutional environment.
The central implication is therefore not that external barriers are irrelevant, but that the ability of organizations to act under those conditions deserves greater attention. Sustainable construction should be approached as a coordinated capability-building process.
6. Implications
The findings have theoretical, practical, and policy implications, particularly for strengthening the organizational capacity required to implement sustainable construction.
6.1. Theoretical Implications
The study contributes to the application of the TOE framework by examining sustainable construction as an organizational innovation in Jordan. The significant associations of Human Capacity and Technological Readiness with adoption emphasize the organizational and technological dimensions of the framework [
16]. Given the discriminant-validity results, the constructs should be interpreted as theoretically distinct dimensions without assuming unequivocal empirical separation for every pairwise comparison.
The findings also support RBV interpretation. Skills, training, internal communication, continuous learning, and technical expertise function as organizational resources that may help firms translate sustainability awareness into reported implementation [
18]. The evidence is associative and does not establish that these resources cause adoption.
The SCP → PSV association is consistent with TBL principles [
1,
2], but it is interpreted as Perceived Sustainability Value rather than objective environmental, economic, or social performance because the measures are self-reported and PSV includes a market-related item.
A further contribution is the distinction between barrier salience and adoption-related capability. Financial and regulatory concerns were frequently identified by respondents, but they did not emerge as significant predictors in the full structural model. This indicates that the barriers most visible to practitioners may not be the variables that best explain differences in reported implementation.
For research on sustainable construction in developing economies, this distinction supports examining perceived barriers together with the organizational capabilities required to act under constrained conditions [
29,
30].
6.2. Practical Implications
The findings have several implications for construction firms, consultants, developers, and project managers in Jordan. First, human capacity should be strengthened through practical training in water management, environmentally preferable materials, renewable energy, waste reduction, and environmental performance monitoring. The results indicate an association between stronger human capacity and higher reported adoption.
Second, organizations should improve technological readiness by increasing access to appropriate equipment, digital and technical tools, sustainability-related expertise, and implementation support. Collaboration with suppliers, universities, and research centers may help organizations build these capabilities.
Third, sustainable practices should be considered from the early planning and design stages. Early integration can improve coordination and may reduce the risk that sustainability measures are treated as late, isolated, or costly additions.
Fourth, coordination among developers, consultants, contractors, suppliers, and clients should be strengthened. Recognition of sustainability objectives is unlikely to produce consistent implementation when responsibilities, information, and technical decisions are fragmented across the project team [
31].
Fifth, organizations should communicate sustainability as a source of project value rather than only as an additional cost. The association between Sustainable Construction Practices and Perceived Sustainability Value suggests that respondents linked adoption with environmental achievement, efficiency, and responsiveness to market expectations; this association remains perception-based.
In practical terms, firms should complement awareness activities with implementation tools, including staff training, internal sustainability checklists, material-selection guidance, waste-management procedures, energy-efficiency measures, and environmental monitoring from design through project handover.
6.3. Policy Implications
The results also have implications for Jordanian policymakers and regulators. First, human-capital development should be treated as a policy priority. Vocational training and continuing professional education in sustainable construction should target engineers, architects, contractors, developers, project managers, and skilled tradespeople.
Second, public policy can facilitate access to sustainable technologies, equipment, materials, and technical knowledge. Possible mechanisms include public–private partnerships, demonstration projects, pilot programs, and knowledge-sharing platforms.
Third, the regulatory framework should be clarified and strengthened. Although Regulatory Support was not statistically significant in the structural model, regulatory concerns remained visible in the descriptive and qualitative evidence. Clear standards, consistent enforcement, and the integration of environmental requirements into construction guidance may therefore support implementation [
12,
14].
Fourth, the visibility and accessibility of economic support mechanisms should be improved. The non-significant relationship in the present study may reflect limited availability, awareness, accessibility, or practical relevance of existing incentives rather than evidence that support mechanisms are unnecessary.
Fifth, public procurement can be used to create demand for sustainable materials and technologies. Including environmental criteria in public projects may encourage private-sector capability development and market diffusion.
Finally, sustainability standards should reflect Jordan’s specific resource constraints by emphasizing water efficiency, energy efficiency, waste reduction, and low-impact materials.
8. Conclusions
Jordan’s construction sector operates under significant water, energy, and resource constraints, yet sustainable practices remain unevenly implemented. This study used the TOE framework and PLS-SEM to examine the associations of Financial Barriers, Economic Support, Regulatory Support, Human Capacity, and Technological Readiness with Sustainable Construction Practices and the association between adoption and Perceived Sustainability Value.
Human Capacity and Technological Readiness were the two statistically significant predictors of adoption in the full model, while Financial Barriers, Economic Support, and Regulatory Support were not statistically significant.
Sustainable Construction Practices were positively associated with Perceived Sustainability Value. Because both constructs were self-reported and multiple bootstrapped HTMT confidence intervals, including SCP–PSV, contained 1.0, this relationship is interpreted cautiously and not as evidence of causal or verified project-performance improvement.
Cost, incentives, and regulation nevertheless remained prominent in the descriptive and open-ended responses, showing that perceived barrier salience and multivariable statistical association were not equivalent.
The principal contribution is therefore the distinction between perceived barrier salience and implementation capacity, while recognizing that several modeled dimensions were not unequivocally distinct empirically.
Future research should combine longitudinal or multi-source data with objective indicators of energy use, water consumption, waste generation, costs, and project performance. Comparative studies across Middle Eastern countries and in-depth qualitative research with contractors, consultants, developers, and policymakers could further clarify the mechanisms affecting implementation.
Overall, strengthening training, technical expertise, access to suitable technologies, regulatory clarity, and practical support may help the Jordanian construction industry move from sustainability awareness toward more consistent application.




 ,
,