Article

Proposing Novel Symbolic Regression-Based Equations for Predicting the Shear Capacity of Polypropylene-Fiber-Reinforced Concrete (PFRC) Beams Without Transverse Reinforcement


1
Department of Civil Engineering, Engineering Faculty, Kırklareli University, Kırklareli 39100, Türkiye
2
Department of Civil Engineering, Engineering Faculty, Istanbul Aydin University, Istanbul 34295, Türkiye
3
Department of Civil Engineering, Civil Engineering Faculty, Yildiz Technical University, İstanbul 34220, Türkiye
*
Author to whom correspondence should be addressed.
Buildings 2026, 16(18), 3749; https://doi.org/10.3390/buildings16183749 (registering DOI)
Submission received: 18 August 2026 / Revised: 7 September 2026 / Accepted: 18 September 2026 / Published: 20 September 2026
(This article belongs to the Section Building Structures)

Abstract

Predicting the shear strength of polypropylene and macro-synthetic fiber-reinforced concrete (PFRC) beams remains challenging because many available formulations were originally developed for conventional reinforced concrete or steel-fiber-reinforced concrete. This study develops practical and explicit symbolic equations for estimating the shear strength of PFRC beams without transverse reinforcement. A dedicated database comprising 98 shear-critical PFRC beam specimens was assembled using clearly defined inclusion and exclusion criteria. Seven predictors representing beam geometry, concrete strength, longitudinal reinforcement, and fiber properties were employed. Gene Expression Programming (GEP) and Multi-Expression Programming (MEP) were used to derive explicit mathematical equations, which were evaluated using a hold-out testing subset and compared under consistent data conditions with six benchmark machine learning algorithms and twenty existing shear strength formulations. Unlike previous studies that generally focused on individual prediction approaches or specific classes of fiber-reinforced concrete, the present study combines a PFRC-specific database, two explicit symbolic regression methods, comprehensive benchmarking, and SHAP-based model interpretation within a unified framework. The proposed MEP equation achieved the best testing performance, with a coefficient of determination (R2) of 0.976 and a root-mean-square error (RMSE) of 15.75 kN. The corresponding mean absolute percentage error (MAPE) and coefficient of variation (COV) were 10.55% and 0.143, respectively. The GEP equation also demonstrated satisfactory predictive performance, with an R2 of 0.965 and a MAPE of 18.16%. Among the benchmark machine learning algorithms, CatBoost achieved the best testing performance, with an R2 of 0.968, but was outperformed by the MEP equation. The MEP equation also improved the highest R2 among the twenty existing formulations from 0.883 to 0.976 and reduced the lowest MAPE among the existing formulations from 25.81% to 10.55%. Shapley additive explanations (SHAP) analysis indicated that beam width, shear span-to-effective depth ratio, and effective depth were the most influential variables governing the predictions of the MEP equation. Within the limits of the assembled database, the proposed MEP equation provides an accurate, transparent, and directly applicable approach for estimating the shear strength of PFRC beams without transverse reinforcement.

1. Introduction

Shear strength still continues to pose challenges for reinforced concrete (RC) beams due to their rapid and sudden mode of failure. While transverse reinforcement is used to oppose the diagonal tension forces and to prevent the development of shear cracks, dense spacing of stirrups can result in more labor-intensive processes as well as difficulties in placing concrete, especially in deep, pre-stressed, and high-performance concrete beams. Thus, fiber reinforcement has attracted a lot of attention to overcome such problems.
The post-cracking tensile properties of fiber-reinforced concrete (FRC) improve via fiber bridging, which limits crack opening and propagation and increases residual strength, ductility, and energy dissipation. Early research revealed that the contribution of fibers to structural performance is dependent on the load transfer mechanisms, member dimensions, fiber characteristics, and reinforcement arrangements [1,2]. At the interface between the crack surfaces, the results of push-off experiments indicated that the increase in polypropylene fiber content increases the shear resistance, which reduces when the crack opening increases and is affected by slip and confinement [3]. However, many early studies and popular prediction models were derived from experiments involving steel-fiber-reinforced concrete. Considering the substantial differences in the elastic modulus, tensile strengths, geometries, and bond characteristics of steel and synthetic fibers, the models calibrated based on steel fibers cannot accurately describe polypropylene and macro-synthetic fibers [4,5,6,7]. Comparative studies on beams show that steel fibers lead to higher strength and stiffness improvement, whereas polypropylene fibers are more efficient for early cracking control, crack spacing, and deformation [8].
Though there is experimental evidence demonstrating the effectiveness of polypropylene and macro-synthetic fibers for improving the shear behavior of RC beams, considerable variability in their structural performance has been noted [9,10,11]. In beams with no stirrups, improvement in shear strength, ductility, crack pattern and behavior at failure has been reported, although depending on the member geometry and fiber content. Investigations carried out with conventional transverse reinforcements have shown that the effect of the fibers depends not only on the interaction between the fibers and stirrups, but also on the size distribution of the fibers [12,13,14,15]. Additionally, the type and quantity of longitudinal reinforcements are crucial, as shown by experiments conducted with steel-, GFRP- and BFRP-reinforced beams [16,17]. In a more general context, the use of polypropylene and macro-synthetic fibers has been investigated in pre-stressed, self-compacting, engineered cementitious composite, high-strength, ultra-high-performance, lightweight, deep beam, fly ash and hybrid fiber systems [4,18,19,20,21,22,23,24,25]. Overall, it seems clear that the contribution of synthetic fibers cannot be uncoupled from the concrete matrix, member geometry, reinforcement arrangement, fiber properties, and mode of failure.
These findings have been recently extended to include hybrid fiber systems and also PFRC shear behaviors in general. Experimental and numerical analyses of hybrid systems of steel, polypropylene, glass, basalt, and polyvinyl alcohol fibers have revealed that the choice of system and total amount influence the shear strength, crack control, deformability, and ductility [26,27]. Reviews have also noted heterogeneity in the existing PFRC literature and significant differences among shear design rules from different countries, especially those for members reinforced by macro-synthetic fibers and traditional transverse reinforcement [28]. In addition, experimental investigations differ in terms of the size of beams, shear span-to-effective depth ratio, concrete mix, longitudinal and transverse reinforcement, fiber amount and characteristics, loadings, and responses under consideration, such as monotonic, long-term, blast, crack identification, and hybrid fiber actions [21,29,30,31].
Despite the difference in physical mechanisms between the externally bonded fiber-reinforced polymer (FRP) strengthening technique and the use of dispersed fibers, the findings from these studies contribute to each other in the examination of the effect of a supplementary tensile resisting system based on the variation in certain parameters. Strengthening efficiency is found to be influenced by many parameters such as the shear span-to-depth ratio, existing transverse reinforcement, the nature and shape of the strengthening material, the amount and pattern of the reinforcement, the presence of cracks, bond characteristics, and the dominant mode of failure [27,32,33,34,35,36,37,38,39,40,41,42,43]. The results reinforce the broader conclusion that the shear contribution of synthetic fibers should be evaluated together with member geometry and reinforcement arrangement rather than treated as an independent additive component.
Recent model development works have tried to tackle the intricacies of fiber-reinforced concrete behavior through specific analytical formulation, carefully curated databases, probabilistic optimization, and data-driven methods. A shear formula for PFRC based on compression strut action and splitting tensile strength showed promising results; however, the validation dataset consisted of different types of concretes, reinforcement patterns, and fiber systems [44]. A semi-empirical equation created based on the curation of a database of high-strength and ultra-high-performance fiber-reinforced concrete beams proved that physically meaningful parameters and careful database curation could result in comparable predictions without the need for sophisticated models [45]. Probabilistic and multi-objective modeling has shown potential in the prediction and optimization of fiber-reinforced concrete properties, stressing, at the same time, the shortcomings of highly accurate black-box models in terms of transparency and physical consistency [46]. Simultaneously, GEP showed its ability to develop explicit formulas for capacity of structures problems with good predictive performance compared with conventional and current data-driven models [47].
Despite these advances, the predictive assessment of PFRC beams without transverse reinforcement remains insufficiently established. The available experimental studies involve markedly different beam geometries, shear span-to-effective depth ratios, concrete classes, longitudinal reinforcement ratios, fiber dosages, fiber properties, and loading configurations. The existing evidence also includes different concrete systems, reinforcement types, fiber categories, and failure modes. Moreover, many available shear strength formulations were originally developed using conventional RC, steel-fiber-reinforced concrete, mixed fibers, or specialized structural databases. Consequently, their reliability for conventionally steel-reinforced concrete beams containing polypropylene or macro-synthetic fibers without stirrups remains uncertain. Although analytical, semi-empirical, and data-driven models have been proposed, comparatively limited attention has been devoted to deriving explicit symbolic equations from a dedicated PFRC database and evaluating these equations against both established shear strength formulations and benchmark machine learning algorithms under identical database and testing conditions.
Therefore, the objective of the current study is to propose reliable and explicit equations for the estimation of the shear strength of polypropylene- and macro-synthetic-fiber-reinforced concrete beams without transverse reinforcement. Four major contributions are made through the current study. First, an experimental database consisting of 98 shear-critical PFRC beams from 28 independent research studies was created using clear inclusion and exclusion criteria. Second, Gene Expression Programming (GEP) and Multi-Expression Programming (MEP) algorithms were used to generate explicit mathematical expressions based on geometric, material, reinforcement, and fiber parameters. Third, the proposed equations were evaluated using a hold-out testing subset and benchmarked under consistent conditions against six machine learning algorithms and twenty existing shear strength formulations. Fourth, Shapley additive explanations (SHAP) analysis was carried out to evaluate the behavior of the best-performing explicit equation and to measure the relative significance and directionality of the input variables. This framework distinguishes the current study from previous ones through the use of a PFRC-oriented experimental database, explicit symbolic equations, extensive benchmarking, and model interpretability.

2. Experimental Database

2.1. Database Collection and Selection Criteria

A comprehensive experimental database was assembled from 28 previously published experimental investigations on the shear behavior of polypropylene- and macro-synthetic-fiber-reinforced concrete beams [2,9,10,13,14,18,19,20,21,22,23,24,25,29,48,49,50,51,52,53,54,55,56,57,58,59,60,61]. The primary sources were reviewed at the specimen level, and the geometric, material, reinforcement-related, fiber-related, and measured response data were extracted from the reported experimental programs. Following the screening process described below, the final database comprised 98 beam specimens. The complete specimen-level database, including the source reference and specimen designation, is provided in Appendix B, Table A2.
Specimen selection involved adherence to all of the following conditions: (i) the member was a reinforced concrete beam, employing conventional longitudinal steel reinforcement; (ii) polypropylene or macro-synthetic fibers were the only types of distributed fiber reinforcement employed; (iii) no transverse reinforcement was applied; (iv) the specimen failed under shear-controlled monotonic loading; and (v) the necessary data on the geometric parameters, concrete properties, longitudinal reinforcement parameters, fiber properties, and experimental shear capacity were available. These selection criteria were chosen in order to compile a database relevant to the scope of structures and inputs required by the proposed prediction models.
Specimens were excluded when they exhibited flexural or other non-shear-governed failure modes, contained stirrups or another form of transverse reinforcement, used steel, basalt, glass, polyvinyl alcohol, or hybrid fiber systems, employed FRP longitudinal reinforcement, or incorporated externally bonded strengthening. Furthermore, records where at least one variable used for developing the model was not possible to determine accurately using the original publication source were excluded from this study. From the remaining specimens, beam width ( b ), effective depth ( d ), shear span-to-effective depth ratio ( a / d ), longitudinal reinforcement ratio ( ρ s ), longitudinal reinforcement yield strength ( f y ), fiber volume fraction ( V f ), fiber aspect ratio ( l f / d f ), concrete compressive strength ( f c f ), fiber tensile strength ( f s f ), fiber elastic modulus ( E s f ), and experimentally obtained shear strength ( V e x p ) were considered. The seven variables subsequently used as model predictors are specified in Section 3.1.

2.2. Characteristics and Statistical Description of the Experimental Database

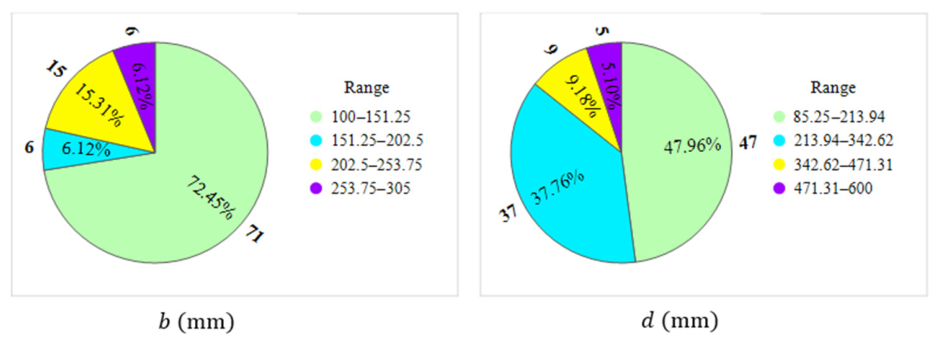
The statistical characteristics of the input and output variables included in the experimental database are summarized in Table 1. The database covers a wide range of geometric, material, reinforcement-related, and fiber-related parameters, thereby representing various structural configurations of polypropylene-fiber-reinforced concrete beams. The beam sizes are from 100 mm to 305 mm, and effective depths are from 85.25 mm to 600 mm. The ratio of the shear span to effective depth is between 0.583 and 4.870, which means that the database contains beams of varying strengths in terms of shear transfer mechanism. The concrete compressive strength values are from 13.85 MPa to 150 MPa, including normal, high-strength, and ultra-high-strength concrete samples. Also, the longitudinal steel ratios are from 0.002 to 0.046, while longitudinal steel yield strengths are from 366.47 to 700 MPa.
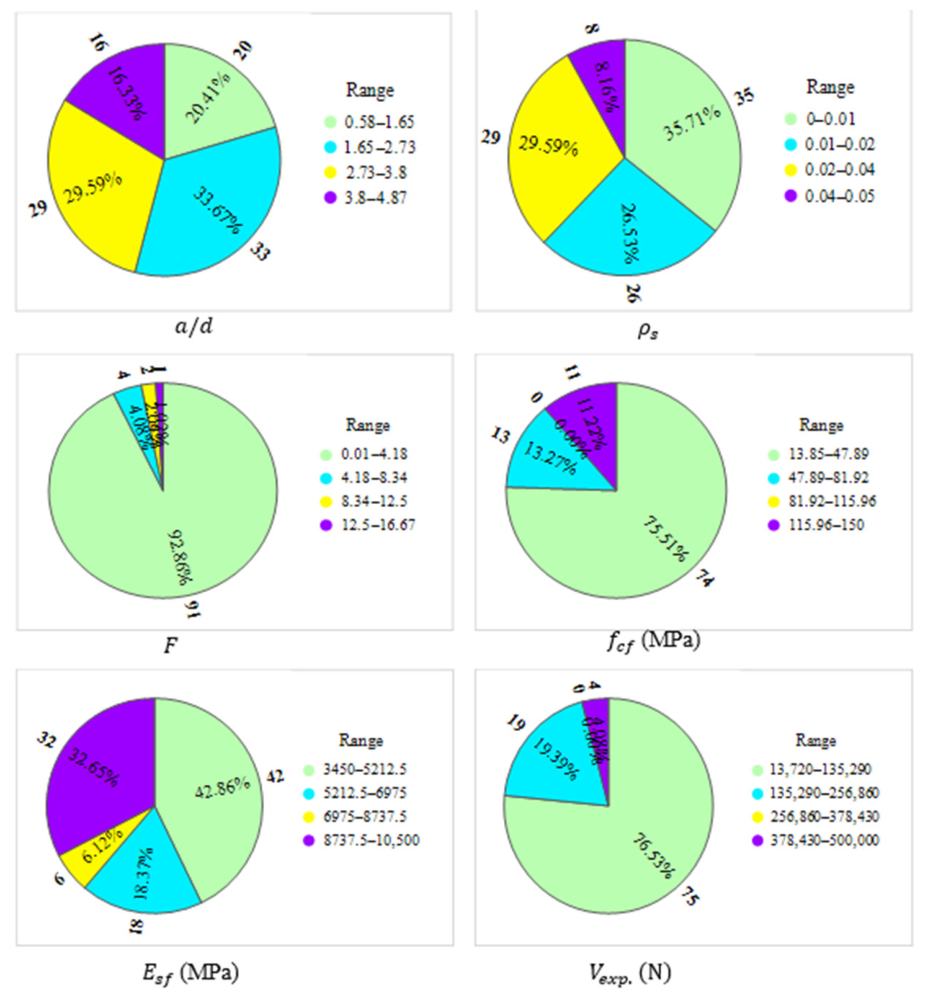
The database also includes a broad range of polypropylene and macro-synthetic fiber characteristics. The fiber volume fraction varies from 0.10% to 3.00%, the fiber aspect ratio ranges from 12.5 to 840, the fiber tensile strength varies between 375 and 685 MPa, and the fiber elastic modulus ranges from 3450 to 10,500 MPa. The experimentally measured shear capacities range from 13.72 to 500 kN, reflecting the substantial variation in the geometrical and mechanical characteristics of the collected specimens. The minimum, maximum, mean, and standard deviation values of all variables are presented in Table 1. The fiber volume fraction V f and fiber aspect ratio l f / d f are reported separately in the table because they represent two distinct and directly reported fiber characteristics. For the graphical presentation in Figure 1, these parameters were combined into the fiber factor, as defined by Equation (1).
F = V f l f d f
which simultaneously represents the effects of fiber dosage and fiber geometry. The distributions of the selected input and output variables, including the derived fiber factor, are presented in Figure 1, where the segment labels indicate the number and percentage of specimens within each range. Although the observations are not uniformly distributed across all parameter ranges, the database encompasses a broad range of experimental conditions suitable for the development and evaluation of the proposed prediction models.

3. Methodology

3.1. Data Preparation

The database mentioned in Section 2 was utilized for the development and analysis of the predictive models. A total of seven variables were selected as predictors of the model: beam width ( b ), effective depth ( d ), the ratio of the shear span to effective depth ( a / d ), the longitudinal steel ratio ( ρ s ), concrete compressive strength ( f c f ), the elastic modulus of the fiber ( E s f ) and the fiber factor ( F ). The value of the fiber factor F was calculated using Equation (1).
Though both V f and l f / d f are shown in Table 1 in order to keep the original features of the database for experiments, their combination, namely, F , was used while developing the models. Experimentally determined shear strength ( V e x p ) was chosen as the target output parameter.
Prior to modeling, missing values, unit inconsistencies, and incomplete records in the database were identified. Subsequently, the 98 samples were split using a random hold-out method into a training sample size of 74 samples and a testing sample size of 24 samples. These testing samples were not used in any stage of model building, selection, and parameter tuning; hence, they served only for the ultimate test of predictive performance. Consequently, the testing outcomes presented below are out-of-sample predictions on experimental beam samples that have not been involved in the process of model development. Nonetheless, since both samples were drawn from the same assembled database, this testing is called hold-out evaluation and not full external validation.

3.2. Machine Learning Models

Machine learning analyses were conducted in JupyterLab 4.4.4 [62] using Python 3.9.12; model development and evaluation used scikit-learn 1.1.3, and data processing and numerical computations employed pandas 2.3.1 and NumPy 1.24.4. CatBoost, AdaBoost, Extra Trees (ET), XGBoost, Gaussian Process Regression (GPR), and Random Forest (RF), six machine learning algorithms, were applied as the benchmarking models for assessing the prediction performance of the developed GEP and MEP models. They were chosen because they are based on distinct methods of nonlinear regression such as gradient boosting, bagging-based tree ensemble, randomized tree ensemble, adaptive boosting, and kernel-based probabilistic regression. Consequently, they provide diversity in the benchmarking models rather than a single class of machine learning algorithms [63,64,65,66,67]. All benchmarking models utilized the same seven independent variables, which were used to develop the GEP and MEP equations: beam width ( b ), effective depth ( d ), the ratio of the shear span to effective depth ( a / d ), the longitudinal steel ratio ( ρ s ), concrete compressive strength ( f c f ), the elastic modulus of the fiber ( E s f ), and the fiber factor ( F ). Experimentally determined shear strength ( V e x p ) was used as the target variable. The fiber factor was computed based on Equation (1). In order to conduct a consistent evaluation, all machine learning algorithms were trained and tested on the same set of training and hold-out testing sets as the GEP and MEP models. The training subset was used for model fitting and hyperparameter selection, whereas the testing subset was reserved exclusively for the final evaluation of predictive performance. The selected hyperparameters and configuration details of all benchmark and symbolic models are summarized in Table 2.

3.3. Gene Expression Programming (GEP)

Gene Expression Programming (GEP) is an evolutionary machine learning approach that utilizes a population of genes and chromosomes of fixed length for detecting relationships between various variables and expressing these relationships in the form of mathematical formulas in the form of expression trees. The strength of GEP compared with most machine learning approaches is the ability to generate a mathematical equation rather than numerical prediction only. This allows for the evaluation and practical implementation of the generated model. Through the evolutionary process, the expressions are modified via genetic operators to obtain a satisfactory result [68]. In the current research, the GEP method was used to develop an explicit equation that would be able to predict the shear strength of PFRC beams. An optimal model structure was selected by the trial-and-error method to maximize the predictive accuracy and simplicity of the equation. The structure of the proposed GEP model is presented in Table 2.

3.4. Multi-Expression Programming (MEP)

Multi-Expression Programming (MEP) is an evolutionary machine learning method that represents multiple candidate solutions within a single linear chromosome and selects the expression with the best fitness as the final model. The algorithm progressively improves candidate expressions through selection, crossover, mutation, and replacement operations until an optimal solution is obtained. By generating explicit mathematical equations without requiring a predefined functional form, MEP can effectively model complex and nonlinear relationships among input variables while maintaining control over expression complexity [69]. In the present study, MEP was employed to derive an explicit equation for predicting the shear strength of PFRC beams. The algorithm was trained using the same training subset employed for the GEP model, whereas the hold-out testing subset was reserved exclusively for the final evaluation of predictive performance. Similar to the GEP procedure, the model parameters were optimized through iterative analyses to obtain the best possible balance between predictive capability and equation complexity. The configuration of the developed MEP model together with the hyperparameter settings of the benchmark machine learning models is summarized in Table 2. The input parameters were b (mm), d (mm), a / d , ρ s , F , E s f (MPa) and f c f (MPa).

3.5. Performance Evaluation Criteria

The predictive performances of the developed models were evaluated using five statistical indicators: mean value ( M V ), coefficient of variation ( C O V ), root-mean-square error ( R M S E ), mean absolute percentage error ( M A P E ), and coefficient of determination ( R 2 ).
The mean value ( M V ) of the experimental-to-predicted shear strength ratios was calculated as Equation (2):
M V = 1 n i = 1 n V e x p , i V p r e d , i  
where V e x p and V p r e d denote the experimental and predicted shear strengths, respectively, and n represents the number of observations.
The coefficient of variation ( C O V ) was computed as Equation (3):
C O V = S D M V
where S D is the standard deviation of the prediction ratios.
The root-mean-square error ( R M S E ) was calculated using Equation (4):
R M S E = 1 n i = 1 n V e x p , i V p r e d , i 2
The mean absolute percentage error ( M A P E ) was determined via Equation (5):
M A P E = 100 n i = 1 n V e x p , i V p r e d , i V e x p , i
Finally, the coefficient of determination ( R 2 ) was calculated as Equation (6):
R 2 = 1 i = 1 n V e x p , i V p r e d , i 2 i = 1 n V e x p , i V ¯ e x p 2
where V e x p denotes the mean experimental shear strength.
R 2   values closer to unity, M V values closer to 1.0, and lower C O V , R M S E , and M A P E values indicate better predictive performance. Therefore, the model exhibiting the highest correlation and the lowest prediction error was considered the most reliable approach for estimating the shear strength of polypropylene-fiber-reinforced concrete beams.

3.6. Existing Shear Strength Models

To evaluate the applicability of existing shear strength prediction approaches for fiber-reinforced concrete beams without transverse reinforcement, twenty analytical, empirical, semi-empirical, and design-oriented models reported in the literature were implemented and applied to the assembled experimental database. The evaluated formulations included the models proposed by Sharma [70], Khuntia et al. [71], Ashour et al. [72], Kwak et al. [73], Mansur et al. [74], Narayanan and Darwish [75], Swamy et al. [76], Li et al. [5], Greenough and Nehdi [77], Imam et al. [78], Sarveghadi et al. [79], Shin et al. [80], Arslan [81], Arslan et al. [48], Said et al. [82], Gandomi et al. [83], RILEM [84], DAfStB [85], fib Model Code 2010 [86], and Albidah and Abbas [87]. The principal variables considered by the evaluated models are summarized in Table 3.
The present formulations exhibit considerable differences in terms of their theoretical basis and the parameters employed in describing the shear-resisting behavior of fiber-reinforced concrete. While some of the formulations directly take into account the fiber properties with respect to the fiber volume fraction, aspect ratio, bond stress or fiber factor, the contribution of fibers to shear resistance in some formulations is indirectly accounted for via residual flexural tensile strength, splitting tensile strength, flexural tensile strength or other experimentally obtained material parameters. The effect of the longitudinal reinforcement ratio, effective depth and shear span–depth ratio is taken into account differently in the considered models. Therefore, there are considerable differences in the parameters governing the performance of different formulations as well as the basic assumptions employed in the formulations. All models were implemented using a consistent set of experimental parameters extracted from the collected database to maintain methodological consistency and facilitate a transparent comparison of predictive performance. When the experimental parameters needed by a particular formulation were readily available from the original sources, they were directly used for the analysis. However, there were certain formulations requiring certain parameters that were not readily available for all specimens. In such cases, supplementary assumptions were introduced based on recommendations available in the literature and previous comparative studies. For models using the fiber–concrete bond stress factor, the bond stress was considered to have a fixed value of τ = 1.0 MPa for all of the computations. This was done considering the procedure described in the study conducted by Yazdanbakhsh et al. [88], where an interfacial bond stress of about 1.0 MPa was used for macro-synthetic fibers mixed into normal-strength concrete in their application to various models that predict the shear strength. In the model developed by Imam et al. [78], one must use the maximum aggregate size ( d a ). However, d a could not be obtained from the available data for some specimens in the collected database. Accordingly, d a was assumed to be 10 mm for specimens lacking aggregate-size information, consistent with the database compilation procedure adopted by Lantsoght [89] for laboratory beams. This was done only for specimens whose aggregate size data were not known, while for those for which the aggregate size data were known, they were kept as originally reported. Because all beams included in the present database were tested without stirrups, the contribution of transverse reinforcement to shear capacity, V s , was taken as zero ( V s = 0) in the formulations where this parameter was required. Particular emphasis was put on the implementation of the fib Model Code 2010 [86]. This model needs parameters f R 1 and f R 3 of the residual flexural tensile strength, which were not available for a considerable part of the experimental dataset. Hence, these parameters were estimated via the empirical relations given by Moraes-Neto et al. [90] depending on the fiber reinforcement index ( R I = V f l f / d f ) in accordance with the method described by Nzambi et al. [91] for estimating the residual flexural behavior of fiber-reinforced concrete. The RILEM [84] and DAfStB [85] models were applied according to the assumptions and calculation schemes used in the comprehensive study by Lantsoght [89] for the evaluation of the fiber-reinforced concrete beam databases. Moreover, the original formulation for estimating the shear strength given by Arslan (2014) [81] and the modified version suggested by Arslan et al. (2017) [48] were assessed separately, as these models have been independently calibrated for distinct fiber reinforcement systems. Except for the assumptions and parameter estimates mentioned above, all models were implemented in their original forms as proposed by their respective authors. This approach ensured transparency, reproducibility, and consistency in evaluating the predictive performance of the existing shear strength models on the same hold-out testing dataset.

4. Development of Proposed Equations

4.1. Developed GEP Equation

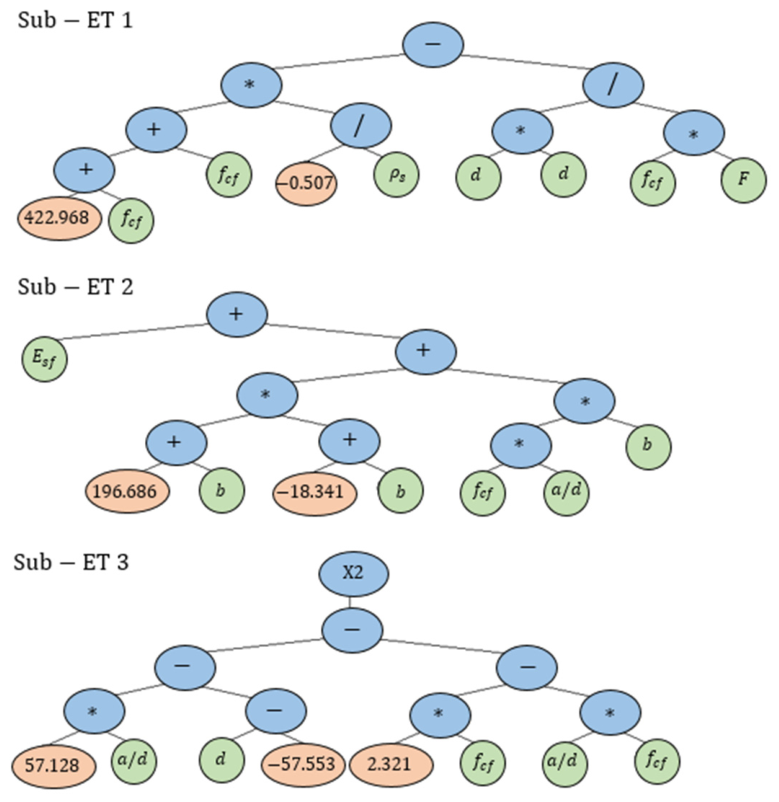
Gene Expression Programming (GEP) was employed to derive an explicit mathematical equation for predicting the shear strength of polypropylene-fiber-reinforced concrete (PFRC) beams. During model development, different combinations of chromosomes, genes, head sizes, and mathematical operators were examined to obtain a suitable balance between predictive performance and equation complexity. The final GEP equation is given in Equation (7).
V G E P = 214.47 + 1.01 f c f ρ s d 2 f c f F + E s f + b 2 + 178.34 b 3607.55 + b f c f a d + a d f c f + 57.13 d 2.32 f c f 57.55 2
where V G E P represents the shear strength predicted in N; b and d are the beam width and effective depth in mm, respectively; a / d represents the shear span-to-effective depth ratio; f c f represents the concrete compressive strength in MPa; ρ s is the longitudinal steel ratio; F is the fiber factor and is given by F = V f ( l f / d f ) ; and E s f is the elastic modulus of the polypropylene fibers in MPa. Equation (7) gives the predicted shear strength in N upon input of the variables in the stated units.
A mathematical representation of Equation (7) can be seen in the form of expression trees shown in Figure 2 below. The final GEP model has three expressions that are linked through addition operators. Each expression tree constitutes one part of the equation produced through evolution.
The variables retained in Equation (7) are consistent with parameters commonly associated with the shear resistance of PFRC beams. These include member geometry, concrete compressive strength, longitudinal reinforcement, fiber dosage and geometry represented by the fiber factor, and fiber elastic modulus. Nevertheless, Equation (7) was obtained through data-driven symbolic regression rather than derived directly from a mechanics-based shear model. Therefore, its mathematical terms should primarily be interpreted as predictive relationships identified from the experimental database.
Based on the above-mentioned nonlinearity in the combination of the input parameters in Equation (7), it can be implied that the GEP model constructed takes into account nonlinear relationships between geometric, material, reinforcement, and fiber parameters. However, it is wrong to assume that the aforementioned mathematical expressions represent the shear transfer mechanisms. The effectiveness of Equation (7) is evaluated in Section 5 by comparing it with testing results, machine learning models, and existing shear strength equations.

4.2. Developed MEP Equation

Multi-Expression Programming (MEP) was employed to derive an explicit mathematical equation for predicting the shear strength of polypropylene-fiber-reinforced concrete (PFRC) beams. During model development, different combinations of code lengths, subpopulation configurations, generations, constants, and mathematical operators were examined to obtain a suitable balance between predictive performance and equation complexity. The final MEP equation is given in Equation (8).
V M E P = b + d + ρ s 2 d + ρ s ρ s + 2 b + F 2 d + ρ s 2 E s f + 2 b f c f d + ρ s 2 F f c f + 4 b + F 2 a d ρ s 2
where V M E P is the calculated shear capacity in N; b and d are the width and effective depth of the beam in mm, respectively; a / d is the shear span-to-depth ratio; f c f is the concrete compressive strength in MPa; ρ s is the longitudinal reinforcement ratio; F is the fiber factor, F = V f ( l f / d f ); and E s f is the modulus of elasticity of the polypropylene fibers in MPa. Equation (8) gives the calculated shear strength in N with the input parameters inserted in their appropriate units, as indicated above.
Unlike GEP, which represents the final solution through linked expression trees, MEP encodes multiple candidate expressions within a single chromosome and selects the expression providing the most suitable performance according to the adopted fitness criterion. The detailed chromosome structure and program representation associated with Equation (8) are provided in Appendix A.
The variables retained in Equation (8) are consistent with parameters commonly associated with the shear resistance of PFRC beams. These include the member geometry, concrete compressive strength, longitudinal reinforcement, fiber dosage and geometry represented by the fiber factor, and fiber elastic modulus. Nevertheless, Equation (8) was obtained through data-driven symbolic regression rather than derived directly from a mechanics-based shear model. Therefore, its mathematical terms should primarily be interpreted as predictive relationships identified from the experimental database.
Nonlinear combinations of the selected input variables are included in Equation (8), meaning that the MEP model established includes non-additive interactions between the geometric, material, reinforcing and fiber properties. Nevertheless, these equations do not mean a representation of shear transfer mechanisms themselves. The performance of Equation (8) is tested in Section 5 based on comparisons against the experimental results, benchmark machine learning techniques, the proposed GEP equation and available shear strength equations.

4.3. Applicability Range of the Proposed Equations

The use of the GEP and MEP equations formulated is restricted to beams made of polypropylene-reinforced concrete without transverse reinforcement and under experimental conditions captured in the database assembled. Therefore, Equations (7) and (8) need to be used with inputs from the ranges shown in Table 1. The use of values outside these ranges is considered to be an extrapolation and may be prone to higher levels of uncertainty. The developed equations contain seven parameters such as the width of the beam ( b ), effective depth of the beam ( d ), shear span-to-effective depth ratio ( a / d ), reinforcement ratio ( ρ s ), concrete strength ( f c f ), fiber factor ( F ), and elastic modulus of the fibers ( E s f ). The fiber factor ( F ) is expressed as F = V f ( l f / d f ), where V f is the fiber volume ratio, while l f / d f is the fiber aspect ratio. Therefore, the equations can be used only for beams that have geometric, material, reinforcement-related and fiber-related properties within the range of the database. Furthermore, one needs to understand that both GEP and MEP formulas were derived using data-based symbolic regression and not as code-based design equations with any safety factor involved. This means that the application of these formulas should be limited to determining the experimental shear strength of PFRC beams in the investigated range of parameters, and not for designing structures. The predictive performance of the equations was assessed using a hold-out testing subset drawn from the assembled database; a fully independent external experimental dataset was not available for the present evaluation. Therefore, predictions for beam configurations not adequately represented in the database should be interpreted cautiously and, where possible, supported by independent experimental evidence or additional analytical assessment.

5. Results and Discussion

5.1. Evaluation of Machine Learning Models and Developed GEP and MEP Equations

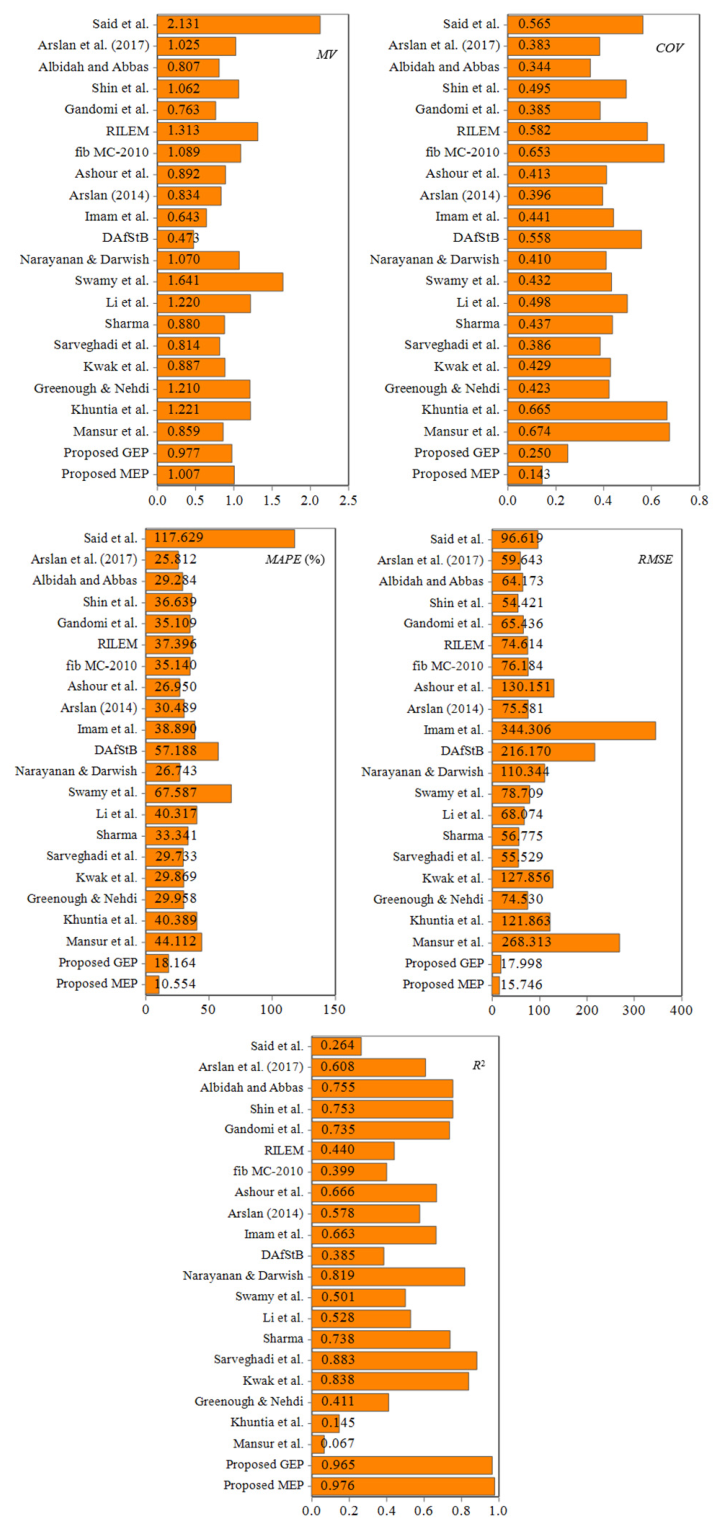
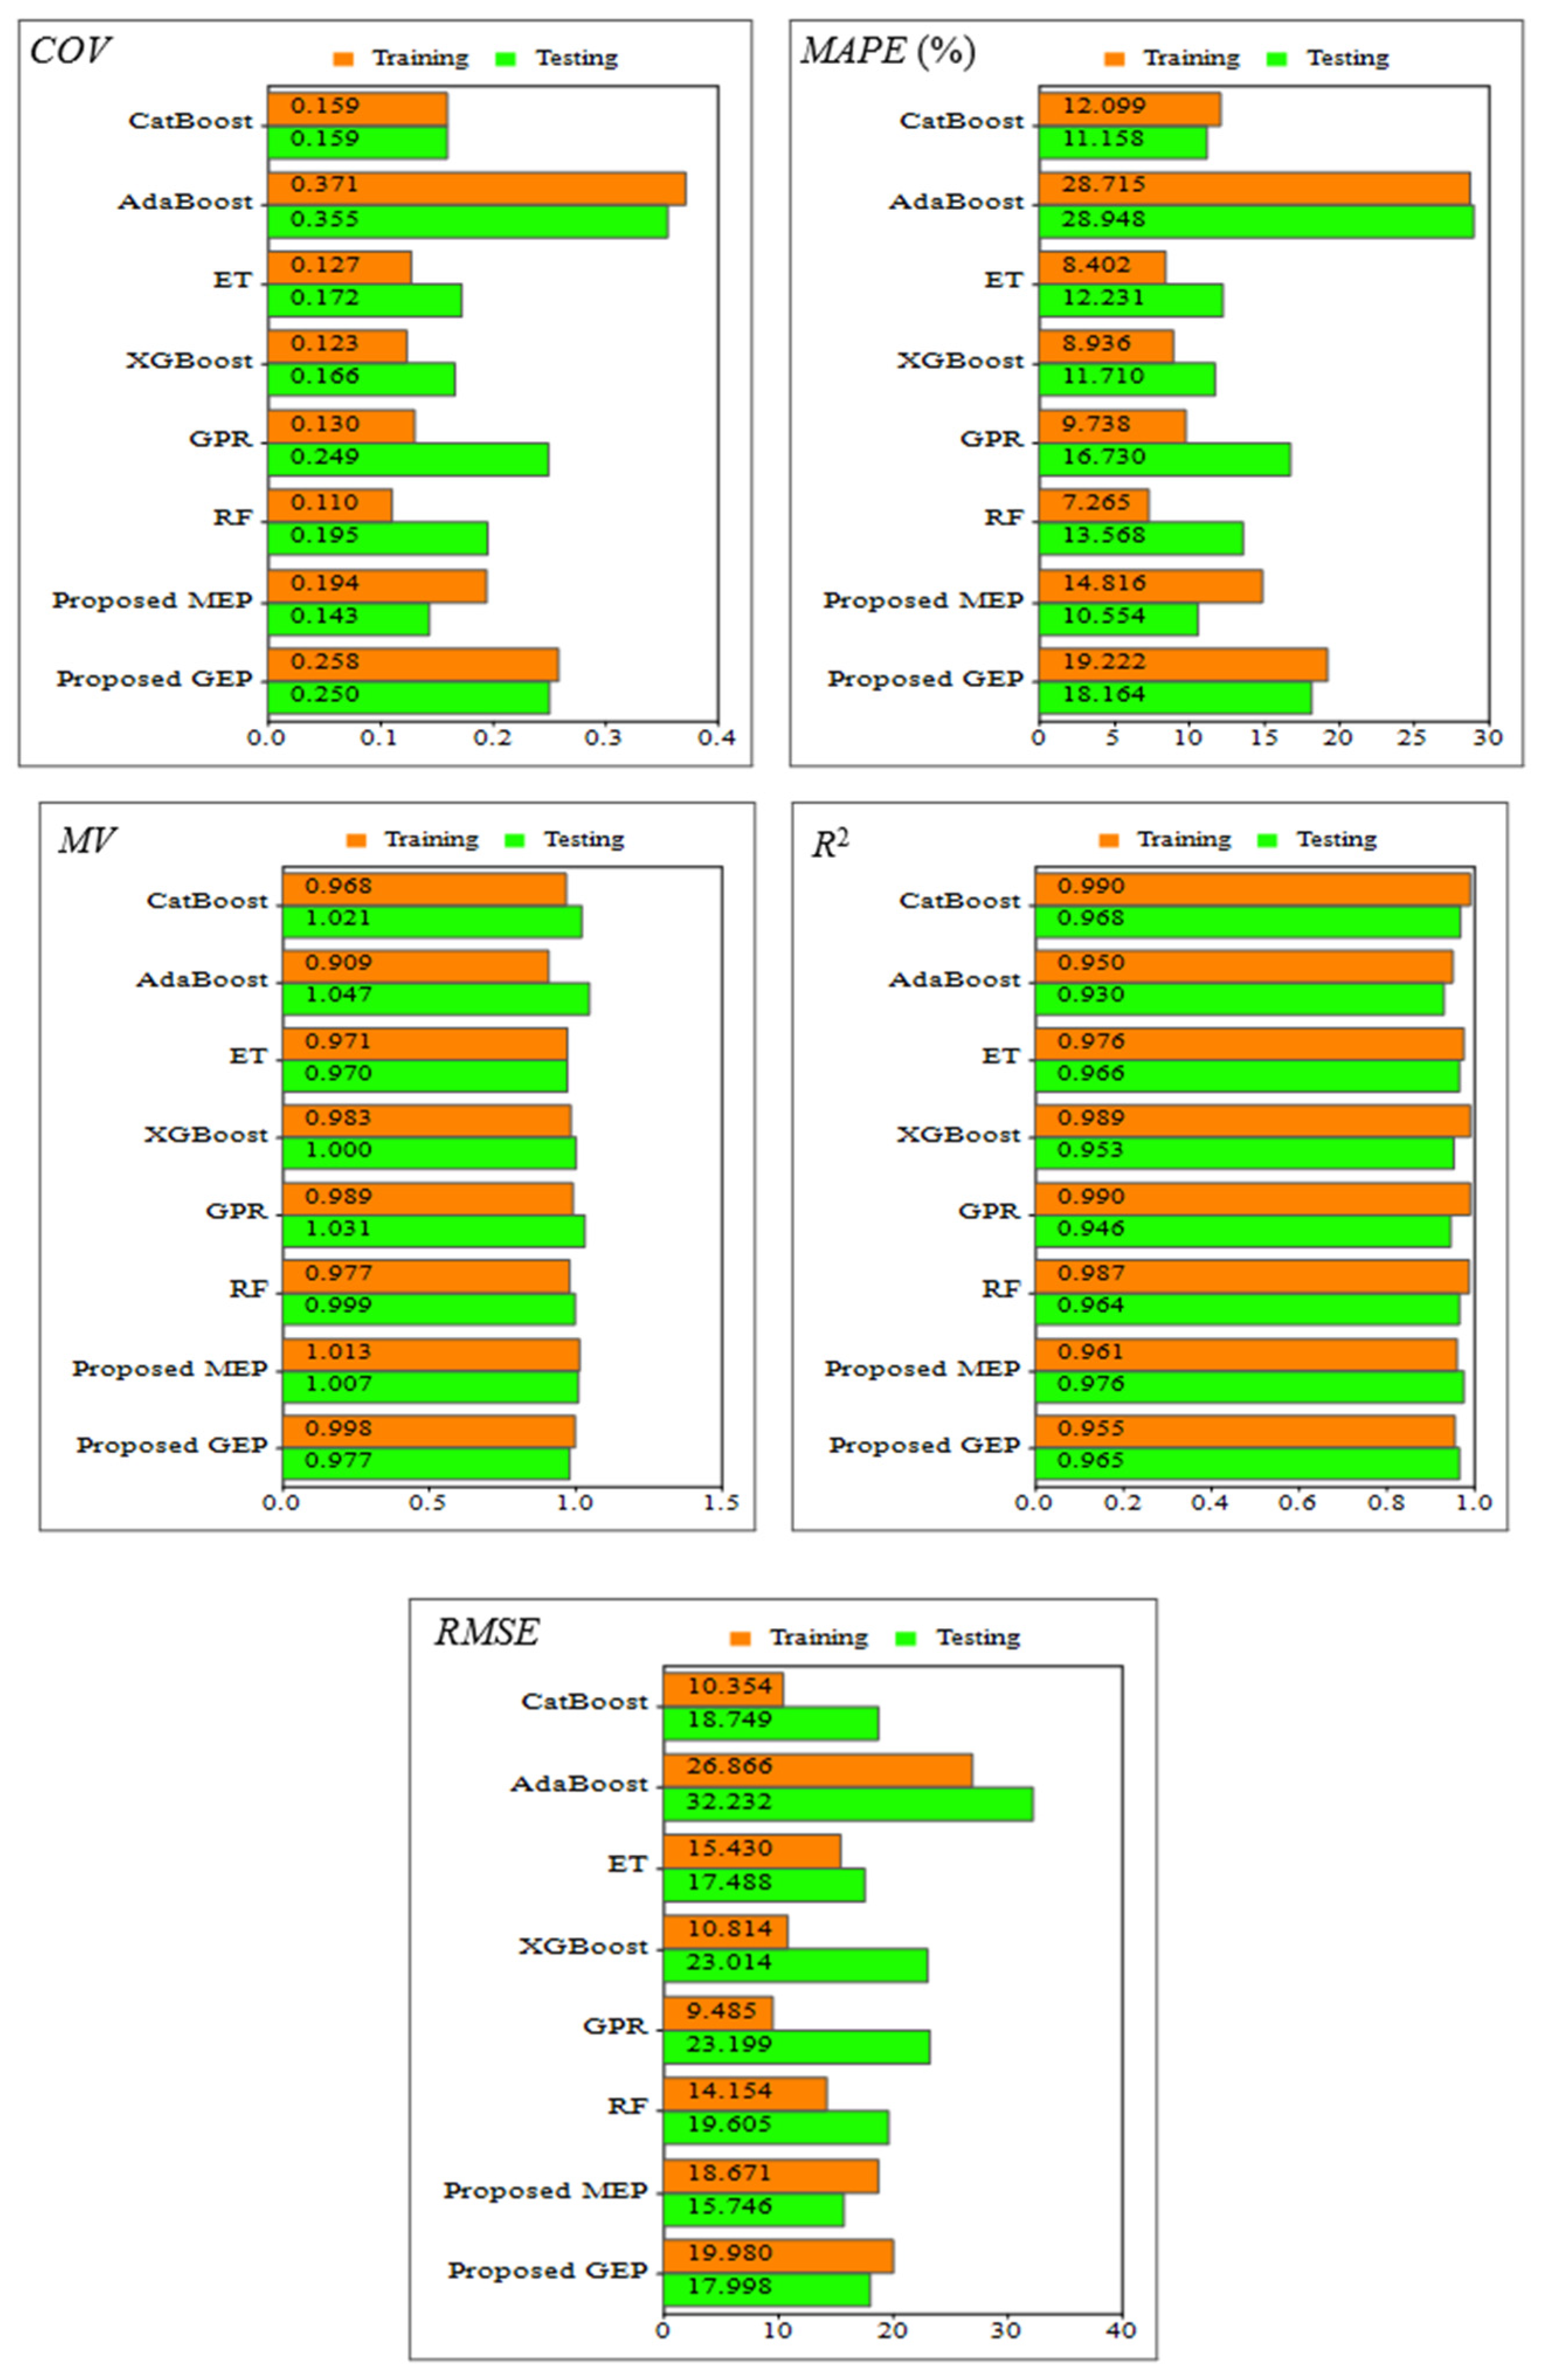
The prediction capabilities of benchmark machine learning methods and equations proposed by GEP and MEP were assessed based on the training and hold-out sets. The performance criteria M V , C O V , R 2 , R M S E , and M A P E were used for evaluation purposes. The performance results obtained are presented in Table 4 and depicted in Figure 3.
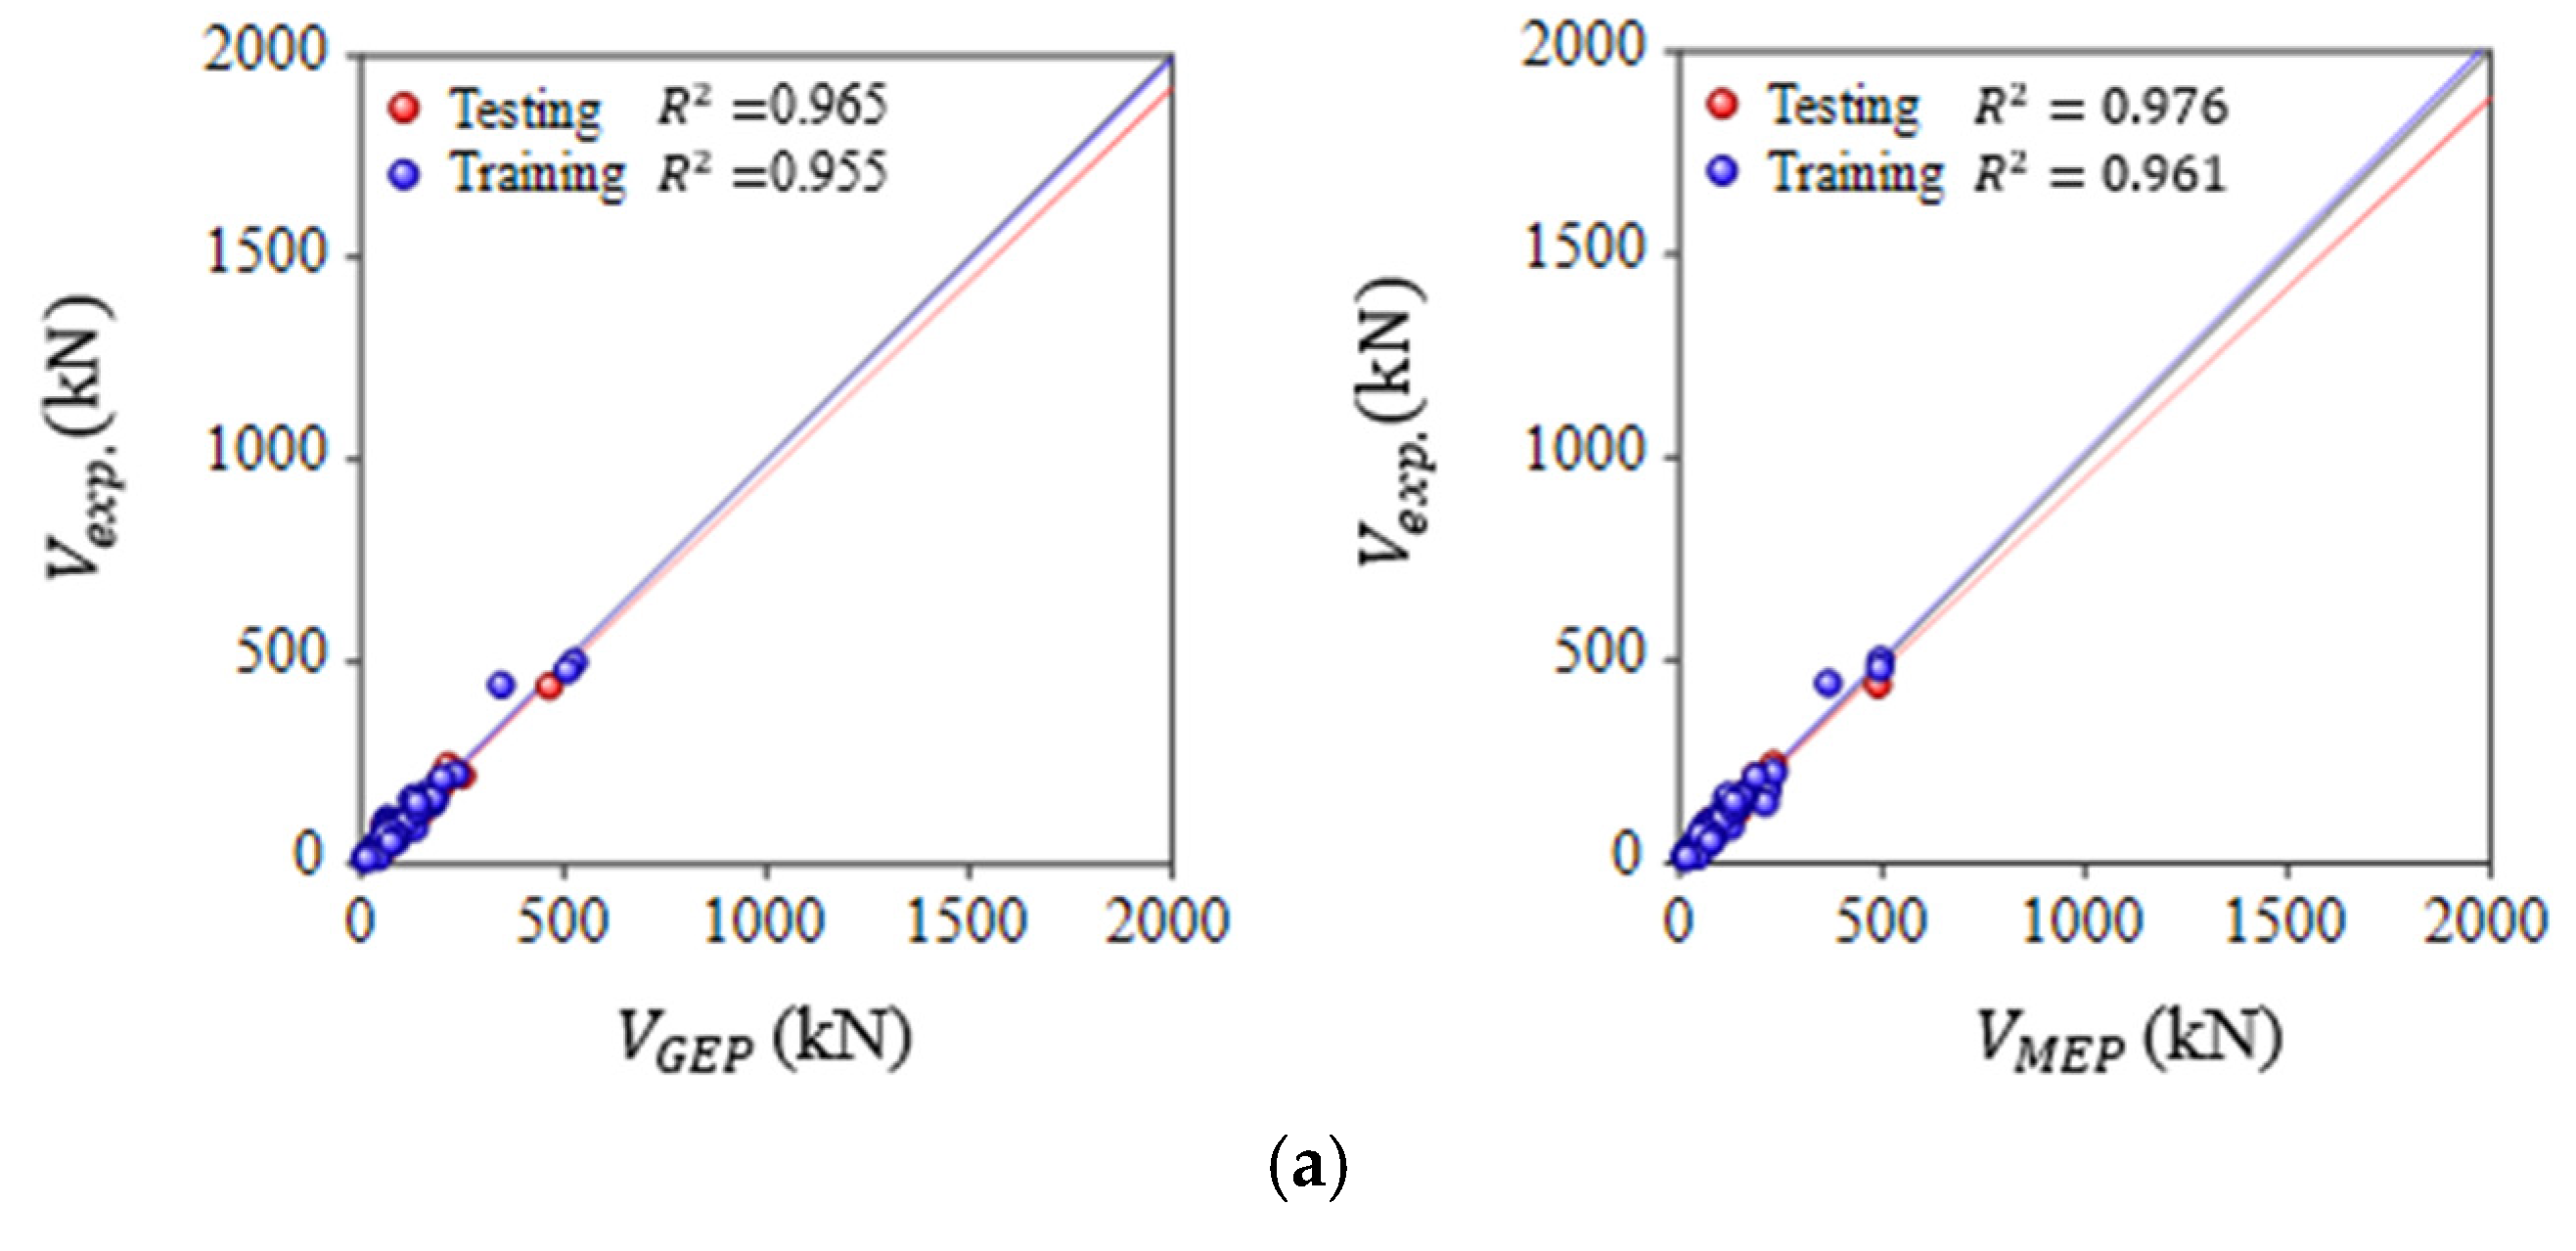
As shown in Table 4 and Figure 3, the benchmark machine learning models generally achieved high training accuracy. However, the hold-out testing results provide a more relevant assessment of predictive performance for specimens excluded from model development. Among the benchmark algorithms, CatBoost achieved the highest testing R 2 of 0.968, with an R M S E of 18.749 kN and a M A P E of 11.158%. The developed MEP equation provided the best overall testing performance, with R 2 = 0.976, R M S E = 15.746 kN, M A P E = 10.554%, M V = 1.007, and C O V = 0.143. The close-to-unity M V indicates limited average bias, while the comparatively low C O V indicates lower dispersion in the experimental-to-predicted shear capacity ratios. The GEP equation also achieved a high testing correlation ( R 2 = 0.965), but its M A P E of 18.164% and C O V of 0.250 indicate greater prediction error and dispersion than those obtained using MEP. The experimentally measured shear capacities of the 24 hold-out testing specimens are compared with the corresponding GEP and MEP predictions in Figure 4a. Since these data samples were not used in the processes of modeling, model selection and parameter tuning, the analysis is a true out-of-sample test compared with the actual experimental response data. Predictions made using the MEP formula are closer to the line of equality, while GEP shows more dispersion of points, which is in accordance with the statistical parameters presented in Table 4. Accordingly, under the adopted hold-out testing conditions, the explicit MEP equation achieved predictive performance comparable to or better than that of the evaluated machine learning models while retaining a directly implementable mathematical form.
The performance of the developed equations relative to the existing shear strength formulations is discussed separately in Section 5.2.

5.2. Comparison with Existing Shear Strength Formulations

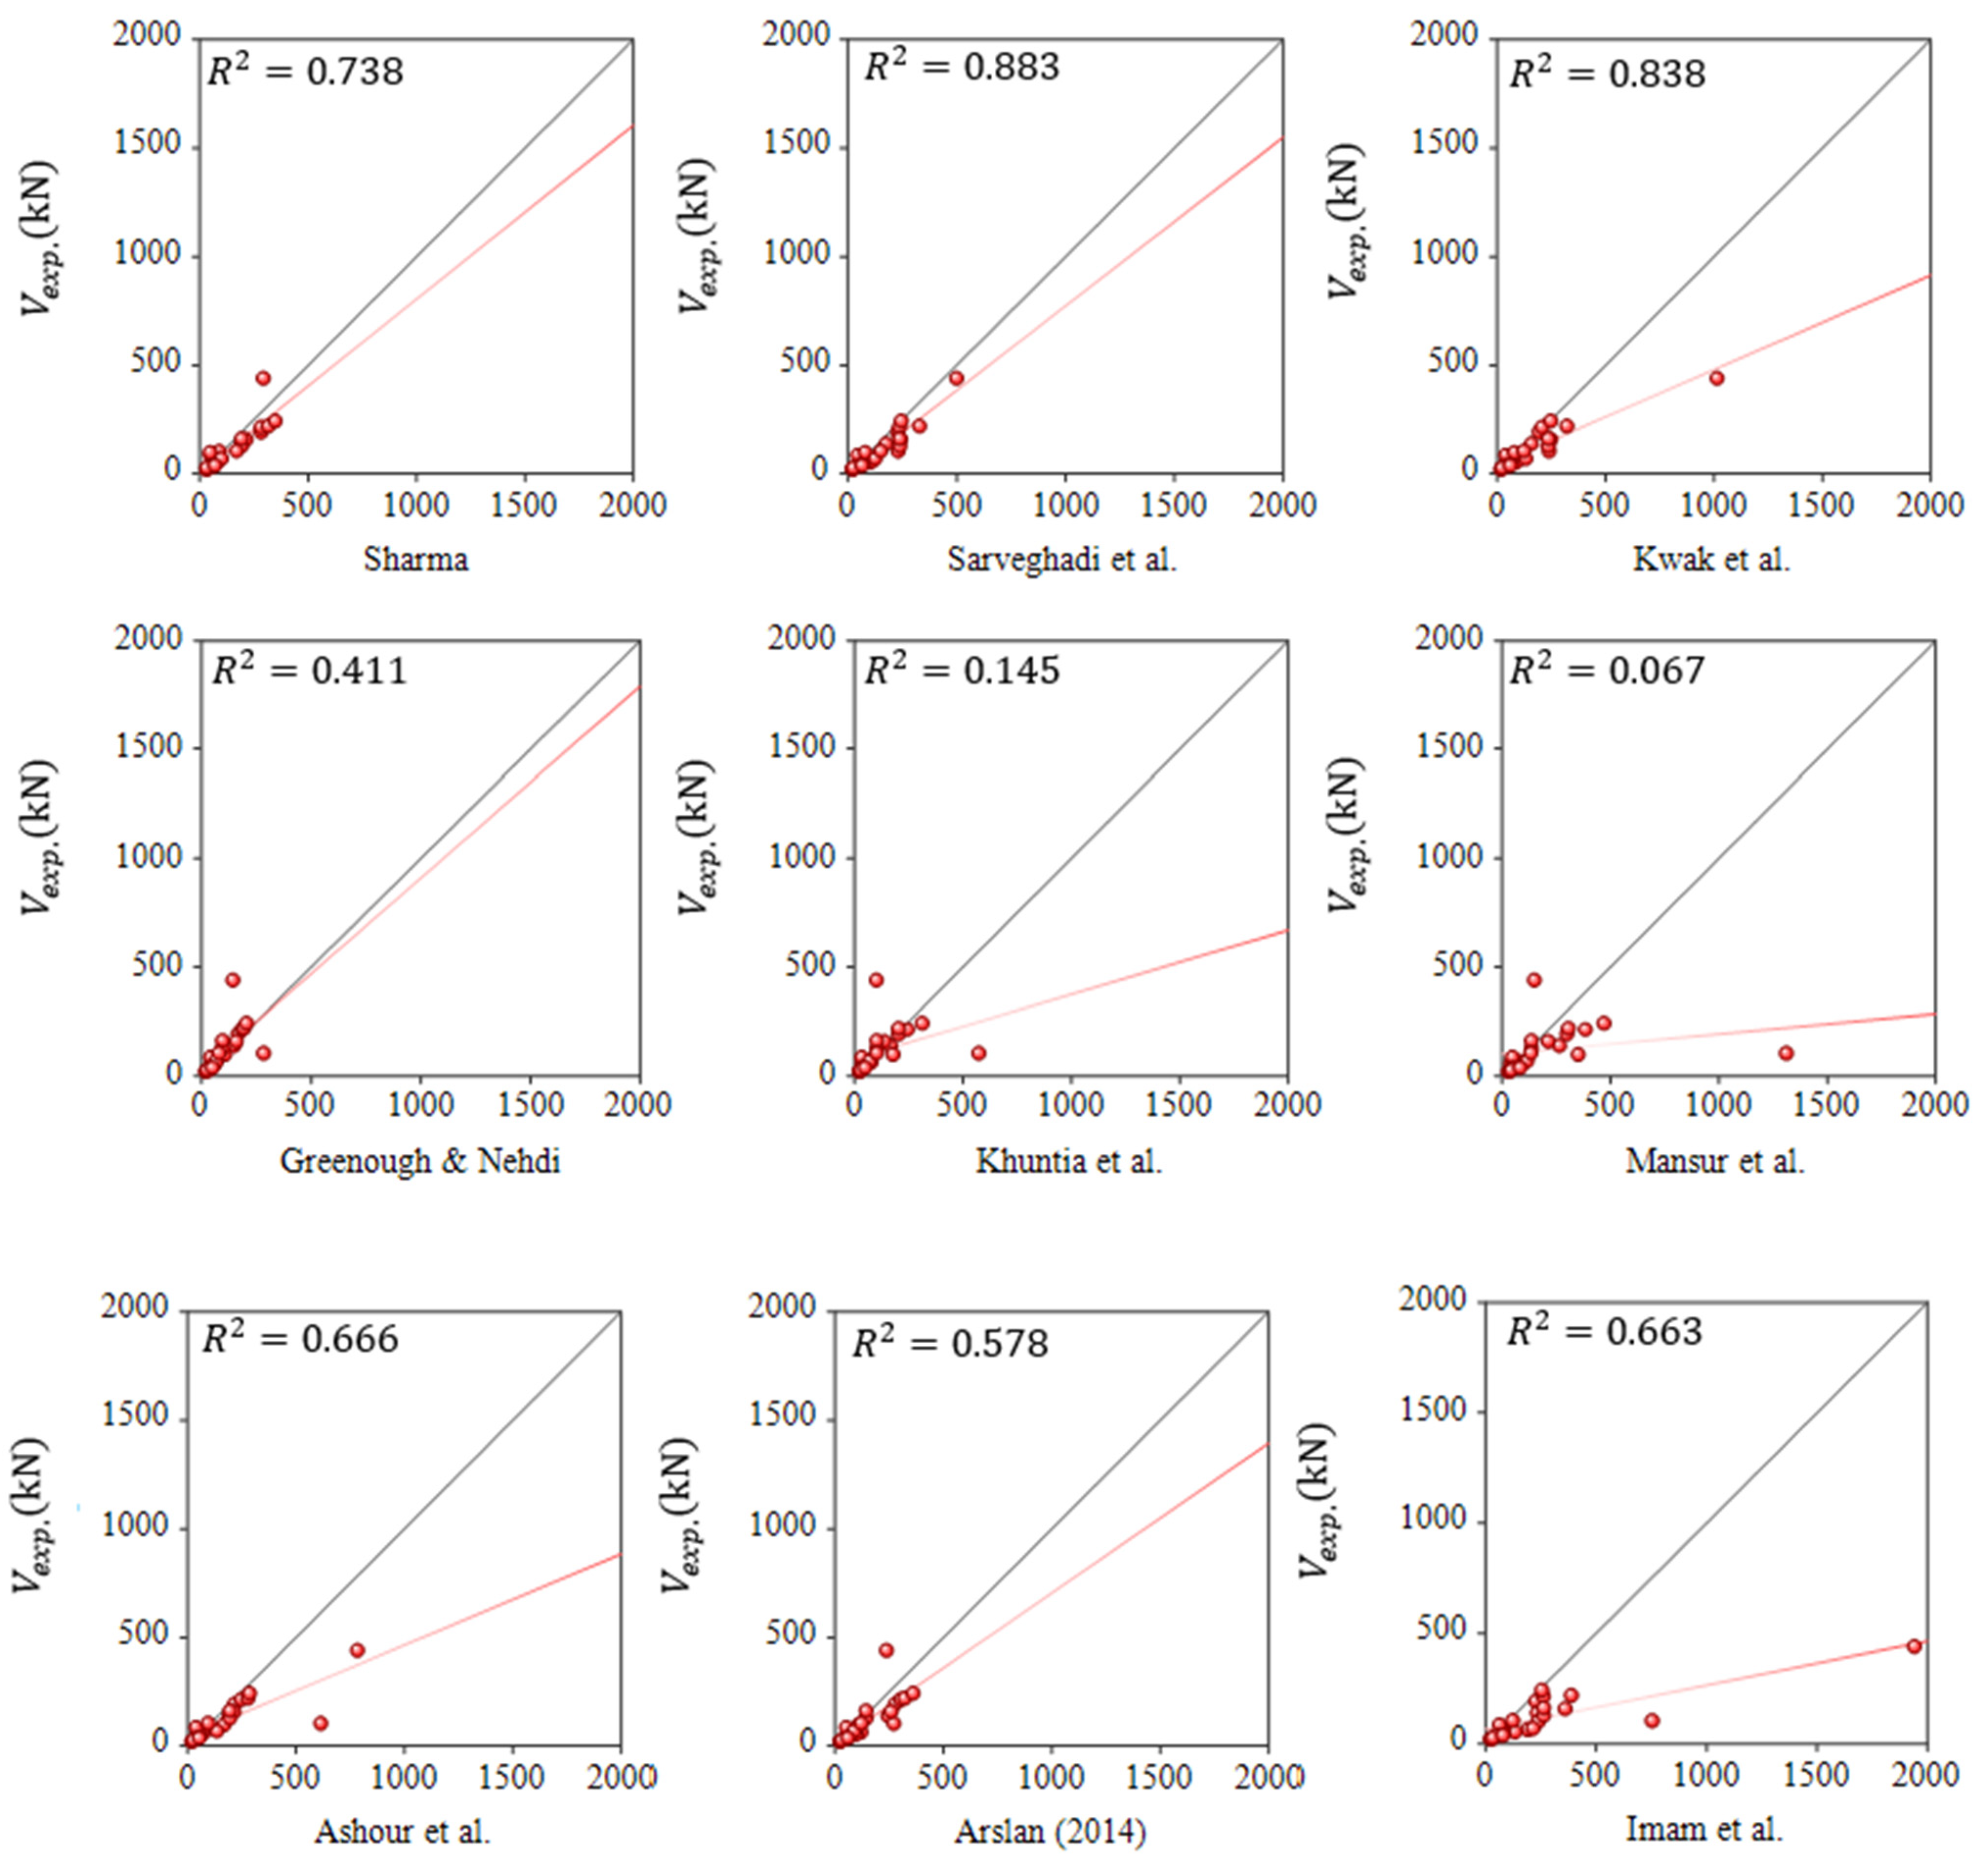
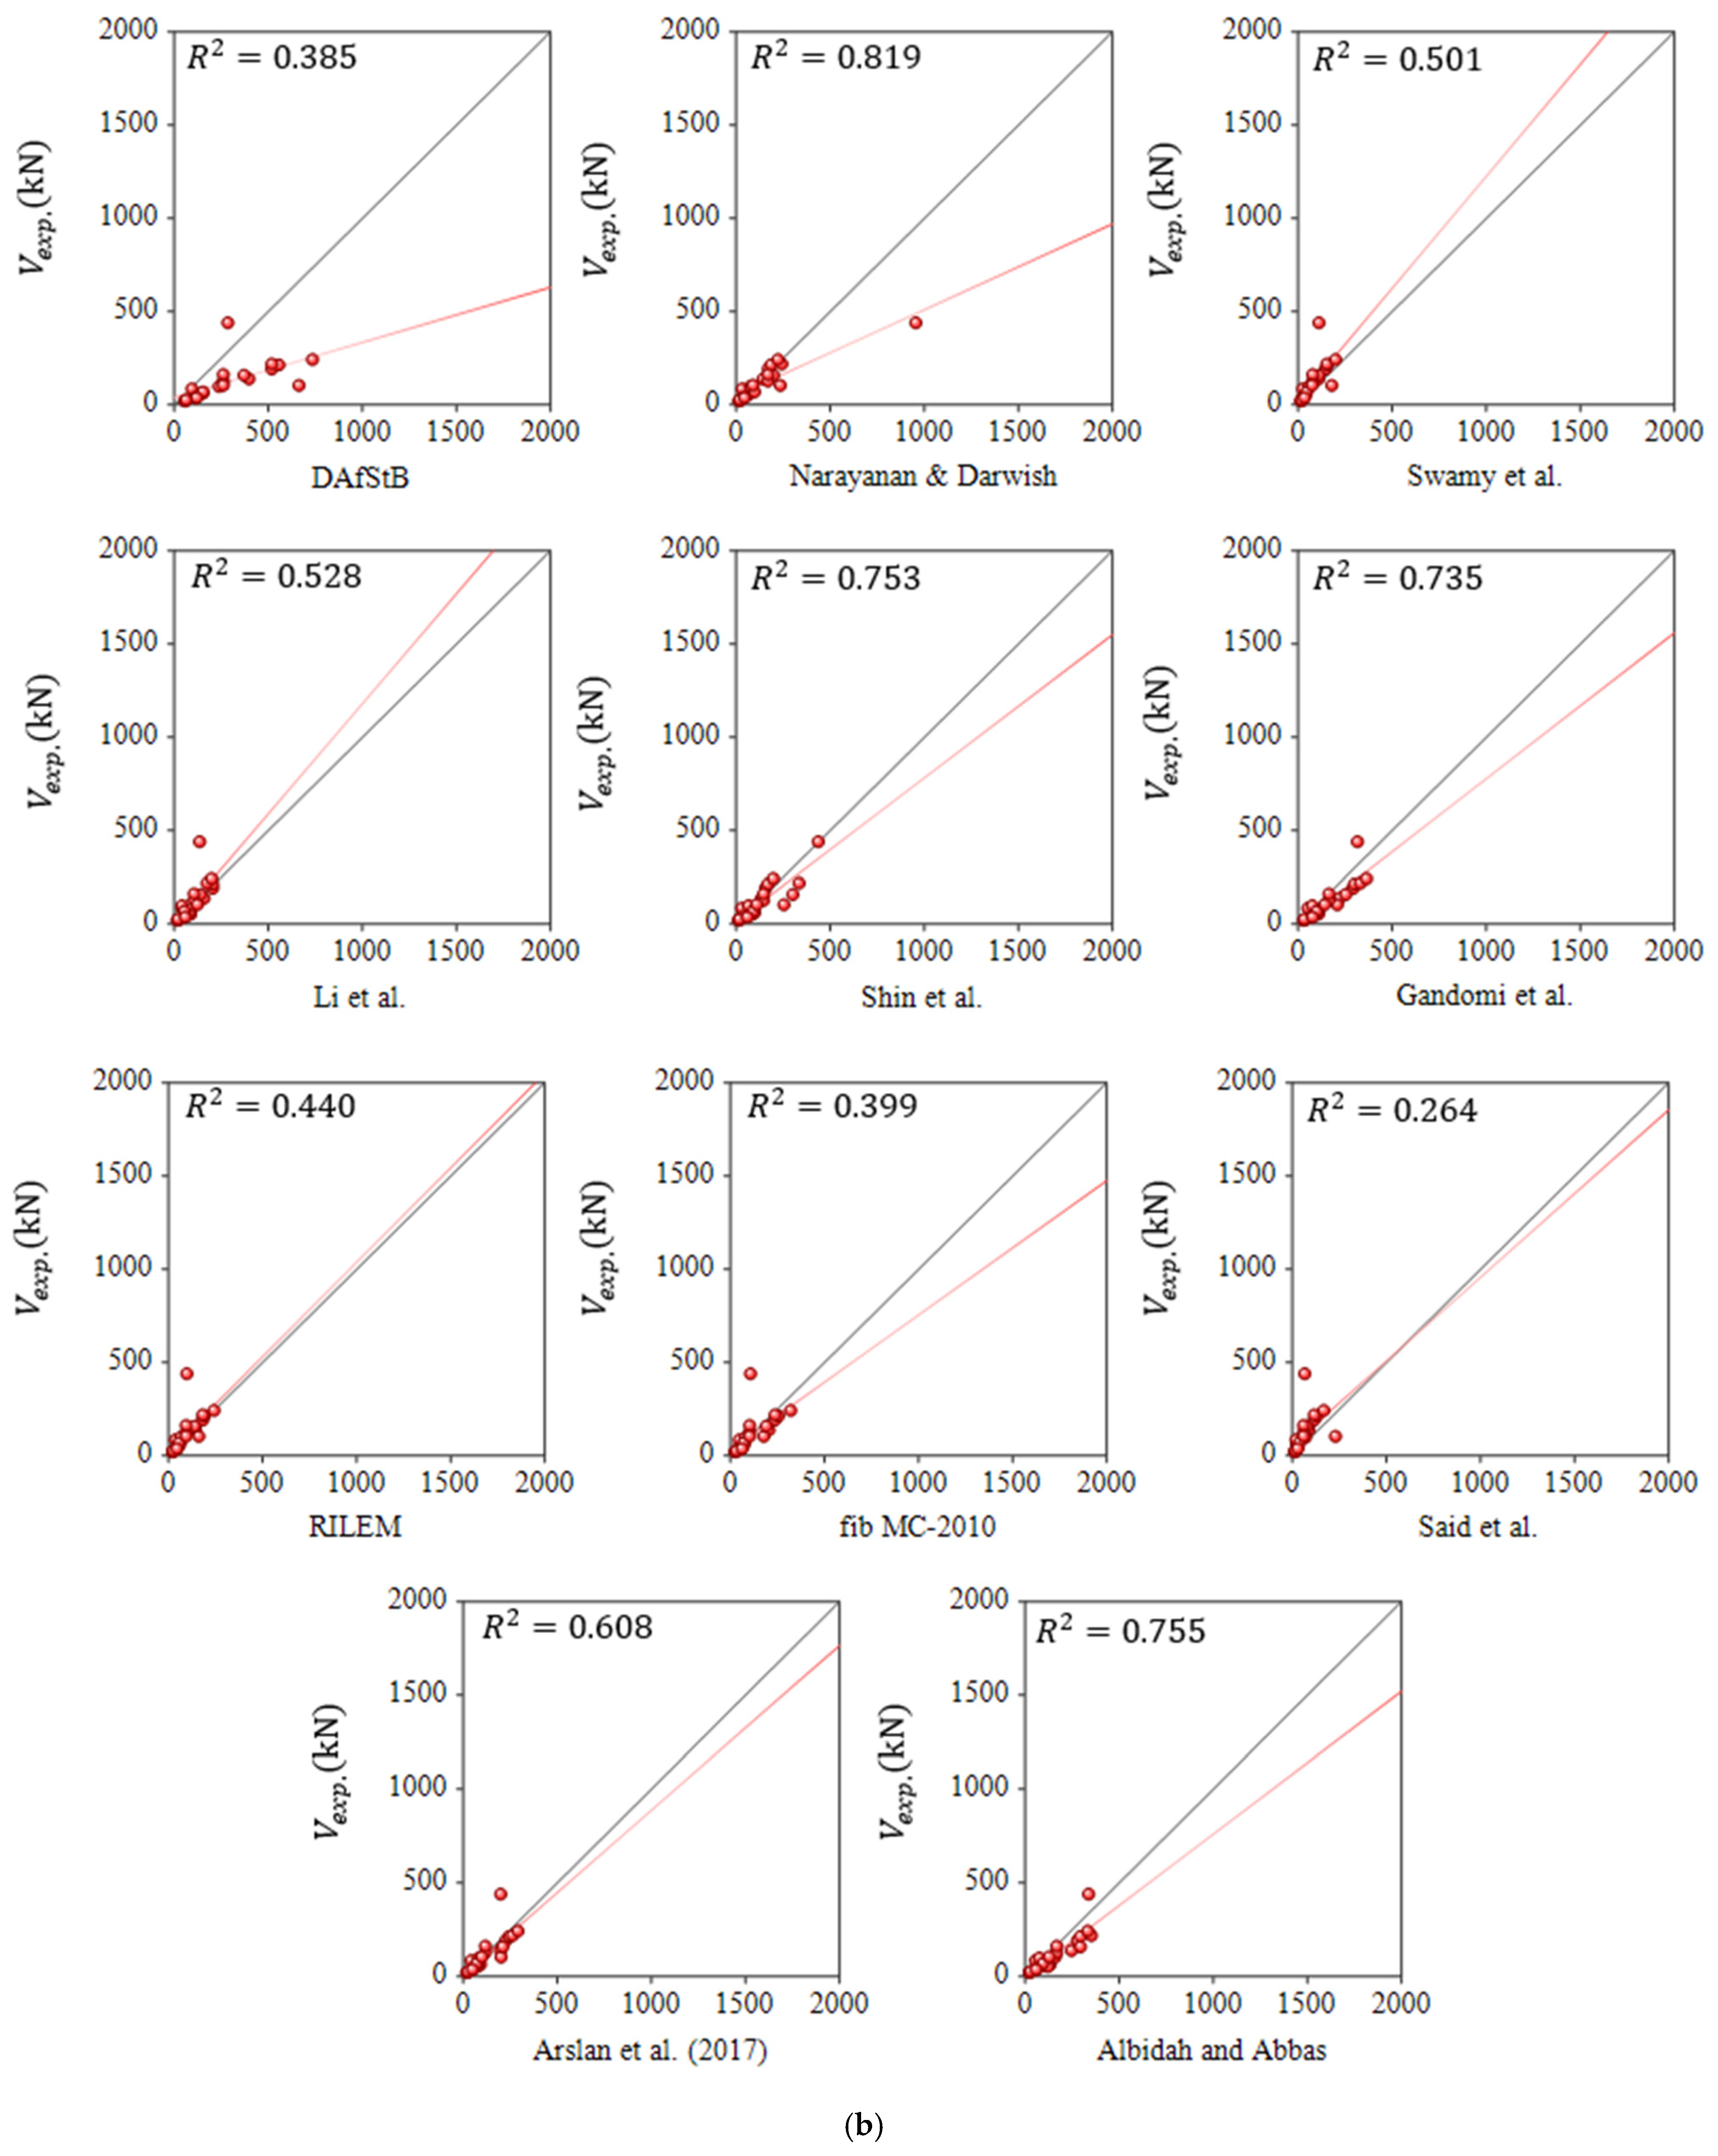
The developed GEP and MEP equations were subsequently compared with the twenty existing shear strength formulations introduced in Section 3.6. All formulations were evaluated using the same hold-out testing subset and the performance indicators defined in Section 3.5. The statistical results are reported in Table 5, the experimental and predicted shear capacities are compared in Figure 4b, and the corresponding performance indicators are presented graphically in Figure 5.
The existing formulations exhibited substantial variation in predictive performance, with R 2 values ranging from 0.067 to 0.883. No single existing formulation performed best according to all statistical indicators. Sarveghadi et al. [79] achieved the highest R 2 of 0.883, Arslan et al. (2017) [48] produced the lowest M A P E of 25.812%, Albidah and Abbas [87] yielded the lowest COV of 0.344, and Arslan et al. (2017) [48] provided the M V closest to unity, at 1.025. The developed MEP equation provided the most balanced performance, with R 2 = 0.976, R M S E =15.746 kN, M A P E =10.554%, M V =1.007, and C O V = 0.143. Compared with the best individual values obtained from the existing formulations, MEP increased the highest R 2 from 0.883 to 0.976, reduced the lowest MAPE among the existing formulations from 25.812% to 10.554%, and lowered the minimum COV from 0.344 to 0.143. The GEP equation also achieved a higher R 2 and lower RMSE and MAPE values than all existing formulations evaluated in this study, although its COV remained higher than that obtained using the proposed MEP equation. The scatter plots in Figure 4b support these statistical findings, particularly at higher shear capacity levels. These comparisons should be interpreted in view of the different calibration databases, fiber systems, theoretical assumptions, and required input parameters of the existing formulations. As described in Section 3.6, supplementary assumptions were required for unavailable quantities such as fiber–concrete bond stress, maximum aggregate size, and residual tensile strength parameters. Although a consistent implementation procedure was used, these assumptions may have influenced the predictions of some formulations.

5.3. Interpretation and Sensitivity Analysis of MEP Predictions

5.3.1. SHAP-Based Interpretation

To investigate the importance of the input variables to the results produced from the derived MEP model, the Shapley additive explanations (SHAP) technique [92] was carried out on the testing dataset. The SHAP technique was applied directly to the MEP model that was developed, and the original input variables were used without normalization. Therefore, the SHAP values are the result of the importance of each input variable to the predicted shear capacity for the 24 specimens of the testing dataset.
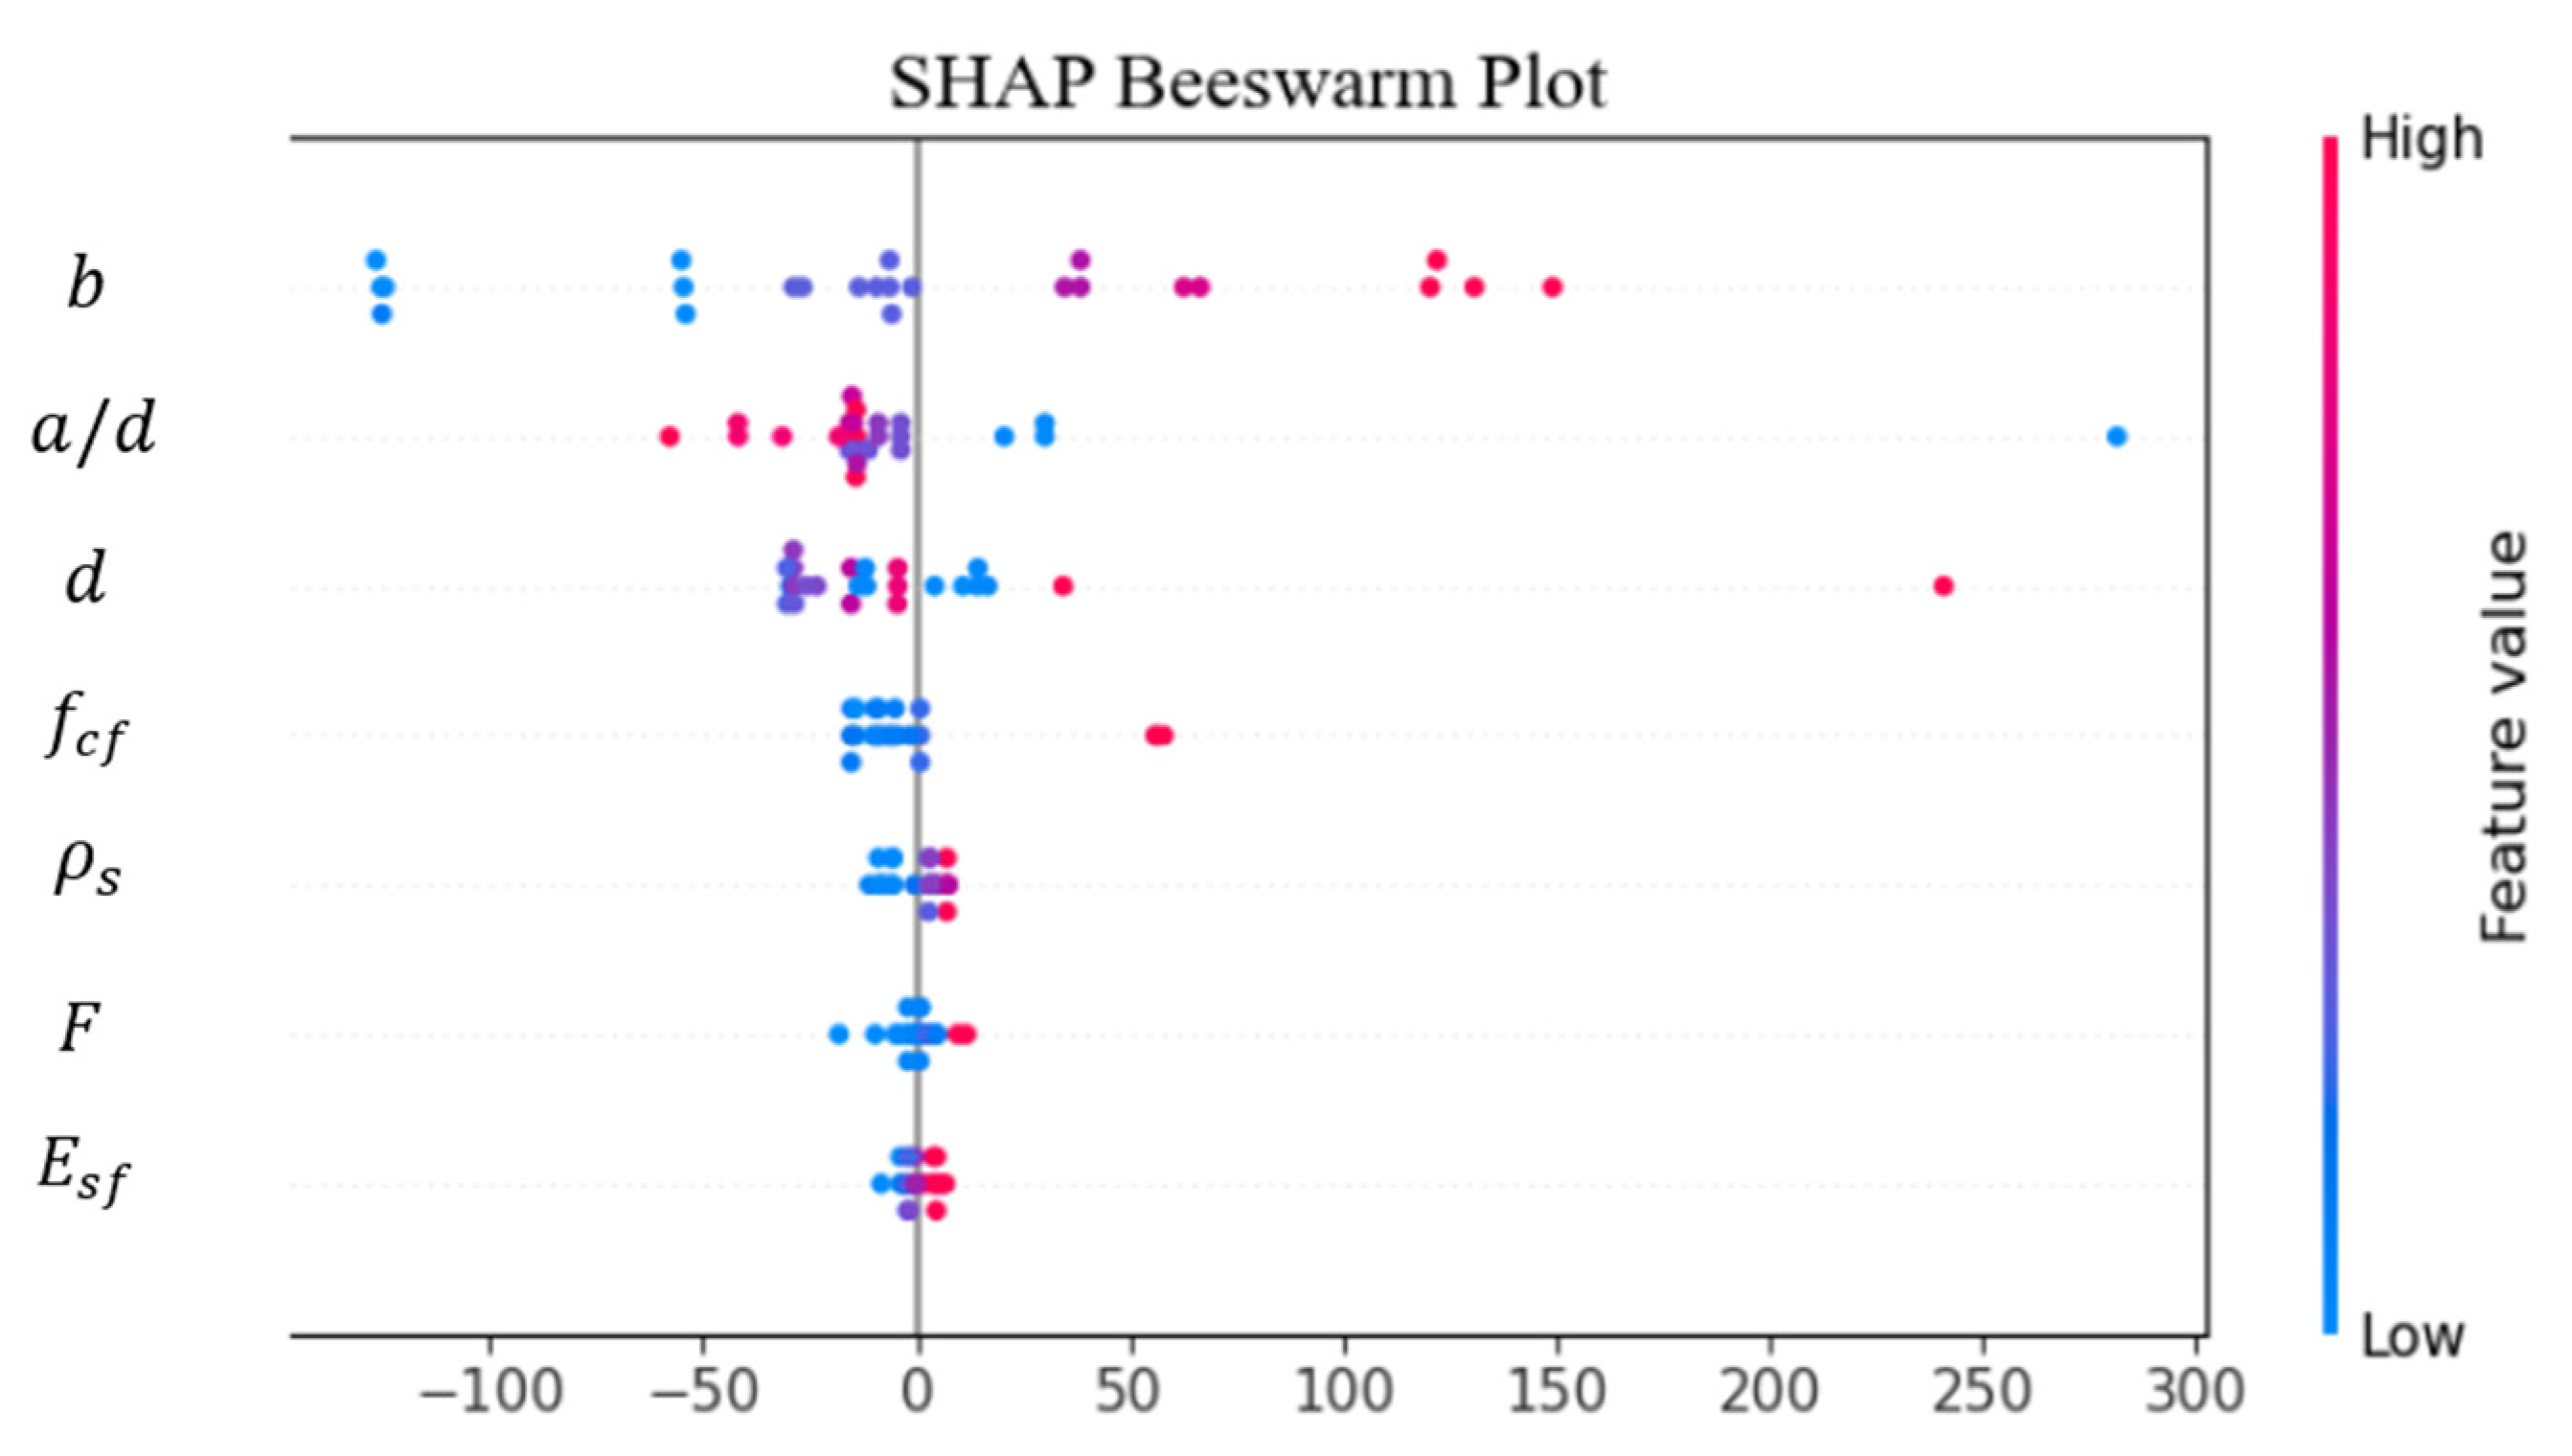
Figure 6 shows the SHAP summary plot of the formulated MEP equation. These variables are sorted based on their mean absolute SHAP values, with the most important variables being arranged at the top end of the plot. Points on the plot correspond to individual specimens in the test dataset. A positive SHAP value means the effect of the variable is an increase in shear strength compared with the reference prediction, while a negative value means a decrease in the shear strength prediction. The color scale represents the original magnitude of each input variable, with higher and lower values shown at opposite ends of the scale.
Beam width b exhibited the largest contribution to the predictions generated by the MEP equation. Higher values of b were generally associated with positive SHAP values, indicating increased predicted shear capacity. This trend is reasonable because a wider beam provides a larger cross-sectional area contributing to the total shear resistance. However, the relatively high importance of b should also be interpreted in view of the use of total shear capacity, rather than normalized shear stress, as the target variable. The ratio of the shear span to effective depth ( a / d ) was found to be the second most significant factor. As the a/d ratio increased, the prediction became less favorable for the shear resistance capacity; as it decreased, the predictions were more favorable. This behavior follows the logic that at low a / d ratios, arching is more dominant than the beam mode of action.
Effective depth d also made a substantial contribution to the MEP predictions. Higher values of d were generally associated with positive SHAP values for the predicted total shear capacity. Nevertheless, this observation should not be interpreted as evidence against the size effect commonly discussed in terms of normalized shear strength. Because the target variable was the total shear capacity, an increase in member dimensions may produce a positive contribution even when the corresponding normalized shear stress decreases. The compressive strength of concrete ( f c f ) contributed less than the main geometric parameters but still had significance in the calculation of the shear resistance capacity. The longitudinal steel ratio ( ρ s ), fiber factor ( F ), and elastic modulus of polypropylene fibers ( E s f ) had lower mean absolute SHAP values. Even though their significance was relatively low, they still influenced the prediction and were factors in the MEP equation.
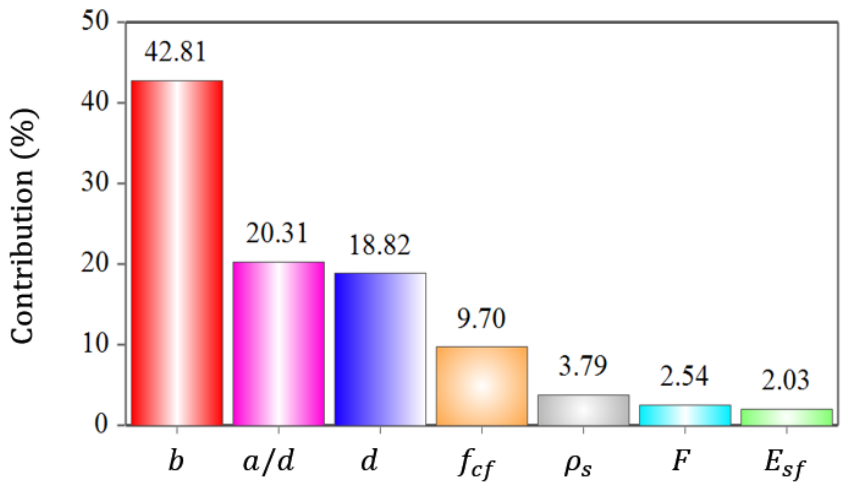
The relative importance values calculated from the mean absolute SHAP values are presented in Figure 7. Beam width, the shear span-to-effective depth ratio, and effective depth accounted for 42.81%, 20.31%, and 18.82% of the total model-based importance, respectively. Their combined contribution was 81.94%. Concrete compressive strength accounted for 9.70%, while the combined contribution of the longitudinal reinforcement ratio, fiber factor, and fiber elastic modulus was 8.36%.
The SHAP results indicate that the predictions generated by the MEP equation were primarily governed by the geometric characteristics of the beams and the shear span-to-effective depth ratio within the testing dataset. These findings describe the behavior of the developed equation rather than establishing the independent physical importance of the variables in the shear transfer mechanism. Moreover, because the analysis was based on only the 24 testing specimens, and the input variables were used in their original units, the reported importance values should be interpreted within the range and distribution of the testing data.

5.3.2. One-at-a-Time Sensitivity and Parametric Analysis

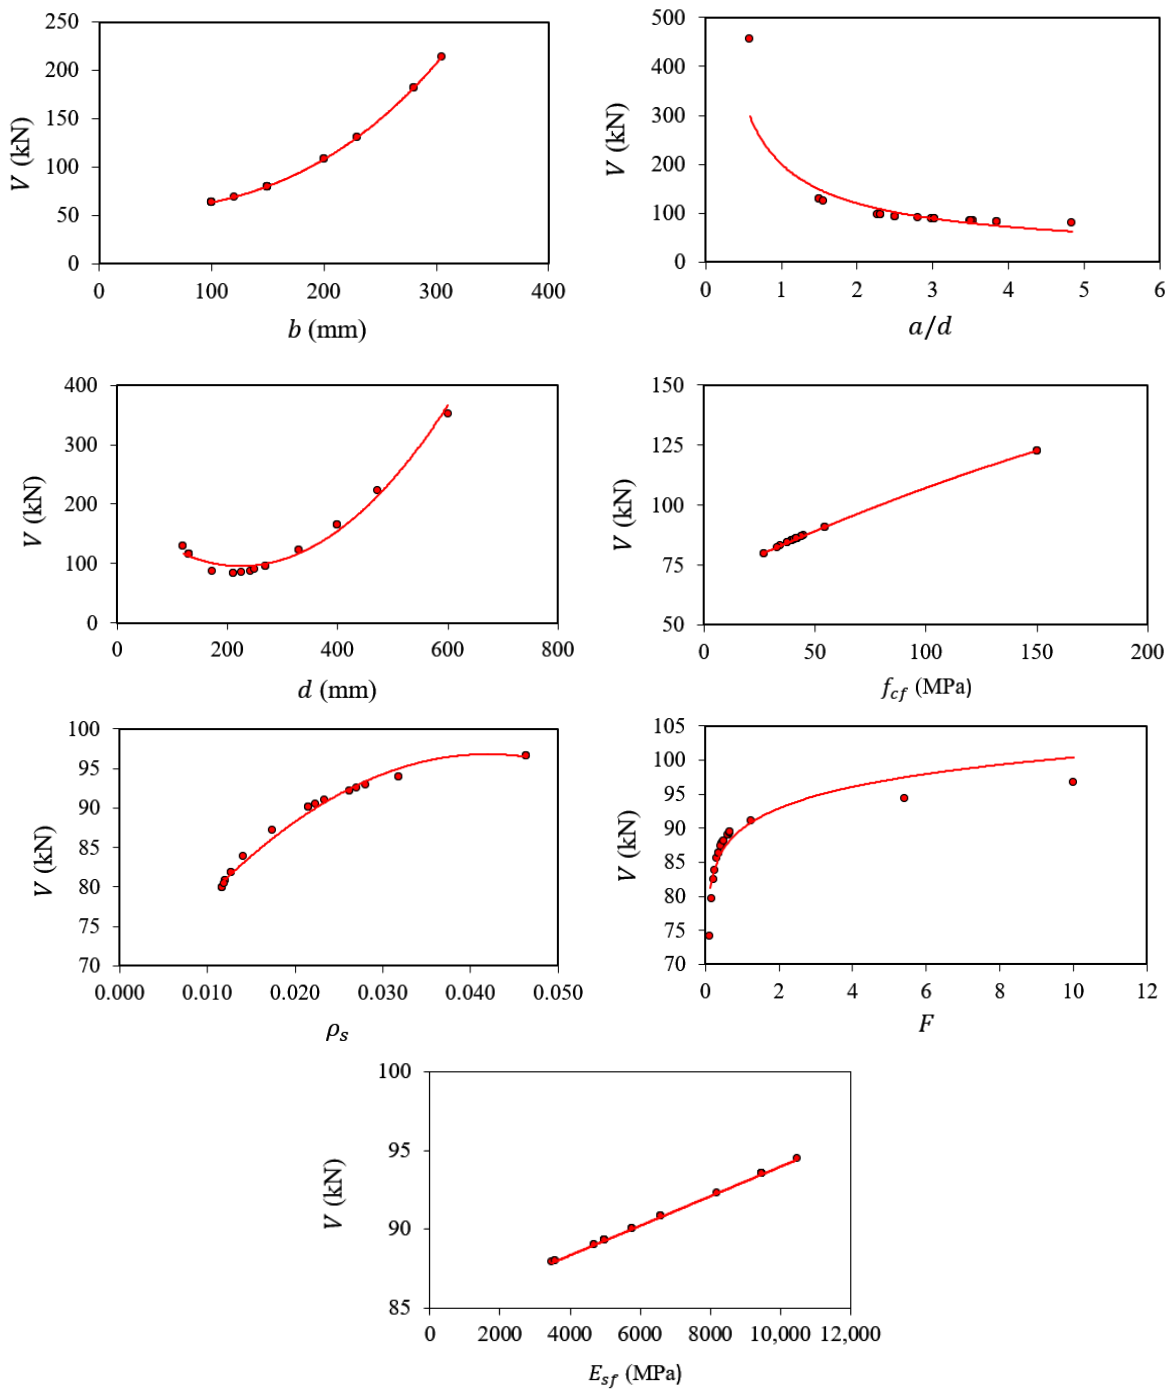
To complement the SHAP-based interpretation and examine the directional response of the MEP equation, a one-at-a-time (OAT) sensitivity and parametric analysis was conducted using the hold-out testing subset. Following the procedure adopted in previous symbolic modeling studies [47,69], each input variable was varied individually between its minimum and maximum values observed in the testing subset, while the remaining six variables were held constant at their corresponding testing-subset mean values. The variation in the MEP-predicted shear capacity was used to examine the direction and nonlinearity of the model response and to calculate the relative sensitivity contribution of each input variable. In the sensitivity calculation, the output range produced by each input variable was normalized by the sum of the output ranges obtained for all seven inputs [47,69]. This analysis characterizes the mathematical response of the MEP equation within the testing-data ranges and should not be interpreted as an independent experimental assessment of physical causality.
Figure 8 illustrates the parametric responses of the MEP-predicted shear capacity to variations in different structural parameters. The parametric responses show that the MEP-predicted shear capacity increases nonlinearly with beam width. The response to effective depth is also nonlinear and non-monotonic, exhibiting an initial decrease followed by a pronounced increase at larger depths. In contrast, increasing the shear span-to-effective depth ratio produces a substantial reduction in predicted shear capacity, which is consistent with the decreasing contribution of arching action as the structural response shifts toward beam action. The predicted capacity increases over most of the investigated range of the longitudinal reinforcement ratio but tends to plateau at higher reinforcement ratios. The fiber factor produces a positive but gradually diminishing response, whereas concrete compressive strength and the fiber elastic modulus exhibit approximately positive linear relationships with the predicted capacity over the evaluated ranges.
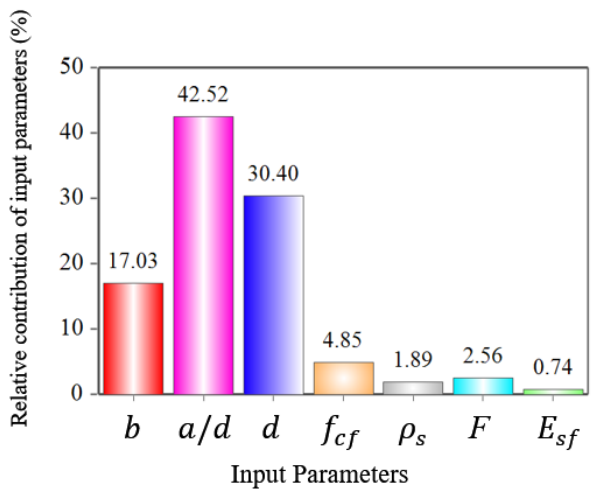
According to the OAT sensitivity analysis in Figure 9, the ratio of the shear span to effective depth was the most sensitive parameter, contributing a percentage of 42.52%, while the effective depth and beam width were the second and third most sensitive parameters, contributing percentages of 30.40% and 17.03%, respectively. The three mentioned variables were responsible for 89.95% of the total sensitivity in the OAT analysis. The concrete compressive strength, fiber factor, longitudinal reinforcement ratio, and fiber elastic modulus contributed percentages of 4.85%, 2.56%, 1.89%, and 0.74%, respectively. The results indicate that the mathematical response of the MEP equation is governed predominantly by member geometry and the shear span-to-effective depth ratio within the ranges represented by the testing subset.
While the relative importance derived from SHAP and OAT was different, beam width, effective depth, and the shear span-to-effective depth ratio were found to be the important parameters that control the MEP predictions by both SHAP and OAT analyses. The difference in the results is a result of the different objectives of the two methods. While SHAP captures the contribution of each parameter based on actual combinations present in the test set specimens, OAT captures the output variation due to a change in one input parameter from its minimum to maximum value, keeping all other parameters constant at their average values. Neither of the two methods establishes a physical cause-and-effect relationship and converts the data-driven equation into a mechanics-based shear model.

6. Conclusions

This study developed explicit GEP- and MEP-based equations for predicting the shear capacity of polypropylene- and macro-synthetic-fiber-reinforced concrete beams without transverse reinforcement. The proposed equations were evaluated using a hold-out testing subset and compared under consistent conditions with six benchmark machine learning algorithms and twenty existing shear strength formulations. The main conclusions are as follows:
  • The MEP equation yielded the best results for the hold-out test set, giving R 2 = 0.976, R M S E = 15.75 kN, M A P E = 10.55%, M V = 1.007 and C O V = 0.143. The near-unity value of M V and low C O V suggest minimal systematic error and consistency in the ratio of the experimental and predicted shear capacities. Meanwhile, the GEP equation gave satisfactory results, with R 2 = 0.965, R M S E = 18.00 kN, M A P E = 18.16%, M V = 0.977 and C O V = 0.250, but had higher error and scatter compared with the MEP equation.
  • Among the benchmark machine learning algorithms, CatBoost achieved the highest testing R 2 of 0.968. Nevertheless, the MEP equation provided a higher R 2 together with lower R M S E and M A P E values. This finding indicates that, under the adopted hold-out testing conditions, an explicit symbolic equation can achieve predictive performance comparable to or better than that of the evaluated machine learning models while retaining a directly implementable mathematical form.
  • The twenty existing shear strength formulations exhibited substantial variation in predictive performance, and no single formulation performed best according to all statistical criteria. Sarveghadi et al. provided the highest R 2 of 0.883, Arslan et al. yielded both the lowest MAPE of 25.81% and the M V closest to unity, at 1.025, and Albidah and Abbas produced the lowest C O V of 0.344. In comparison, the MEP equation increased the highest R 2 from 0.883 to 0.976, reduced the lowest M A P E from 25.81% to 10.55%, and reduced the lowest C O V from 0.344 to 0.143. The MEP equation, therefore, provided a more balanced performance in terms of correlation, prediction error, bias, and dispersion.
  • The SHAP and OAT results agreed that beam width, effective depth, and the ratio of the shear span to effective depth were key variables for determining the MEP predictions despite the difference in their ranking orders due to the different ways that the two methods interpret model behaviors. The OAT result indicated that an increase in the ratio of the shear span to effective depth would lower the prediction of the shear capacity, while an increase in beam width, concrete compressive strength, the fiber factor, and the fiber elastic modulus led to a positive impact. Nonlinear impacts were obtained on the variation in the effective depth and reinforcement ratio. Such tendencies enhance our understanding of the MEP formula at the model level, but SHAP or OAT does not indicate the mechanism of such physical relationships.
In the tested ranges of parameters, the proposed MEP formula serves as an accurate, explicit, and easy-to-implement method for predicting the shear strength of PFRC beams with no transverse reinforcement. However, several caveats need to be addressed. Firstly, the proposed formulas are based on a limited experimental database, and the results are not uniformly distributed within the ranges of parameters. Second, the models were evaluated using a single random hold-out testing subset rather than a fully independent external experimental dataset or a study-wise validation procedure. Thirdly, the equations serve as empirical symbolic models and do not describe any mechanisms involved in the process of shear transfer. They should, thus, be used only for the ranges of geometrical, material, reinforcing, and fiber parameters present in the experimental database. Additionally, they do not contain any resistance or safety factors and are not meant as a replacement for the design methods defined in codes.
Further investigation is required to validate the suggested formulas based on independent experimental data within wider ranges of the considered parameters. It is also important to account for additional validation, uncertainty analysis, reliability testing, optimization, dimensional homogeneity, and mechanical constraints in order to increase the applicability of symbolic regression models.

Author Contributions

H.C.A.: literature review, data curation, conceptualization, methodology, validation, investigation, writing—original draft, and writing—review and editing. K.S.: conceptualization, methodology, investigation, formal analysis, data curation, writing—original draft, project administration, and writing—review and editing. S.A.: methodology, software, validation, visualization, supervision, and writing—review and editing. A.N.: literature review, data curation, validation, and writing—review and editing. All authors have read and agreed to the published version of the manuscript.

Funding

This research received no specific grant from any funding agency in the public, commercial, or not-for-profit sectors.

Data Availability Statement

The data supporting the findings of this study are provided in Appendix B, Table A2. The data were compiled from the published studies cited in this manuscript.

Conflicts of Interest

The authors declare no conflicts of interest.

Nomenclature/Abbreviations

b Beam width (mm)
d Effective depth of the beam (mm)
a / d Shear span-to-effective depth ratio
ρ s Longitudinal reinforcement ratio
f y Yield strength of longitudinal reinforcement (MPa)
f c f Concrete compressive strength (MPa)
V f Fiber volume fraction (%)
l f / d f Fiber aspect ratio (ratio of fiber length to fiber diameter)
F Fiber factor
f s f Fiber tensile strength (MPa)
E s f Fiber elastic modulus (MPa)
V e x p Experimentally measured shear capacity (kN or N)
V p r e d Predicted shear capacity
V G E P Shear capacity predicted by the GEP equation (N)
V M E P Shear capacity predicted by the MEP equation (N)
τInterfacial bond stress between fiber and concrete (MPa)
d a Maximum aggregate size (mm)
f R 1 , f R 3 Residual flexural tensile strengths
RIFiber reinforcement index
RCReinforced concrete
FRCFiber-reinforced concrete
PFRCPolypropylene-fiber-reinforced concrete
GEPGene Expression Programming
MEPMulti-Expression Programming
MLMachine learning
RFRandom Forest
ETExtra Trees
GPRGaussian Process Regression
AdaBoostAdaptive Boosting
XGBoostExtreme Gradient Boosting
SHAPShapley additive explanations
OATOne-at-a-time
R2Coefficient of determination
RMSERoot-mean-square error
MAPEMean absolute percentage error
MVMean value of the experimental-to-predicted shear strength ratios
COVCoefficient of variation
SDStandard deviation
nNumber of observations

Appendix A. Mathematical Representation of the Developed MEP Model

The mathematical expression of the MEP model constructed is shown in Table A1 below. This table shows the program structure and the mathematical calculations that led to the generation of the prediction equation.
Table A1. Mathematical representation of the developed MEP model.
StepExpression
prg[0] ρ s
prg[1] d   ( m m )
prg[2] a / d
prg[3]prg[2] − prg[0]
prg[4]prg[1] + prg[0]
prg[5]prg[4] × prg[4]
prg[6] b   ( m m )
prg[7] f c f   ( M P a )
prg[8]prg[4]/prg[0]
prg[9] F
prg[10]prg[6] + prg[9]
prg[11]prg[5]/prg[9]
prg[12]prg[11]/prg[7]
prg[13]prg[10] × prg[10]
prg[14] E s f   ( M P a )
prg[15]prg[7] × prg[6]
prg[16]prg[13] + prg[13]
prg[17]prg[16]/prg[5]
prg[18]prg[15] − prg[12]
prg[19]prg[3] × prg[3]
prg[20]prg[5] − prg[8]
prg[21]prg[17] × prg[18]
prg[22]prg[14] × prg[17]
prg[23]prg[16]/prg[19]
prg[24]prg[21] + prg[20]
prg[25]prg[24] + prg[23]
prg[26]prg[21] + prg[25]
prg[27]prg[22] + prg[26]
prg[28]prg[6] + prg[23]
V p r e   ( N ) prg[28] + prg[27]

Appendix B. Experimental Database

The complete experimental database used for model development and hold-out evaluation of the proposed prediction models is presented in Table A2. The database consists of 98 polypropylene-fiber-reinforced concrete (PFRC) beam specimens collected from 28 independent experimental studies reported in the literature. The database includes geometric parameters, reinforcement characteristics, concrete properties, fiber properties, and experimentally measured shear strengths used throughout the present investigation. The experimental shear strength values are reported in kN for consistency with the developed symbolic regression equations and the performance evaluation metrics adopted in this study.
Note: The fiber factor ( F ) employed in the developed GEP and MEP models was calculated as
F = V f l f d f
where V f is the fiber volume fraction (%), and l f / d f   is the fiber aspect ratio.
Table A2. Experimental database used in the present study.
IDReferenceBeam ID b (mm) d (mm) a / d ρ s f y (MPa) V f (%)Aspect
Ratio
f c f (MPa) f s f (MPa) E s f (MPa) V e x p (kN)
1Altoubat et al. [9]L1-0.50-b2804003.530.0224200.5090.0041.906209500193.00
2Altoubat et al. [9]L2-0.50-a2303303.500.0324200.5090.0041.906209500131.50
3Altoubat et al. [9]L2-0.50-b2303303.500.0324200.5090.0041.906209500133.50
4Altoubat et al. [9]L1-0.75-a2804003.530.0224200.7590.0041.906209500214.50
5Altoubat et al. [9]L1-0.75-b2804003.530.0224200.7590.0041.906209500213.00
6Altoubat et al. [9]L2-0.75-b2303303.500.0324200.7590.0041.906209500139.50
7Altoubat et al. [9]L2-1.0-b2303303.500.0324201.0090.0035.606209500151.50
8Altoubat et al. [9]Sh1-0.50-a2804002.280.0224200.5090.0041.906209500219.50
9Altoubat et al. [9]Sh2-0.50-b2303302.270.0324200.5090.0041.906209500150.00
10Altoubat et al. [9]Sh2-0.75-a2303302.270.0324200.7590.0041.906209500168.50
11Altoubat et al. [9]Sh2-0.75-b2303302.270.0324200.7590.0041.906209500170.50
12Navas et al. [10]OAP1305472.93.870.0175791.1056.5043.124004700223.34
13Navas et al. [10]OAP2305472.54.840.0225791.1056.5044.914004700243.13
14Navas et al. [10]OBP1229470.63.890.0225791.1056.5042.674004700180.87
15Navas et al. [10]OBP2229469.24.870.0225791.1056.5042.004004700147.80
16Al-Alawi and Mashrei [20]B-Sy M PF1–6.41001302.310.0465000.6964.00150.0068510,50065.26
17Al-Alawi and Mashrei [20]B-Sy M PF1–4.81001302.310.0465000.5264.00150.0068510,50058.84
18Al-Alawi and Mashrei [20]B-Sy M PF1–3.21001302.310.0465000.3464.00150.0068510,50057.77
19Al-Alawi and Mashrei [20]B-Sy M PF2–6.41001302.310.0465000.69180.00150.00620660064.72
20Al-Alawi and Mashrei [20]B-Sy M PF2–4.81001302.310.0465000.52180.00150.00620660057.77
21Al-Alawi and Mashrei [20]B-Sy M PF2–3.21001302.310.0465000.34180.00150.00620660054.56
22Al-Alawi and Mashrei [20]B-Sy M PF1–4.8 -ρ31001302.310.0465000.5264.00150.0068510,50066.86
23Al-Alawi and Mashrei [20]B-Sy M PF1–4.8 -ρ21001302.310.0405000.5264.00150.0068510,50058.84
24Al-Alawi and Mashrei [20]B-Sy M PF1–4.8 -ρ11001302.310.0335000.5264.00150.0068510,50044.93
25Xiang et al. [49]F3-A-3150241.52.980.0285420.3237.5034.50543820062.86
26Xiang et al. [49]F6-A-3150241.52.980.0285420.6337.5037.50543820083.89
27Xiang et al. [49]F9-A-3150241.52.980.0285420.9537.5036.90543820096.72
28Altoubat et al. [29]VB-0L-0.502303303.480.0324200.5090.0032.30620950090.00
29Uğur and Ünal [18]SCC-F2-S11252402.500.005366.470.2877.1438.61550706023.35
30Zhang et al. [19]RE-001502502.800.0274003.00333.3332.804825000104.38
31Ababneh et al. [50]B1V3S01001252.400.0324700.3390.0044.40620950032.00
32Ababneh et al. [50]B1V5S01001252.400.0324700.5490.0045.10620950035.00
33Ababneh et al. [50]B1V7S01001252.400.0324700.7690.0045.90620950038.50
34Arslan et al. [48]B2.5P1.01502102.500.0134921.0050.0027.00470360047.92
35Arslan et al. [48]B2.5P2.01502102.500.0134922.0050.0013.85470360042.94
36Arslan et al. [48]B2.5P3.01502102.500.0134923.0050.0018.45470360056.06
37Arslan et al. [48]B3.5P1.01502103.500.0134921.0050.0027.00470360046.75
38Arslan et al. [48]B3.5P2.01502103.500.0134922.0050.0013.85470360042.50
39Arslan et al. [48]B3.5P3.01502103.500.0134923.0050.0018.45470360050.72
40Majdzadeh et al. [51]B61501203.020.0265000.5085.0043.90620950086.00
41Majdzadeh et al. [51]B71501203.020.0265001.0085.0044.206209500113.00
42Majdzadeh et al. [51]B81501203.020.0265001.5085.0043.106209500104.00
43Majdzadeh et al. [51]B91501203.020.0265000.50360.0043.40375350082.00
44Majdzadeh et al. [51]B101501203.020.0265001.00360.0044.803753500100.00
45Majdzadeh et al. [51]B111501203.020.0265001.50360.0042.00375350099.00
46Sahoo et al. [52]PFRC1501723.490.0235001.0025.0037.60460500038.40
47Shaaban et al. [53]B51202602.350.0337001.50666.6745.90400345063.00
48Shaaban et al. [53]B61202602.350.0337002.50666.6745.90400345070.80
49Shaaban et al. [53]B71202602.350.0337000.75666.6745.05400345055.00
50Bastami [21]SCC-0.75%S1-15M-01252013.690.0164340.7574.0051.60625950042.85
51Bastami [21]HSC-0.75%S1-15M-01252013.690.0164340.7574.0071.40625950056.10
52Bastami [21]HSC-0.75%S1-20M-01252013.690.0244260.7574.0078.30625950085.00
53Murad and Abdel-Jabbar [54]P21502251.560.0124200.2276.5045.30585660073.90
54Murad and Abdel-Jabbar [54]P41502251.560.0124200.4476.5040.80585660057.85
55Murad and Abdel-Jabbar [54]P81502251.560.0124200.8876.5037.70585660069.75
56Altoubat et al. [13]L-F2303303.500.0324200.5090.0042.006209500132.50
57Altoubat et al. [13]Sh-F2303302.270.0324200.5090.0042.006209500159.00
58Parmentier et al. [55]Sy4.5-1-12002701.500.0125000.5070.0054.506005000128.10
59Parmentier et al. [55]Sy4.5-1-22002701.500.0125000.5070.0054.506005000162.60
60Parmentier et al. [55]Sy4.5-2-12002702.500.0125000.5070.0054.506005000105.50
61Parmentier et al. [55]Sy4.5-2-22002702.500.0125000.5070.0054.506005000111.70
62Furlan Jr. and Hanai [2]P2B10085.253.520.0175000.50840.0048.00400350017.50
63Hossain et al. [56]R0C5F12002681.850.0084960.15666.6728.30400401086.70
64Hossain et al. [56]R0C10F12002681.850.0084960.15666.6741.904004010105.10
65Shoeib et al. [22]B21206000.580.0144000.3056.4744.204004700440.00
66Shoeib et al. [22]B31206000.580.0144000.6056.4751.004004700480.00
67Shoeib et al. [22]B41206000.580.0144000.9056.4754.404004700500.00
68Mori et al. [57]C-P121001641.220.0135000.4042.8649.10500950071.45
69Mori et al. [57]D-P122504341.150.0145001.2042.8657.605009500443.15
70Bajaj and Shrisvastava [58]1-B21001303.850.012427.550.10158.8040.12680580019.95
71Bajaj and Shrisvastava [58]2-B21001303.850.017422.550.10158.8040.12680580024.30
72Bajaj and Shrisvastava [58]1-B31001303.850.012427.550.20158.8040.97680580021.00
73Bajaj and Shrisvastava [58]2-B31001303.850.017422.550.20158.8040.97680580025.35
74Bajaj and Shrisvastava [58]1-B41001303.850.012427.550.30158.8039.78680580022.20
75Bajaj and Shrisvastava [58]2-B41001303.850.017422.550.30158.8039.78680580026.40
76Bajaj and Shrisvastava [58]1-B51001303.850.012427.550.40158.8039.53680580022.80
77Bajaj and Shrisvastava [58]2-B51001303.850.017422.550.40158.8039.53680580027.15
78Bajaj and Shrisvastava [58]1-B61001303.850.012427.550.50158.8038.25680580021.75
79Bajaj and Shrisvastava [58]2-B61001303.850.017422.550.50158.8038.25680580026.25
80Bajaj and Shrisvastava [58]1-B71001303.850.012427.550.60158.8036.55680580021.45
81Bajaj and Shrisvastava [58]2-B71001303.850.017422.550.60158.8036.55680580025.05
82Al-Khafaji and Harba [23]BS21501752.860.0136780.10666.6737.20400350057.27
83Al-Khafaji and Harba [23]BS31501752.860.0136780.20666.6739.26400350049.32
84Kamal et al. [24]B10P1001302.310.0125500.1112.50130.00400350020.95
85Kamal et al. [24]B12P1001302.310.0175500.1112.50130.00400350027.00
86Al Ghali et al. [59]PP-421502251.480.0195650.2542.0049.20600950089.15
87Al Ghali et al. [59]PP-2701502251.480.0195650.25270.0040.10570350081.30
88Rafid Saeed Atea [60]BM(30)1002801.000.0295000.50667.0031.004003500160.00
89Rafid Saeed Atea [60]BM(40)1002801.000.0295001.00667.0040.004003500166.00
90Rao et al. [25]0,5-MixA1002800.710.0025000.12300.0018.47600350013.72
91Rao et al. [25]0,5-MixB1002800.710.0025000.12300.0024.36600350020.16
92Rao et al. [25]0,5-MixC1002800.710.0025000.12300.0029.78600350024.08
93Rao et al. [25]1-MixA1002800.710.0025000.23300.0019.07600350015.12
94Rao et al. [25]1-MixB1002800.710.0025000.23300.0024.60600350020.44
95Rao et al. [25]1-MixC1002800.710.0025000.23300.0031.47600350024.64
96Ozturk et al. [14]B2.5P1.01502102.500.0134921.0050.0027.00470360038.34
97Mahmut Onur Ketenci [61]C30PP12503672.450.0094200.66350.0030.006308000164.34
98Mahmut Onur Ketenci [61]C30PP22503672.450.0094200.66350.0030.006308000154.92
b is the beam width; d is the effective depth; a / d is the shear span-to-effective depth ratio; ρ s is the longitudinal reinforcement ratio; f y   is the yield strength of longitudinal reinforcement; V f is the fiber volume fraction; the aspect ratio is the ratio of fiber length to fiber diameter l f / d f ; f c f   is the concrete compressive strength; f s f is the fiber tensile strength; E s f is the fiber elastic modulus; and V e x p is the experimentally measured shear strength.

References

  1. Noghabai, K. Beams of fibrous concrete in shear and bending: Experiment and model. J. Struct. Eng. 2000, 126, 243–251. [Google Scholar] [CrossRef] [Scilit]
  2. Furlan, S.; de Hanai, J.B. Shear behaviour of fiber reinforced concrete beams. Cem. Concr. Compos. 1997, 19, 359–366. [Google Scholar] [CrossRef] [Scilit]
  3. Ortiz-Navas, F.; Navarro-Gregori, J.; Serna, P. The Effects of Polypropylene Fibres on the Shear Behaviour of a Concrete Crack: An Experimental Study. Fibers 2025, 13, 96. [Google Scholar] [CrossRef] [Scilit]
  4. Joshi, S.S.; Thammishetti, N.; Prakash, S.S. Efficiency of steel and macro-synthetic structural fibers on the flexure-shear behaviour of prestressed concrete beams. Eng. Struct. 2018, 171, 47–55. [Google Scholar] [CrossRef] [Scilit]
  5. Li, V.C.; Ward, R.J.; Hamza, A.M. Steel and synthetic fibers as shear reinforcement. ACI Mater. J. 1992, 89, 499–508. [Google Scholar] [CrossRef] [Scilit] [PubMed]
  6. Bermudez, M.; Wen, K.-W.; Hung, C.-C. A Comparative Study on the Shear Behavior of UHPC Beams with Macro Hooked-End Steel Fibers and PVA Fibers. Materials 2022, 15, 1485. [Google Scholar] [CrossRef] [Scilit] [PubMed]
  7. Karthik, M.; Maruthachalam, D. Experimental study on shear behaviour of hybrid Fibre Reinforced Concrete beams. KSCE J. Civ. Eng. 2015, 19, 259–264. [Google Scholar] [CrossRef] [Scilit]
  8. Martazaev, A.; Razzakov, S. Stress–Strain State and Strength of Fiber-Reinforced Concrete Beams with Basalt, Steel, and Polypropylene Fibers. Constr. Mater. 2026, 6, 19. [Google Scholar] [CrossRef] [Scilit]
  9. Altoubat, S.; Yazdanbakhsh, A.; Rieder, K.A. Shear behavior of macro-synthetic fiber-reinforced concrete beams without stirrups. ACI Mater. J. 2009, 106, 381–389. [Google Scholar] [CrossRef] [Scilit] [PubMed]
  10. Navas, F.O.; Navarro-Gregori, J.; Herdocia, G.L.; Serna, P.; Cuenca, E. An experimental study on the shear behaviour of reinforced concrete beams with macro-synthetic fibres. Constr. Build. Mater. 2018, 169, 888–899. [Google Scholar] [CrossRef] [Scilit]
  11. Conforti, A.; Minelli, F.; Tinini, A.; Plizzari, G.A. Influence of polypropylene fibre reinforcement and width-to-effective depth ratio in wide-shallow beams. Eng. Struct. 2015, 88, 12–21. [Google Scholar] [CrossRef] [Scilit]
  12. Arslan, G.; Keskin, R.S.O. Influence of polypropylene fibres on the shear strength of RC beams with web reinforcement. Eur. J. Environ. Civ. Eng. 2019, 23, 1222–1234. [Google Scholar] [CrossRef] [Scilit]
  13. Altoubat, S.; Yazdanbakhsh, A.; Rieder, K.-A. Shear strength of beams reinforced with synthetic macro-fibers and stirrups. In 8th RILEM International Symposium on Fibre Reinforced Concrete: Challenges and Opportunities (BEFIB 2012), Proceedings of the 8th RILEM International Symposium on Fibre Reinforced Concrete, Guimarães, Portugal, 19–21 September 2012; Barros, J.A.O., Ed.; RILEM Publications S.A.R.L.: Bagneux, France, 2012; pp. 1240–1252. [Google Scholar]
  14. Ozturk, M.; Keskin, R.S.O.; Arslan, G. The behavior of PFRC beams with and without web reinforcement. Eurasia Proc. Sci. Technol. Eng. Math. 2017, 1, 347–352. [Google Scholar]
  15. Yang, X.; Liang, N.; Hu, Y.; Feng, R. An Experimental Study of Shear Resistance for Multisize Polypropylene Fiber Concrete Beams. Int. J. Concr. Struct. Mater. 2021, 15, 52. [Google Scholar] [CrossRef] [Scilit]
  16. Duarte, I.O.; Forti, N.C.D.S.; Pimentel, L.L.; Jacintho, A.E.P.G.D.A. A Study of the Shear Behavior of Concrete Beams with Synthetic Fibers Reinforced with Glass and Basalt Fiber-Reinforced Polymer Bars. Buildings 2024, 14, 2123. [Google Scholar] [CrossRef] [Scilit]
  17. Hiremath, G.; Thammishetti, N.; Prakash, S.S. Effect of longitudinal rebar ratio and synthetic fiber dosage on flexure–shear behavior of GFRP- reinforced concrete beams. Struct. Concr. 2026, 27, 2403–2419. [Google Scholar] [CrossRef] [Scilit]
  18. Uğur, A.E.; Ünal, A. Assessing the structural behavior of reinforced concrete beams produced with macro synthetic fiber reinforced self-compacting concrete. Structures 2022, 38, 1226–1243. [Google Scholar] [CrossRef] [Scilit]
  19. Zhang, R.; Matsumoto, K.; Hirata, T.; Ishizeki, Y.; Niwa, J. Shear behavior of polypropylene fiber reinforced ECC beams with varying shear reinforcement ratios. J. JSCE 2014, 2, 39–53. [Google Scholar] [CrossRef] [Scilit] [PubMed]
  20. Al-Alawi, A.R.; Mashrei, M. Shear capacity of sustainable ultra-high performance concrete beam reinforced with macro synthetic fiber as a sustainable alternative for stirrups and steel fiber. Case Stud. Constr. Mater. 2022, 17, e01443. [Google Scholar] [CrossRef] [Scilit]
  21. Bastami, R. Structural Performance of High-Strength Reinforced Concrete Beams Built with Synthetic Fibers. Master’s Thesis, University of Ottawa, Ottawa, ON, Canada, 2019. [Google Scholar]
  22. Shoeib, A.E.-K.; Abdelghaffar, M.S.; Ibrahim, A.H.; Badawy, M.S. Behavior of self compacted concrete deep beams reinforced with polypropylene fibers. Eng. Res. J. 2023, 52, 114–124. [Google Scholar] [CrossRef] [Scilit]
  23. Al-Khafaji, N.H.A.; Harba, I.S.I. Shear and Flexural Behavior of Lightweight Concrete Beams Containing Hybrid Fibers. Civ. Environ. Eng. 2023, 19, 206–217. [Google Scholar] [CrossRef] [Scilit]
  24. Kamal, M.; Safan, M.; Etman, Z.; Salama, R. Behavior and strength of beams cast with ultra high strength concrete containing different types of fibers. HBRC J. 2014, 10, 55–63. [Google Scholar] [CrossRef] [Scilit]
  25. Krishna Rao, M.V.; Dakhshina Murthy, N.R.; Santhosh Kumar, V. Behaviour of polypropylene fibre reinforced fly ash concrete deep beams in flexure and shear. Asian J. Civ. Eng. 2011, 12, 143–154. [Google Scholar]
  26. Younes, M.; Mokdad, K.; Hamad, B.; Assaad, J.; Jahami, A. Experimental and Numerical Studies on the Shear Strength of HFRC Beams without Stirrups. J. Struct. Des. Constr. Pract. 2026, 31, 04026055. [Google Scholar] [CrossRef] [Scilit]
  27. Smarzewski, P. Shear behaviour and failure mechanisms of high-performance concrete beams without stirrups reinforced with hybrid steel, polypropylene and glass fibres. Compos. Struct. 2026, 377, 119866. [Google Scholar] [CrossRef] [Scilit]
  28. Farag, B.; Thonstad, T.; Calvi, P.M. Evaluating Shear Strength of Reinforced Concrete Elements Containing Macro-Synthetic Fibers and Traditional Steel Reinforcement. Buildings 2025, 15, 3617. [Google Scholar] [CrossRef] [Scilit]
  29. Altoubat, S.; Karzad, A.S.; Maalej, M.; Barakat, S.; Junaid, T. Experimental study of the steel/CFRP interaction in shear-strengthened RC beams incorporating macro-synthetic fibers. Structures 2020, 25, 88–98. [Google Scholar] [CrossRef] [Scilit]
  30. Daniels, M. Long-Term Shear İnvestigation of Polypropylene Fiber-Reinforced Concrete Beams. Doctoral Dissertation, The University of Texas at Arlington, Arlington, TX, USA, 2017. [Google Scholar]
  31. Ghahremannejad, M.; Mahdavi, M.; Saleh, A.E.; Abhaee, S.; Abolmaali, A. Experimental investigation and identification of single and multiple cracks in synthetic fiber concrete beams. Case Stud. Constr. Mater. 2018, 9, e00182. [Google Scholar] [CrossRef] [Scilit]
  32. Arslan, G.; Ozturk, M.; Sengun, K. An Experimental Investigation of CFRP Strengthening Efficiency on The Retrofitted Damaged Geopolymer Concrete Beams. Gazi Univ. J. Sci. 2025, 38, 630–646. [Google Scholar] [CrossRef] [Scilit]
  33. Sengun, K.; Arslan, G. Performance of RC Beams Strengthened in Flexure and Shear with CFRP and GFRP. Iran. J. Sci. Technol. Trans. Civ. Eng. 2024, 48, 117–130. [Google Scholar] [CrossRef] [Scilit]
  34. Sengun, K.; Arslan, G. Investigation of CFRP strengthening efficiency experimentally and analytically on reinforced concrete beams. Res. Eng. Struct. Mater. 2025, 11, 2351–2379. [Google Scholar] [CrossRef] [Scilit]
  35. Sengun, K.; Arslan, G. Influence of CFRP on the strength of retrofitted RC beams without stirrups. Sigma J. Eng. Nat. Sci. 2017, 35, 77–85. [Google Scholar]
  36. Keskin, R.S.O.; Arslan, G.; Sengun, K. Influence of CFRP on the shear strength of RC and SFRC beams. Constr. Build. Mater. 2017, 153, 16–24. [Google Scholar] [CrossRef] [Scilit]
  37. Sengun, K.; Arslan, G. Investigation of the parameters affecting the behavior of RC beams strengthened with FRP. Front. Struct. Civ. Eng. 2022, 16, 729–743. [Google Scholar] [CrossRef] [Scilit]
  38. Sengun, K.; Arslan, G. Parameters affecting the behaviour of RC beams strengthened in shear and flexure with various FRP systems. Structures 2022, 40, 202–212. [Google Scholar] [CrossRef] [Scilit]
  39. Ozturk, M.; Sengun, K.; Arslan, G. CFRP contribution to load-carrying capacity of retrofitted geopolymer concrete beams. Structures 2023, 48, 1391–1402. [Google Scholar] [CrossRef] [Scilit]
  40. Akkaya, H.C.; Aydemir, C.; Arslan, G. Evaluation of shear behavior of short-span reinforced concrete deep beams strengthened with fiber reinforced polymer strips. Eng. Struct. 2024, 299, 117145. [Google Scholar] [CrossRef] [Scilit]
  41. Cakir, F.; Aydin, M.R.; Acar, V.; Aksar, B.; Akkaya, H.C. An experimental study on RC beams shear-strengthened with intraply hybrid U-jackets composites monitored by digital image correlation (DIC). Compos. Struct. 2023, 323, 117503. [Google Scholar] [CrossRef] [Scilit]
  42. Akkaya, H.C.; Aydemir, C.; Arslan, G. An experimental research on reinforced concrete deep beams fully wrapped with fiber reinforced polymers against shear. Case Stud. Constr. Mater. 2022, 17, e01198. [Google Scholar] [CrossRef] [Scilit]
  43. Akkaya, H.C.; Aydemir, C.; Arslan, G. Investigation on shear behavior of reinforced concrete deep beams without shear reinforcement strengthened with fiber reinforced polymers. Case Stud. Constr. Mater. 2022, 17, e01392. [Google Scholar] [CrossRef] [Scilit]
  44. Yassin, A.M.; Eldin, M.M.; Omar, M.S.; Hafez, M.A.; Elnaggar, M.A. A new approach to calculate the shear strength of high-performance reinforced concrete beams fibered with micro polypropylene (experimental and analytical study). Eng. Struct. 2024, 314, 118347. [Google Scholar] [CrossRef] [Scilit]
  45. Bermudez, M.; Hung, C.-C. Shear strength equation and database for high-strength high-performance fiber-reinforced concrete and ultra-high-performance concrete beams without stirrups. ACI Struct. J. 2024, 121, 185–195. [Google Scholar] [CrossRef] [Scilit]
  46. Yu, Y.; Su, J.; Wu, B. A hybrid Bayesian model updating and non-dominated sorting genetic algorithm framework for intelligent mix design of steel fiber reinforced concrete. Eng. Appl. Artif. Intell. 2025, 161, 112071. [Google Scholar] [CrossRef] [Scilit]
  47. Akkaya, H.C.; Alacalı, S. Developing a new model using gene expression programming on the prediction of moment capacity of ferrocement elements. Bitlis Eren Univ. J. Sci. 2025, 14, 713–731. [Google Scholar] [CrossRef] [Scilit]
  48. Arslan, G.; Keskin, R.S.O.; Ozturk, M. Shear behaviour of polypropylene fibre-reinforced-concrete beams without stirrups. Proc. Inst. Civ. Eng. Struct. Build. 2017, 170, 190–198. [Google Scholar] [CrossRef] [Scilit]
  49. Xiang, Z.; Zhou, J.; Niu, J.; Feng, X.; Wang, J. Study on shear behavior of high-performance polypropylene fiber-reinforced lightweight aggregate concrete beams. Case Stud. Constr. Mater. 2022, 17, e01594. [Google Scholar] [CrossRef] [Scilit]
  50. Ababneh, A.; Al-Rousan, R.; Alhassan, M.; Alqadami, M. Influence of synthetic fibers on the shear behavior of lightweight concrete beams. Adv. Struct. Eng. 2017, 20, 1671–1683. [Google Scholar] [CrossRef] [Scilit]
  51. Majdzadeh, F.; Soleimani, S.M.; Banthia, N. Shear strength of reinforced concrete beams with a fiber concrete matrix. Can. J. Civ. Eng. 2006, 33, 726–734. [Google Scholar] [CrossRef] [Scilit]
  52. Sahoo, D.R.; Maran, K.; Kumar, A. Effect of steel and synthetic fibers on shear strength of RC beams without shear stirrups. Constr. Build. Mater. 2015, 83, 150–158. [Google Scholar] [CrossRef] [Scilit]
  53. Shaaban, I.G.; Said, M.; Khan, S.U.; Eissa, M.; Elrashidy, K. Experimental and theoretical behaviour of reinforced concrete beams containing hybrid fibres. Structures 2021, 32, 2143–2160. [Google Scholar] [CrossRef] [Scilit]
  54. Murad, Y.; Abdel-Jabbar, H. Shear behavior of RC beams prepared with basalt and polypropylene fibers. Case Stud. Constr. Mater. 2022, 16, e00835. [Google Scholar] [CrossRef] [Scilit]
  55. Parmentier, B.; Cauberg, N.; Vandewalle, L. Shear resistance of macro-synthetic and steel fibre reinforced concrete beams without stirrups. In 8th RILEM International Symposium on Fibre Reinforced Concrete: Challenges and Opportunities (BEFIB 2012), Proceedings of the 8th RILEM International Symposium on Fibre Reinforced Concrete, Guimarães, Portugal, 19–21 September 2012; Barros, J.A.O., Ed.; RILEM Publications S.A.R.L.: Bagneux, France, 2012; pp. 1096–1108. [Google Scholar]
  56. Hossain, F.Z.; Pal, A.; Ahmed, K.S.; Bediwy, A.; Alam, M.S. Shear behavior of polypropylene fiber-reinforced concrete beams containing recycled aggregate and crumb rubber. J. Clean. Prod. 2023, 412, 137370. [Google Scholar] [CrossRef] [Scilit]
  57. Mori, K.; Sato, Y.; Kaneko, Y. Flexural and shear behavior of RC beams reinforced by polypropylene fiber. J. Struct. Constr. Eng. AIJ 2017, 82, 1081–1090. [Google Scholar] [CrossRef] [Scilit]
  58. Bajaj, K.; Shrisvastava, Y. Performance of fibre based concrete in shear. Int. J. Earth Sci. Eng. 2011, 4, 619–622. [Google Scholar]
  59. Al Ghali, A.E.; El Ezz, N.E.; Hamad, B.; Assaad, J.; Yehya, A. Comparative study on shear strength and life cycle assessment of reinforced concrete beams containing different types of fibers. Case Stud. Constr. Mater. 2023, 19, e02497. [Google Scholar] [CrossRef] [Scilit]
  60. Atea, R.S. Improvement of structural properties for reinforced concrete deep beam using silica fume with polypropylene fibers. Muthanna J. Eng. Technol. 2017, 5, 1–9. [Google Scholar] [CrossRef] [Scilit]
  61. Ketenci, M.O. Kesme Donatısız Polipropilen ve Çelik Lifli Betonarme Kirişlerinin Eğilme ve Kesme Kuvveti Altında Davranışlarının Deneysel Olarak İncelenmesi. Master’s Thesis, Ege University, İzmir, Türkiye, 2022. [Google Scholar]
  62. Project Jupyter. JupyterLab, 4.4.4. 2026. Available online: https://jupyter.org (accessed on 6 September 2026).
  63. Alacalı, S.; Karslıoğlu, M.; Ünsal Aslan, Z.; Doran, B. Comparative analysis of machine learning algorithms for predicting shear strength of URM walls. Mater. Today Commun. 2025, 47, 113257. [Google Scholar] [CrossRef] [Scilit]
  64. Alacalı, S.; Çıbuk, F. Predicting the axial load capacity of circular concrete-filled steel tube columns confined with fiber-reinforced polymer using machine learning models. Comput. Concr. 2026, 38, 157–191. [Google Scholar] [CrossRef]
  65. Geurts, P.; Ernst, D.; Wehenkel, L. Extremely randomized trees. Mach. Learn. 2006, 63, 3–42. [Google Scholar] [CrossRef] [Scilit]
  66. Freund, Y.; Schapire, R.E. A decision-theoretic generalization of on-line learning and an application to boosting. J. Comput. Syst. Sci. 1997, 55, 119–139. [Google Scholar] [CrossRef] [Scilit]
  67. Rasmussen, C.E.; Williams, C.K.I. Gaussian Processes for Machine Learning; MIT Press: Cambridge, MA, USA, 2006. [Google Scholar]
  68. Alacalı, S.; Akkaya, H.C.; Sengun, K.; Arslan, G. Proposal and evaluation of new models for predicting the FRP contribution to shear strength in reinforced concrete beams using gene expression programming. Neural Comput. Appl. 2024, 36, 15515–15544. [Google Scholar] [CrossRef] [Scilit]
  69. Akkaya, H.C.; Alacalı, S. Predicting the punching shear capacity of RC slab–column connections with FRP bars using machine learning-based algorithms. Lat. Am. J. Solids Struct. 2026, 23, e8817. [Google Scholar] [CrossRef] [Scilit]
  70. Sharma, A.K. Shear strength of steel fiber reinforced concrete beams. ACI J. Proc. 1986, 83, 624–628. [Google Scholar] [CrossRef] [Scilit] [PubMed]
  71. Khuntia, M.; Stojadinovic, B.; Goel, S.C. Shear strength of normal and high-strength fiber reinforced concrete beams without stirrups. ACI Struct. J. 1999, 96, 282–289. [Google Scholar] [CrossRef] [Scilit] [PubMed]
  72. Ashour, S.A.; Hasanain, G.S.; Wafa, F.F. Shear behavior of high-strength fiber reinforced concrete beams. ACI Struct. J. 1992, 89, 176–184. [Google Scholar] [CrossRef] [Scilit] [PubMed]
  73. Kwak, Y.K.; Eberhard, M.O.; Kim, W.S.; Kim, J. Shear strength of steel fiber-reinforced concrete beams without stirrups. ACI Struct. J. 2002, 99, 530–538. [Google Scholar] [CrossRef] [Scilit] [PubMed]
  74. Mansur, M.A.; Ong, K.C.G.; Paramasivam, P. Shear strength of fibrous concrete beams without stirrups. J. Struct. Eng. 1986, 112, 2066–2079. [Google Scholar] [CrossRef] [Scilit]
  75. Narayanan, R.; Darwish, I.Y.S. Use of steel fibers as shear reinforcement. ACI Struct. J. 1987, 84, 216–227. [Google Scholar] [CrossRef] [Scilit] [PubMed]
  76. Swamy, R.N.; Jones, R.; Chiam, A.T.P. Influence of steel fibers on the shear resistance of lightweight concrete I-beams. ACI Struct. J. 1993, 90, 103–114. [Google Scholar] [CrossRef] [Scilit] [PubMed]
  77. Greenough, T.; Nehdi, M. Shear behavior of fiber-reinforced self-consolidating concrete slender beams. ACI Mater. J. 2008, 105, 468–477. [Google Scholar] [CrossRef] [Scilit] [PubMed]
  78. Imam, M.; Vandewalle, L.; Mortelmans, F.; Van Gemert, D. Shear domain of fibre-reinforced high-strength concrete beams. Eng. Struct. 1997, 19, 738–747. [Google Scholar] [CrossRef] [Scilit]
  79. Sarveghadi, M.; Gandomi, A.H.; Bolandi, H.; Alavi, A.H. Development of prediction models for shear strength of SFRCB using a machine learning approach. Neural Comput. Appl. 2019, 31, 2085–2094. [Google Scholar] [CrossRef] [Scilit]
  80. Shin, S.W.; Oh, J.G.; Ghosh, S.K. Shear behavior of laboratory-sized high-strength concrete beams reinforced with bars and steel fibers. In Fiber Reinforced Concrete Developments and Innovations; Daniel, J.I., Shah, S.P., Eds.; American Concrete Institute: Detroit, MI, USA, 1994; pp. 181–200. [Google Scholar] [CrossRef] [Scilit] [PubMed]
  81. Arslan, G. Shear strength of Steel Fiber Reinforced Concrete (SFRC) slender beams. KSCE J. Civ. Eng. 2014, 18, 587–594. [Google Scholar] [CrossRef] [Scilit]
  82. Said, M.; Montaser, W.; Elgammal, A.S.; Zahir, A.H.; Shaaban, I.G. Shear Strength of Reinforced Mortar Beams Containing Polyvinyl Alcohol Fibre (PVA). Int. J. Civ. Eng. 2021, 19, 1155–1178. [Google Scholar] [CrossRef] [Scilit]
  83. Gandomi, A.H.; Alavi, A.H.; Yun, G.J. Nonlinear modeling of shear strength of SFRC beams using linear genetic programming. Struct. Eng. Mech. 2011, 38, 1–25. [Google Scholar] [CrossRef] [Scilit]
  84. RILEM TC 162-TDF. Test and design methods for steel fibre reinforced concrete: σ–ε design method—Final recommendation. Mater. Struct. 2003, 36, 560–567. [Google Scholar] [CrossRef] [Scilit]
  85. Deutscher Ausschuss für Stahlbeton. DAfStB-Richtlinie Stahlfaserbeton; Beuth Verlag: Berlin, Germany, 2012. [Google Scholar]
  86. International Federation for Structural Concrete. fib Model Code 2010: Final Draft; fib: Lausanne, Switzerland, 2012. [Google Scholar]
  87. Albidah, A.S.; Abbas, Y.M. Improving Shear Strength Prediction in Steel Fiber Reinforced Concrete Beams: Stacked Ensemble Machine Learning Modeling and Practical Applications. Buildings 2024, 14, 2169. [Google Scholar] [CrossRef] [Scilit]
  88. Yazdanbakhsh, A.; Altoubat, S.; Rieder, K.-A. Analytical study on shear strength of macro synthetic fiber reinforced concrete beams. Eng. Struct. 2015, 100, 622–632. [Google Scholar] [CrossRef] [Scilit]
  89. Lantsoght, E.O.L. Database of shear experiments on steel fiber reinforced concrete beams without stirrups. Materials 2019, 12, 917. [Google Scholar] [CrossRef] [Scilit] [PubMed]
  90. Moraes-Neto, B.N.; Barros, J.A.O.; Melo, G.S.S.A. A model for the prediction of the punching resistance of steel fibre reinforced concrete slabs centrically loaded. Constr. Build. Mater. 2013, 46, 211–223. [Google Scholar] [CrossRef] [Scilit]
  91. Nzambi, A.K.L.L.; Ntuku, J.B.; de Oliveira, D.R.C. Empirical equations for flexural residual strengths in concrete with low volumetric fractions of hook-end steel fiber. Eng. Rep. 2022, 4, e12490. [Google Scholar] [CrossRef] [Scilit]
  92. Lundberg, S.M.; Lee, S.-I. A unified approach to interpreting model predictions. In Advances in Neural Information Processing Systems 30, Proceedings of the 31st Conference on Neural Information Processing Systems, Long Beach, CA, USA, 4–9 December 2017; Guyon, I., von Luxburg, U., Bengio, S., Wallach, H., Fergus, R., Vishwanathan, S.V.N., Garnett, R., Eds.; Curran Associates: Red Hook, NY, USA, 2017; pp. 4765–4774. [Google Scholar]
Figure 1. Distribution of the input and output variables in the experimental database.
Buildings 16 03749 g001aBuildings 16 03749 g001b
Figure 2. Expression trees of the developed GEP equation.
Buildings 16 03749 g002
Figure 3. Statistical performance of the developed models.
Buildings 16 03749 g003
Figure 4. Experimental versus predicted shear strengths for (a) the proposed GEP and MEP models and (b) the existing shear strength equations [5,48,70,71,72,73,74,75,76,77,78,79,80,81,82,83,84,85,86,87].
Buildings 16 03749 g004aBuildings 16 03749 g004bBuildings 16 03749 g004c
Figure 5. Statistical comparison of existing equations and proposed models [5,48,70,71,72,73,74,75,76,77,78,79,80,81,82,83,84,85,86,87].
Buildings 16 03749 g005
Figure 6. SHAP summary plot for the developed MEP equation using the testing dataset.
Buildings 16 03749 g006
Figure 7. Relative importance of the input variables based on the mean absolute SHAP values for the developed MEP equation.
Buildings 16 03749 g007
Figure 8. Parametric responses of the MEP-predicted shear capacity to individual variations in the input variables within their ranges in the hold-out testing subset.
Buildings 16 03749 g008
Figure 9. Relative sensitivity contributions of the input variables to the MEP-predicted shear capacity based on the OAT analysis.
Buildings 16 03749 g009
Table 1. Statistical characteristics of the experimental database.
ParameterMinMaxMeanStd. Dev.
Beam width, b (mm)100305153.14258.685
Effective depth, d (mm)85.25600241.407117.286
Shear span-to-depth ratio, a / d 0.5834.8702.627041.028
Longitudinal reinforcement ratio, ρ s 0.0020.0460.021030.011
Yield strength of reinforcement, f y (MPa)366.470700482.80669.042
Fiber volume fraction, V f   (%)0.130.6980.593
Fiber aspect ratio, l f / d f 12.5840178.396193.692
Concrete compressive strength, f c f (MPa)13.8515051.86935.318
Fiber tensile strength, f s f (MPa)375685558.428104.594
Fiber elastic modulus, E s f (MPa)345010,5006457.4482563.832
Experimental shear strength, V e x p (N)13,720500,00098,097.63595,276.749
Table 2. Hyperparameter settings and configuration details of the developed models.
ModelSelected Parameters
ETbootstrap = False; max_depth = 10; max_features = 0.6; min_samples_leaf = 2; min_samples_split = 4; n_estimators = 1000
CatBoostdepth = 3; iterations = 900; learning_rate = 0.03; l2_leaf_reg = 20; min_data_in_leaf = 8; random_strength = 2; rsm = 0.8; subsample = 0.75
RFmax_depth = None; max_features = 0.6; max_samples = None; min_samples_leaf = 1; min_samples_split = 2; n_estimators = 1000
XGBoostn_estimators = 900; max_depth = 3; learning_rate = 0.02; min_child_weight = 5; subsample = 0.85; colsample_bytree = 0.75; reg_alpha = 0; reg_lambda = 10
GPRalpha = 0.05; kernel = constant kernel (1.0) × Matérn kernel (length scale = 1, ν = 2.5) + white-noise kernel (noise level = 0.5); number of optimizer restarts = 5
AdaBoostn_estimators = 1500; learning_rate = 0.006; loss = square
GEPSoftware: GeneXproTools; fitness function: RMSE; strategy: Optimal Evolution; training/test records: 74/24; chromosomes: 256; head size: 8; genes: 3; linking function: addition; function set: (+, −, *, /, x2); genetic operators: default Optimal Evolution rates; constants: 10 per gene, floating-point, −10 to +10; model selection: best model only; complexity increase: disabled; parallel processing: 8 threads
MEPSoftware: MEPX; problem type: symbolic regression; error measure: MAE; function set: (+, −, *, /, x2); subpopulations: 250; subpopulation size: 100; code length: 30; generations: 5000; crossover probability = 0.90; crossover type = uniform; mutation: 0.01; tournament size: 2; constants: 3, automatically generated, −10 to +10; runs: 5; threads: 12
Table 3. Principal input variables considered by the evaluated shear strength models.
Model f c f V f l f / d f τ ρ s a / d d Residual Strengths ( f R 1 , f R 3 )
Sharma [70]
Khuntia et al. [71]
Ashour et al. [72]
Kwak et al. [73]
Mansur et al. [74]
Narayanan and Darwish [75]
Swamy et al. [76]
Li et al. [5]
Greenough and Nehdi [77]
Imam et al. [78]
Sarveghadi et al. [79]
Shin et al. [80]
Arslan (2014) [81]
Arslan et al. (2017) [48]
Said et al. [82]
Gandomi et al. [83]
RILEM [84] Equivalent flexural strength
DAfStB [85] Residual tensile strength
fib Model Code 2010 [86]
Albidah and Abbas (2024) [87]
✓: Considered.
Table 4. Statistical performance of the benchmark machine learning models and developed GEP and MEP equations for the training and testing datasets.
Training Data
MetricCatBoostAdaBoostETXGBoostGPRRFProposed MEPProposed GEP
MV0.9680.9090.9710.9830.9890.9771.0130.998
Standard deviation0.1540.3380.1230.1210.1280.1080.1970.257
COV0.1590.3710.1270.1230.1300.1100.1940.258
MAPE (%)12.09928.7158.4028.9369.7387.26514.81619.222
RMSE (kN)10.35426.86615.43010.8149.48514.15418.67119.980
R20.9900.9500.9760.9890.9900.9870.9610.955
Testing Data
MetricCatBoostAdaBoostETXGBoostGPRRFProposed MEPProposed GEP
MV1.0211.0470.9701.0001.0310.9991.0070.977
Standard deviation0.1620.3720.1660.1660.2570.1950.1440.245
COV0.1590.3550.1720.1660.2490.1950.1430.250
MAPE (%)11.15828.94812.23111.71016.73013.56810.55418.164
RMSE (kN)18.74932.23217.48823.01423.19919.60515.74617.998
R20.9680.9300.9660.9530.9460.9640.9760.965
Table 5. Statistical comparison of the existing shear strength formulations and developed GEP and MEP equations for the testing dataset.
Model M V C O V M A P E  (%) R M S E  (kN) R 2
Said et al. [82]2.1310.565117.62996.6190.264
Arslan et al. (2017) [48]1.0250.38325.81259.6430.608
Albidah and Abbas [87]0.8070.34429.28464.1730.755
Shin et al. [80]1.0620.49536.63954.4210.753
Gandomi et al. [83]0.7630.38535.10965.4360.735
RILEM [84]1.3130.58237.39674.6140.440
fib MC-2010 [86]1.0890.65335.14076.1840.399
Ashour et al. [72]0.8920.41326.950130.1510.666
Arslan (2014) [81]0.8340.39630.48975.5810.578
Imam et al. [78]0.6430.44138.890344.3060.663
DAfStB [85]0.4730.55857.188216.1700.385
Narayanan and Darwish [75]1.0700.41026.743110.3440.819
Swamy et al. [76]1.6410.43267.58778.7090.501
Li et al. [5]1.2200.49840.31768.0740.528
Sharma [70]0.8800.43733.34156.7750.738
Sarveghadi et al. [79]0.8140.38629.73355.5290.883
Kwak et al. [73]0.8870.42929.869127.8560.838
Greenough and Nehdi [77]1.2100.42329.95874.5300.411
Khuntia et al. [71]1.2210.66540.389121.8630.145
Mansur et al. [74]0.8590.67444.112268.3130.067
Proposed GEP0.9770.25018.16417.9980.965
Proposed MEP1.0070.14310.55415.7460.976
Disclaimer/Publisher’s Note: The statements, opinions and data contained in all publications are solely those of the individual author(s) and contributor(s) and not of MDPI and/or the editor(s). MDPI and/or the editor(s) disclaim responsibility for any injury to people or property resulting from any ideas, methods, instructions or products referred to in the content.