Article

Multi-Objective Capacity Configuration of PV-Energy Storage Systems in Low-Carbon Buildings with Electric Vehicles: A Bi-Level Optimization Approach

School of Energy Science and Engineering, Nanjing Tech University, Nanjing 211816, China
*
Authors to whom correspondence should be addressed.
Buildings 2026, 16(18), 3743; https://doi.org/10.3390/buildings16183743 (registering DOI)
Submission received: 24 July 2026 / Revised: 11 September 2026 / Accepted: 15 September 2026 / Published: 20 September 2026
(This article belongs to the Section Building Energy, Physics, Environment, and Systems)

Abstract

To support low-carbon smart buildings, this study proposes a multi-objective capacity optimization method for PV-energy storage systems considering the flexibility potential of orderly electric vehicle (EV) charging loads. First, an orderly EV charging model based on price-guided charging quantifies the flexibility potential of EV charging loads. Then, a bi-level multi-objective capacity configuration model is proposed. In the upper level, the building operator minimizes both economic and carbon emission costs, jointly optimizing PV-energy storage capacity configuration and EV charging prices. In the lower level, EV users optimize their charging schedules to minimize their charging costs in response to the charging prices. To solve this bi-level multi-objective problem, the two objectives are normalized and weighted into a single-objective function, and then a heuristic solution method based on a genetic algorithm is developed. Case study results show that the proposed mode reduces building economic cost and electricity-related carbon emissions, demonstrating the benefits of incorporating carbon emissions into demand-side optimization under the “dual-carbon” targets.

1. Introduction

Against the backdrop of global efforts to address climate change, the development of low-carbon buildings has become an important pathway for promoting the energy transition and achieving the “dual-carbon” targets. According to statistics from the International Renewable Energy Agency, building-related carbon emissions account for 28% of global carbon emissions, with energy consumption and emissions during the operational stage being the dominant contributors [1]. In China, in 2024, carbon emissions from building operations accounted for 22.1% of the national total. Among operational emissions from public buildings, urban residential buildings, and rural residential buildings, the shares of indirect emissions associated with electricity consumption reached as high as 78.3%, 49.5%, and 77.3% [2], respectively, indicating significant potential for emission reduction. Meanwhile, clean energy supply and storage technologies represented by distributed photovoltaic (PV) systems and energy storage, driven by improved technological maturity, enhanced safety, and continuously declining costs, are promoting the transition of end-users from passive electricity consumers to active energy managers [3,4]. In some microgrids and user-side applications, energy self-sufficiency has even been achieved [5]. Users can effectively reduce energy costs and carbon emissions by deploying PV and energy storage systems in and around buildings and optimizing their energy consumption in response to electricity price signals, thereby creating broader opportunities for achieving the “dual-carbon” targets [6,7]. Therefore, it is particularly important to optimize the capacity configuration of PV-storage systems in buildings by jointly considering economic performance and carbon emissions, thereby promoting the development of low-carbon buildings.
A growing body of research has focused on the coordinated configuration and operation of distributed PV and energy storage in smart buildings. Both [8,9] aimed to reduce operation costs and carbon emission costs by coordinating electrical energy storage, thermal energy storage, and hydrogen storage to optimize building energy use. However, they differ in their treatment of carbon objectives. The former imposes a zero-carbon electricity constraint, while the latter one considers the carbon objective separately from the economic objective and assigns it a specific weight. Ref. [10] showed that, after integrating electrical and thermal energy storage, the carbon emissions can be reduced by 28% while costs decrease by 7%. The joint configuration of PV and energy storage can further enhance building electrification and reduce both economic and carbon emission costs [11]. In [12], a building energy system incorporating PV, heat pumps, thermal storage, and battery energy storage achieved a 16.3% reduction in the levelized cost of electricity (LCOE) and a 20.9% reduction in carbon emissions compared with a PV-only system. The system in [13], which includes rooftop PV, battery storage, and cold thermal storage, demonstrated that a configuration with 40% PV penetration and an energy storage investment cost of 0.006 USD/kWh can reduce costs by 27.3%, outperforming configurations with either standalone PV or standalone energy storage. In studies focusing solely on energy storage operation or the impacts of specific factors on operational performance, the storage capacity is often predefined, such as the actually installed capacity [14], a value equal to the maximum net load [15], or a fixed proportion of PV capacity [16]. While this approach simplifies the optimization problem, the predefined capacity may not be optimal in terms of economic and carbon performance and may make it difficult to recover the investment cost even after operational optimization [17]. Joint optimization of capacity configuration and system operation can yield more appropriate solutions [18,19]. Despite these advances, in PV-energy storage capacity configuration, carbon objectives are typically incorporated through rigid constraints or subjectively assigned weights, making it difficult to explicitly characterize different low-carbon preferences and their impacts on resource configuration.
Meanwhile, with the increasing penetration of electric vehicles (EVs), large-scale EV charging demand in smart buildings not only imposes additional load pressure on building operation but also provides new opportunities for low-carbon and cost-effective energy management. As typical flexible loads, EV charging features temporal flexibility and controllability. While satisfying users’ travel demands, EV charging behavior can be guided through price signals or dispatch instructions to achieve peak shaving and valley filling, as well as to facilitate the utilization of PV generation [20]. Moreover, EV adoption also offers significant potential for reducing global emissions, with every 1% increase in EV penetration leading to a 0.096% reduction in global carbon emissions [21]. EV charging loads and their associated flexibility have been incorporated into building energy system models. In [22], a smart building energy system with vehicle-to-grid (V2G) capability is modeled as a Markov Decision Process, and reinforcement learning is employed to minimize operating costs. In [23], EVs are treated as flexible loads, and an optimization model is established to minimize system operating costs while considering battery state of charge (SOC) constraints and degradation costs. In [24], coordinated optimization of grid electricity purchase, PV generation, stationary energy storage, and EV charging/discharging is performed with the objective of minimizing the total system operating cost. The authors of [25] consider the dispatchable potential of EV charging stations around buildings and shows that incorporating EVs increases load coverage by 12.08%, improves grid flexibility by 29.63%, reduces annual electricity costs by 18.70%, and decreases the levelized cost of electricity by 6.24%, while also demonstrating significant benefits in terms of economic performance, carbon emissions, and storage capacity.
With the widespread adoption of time-of-use (TOU) electricity pricing, its effectiveness in regulating building loads and PV-storage operation has been well demonstrated [26]. The impact of TOU pricing on flexible loads, particularly EVs, has also been extensively studied. In [27], the impact of TOU pricing on the electricity costs for EVs parked in residential buildings is analyzed. Under TOU pricing, the effects of uncertainties in EV driving parameters [28] and users’ willingness to respond and its impact on charging power [29] have also been investigated. In these studies, the electricity price signal is typically derived from external grid TOU tariffs or other predefined fixed prices (hereinafter referred to as external prices, OPs), which serve as a common signal for both buildings and EVs. While OP reflects grid electricity prices and the upstream grid’s expectations for building electricity consumption and can effectively guide system operation and investment decisions, it does not reflect the internal energy status of the building system and may, therefore, be insufficient for effectively guiding EV charging within the building. To address this issue, Ref. [30] proposed a hybrid game-based energy system in which a Stackelberg game between the energy system operator and the building integrated energy system (BIES) allocates cooperative benefits through energy trading prices. Under the guidance of OP, heuristic intelligent algorithms are used to determine the energy transaction price between ESO and the BIES. Such an optimization-driven dynamic pricing idea has also been applied at the distribution network level to guide building users toward more desirable electricity consumption patterns and properly reward buildings for providing frequency regulation and other response services. By accounting for diverse objectives and resource states, dynamic electricity prices can provide more adaptive price signals than fixed TOU tariffs. The authors of [31] couple the load layer (including machine-learning-based industrial flexible loads and transparent residential loads) and the electricity-selling layer into a single-layer MINLP model via the Karush–Kuhn–Tucker (KKT) conditions, to obtain the optimal dynamic electricity prices for the electricity retailer and compare them with a fixed electricity price. The results show that although the fixed electricity price determined based on the upper-level wholesale prices can minimize the cost of the electricity retailer, it also yields the lowest revenue. By contrast, dynamic electricity pricing increases the profit of the electricity retailer by 130%. The authors of [32] develop a user-behavior model, which can be combined with the upper-level grid operator model to form a solvable MINLP problem to determine dynamic electricity prices. Compared with the scenario adopting fixed TOU, the grid operation cost and users’ electricity consumption cost decreased by 3.72% and 25.9%, respectively. A similar price-maker bi-level model has also been applied in frequency regulation ancillary service markets. In [33], a market platform is designed where the upper level represents an AVPP, which procures power services from lower-level ancillary service providers and sells them to the transmission system operator (TSO) for arbitrage. The upper and lower levels act as the price maker and price takers, respectively, and the model is solved by coupling the two levels through KKT optimality conditions. Compared with the fixed-price scenario, the dynamic market-clearing price scenario increases the upper-level profit by 27.9%, while enhancing the flexibility contribution of lower-level resources by 61.1%. The prices reflect both the profit-seeking behavior of participants and the respective energy states of the participating resources. The bi-level model solved via heuristic algorithms can preserve information privacy between the two levels, whereas bi-level models reformulated using KKT conditions can obtain the global optimum. Accordingly, these two approaches have their respective advantages and limitations. Based on similar principles, such an approach can also be applied to buildings or charging stations to guide the charging behavior of EVs. However, existing studies on integrated optimization of buildings and EVs primarily rely on OP and rarely consider an interactive pricing mechanism that reflects the internal energy state of the building and EV users’ response behavior.
In summary, despite extensive research efforts, three gaps remain. First, in PV-energy storage capacity configuration, carbon objectives are typically incorporated through rigid constraints or subjectively, making it difficult to reflect different low-carbon preferences in resource configuration. Second, coordination between the building energy operator and EV users primarily relies on external grid prices that do not reflect the internal energy state of the building, with limited consideration of interactive pricing mechanisms. Third, the flexibility potential of EV charging loads is not explicitly quantified and incorporated in PV-storage capacity optimization, potentially limiting opportunities to reduce storage investment and carbon emissions. In this context, to fully exploit the flexibility potential of EV charging loads and to optimize PV-energy storage capacity configuration considering EV flexibility, this study proposes a multi-objective capacity optimization method for PV-energy storage systems that jointly consider economic and carbon objectives. The proposed method incorporates the flexibility potential of existing EV charging loads in buildings, enabling the coordinated low-carbon and cost-effective configuration of PV-storage systems. Case study results demonstrate the effectiveness of the proposed approach. The main contributions of this study are summarized as follows:
(1) A multi-objective capacity optimization model for PV-storage systems is developed based on a bi-level optimization framework that explicitly accounts for the flexibility potential of EV charging loads. The proposed model explores both optimal PV-storage configuration strategies and building-EV cooperation mechanisms. Specifically, the upper-level model represents the building energy operator, aiming to minimize both the economic cost and the carbon emission cost, thereby achieving joint optimization of PV-storage capacity configuration and EV charging prices. The lower-level mode represents EV users, who optimize their charging schedules to minimize their total charging cost in response to the charging prices set by the building operator.
(2) An efficient solution algorithm based on a genetic algorithm (GA) is developed for the bi-level multi-objective optimization model. An efficient solution algorithm is developed. First, a weighted-sum method is employed to convert the multi-objective problem into a single-objective optimization problem. Then, a heuristic solution framework is developed, where the upper-level model and lower-level model are, respectively, solved by GA and commercial solvers through iterative updates of EV charging prices.
The remainder of this paper is organized as follows. Section 2 presents the methodology. Section 3 presents the solution method. Section 4 presents case studies, and Section 5 draws the main conclusions.

2. Methodology

2.1. Model Framework

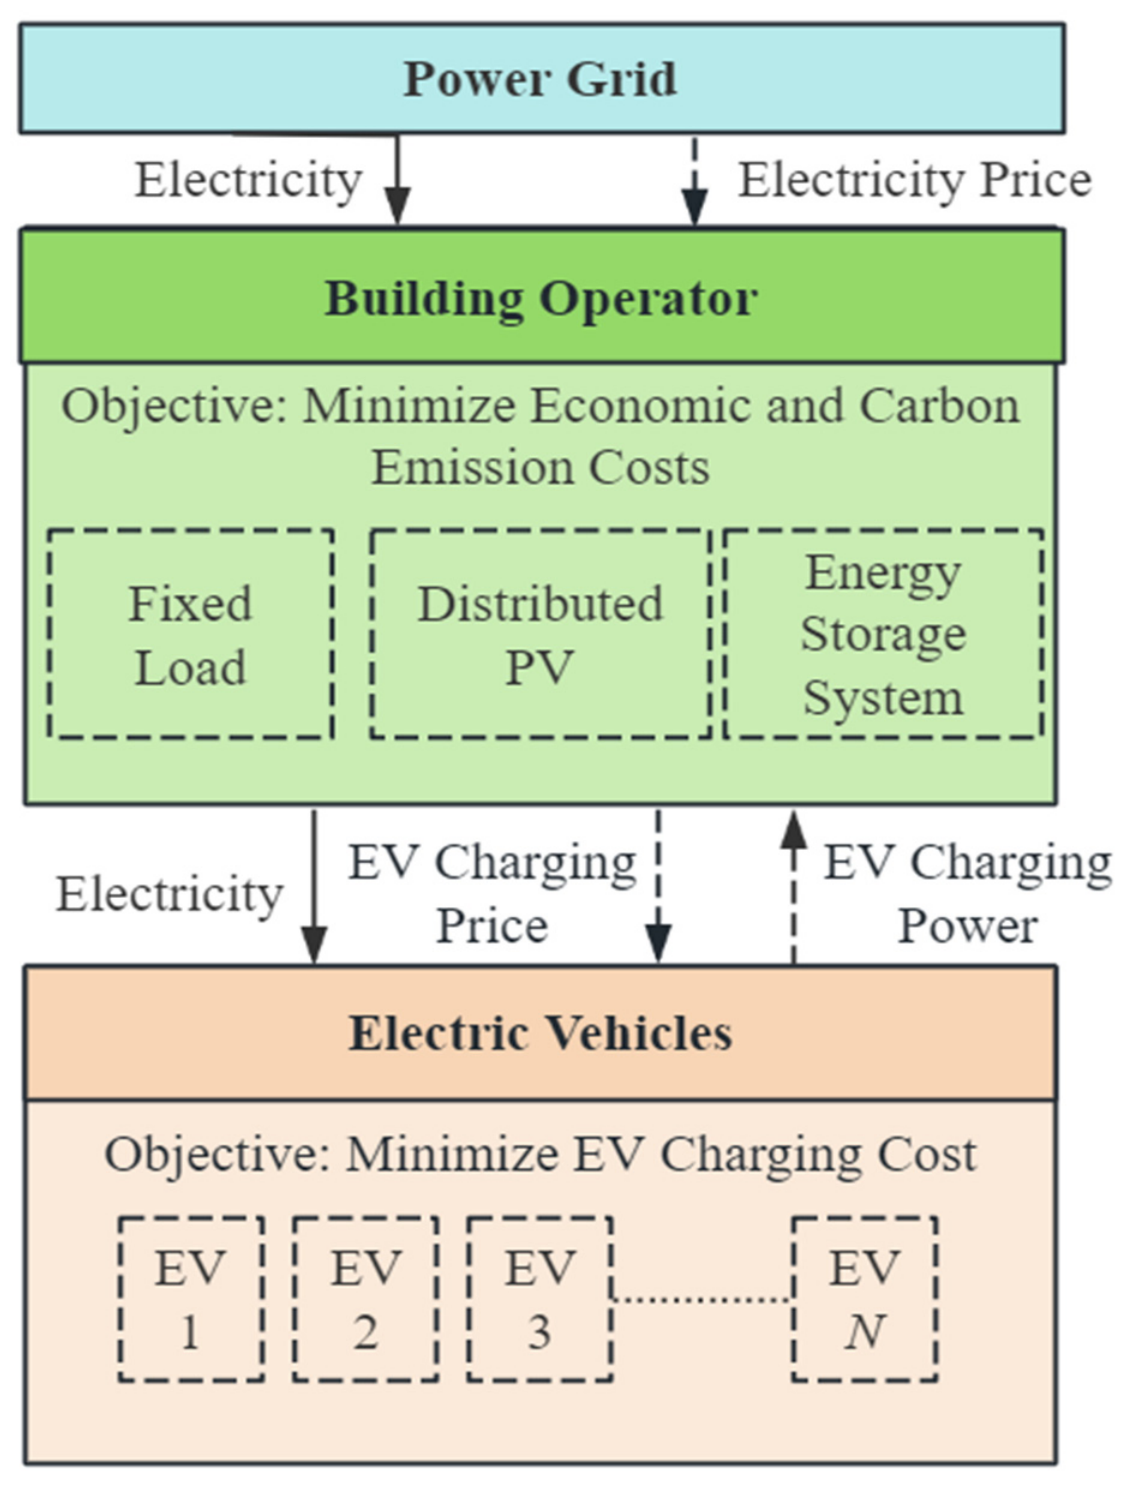
This study focuses on the development of low-carbon and cost-effective smart buildings through the joint optimal capacity configuration of PV-energy storage systems. Figure 1 illustrates the energy and information flow architecture of the considered building energy system. The building’s electricity demand consists of inherent building loads and EV charging loads, while distributed PV and energy storage systems are newly installed within the building. The building operator serves as the central decision maker for system planning and operation and is responsible for coordinating the power dispatch of inherent building loads, EV charging loads, distributed PV, and energy storage systems. Meanwhile, the operator determines the charging prices for orderly EV charging based on grid electricity prices and the internal operational conditions of the building energy system.
In consideration of the different objectives between EV users and the building operator, the coordinated operation of the building energy system and orderly EV charging is formulated using a bi-level optimization framework. In the upper level, the building operator aims to minimize the total economic cost and carbon emission cost, thereby jointly optimizing PV-storage capacity configuration and EV charging prices, the latter of which are then communicated to the lower level. In the lower level, EV users optimize their charging schedules to minimize their charging costs in response to the received charging prices and feed the resulting charging schedules back to the upper level.
Ultimately, through the optimal capacity configuration of PV-storage systems and the implementation of price-guided orderly EV charging, the building achieves low-carbon and cost-effective operation.

2.2. EV Orderly Charging Model

With the continuous growth in EV adoption, a substantial number of EV charging loads have emerged in commercial and office buildings. A key consideration in implementing orderly EV charging is to properly account for users’ willingness to respond. User response behavior is influenced by multiple factors, including charging cost, charging safety, travel convenience, individual behavioral habits, and psychological factors, among which economic considerations are among the primary driver of charging decisions.
This study focuses on a slow-charging scenario in buildings, where EVs are modeled as flexible loads with flexible charging time windows. For simplification, V2G operation/EV discharging is not considered in this study. A price-driven orderly EV charging model is developed. Specifically, the parameters of each EV in the building are defined E EV , n , d , t in , n , d , t out , n , d , S O C EV , n , d in , S O C EV , n , d exp .
Considering that the parking duration of EVs in buildings is generally longer than the time required to fulfil their charging demand, the charging demand can be flexibly scheduled within the parking period. By optimizing the temporal scheduling of charging activities during the parking interval, the flexibility potential of EV charging loads as controllable loads can be effectively exploited, thereby supporting low-carbon and cost-effective operation of building energy systems.
In the process of implementing orderly EV charging, the charging demand of EV users must be satisfied as a fundamental requirement. Therefore, the following constraints are formulated for orderly EV charging:
S O C EV , n , d exp S O C EV , n , d , t S O C EV , n , d max , t = t out , n , d
0 P EV , n , d , t δ EV , n , d , t P EV 0 , n = 1 , , N EV , d = 1 , , D , t = 1 , , T
δ EV , n , d , t μ EV , n , d , t , n = 1 , , N EV , d = 1 , , D , t = 1 , , T
n = 1 N E V δ EV , n , d , t N c p , n = 1 , , N EV , d = 1 , , D , t = 1 , , T
where δ EV , n , d , t = 1 indicates that the EV is charging in the current time interval, and otherwise it is not charging. μ EV , n , d , t is an input parameter, where a value of 1 indicates that the vehicle is parked within the building charging area and is available for charging, while 0 indicates that it is outside the feasible charging region. Constraint (1) represents that the SOC at the departure interval of EV n should be equal to or larger than the target SOC. And since V2G is not considered and EVs can only be at charging status, Constraint (1) naturally constrains that SOC at each interval does not exceed the allowable maximum SOC. Constraint (2) defines the charging power of EV n at time interval t. Constraint (3) specifies the charging availability constraint, indicating whether EV n is in an allowable time interval for charging. Constraint (4) states that the number of EVs at charging status should not exceed the number of available installed charging piles.

2.3. Optimal Configuration Model of PV-Storage Systems Considering Orderly EV Charging

This study adopts a typical-day-based operational simulation approach, in which one representative day is selected for each of the four seasons (spring, summer, autumn, and winter) to formulate a multi-objective capacity planning model that satisfies operational constraints of each typical day while minimizing the annual total economic cost and carbon emission cost. Specifically, the proposed multi-objective capacity configuration model is formulated within a bi-level optimization framework, and its structure is illustrated in Figure 1.

2.3.1. Multi-Objective Capacity Configuration Model for PV-Storage Systems

(1) Objective function
In PV-energy storage capacity configuration, the objective of the building energy operator is to achieve both the minimum carbon emission cost C carb and economic cost C fina . The economic cost includes the investment cost of the PV-storage system C inv , the total operation and maintenance cost of the PV-storage system C o & m , the cost of electricity purchased from the grid C g , the cost of curtailed PV power C curt , and the revenue from EV charging C EV .
min f C carb , C fina
C carb = d = 1 D t = 1 T π d e carb P g , d , t Δ t
C fina = C inv + C g + C curt + C o & m C EV
C inv = c bess inv E bess N + c pv inv P pv N
C o & m = c bess o & m P bess N + c pv o & m P pv N
C g = d = 1 D t = 1 T π d c g , d , t P g , d , t Δ t
C curt = d = 1 D t = 1 T π d c curt P curt , d , t Δ t
C EV = d = 1 D t = 1 T n = 1 N EV π d R d , t EV P EV , n , d , t Δ t
The electricity price for EV charging R d , t EV is determined by the building operator based on the building’s internal operation conditions and the characteristics of EV charging loads. EV users’ response to the price depends on their economic considerations, charging demands and parking schedules. As a vital variable coupling the building model and the EV model, the R d , t EV serves as the key decision variable in the interaction between the upper and lower levels. Setting a lower charging price at a certain time interval t enables the building to encourage EV users for charging yet reduces the building operator’s charging revenue. In contrast, setting a higher charging price discourages EV users from charging during that interval, thereby shifting charging demand to other periods. In this case, by accepting a lower charging revenue during certain time intervals according to the sufficiency or shortage of its inherent energy resources, the building can improve its overall profit over the entire time horizon and reduce EV users’ charging costs. This motivates the introduction of dynamically optimized EV charging prices in this study and also explains the mechanism through which mutual economic benefits can be achieved.
(2) Constraints
The constraints of the proposed multi-objective PV-storage capacity configuration model for the building are as follows:
(a) Power balance constraint
P g , d , t + P pv N + P pv 0 P ˜ pv , d , t P curt , d , t + P bess , d , t d = P l , d , t + P bess , d , t c + n = 1 N EV P EV , n , d , t , d = 1 , , D ,   t = 1 , , T
Constraint (13) ensures that the internal power balance between supply and demand is satisfied at any time interval within the building.
(b) PV power curtailment constraint
0 P curt , d , t P pv N + P pv 0 P ˜ pv , d , t , d = 1 , , D ,   t = 1 , , T
Constraint (14) restricts the PV power curtailment at any time interval to be within its upper and lower bounds.
(c) Energy storage charging and discharging power constraints
0 P bess , d , t d P bess N 0 P bess , d , t c P bess N , d = 1 , , D ,   t = 1 , , T
0 P bess , d , t d u bess , d , t M 0 P bess , d , t c 1 u bess , d , t M , d = 1 , , D ,   t = 1 , , T
E bess , d , t = E bess , d , t 1 + η bess c P bess , d , t c P bess , d , t d / η bess d Δ t , d = 1 , , D ,   t = 1 , , T
S O C bess min E bess N E bess , d , t S O C bess max E bess N , d = 1 , , D ,   t = 1 , , T
E bess , d , 0 = E bess , d , T d = 1 , , D
where u bess , d , t = 1 indicates that the storage system is in discharging mode, and otherwise it is in charging mode. Constraint (15) limits the charging and discharging power of the energy storage system at any time interval to be less than its rated power. Constraint (16) ensures that the energy storage system cannot charge and discharge simultaneously at any time interval. Constraint (17) describes the relationship between the stored energy and the charging/discharging power of the energy storage system. Constraint (18) ensures that the stored energy of the energy storage system at any time interval must remain within its allowable minimum and maximum SOC limits. Constraint (19) ensures that the state of charge of the energy storage system at the initial and terminal time intervals of a typical day is the same.

2.3.2. EV Charging Response Model

EV users in the building provide a certain degree of charging flexibility through the temporal shifting of charging demand, which can effectively facilitate PV generation accommodation and peak-load reduction during high-price periods within the building energy system. Within this framework, EV users optimize their charging power across time intervals with the objective of minimizing their total charging cost:
min C EV = d = 1 D t = 1 T n = 1 N EV π d R d , t EV P EV , n , d , t Δ t
Meanwhile, the EV charging constraints specified in Equations (1)–(4) are satisfied.

3. Solution Method

The proposed PV-energy storage capacity configuration model for the building is formulated as a bi-level multi-objective mixed-integer linear programming (MILP) problem, which is difficult to solve directly. To address this issue, a weighted-sum method is first employed to transform the bi-objective optimization problem into a single-objective problem. However, the resulting single-objective model remains a bi-level program with binary variables at the lower level, which prevents direct reformulation. To tackle this challenge, a GA-based solution approach is developed.

3.1. Single-Objective Model Reformulation

Existing studies have proposed optimization strategies for power systems or demand-side users that simultaneously consider the dual objectives of carbon emissions and economic performance. Common approaches include the Pareto optimality method [34,35] and the ε-constraint method [36]. In this study, the building is modeled as an individual decision-making entity with two optimization objectives. A key consideration in formulating the proposed model is that carbon emission costs and economic costs differ considerably in magnitude from other economic costs. Nevertheless, in practical scenarios, decision makers may attach comparable importance to carbon reduction and economic performance. Although relatively straightforward, the weighted-sum method is adopted in this study to eliminate the influence of differences in objective scales and enable their relative importance to be appropriately represented.
The weighted-sum method is adopted to convert the bi-objective optimization problem into a single-objective formulation. First, to eliminate the influence of scale differences among two objectives on the optimization results, both the economic objective and the carbon emission objective are normalized. The established model is first solved by considering only the economic objective to obtain the minimum economic cost, which is used as the lower bound for normalization of C fina . The upper bound of C fina is obtained from the reference case without PV-energy storage capacity expansion or EV charging optimization, in which the building relies on power exchange with the main grid. Thus, the economic objective C fina is normalized into the interval [0, 1]. Similarly, the carbon emission cost C carb is normalized using its upper and lower bounds obtained following the same procedure.
min f = α C carb C carb min C carb max C carb min + β C fina C fina min C fina max C fina min
where α + β = 1 . The capacity configuration model transformed by Equation (21) is formulated as a single-objective optimization problem.
max ε = ( f dp f ) ( C EV , dp C EV )
where the disagreement point of the bilateral negotiation is defined based on the optimization outcomes when two levels independently optimize their respective objectives using their available resources. Specifically, the two levels interact with power exchange based on the TOU tariff instead of optimizing the EV charging price.
R min R d , t EV c g , d , t
It should be noted that V2G participation of EVs is not considered in this study. Thus, Constraint (23) is introduced to impose bounds on the EV to ensure reasonable daytime EV charging behavior within the building.

3.2. GA-Based Solution Method for the Bi-Level Optimization Model

In the proposed bi-level optimization model, the lower-level orderly EV charging optimization problem (i.e., Equation (20), Constraints (1)–(4) and (23)) contains a large number of binary variables, preventing the direct application of KKT- or strong-duality-based reformulation methods. Furthermore, to preserve the information privacy of the lower-level EV users, in practical implementation, the lower level only feeds back its charging power to the upper level. As a result, conventional reformulation methods based on KKT conditions or strong-duality-based reformulation, which are typically used to convert a bi-level model into an equivalent single-level problem, cannot be directly applied.
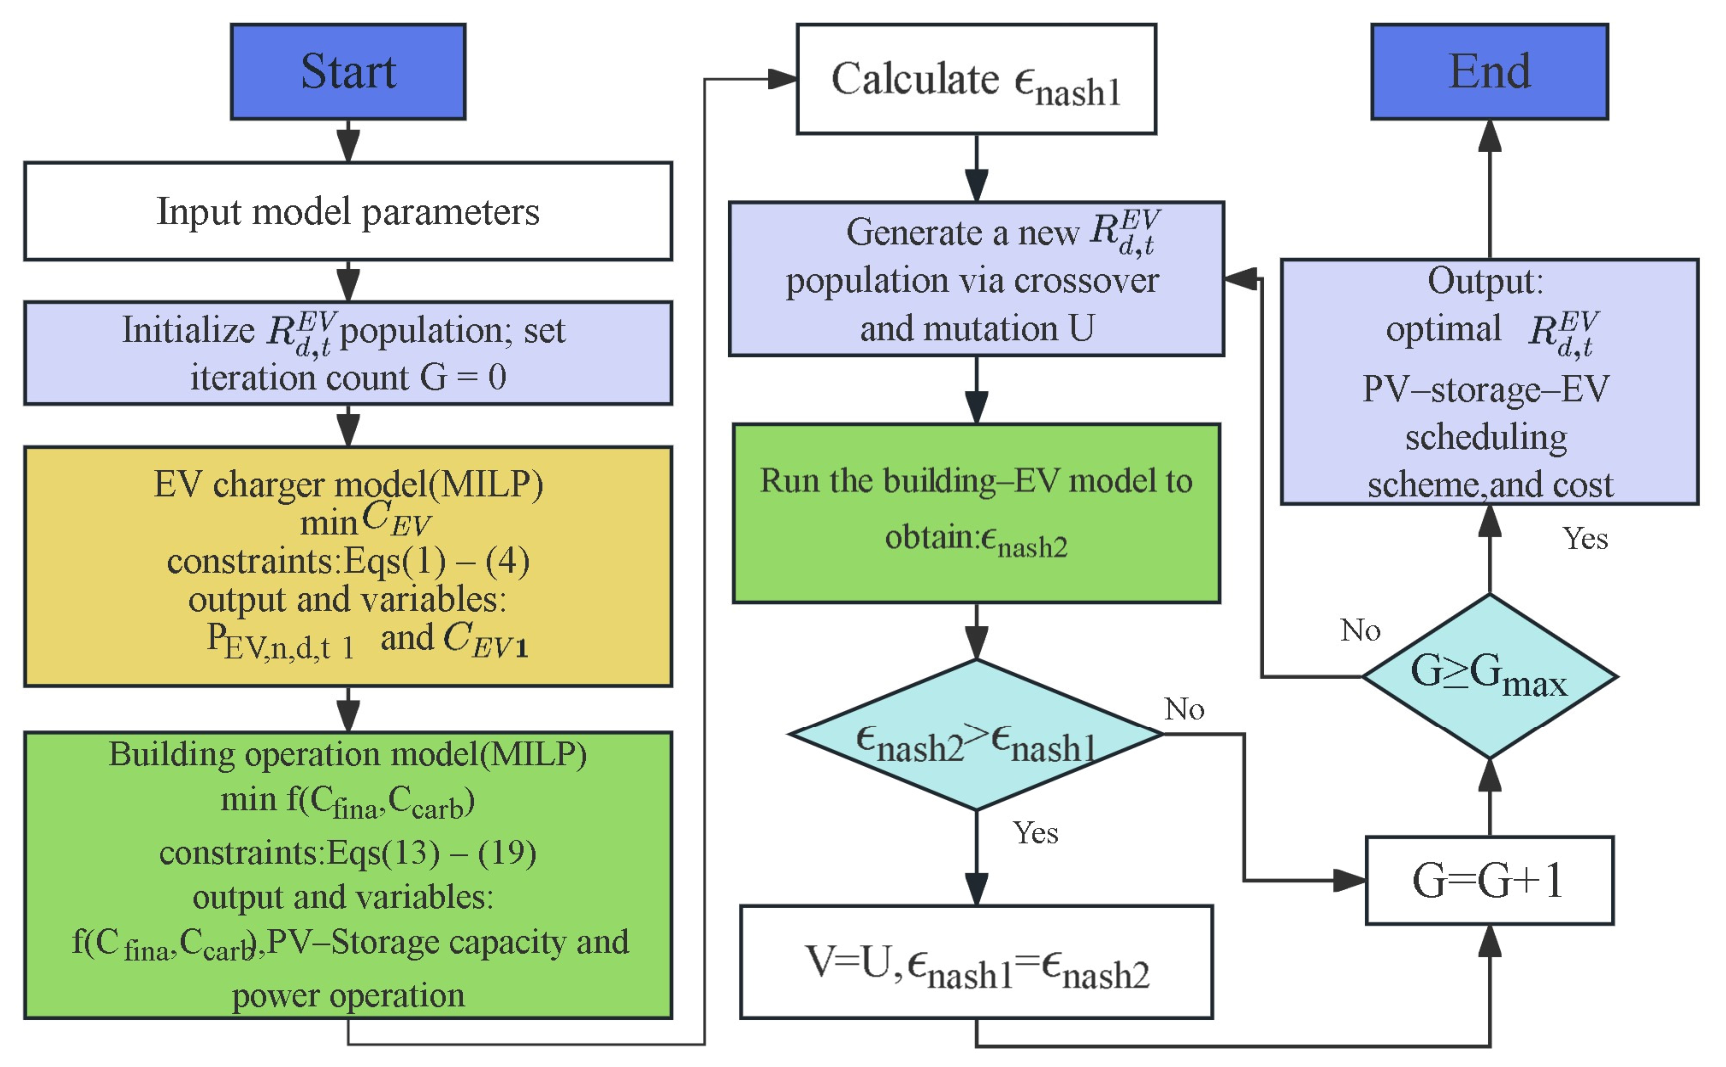
To address this issue, a GA-based solution framework is developed to solve the bi-level optimization model, as illustrated in Figure 2. The main solution procedure is as follows. First, the upper-level model initializes a population of EV charging price schemes R d , t EV . Given the charging prices, the lower-level orderly EV charging problem is a MILP, which can be directly solved, yielding the optimal EV charging power profile in response to the given charging prices. Subsequently, the obtained EV charging response is fed back to the upper-level model, which then performs coordinated optimization of PV-storage capacity configuration and charging prices based on the updated EV charging demand. In summary, the decision variables optimized by the GA, i.e., the chromosome, are the charging prices R d , t EV . With the proposed solution framework, both the lower-level EV problem and the upper-level building problem can be solved as MILPs for a given charging price scheme, which can be solved directly using commercial solvers such as Gurobi.
During the iterative process, the Nash product between the building operator and EV users is adopted as the fitness function of the GA, and the GA evolves the population toward maximizing the Nash product. The algorithm proceeds through population initialization, selection, crossover, and mutation operations and iterates until the predefined convergence criteria are satisfied. Finally, the optimal PV-storage capacity configuration and EV charging price scheme are obtained.

4. Case Studies

4.1. Case Data

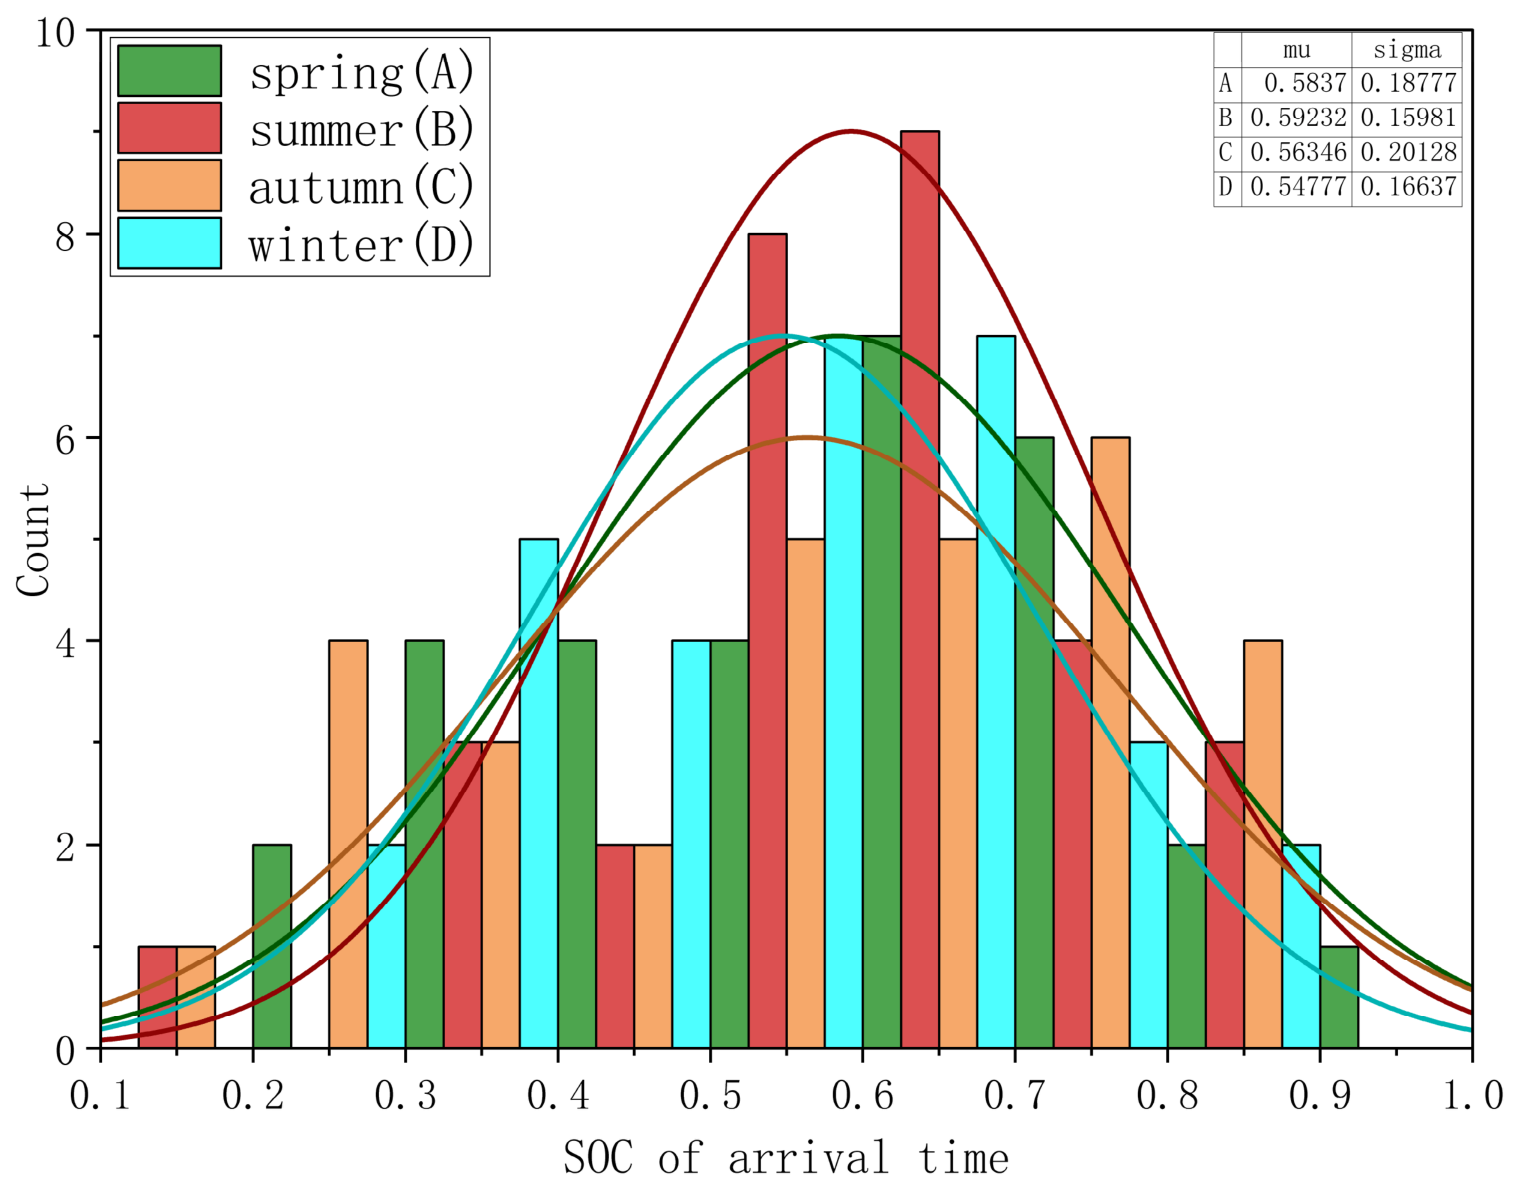
EV charging data are extracted from [28], which reports a survey on EV travel and charging behavior at the campus of Beijing University of Technology, showing that the average EV arrival and departure times are 08:07 and 18:37, respectively. The arrival SOC follows a normal distribution of N (0.59, 0.21). The arrival SOC values sampled based on the normal distribution are shown in Figure 3. The sampled arrival SOC parameters are used as the initial SOC of each EV in Equation (1). This study focuses on an office building on the campus, and the maximum building load of 90 kW is adopted based on data in [28]. In this study, EVs are assumed to remain parked at the building from 08:00 to 18:00, and their charging loads are available for scheduling during this period. The departure SOC of each EV is limited to the interval [0.8, 0.95].
The EV battery capacity is set to 60 kWh, based on the specifications of the Tesla Model Y, and the charging pile power is set to 7 kW, based on Tesla’s third-generation wall-mounted connector. The charging efficiency is assumed to be 95%. In this case study, 30 EVs and 10 charging piles are considered. The cost parameters of the PV and energy storage systems are adopted from [37]. The PV investment cost is 3815.1 CNY/kW, with a lifetime of 25 years and an annual operation and maintenance cost of 38.15 CNY/kW. The energy storage system has a charge/discharge rate of 0.25 and an efficiency of 95%, with an investment cost of 3851.1 CNY/kWh, a lifetime of 15 years, and an annual operation and maintenance cost of 96.28 CNY/kW. The PV power curtailment penalty is set to 0.3 CNY/kWh. The carbon emission cost coefficient of grid electricity purchase is set to 0.01013 CNY/kWh, with reference to the typical value of 0.0102 CNY/kWh in the North China Power Grid. This value is also consistent with a grid emission factor of approximately 0.85 kg CO2/kWh and a carbon price of approximately 0.012 CNY/kg CO2. The Big-M parameter in Equation (16) is set to 1 × 10⁷.
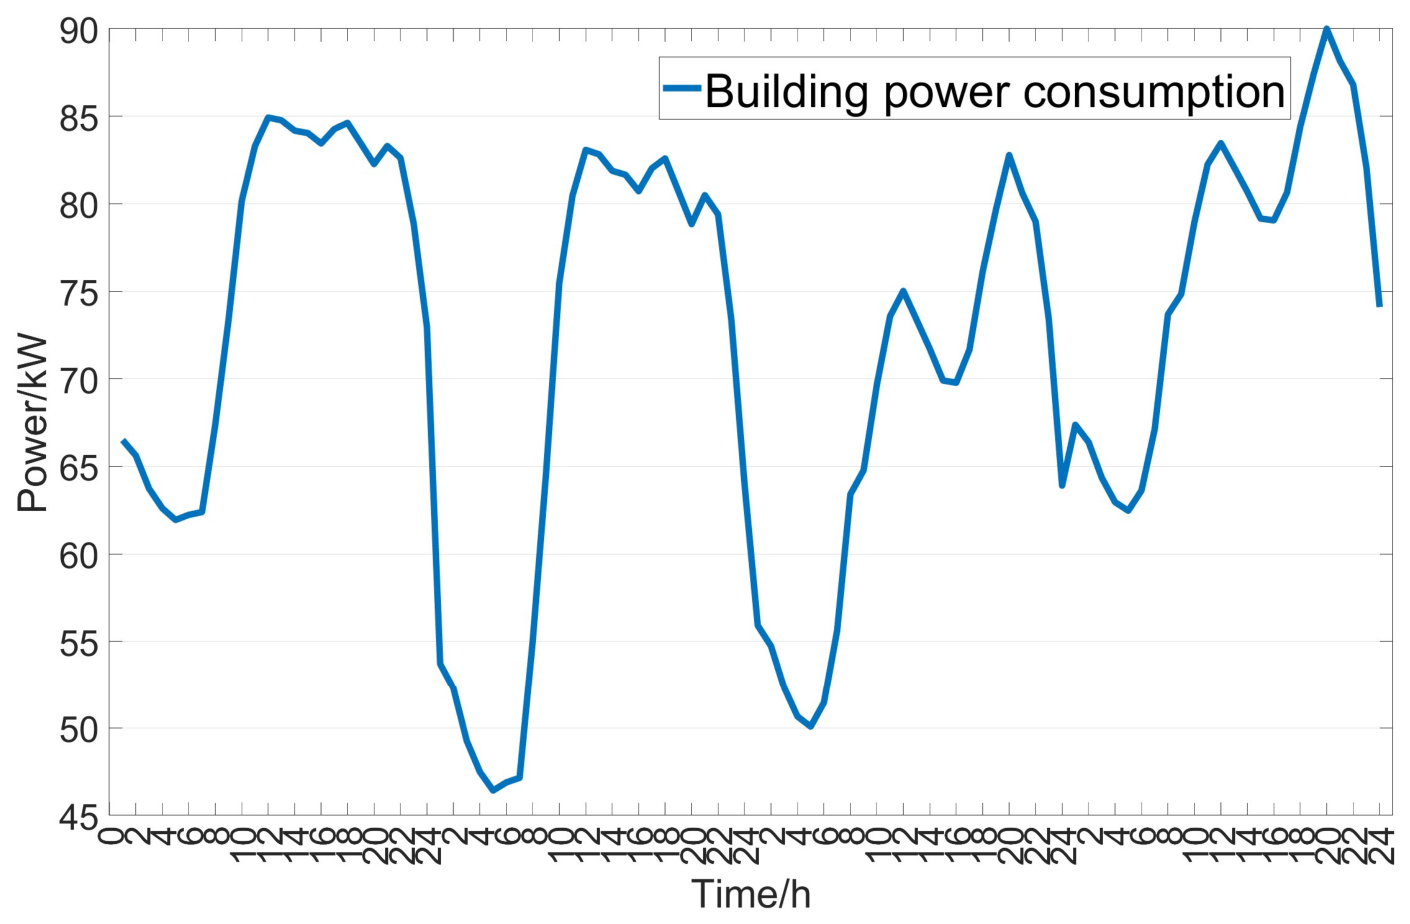
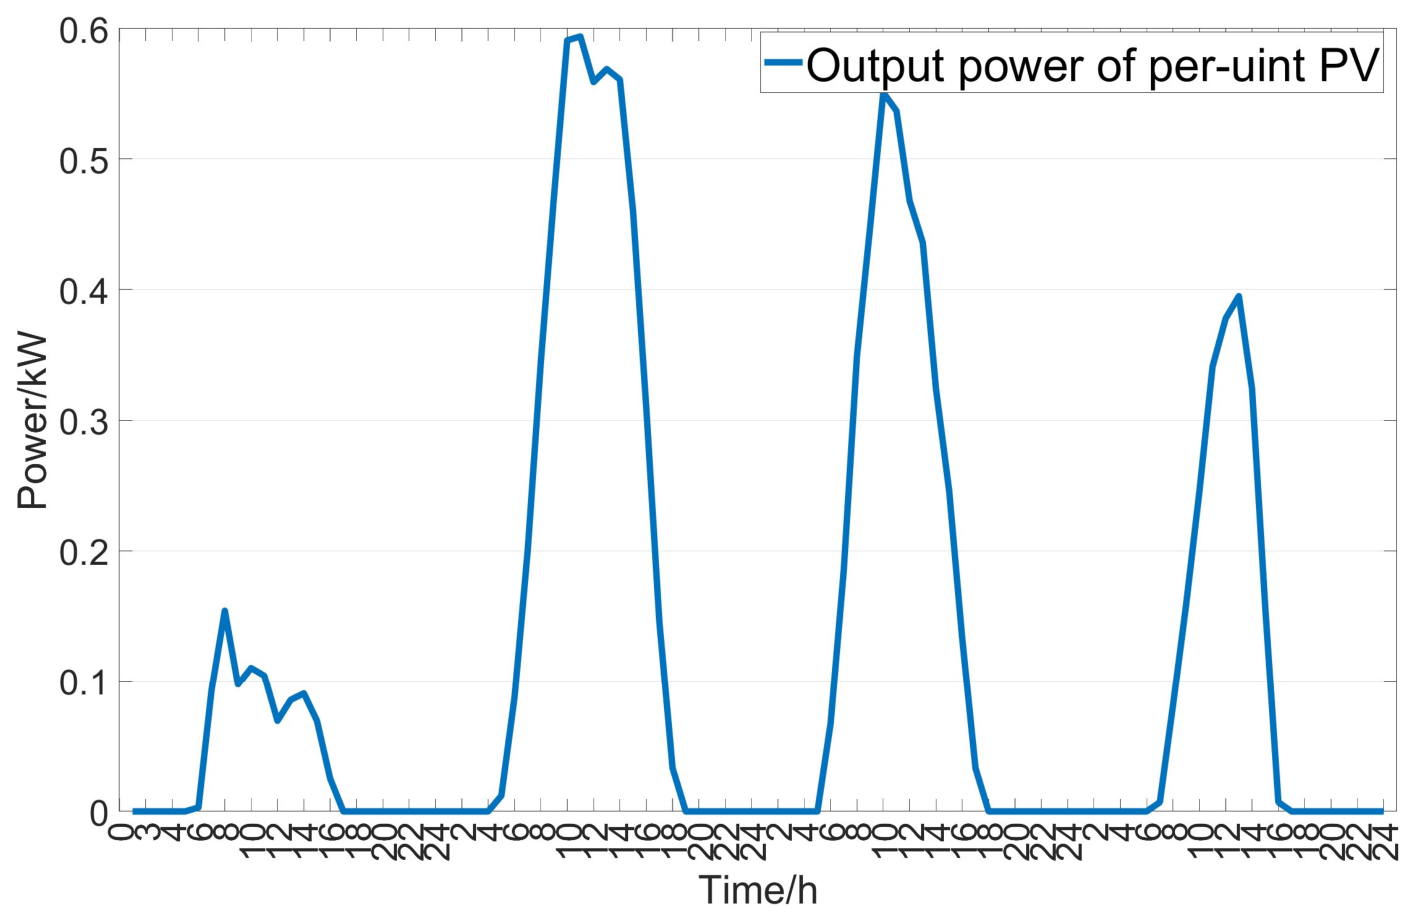
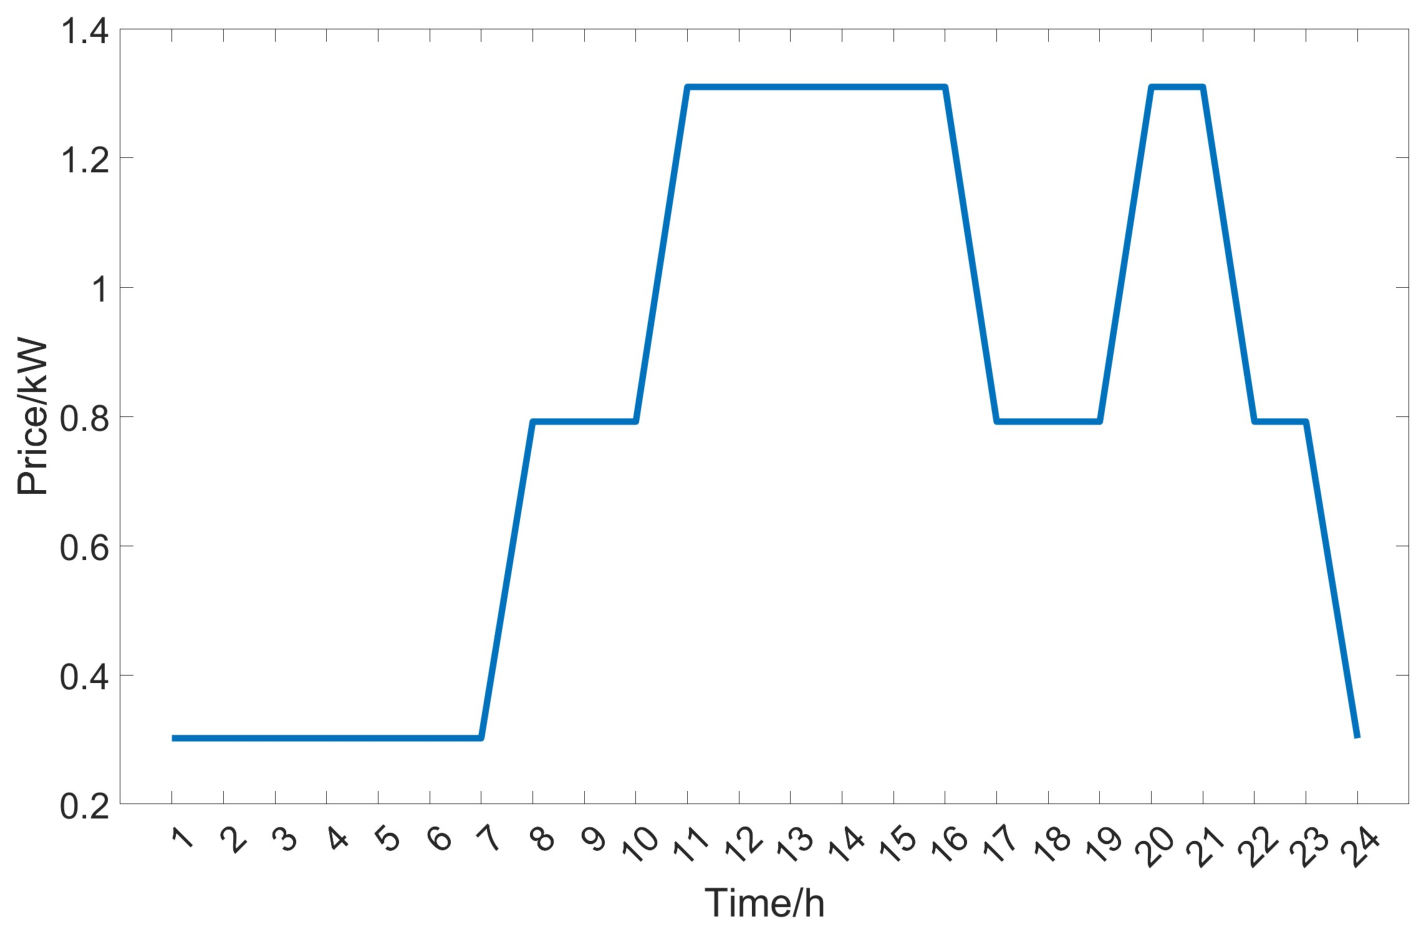
The typical seasonal electricity load curves and corresponding data for Beijing can be obtained from [38]. Since this study does not focus on the development of representative-day construction methods, four representative days, one for each season, are selected following previous work using representative days for capacity expansion planning models. Specifically, the load profiles on 1 March, 1 June, 1 September, and 1 December are selected and normalized to obtain representative daily load factors. These factors are then multiplied by the maximum load of the BUT building to generate the load profiles shown in Figure 4. All data are aligned to Beijing Time (UTC+8). The per-unit PV power output profiles are extracted from the MERRA-2-based dataset in [39] using the grid cell covering the BUT campus (39.8744° N, 116.4857° E). The unit-capacity PV generation profile is shown in Figure 5, and the time-of-use electricity price is shown in Figure 6.
The upper-level optimization problem is solved by the ga function in MATLAB (Global Optimization Toolbox, version corresponding to MATLAB R2023b). The EV model and building model are solved by Gurobi (version 13.0.0). Detailed parameters of GA and Gurobi are provided in Appendix A.

4.2. Results and Discussion

To highlight the effectiveness of the proposed multi-objective PV-storage capacity configuration method considering the flexibility potential of EV charging loads, six comparative cases are designed, as summarized in Table 1.
Cases I and II correspond to the proposed PV-storage capacity configuration framework considering EV charging flexibility, where Case I considers both carbon emission and economic objectives, while Case II considers only the economic objective. Cases III and IV represent PV-storage configurations without EV charging optimization, where EVs charge according to the TOU tariff. Case III includes both objectives and Case IV considers only the economic objective. Cases I–IV are designed to evaluate the impact of the utilization of EV charging flexibility in building load regulation as well as the influence of single-objective versus multi-objective optimization on PV-storage configuration. Case V considers only the carbon emission objective in the PV-storage configuration, while Case VI represents a multi-objective building operation scenario without PV-storage capacity planning and without considering EV flexibility. It should be noted that all cases are considered for theoretical demonstration since some engineering constraints that may limit the installation of PV-energy storage systems are not considered, e.g., the available rooftop or installation area, maximum PV installation capacity. The presented methodology for PV-energy storage capacity planning can be easily extended to more realistic application scenarios by adding additional scenario-specific constraints without altering the model features and the applicability of the proposed solution algorithms.
The PV-storage configuration results and corresponding cost performance under different cases are presented in Table 2 and Table 3, respectively.
From Table 2 and Table 3, it can be observed that, compared with Case VI, Case I, which jointly optimizes PV-storage capacity configuration and orderly EV charging, significantly reduces both the total economic cost and carbon emission cost of the building, with reductions of 12.28% and 21.24%, respectively. This result demonstrates the potential of smart buildings in achieving cost reduction and decarbonization under the dual-carbon targets.
Comparisons of Case I with Case II and Case III with Case IV, jointly considering economic cost and carbon emission cost, allow the decarbonization objective to be explicitly incorporated under the “dual carbon” goals, elevating the importance of carbon emissions to a level comparable with economic objectives. A reduction in carbon emissions (1.19%) can be achieved with 0.08% increases in economic performance. In contrast, pursuing a zero-carbon electricity supply alone leads to oversized PV-storage configurations and substantial PV curtailment, resulting in building economic costs that are several-times higher.
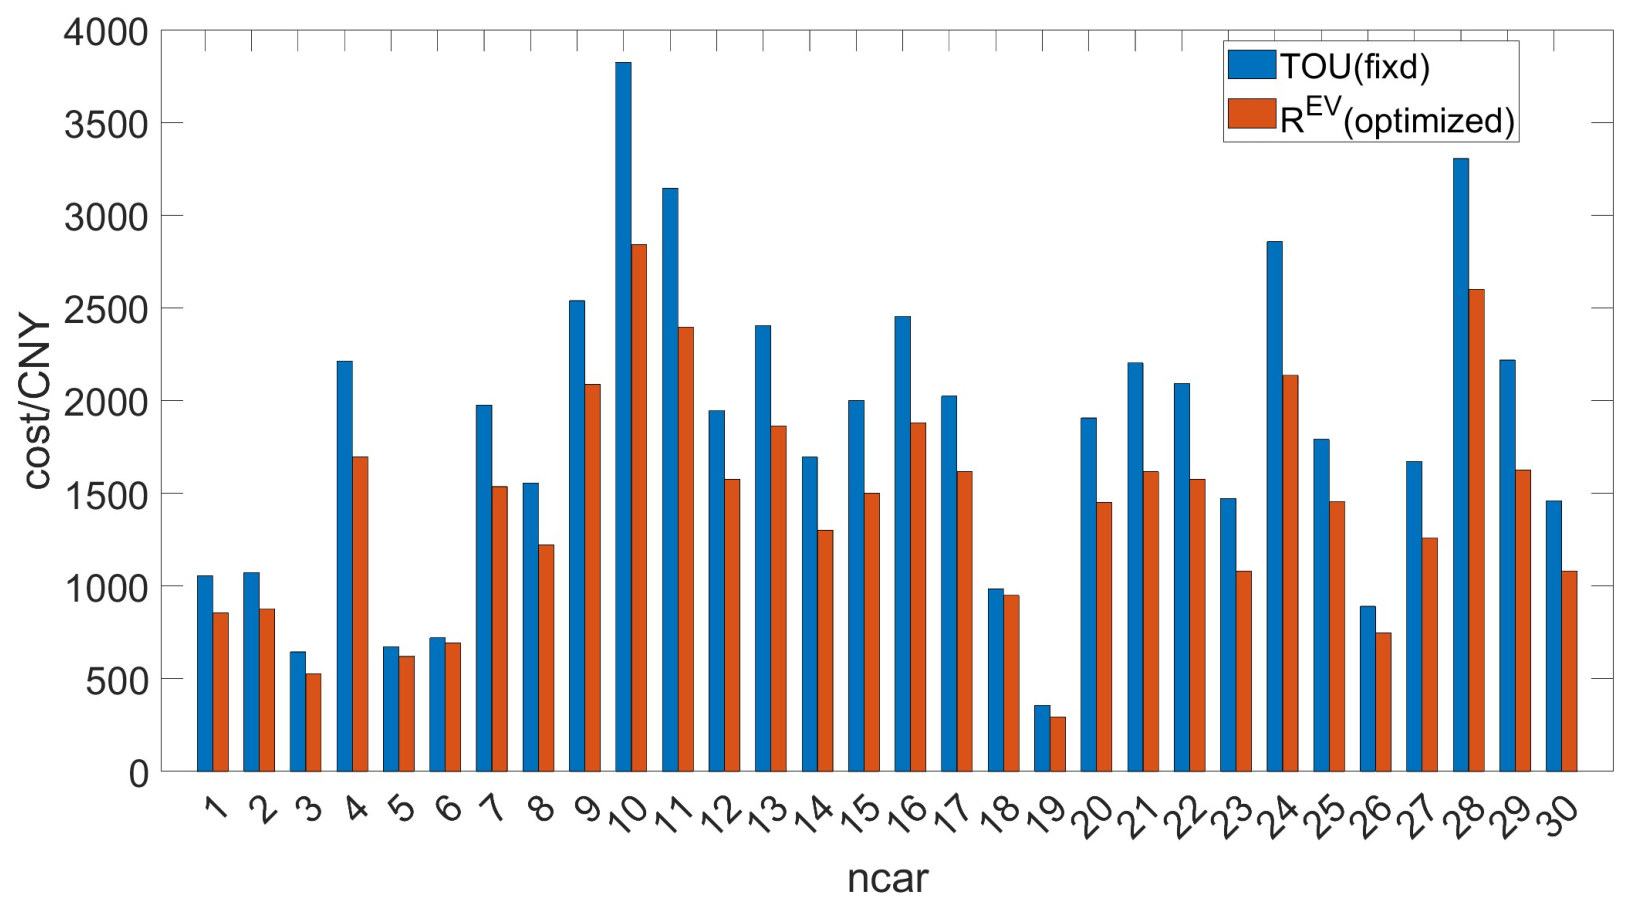
In addition, EV charging loads within the building exhibit significant flexibility potential. By optimizing EV charging schedules, the required PV-storage capacity can be effectively reduced. Comparing Case I and Case III further indicates that optimized EV charging yields considerable economic benefits. By reducing peak EV charging demand and shifting charging loads toward periods with abundant PV generation, the required energy storage system capacity can be reduced. Based on the results in Table 2, the rated power of energy storage decreases from 43.935 kW in Case III to 8.222 kW in Case I with a reduction of 35.713 kW, which is about 51.02% of the total rated power of building charging piles. This coordination contributes to a reduction in the total building cost of CNY 10,510 and a reduction in EV charging cost of CNY 11,996 compared with the TOU scenario. The specific charging costs for each EV are compared in Figure 7. In contrast, Case V results in excessively large capacities of energy storage and PV generation, which may be impractical for buildings with a peak load of only 90 kW. This is because Case V minimizes the carbon emission cost without considering economic costs. Since grid electricity purchases are assumed to be the only source of operational carbon emissions, optimization tends to eliminate grid electricity purchases through PV capacity far exceeding the building’s peak load.
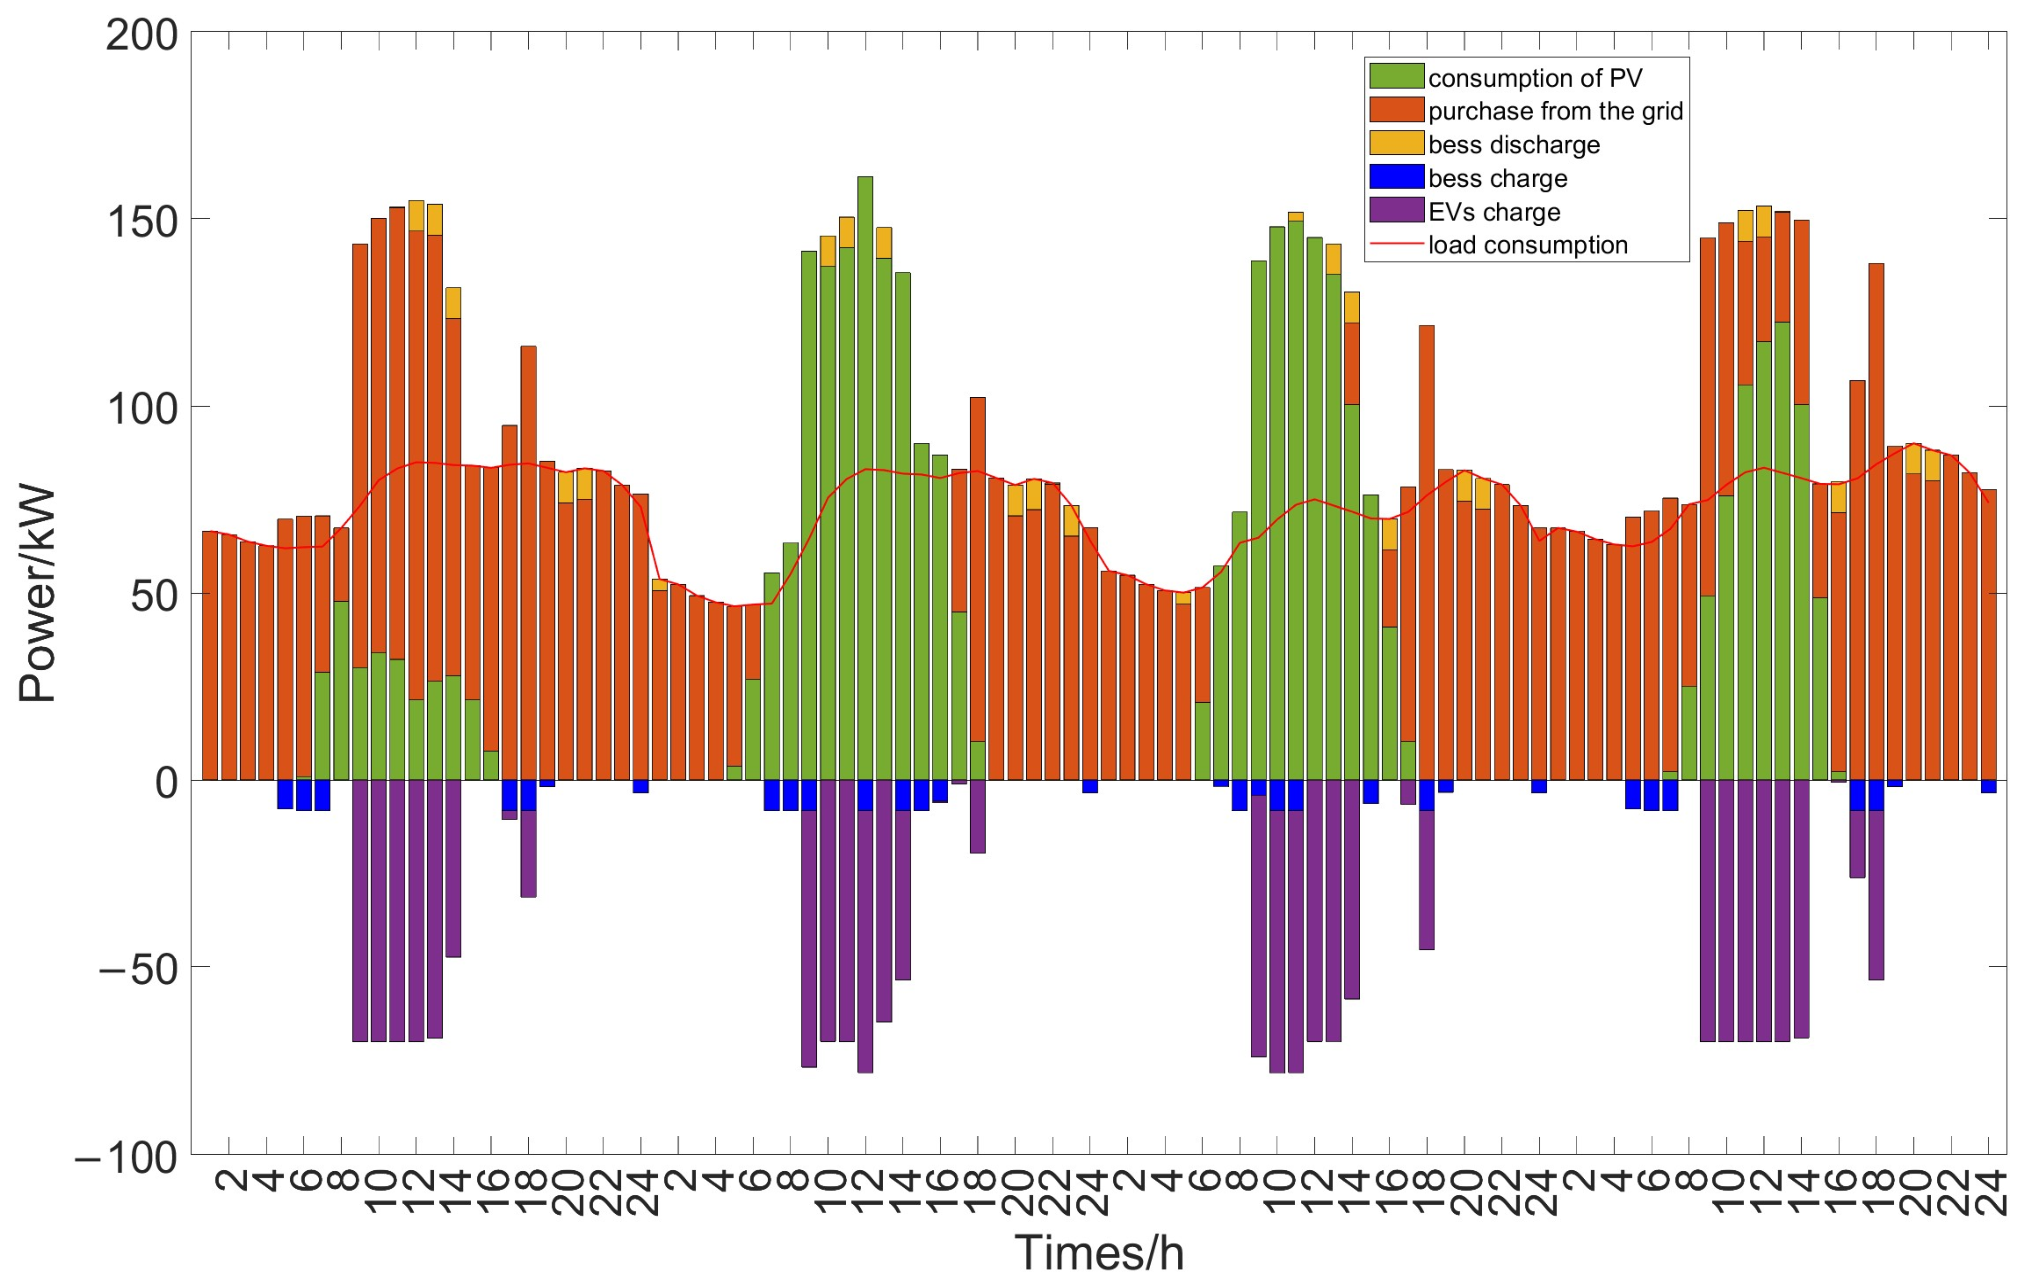
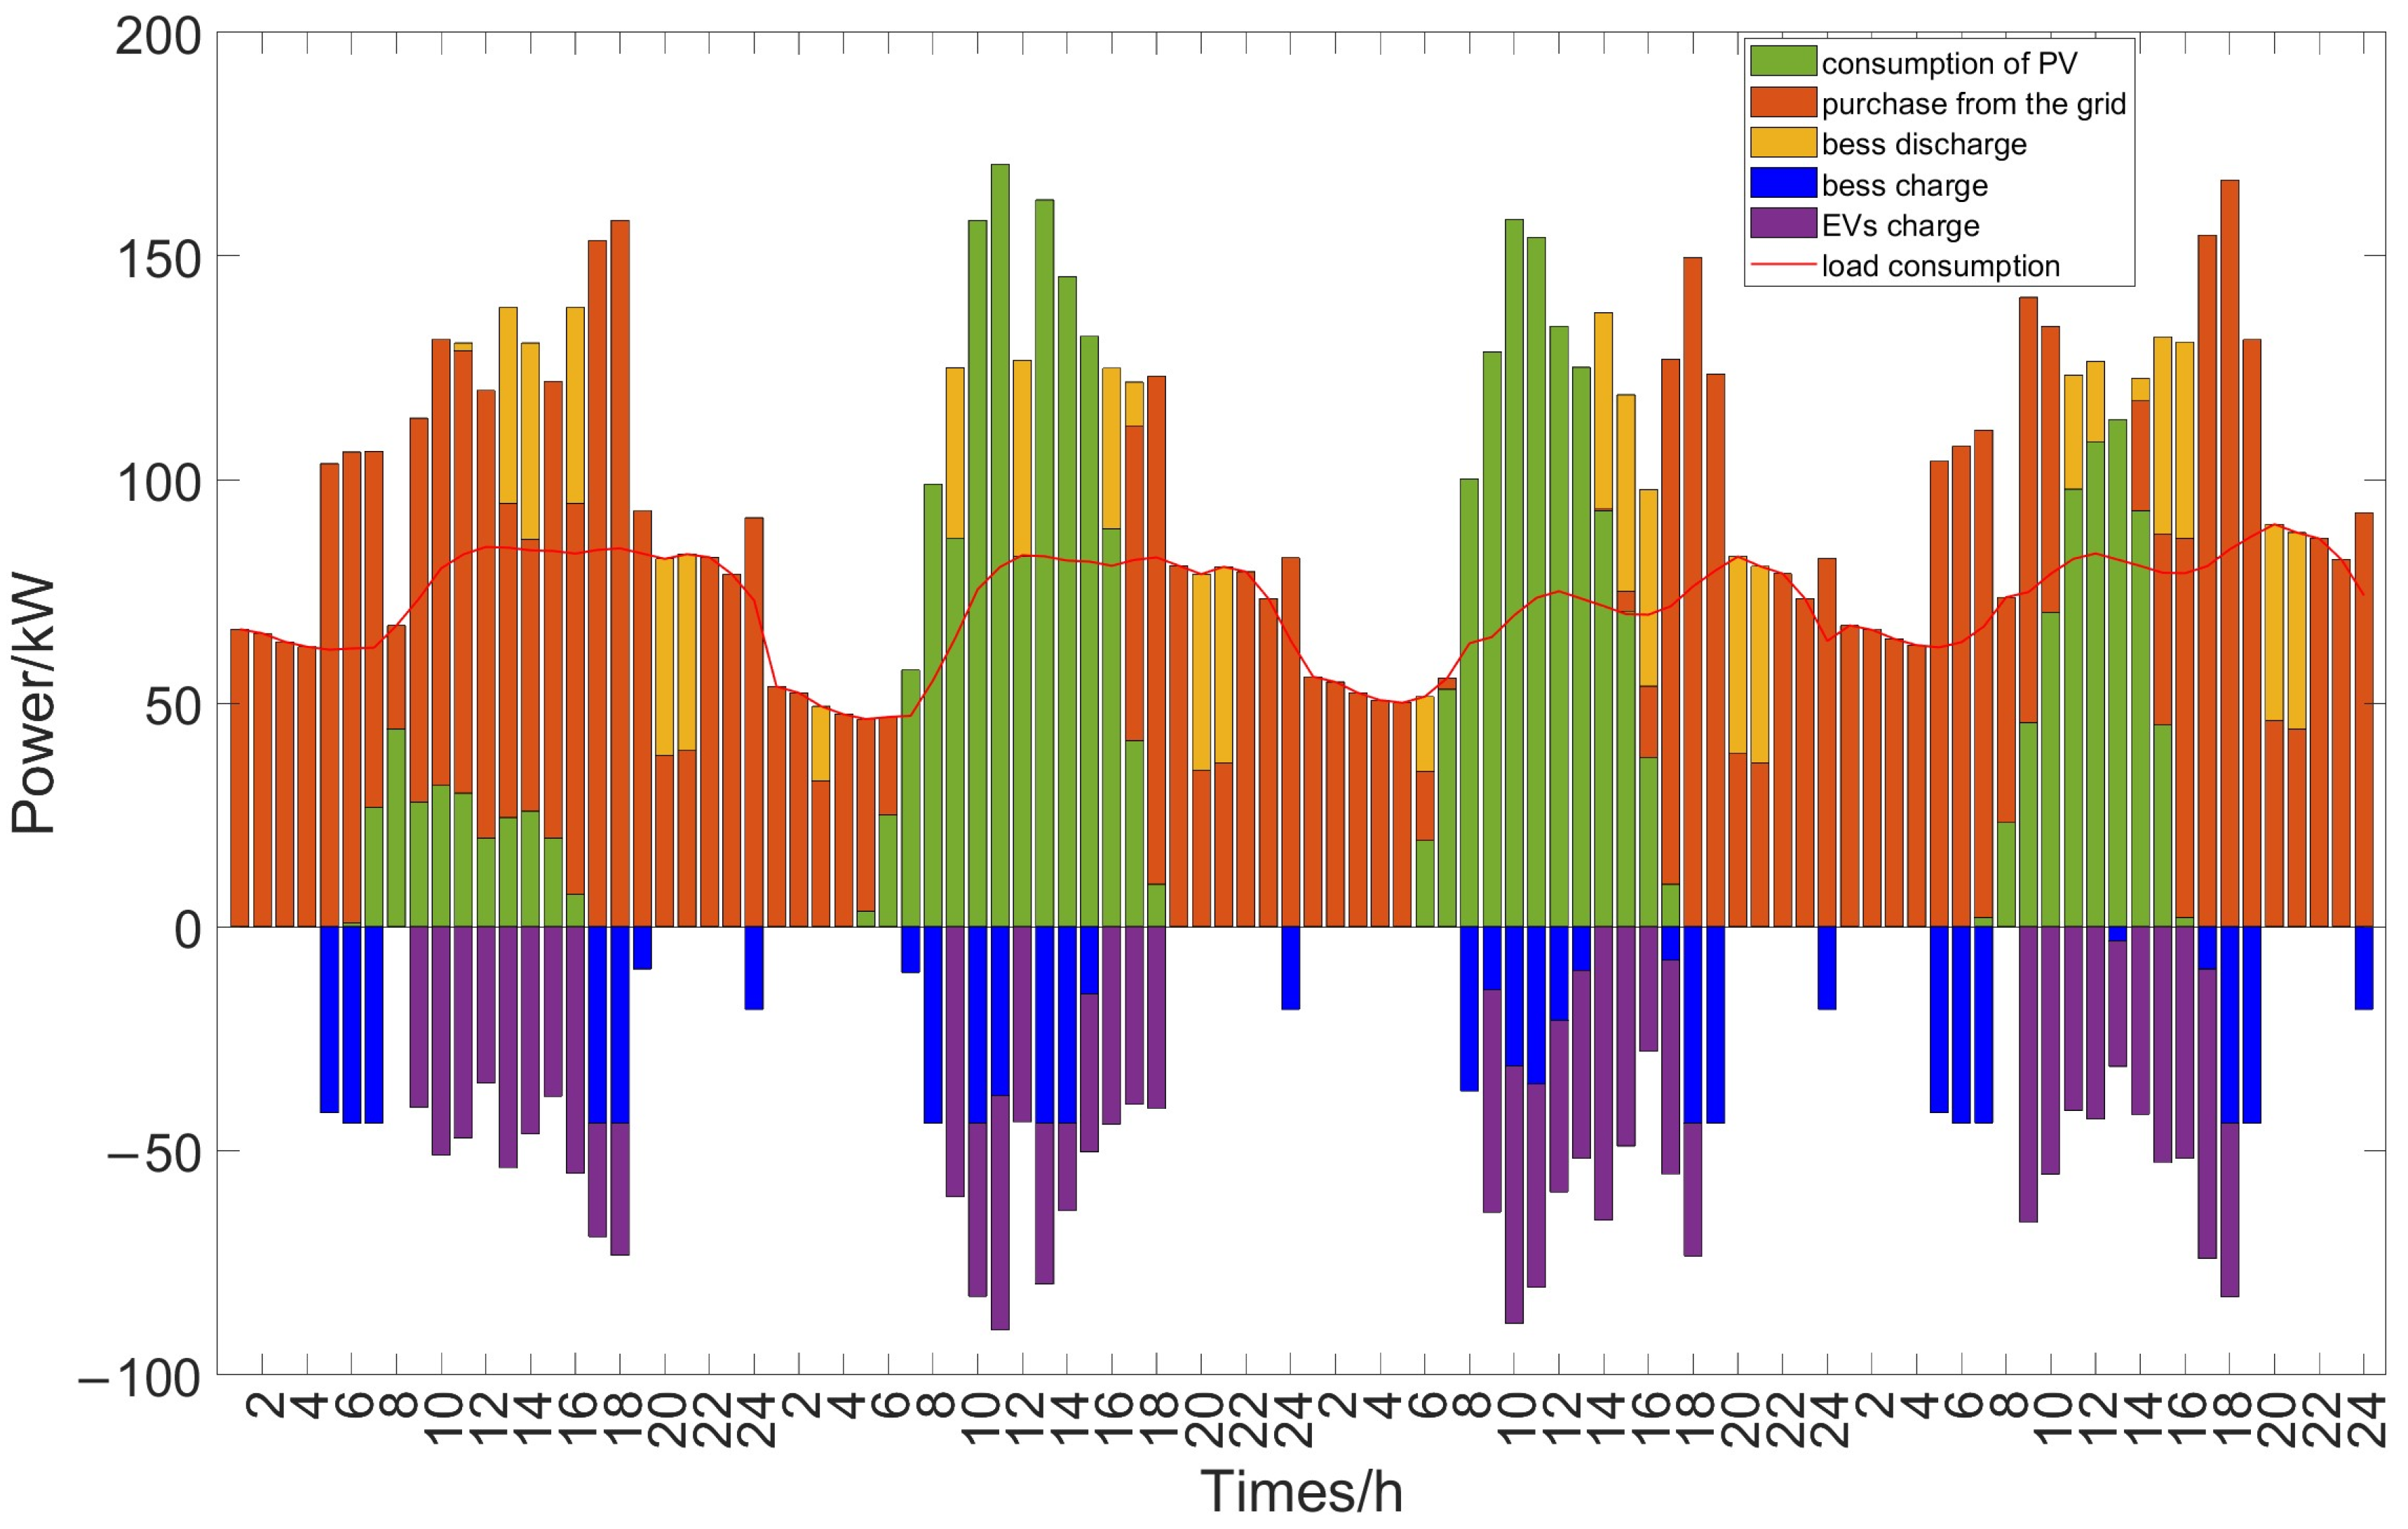
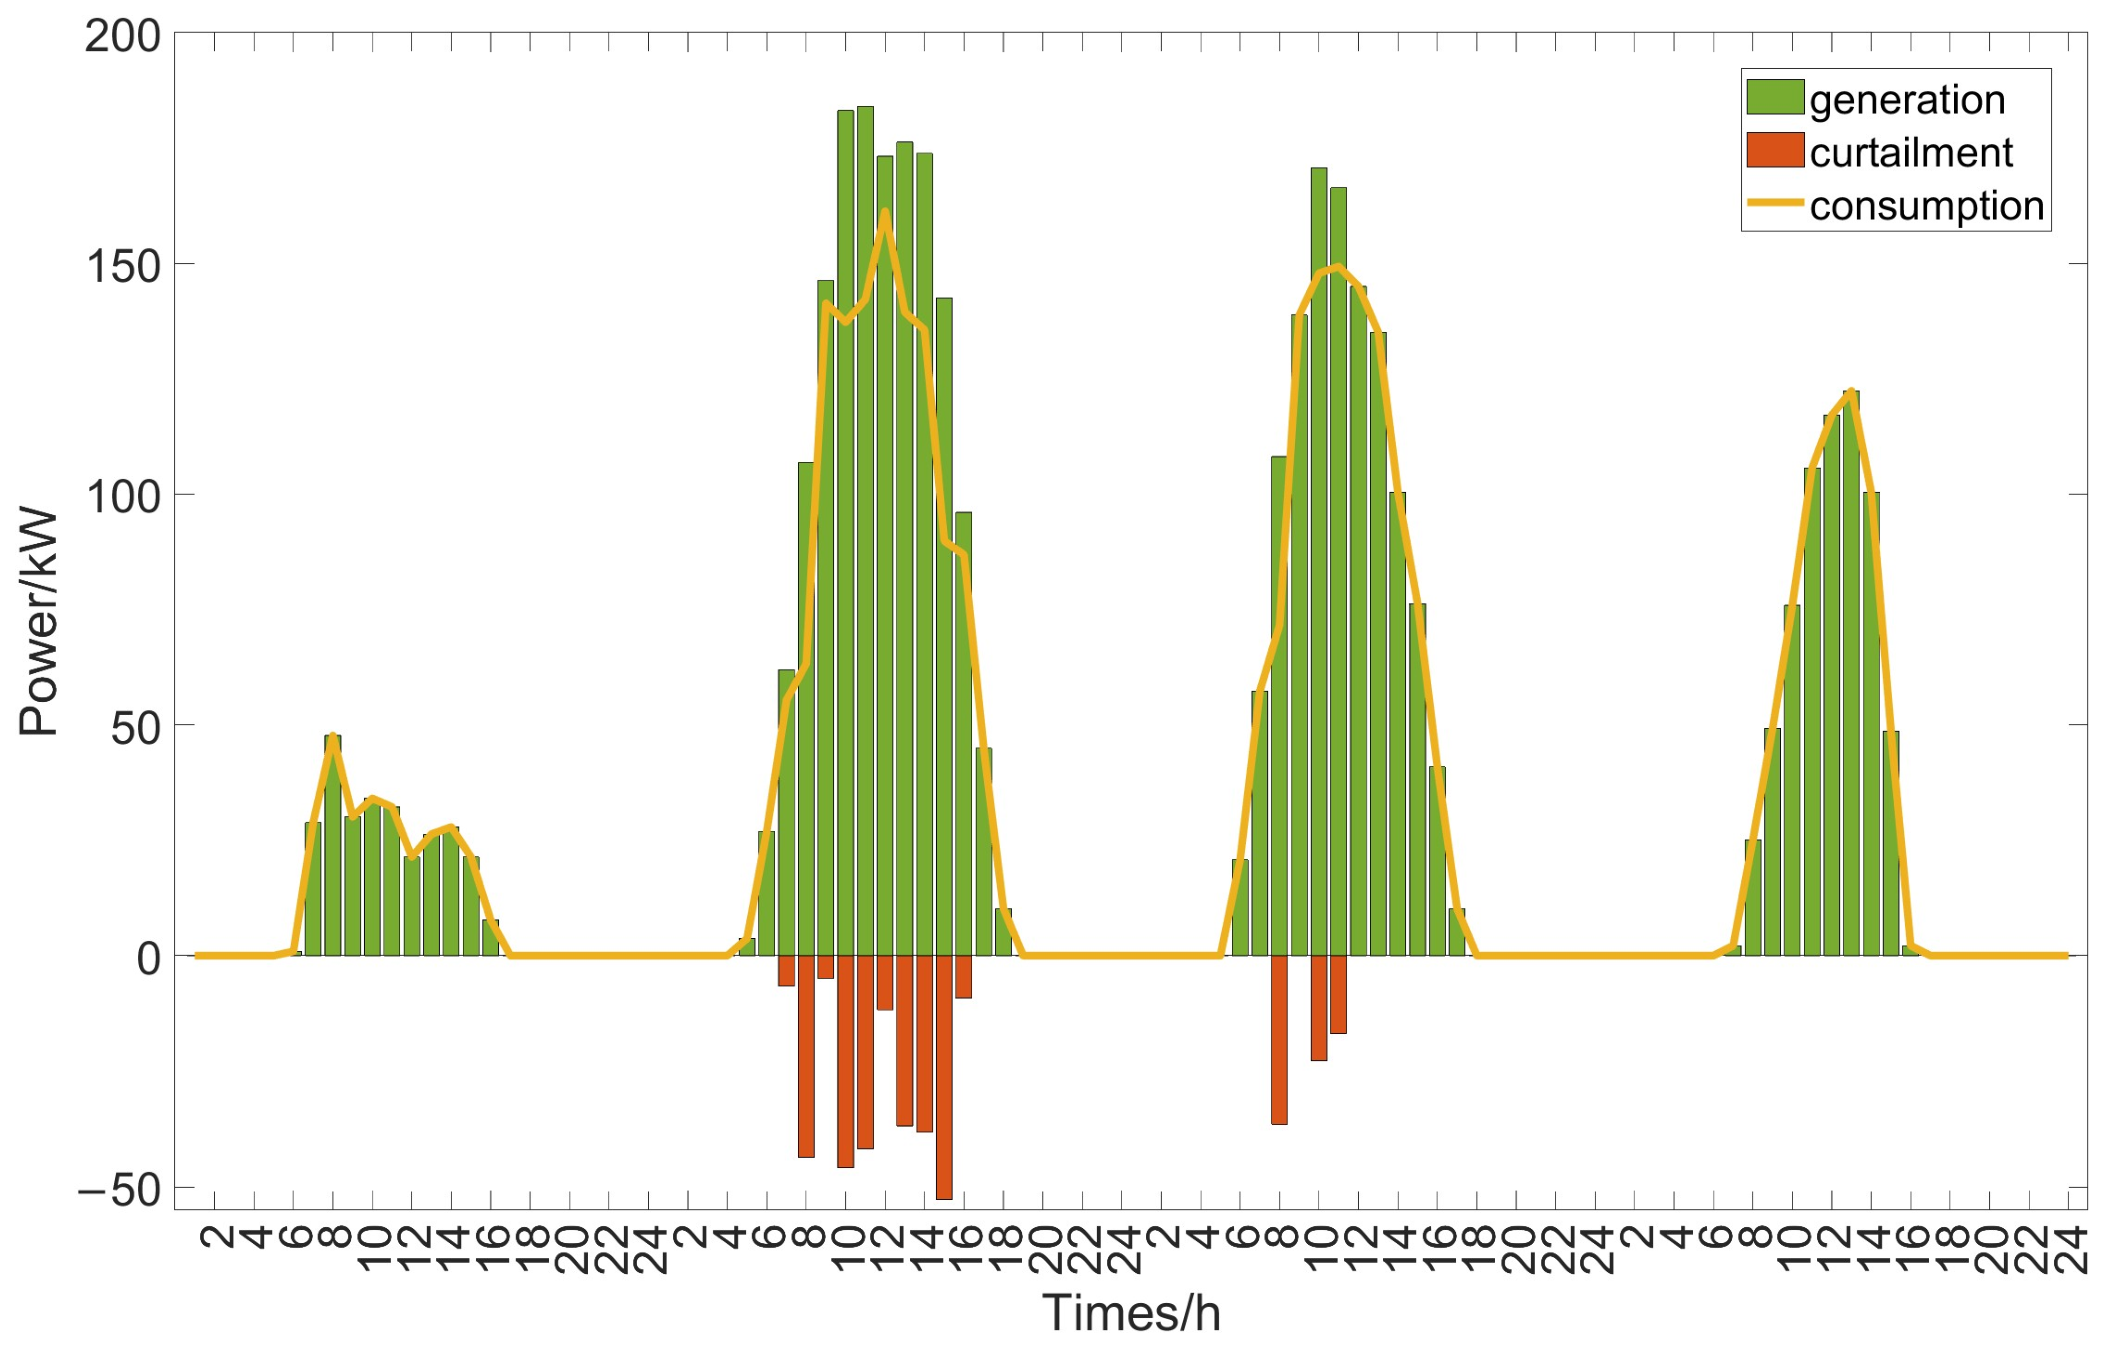
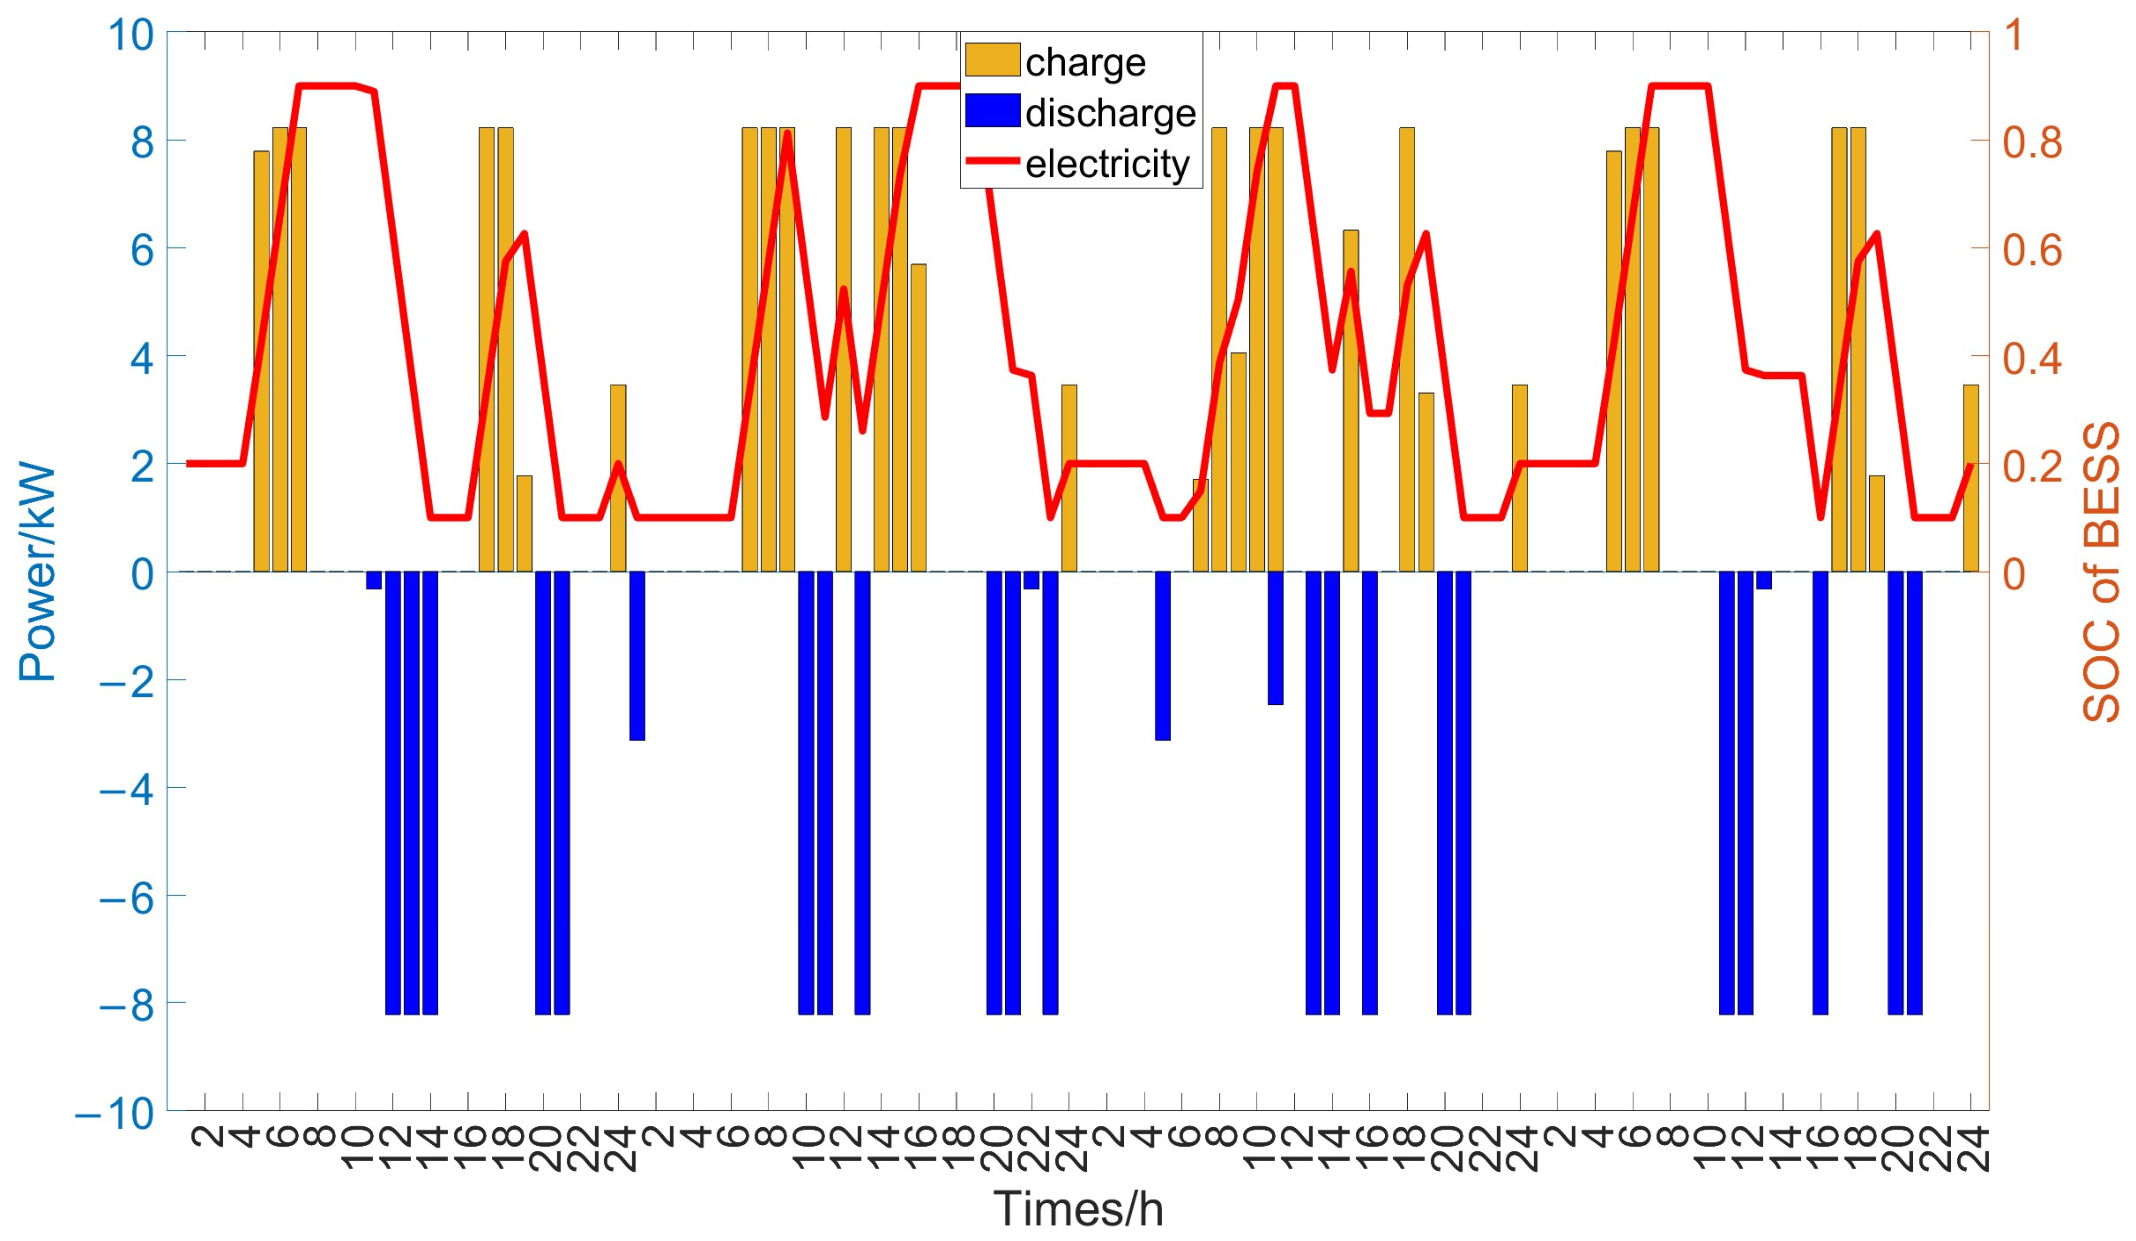
In terms of the detailed operational simulation results for each typical day, the energy storage system exhibits relatively limited charging and discharging activity in spring, autumn, and winter. In these three seasons, PV power curtailment is almost negligible. In contrast, during the summer representative day, due to higher PV generation, the energy storage system exhibits more frequent switching between charging and discharging during daytime operation, and PV curtailment becomes more pronounced, as shown in Figure 8, Figure 9, Figure 10 and Figure 11.
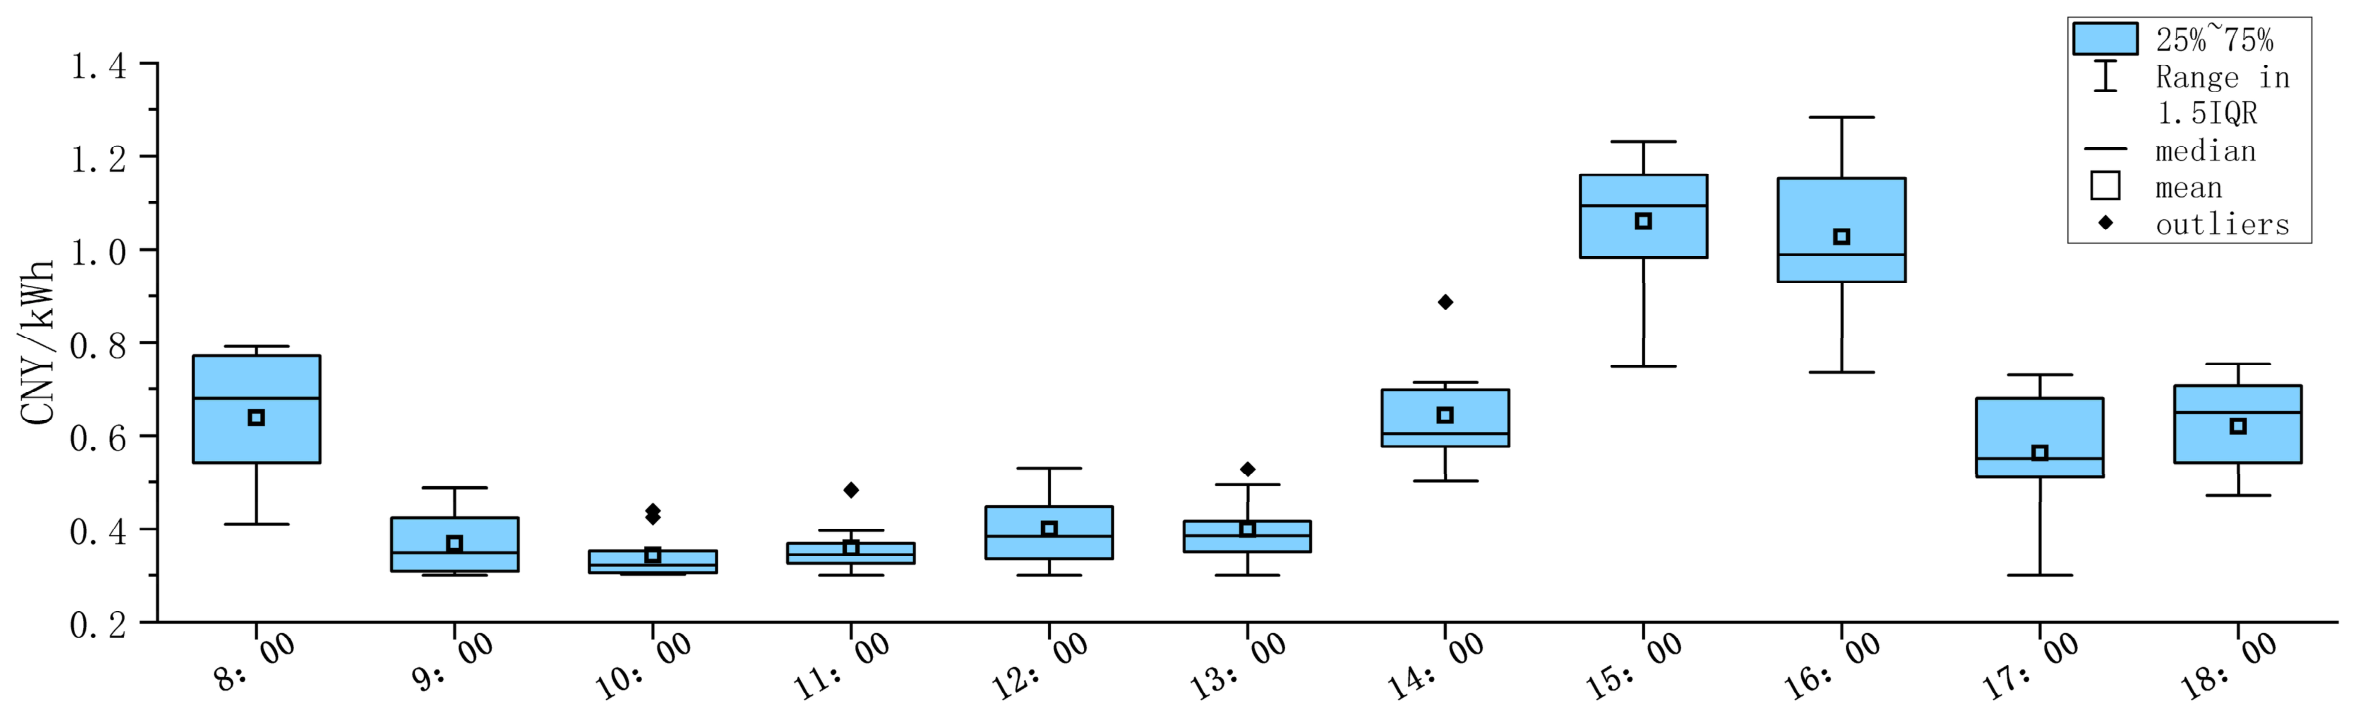
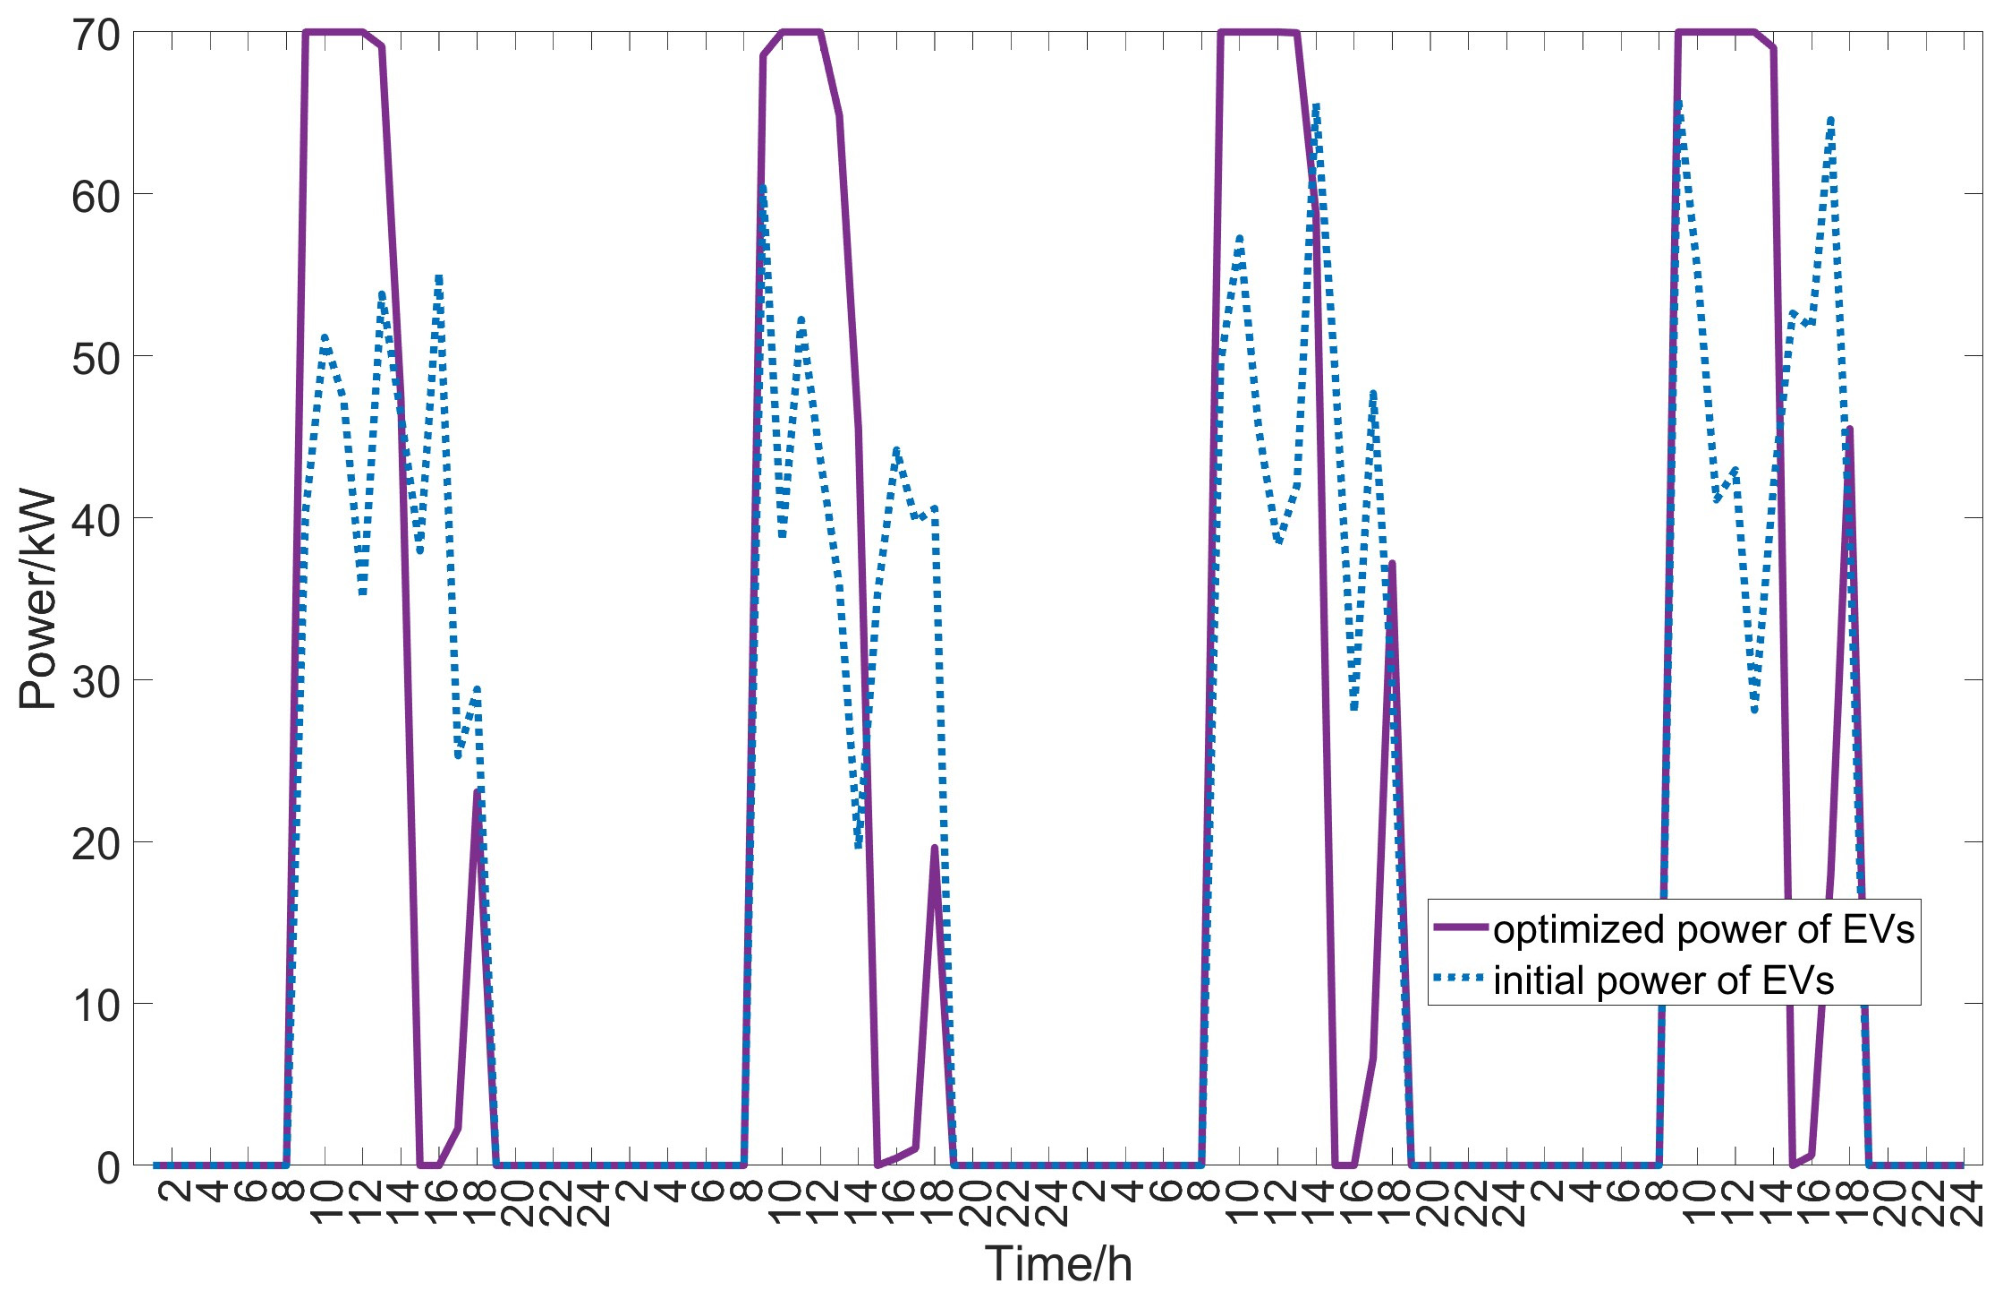
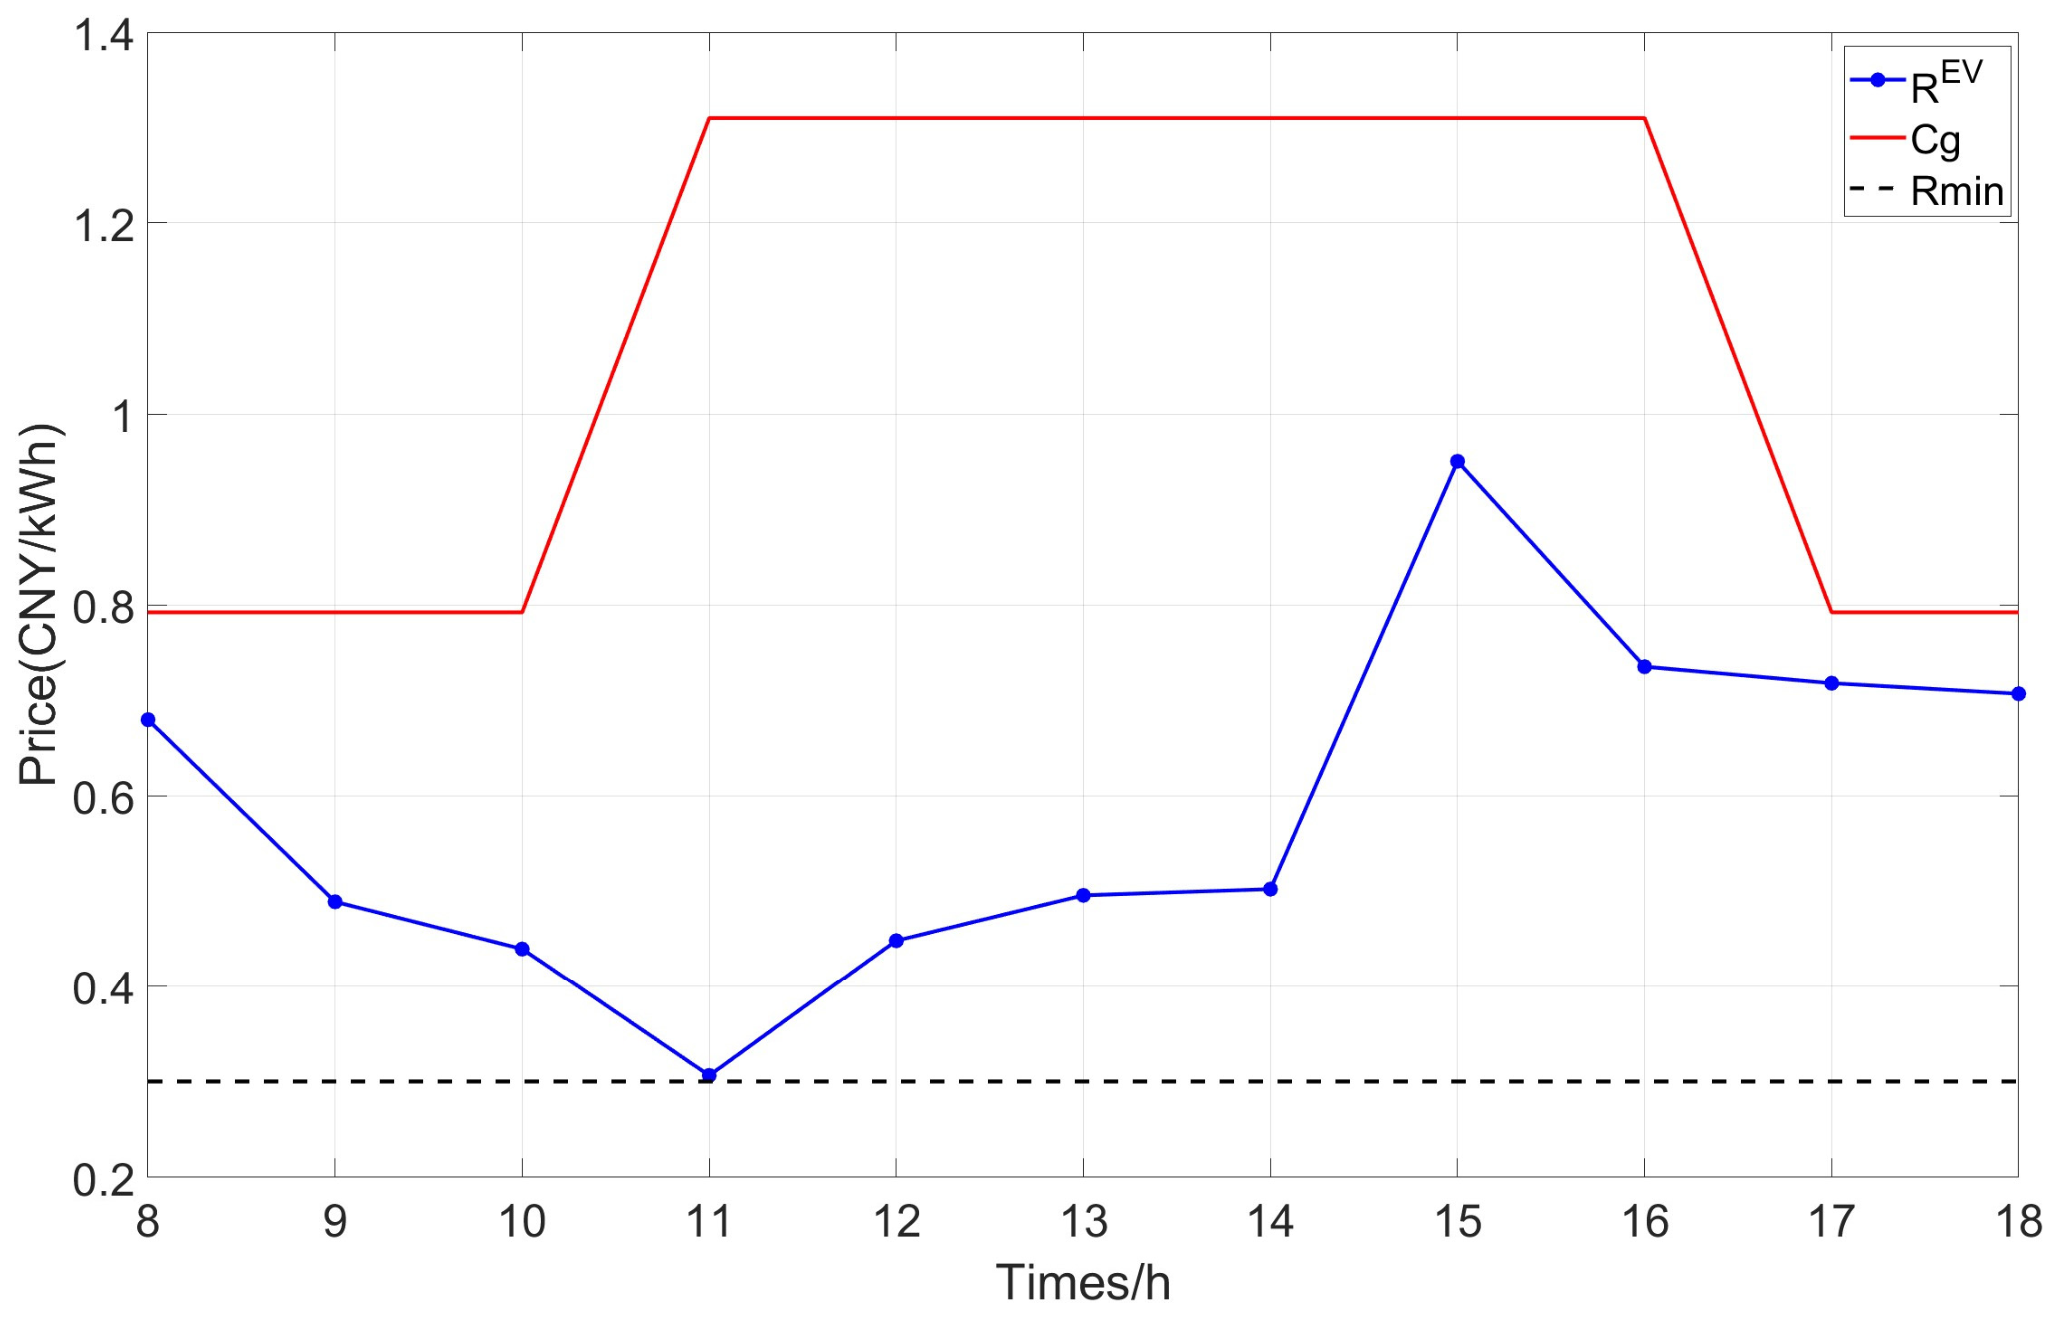
Figure 12 shows the EV charging power profiles before and after optimization. The optimized EV charging price is illustrated in Figure 13. We can observe that the EV charging price first decreases and then increases, reaching its minimum at 11:00 and the maximum at 15:00. This pattern is mainly attributed to abundant PV generation during the daytime. Accordingly, the EV charging profile is redistributed across the scheduling period. The optimized EV charging demand is mainly concentrated during 09:00 and14:00 and around 18:00, exhibiting a bimodal pattern with one major peak and one minor peak.
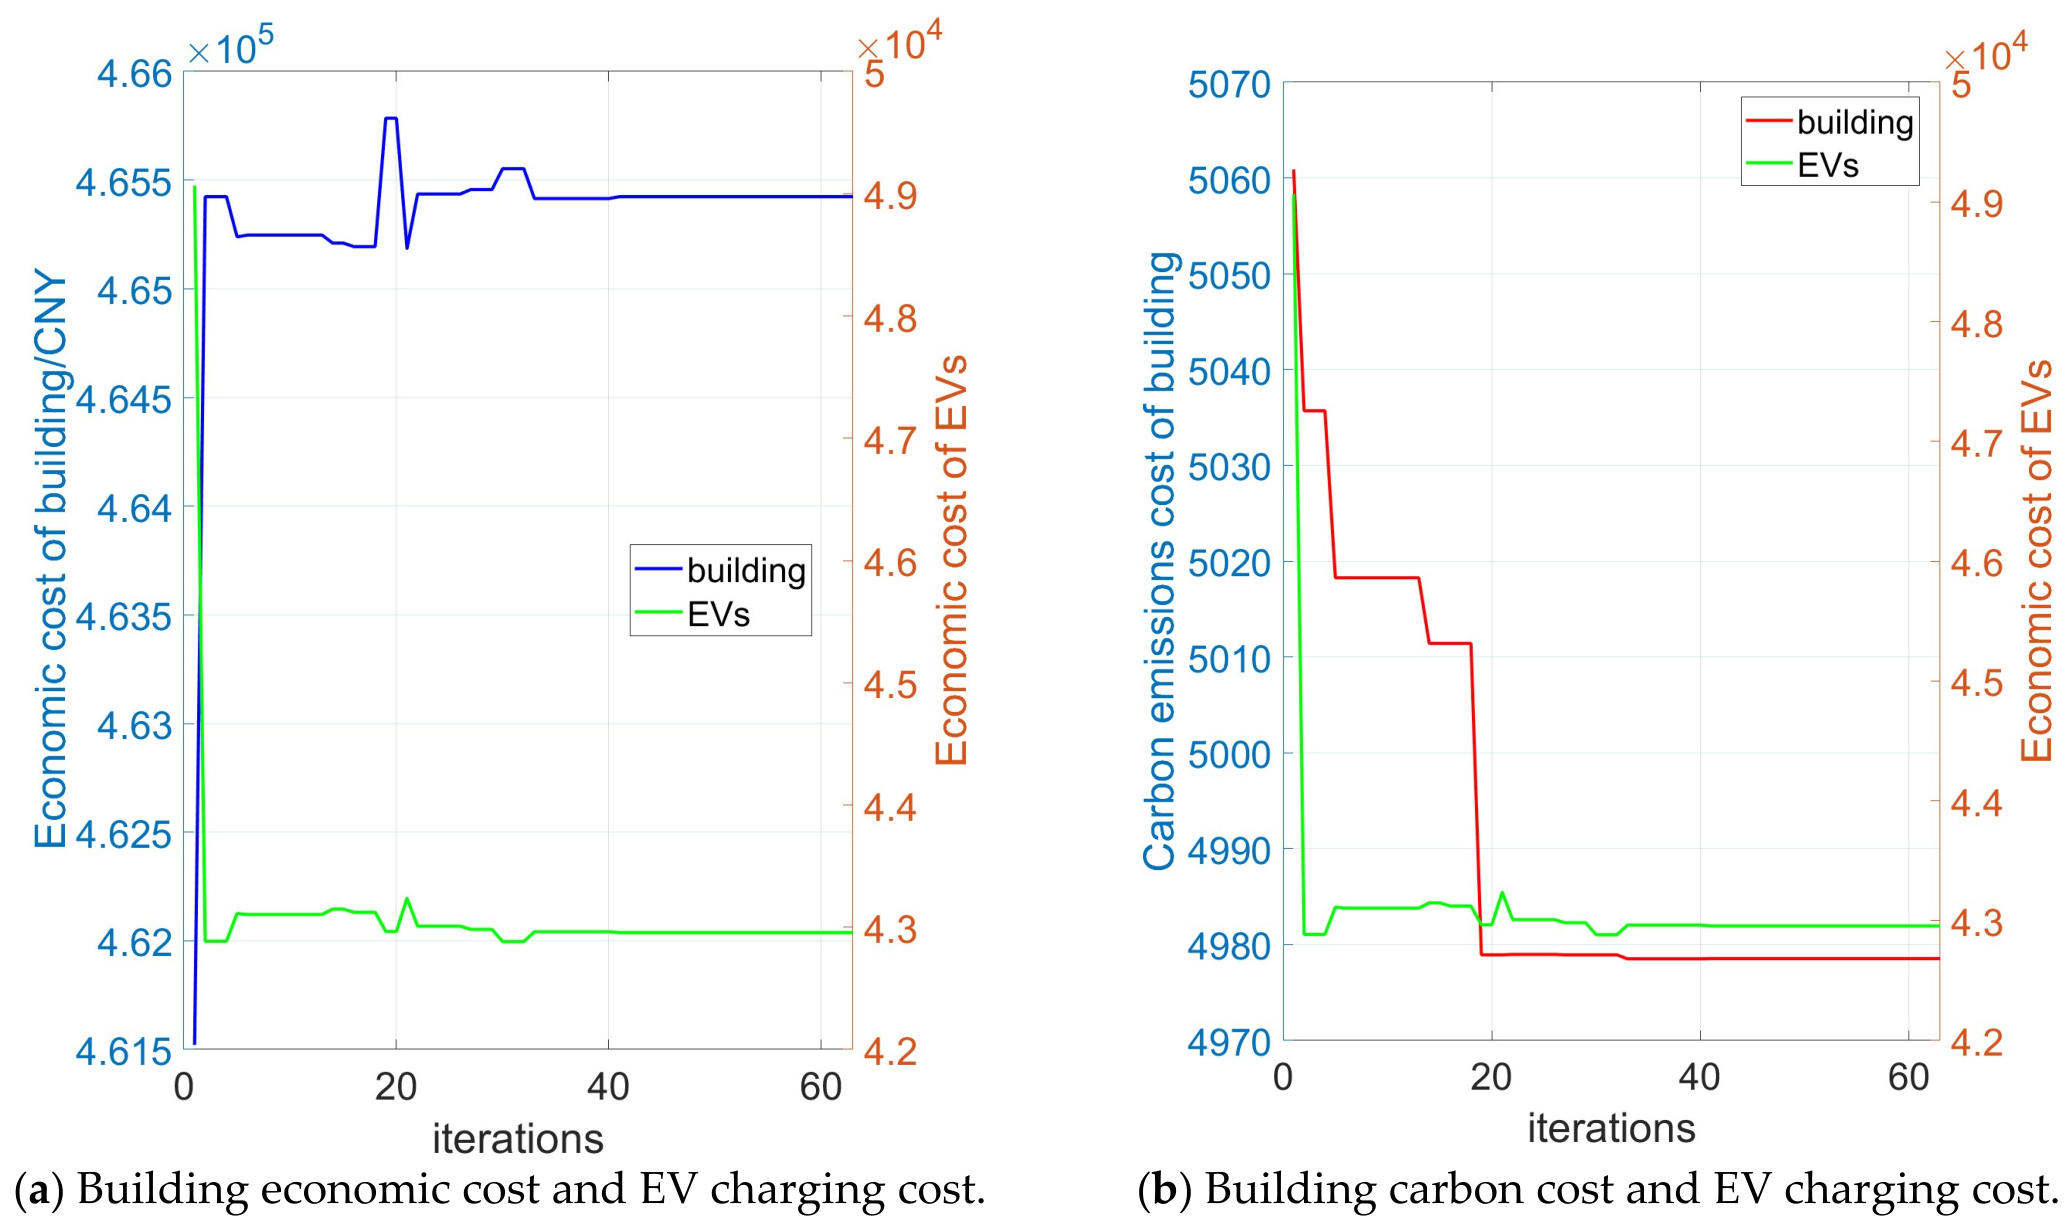
The solution process of the proposed building PV-storage capacity configuration model is illustrated in Figure 14. It can be observed that the GA-based optimization converges after 41 iterations, reaching a stable solution. During the iterative process, a solution close to the final converged value is already achieved after 20 iterations, and subsequent iterations only exhibit minor variations until the convergence criterion is reached.
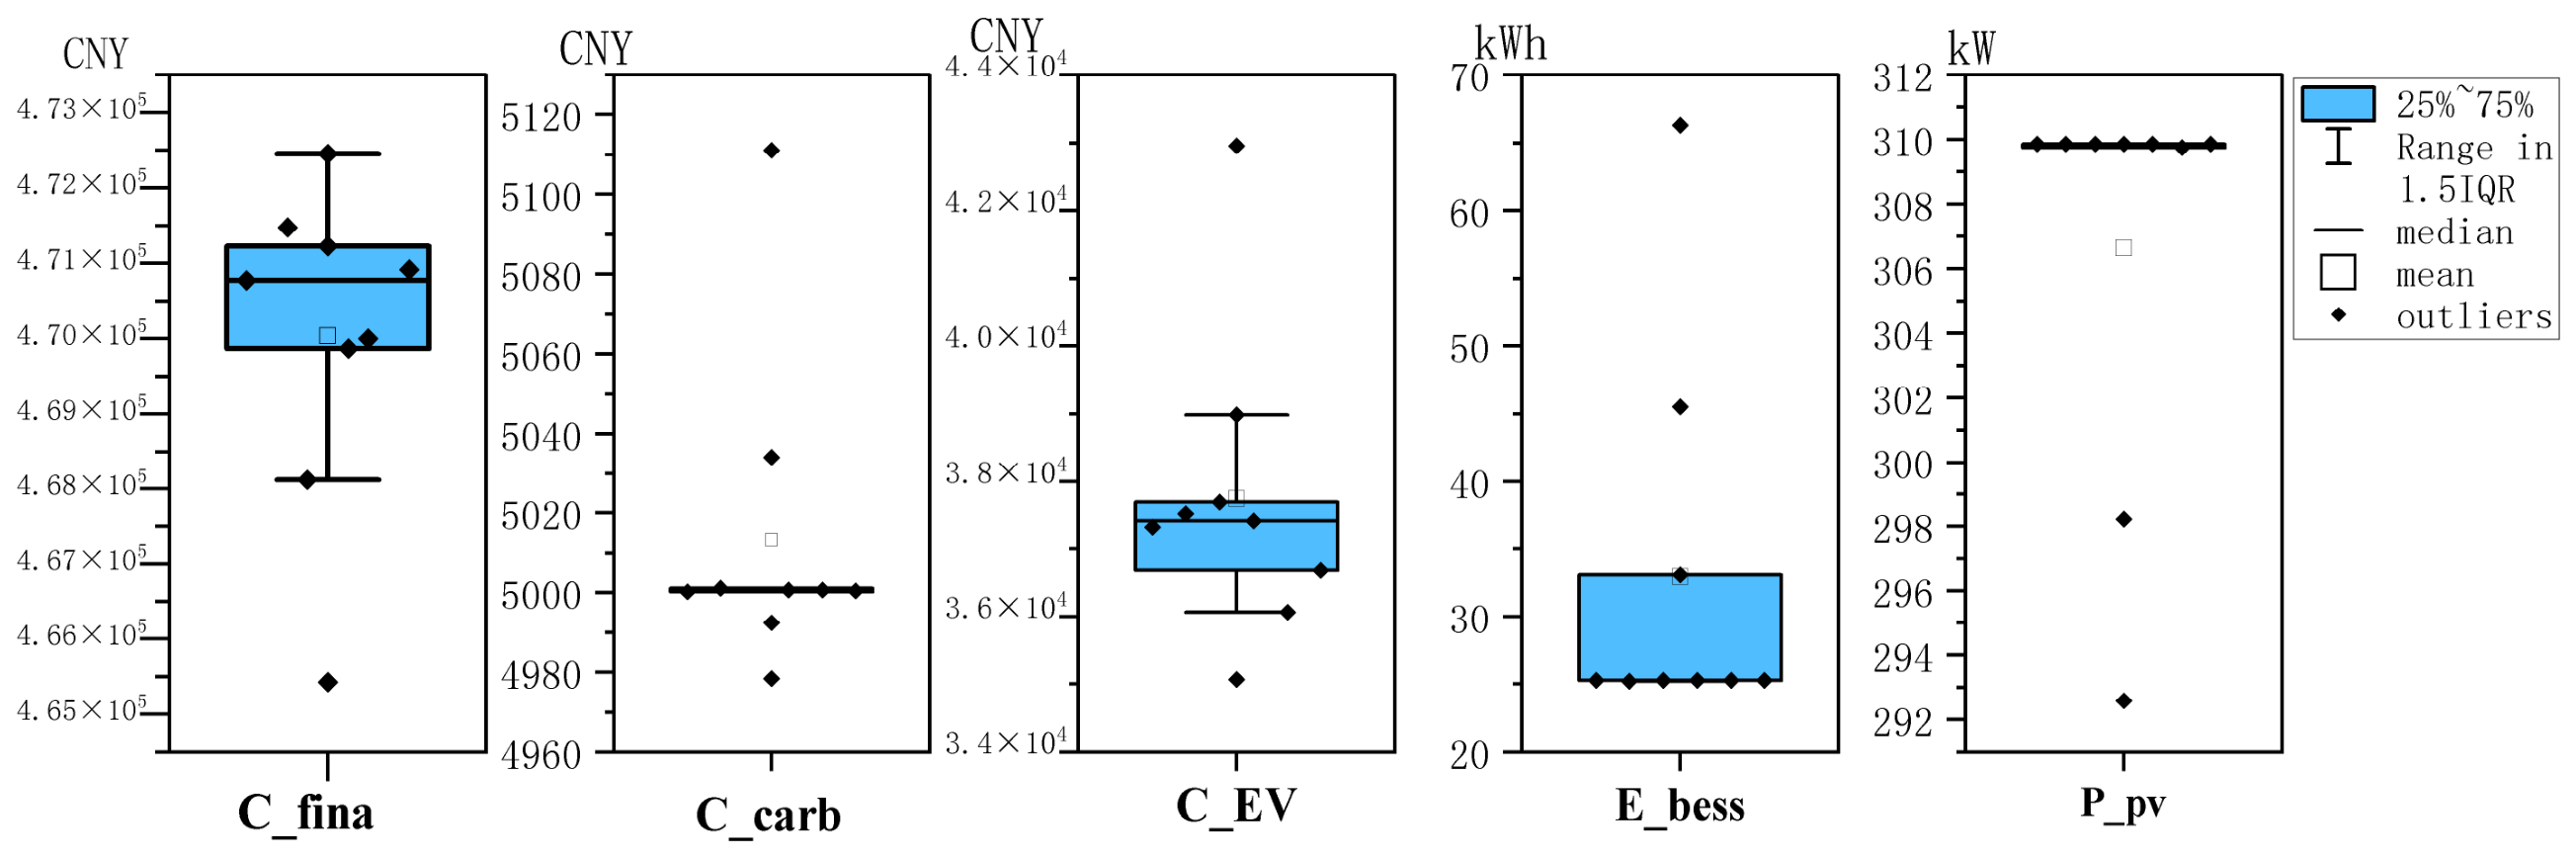
To further investigate the convergence performance, nine independent runs are conducted and statistically analyzed, as illustrated in Figure 15 and Figure 16. The average computation time of the model is about 7063 s. The carbon emission cost shows limited fluctuation. However, the building economic cost and EV charging cost exhibit greater variations across runs, which correspond to different allocations of the cooperative benefits under varying electricity prices. Nevertheless, the total cooperative benefits remain relatively stable. Energy storage and flexible EV charging provide partially substitutable temporal flexibility, which leads to greater variability in the optimized energy storage capacity across runs compared with PV capacity. The degree of variation and convergence degree of the charging price differ across time intervals, while its intra-day trend remains similar across independent runs, where low prices in the morning encourage EV charging, whereas high prices in the afternoon discourage EV charging. Overall, the adopted GA-based solution approach is effective in solving the established bi-level model.

4.3. Sensitivity Analysis

The optimal PV-storage capacity configuration in the building is influenced by multiple technical and economic parameters. To further verify the effectiveness of the proposed method under different parameter settings, this section conducts a sensitivity analysis on key parameters, including objective weighting coefficients, unit investment costs of distributed PV and energy storage systems, and PV curtailment penalty.
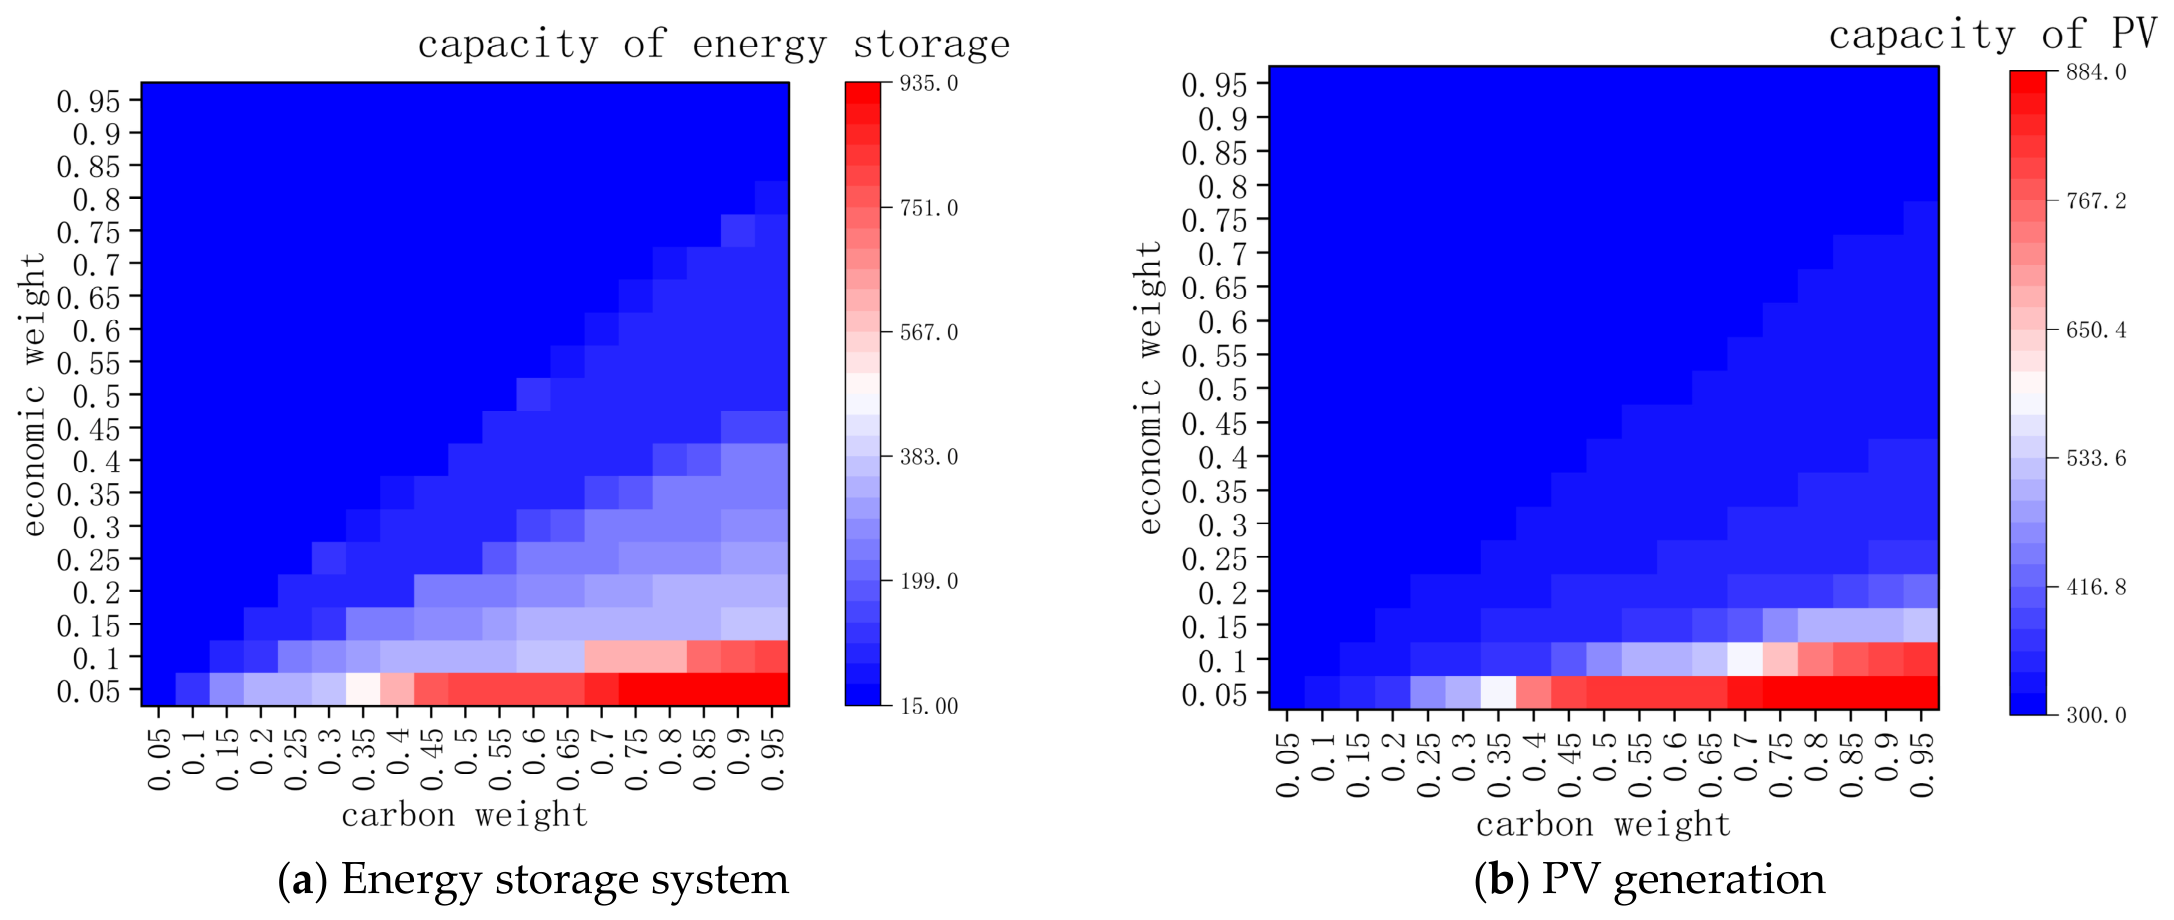
Figure 17a,b illustrate the variations in energy storage capacity and PV capacity under different combinations of economic and carbon objective weights, respectively. Since the economic cost objective and the carbon emission cost objective have been normalized in this study, and the two weights are allowed to vary independently in the model, this two-dimensional sensitivity analysis can reflect the influence of different decision-making preferences on system capacity configuration.
As shown in Figure 17a, the energy storage capacity is relatively sensitive to changes in objective weights. When the economic weight is high, the overall storage capacity remains low, indicating that greater emphasis on the economic objective limits the deployment of energy storage. When the economic weight is low and the carbon weight is high, the storage capacity increases significantly, suggesting that under a low-carbon-dominated scenario, the system tends to deploy more energy storage to improve PV accommodation, reduce PV curtailment, and decrease carbon emissions associated with grid electricity purchases.
As shown in Figure 17b, PV capacity exhibits a trend similar to that of energy storage capacity. When the economic weight is high, PV capacity remains low because of its investment cost. When the carbon weight is high and the economic weight is low, PV capacity increases markedly, indicating that PV, as the main low-carbon energy supply technology, becomes more favorable as greater emphasis is placed on the carbon objective.
Overall, Figure 17 shows that PV and energy storage capacity configurations have a synergistic relationship. In the region with low economic weight and high carbon weight, the system forms a “high PV capacity–high energy storage capacity” configuration pattern. In contrast, in the region with high economic weight, the optimal capacities of both types of equipment remain relatively low. This indicates that the proposed model can reasonably characterize the trade-off between economic performance and low-carbon performance and adjust the PV-storage capacity configuration in response to different objective preferences.
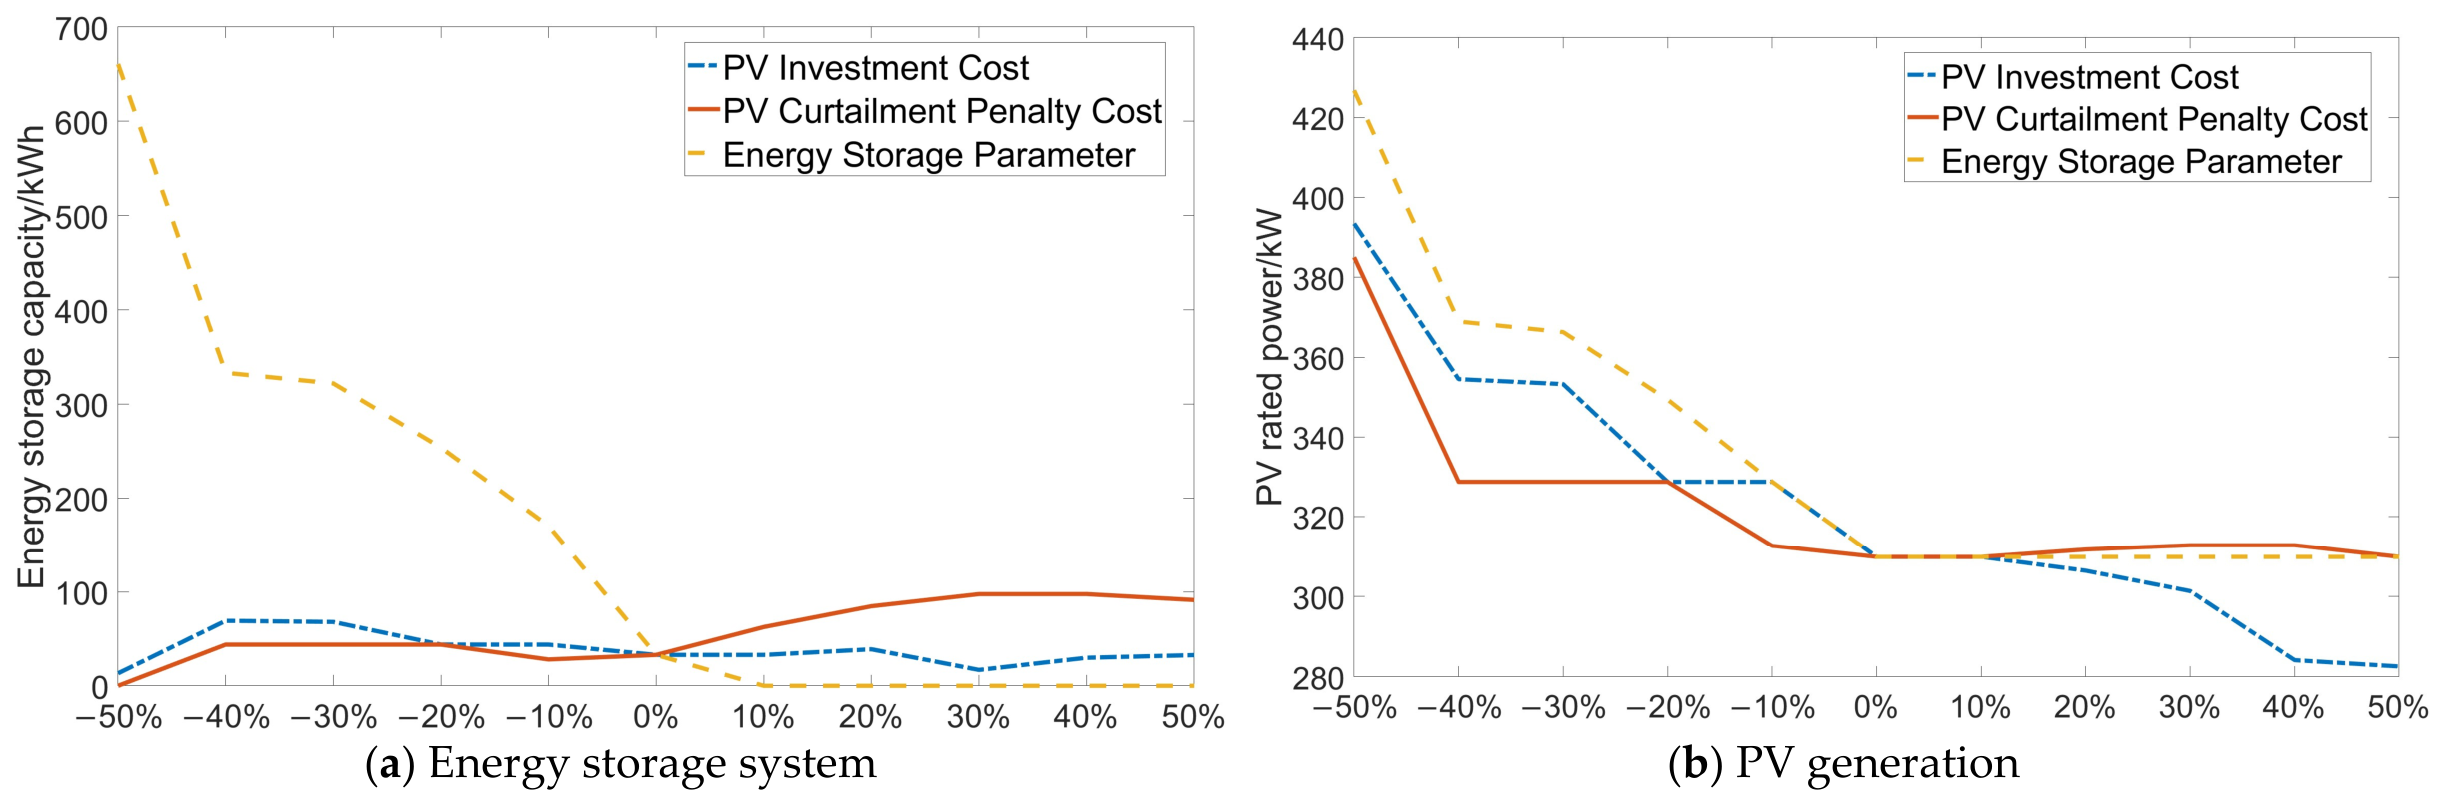
Figure 18a,b illustrate the impacts of variations in PV investment cost, PV curtailment penalty, and energy storage cost parameters on energy storage capacity and PV capacity, respectively. Overall, the capacities of both types of equipment exhibit systematic response patterns to changes in key parameters.
For energy storage capacity, the energy storage-related parameters have the greatest influence. When the storage-related parameters decrease, the optimal energy storage capacity increases substantially. As these parameters increase, the storage capacity declines rapidly and remains at a relatively low level when approaching the baseline value. This indicates that energy storage configuration is primarily influenced by its own investment and operating costs. Only when the cost of energy storage decreases does the system tend to deploy a larger storage capacity. Meanwhile, an increase in the PV curtailment penalty cost leads to a slight increase in energy storage capacity, suggesting that energy storage provides flexibility in improving PV accommodation and reducing PV curtailment.
For PV capacity, PV investment cost has the most direct influence. As the PV investment cost increases, the optimal PV capacity generally decreases, indicating that PV configuration is strongly influenced by the unit installation cost. When the energy storage-related parameters decrease, PV capacity also increases accordingly. This suggests that lower storage costs enhance the system’s ability to shift surplus PV generation across time and mitigate temporal mismatches between generation and load demand, thereby making a larger PV capacity economically more favorable. In contrast, the impact of PV curtailment penalty cost on PV capacity is relatively limited. This indicates that, under the current model constraints, the curtailment penalty mainly improves PV accommodation by affecting storage configuration and operational scheduling, rather than directly driving a substantial increase in PV capacity.
Overall, the sensitivity analysis results in Figure 18 demonstrate a clear coupled relationship between PV and energy storage capacity configuration. PV capacity is mainly affected by PV investment cost, while energy storage capacity is primarily influenced by storage-related parameters. At the same time, improved storage economics can enhance PV accommodation capability and thereby support a higher level of PV deployment. These results indicate that the proposed optimization model can effectively capture the trade-off among investment costs, PV curtailment costs, and operational flexibility capability in PV-storage systems.

5. Conclusions

This study focuses on low-carbon smart buildings and develops a multi-objective capacity optimization model for PV-energy storage considering the flexibility potential of orderly EV charging loads. The proposed model is formulated as a bi-level multi-objective optimization framework. The upper level represents the building operator, aiming to simultaneously minimize economic cost and carbon emission cost. The lower level represents EV users, who optimize their charging schedules in response to the charging prices set by the building operator with the objective of minimizing their individual charging costs. To solve the proposed model, an objective normalization and weighted-sum method is first developed to convert the bi-objective optimization problem into a single-objective formulation using a weighted-sum approach. Furthermore, a GA-based solution framework is proposed for the bi-level optimization model.
Case study results demonstrate the effectiveness of the proposed model and solution method. The results demonstrate that incorporating carbon emission reduction objectives into PV-storage capacity planning significantly reduces the building’s carbon emission level, highlighting the low-carbon operational characteristics and emission reduction potential of smart buildings under dual-carbon targets. Meanwhile, the flexible regulation potential of orderly EV charging effectively reduces the required capacity of the PV-storage system, thereby decreasing both the total economic cost and carbon-related cost of the building system, as well as reducing EV charging costs.
Overall, this study provides a theoretical foundation for the coordinated planning of PV-energy storage and EV resources in low-carbon buildings. Future work will extend the proposed framework to incorporate V2G operation and uncertainties in EV resources. In addition, the current study represents seasonal operation using four representative days and does not explicitly capture inter-day variability. Future research will investigate more advanced representative-day construction methods that account for both intra-day load profiles and inter-day variations, particularly under prolonged extreme weather conditions, to improve the temporal representation of capacity planning models.

Author Contributions

Conceptualization, W.Y., J.Y. and Y.W.; methodology, Y.Z., T.W., W.Y. and J.Y.; software, Y.Z.; validation, T.W.; formal analysis, T.W.; investigation, Y.Z. and L.L.; resources, J.Y.; data curation, Y.Z.; writing—original draft, Y.Z.; writing—review and editing, T.W., L.L., W.Y., J.Y. and Y.W.; visualization, T.W.; supervision, J.Y.; project administration, W.Y.; funding acquisition, W.Y. All authors have read and agreed to the published version of the manuscript.

Funding

This work was funded by the Basic Research Program of Jiangsu, China (BK20250608).

Data Availability Statement

All data generated or analyzed during this study are included in this paper and are available for open access.

Conflicts of Interest

The authors declare no conflicts of interest.

Nomenclature

Sets and Indices
nIndex of EVs.
dIndex of typical days.
tIndex of periods.
gIndices of power distribution grid.
chIndices of charging state.
disIndices of discharging state.
dpDisagreement point of the negotiation.
Parameters
π d The number of days corresponding to the d-th typical day.
N EV The total number of electric vehicles.
N cp The total number of installed charging piles.
D The total number of typical days
T The total number of periods in d.
η bess c The charging efficiencies of the storage system.
η bess d The discharging efficiencies of the storage system.
α The weighting coefficients of the carbon emission cost.
β The weighting coefficients of the economic cost.
μ EV , n , d , t The status of EV parked within the building charging area.
S O C EV , n , d exp The expected SOC of the n-th vehicle upon leaving the building on the d-th typical day.
S O C EV , n , d in The initial SOC of the n-th vehicle upon entering the building on the d-th typical day.
S O C EV , n , d max The maximum SOC of the n-th vehicle upon entering the building on the same day.
S O C bess min The minimum SOC limits of the energy storage system.
S O C bess max The maximum SOC limits of the energy storage system.
E bess , d , 0 The initial stored energy of the energy storage system in a scheduling period.
E bess , d , T The end stored energy of the energy storage system at time in a scheduling period.
P EV 0 The rated power of the charging pile.
c bess i n v The unit capacity investment cost of the energy storage system.
c pv i n v The unit power investment cost of the PV system.
c curt The curtailment penalty cost per unit of curtailed PV power.
c g , d , t The electricity price for grid power purchase at time interval t of the d-th typical day.
e carb The carbon emission cost coefficient associated with electricity purchased from the grid.
c bess o & m The unit power operation and maintenance cost of the energy storage system.
c pv o & m The unit power operation and maintenance cost of the PV system.
P pv 0 The capacity of existing PV generation in the building.
P l , d , t The electricity demand of the building at time interval t of the d-th typical day.
P ˜ pv , d , t The per-unit-capacity output of distributed PV generation at time interval t of the d-th typical day.
R min The minimum limits of the charging price for EV charging.
Variables
C carb The total carbon emission cost of the building.
C fina The total economic cost of the building.
C inv The investment cost of the PV-storage system.
C g The cost of electricity purchased from the grid.
C curt The cost of curtailed PV power.
C o & m The total operation and maintenance cost of the PV-storage system.
C EV The cost of EV charging, which is also the revenue of building from providing electricity to EV users.
E bess N The rated capacity of the configured energy storage system.
P pv N The rated power of the configured PV system.
P bess N The rated power of the configured energy storage system.
P g , d , t The power purchased from the grid by the building at time interval t of the d-th typical day
P EV , n , d , t The charging power of the n-th EV at time interval t on the d-th typical day.
P curt , d , t The curtailed PV power of the building at time interval t of the d-th typical day.
P bess , d , t c The charging power of the energy storage system at time interval t of the d-th typical day
P bess , d , t d The discharging power of the energy storage system at time interval t of the d-th typical day
E bess , d , t The stored energy of the energy storage system at time interval t.
R d , t EV The electricity price set by the building operator for EV charging.
Binary Variables
δ EV , n , d , t The charging status of EV n at time interval t on the d-th typical day.
u bess , d , t The charging/discharging state of the energy storage system at time interval t of the d-th typical day.

Appendix A

For the detailed parameter setting in GA, the initial population of size 20 is randomly generated within the feasible ranges defined by Constraint (23). At each generation, the fitness is evaluated as the Nash product defined above Equation (22). Infeasible individuals are penalized by adding a large penalty term (10 × 106) to the fitness value. A tournament selection strategy with a tournament size of 2 is used to select parents for the next generation. The crossover operation uses a two-point crossover function with a crossover fraction of 0.8, meaning that 80% of the offspring are produced by crossover and the remaining 20% by mutation. The mutation operation uses the ‘mutation adapt feasible function’ with a shrink rate of 0.1; this function adaptively reduces the mutation range as the population converges, while ensuring that mutated individuals remain within the feasible bounds. An elite count of 2 is employed to preserve the best solutions across generations. The optimization terminates when the average relative change in the fitness value over 20 consecutive generations falls below 10 × 10−6. This convergence tolerance is used instead of the term “optimality gap” to avoid confusion with the rigorous optimality gap defined in MILP solvers. At each GA iteration, the candidate charging price is passed to the lower level, where the EV model and building model are solved by Gurobi (version 13.0.0) with an optimality gap of 10 × 10−4. No random seed was explicitly set for the nine independent runs; the seeds were generated randomly by the system. The disagreement-point values are taken from Case III (presented below), i.e., { C fina dp , C carb dp , C EV dp }. The GA process is coded in MATLAB R2023b and implemented on a personal computer with 16 GB RAM.
Parameters about the physical boundary of the building are presented here as a reference for the results of PV-storage capacity planning. The building investigated in [28] has a PV installation area of 1952.3 m2, with a PV capacity of 360 kW and a battery storage capacity of 360 kWh.
The detailed formulas for calculating the PV capacity factor, which are implemented in the Renewables.ninja model, can be found in [40].

References

  1. International Renewable Energy Agency. Global Renewables Outlook: Energy Transformation 2050; International Renewable Energy Agency: Abu Dhabi, United Arab Emirates, 2020. [Google Scholar]
  2. China Association of Building Energy Efficiency; Chongqing University. Research Report on Carbon Emissions in China’s Urban-Rural Construction Sector (2025); China Association of Building Energy Efficiency: Beijing, China, 2026. [Google Scholar]
  3. National Development and Reform Commission; National Energy Administration. Notice on Deepening the Market-Oriented Reform of Grid-Connected Electricity Prices for New Energy and Promoting High-Quality Development of New Energy. 2025. Available online: https://www.gov.cn/zhengce/zhengceku/202502/content_7002959.htm (accessed on 11 October 2025).
  4. Parag, Y.; Sovacool, B.K. Electricity market design for the prosumer era. Nat. Energy 2016, 1, 16032. [Google Scholar] [CrossRef] [Scilit]
  5. Hatziargyriou, N.; Asano, H.; Iravani, R.; Marnay, C. Microgrids. In IEEE Power and Energy Magazine; IEEE: New York, NY, USA, 2007; Volume 5, pp. 78–94. [Google Scholar] [CrossRef] [Scilit]
  6. The Communist Party of China Central Committee; The State Council. Working Guidance for Carbon Dioxide Peaking and Carbon Neutrality in Full and Faithful Implementation of the New Development Philosophy. 2021. Available online: http://www.gov.cn/zhengce/2021-09/22/content_5636011.htm (accessed on 11 October 2025).
  7. The Communist Party of China Central Committee; The State Council. Action Plan for Carbon Dioxide Peaking Before 2030. 2021. Available online: http://www.gov.cn/zhengce/content/2021-10/24/content_5644613.htm (accessed on 11 October 2025).
  8. Guo, W.Y.; Xu, Z.B.; Liu, J.H. Optimal coordination of zero carbon building energy systems. Natl. Sci. Open 2024, 3, 20240004. [Google Scholar] [CrossRef] [Scilit]
  9. Fan, G.Y.; Gong, D.X.; Guo, J.C. Optimization design and performance analysis of the energy system combining electricity, hydrogen and heat storage for near-zero energy communities in China. J. Energy Storage 2026, 152, 120536. [Google Scholar] [CrossRef] [Scilit]
  10. Sameti, M.; Haghighat, F. Integration of distributed energy storage into net-zero energy district systems: Optimum design and operation. Energy 2018, 153, 575–591. [Google Scholar] [CrossRef] [Scilit]
  11. Ceran, B.; Jurasz, J.; Mielcarek, A.; Campana, P.E. PV systems integrated with commercial buildings for local and national peak load shaving in Poland. J. Clean. Prod. 2021, 322, 129076. [Google Scholar] [CrossRef] [Scilit]
  12. Zhang, L.; Feng, G.; Huang, K.; Bi, Y.; Chang, S.; Li, A. Design and optimization for photovoltaic heat pump system integrating thermal energy storage and battery energy storage. Energy Build. 2025, 329, 115277. [Google Scholar] [CrossRef] [Scilit]
  13. Chen, Q.; Kuang, Z.; Liu, X.; Zhang, T. Optimal sizing and techno-economic analysis of the hybrid PV-battery-cooling storage system for commercial buildings in China. Appl. Energy 2024, 355, 122231. [Google Scholar] [CrossRef] [Scilit]
  14. Hanna, R.; Kleissl, J.; Braff, W. Energy dispatch schedule optimization for demand charge reduction using a photovoltaic-battery storage system with solar forecasting. Sol. Energy 2014, 103, 269–287. [Google Scholar] [CrossRef] [Scilit]
  15. Nottrott, A.; Kleissl, J.; Washom, B. Energy dispatch schedule optimization and cost benefit analysis for grid-connected, photovoltaic-battery storage systems. Renew. Energy 2013, 55, 230–240. [Google Scholar] [CrossRef] [Scilit]
  16. Quoilin, S.; Kavvadias, K.; Mercier, A.; Pappone, I.; Zucker, A. Quantifying self-consumption linked to solar home battery systems: Statistical analysis and economic assessment. Appl. Energy 2016, 182, 58–67. [Google Scholar] [CrossRef] [Scilit]
  17. Zhao, G.; Clarke, J.; Searle, J.; Lewis, R.; Baker, J. Economic analysis of integrating photovoltaics and battery energy storage system in an office building. Energy Build. 2023, 284, 112885. [Google Scholar] [CrossRef] [Scilit]
  18. Talent, O.; Du, H. Optimal sizing and energy scheduling of photovoltaic-battery systems under different tariff structures. Renew. Energy 2018, 129, 1013–1026. [Google Scholar] [CrossRef] [Scilit]
  19. Khalilpour, K.R.; Vassallo, A.M. Planning and operation scheduling of PV-battery systems: A novel methodology. Renew. Sustain. Energy Rev. 2016, 53, 194–208. [Google Scholar] [CrossRef] [Scilit]
  20. Fachrizal, R.; Munkhammar, J. Improved photovoltaic self-consumption in residential buildings with distributed and centralized smart charging of electric vehicles. Energies 2020, 13, 1153. [Google Scholar] [CrossRef] [Scilit]
  21. Zhao, X.; Hu, H.; Yuan, H.; Chu, X. How does adoption of electric vehicles reduce carbon emissions? Evidence from China. Heliyon 2023, 9, e20296. [Google Scholar] [CrossRef] [Scilit] [PubMed]
  22. Kim, S.; Lim, H. Reinforcement learning based energy management algorithm for smart energy buildings. Energies 2018, 11, 2010. [Google Scholar] [CrossRef] [Scilit]
  23. Honarmand, M.; Zakariazadeh, A.; Jadid, S. Optimal scheduling of electric vehicles in an intelligent parking lot considering vehicle-to-grid concept and battery condition. Energy 2014, 65, 572–579. [Google Scholar] [CrossRef] [Scilit]
  24. Yan, Q.; Zhang, B.; Kezunovic, M. Optimized operational cost reduction for an EV charging station integrated with battery energy storage and PV generation. IEEE Trans. Smart Grid 2019, 10, 2096–2106. [Google Scholar] [CrossRef] [Scilit]
  25. Liu, J.; Wu, H.; Huang, H.; Yang, H. Renewable energy design and optimization for a net-zero energy building integrating electric vehicles and battery storage considering grid flexibility. Energy Convers. Manag. 2023, 298, 117768. [Google Scholar] [CrossRef] [Scilit]
  26. Sepúlveda-Mora, S.B.; Hegedus, S. Making the case for time-of-use electric rates to boost the value of battery storage in commercial buildings with grid connected PV systems. Energy 2021, 218, 119447. [Google Scholar] [CrossRef] [Scilit]
  27. Chen, J.; Qing, J.; Cai, Q. Impact of bi-directional electric vehicle and demand response on residential distributed PV capacity planning based on TOU pricing. J. Environ. Manag. 2024, 356, 120689. [Google Scholar] [CrossRef] [Scilit] [PubMed]
  28. Bai, Y.; Zhang, W.; Hu, X. A collaborative matching method for multi-energy supply systems in office buildings considering the random characteristics of electric vehicles. Energy Build. 2024, 303, 113809. [Google Scholar] [CrossRef] [Scilit]
  29. Visaria, A.A.; Jensen, A.F.; Thorhauge, M.; Mabit, S.E. User preferences for EV charging, pricing schemes, and charging infrastructure. Transp. Res. Part A Policy Pract. 2022, 165, 120–143. [Google Scholar] [CrossRef] [Scilit]
  30. Zhai, J.; Shen, G.; Li, C.; Liu, H. Fuzzy chance-constrained day-ahead operation of multi-building integrated energy systems: A bi-level mixed game approach. Buildings 2025, 15, 2441. [Google Scholar] [CrossRef] [Scilit]
  31. Che, P.; Zhang, C.; Liu, Y.; Zhang, Y. An integrated learning and optimization approach to optimal dynamic retail electricity pricing of residential and industrial consumers. Appl. Energy 2025, 382, 125234. [Google Scholar] [CrossRef] [Scilit]
  32. He, W.; Guo, L.; Yang, W.; Lin, X.; Wei, F.; Dawoud, S.M. Co-optimization strategy of island distribution grid and time-of-use pricing considering the time response characteristics of multiple interruptible loads. IEEE Access 2024, 12, 89647–89659. [Google Scholar] [CrossRef] [Scilit]
  33. Abdollahi, A.; Khava, S.C. Enhancing the flexibility of decentralized energy resources through bi-level optimization in intra-day regional markets. Renew. Energy Focus 2026, 56, 100778. [Google Scholar] [CrossRef] [Scilit]
  34. Borhani, A.; Ouadi, H. Multi-objective optimal sizing of EV charging stations and PV systems in residential buildings. Energy Storage Sav. 2026, 5, 100141. [Google Scholar] [CrossRef] [Scilit]
  35. Chen, X.; Liu, Z.; Wang, P.; Li, B.; Liu, R.; Zhang, L.; Zhao, C.; Luo, S. Multi-objective optimization of battery capacity of grid-connected PV-BESS system in hybrid building energy sharing community considering time-of-use tariff. Appl. Energy 2023, 350, 121727. [Google Scholar] [CrossRef] [Scilit]
  36. Nosratabadi, S.M.; Peivand, A.; Saadat, A. Intelligent parking lot power management: Augmented epsilon-constraint concept with correlation analysis. IET Renew. Power Gener. 2024, 18, 3378–3404. [Google Scholar] [CrossRef] [Scilit]
  37. Cai, Q.; Qing, J.; Xu, Q.; Zhong, C.; Xue, M.M.; Liang, Q.M. Incremental techno-economic benefits of interregional generation-grid-load-storage coordination in China’s power system decarbonization: A long-term evolutionary and provincial heterogeneity analysis. Energy Policy 2026, 209, 114995. [Google Scholar] [CrossRef] [Scilit]
  38. Wu, H.; Kan, X. Hourly Electric Power Load and Transmission Data at the Provincial Level in China [DS]; Zenodo: Geneva, Switzerland, 2023; Available online: https://zenodo.org/records/8322210 (accessed on 15 February 2026).
  39. Pfenninger, S.; Staffell, I. Renewables.ninja. 2016. Available online: https://www.renewables.ninja (accessed on 15 February 2026).
  40. Pfenninger, S.; Staffell, I. Long-term patterns of European PV output using 30 years of validated hourly reanalysis and satellite data. Energy 2016, 114, 1251–1265. [Google Scholar] [CrossRef] [Scilit]
Figure 1. Framework and energy and information flow in the building system.
Buildings 16 03743 g001
Figure 2. Framework of the GA-based solution approach.
Buildings 16 03743 g002
Figure 3. Diagram of sampled arrival SOC parameters for EVs.
Buildings 16 03743 g003
Figure 4. Load profiles on representative days.
Buildings 16 03743 g004
Figure 5. Per-unit PV power output profiles.
Buildings 16 03743 g005
Figure 6. Time-of-use electricity price profile.
Buildings 16 03743 g006
Figure 7. Costs of EVs for charging.
Buildings 16 03743 g007
Figure 8. Energy balance with orderly EV charging.
Buildings 16 03743 g008
Figure 9. Energy balance without orderly EV charging.
Buildings 16 03743 g009
Figure 10. PV power curtailment with orderly EV charging.
Buildings 16 03743 g010
Figure 11. Energy storage operation results with orderly EV charging.
Buildings 16 03743 g011
Figure 12. EV charging profiles.
Buildings 16 03743 g012
Figure 13. The charging prices for EV charging.
Buildings 16 03743 g013
Figure 14. The iteration process.
Buildings 16 03743 g014
Figure 15. Statistical diagram for independent optimization results (cost and capacity).
Buildings 16 03743 g015
Figure 16. Statistical diagram for independent optimization results (charging price R d , t EV ).
Buildings 16 03743 g016
Figure 17. Configuration results under different weight settings.
Buildings 16 03743 g017
Figure 18. Configuration results under different investment parameters.
Buildings 16 03743 g018
Table 1. Case settings.
CaseEnergy Storage + PV GenerationElectric Vehicles (with Optimized R d , t EV )Economic ObjectiveCarbon Emission Objective
I
II×
III×
IV××
V××
VI××
Note: √ indicates that the factor is considered, while × indicates that the factor is not considered.
Table 2. PV-storage configuration results under different cases.
CaseEnergy Storage Capacity (kWh)Energy Storage Power (kW)PV Capacity (kW)
I32.8888.222309.869
II16.9224.231301.349
III175.73943.935286.980
IV19.9444.986254.209
V4075.1461018.789164,225
Table 3. Building costs and their components under different cases.
CaseCosts (104 CNY)
C inv C o & m C g C curt C fina C carb C EV  *
I10.5621.26138.0410.99446.5430.4974.315
II9.6641.19039.0270.92046.5060.5034.295
III15.5331.51835.6410.41647.5940.5095.514
IV8.3771.01841.1290.52645.5360.5395.514
V5062.764636.32705166.32210,859.89905.514
VI0058.578053.0640.6315.514
* Note: The value for CEV represents the buildings’ revenue from EV charging.
Disclaimer/Publisher’s Note: The statements, opinions and data contained in all publications are solely those of the individual author(s) and contributor(s) and not of MDPI and/or the editor(s). MDPI and/or the editor(s) disclaim responsibility for any injury to people or property resulting from any ideas, methods, instructions or products referred to in the content.