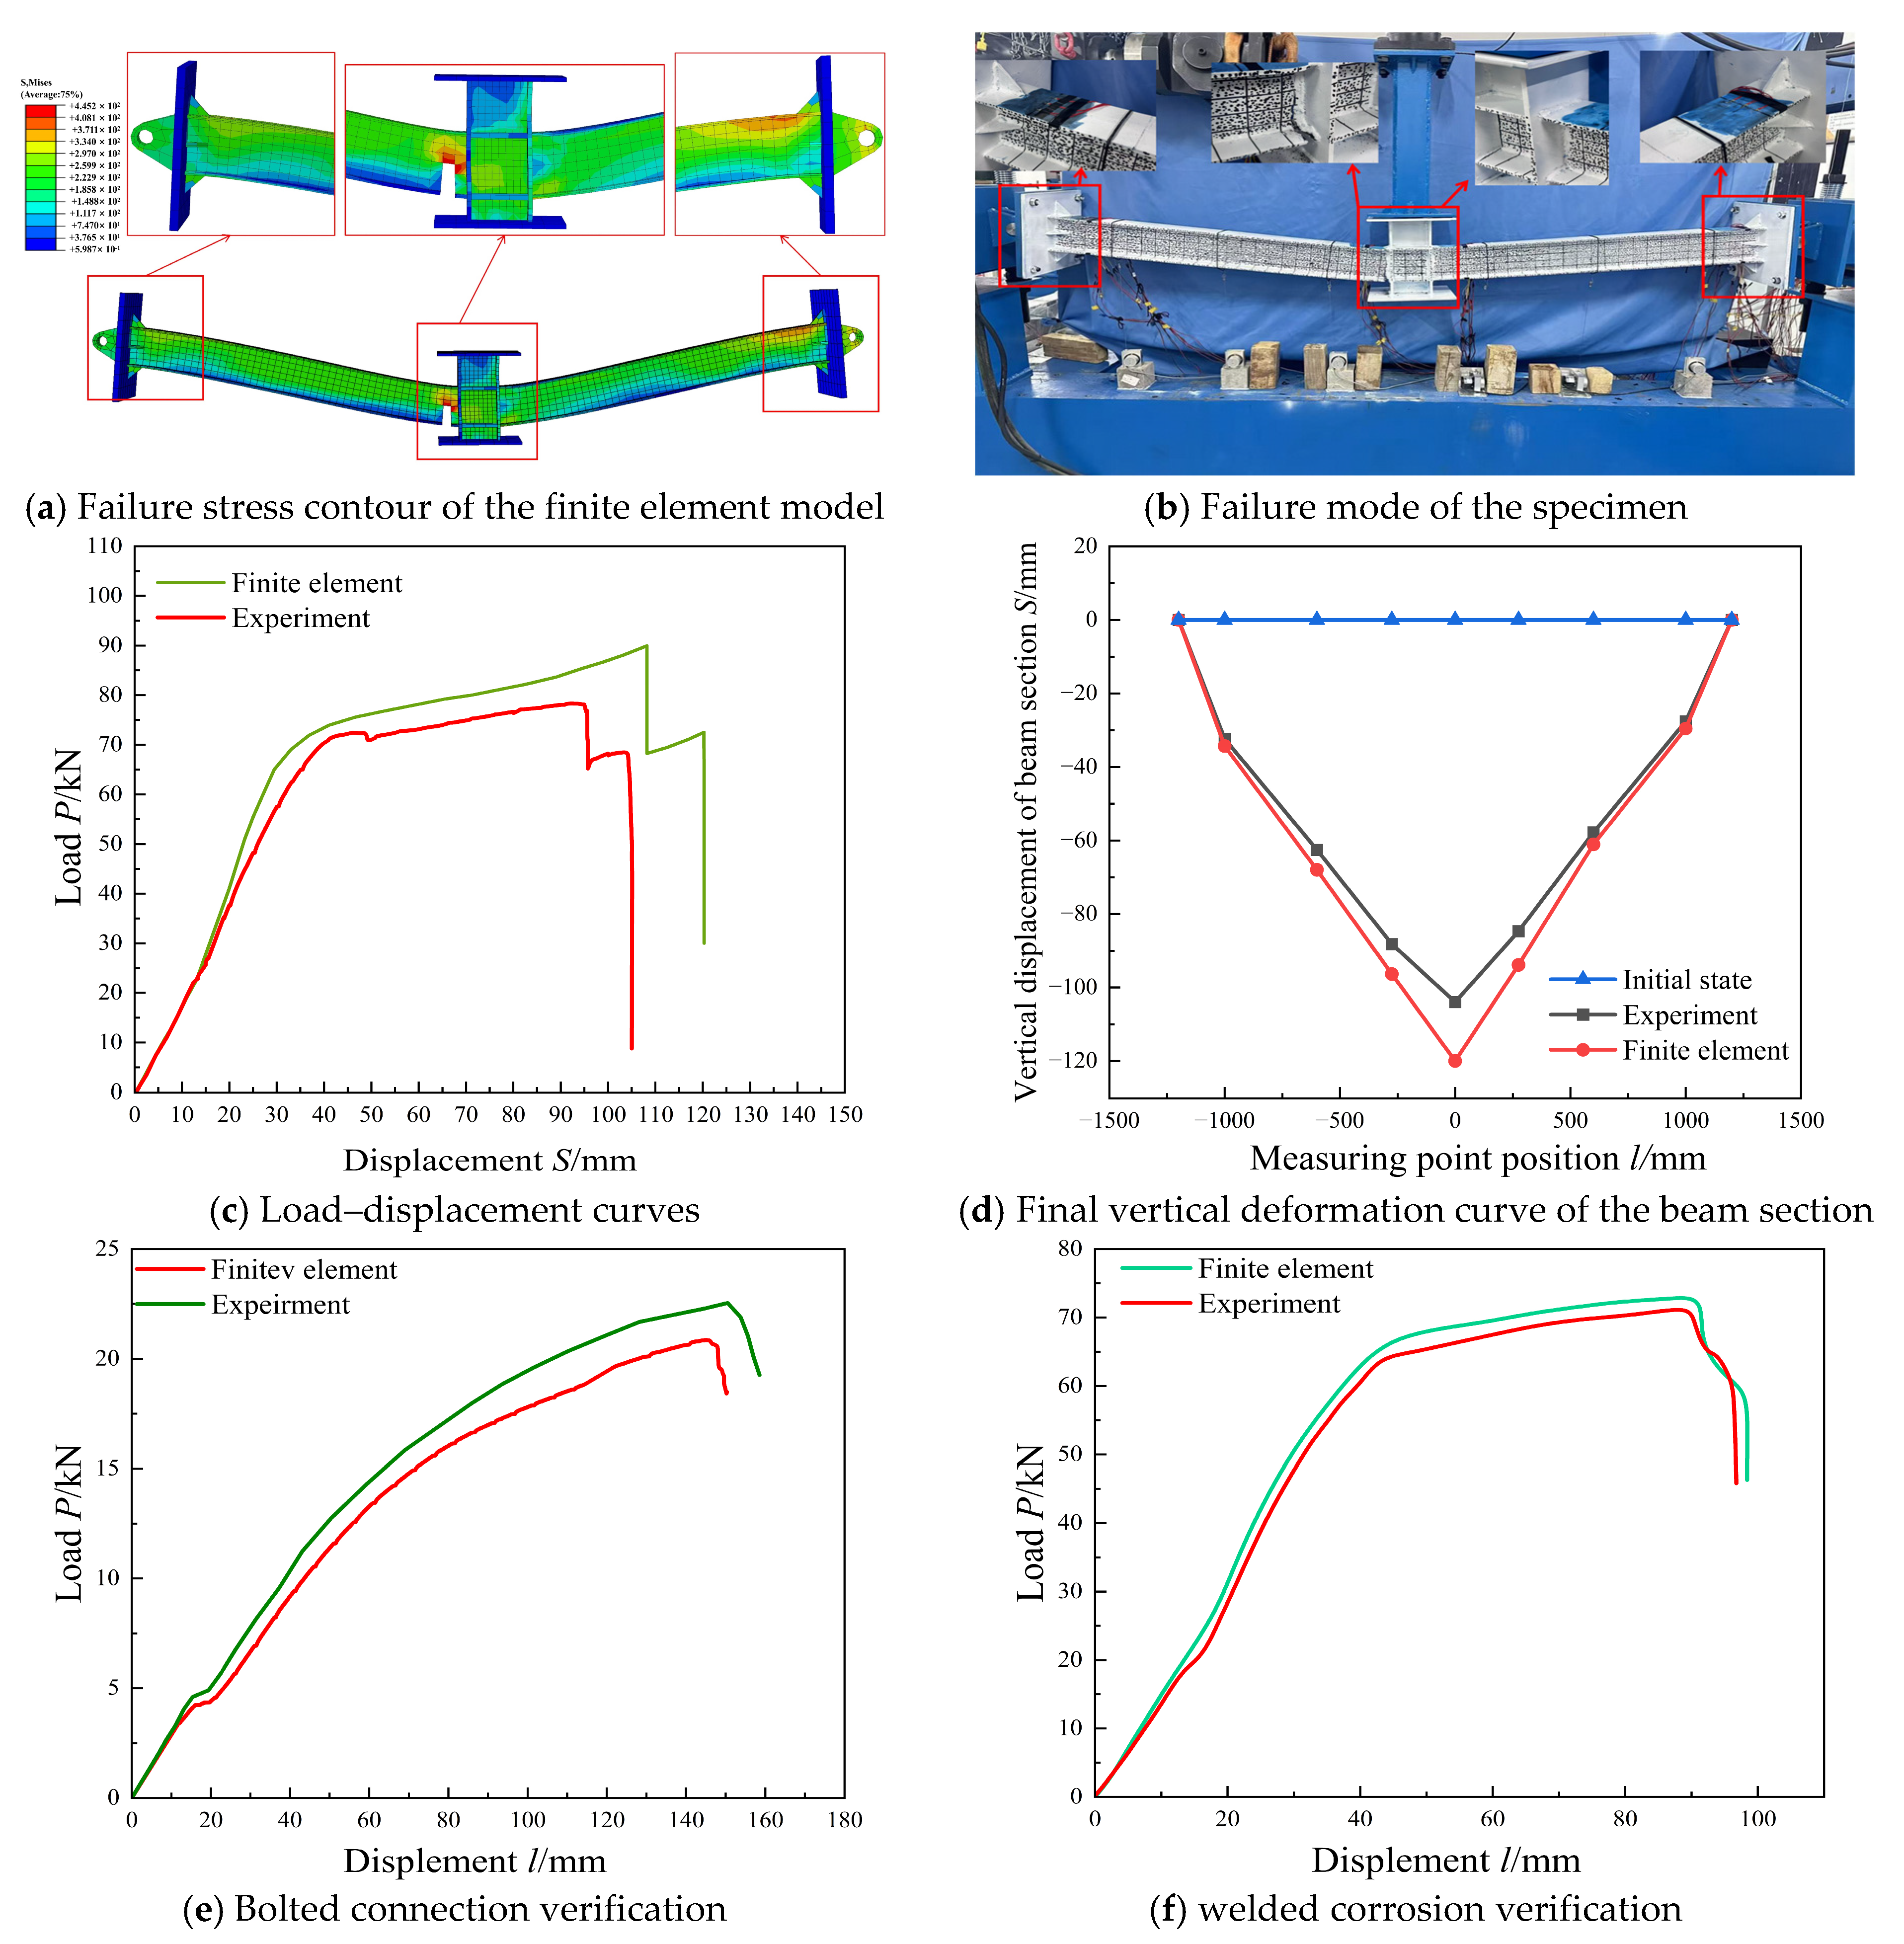
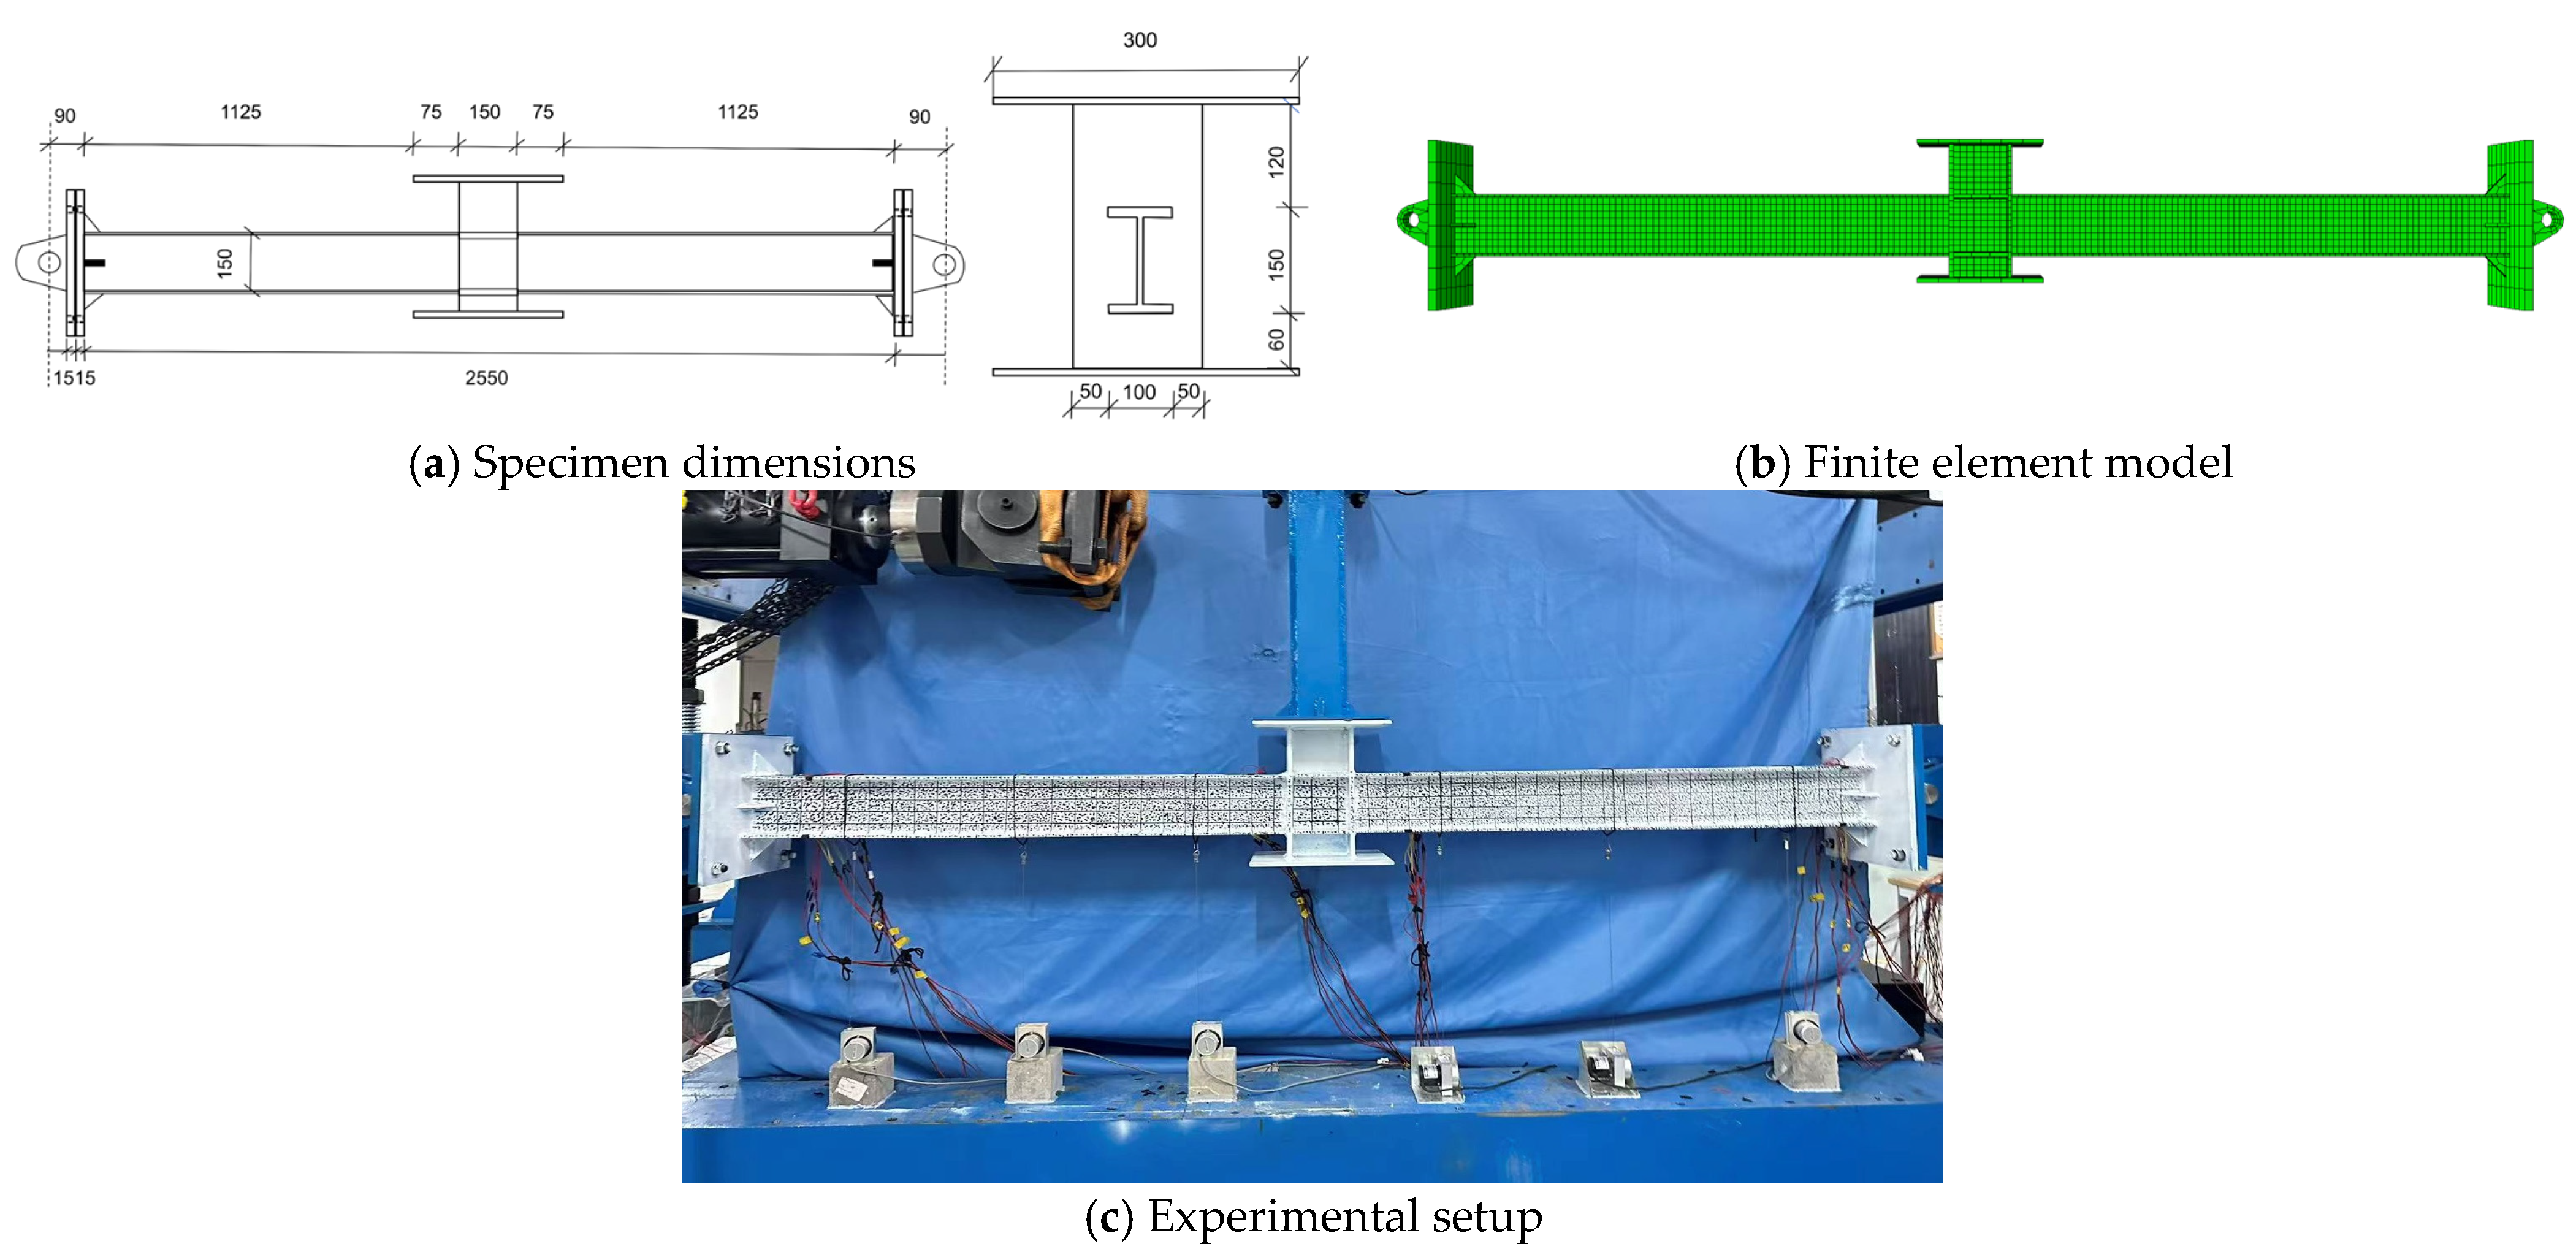
1. Introduction
Progressive collapse refers to a chain reaction initiated by the failure of a local structural component, which can result in disproportionate and catastrophic structural damage. Owing to the high strength, efficient constructability, and favorable seismic performance, steel frame structures are widely used in high-rise buildings and industrial facilities. Nevertheless, when deployed in marine or industrial environments, such structures are susceptible to long-term corrosion. This corrosion causes section loss and material deterioration, greatly reducing the load-bearing capacity and stiffness of both members and joints [
1,
2,
3,
4,
5]. Joints are critical load-transfer components. Corrosion-induced damage at joints can disrupt force transmission paths, reduce structural redundancy, and substantially increase the risk of progressive collapse [
6,
7,
8]. However, systematic investigations into the coupled influence of corrosion and beam–column connection characteristics on the progressive collapse resistance of steel structures remain limited. Connection configurations with different rotational stiffness characteristics can exhibit distinct load-transfer paths, deformation capacities, and failure mechanisms, and these differences may evolve as corrosion-induced deterioration progresses. A comparative assessment of such connection configurations under different corrosion levels is therefore essential for improving structural performance evaluation, connection selection, and collapse-resistant design in corrosive environments.
Existing research has mainly concentrated on how different connection types and detailing characteristics affect progressive collapse resistance. Studies [
9,
10,
11] show that the configuration of beam–column connections in steel frames plays a key role in the catenary action used to resist progressive collapse. Building on this characteristic, these studies analyzed the roles and mechanical behavior of beams and columns during collapse and assessed the effects of key parameters [
12,
13]. Subsequent work [
14,
15,
16,
17] developed refined finite element models of steel frame joints and conducted numerical simulations to characterize nonlinear connection behavior and mechanical characteristics of joints. Furthermore, researchers verified the results of theoretical analyses and numerical simulations through designed experiments [
18,
19,
20], which further confirmed the reliability and accuracy of the proposed theoretical models and numerical simulation methods. Yang et al. [
21] clarified the influence of semi-rigid and pinned connections on progressive collapse resistance through experiments and finite element analyses. Rong et al. [
22] experimentally investigated the effects of joint tensile-bending performance and rotational capacity on structural collapse resistance. Tan et al. [
23] applied a component-based modeling approach to analyze the nonlinear behavior of bolted–welded joints and to build numerical models for progressive collapse analysis of beam–column substructures. Wang et al. [
24] experimentally and numerically investigated the net-section failure of staggered bolted connections and evaluated the effects of key geometric parameters on their tensile resistance. Qiao et al. [
25] combined numerical simulations with experiments to investigate the mechanical response and failure modes of steel structures under extreme loading, providing key theoretical insights for enhancing structural safety and reliability. However, research on the progressive collapse resistance of steel frames has predominantly focused on either intact structures or a single connection configuration. Few studies have conducted comparative analyses across steel frames with varying stiffness levels.
Corrosion-induced degradation of structural durability [
26,
27,
28,
29] has become a major focus of research. The mechanical properties of corroded steel materials have been extensively investigated, as corrosion of steel structures becomes increasingly serious. Correlations between corrosion mass loss and steel mechanical properties have been established by researchers [
30,
31,
32,
33]. In addition, a substantial number of experimental studies have focused specifically on corroded frame structures [
34,
35]. Accelerated corrosion tests under simulated coastal atmospheric conditions were carried out by Zheng et al. [
36] on steel frame columns and steel specimens with varying thicknesses. A marked reduction in ultimate load-bearing and energy dissipation capabilities was observed with increased corrosion, along with substantial degradation in strength and stiffness, according to their findings. Ye et al. [
37] proposed a simplified method for mechanical degradation of pitting-corroded steel members by introducing an equivalent elastic modulus. Zhang et al. [
38] conducted quasi-static tests on corroded steel frame columns to assess the effects of corrosion degree and axial compression ratio on failure mode, load-bearing capacity, deformation capacity, and energy dissipation capacity. They further developed service-life prediction models for corroded steel frames using reliability theory and stochastic-process methods. Garbatov et al. [
39] tested materials extracted from naturally corroded box girders and derived regression equations linking corrosion degree to material properties. Karagh et al. [
40] simulated corrosion by artificial section reduction and studied the residual load-bearing capacity of 13 H-shaped short columns at different corrosion levels; they revealed that corrosion damage has a significant effect on the load-bearing capacity of steel columns. It can be seen that in practical engineering, the mechanical properties and bearing capacity of steel frame columns will decrease with the intensification of corrosion. More recently, Qin et al. [
41] and Zhang and Lou [
42] investigated the effects of connection rotational stiffness and corrosion, respectively, on the structural response of steel beam–column systems, further highlighting the importance of these two factors in structural performance.
Most studies on the coupled influence of connection stiffness and corrosion remain insufficiently investigated. In practice, corrosion progressively reduces the effective load-bearing cross-sectional area and degrades joint reliability. The roles of joints with different stiffness in resisting progressive collapse may change significantly as corrosion advances. Clarifying this evolution is critical for optimizing collapse-resistant design of corroded steel frames. Moreover, dynamic effects substantially influence progressive collapse and should be represented by measurable indicators to address the limitations of static testing.
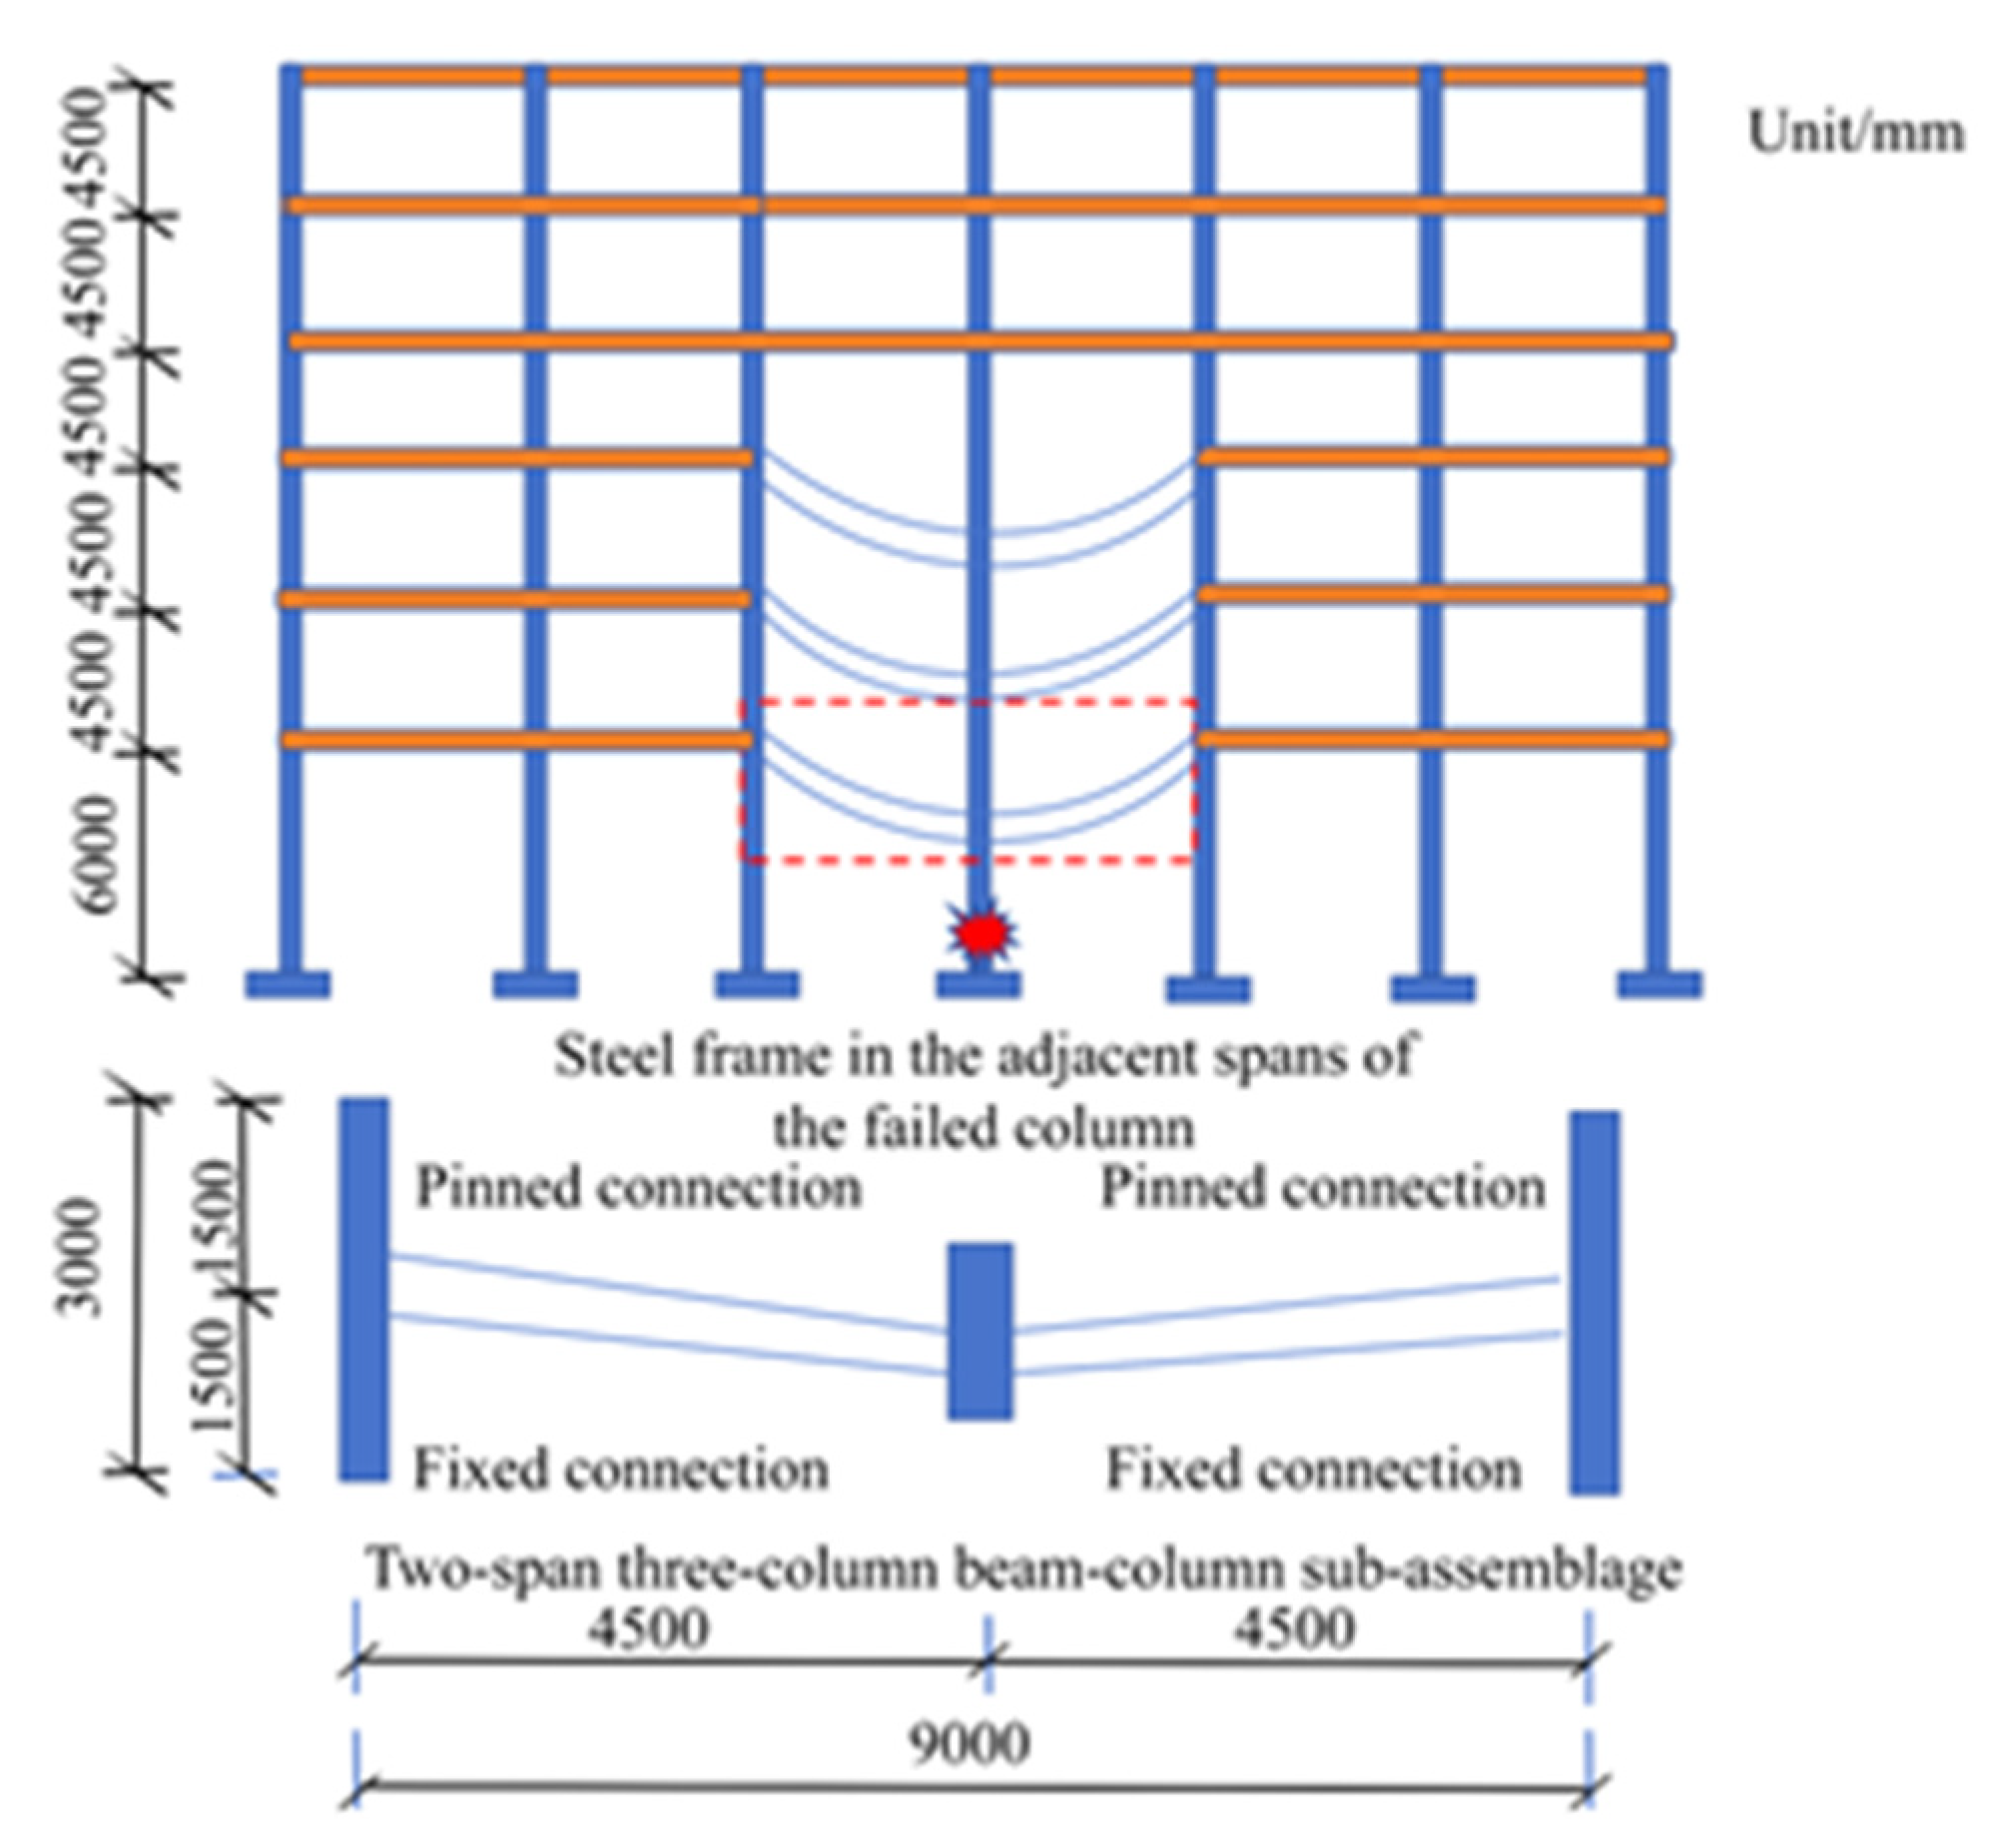
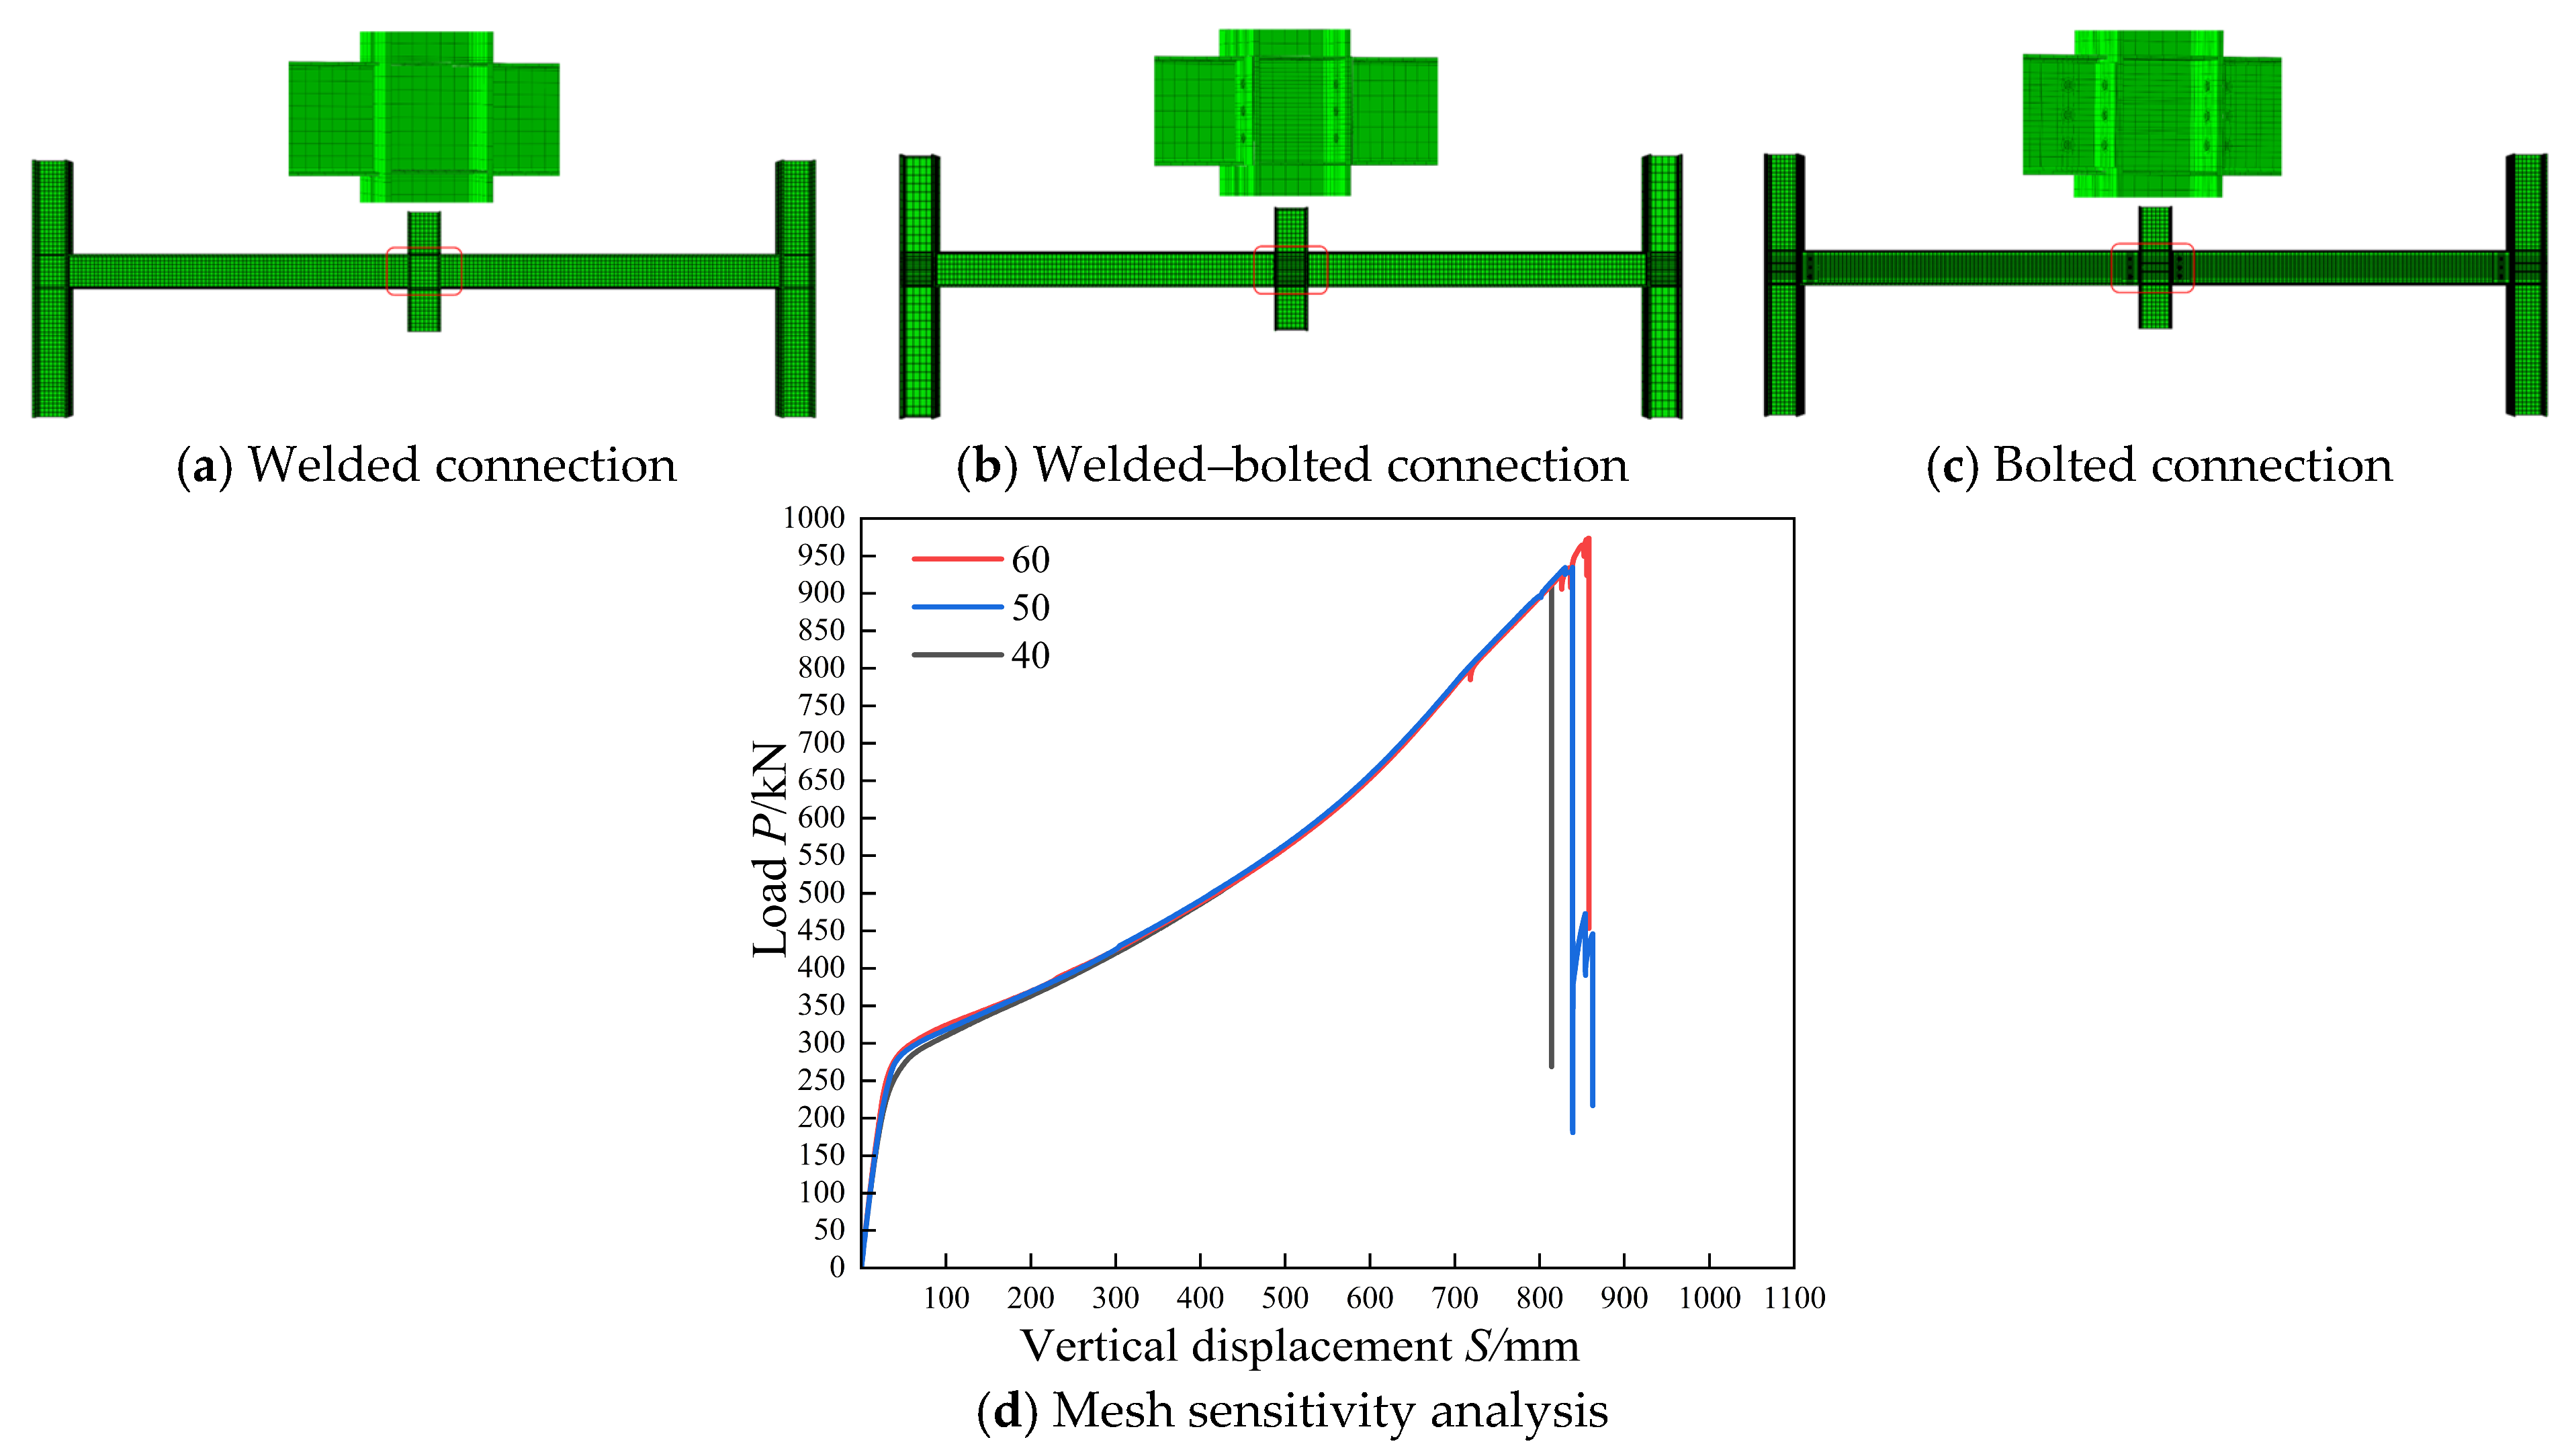
A representative steel frame structure was selected as the research object. Three connection types with different stiffness, including welded connection, bolted connection and welded–bolted connection, were adopted to represent typical connection forms commonly used in steel structures. Five prescribed corrosion levels of 0%, 5%, 10%, 15%, and 20% were considered to reproduce the typical atmospheric corrosion behavior. Damage mechanisms and failure criteria of corroded steel frames with different connection stiffness were systematically investigated. The findings aim to provide theoretical references and technical guidance for collapse-resistant design and evaluation in engineering practice.
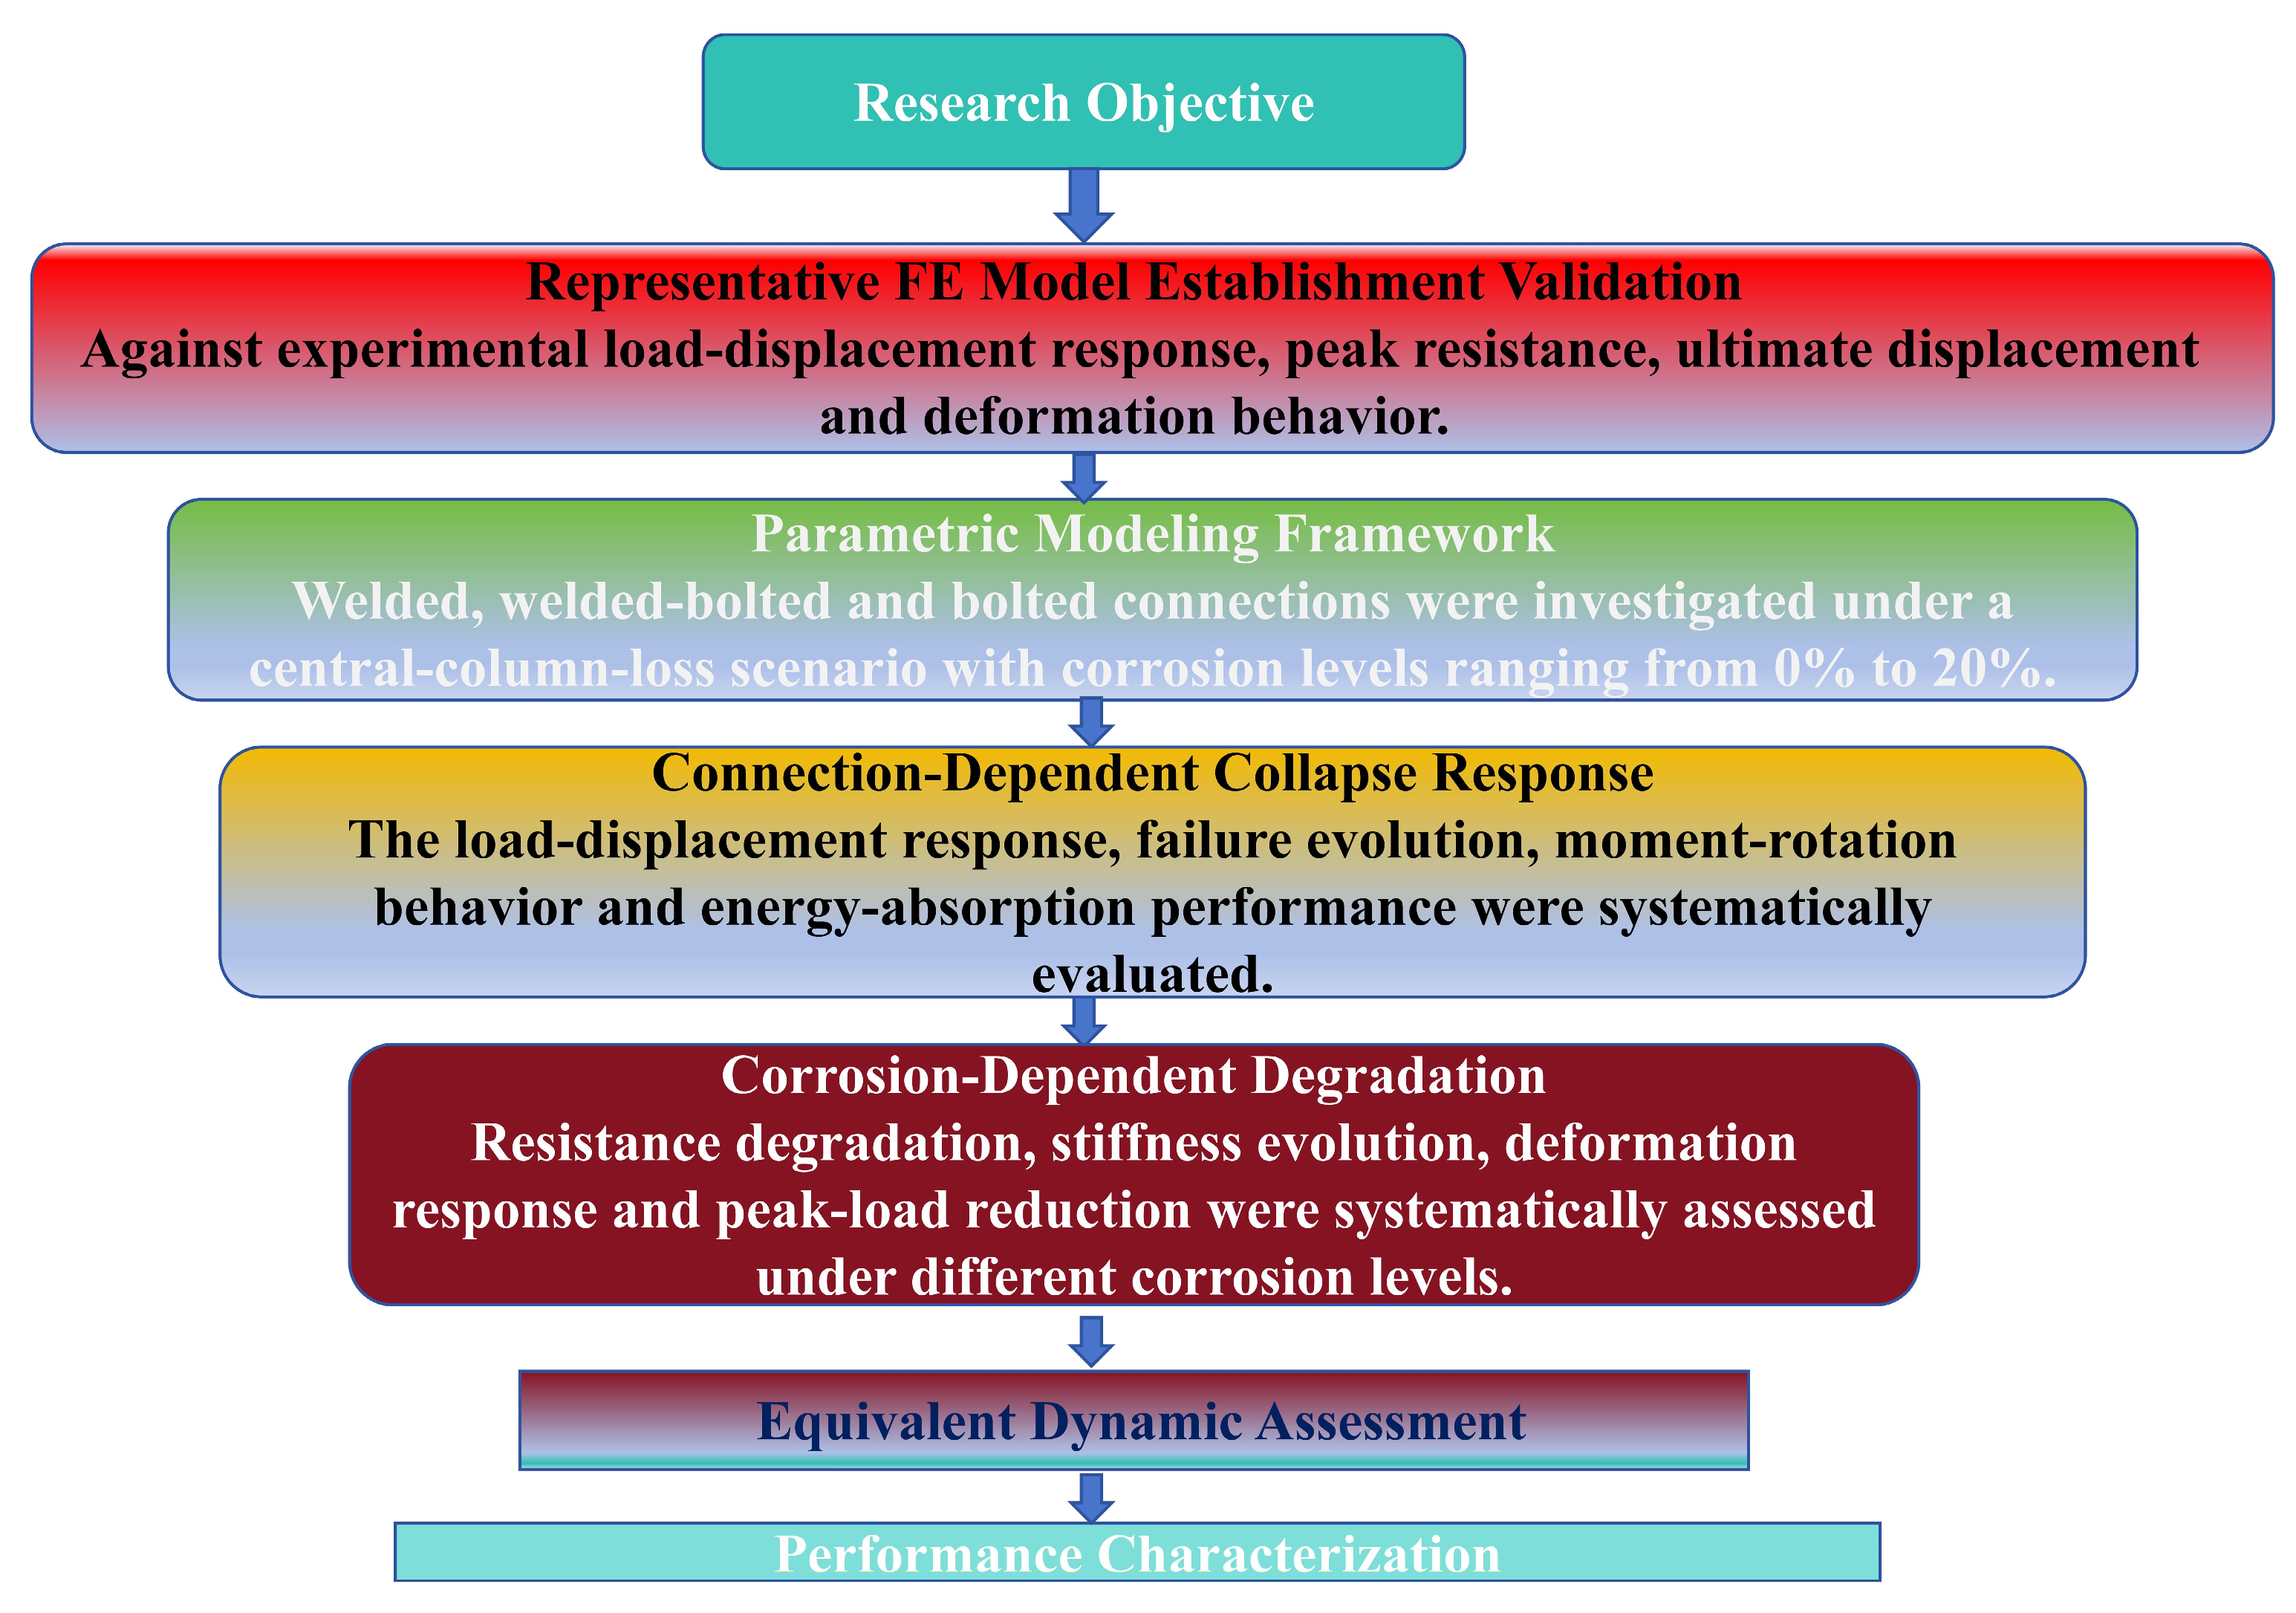
The overall research framework of this study is illustrated in
Figure 1.
The present study focuses on planar substructures with three representative connection configurations under selected corrosion conditions. Future work may further extend this framework to a broader range of structural systems and loading scenarios.
3. Results and Analysis
3.1. Load–Displacement Curves and Stiffness Variation
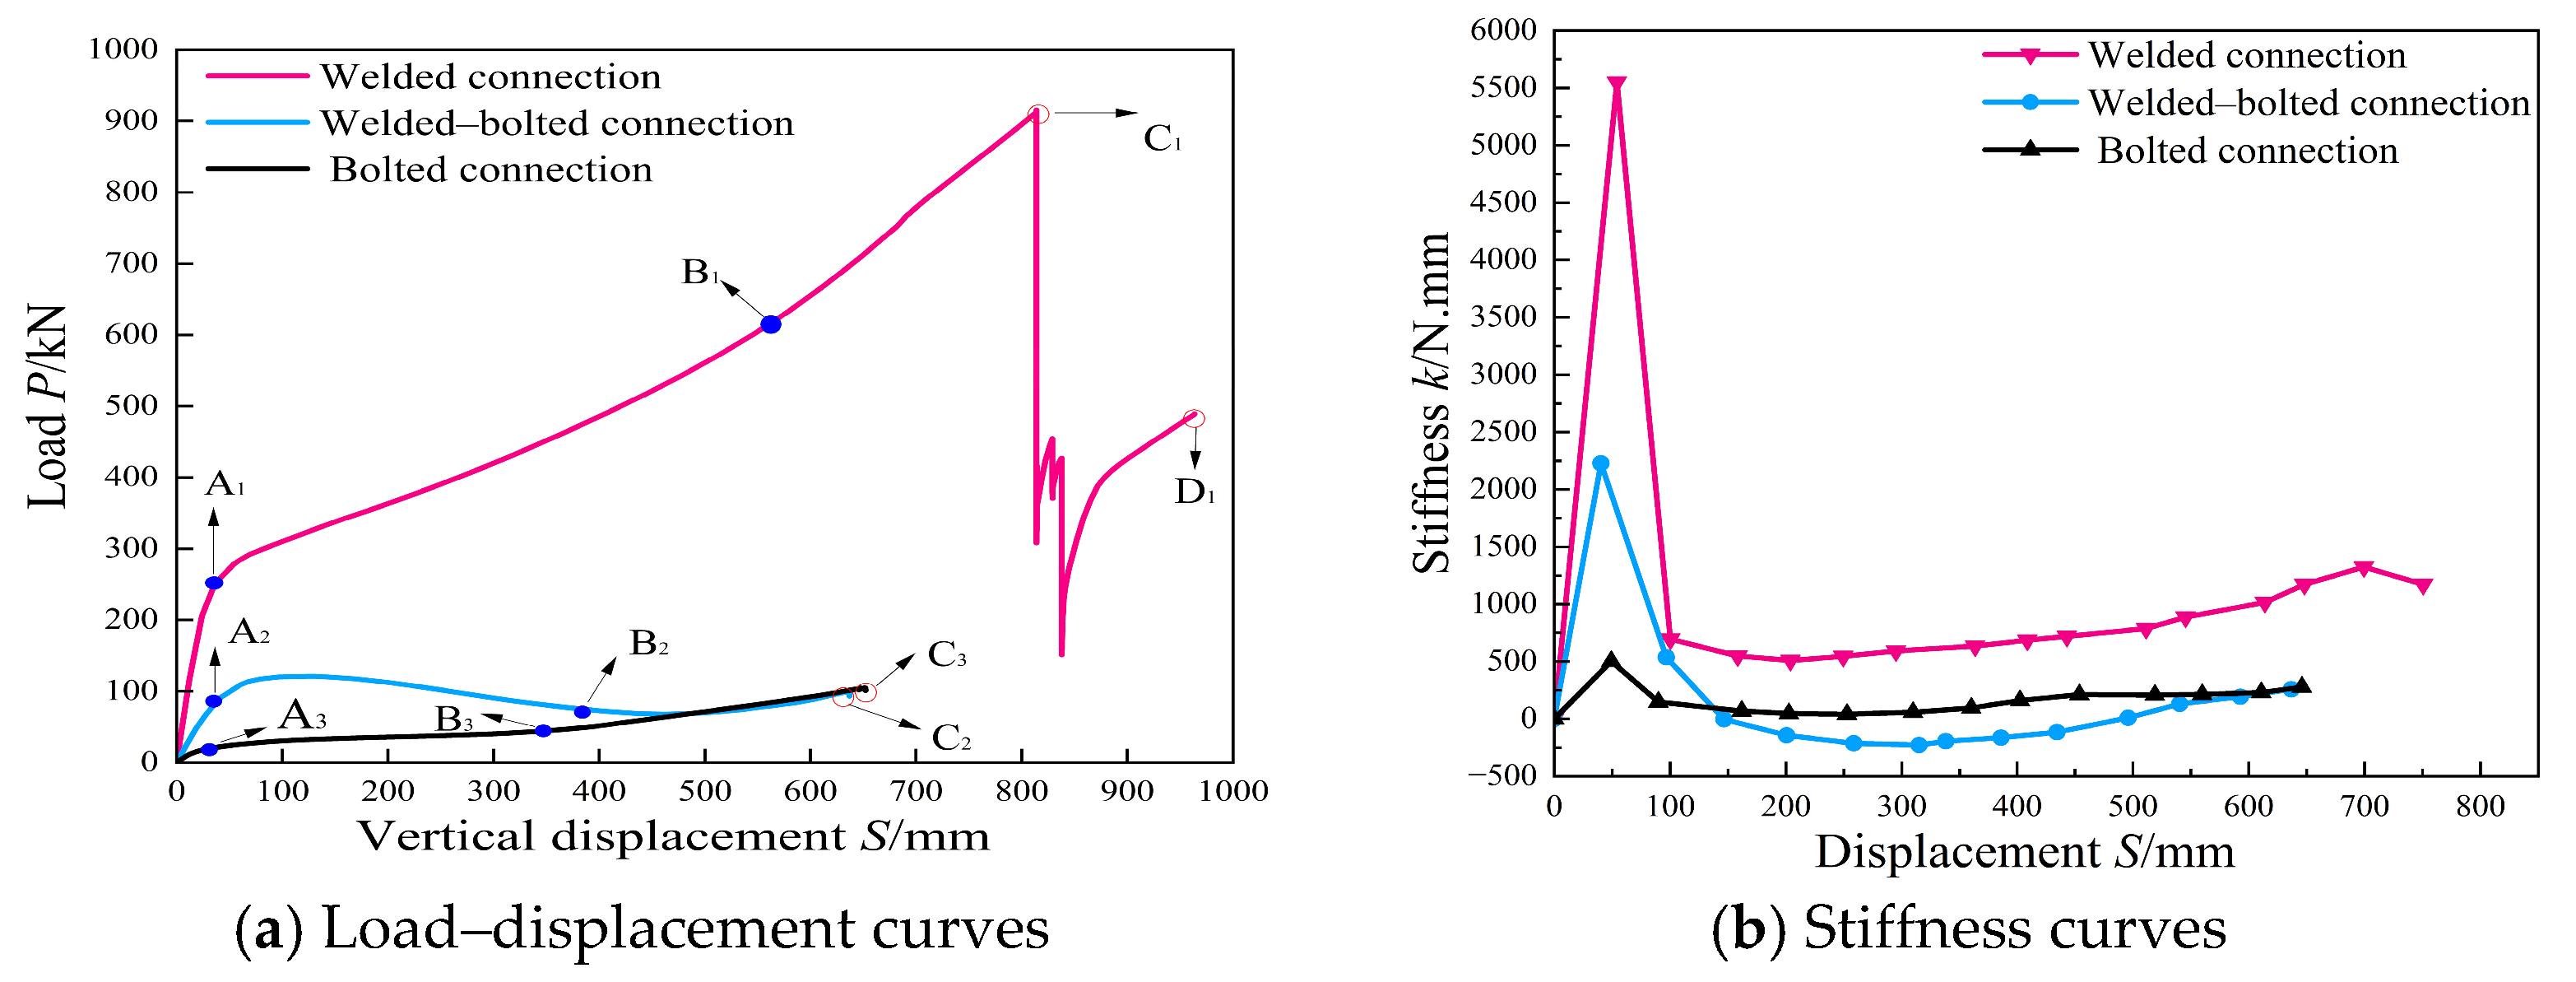
The load and displacement coordinates corresponding to the three stages of each specimen prior to complete failure are presented in
Table 2. Progressive failure was identified from the evolution of local fracture, crack development, internal-force redistribution, and the resistance–displacement response. The first local fracture was regarded as the onset of progressive failure rather than global failure, since alternative load-transfer mechanisms could still develop. Global failure was identified when pronounced crack development and excessive deformation were accompanied by an irreversible post-peak reduction in resistance, indicating that the structure could no longer sustain an effective load-transfer mechanism.
Figure 6a presents the load–displacement curves for steel frame specimens with three connection stiffness levels. For the welded specimen, the load–displacement curve increased linearly in the elastic stage until yielding occurred in the top flange at point A1, corresponding to a displacement of 36 mm. With further loading, the specimen entered the A1-B1 stage from 36 mm to 551 mm, during which compressive arch action governed the response. Upon reaching a displacement of 551 mm at point B1, a redistribution of internal forces was observed, and the structure’s response transitioned into a catenary mechanism. The load–displacement curve reached a peak load of 915.6 kN at point C1, corresponding to a vertical displacement of 814 mm. Subsequently, an initial fracture occurred at the weakened section of the lower beam flange, causing the load to plummet dramatically to 152.2 kN. The crack continued to propagate upward in an arc-shaped path along the beam web. When the vertical displacement increased to 963.5 mm, the crack had developed to the corresponding location on the upper flange at point D1. Accordingly, the welded specimen was considered to have reached global failure when the pronounced post-peak drop in resistance was accompanied by extensive crack propagation and large deformation.
For the welded–bolted specimen, the load–displacement response was linear in the elastic stage until yielding occurred in the top flange at point A2, at a displacement of 40.3 mm. With continued loading, the specimen entered the compressive arch action stage within segment A2-B2, where the response was governed by compressive arching as displacement increased from 40.3 mm to 385.13 mm. A peak load of 120.3 kN was reached at a displacement of 97.32 mm, followed by a slight decrease in resistance due to successive cracking in the weld region and bolts. When the displacement reached 385.13 mm at point B2, internal force redistribution occurred in the specimen, and it began to transition into the catenary action stage. However, due to insufficient tensile strength of the bolts and limited synergistic behavior of the connection, a stable and effective catenary force transmission system could not be established. Following a slight recovery in resistance, progressive shear fracture of the bolts caused an irreversible reduction in load-carrying capacity. Accordingly, the specimen was considered to have reached global failure at point C2, where a stable catenary load-transfer mechanism could no longer be maintained.
In the bolted specimen, beam action was dominant before yielding occurred at point A3 at a displacement of 28.4 mm. During the elastic stage, deformation was relatively limited, and the load–displacement relationship exhibited linear behavior. During stage A3-B3, from 28.4 mm to 345 mm, local buckling occurred in the top flange. As displacement progressed, a stable compressive arch developed. This compressive arch action was maintained through the combined contributions of flexural resistance from the angle steel, shear capacity of the bolts, and overall joint integrity. Consequently, the specimen exhibited a gradual increase in resistance. When the displacement reached 345 mm at point B3, the specimen transitioned into the catenary arch phase. As loading progressed, internal forces were redistributed, and the load continued to rise. Nevertheless, due to inadequate tensile synergy among the bolts and the limited tensile capacity of the angle steel, a stable and effective catenary force transmission system failed to develop, resulting in only a slow resistance increase. Subsequently, the resistance increased only slowly at large displacements and gradually entered a descending branch as the bolt shear capacity was reached. The pronounced deformation and sustained reduction in resistance indicated that the specimen had reached global failure at point C3.
The welded connection exhibited the greatest initial stiffness according to
Figure 6b, indicating considerable resistance to deformation in the early loading stage. Following the elastic phase, its stiffness dropped sharply, and only slight recovery was observed, attributable to compressive arch and catenary effects. This behavior reflects high flexural strength but limited deformation accommodation capability, with a greater tendency toward abrupt post-peak resistance loss. With an initial stiffness of approximately 2500 N/mm, the welded–bolted connection ranked between the welded and bolted counterparts. Within the 0–100 mm displacement range, stiffness rapidly decreased to zero as a result of plastic deformation in the welded region and bolt slip. Further displacement subsequently led to negative stiffness, caused by local gap rebound in the joint, which was gradually counteracted by additional plastic deformation. Consequently, stiffness fluctuated around zero and was ultimately upheld largely by residual bolt restraint. As for initial stiffness, the bolted connection registered the lowest value, at about 500 N/mm. Stiffness slightly decreased within the 0–100 mm displacement range. Subsequently, it stabilized and remained stable at a low level of 500 N/mm with minor fluctuations during the middle and later stages. This behavior exhibits favorable cushioning and energy absorption characteristics, making it more adaptable to larger deformations.
3.2. Failure Modes
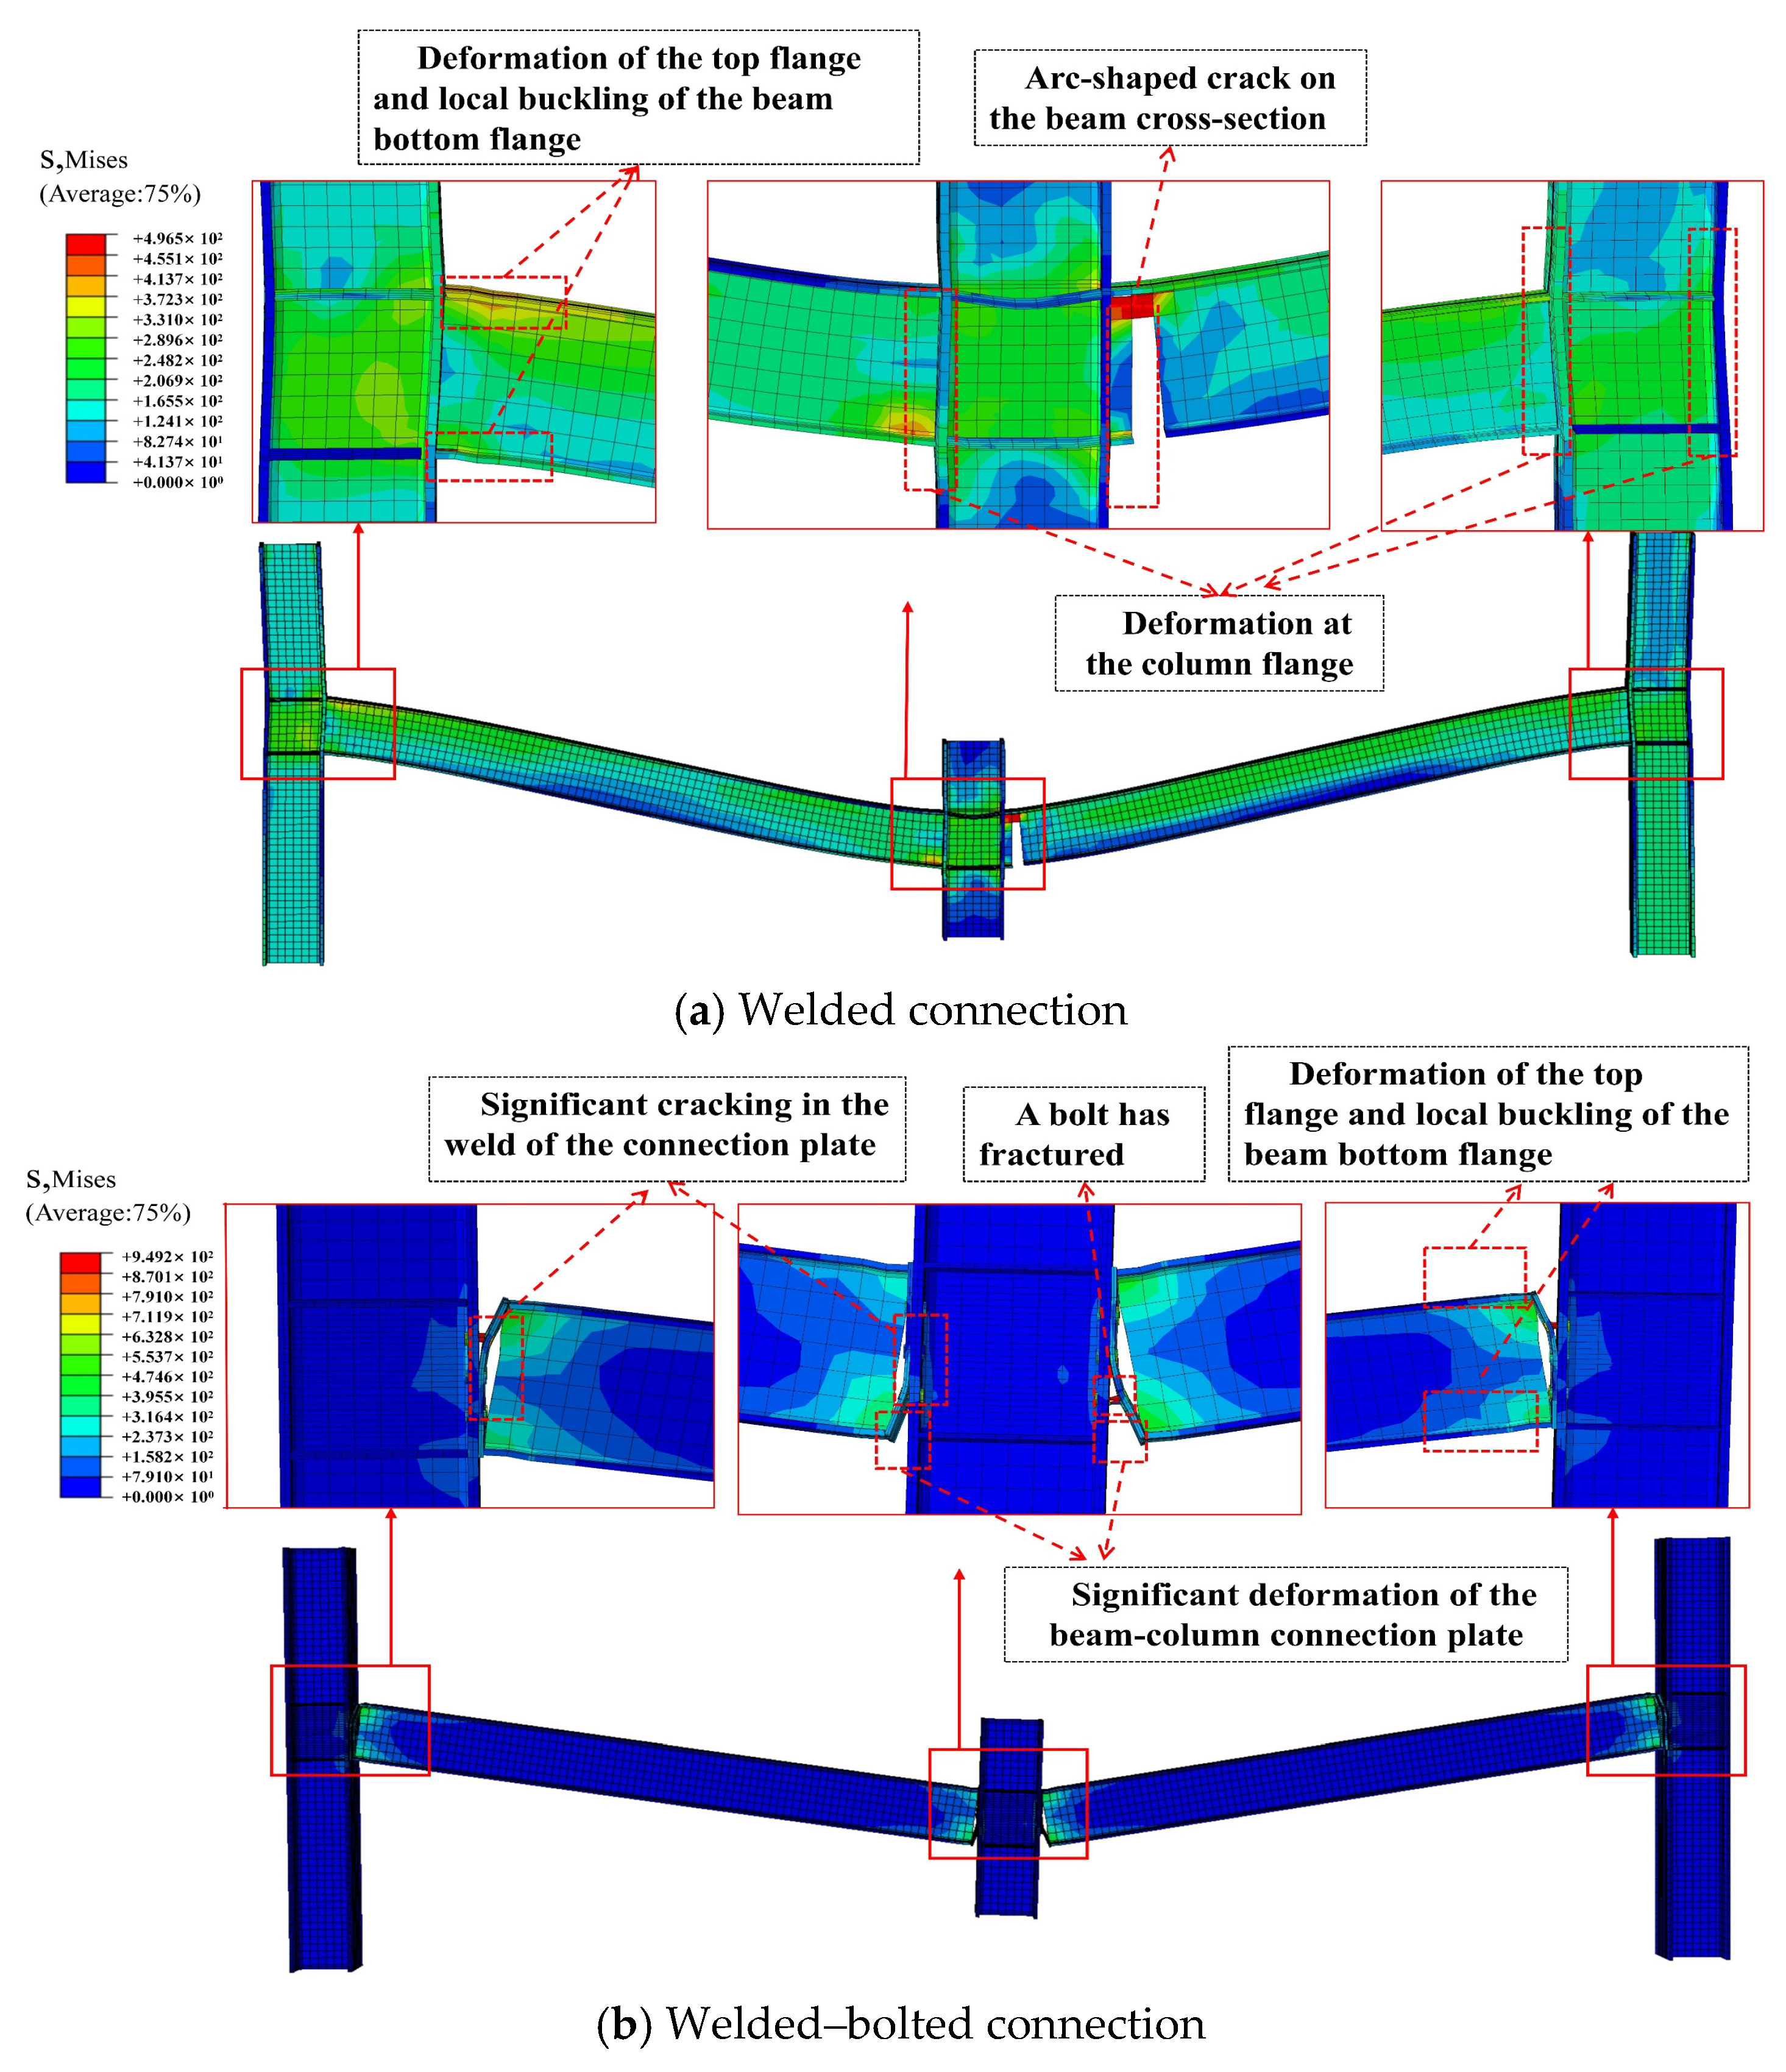
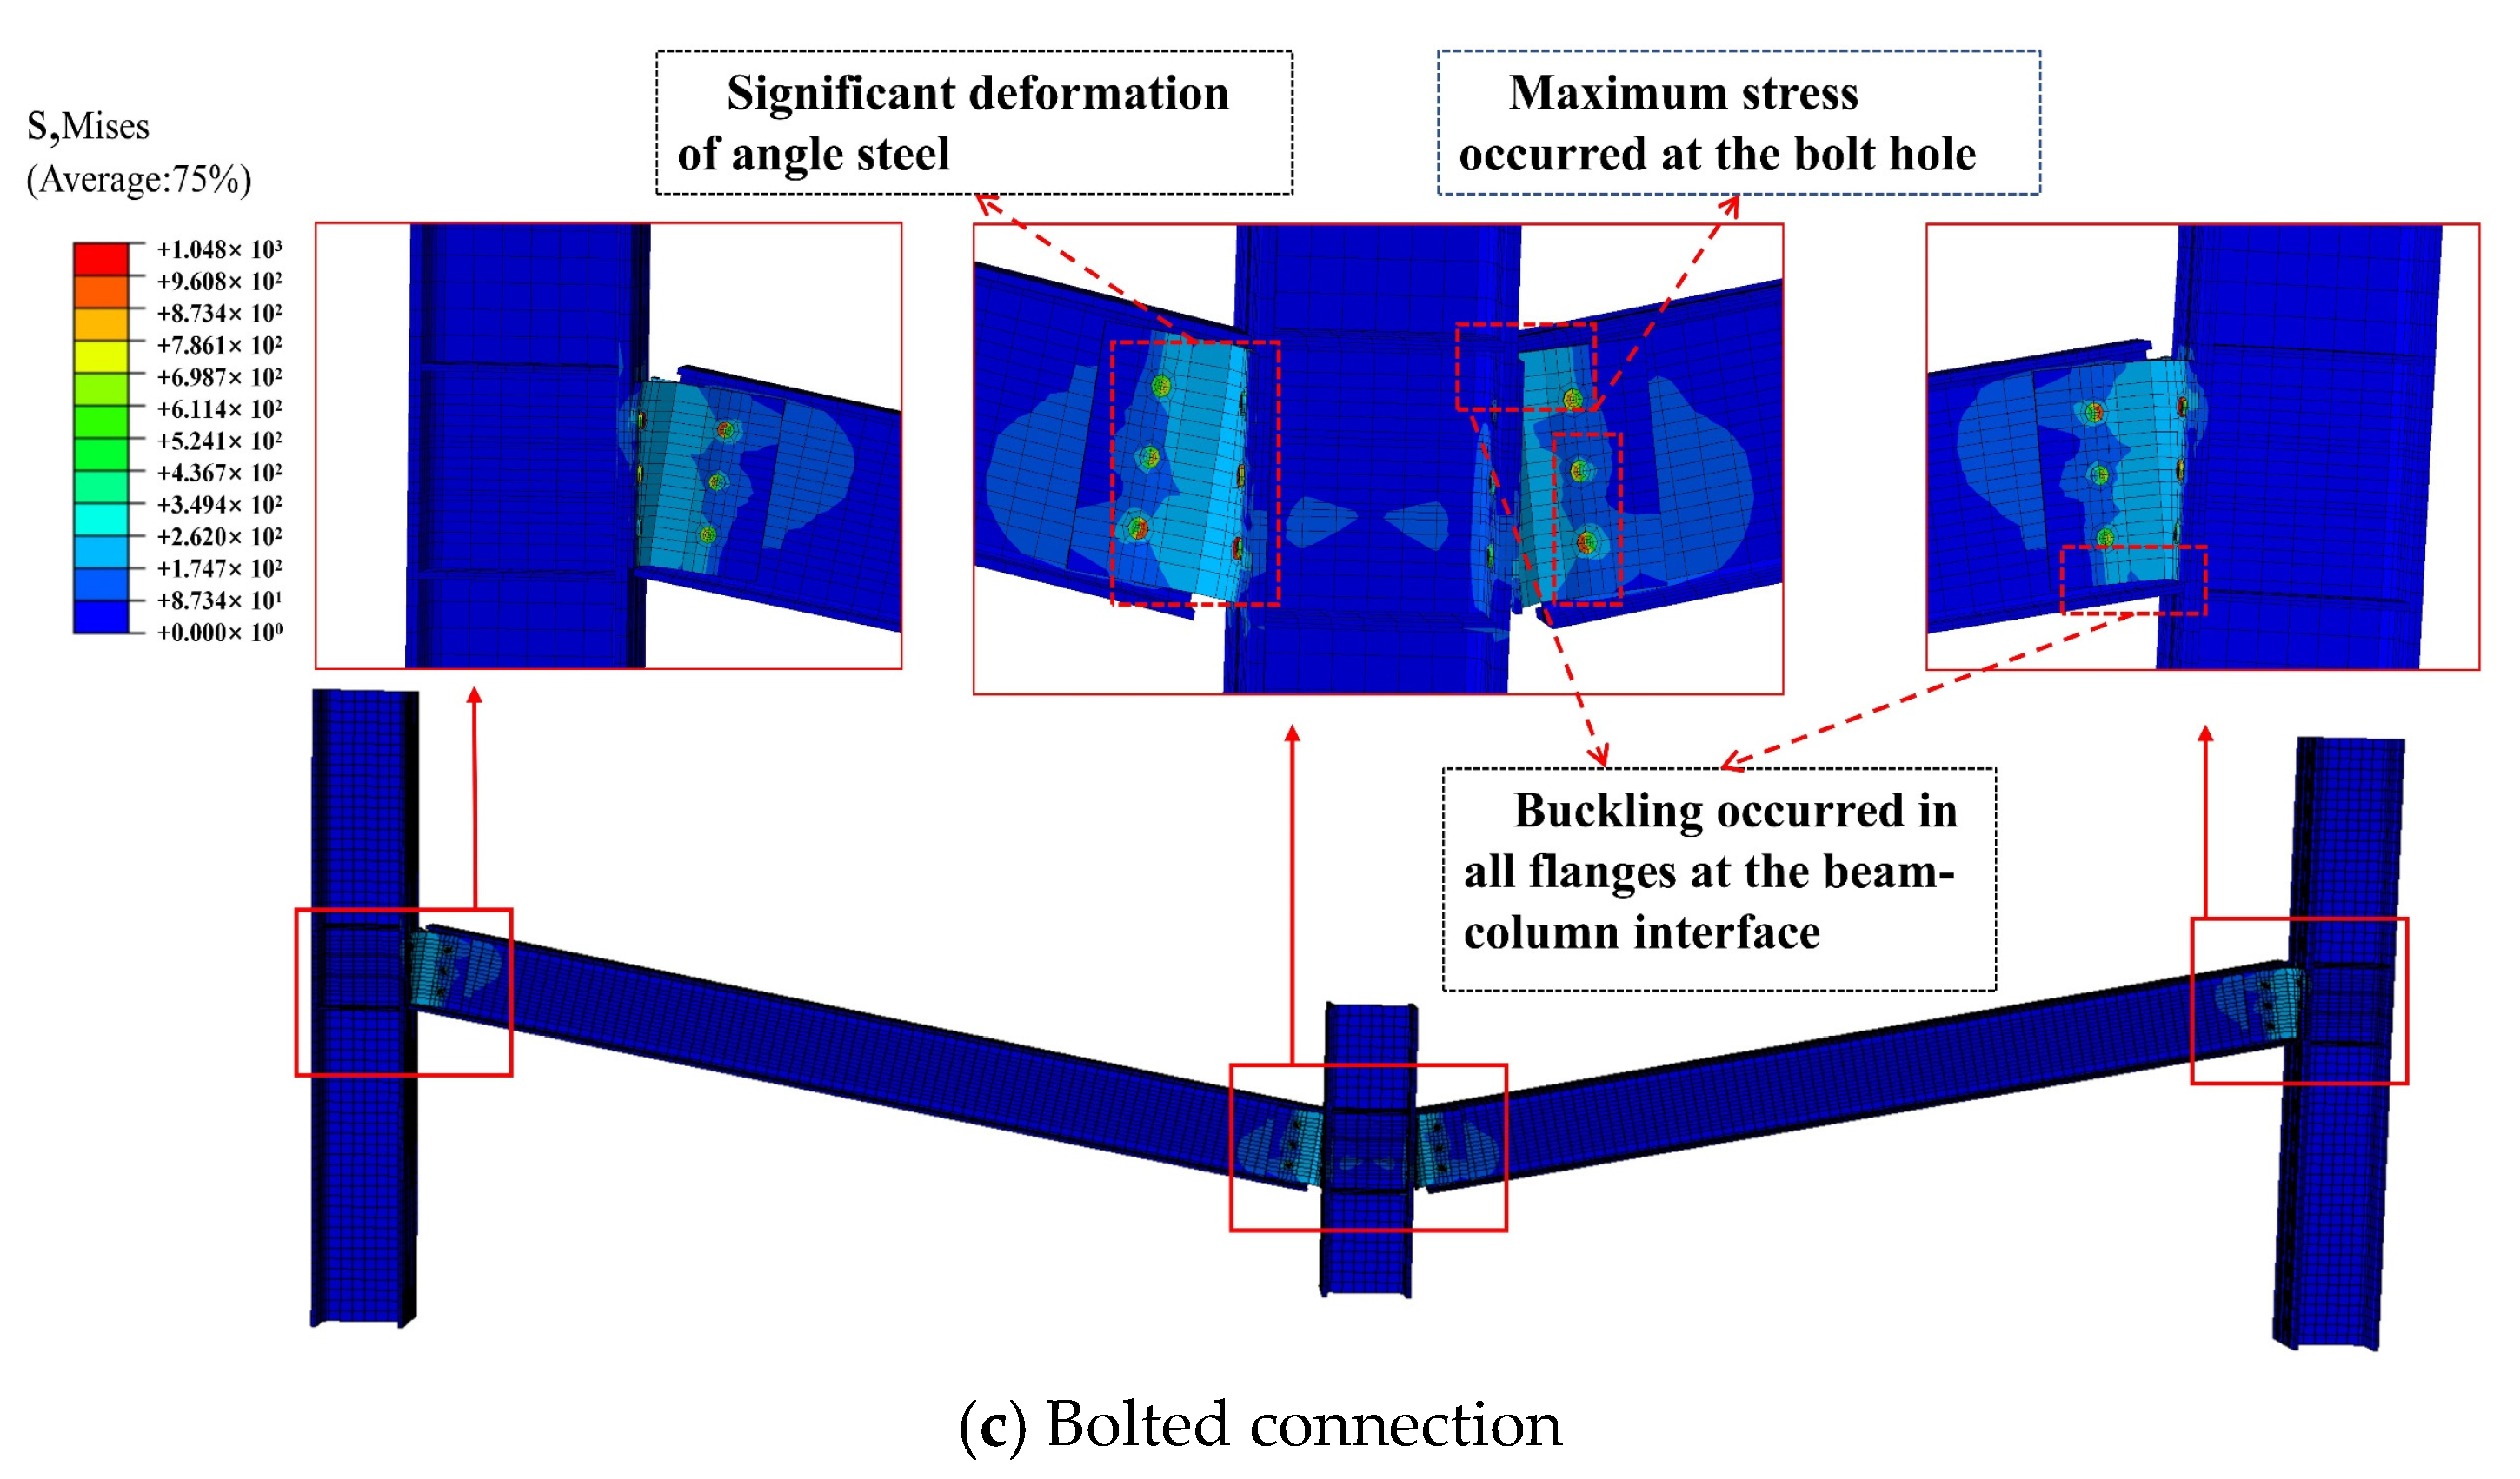
Stress contour plots of the structural failure are depicted in
Figure 7. For the welded connection, peak stress concentration was extremely pronounced. High-stress regions were mainly concentrated in the welds connecting the beam flange to the column and in adjacent regions. The combined effects of welding residual stress and stress concentration increased the likelihood of brittle fracture. This finding agreed with the sudden load drop observed in the load–displacement curve. For the welded–bolted connection, the stress distribution was more uniform. High-stress zones appeared around the bolt holes and in the weld region. The load was transferred through the combined action of the welds and bolts, which alleviated the degree of stress concentration. During the failure process, bolt slippage and weld yielding occurred sequentially, resulting in relatively good deformation accommodation capability. For the fully bolted connection, stress was concentrated around the bolt holes, and the angle steel exhibited relatively high stress. Since no welds were present, the stress concentration was completely transferred to the bolt holes. The dominant failure modes were bearing failure at the bolt holes or shear failure of the bolt shanks, exhibiting greater deformation accommodation capability.
3.3. Moment–Rotation Response (M-θ) Analysis
To quantitatively characterize the rotational behavior of the three connection configurations, the moment–rotation (
Mb-
θj) responses of the uncorroded specimens were evaluated. The relative rotation between the beam and column was determined from the displacement fields of adjacent cross-sections near the connection. Two sections were selected on both the beam and column sides, while avoiding regions strongly affected by local deformation around welds, bolt holes, and angle components. Identical measurement locations were adopted for all three connection configurations to ensure consistency. For each section, the deformed centroid coordinates were determined from the averaged nodal displacements as
The beam and column rotations were then obtained from the changes in orientation of the corresponding section centerlines, and the relative joint rotation was defined as
where
θb and
θc denote the rotations of the beam and column, respectively. The corresponding connection moment
Mb was obtained from a free-body cut taken through the beam section adjacent to the connection. The moment component normal to the frame plane was extracted and combined with the corresponding relative rotation to establish the
Mb-
θj response.
The initial rotational stiffness
Sj,ini was determined from the slope of the initial elastic portion of the moment–rotation curve. To minimize the influence of numerical fluctuations at individual data points, linear regression through the origin was applied to the initial elastic data:
where
Mb and
θj,i are the connection moment and relative joint rotation at the i data point, respectively.
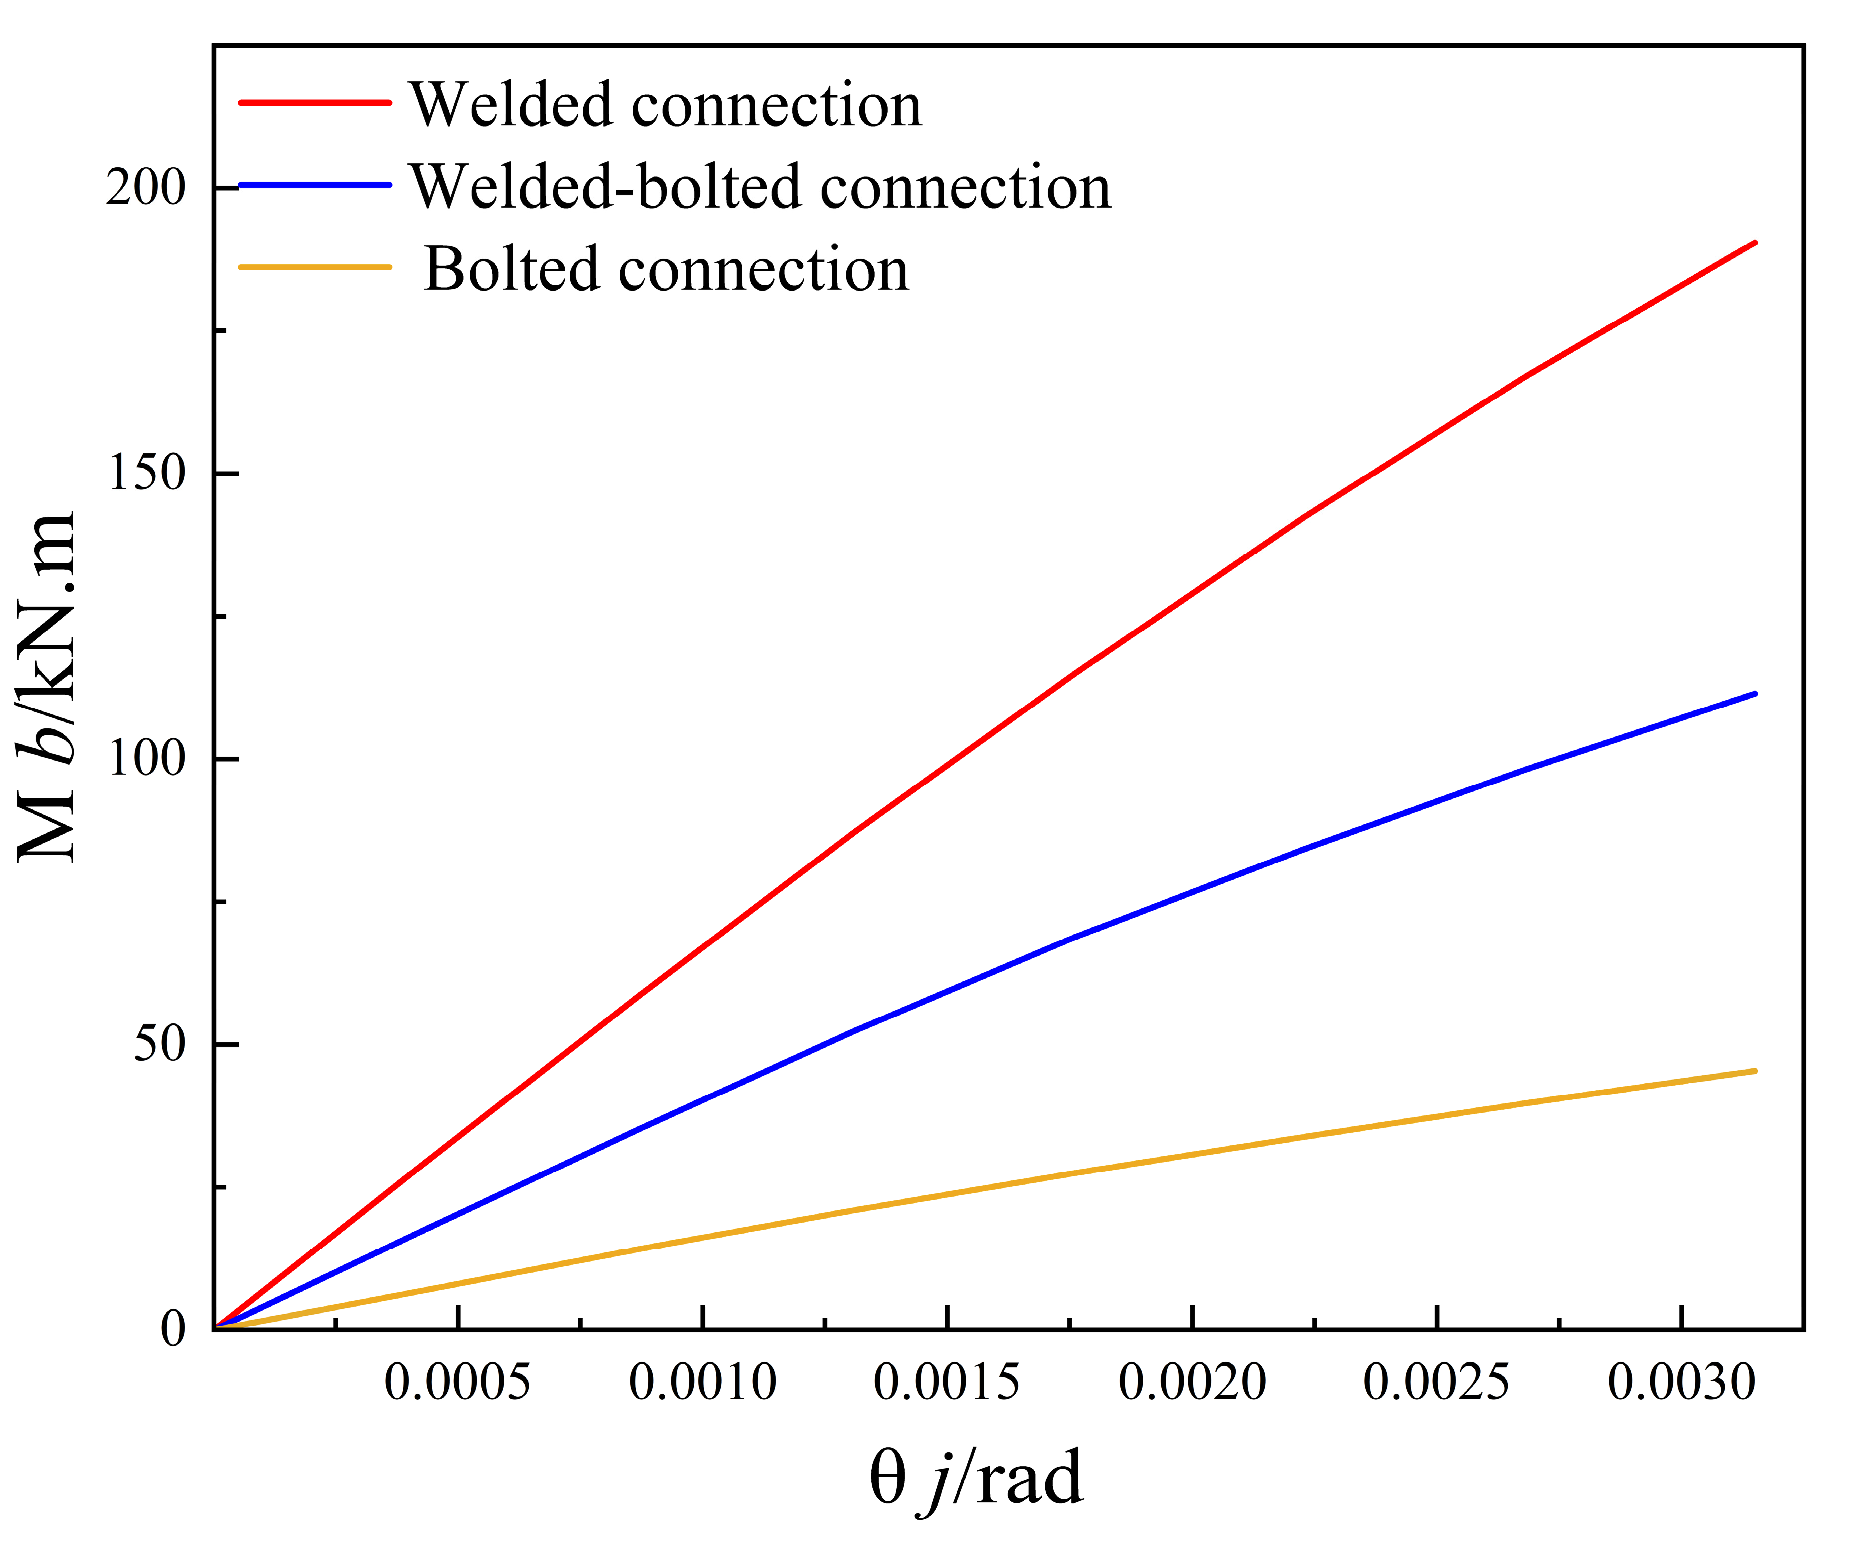
As shown in
Figure 8, pronounced differences are observed among the moment–rotation responses of the three connection configurations. The welded connection exhibits the steepest response, followed by the welded–bolted connection, whereas the bolted connection shows the lowest slope. At a joint rotation of approximately 0.003 rad, the corresponding moments are approximately 193, 117, and 47.5 kN·m for the welded, welded–bolted, and bolted connections, respectively. Thus, at the same rotation level, the welded connection develops approximately 1.65 times the moment of the welded–bolted connection and more than four times that of the bolted connection. Based on the initial linear portions of the curves, the initial rotational stiffnesses are approximately 6.8 × 10
4, 4.1 × 10
4, and 1.65 × 10
4 kN·m/rad for the welded, welded–bolted, and bolted connections, respectively. Taking the welded connection as the reference, the corresponding normalized stiffness ratios are approximately 1.00, 0.60, and 0.24. Therefore, the rotational stiffness follows a clear hierarchy
.
The higher rotational stiffness of the welded connection is attributed to the direct continuity between the beam and column, which provides strong rotational restraint and facilitates moment transfer. The welded–bolted connection exhibits an intermediate stiffness because deformation of the transition plate and bolted components introduces additional connection flexibility. By contrast, the lower rotational stiffness of the bolted connection is associated with deformation of the angle components, bolt–hole interaction, and relative deformation within the connection region. Nevertheless, the progressive collapse resistance cannot be determined solely by rotational stiffness, because connection strength, deformation capacity, energy absorption capability, internal-force redistribution, and failure mechanisms collectively govern the structural response under large deformation.
3.4. Energy-Absorption Performance
To quantitatively evaluate the energy-absorption performance of the three connection configurations, the absorbed energy
Ea and the normalized energy-absorption index
IE were defined as
where
P(
s) is the vertical resistance,
Su is the displacement at final failure, and
Pmax is the peak resistance. The absorbed energy was obtained by numerical integration of the resistance–displacement curve using the trapezoidal rule. The normalized index IE was introduced to reduce the influence of differences in strength level and deformation range among the three connection configurations.
As summarized in
Table 3, the absorbed energies of the welded, welded–bolted, and fully bolted connections were 478.5, 56.1, and 32.6 kJ, respectively. The substantially greater
Ea of the welded connection is primarily attributed to its markedly higher resistance throughout the loading process. However, because absolute absorbed energy is strongly dependent on the resistance level,
Ea alone does not provide a direct basis for comparing connections with substantially different strengths.
The corresponding normalized energy-absorption indices were 0.54, 0.72, and 0.49 for the welded, welded–bolted, and fully bolted connections, respectively. Although the welded connection exhibited the greatest absolute energy absorption, the welded–bolted connection achieved the highest normalized index, indicating a more balanced utilization of its strength and deformation capacities. The fully bolted connection accommodated relatively large deformation without abrupt fracture, but its comparatively low resistance resulted in the lowest total absorbed energy.
3.5. Influence of Different Corrosion Levels
3.5.1. Load–Displacement Curves
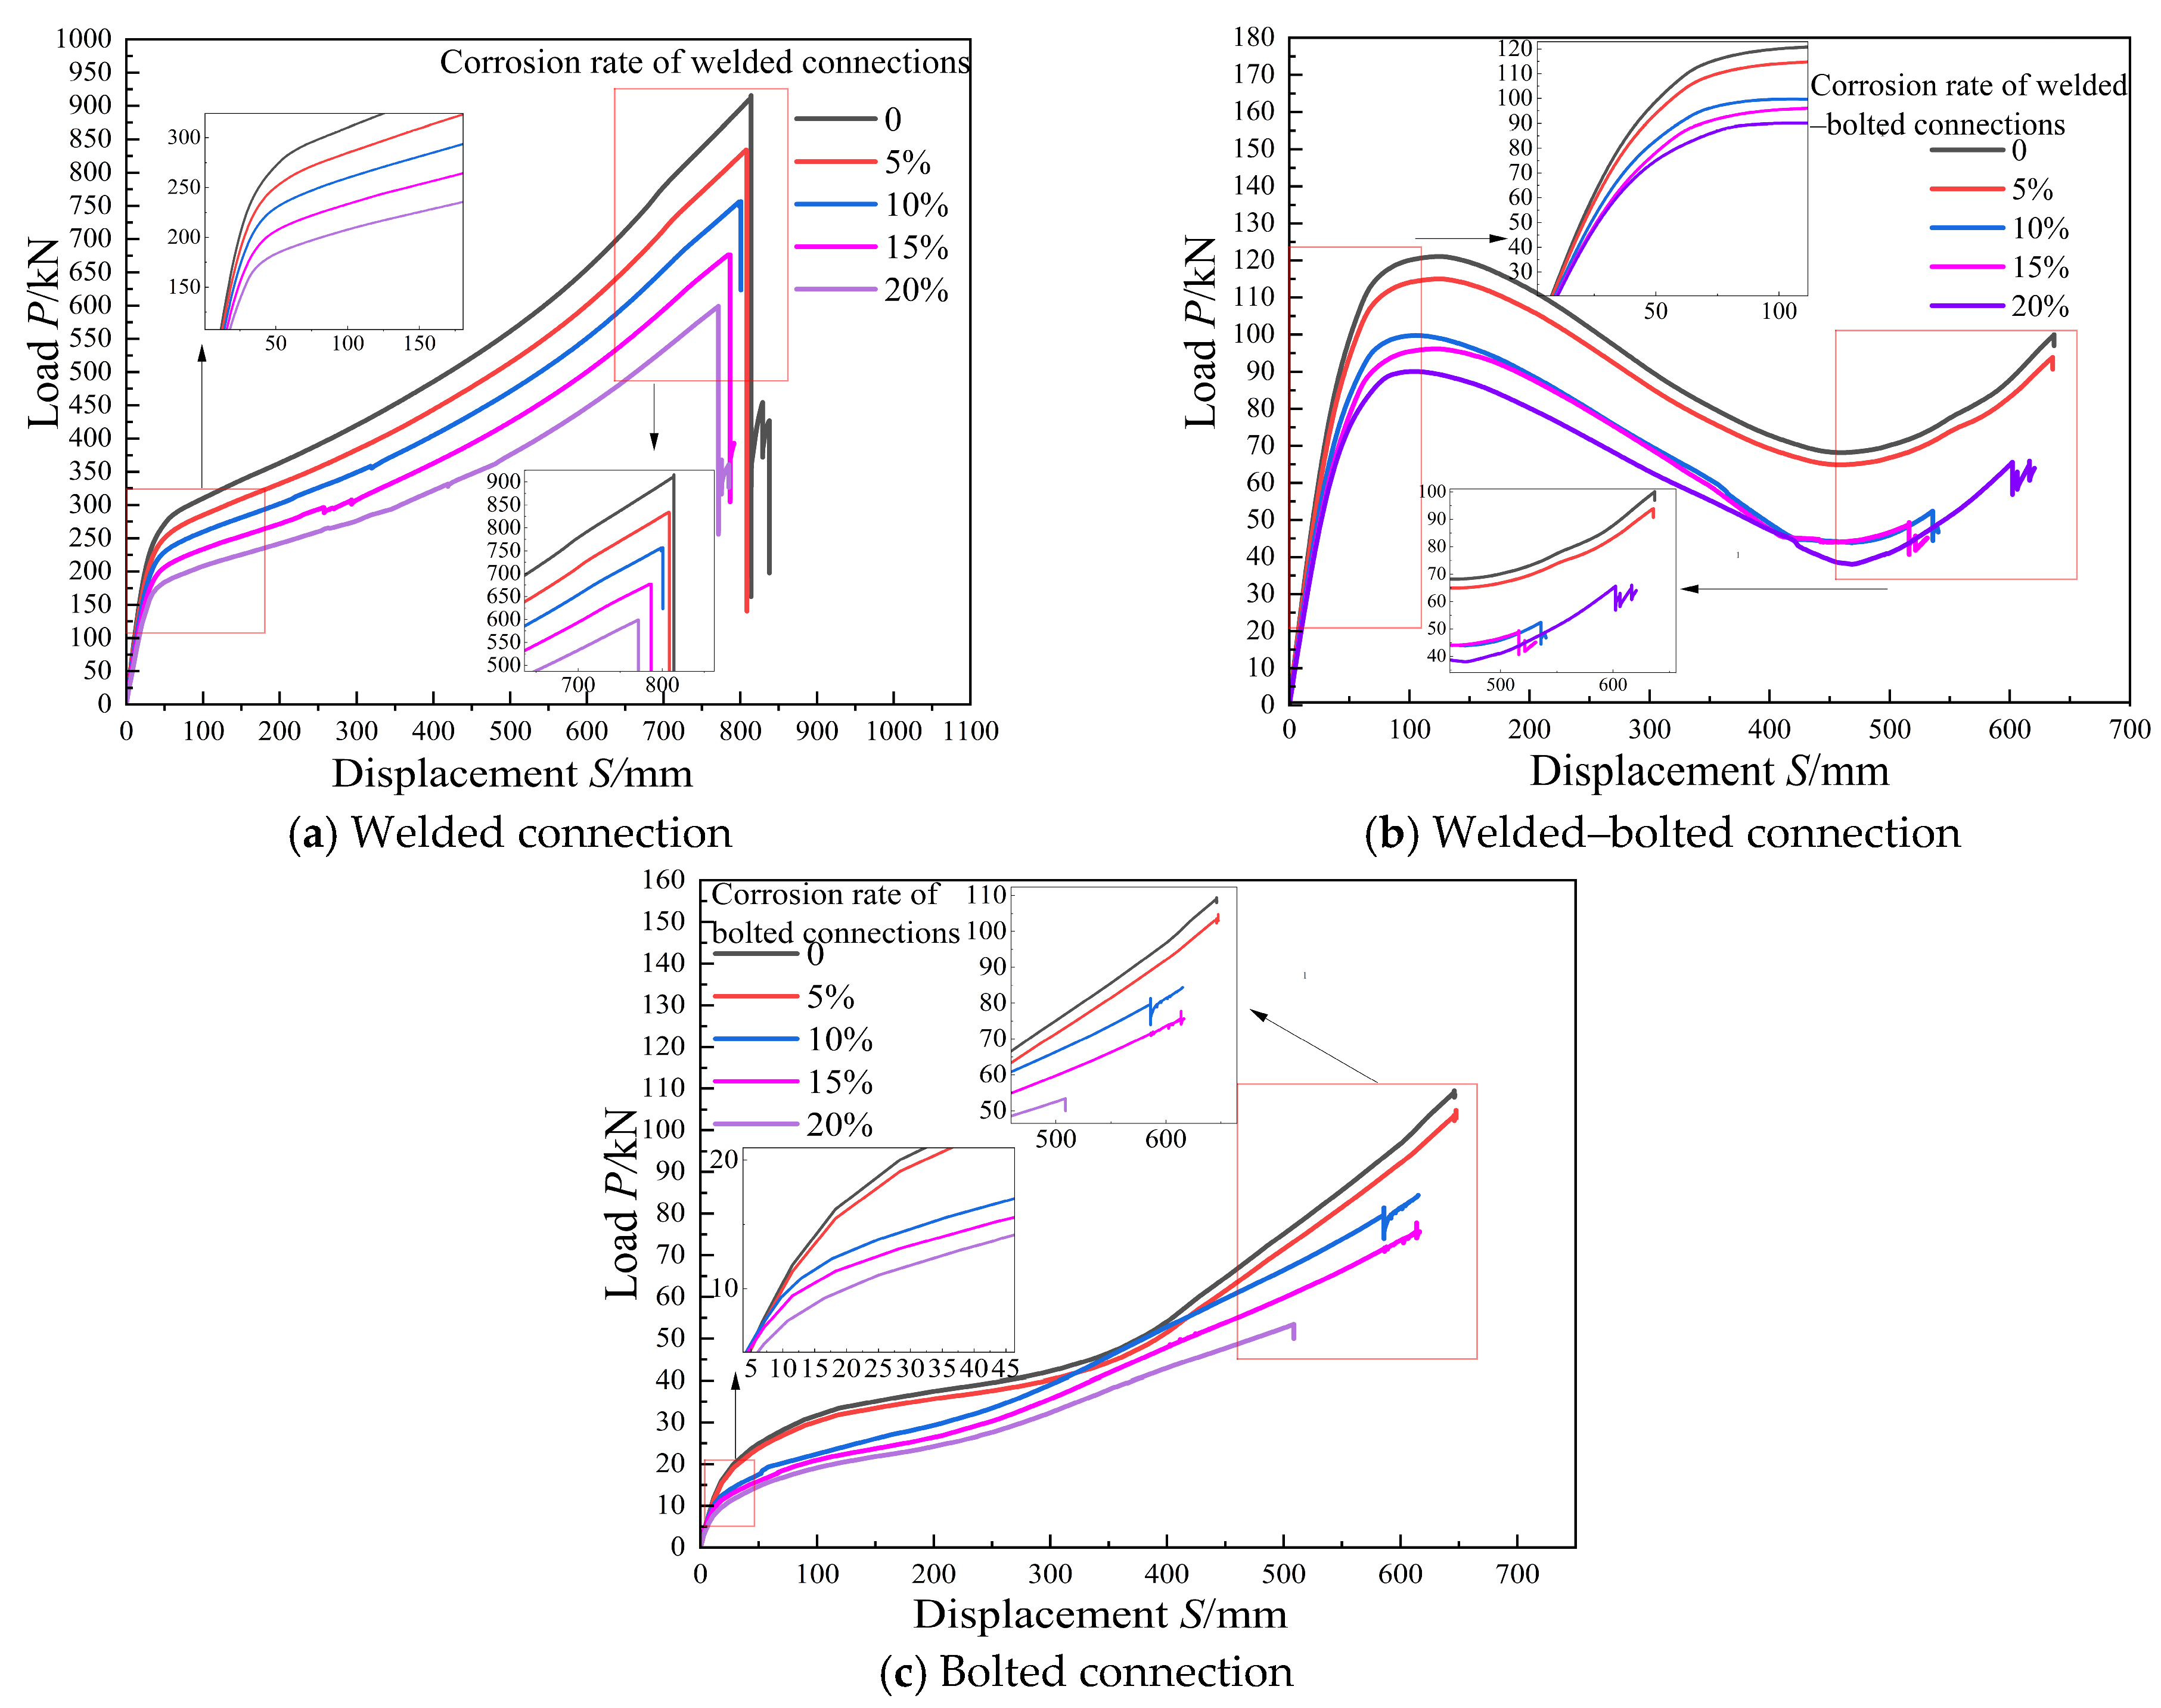
Figure 8 shows the load–displacement curves for each of the five structural groups under different corrosion rate conditions.
Figure 9a reveals that the ascending branch for the welded specimen showed a monotonic increase in load with increasing displacement. At a given displacement, increasing corrosion levels intensified structural degradation and reduced the load-carrying capacity of the connection, accelerating stress concentration and thereby reducing joint load-carrying capacity. Greater corrosion levels were associated with an earlier appearance of the descending branch in the curve and a faster decline in connection load-bearing capacity. The uncorroded specimen exhibited the highest load-carrying capacity as well as maintained a relatively stable deformation response before the onset of severe damage. When the corrosion rate reached 20%, the mechanical performance of the joint deteriorated significantly. As illustrated in
Figure 9b, the curve for the non-corroded welded–bolted specimen exhibits a distinct three-stage “rise-drop-rise” behavior. This specimen demonstrated the highest peak load and a pronounced secondary load capability. Increasing corrosion rate amplified damage to welds and bolts. This increased porosity and reduced yield strength and elastic modulus. As a result, the load-carrying capacity, peak load, and the magnitude of the secondary load recovery all decreased. When the corrosion rate exceeded 10%, the descending branch became steeper, and the secondary load recovery became negligible. When the corrosion rate reaches 20%, the mechanical properties of the specimen decrease substantially. However, the impact of corrosion on the deformation accommodation capability of this connection type is limited.
As shown in
Figure 9c, the load–displacement curves of the bolted specimens all exhibit a smooth upward trend before reaching the peak load. As the corrosion rate increased, higher porosity reduced the shear capacity of the bolts and the tensile strength of the angle steel. Consequently, the ultimate load-carrying capacity decreased. The uncorroded specimen had the steepest ascending slope and the highest capacity. At a corrosion rate of 20%, the curve was the flattest, and the peak load was the lowest. These results indicated a significant reduction in load-bearing capacity.
The post-peak load–displacement response was examined to characterize the deformation accommodation and resistance–retention behavior of the welded connection. A more gradual descending branch indicates a greater ability to sustain load as deformation develops after the peak. The uncorroded welded specimen exhibited a relatively smooth post-peak response and maintained its resistance over a wider deformation range. With increasing corrosion level, the descending branch became progressively steeper, indicating reduced post-peak resistance retention and deformation accommodation capability, together with a greater tendency toward abrupt resistance degradation. It manifested as a sharp loss of load-carrying and deformation capability after the peak load. In contrast, bolted and welded–bolted specimens did not exhibit a pronounced sudden drop in the load–displacement curves at any corrosion level. Their post-peak curves showed a gradual descending trend. At a corrosion rate of 20%, both types continued to dissipate energy via plastic mechanisms, including bolt shank shear and bearing deformation of the connection plate, without experiencing sudden fracture. It can be seen that corrosion only weakens the strength of bolted and welded–bolted structures, but does not alter their inherent ductile failure mode.
3.5.2. Stiffness
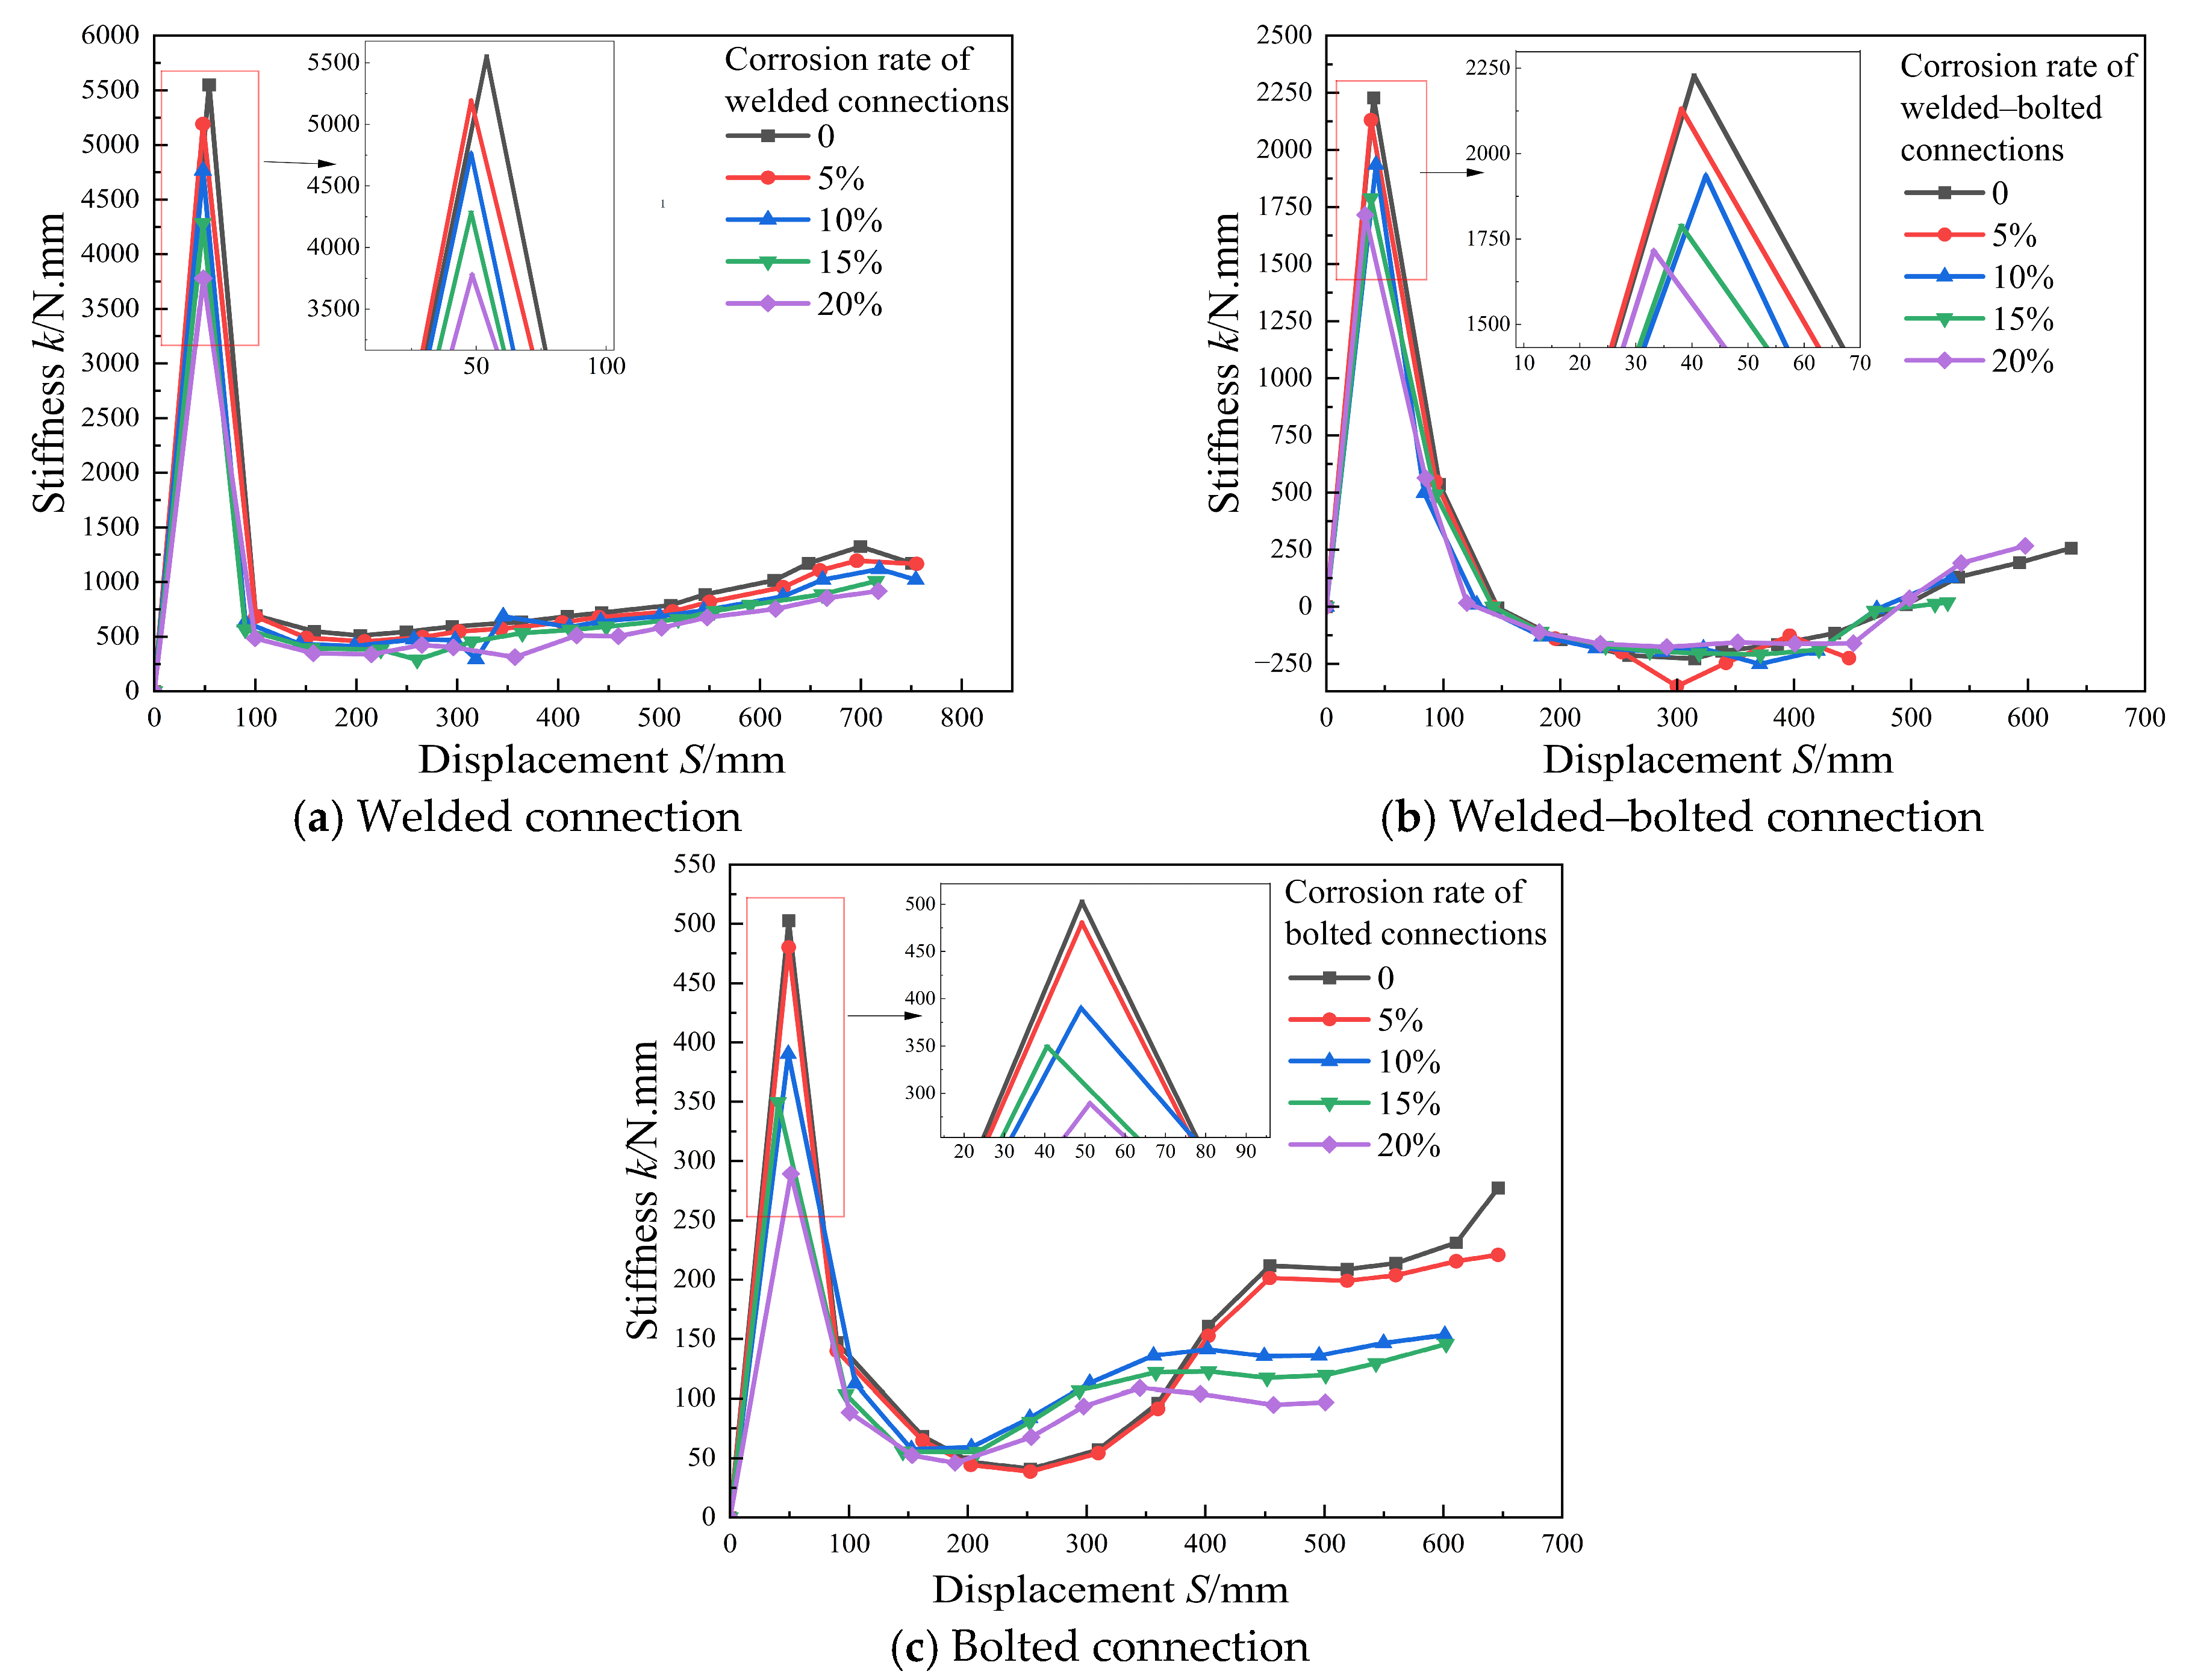
As depicted in
Figure 10, the overall stiffness of the welded, welded–bolted, and fully bolted structures decreases significantly with an increase in corrosion rate. During the initial displacement phase (0–100 mm), the stiffness of all three structural types degraded rapidly, with the bolted specimens exhibiting the most significant deterioration, followed by the welded and bolted–welded specimens. The peak stiffness declined by 32%, 23%, and 42.44% for the welded, welded–bolted, and fully bolted specimens, respectively, at a corrosion rate of 20%. Joint deformation is amplified, and deformation resistance is diminished during this phase due to stiffness degradation, which compromises structural performance and ultimately leads to excessive deflection under service loads.
Uncorroded welded specimens exhibited slow stiffness recovery in the intermediate phase, while high-corrosion specimens, by contrast, demonstrated recovery that was both slower and more subdued. For welded–bolted specimens with low corrosion levels, stiffness first decreased and then entered a recovery phase. High-corrosion specimens continued to exhibit low-level stiffness fluctuations with only minor recovery. For bolted specimens, low corrosion levels resulted in progressive stiffness recovery, while high corrosion levels led to sustained low-level fluctuations. Across all three structural types, stiffness recovery in highly corroded specimens was consistently delayed and limited, compromising the stability of their post-peak mechanical performance.
In the final phase, stiffness continued to increase gradually in uncorroded welded specimens. By contrast, specimens with high corrosion levels experienced delayed and limited stiffness recovery, which worsened their ability to sustain deformation and resistance deterioration and increased the risk of brittle failure. For the uncorroded welded–bolted specimen, stiffness gradually approached zero before stabilizing, while high-corrosion specimens showed large fluctuations and limited recovery. Among all specimens, the uncorroded bolted ones demonstrated the most pronounced stiffness recovery. Insufficient stiffness recovery in highly corroded bolted joints fostered internal force concentration and load imbalance. These conditions could precipitate premature local failure and reduce the overall structural safety margin.
In summary, corrosion affected the stiffness of the three structural types in distinct ways. Differences in corrosion levels and their effects on stiffness degradation modified the original load-transfer paths. The adverse effects on initial stiffness degradation and the limited late-stage recovery were most pronounced in bolted structures.
3.5.3. Peak Load
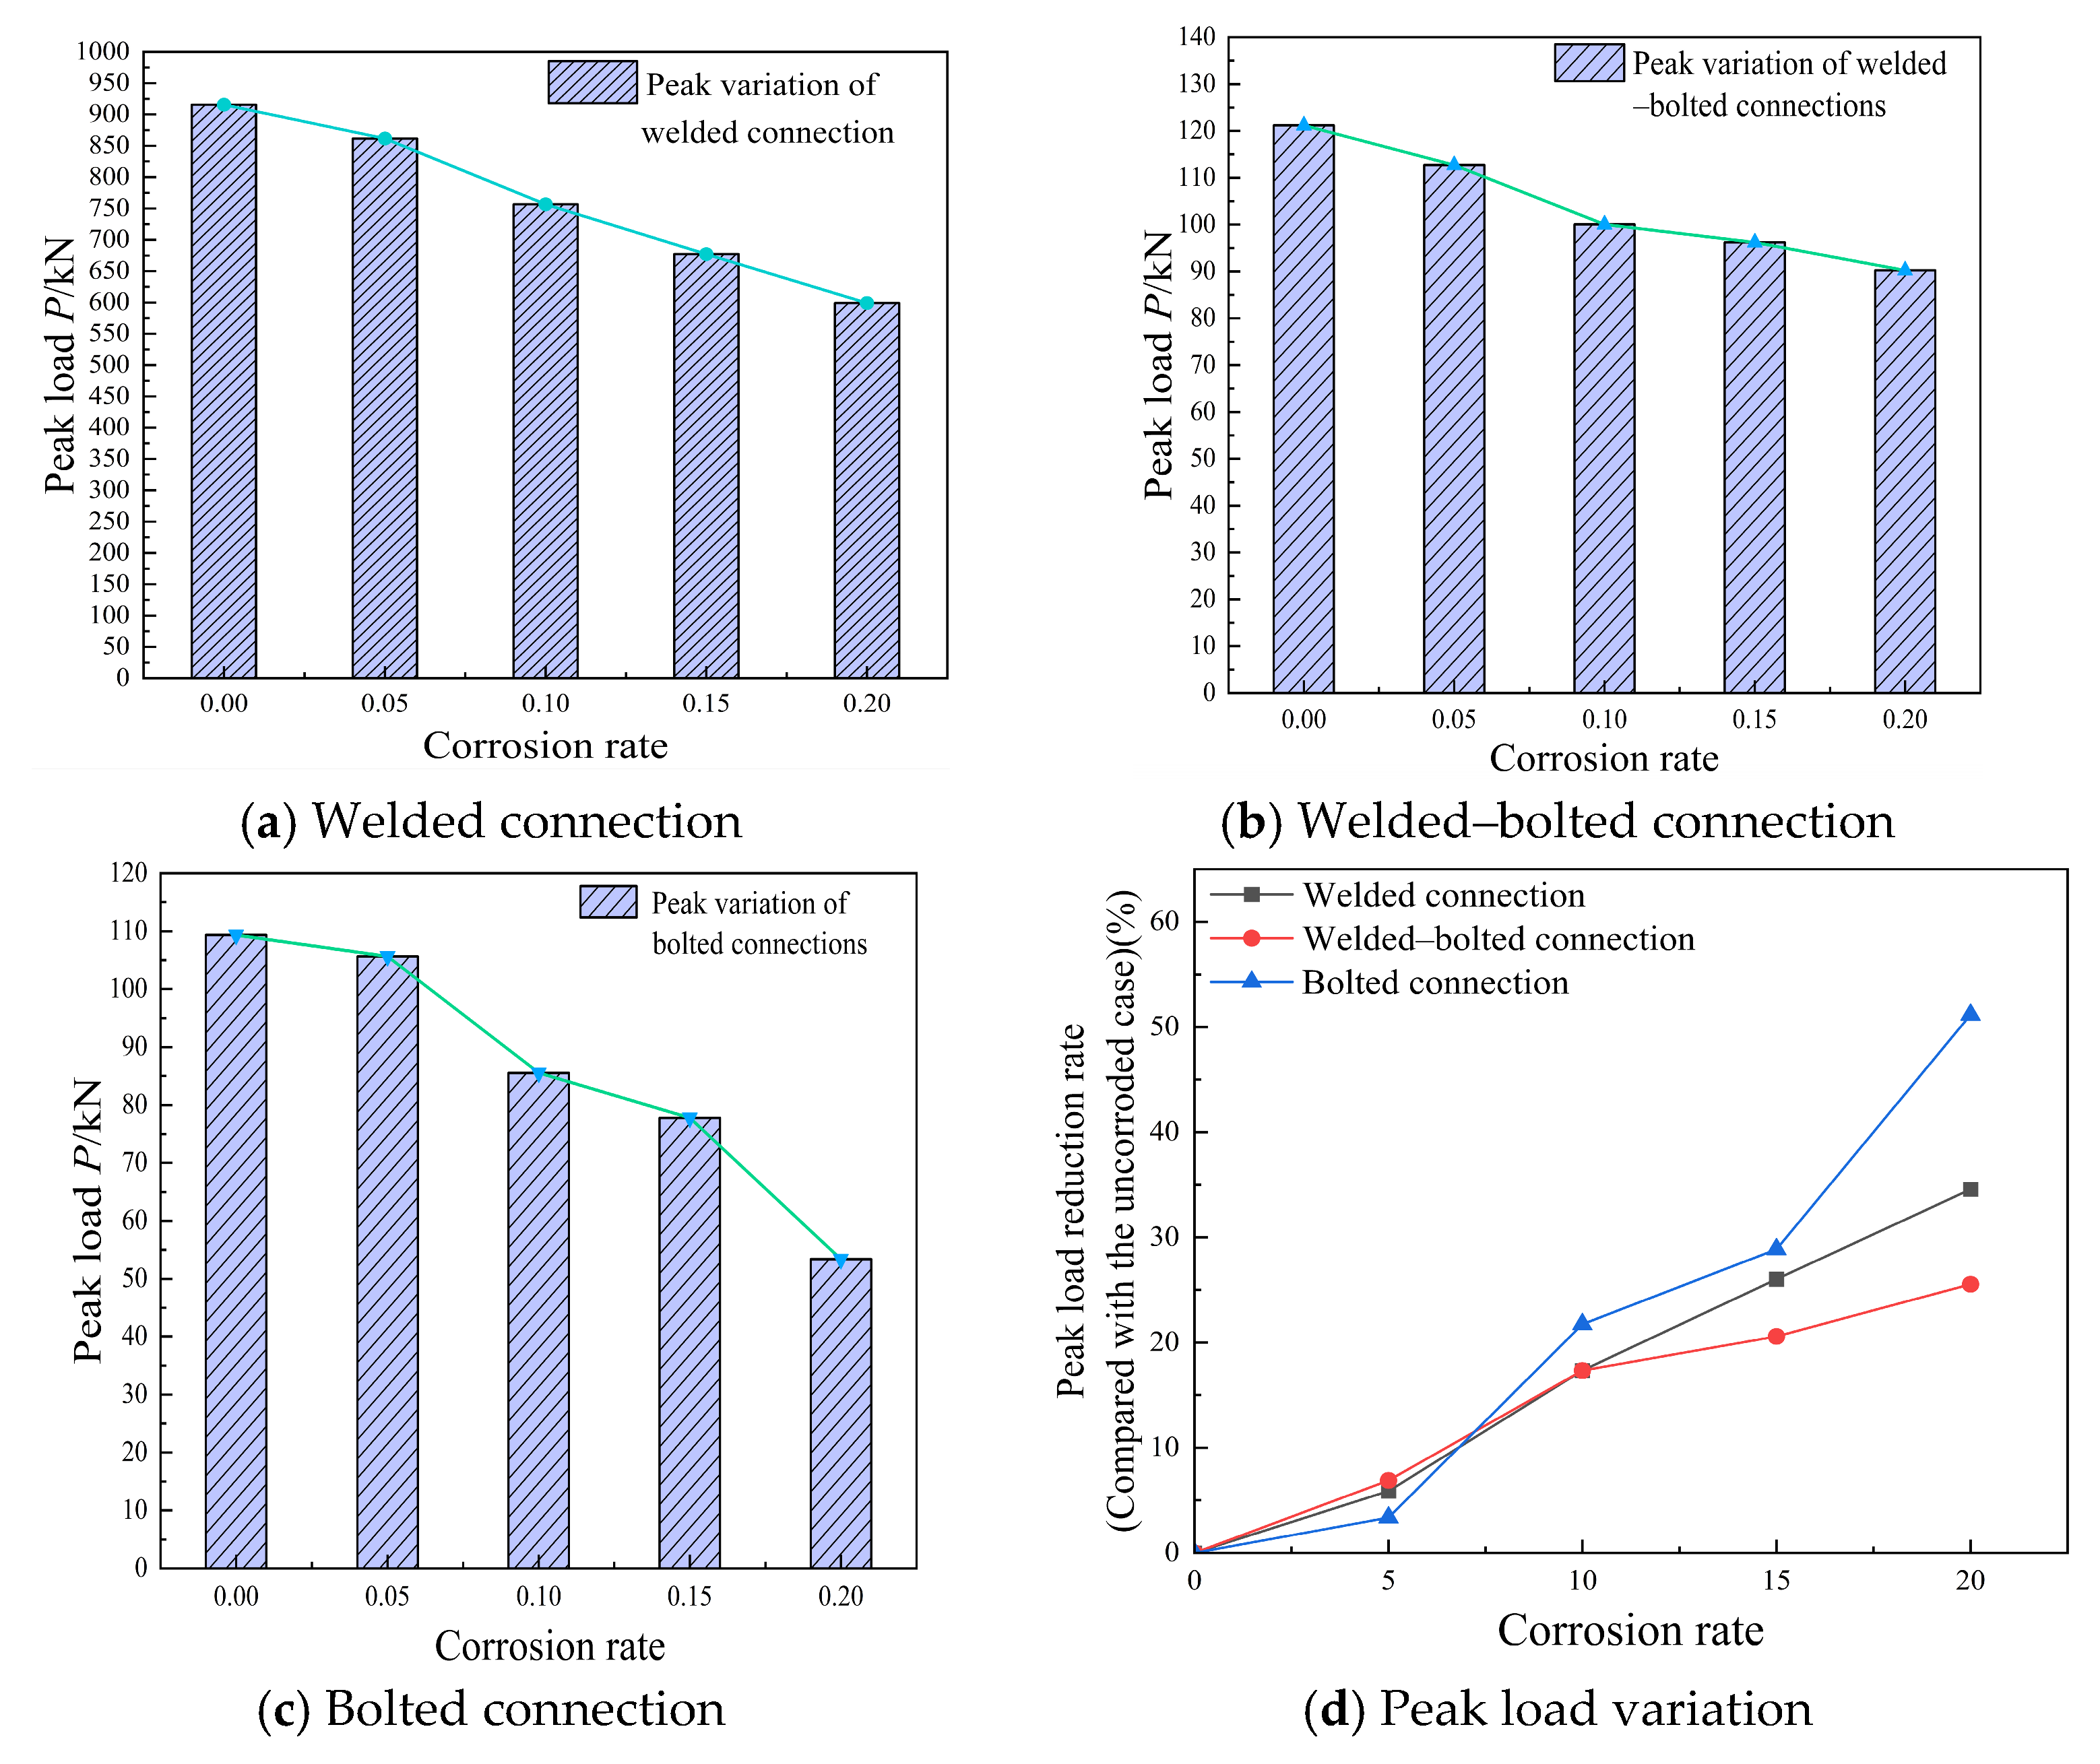
Figure 11 shows the variation in peak load with corrosion levels for welded, welded–bolted, and fully bolted steel-frame specimens. All three connection types lost load-bearing capacity as corrosion rate increased, but the degradation patterns differed. The welded structure showed an approximately linear decline. Load-bearing capacity decreased by only 5.9% when the corrosion rate was within the range of 0–5%. The degradation rate rose markedly when the corrosion rate fell within 5–10%. Load-bearing capacity fell to 65.4% of the original value at a corrosion rate of 20%. The welded–bolted specimens exhibited a gradual and moderate reduction over the 0–20% corrosion rate range. The ultimate capacity retained 74.5% of the original value at a corrosion rate of 20%. The fully bolted specimens experienced the most severe degradation. These specimens showed a total capacity reduction of 48.83%. Load-bearing capacity degradation for these specimens was stage-dependent: a 3.37% decrease occurred in the 0–5% range; a 22.5% decrease occurred in the 5–10% range; and the decline accelerated in the 10–20% range. The reduction further increased to 31.34% in the 15–20% range. These values indicated severe internal joint damage and showed that mechanical performance approached the limit state as corrosion advanced.
Although the degradation rate varied among the three connection configurations, a more pronounced reduction in load-carrying capacity was observed around the 10% corrosion level. Therefore, within the investigated range, approximately 10% corrosion may be regarded as an indicative transition level, beyond which the deterioration in structural performance became more evident.
Figure 11d compares the variation in the ultimate load reduction rate of the three connection types with the corrosion rate, and reveals the obvious difference in their sensitivity to corrosion damage. Corrosion affects the ultimate load mainly by weakening the catenary effect. For bolted specimens, when the corrosion rate is less than 5%, the ultimate load reduction rises slowly, and when the corrosion rate exceeds 10%, the ultimate load reduction rises sharply. At a corrosion rate of 20%, the ultimate load reduction rate is the highest among the three, indicating that its bearing capacity is most affected by corrosion. The welded sample is between the two, showing a relatively smooth trend with no obvious turning point; its decay rate under high corrosion conditions is still lower than that of bolted specimens, indicating that its performance degradation is more moderate. In contrast, with the corrosion of the bolt-welding specimen, the decay rate increases the slowest, and the slope is the smallest in the whole range. It consistently maintains the lowest reduction level, reflecting the best retention of load-carrying capacity among the three types.
In summary, as corrosion deepens, the performance gap among the three types widens progressively. Corrosion most markedly reduced the load-bearing capacity of the fully bolted structures; the welded–bolted structure exhibited the best resistance to corrosion.
3.6. Equivalent Dynamic Capacity Assessment
To overcome limitations of static loading tests, Izzuddin et al. [
45] introduced a simplified energy balance-based method and confirmed its effectiveness [
46]. The method assumes that structural mechanisms and failure modes under dynamic and static loading are equivalent [
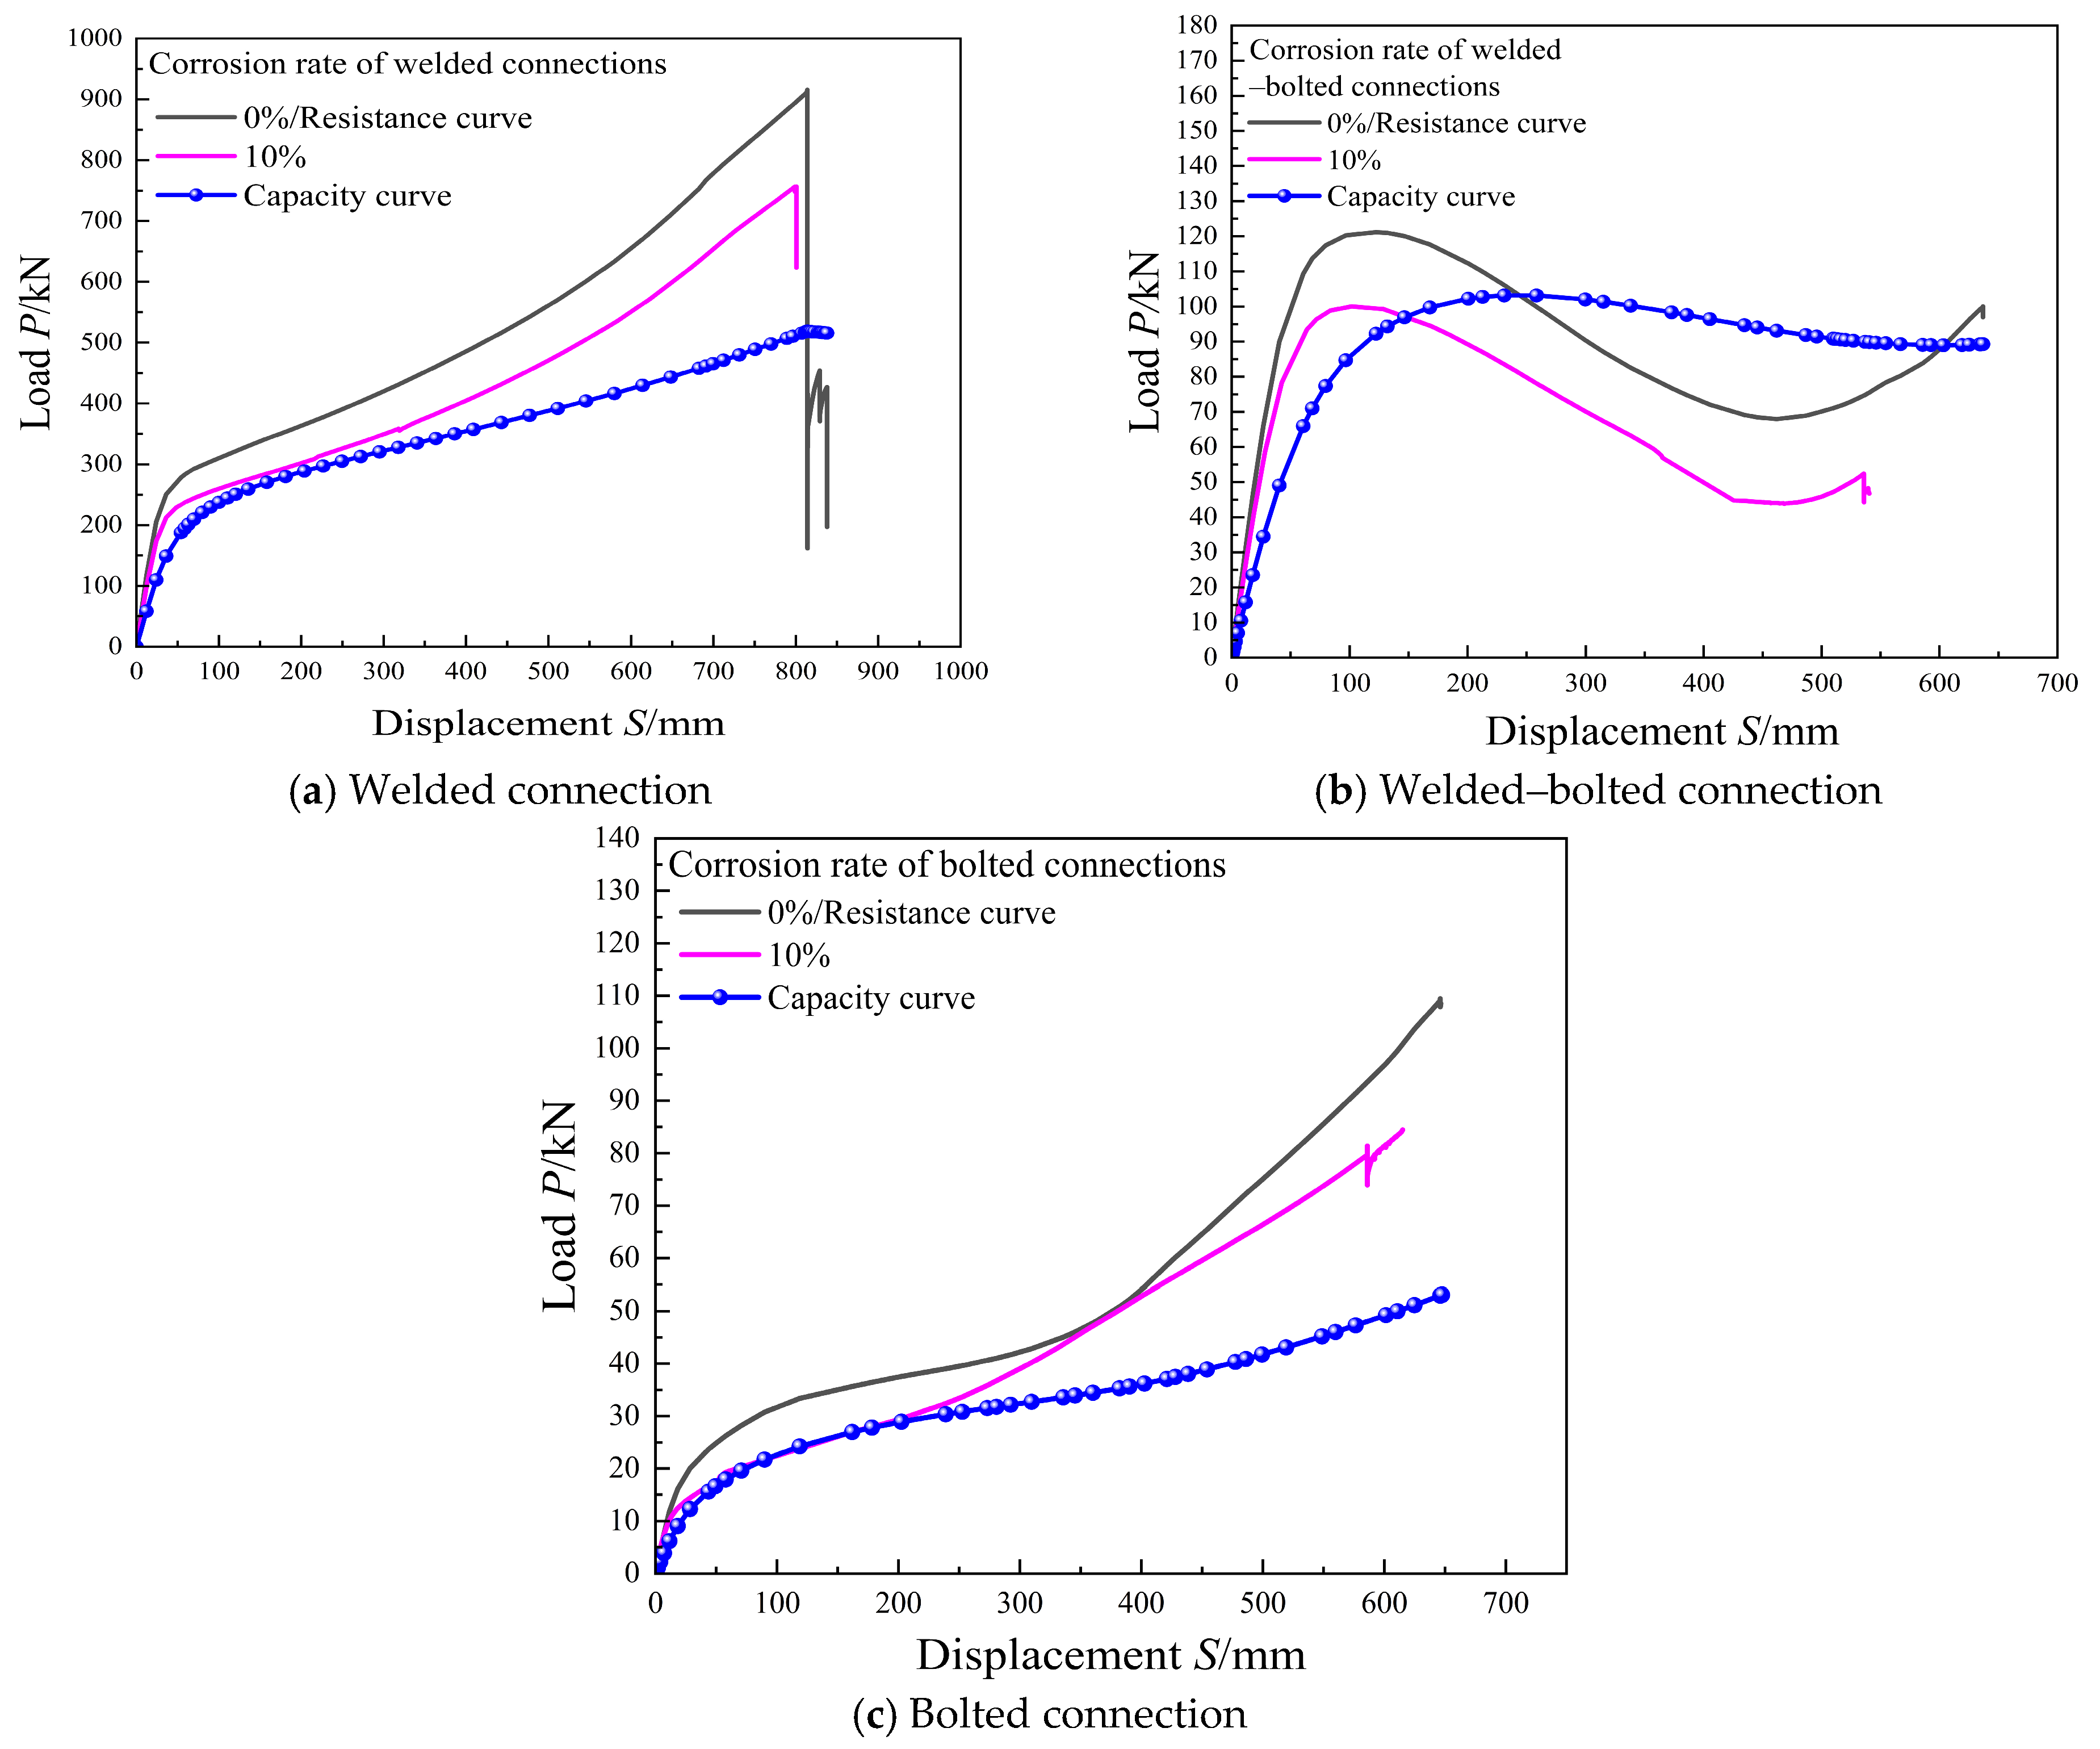
47]. It is underpinned by the principle that the work done by the dynamic load is entirely absorbed by the structure as internal energy. Accordingly, the load–displacement curves obtained from static FE analyses are transformed into equivalent dynamic capacity curves using Equation (14). The resulting equivalent dynamic capacities are presented in
Figure 12 and used to assess the progressive collapse resistance of the structures [
48].
where
Fd,i is the dynamic load corresponding to the same displacement under static loading;
F is the load-bearing capacity obtained from the static test;
ud,i is the displacement under static loading;
λd,i is the dynamic amplification factor.
Figure 12 presents the load–displacement curves obtained from static tests on the three uncorroded specimens, as well as the corresponding capacity curves converted using Equation (14). The converted capacity curves exhibited two main features: (1) Both the peak and ultimate loads fell below those of the resistance curves. (2) The post-peak softening descending branch was noticeably gentler. This mainly resulted from the transformation procedure applied to the original resistance curves. Furthermore, given the extremely short duration of dynamic loading, it is generally assumed in engineering applications that structural failure occurs when the dynamic load reaches its maximum value. As shown in
Figure 12a, the equivalent dynamic capacity of the welded specimen increases rapidly at small displacements. After reaching an initial local peak, the capacity shows only a limited further increase before gradually decreasing. This non-monotonic displacement-dependent response arises from the energy-equivalent transformation of the static resistance curve, in which the equivalent capacity at a given displacement depends on the cumulative deformation work developed during the preceding loading process. Consequently, the effects of stiffness degradation, local damage, and post-peak resistance reduction embedded in the static response are distributed over a broader displacement range, resulting in a smoother but still distinguishable variation in the transformed capacity curve. For the welded–bolted specimen in
Figure 12b, the equivalent dynamic capacity also increases rapidly at small displacements and remains relatively stable after the initial peak. This plateau-like response indicates that the combined load-transfer contributions of the welded and bolted components enable the connection to retain a relatively stable resistance over a wider deformation range. In contrast, the fully bolted specimen in
Figure 12c develops its equivalent dynamic capacity more gradually with increasing displacement, reflecting a deformation-dominated response in which resistance is progressively mobilized with increasing deformation rather than concentrated around a distinct peak. Overall, the differences among the three curves reflect the combined influence of connection configuration, load-transfer mechanism, and large-deformation resistance development on the displacement-dependent evolution of the equivalent dynamic capacity.
In addition, at approximately 10% corrosion, the peak resistance of all three connection configurations approached the corresponding capacity-curve peak, indicating a marked reduction in resistance reserve. Within the investigated range, this corrosion level may be regarded as an indicative transition level for progressive collapse resistance.
4. Conclusions
(1) For the configurations considered, welded structures have the highest load-bearing capacity at 915.6 kN, the greatest among the three, but exhibit significant plastic deformation and brittle fracture. They exhibited high resistance capacity but relatively limited deformation tolerance after reaching the peak resistance. Strict welding quality control is required to prevent brittle failure. Bolted structures exhibited superior deformation accommodation capability but reduced load-bearing capacity. The welded–bolted composite structures achieved a more balanced response between strength and deformation accommodation, demonstrating favorable deformation capacity and energy absorption characteristics.
(2) Welded structures exhibited high initial stiffness but experienced significant stiffness degradation under large deformations. The stiffness level and degradation behavior of welded–bolted composite structures lay between those of welded and bolted structures. These composites combine the stiffness advantage of welding with the favorable load-transfer characteristics of bolting. Consequently, they are suitable for applications that require moderate stiffness and deformation. Bolted structures exhibited low initial stiffness and a rapid loss of deformation resistance during loading. But also showed deformation accommodation capability within the investigated loading conditions.
(3) Welded–bolted composite structures demonstrated the best overall mechanical performance, stiffness stability, and load-bearing potential, with higher safety, making them a reliable connection type. Even at a corrosion level of 20%, their ultimate load-bearing capacity remained 74.5%, with a cumulative loss of only 25.5%. The load-bearing capacity of welded structures exhibited a decline as the corrosion level increased, particularly once the corrosion level surpassed 10%. As corrosion deepened, the overall stiffness decreased the most. At a 20% corrosion level, the load-bearing capacity dropped to 65.4% of its original value, with a cumulative loss of 34.6%, and the stiffness degradation was the most pronounced, making them prone to premature brittle failure. Bolted structures suffered the most pronounced degradation in load-bearing capacity as a result of corrosion, with a total reduction of 48.83% in load-bearing capacity and the greatest impact on stiffness stability at a 20% corrosion level. For the configurations in this study, bolted connections exhibited higher sensitivity to corrosion-induced degradation, indicating the importance of considering corrosion effects in the assessment of similar connection systems.
(4) Among the three connection configurations considered, an approximately 10% corrosion level was associated with an evident transition in mechanical degradation. Within the investigated range, this corrosion level may be regarded as an indicative transition level for progressive collapse resistance and may provide a preliminary reference for corrosion inspection and maintenance planning of the investigated configurations.
(5) Future research may extend the present framework by considering a broader range of corrosion conditions and more complex corrosion distributions, conducting additional experimental investigations of different connection configurations, and performing further nonlinear dynamic analyses to broaden the assessment of progressive collapse behavior under various loading and deterioration scenarios.