1. Introduction
Buildings occupy a dual position in the climate transition. They are major contributors to global energy consumption and greenhouse gas emissions, while simultaneously constituting an infrastructure increasingly exposed to climatic stress [
1]. Global final energy demand in buildings continues to grow under the combined effects of urbanisation, rising living standards, and expanding access to thermal comfort [
2]. Climate change is reinforcing these pressures by altering outdoor thermal regimes, intensifying heatwaves, and reshaping the seasonal balance between heating and cooling demand [
3]. Space cooling, in particular, is emerging as the fastest-growing building end-use worldwide, extending cooling seasons and amplifying peak electricity demand in warm climates [
1]. This shift toward cooling dominance exposes a structural challenge for building regulation. Most thermal regulations implicitly assume climatic stationarity, relying on historical weather data as proxies for long-term building performance [
4]. However, rising mean temperatures and elevated night-time minima are progressively undermining this assumption [
5]. Consequently, a compliance verdict issued against a stationary climatic reference progressively loses its representativeness of the thermal performance it was intended to ensure. In this study, we refer to this progressive loss of correspondence as the compliance–performance gap (CPG). The CPG is defined as the divergence between the climate-driven response of a regulatory criterion and the climate-driven response of the building’s operational thermal performance over the same transition from a reference climate to a projected future climate.
The Mediterranean basin represents one of the world’s most prominent climate-change hotspots, with warming rates exceeding the global average and heat extremes projected to intensify through the century [
6]. These dynamics are particularly critical for building performance, as prolonged heatwaves and reduced night-time cooling potential directly amplify cooling demand and overheating risk in dense urban environments. Despite this growing exposure, climate-related building energy research remains dominated by European case studies, while southern Mediterranean and North African contexts, characterised by distinct construction practices, socio-economic conditions, and regulatory frameworks, remain comparatively underrepresented [
7]. Within this regional context, Algeria faces a convergence of climatic, demographic, and energy-system pressures. Indeed, rapid population growth and decades of mass housing programmes have produced extensive standardised residential developments across the country [
8], resulting in a housing stock of nearly 10 million dwellings [
9] that now accounts for approximately 46% of the national final energy consumption [
10]. These programmes rely on reproducible architectural typologies deployed at a large scale, creating long-lived infrastructure whose thermal performance will shape national energy demand trajectories for decades. Moreover, national housing projects indicate that approximately 1.4 million additional dwellings are planned for construction in the coming decade [
9], amplifying the long-term impact of current regulatory assumptions and underscoring the need to evaluate these standardised residential models before large-scale deployment.
Against this infrastructural context, recent national assessments indicate that Algeria’s mean surface temperature increased by approximately 0.49 °C per decade between 2000 and 2023, compared with a global average of 0.37 °C per decade over the same period [
11]. Over the same period, cooling degree days rose by about 35% while heating degree days declined significantly, reflecting a structural rebalancing of thermal demand and a rapid shift in climatic boundary conditions that are relevant to building performance. Concurrently, high temperature exposure is projected to reduce the operational reliability of a large share of Algeria’s gas-fired power generation fleet by mid-century [
11], increasing peak-period system stress during cooling-dominated periods. This compounds the vulnerability of the electricity system to climate-driven demand growth and highlights the importance of demand-side regulatory strategies in mitigating future grid stress. Despite these converging pressures, the thermal performance of Algerian residential buildings remains governed by the national thermal regulation DTR C3.2/4, which defines a single, mandatory prescriptive compliance pathway. Compliance is assessed through global heat-loss and heat-gain indicators applied to the building envelope, calculated under boundary conditions derived from historical climatic data. In this context, misalignments between regulatory assumptions and future climatic conditions may contribute to systemic inefficiencies in the housing stock, highlighting the need to assess the climate resilience of current thermal regulations. This study quantifies the CPG for a formally compliant Algerian residential archetype under projected climates. It reframes the evaluation of thermal regulation under climate change as a building-performance verification problem with direct consequences for regulatory design and, ultimately, as a governance problem, since technical performance can deteriorate while formal conformity is preserved, creating institutional lock-in within static regulatory frameworks.
The study is guided by two research questions: (RQ1) How do the regulatory compliance response and the operational thermal-performance response of an Algerian residential archetype diverge under projected future climate scenarios? (RQ2) Which characteristics of the building and of the regulatory verification framework explain this divergence? Three objectives guide the investigation: (i) to quantify the CPG for a representative archetype of Algeria’s public housing programme (AADL) in Algiers (Köppen Csa) under CMIP6 projections (SSP2-4.5 and SSP5-8.5 for the 2050 and 2080 horizons) by comparing the regulatory compliance response with the time-integrated thermal-performance response defined in
Section 3.5; (ii) to identify the building-related and regulatory-verification mechanisms through which formal compliance persists while energy use and thermal comfort performance deteriorate; and (iii) to propose a staged regulatory transition framework for adapting prescriptive thermal codes to changing climatic conditions in comparable Mediterranean contexts. Three objectives guide the investigation: (i) to quantify the CPG for a representative archetype of Algeria’s public housing programme (AADL) in Algiers (Köppen Csa) under CMIP6 projections (SSP2-4.5 and SSP5-8.5 for the 2050 and 2080 horizons) by comparing the regulatory compliance response with the time-integrated thermal-performance response defined in
Section 3.5; (ii) to identify the building-related and regulatory verification mechanisms through which formal compliance persists while energy use and thermal comfort performance deteriorate; and (iii) to propose a staged regulatory transition framework for adapting prescriptive thermal codes to changing climatic conditions in comparable Mediterranean contexts. To this end, the archetype is evaluated using official Algerian regulatory procedures combined.
To this end, the archetype is evaluated using official Algerian regulatory procedures combined with EnergyPlus simulations under both present and projected climatic conditions, enabling a direct comparison between compliance outcomes and dynamic performance indicators. The study thereby contributes to the evidence base for climate-adaptive building code reform. The following section reviews the existing literature on climate change impacts on building energy performance, thermal comfort, and regulatory adaptation.
2. Literature Review
2.1. Defining and Positioning the Compliance–Performance Gap
Several forms of performance gap must be distinguished. The energy performance gap compares predicted and measured values of the same performance quantity for a given building; its magnitude reflects construction quality, commissioning, system performance, occupancy and modelling assumptions [
12,
13,
14]. Acceptance of the concept has not produced agreement on its content: interpretations and methods vary widely across the literature [
15], and no unique or universally agreed definition of the term has been established [
14].
Within the literature, the most widely used classification distinguishes three variants by the baseline from which the prediction is drawn [
16]: the regulatory performance gap (RPG), in which the prediction comes from compliance modelling under standardised operating conditions; the static performance gap (SPG), in which a performance model under actual operating conditions is used; and the dynamic performance gap (DPG), in which a calibrated, longitudinally tracked model is used. The three differ in baseline but share a common structure: a model-based prediction is compared with a measurement, within a single climatic context, in order to diagnose a building.
The CPG proposed here is related to these concepts and is not put forward as a separate family of performance discrepancies; it extends the classification along a dimension none of them captures. The CPG is defined as the divergence between the climate-driven response of a regulatory criterion and the climate-driven response of the building’s operational thermal performance, over the same transition from a reference climate to a projected future climate.
The CPG shares its regulatory term with the regulatory performance gap, since both are built on the quantity computed by the official compliance procedure, and it differs in what that quantity is compared with and under what climatic conditions. The regulatory performance gap compares it with measured energy use within a single climate state; the CPG compares its climate-driven response with the response of the indicators defined above, across a climatic transition (
Table 1). Framed as such, the CPG concerns the declining representativeness of a regulatory instrument under a changing climate, rather than prediction error, execution quality, or construction non-conformity.
Two consequences follow from this position. The first concerns what is diagnosed. The regulatory, static and dynamic gaps quantify how far a given building departs from its prediction, and the failure they locate lies in the building or in its representation; the CPG quantifies how far a regulatory criterion departs from the thermal performance it is meant to guarantee. A building may satisfy the code with a widening margin while the indicators the code exists to protect deteriorate, and it is that divergence that the CPG measures. The second concerns the absence of a measured term. Both sides of the CPG are modelled, and necessarily so, since the climate against which the criterion is stress-tested has not yet occurred and no measurement of it can exist. The framework cannot therefore be validated against future observations; it can only be verified in the sense that the simulation engine and the models are shown to reproduce the physics they claim to reproduce, with baseline behaviour checked against present-day conditions before any projection is made (
Section 3.5.2).
Finally, the scope of the CPG is code-dependent. Its magnitude depends on the regulatory criterion of the test and on the operational-performance indicators selected for comparison. A regulatory criterion and a building-performance indicator may respond differently to the same climatic transition, because they may represent different temporal scales, physical processes, or performance objectives. The specific indicators, equations and comparison procedure used to quantify the CPG must therefore be adapted to the regulatory architecture under investigation. The purpose of the CPG is to stress-test the robustness of a regulatory criterion under climate change to establish whether it remains aligned with operational-performance indicators as climatic conditions evolve, and so to provide evidence on which future revisions can be based.
2.2. Climate Projections and Future Weather Data in Building Energy Research
Accurate assessment of building energy performance under climate change critically depends on how future climatic conditions are translated into boundary conditions that are suitable for dynamic simulations. Decisions regarding the selection of climate data sources, climate models, emission scenarios, downscaling techniques, and associated tools can significantly influence projected performance outcomes and regulatory compliance [
17].
Recent building energy research increasingly relies on General Circulation Models (GCMs) from the CMIP5 and CMIP6, combined with Representative Concentration Pathways (RCPs) and, more recently, Shared Socio-economic Pathways (SSPs) [
18,
19,
20]. Within CMIP6, SSP2-4.5 and SSP5-8.5 are widely used to bracket moderate- and high-emission futures, capturing both policy-relevant adaptation challenges and thermal stress scenarios [
20,
21]. These scenarios are particularly relevant for Mediterranean and semi-arid regions, where projected warming and heatwave intensification are pronounced [
6]. Weather file generation methods (morphing, stochastic generation, and regional climate modelling) differ in their representation of variability and extreme events [
22,
23]. Comparative analysis demonstrates that identical climate inputs can yield divergent building performance outcomes depending on the method and tool implementation [
24,
25].
This heterogeneity introduces institutional ambiguity as compliance outcomes may depend on methodological selection as much as on intrinsic robustness. Regulatory frameworks calibrated against a single reference climate therefore embed implicit assumptions about climatic stationarity, revealing a key limitation of current regulatory practices under climatic uncertainty. Indeed, researchers increasingly advocate multi-file, multi-scenario approaches that are capable of stress-testing regulatory robustness under evolving climatic boundary conditions [
17,
26]. This shift raises institutional questions regarding how climate uncertainty is incorporated in, or excluded from, formal building energy verification systems.
2.3. Climate-Driven Transformations in Residential Energy Demand and Thermal Comfort
A substantial body of the simulation-based literature demonstrates that climate change is restructuring residential energy demand by reducing space heating requirements and rapidly increasing cooling consumption. This shift is particularly pronounced in Mediterranean climates, where cooling demand growth is sufficient to reverse historically heating-dominated energy balances [
19,
27,
28]. Across sixteen Mediterranean cities, cooling demand increases by up to 137% by 2050 under RCP 8.5, whereas heating reductions do not exceed 63%, confirming an asymmetric seasonal transformation [
29]. Comparable patterns are reported in the MENA region, where cooling demand is projected to rise by 39% in Egypt under the A2 scenario by 2080, by about 60% in Jordan and by 24% in the United Arab Emirates, while heating demand declines by roughly 11% [
18,
30,
31]. This redistribution reshapes seasonal load profiles and intensifies summer electricity peaks, altering infrastructure planning trajectories [
20,
32,
33]. Current regulatory codes are structurally misaligned with this demand transformation. Under the future climate, compliance reflects conformity with past climatic assumptions rather than lifecycle performance robustness, making the CPG both measurable and policy-relevant.
Beyond shifts in annual energy demand, climate change is linked to elevated risks of indoor overheating and thermal discomfort. In Mediterranean climates, overheating metrics increase faster than cooling energy demand, indicating a growing disconnect between energy efficiency and occupant comfort. Using adaptive comfort criteria, Rodrigues and Fernandes [
29] report a 100–300% rise in annual discomfort hours by 2080 under RCP 8.5. Similarly, Domínguez-Amarillo et al. [
34] document a six to eight-fold increase in overheating hours in southern Spain, concentrated during prolonged heatwave sequences. The primary drivers of this overheating risk are consistently identified as rising night-time temperatures, heatwave frequency and duration, and cumulative heat exposure over successive days, which reduce nocturnal heat dissipation and promote heat accumulation within the building envelope [
35]. Evidence from North African contexts confirms the severity of these trends: residential buildings assessed under RCP scenarios show a limited ability to maintain acceptable indoor conditions under future climates [
36,
37].
While adaptive comfort frameworks and overheating metrics provide valuable tools for assessing these risks, they remain largely external to regulatory compliance procedures. Current regulations rely on simplified performance indicators or static comfort assumptions that do not account for cumulative heat exposure, night-time recovery limitations, or prolonged heatwave conditions [
34]. This reinforces the CPG from comfort and habitability perspectives, complementing the energy-based mechanisms discussed earlier.
2.4. Regulatory Adaptation and Policy Design Under Climate Uncertainty
Despite extensive documentation of climate-driven performance degradation, its interaction with formal compliance logic remains underexamined. This distinction is analytically consequential as performance decline does not necessarily result in compliance failure, whereas regulatory adequacy hinges on whether the current criteria remain effective under future conditions.
Most building codes operate as prescriptive policy instruments, anchored in simplified steady-state calculations and design-day verification procedures that are structurally insensitive to cumulative and time-dependent mechanisms associated with progressive warming [
38]. Attia et al. [
39] show that simplified overheating indicators embedded in European regulations fail to capture cumulative thermal stress. Similarly, Halai et al. [
40] confirm empirically that England’s overheating regulation, despite its explicit climate adaptation mandate, requires compliance against current weather files with no obligation to model future climate scenarios. This regulatory design creates an internal inconsistency between policy intent and verification procedure. Jenkins et al. [
41] demonstrate that compliance methods anchored in fixed design conditions systematically underestimate future overheating risk. Fereidani et al. [
42] and Tomrukcu and Ashrafian [
43] provide early evidence of code insufficiency and climate-resilient retrofit pathways under SSP scenarios.
From a governance perspective, building regulation is not merely a technical standard but a long-lived policy instrument that shapes the energy trajectory of the residential sector over multi-decadal horizons. Compliance outcomes influence envelope design, cooling-demand growth, peak load formation, and ultimately infrastructure planning requirements. When compliance frameworks are calibrated against stationary climatic references, they implicitly assume the persistence of historical boundary conditions. Under climate non-stationarity, this assumption introduces structural risk into the regulatory system itself. Policy instruments designed under stable assumptions may therefore exhibit path dependency and institutional inertia as environmental conditions evolve. Regulatory resilience thus depends not only on the stringency of technical thresholds, but also on the flexibility of verification architectures and revision cycles. Within this perspective, the CPG can be interpreted as a manifestation of policy instrument misalignment under climate uncertainty. Rather than a failure of building physics, it reflects a temporal and institutional misalignment between static compliance verification and dynamic climatic exposure. Addressing this misalignment requires shifting analytical attention from component-level thresholds toward the design logic of the regulatory instrument itself.
2.5. Knowledge Gap and Study Positioning
The reviewed literature reveals two enduring gaps at the nexus of climate–building research and regulatory governance. First, although simulation-based studies extensively document climate-driven performance degradation, the regulatory implications of these changes remain largely implicit. Second, North African and Southern Mediterranean contexts remain underrepresented in regulatory-focused climate research, despite concentrating the conditions where governance risk is likely to be most acute: accelerated warming, rapid cooling demand growth, expanding housing stocks, and prescriptive frameworks lacking adaptive recalibration mechanisms.
This study addresses both gaps through a governance-oriented assessment. By reapplying official Algerian compliance verification procedures under CMIP6 scenarios, it aims to operationalise and quantify the CPG, identify its emergence mechanisms, and propose a staged regulatory transition framework grounded in scenario-conditional performance thresholds. While empirically situated in Algiers, the analytical framework is methodologically replicable across comparable climatic and institutional contexts.
3. Materials and Methods
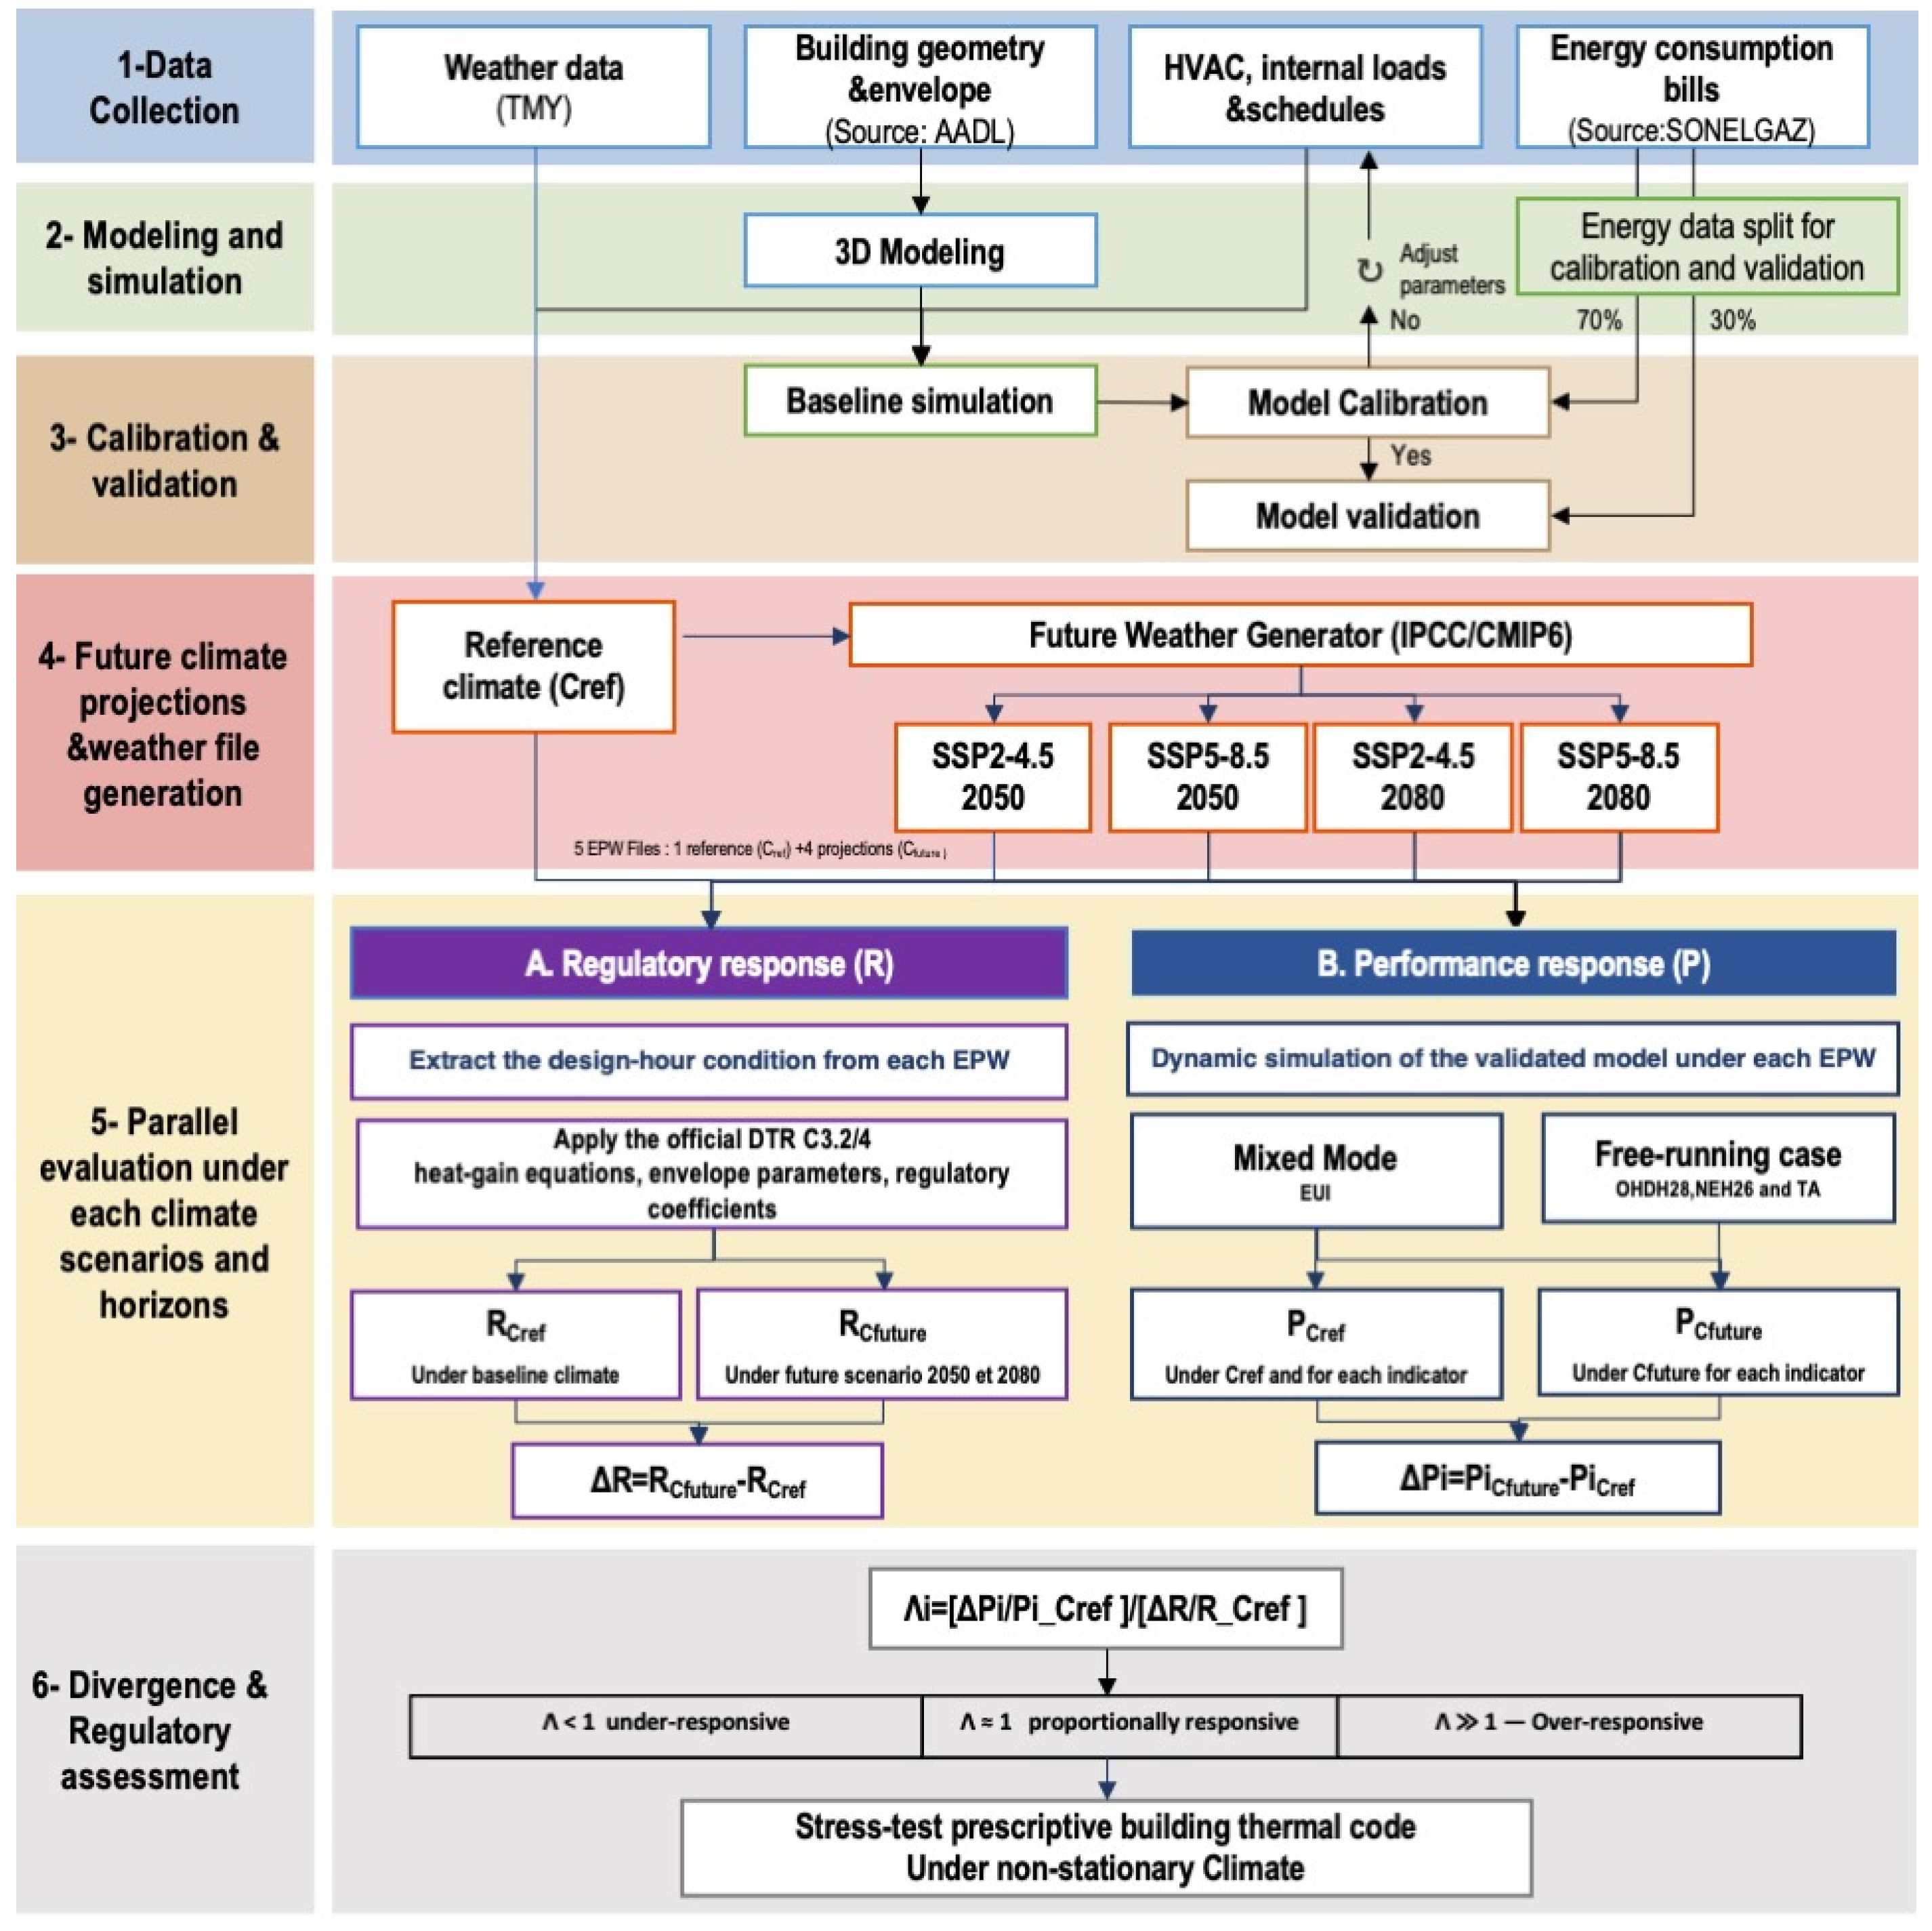
This study proposes an integrated methodological framework to test how Algeria’s thermal regulation (DTR C3.2/4) responds to a non-stationary climate. The framework does not assess compliance alone. It tracks two trajectories across the same climate transition: the regulatory response, given by the envelope heat gain that the code computes, and the performance response, given by the dynamic thermal and energy behaviour of the same building. The divergence between these two trajectories operationalises the CPG. The workflow comprises six stages (
Figure 1).
Stages 1 to 4 are sequential; stage 5 is deliberately parallel: (1) Data collection of regulatory requirements, building typology data, measured energy consumption, and baseline climate datasets; (2) modelling a representative residential Archetype reflecting typical AADL construction practices and envelope characteristics, verified as compliant with DTR C3.2/4; (3) model calibration and validation using population-level energy consumption data to align modelled and observed performance; (4) generating morphed weather files based on CMIP6 projections under SSP2-4.5 and SSP5-8.5 scenarios for mid-century (2050) and end-of-century (2080) horizons; (5) parallel evaluation of the regulatory response and performance response under each climate state; and (6) for each indicator, the divergence ratio compares the relative response of the performance indicator with the relative response of the regulatory quantity.
The framework is designed to stress-test DTR C3.2/4 under future climate conditions by comparing the regulatory and performance responses to the same climate signal. Although the findings are specific to the Algiers case, they provide an empirical basis for assessing the responsiveness of the regulation to a changing climate and for identifying the aspects that would require revision.
3.1. Case Study and Building Typology
3.1.1. Study Area
This study focuses on the city of Algiers, a coastal Mediterranean city, as a case study for regulatory stress-testing under climate change. The city combines three structural conditions of relevance: accelerated warming in the southern Mediterranean hotspot [
6], rapid expansion of the residential building stock under a prescriptive compliance framework, and a documented shift from heating- to cooling-dominated energy demand already observable in national consumption data [
11].
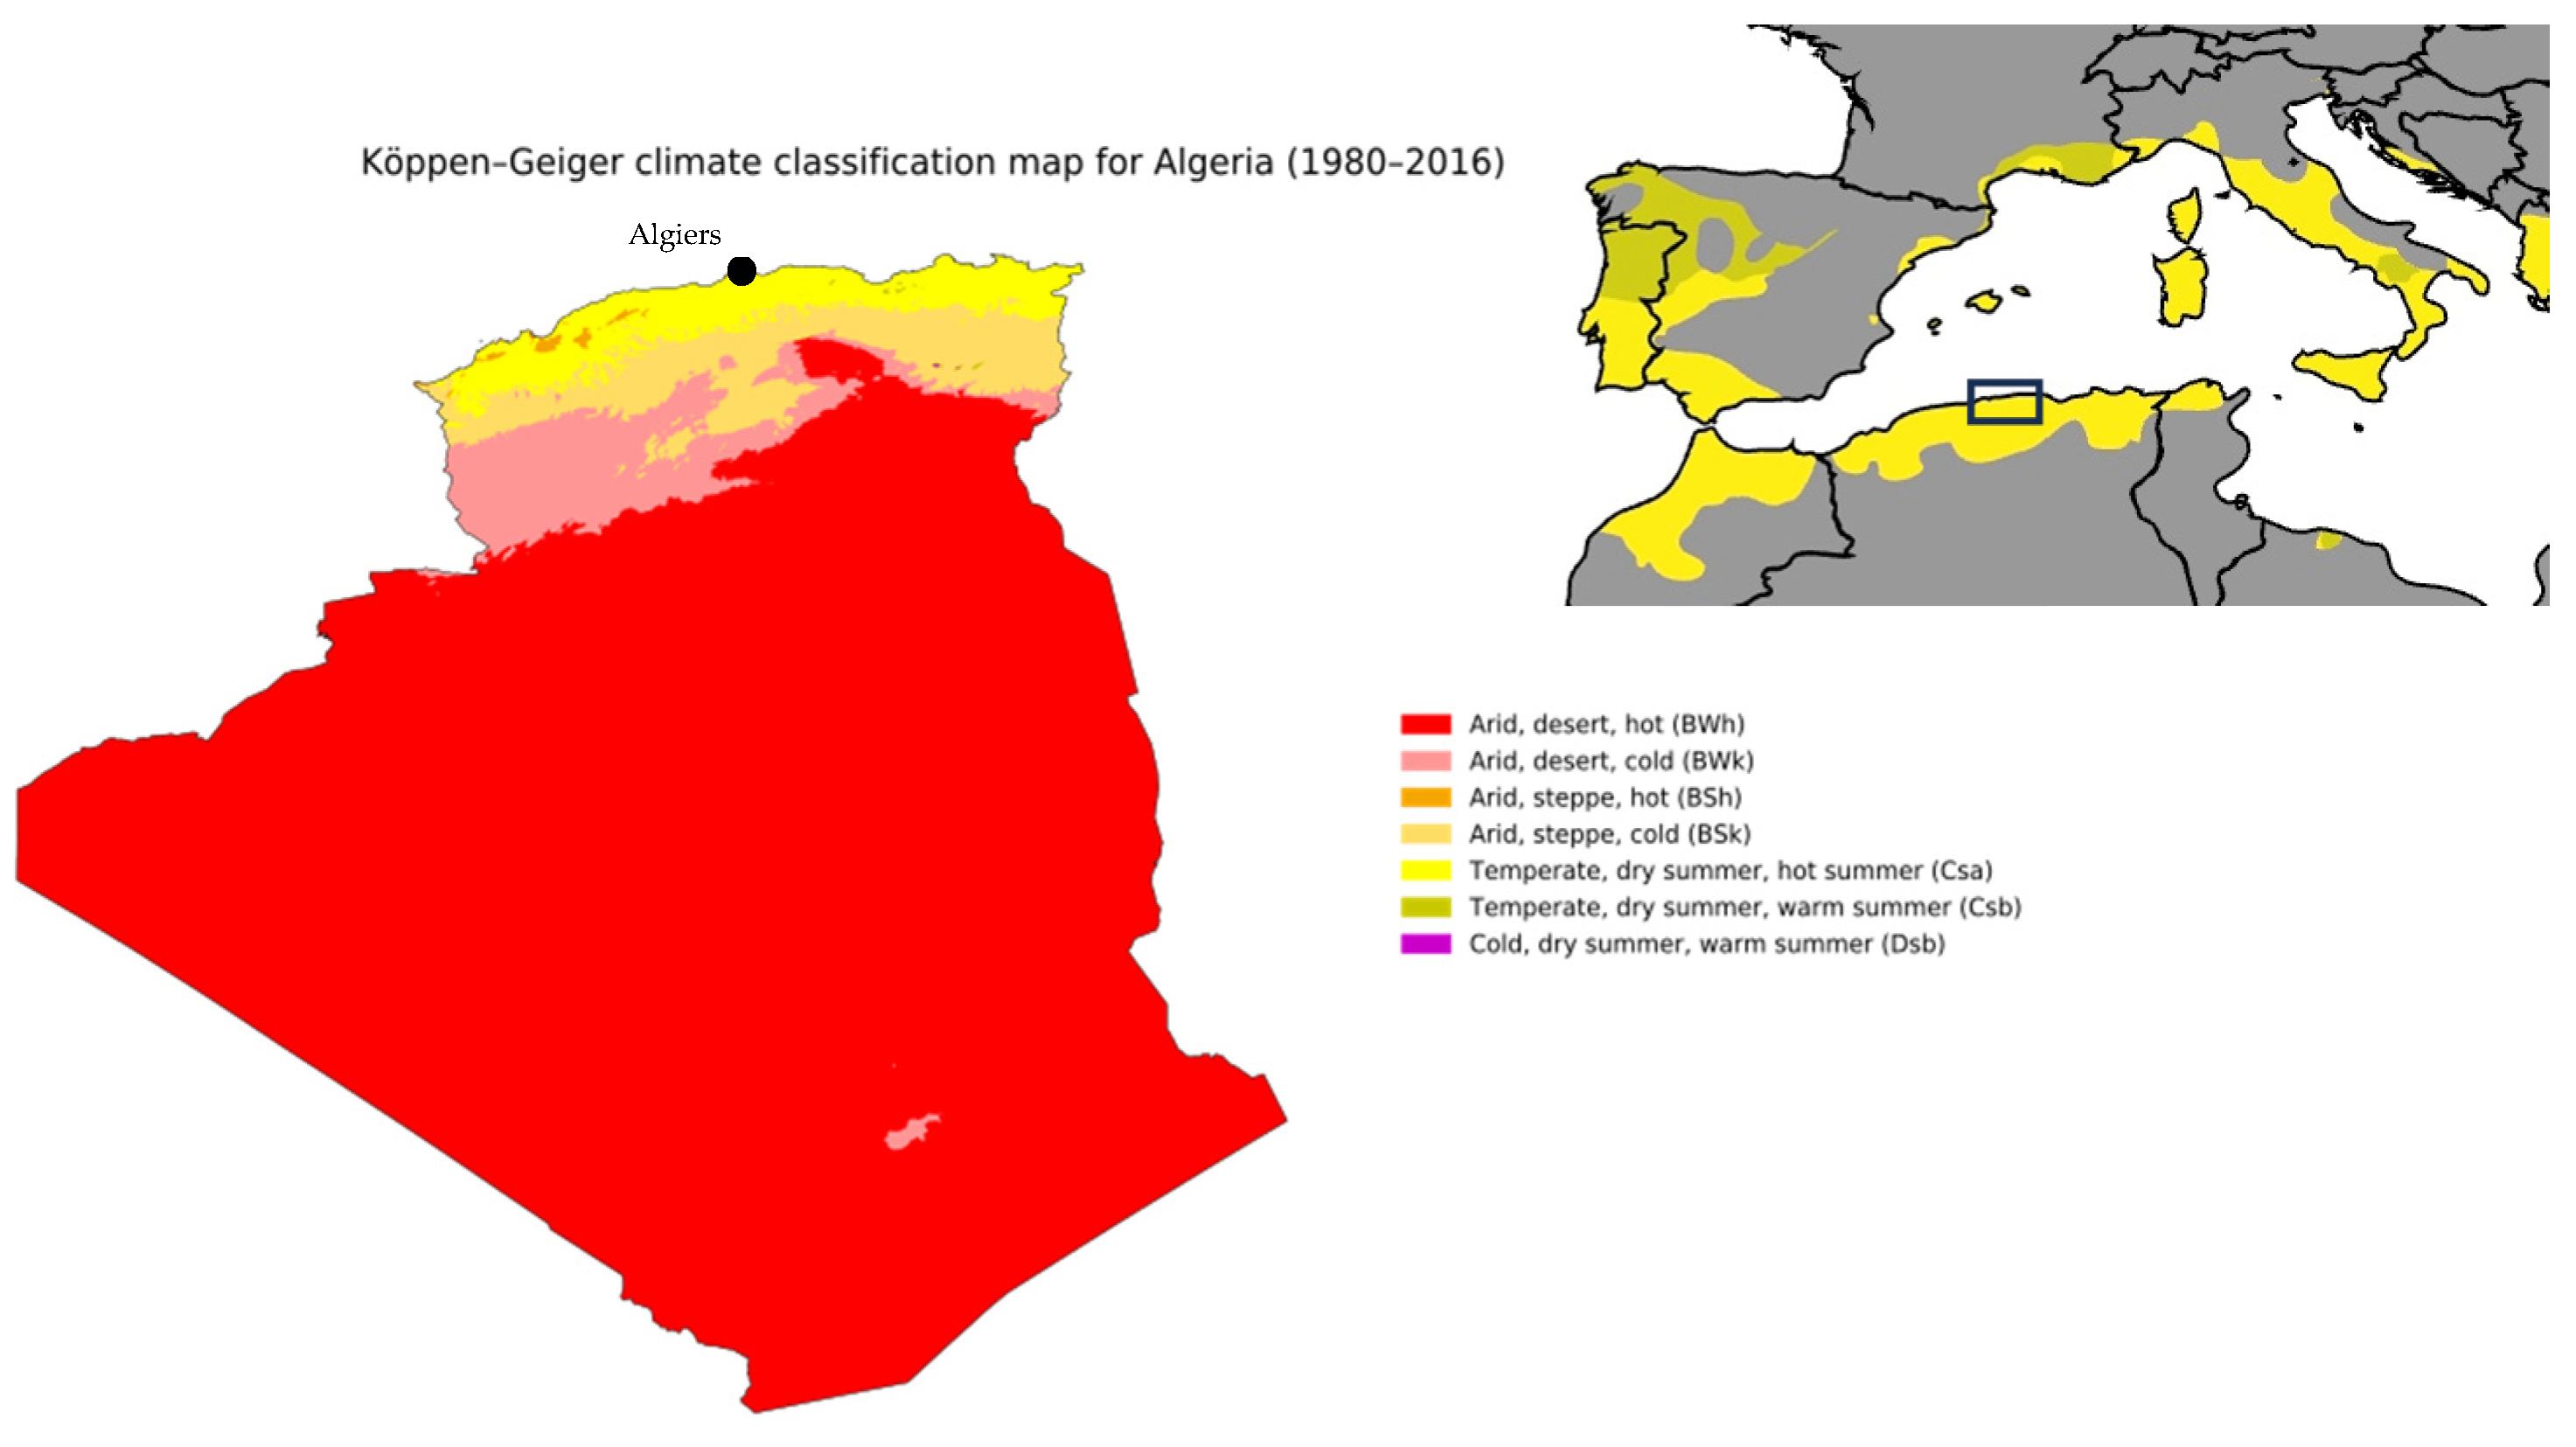
Climatically, Algiers is classified as Köppen–Geiger (Csa), characterised by hot, dry summers and mild, humid winters (
Figure 2). This climate typology spans across a broad arc of southern Mediterranean and North African cities, which exhibit similar thermal exposure patterns with predominantly prescriptive regulatory frameworks [
44]. In such contexts, compliance verification may progressively fail to reflect actual building performance as cooling demand intensifies.
The selection of Algiers was additionally motivated by the availability of a homogeneous measured residential energy consumption dataset enabling robust model calibration, which is currently limited in other Algerian climatic zones. Within this climatic zone, the Sidi Abdellah district was selected as a representative case study for AADL (Agence nationale de l’Amélioration et du Développement du Logement) housing typologies.
3.1.2. Building Typology Selection
Located approximately 25 km southwest of central Algiers, the new town of Sidi Abdellah has undergone significant development since 2016 through the national housing programme implemented by the government agency AADL. In Algeria, AADL refers to large-scale housing programmes, which focus on developing affordable standardised apartments to middle-income households. With 502,776 units delivered nationally to date and approximately 1.4 million additional units planned for the coming decade [
9], this typology is conditioning national residential energy demand trajectories for the forthcoming 50 years or more, making the regulatory adequacy of the AADL typology under future climates a question of direct energy governance relevance.
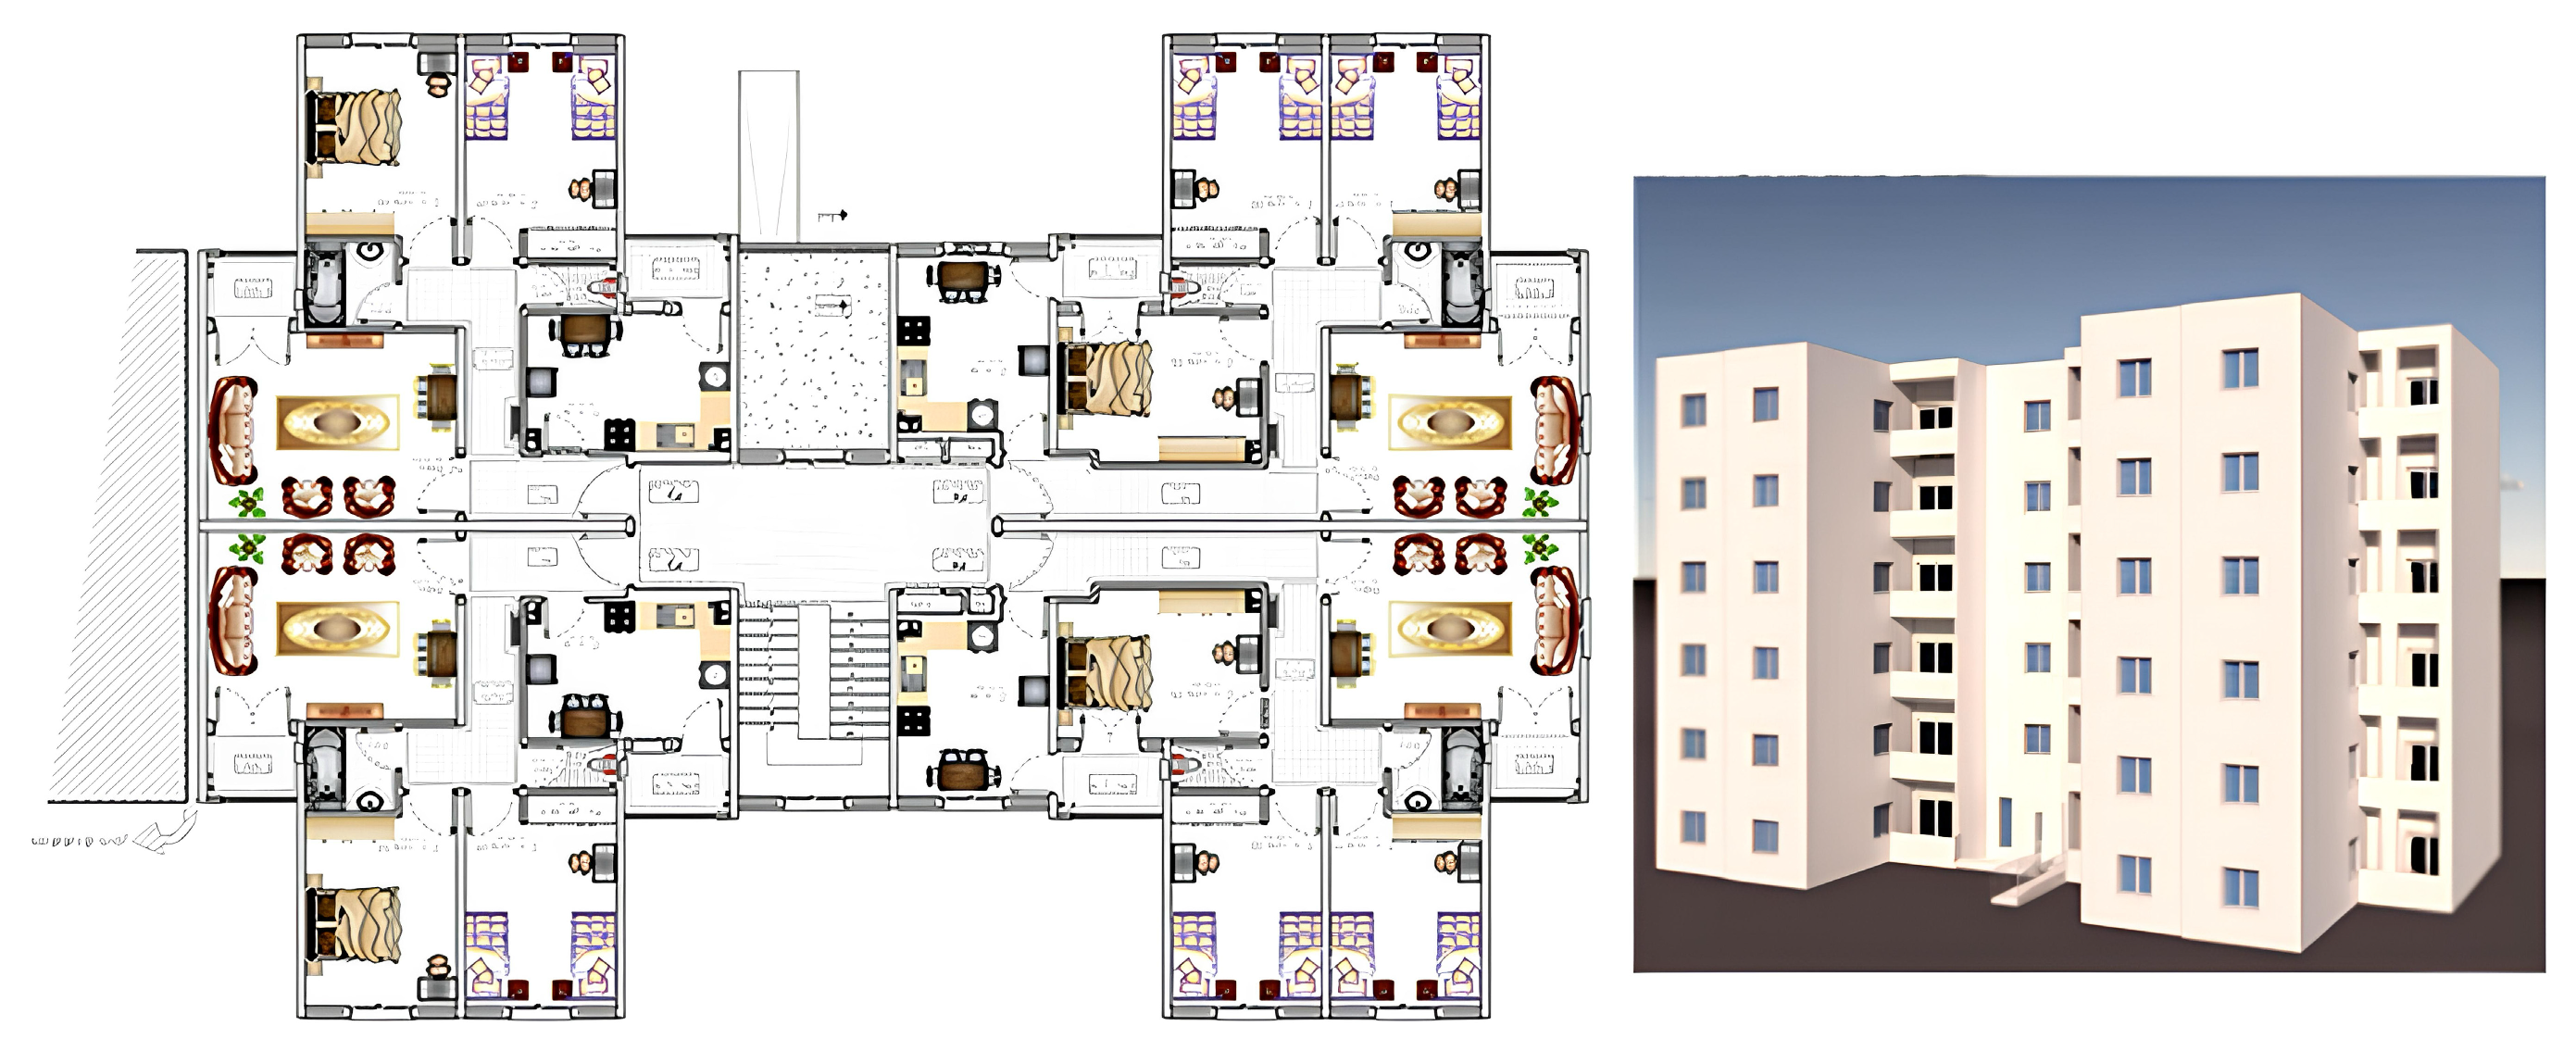
National planning guidelines prescribe the following distribution within residential developments: a maximum of 20% F2 units (50 m
2), a minimum of 50% F3 units (70 m
2), and a maximum of 30% F4 units (85 m
2), with a tolerance of ±3% (
Figure 3). This regulatory distribution structurally centres the housing stock on the F3 typology, making it representative of the median dwelling surface in recent public collective housing. The simulation model represents a typical F3 apartment (70.29 m
2 net floor area) occupied by five residents, corresponding to the average household size in Algerian collective housing [
46].
The reference typology was selected based on both its representativeness and the availability of reliable measured energy consumption data for 298 apartments sharing identical construction characteristics and locations. The AADL Program’s high degree of standardisation in terms of architectural design and material specifications makes this typology particularly suitable for energy analyses. As a statistical archetype, the model represents the central tendency of the stock, not the performance of a specific dwelling. As the building fully complies with the DTR C3.2/4, it provides an appropriate baseline for assessing potential divergence between formal regulatory compliance and projected operational performance.
3.2. Building Modelling
The reference apartment was modelled using Rhinoceros 3D (version 8) and translated into a dynamic energy model using Ladybug Tools [
47], with EnergyPlus (Version 25.1.0) as the simulation engine. Conditioned zones include living rooms and bedrooms, while service spaces (kitchen, bathrooms, and circulation areas) are modelled as unconditioned. This zoning reflects typical residential usage patterns and aligns with the archetype-based analytical scope.
3.2.1. Envelope Design and Thermophysical Properties
Envelope assemblies were derived from the official AADL technical specification and verified as compliant with DTRC3.2/4. Envelope constructions were modelled using a layer-by-layer approach with thermophysical properties assigned from standard material databases (
Table 2). U-values were computed by EnergyPlus from the assembled material layers, with surface thermal resistances defined according to ISO 6946:2017 [
48] under appropriate heat-flow orientations. Internal thermal mass associated with structural elements and internal partitions was explicitly accounted for through detailed material layer definitions.
The dynamic building energy model was developed independently of the thermal regulation calculation procedure. The equivalent transmission coefficient defined by the DTR C3.2/4 was used only for regulatory compliance verification under winter and summer conditions. This separation ensures that regulatory conformity is benchmarked against a physics-based dynamic model, enabling explicit assessment of regulatory robustness under both current and projected climatic conditions.
3.2.2. HVAC System and Operation Conditions
Space conditioning was modelled to reflect common residential practices in Algiers; a mixed-mode strategy combining natural ventilation and mechanical cooling was assumed. Natural ventilation was activated when outdoor air temperature was lower than indoor air temperature and indoor air temperature remained below 25.5 °C, and disabled during periods of mechanical cooling to prevent simultaneous operation. Infiltration was set at 0.7h
−1, consistent with values reported for residential buildings in the Mediterranean climates (
Table 2). Mechanical cooling was provided by individual split air conditioning units (setpoint 26 °C, 2 °C deadband, COP 3.0). Space heating and domestic hot water were supplied by individual 24 kW gas-fired boilers with intermittent thermostat control (20 °C occupied, 18 °C unoccupied) and a seasonal efficiency of 0.9 (
Table 3). Occupancy schedules were derived from ISO 18523-2:2018 [
49] and calibrated against observed consumption (
Table 4). After calibration, all HVAC, ventilation, and occupancy parameters were held constant across baseline and future scenarios to isolate climatic effects.
Two simulation cases were run for each climate scenario, sharing identical envelope properties, occupancy schedules, internal gains and infiltration. In the conditioned case, mechanical cooling operates as described above; this case provides the energy use intensity reports in
Section 4.2 and
Section 4.4. In the free-running case, mechanical cooling is disabled and the zones are tempered by natural ventilation alone; this case provides the thermal comfort indicators reported in
Section 4.6.
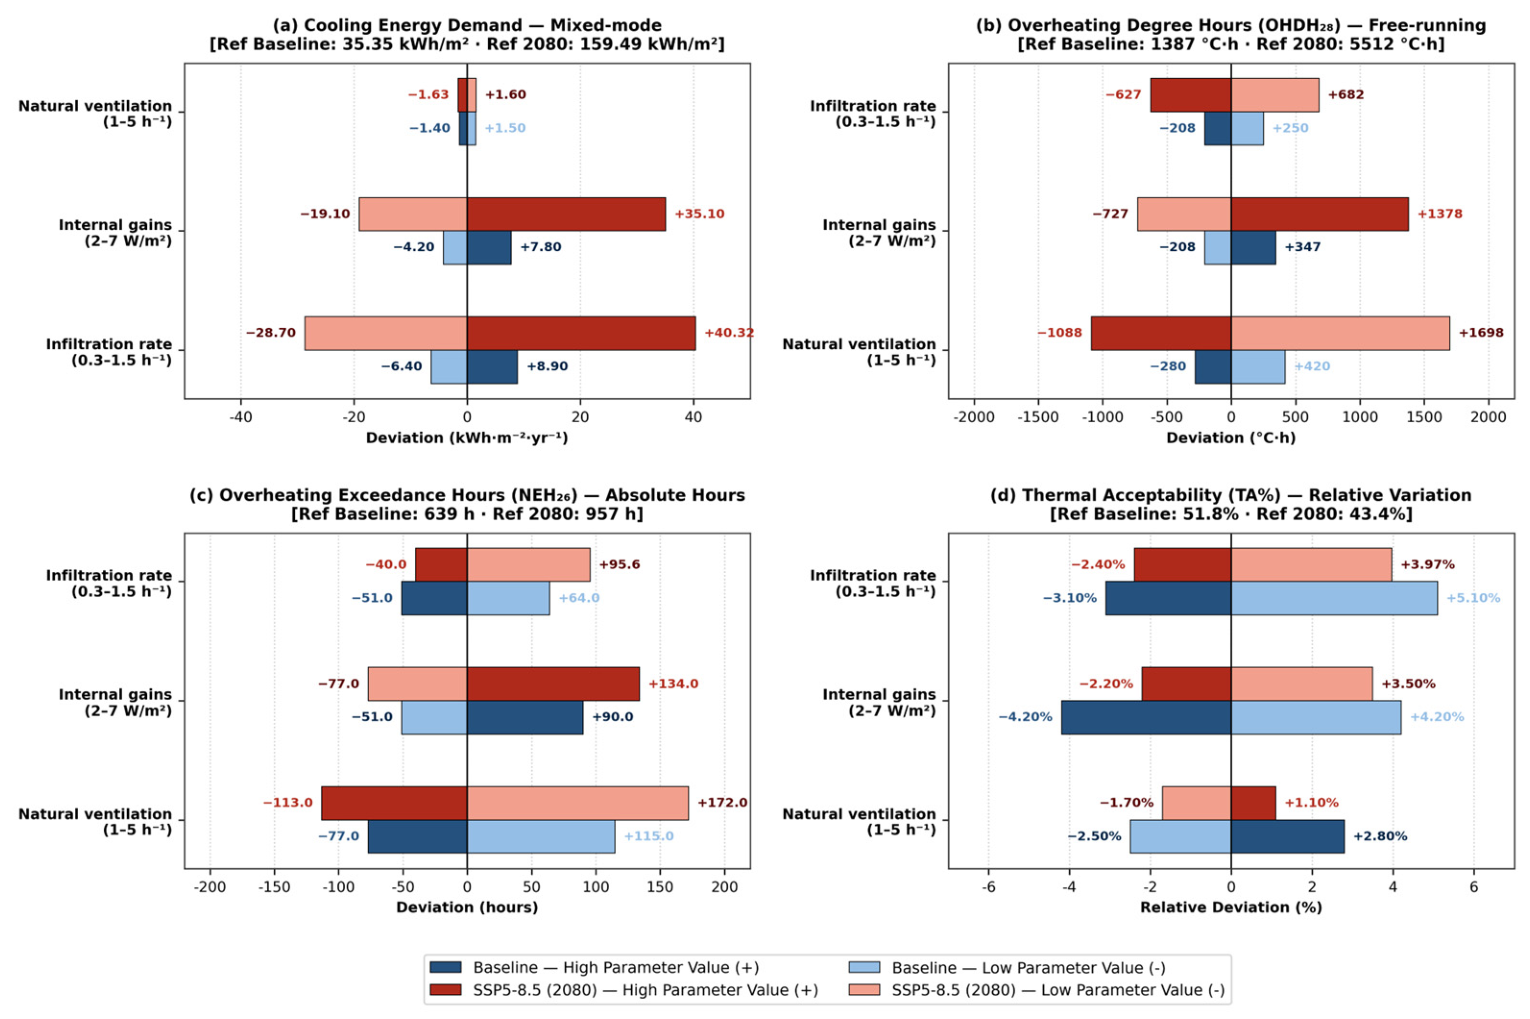
To test how results change under different assumptions, a one-at-a-time sensitivity analysis was performed on the three operational parameters that are least constrained by the calibration data: infiltration rate (0.3–1.5 h−1), internal heat gains (2–7 W·m−2) and natural ventilation air change rate (1–5 h−1). Each was varied independently around the calibrated reference case under both the baseline climate and SSP5-8.5 (2080), and evaluated against cooling EUI and the three free-running thermal performance indicators.
3.3. Model Calibration and Validation Procedure
Model calibration and validation used measured electricity and natural gas consumption obtained from the national utility company (Sonelgaz) for AADL housing units located in the same development as the reference archetype. Calibration was performed at quarterly resolution corresponding to the official billing cycle in Algeria (
Table 5), representing the highest temporal granularity available for household energy consumption data. To enhance statistical robustness and mitigate low sample sensitivity at quarterly resolution (
n = 4 per year), calibration targets population-level representativeness rather than individual household behaviour, consistent with the archetype-based and regulatory-oriented scope of the study [
50].
Of the 298 apartments with available records, 177 belong to the dominant electricity and natural gas consumption clusters identified in a prior statistical analysis of the same stock [
51]. The remaining 121 dwellings, distributed across minority clusters, were not retained, so the archetype represents the dominant energy-use profiles rather than a mixture of heterogeneous operating regimes. This choice improves the interpretability of the calibrated parameter set, but it has a consequence for the reported results. Indeed, the archetype reflects the central tendency of the stock and does not represent the upper tail of consumption. Only uncertain operational parameters (occupancy density, occupancy schedules, internal heat gains, and HVAC patterns) were adjusted within physical bounds. Envelope properties and system efficiencies were kept fixed in accordance with AADL technical specifications. The calibrated model, therefore, represents a building that is simultaneously compliant with DTR C3.2/4 and representative of the central tendency observed in the measured consumption behaviour.
A total of 177 dwellings were divided into calibration (70%, 124 dwellings, n = 496) and validation (30%, 53 dwellings, n = 212) subsets. The calibrated parameter set was subsequently applied without modification to the validation subset, providing an independent assessment of model generalisability.
Model performance was evaluated using the normalised mean bias error (NMBE) (Equation (1)) and the coefficient of variation in the root mean square error (CV(RMSE)) (Equation (2)). Because the calibration aims to derive a population-level (aggregated) archetype rather than reproduce dwelling-specific (disaggregated) consumption, model performance is assessed both across dwelling–billing-period pairs and against the population-mean series that the archetype is intended to represent. Residual diagnostics were also used to distinguish systematic seasonal effects from household-specific and within-household variability. These diagnostics are interpreted descriptively, not as a causal decomposition of behavioural, stochastic, or measurement error.
where
: measured energy consumption at quarter (i = 1,…,496);
: simulated energy consumption (archetype) at quarter I;
: mean of measured energy consumption;
: 496 (calibration simple: 124 units × 4 quarters);
: 3 (number of calibrated parameters).
3.4. Future Climate Model and Weather File Generation
Future climate projections were generated using CMIP6 data. Two shared socioeconomic pathways (SSPs) were selected: SSP2-4.5, representing an intermediate mitigation scenario, and SSP5-8.5, representing a high emission pathway. These two scenarios span the policy-relevant range of future climatic exposure from a mitigation-consistent pathway to an upper-bound stress-test condition and are assessed at mid-century (2050) and end-of-century (2080) horizons to capture both near-term regulatory implications and long-term structural risk.
Baseline climatic conditions were established using the EnergyPlus Typical Meteorological Year (TMY). Weather morphing was subsequently performed using the Future Weather Generator (FWG) [
52]. One composite ensemble-mean file was generated for each scenario and horizon. Published CMIP6 assessments provide useful context for the robustness and magnitude of projected warming over North Africa. Under SSP5-8.5, end-of-century warming has been reported at approximately 5.0 °C, with a 66% range of 4.36–6.37 °C. The sign and broad magnitude of warming remain consistent across model assessments and analyses based on better-performing model subsets [
53]. This supports the interpretation that the warming signal used here is physically robust, while uncertainty remains regarding its local magnitude and temporal evolution. The simulations reported below therefore represent the response to that central signal; the inter-model spread was not propagated through separate simulations, and the resulting impacts are scenario-conditioned ensemble-mean responses rather than probabilistic ranges.
Two documented properties of the morphing method further delimit the interpretation of the results [
22,
24]. The procedure retains the hourly sequence of the baseline year as the carrier of timing and variability, so it does not represent individual future heat events, compound extreme events, or changes in the sequencing and persistence of weather systems. Changes in monthly means, daily temperature ranges, and the frequency of threshold exceedances were verified for each scenario and time horizon considered in this study.
The resulting hourly future EPW weather files, generated by the FWG, served as inputs for EnergyPlus simulations to quantify climate-driven changes in building energy demand and indoor thermal comfort. Heating and cooling degree days were computed from the EPW hourly dry-bulb temperature series using the daily mean method with fixed base temperatures of 18 °C (HDD) and 26 °C (CDD).
All simulations under future climates used the same calibrated archetype, material thermophysical characteristics, system efficiencies, and validated operational assumptions as the baseline case.
3.5. Performance Indicators and Thermal Comfort Metrics
Three categories of performance indicators are defined to operationalise the CPG: energy use intensity, which quantifies the magnitude of climate-driven demand shifts, and two families of thermal comfort indicators, which capture the cumulative and nocturnal dimensions of overheating risk that the DTR C3.2/4 verification procedure is structurally unable to detect. The selected indicators are not intended to be general building performance metrics but diagnostic tools designed to reveal aspects that the regulatory framework conceals.
3.5.1. Energy Use Intensity (EUI)
Building energy performance was assessed using heating and cooling energy use intensity (Equations (3) and (4)), expressed in kWh·m
−2·year
−1 and normalised by conditioned floor area. Heating and cooling demand were evaluated independently to capture seasonal shifts in energy balance under the future climate.
where
and
represent the annual space heating and cooling energy demand (kWh), respectively, and
is the conditioned floor area (m
2). The ratio of cooling to heating EUI across scenarios serves as a scalar indicator of the structural regime shift in residential HVAC demand.
3.5.2. Thermal Comfort Indicators
Thermal comfort is evaluated in the free-running case defined in
Section 3.2.2, in which mechanical cooling is disabled, so that the indicators characterise the passive thermal behaviour of the envelope independently of system operation. The operative temperature (
To) is used as the primary indoor environmental variable, as defined in Equation (5). Three complementary indicators are computed to characterise thermal discomfort across climate scenarios, each targeting a specific limitation of the DTR-C3.2/4. Overheating degree hours above 28 °C (OHDH
28) quantify the cumulative intensity of overheating over the summer season (June–September) (Equation (6)). The 28 °C threshold is selected because it represents the upper bound of the Category II comfort range in EN 16798-1:2019 [
54] for free-running residential buildings and aligns with overheating thresholds used in Mediterranean residential research [
34,
35].
Night-time exceedance hours (NEH26) count the number of summer night hours (22:00–06:00) during which To exceeds 26 °C (Equation (7)) and Thermal Autonomy (TA) measures the proportion of occupied hours (08:00–22:00) throughout the year during which comfort is maintained without mechanical cooling (Equation (8)).
The three indicators are complementary and hierarchically structured:
OHDH28 establishes the magnitude of cumulative seasonal overheating,
NEH26 isolates the nocturnal dimension that the DTR cannot register, and TA quantifies the long-run erosion of passive resilience that drives mechanical cooling dependency. Individually, each indicator captures a dimension of thermal risk that is invisible to the DTR C3.2/4 verification. Collectively, they constitute a time-integrated diagnostic instrument whose outputs, when compared to regulatory pass/fail status, make the CPG empirically measurable.
where
is the indoor air temperature and
is the mean radiant temperature. Indoor air velocities in occupied zones under natural ventilation are consistently below 0.2 m·s
−1, which satisfies the applicability conditions for operative temperature specified in ISO 7726:1998 [
55]. Both quantities are extracted directly from EnergyPlus hourly simulation outputs.
where
N is the total number of hourly timesteps in the season.
where
denotes the set of nocturnal timesteps.
where
denotes the set of occupied timesteps.
3.6. Regulatory Compliance Assessment Under Future Climate Conditions
The DTR C3.2/4 adopts a simplified prescriptive methodology based on global heat-loss and heat-gain indicators derived from surface-weighted thermal transmittance coefficients. For the heating season, compliance is verified by ensuring that the global heat-loss indicator does not exceed the regulatory reference value
within the tolerance margin specified by the regulation. For the cooling season, summer thermal performance is assessed by limiting envelope heat gains. Heat gains through opaque elements and glazed surfaces are calculated at 03:00 PM in July, which is defined by the regulation as being the most critical period of the cooling season. Regulatory compliance requires that the total heat gains remain below the reference threshold
(
Table 6). The summer compliance criterion is therefore based on a single-hour peak condition rather than on time-integrated thermal stress indicators.
To assess compliance under future climates, for each scenario and time horizon, the outdoor dry-bulb temperature and solar radiation values corresponding to July 15:00 were extracted directly from the scenario-specific EPW file and inserted into the official DTR C3.2/4 heat-gain equations. Compliance verification under future climates therefore reflects modifications in climatic boundary conditions only, without altering the prescriptive logic of the regulation.
The CPG is operationalised as a stress test of the regulatory criterion across a climatic transition. The same compliant archetype is evaluated under the reference climate and under each projected climate, and two responses are recorded at each climate state. The regulatory response R is the envelope heat gain computed at the prescribed verification point by the official DTR C3.2/4 procedure. The performance response P is given by the time-integrated indicators defined in
Section 3.5. Because warming acts on the cooling season, R is taken from the summer verification; the heating-season criterion is retained unchanged in the calculation but is not itself stress-tested here. Subscripts C_ref and C_future denote the reference and projected climate states. The gap is reported as the ratio of the two relative changes:
where ΔP = P_Cfuture−P_Cref, and ΔR = R_Cfuture−R_Cref.
Both terms are relative changes, so Λ is dimensionless and remains comparable across regulatory architectures that are expressed in different units. A value of unity indicates that the criterion and the indicator change at the same relative rate, while values above unity indicate that the indicator deteriorates faster than the criterion registers. Λ is a property of the transition considered and is computed separately for each indicator and each projected climate. It is defined only where the regulatory response changes: as ΔR approaches zero the ratio is unbounded, and in that regime the divergence is reported through the underlying changes in R and P rather than through Λ.
Λ is reported for the unbounded indicators. NEH26 and TA are bounded by the number of night hours in the cooling season and by 100% respectively, so a relative change loses meaning as either approaches its bound; these two are reported as levels. A gap is detected when the archetype remains formally compliant under a projected climate while its performance indicators deteriorate, and Λ quantifies the magnitude of that divergence.
4. Results
4.1. Calibration and Validation Results
Because the objective of calibration was to derive a population-level archetype rather than to predict dwelling-specific consumption, model performance was assessed at two levels: across individual dwelling–billing-period pairs and against the population-mean series represented by the archetype.
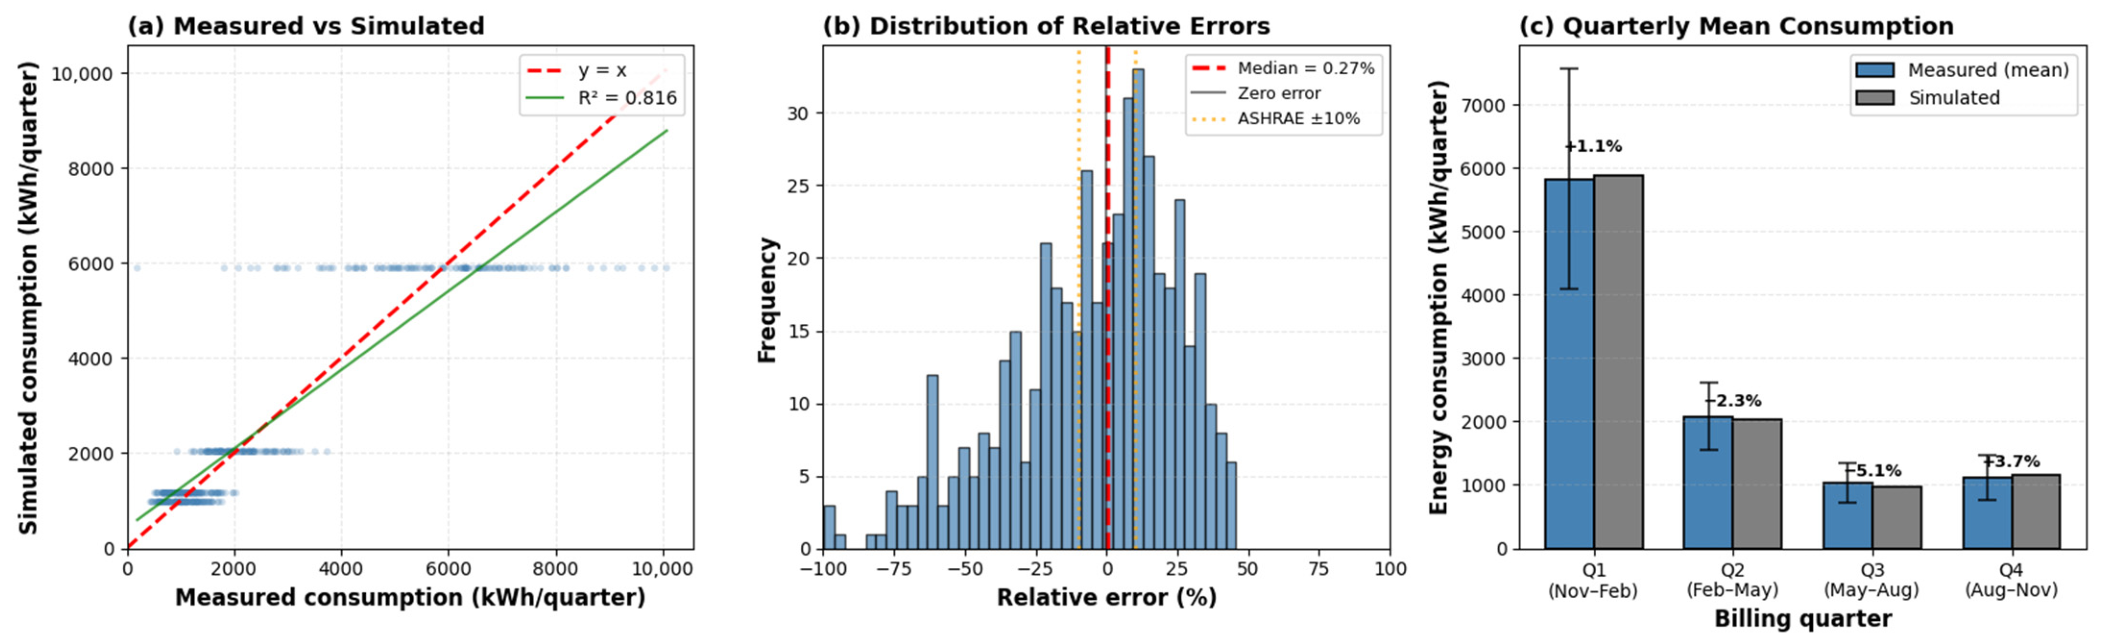
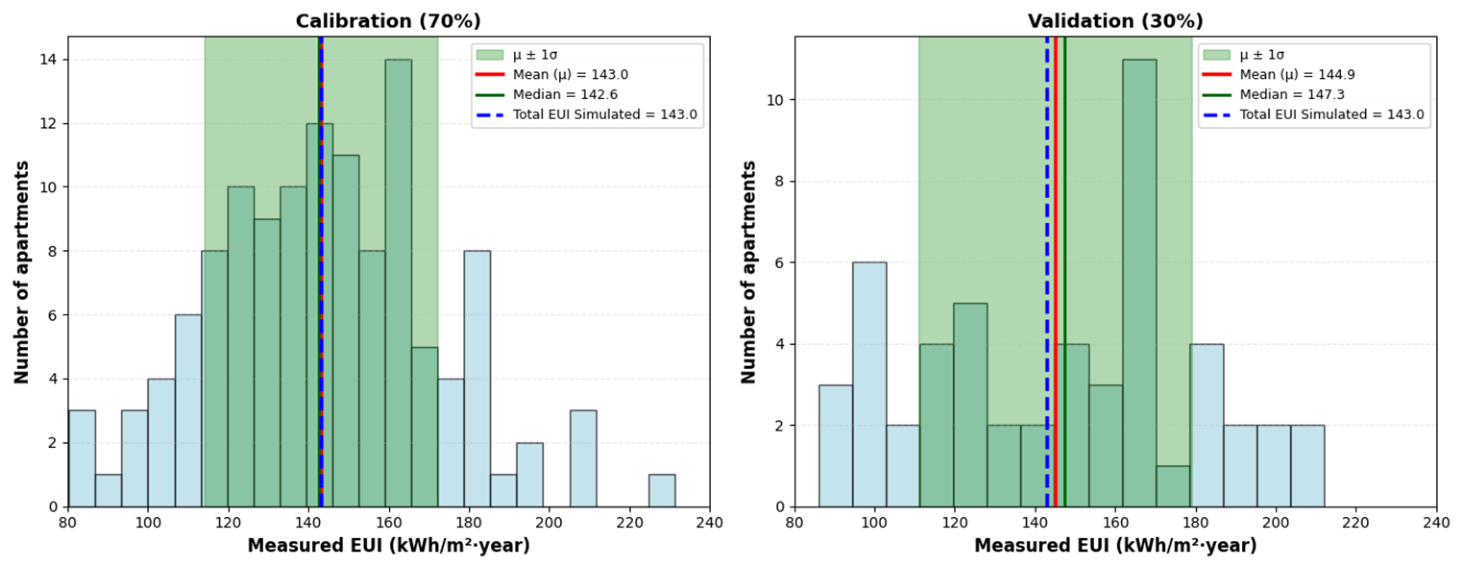
The model showed negligible population-level bias (NMBE = −0.03%; a negative value denotes over-prediction under the ASHRAE Guideline 14 convention). Across the 496 dwelling–billing-period pairs (four billing periods for each of the 124 dwellings), the median signed relative error was 0.27% and the coefficient of determination between simulated and measured values was R
2 = 0.82 (
Figure 4a,b). The fitted relationship departs from the 1:1 line at the upper end of the range, indicating under-prediction for the highest-consuming dwellings. At quarterly resolution, simulated mean consumption deviated from measured mean consumption by +1.1% in Q1, −2.3% in Q2, −5.1% in Q3 and +3.7% in Q4 (
Figure 4c). The simulated annual EUI was 143.04 kWh·m
−2·year
−1, against measured means of 142.99 kWh·m
−2·year
−1 for the calibration sample and 144.91 kWh·m
−2·year
−1 for the independent validation sample (
Figure 5).
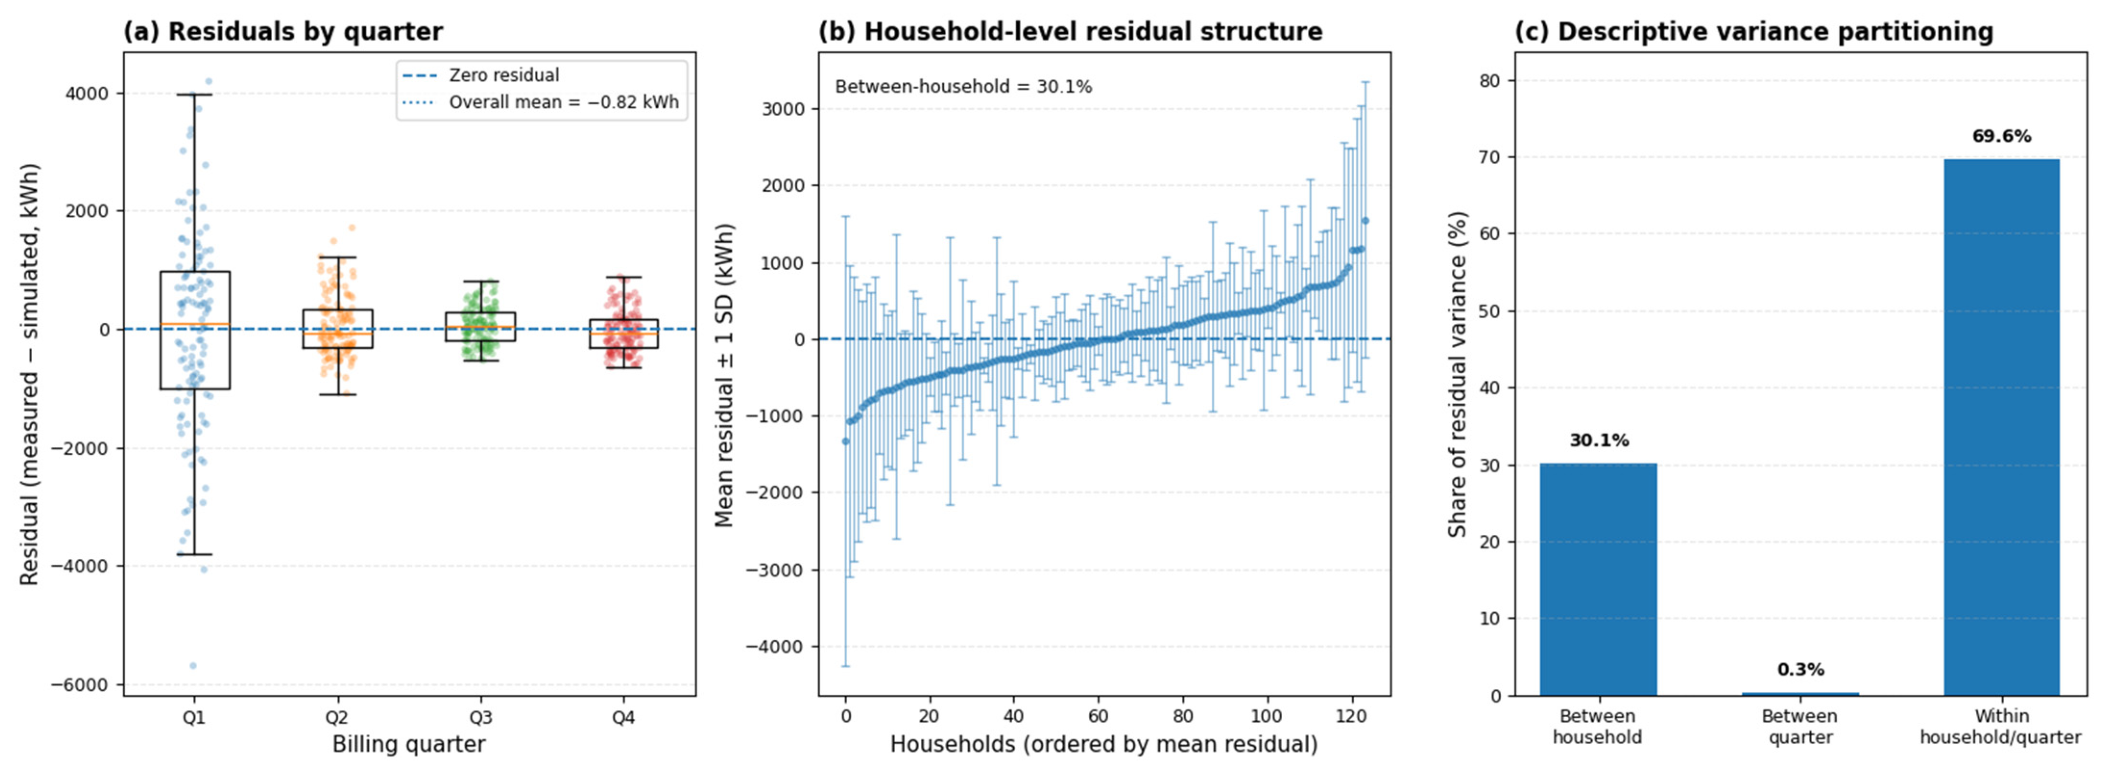
The CV(RMSE) computed over dwelling–billing-period observations was 37.18%, exceeding the threshold commonly cited from ASHRAE Guideline 14. Moreover, the residuals show no systematic seasonal bias. Mean residuals were close to zero in every billing quarter (−63.3, +48.8, +52.3 and −41.0 kWh for Q1–Q4), with an overall mean of −0.82 kWh (
Figure 6a). When dwellings are ordered by their mean residual, the resulting profile crosses zero near the centre of the distribution (
Figure 6b): the dispersion is structured by dwelling rather than by season. A descriptive partitioning of the residual sum of squares confirms this, with quarter-level differences accounting for only 0.31% of the total, against 30.1% for differences between dwellings and 69.6% for variation within a dwelling across billing periods (
Figure 6c). This dispersion may reflect differences in occupancy, thermostat settings, equipment use and other household-specific factors, which cannot be isolated from the available utility data. The combination of low aggregate bias with substantial dwelling-level dispersion is characteristic of archetype models calibrated against disaggregated metered data, and is consistent with the broader urban building energy modelling literature [
50,
56,
57,
58].
At the population-mean level, which corresponds to the intended scale of application, the root-mean-square deviation between simulated and measured mean consumption, computed on the quarterly means rather than on individual pairs, is 52 kWh per billing period, or 2.1% of the mean quarterly consumption. With 124 dwellings contributing to each quarterly mean, and the dwelling-level dispersion of 37.18% taken as the population coefficient of variation, the standard error of that mean is 37.18/√124 ≈ 3.3%. The aggregate deviation of the model is therefore smaller than the precision with which the population mean is itself resolved by this sample. The independent validation subset confirmed low population-level bias in sample (NMBE = +1.31%), while the dwelling-level CV(RMSE) remained elevated at 41.49%.
These results are consistent with the aggregate calibration strategy [
59,
60]. The archetype reproduces the population-mean seasonal pattern with low systematic bias, but was not designed to predict the consumption of individual dwellings. No measured indoor temperature data were available for these dwellings, so the hourly thermal behaviour of the model is not validated against observations; it rests instead on the engine verification reported in
Section 3.5.2. The agreement in population-level bias and seasonal energy structure supports the use of the calibrated archetype for comparative climate-sensitivity analysis, while the elevated CV(RMSE) indicates unresolved dwelling-level variability and therefore limits the interpretation of absolute future energy-use magnitudes.
The calibration and validation results reported above establish that the archetype reproduces measured seasonal energy consumption at the population scale under conditioned operation. They do not extend to the hourly indoor temperature trajectory, which is unconstrained by the available data. The thermal comfort indicators presented in
Section 4.4 should therefore be interpreted as model-based projections rather than as empirically validated observations of indoor conditions.
4.2. Baseline Energy Performance and Regulatory Compliance
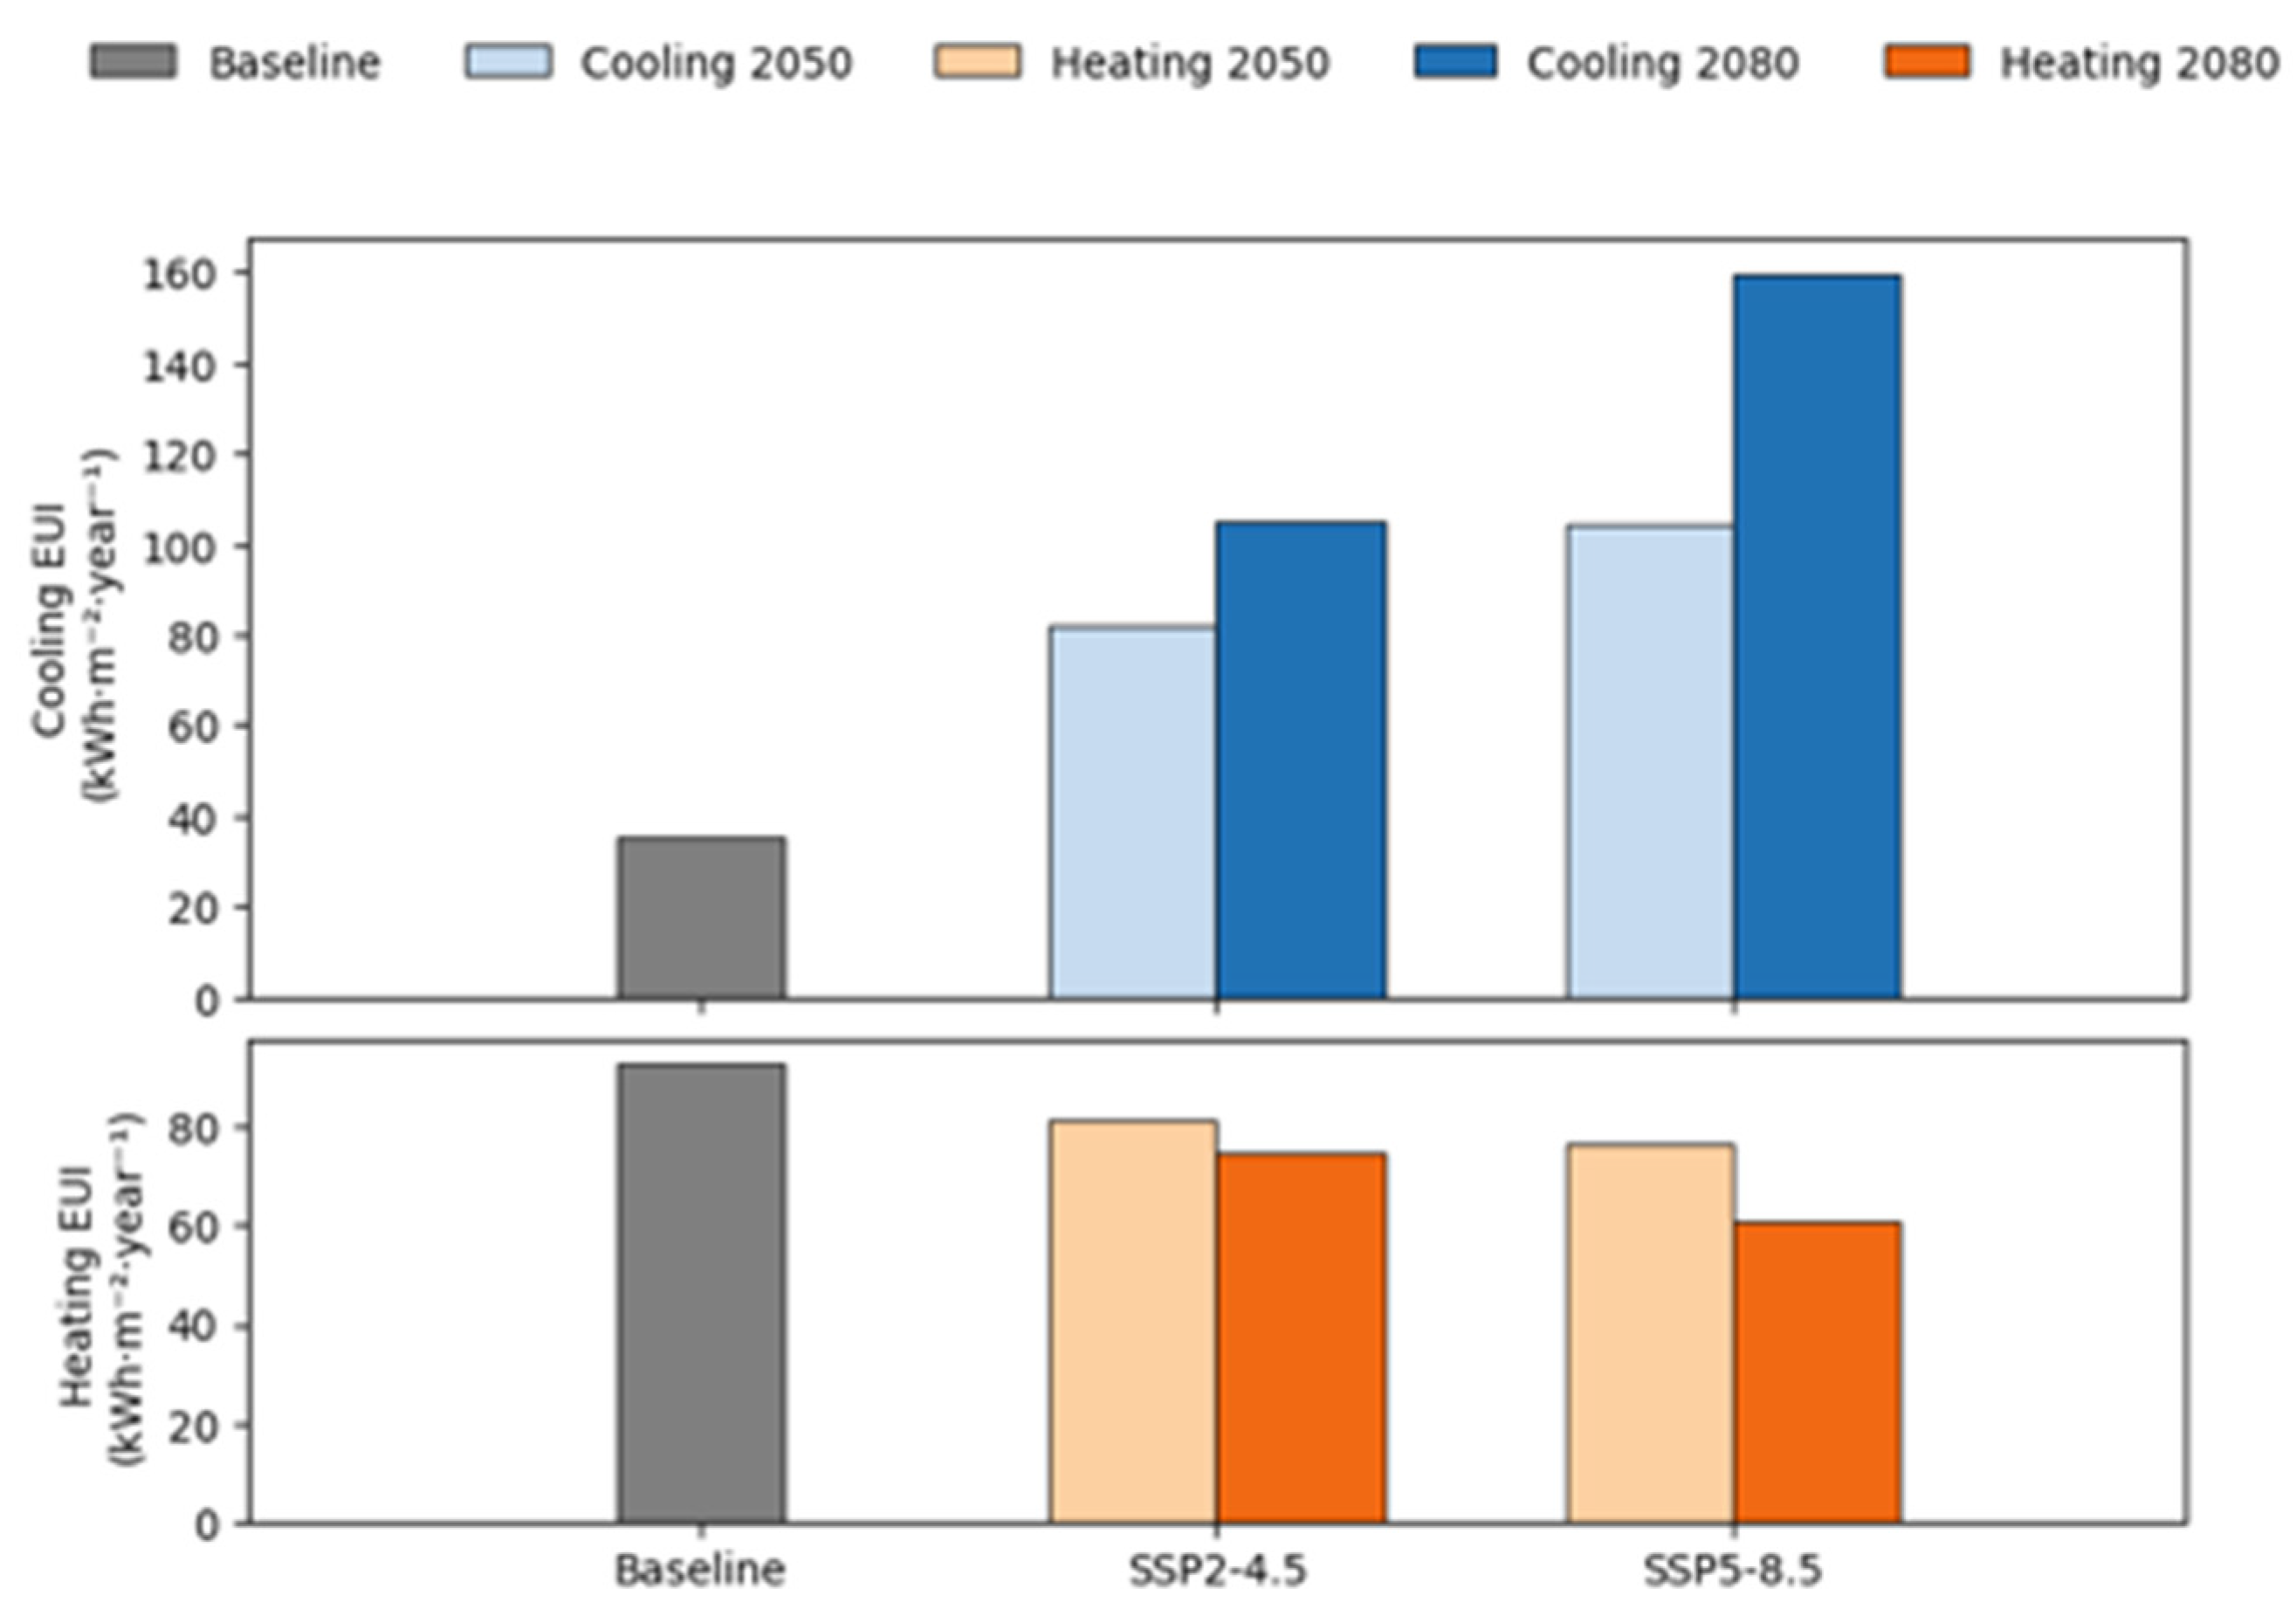
Under the current climate conditions, the calibrated archetype exhibits an annual energy consumption of 10,054 kWh, corresponding to an Energy Use Intensity (EUI) of 143.0 kWh·m
−2·year
−1 (70.29 m
2 total floor area). HVAC systems dominate the total demand (7668 kWh; 76.3%), while non-HVAC end-uses account for 2386 kWh (23.7%). When expressed per conditioned area (60 m
2), space-conditioning intensity reaches 127.8 kWh·m
−2·year
−1, of which 92.45 kWh·m
−2·year
−1 is for space heating and 35.35 kWh·m
−2·year
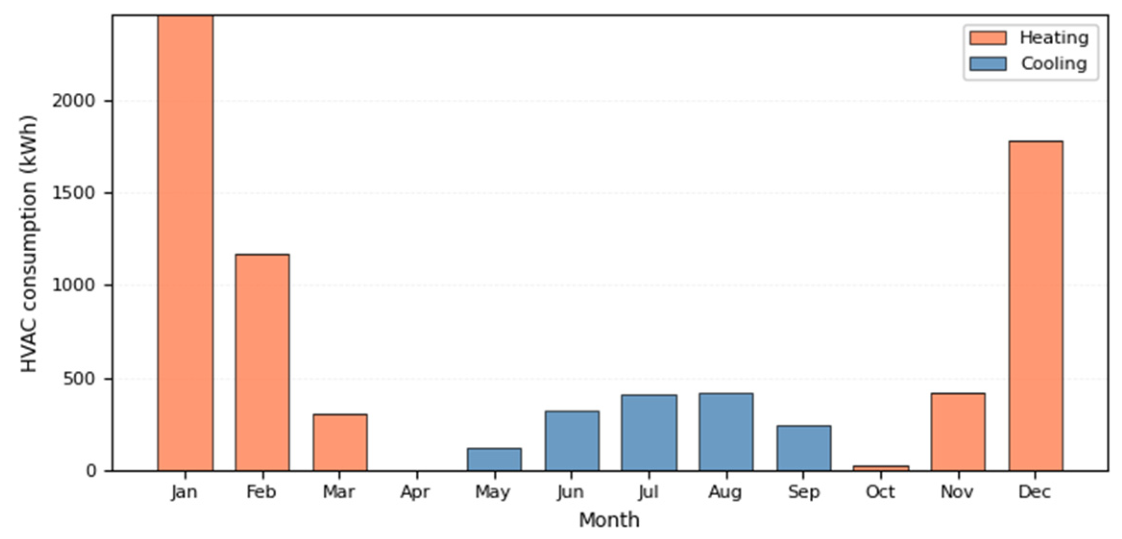
−1 is for cooling. Heating represents approximately 72.3% of total HVAC demand under the present climatic conditions, confirming the continued predominance of winter thermal loads in northern Algeria (
Table 7).
Under baseline conditions, the archetype complies with DTR C3.2/4 requirements (
Table 8). Transmission heat losses remain below the prescribed winter threshold, and envelope heat gains satisfy the summer reference criterion (July, 03:00 PM). However, the monthly profile (
Figure 7) shows that cooling already constitutes a substantial share of annual HVAC demand under current climate conditions. This highlights a structural limitation of the DTR C3.2/4 framework, which evaluates peak summer gains but does not regulate cumulative cooling energy performance or overheating risk. The present compliance, therefore, reflects conformity to static peak-based criteria rather than comprehensive regulation of annual cooling demand, an issue that becomes increasingly consequential under projected climate warming.
4.3. Future Climate Characterisation
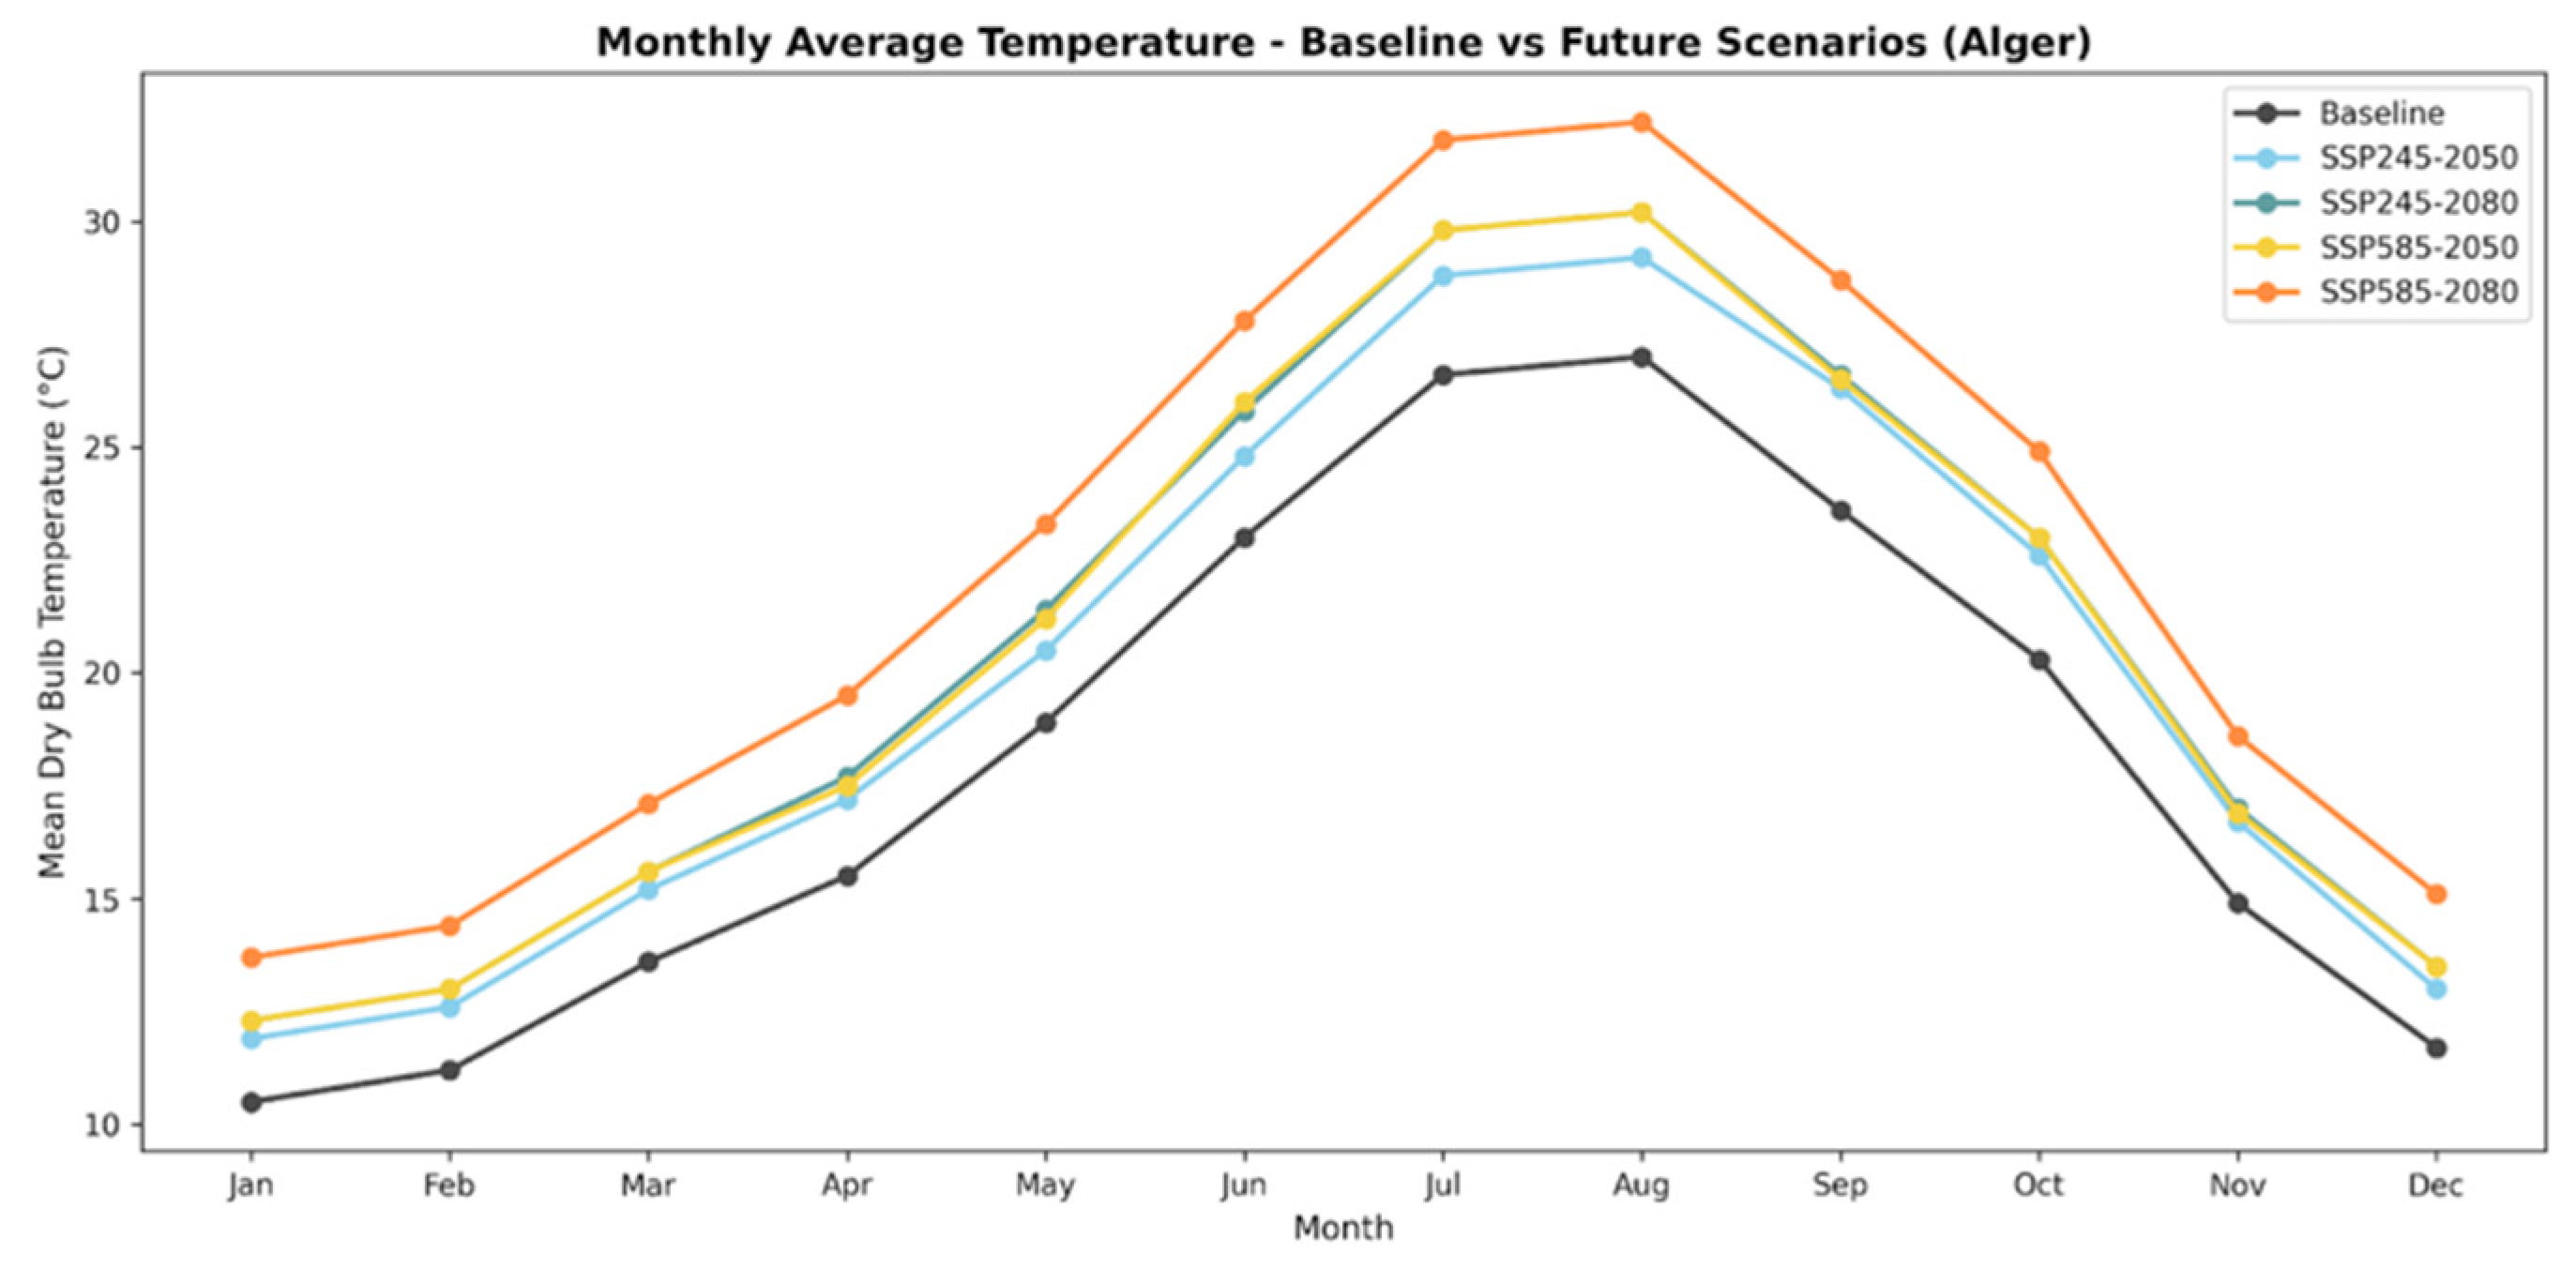
Figure 8 indicates a systematic warming across all months, intensifying with time and emissions. Under SSP2-4.5, mean summer peaks rise from approximately 27 °C at baseline to nearly 30 °C by 2080, while SSP5-8.5 exceeds 32 °C, representing an increase of roughly 5 °C. Winter means increase from about 10.5 °C to above 13 °C under high-emission end-of-century conditions.
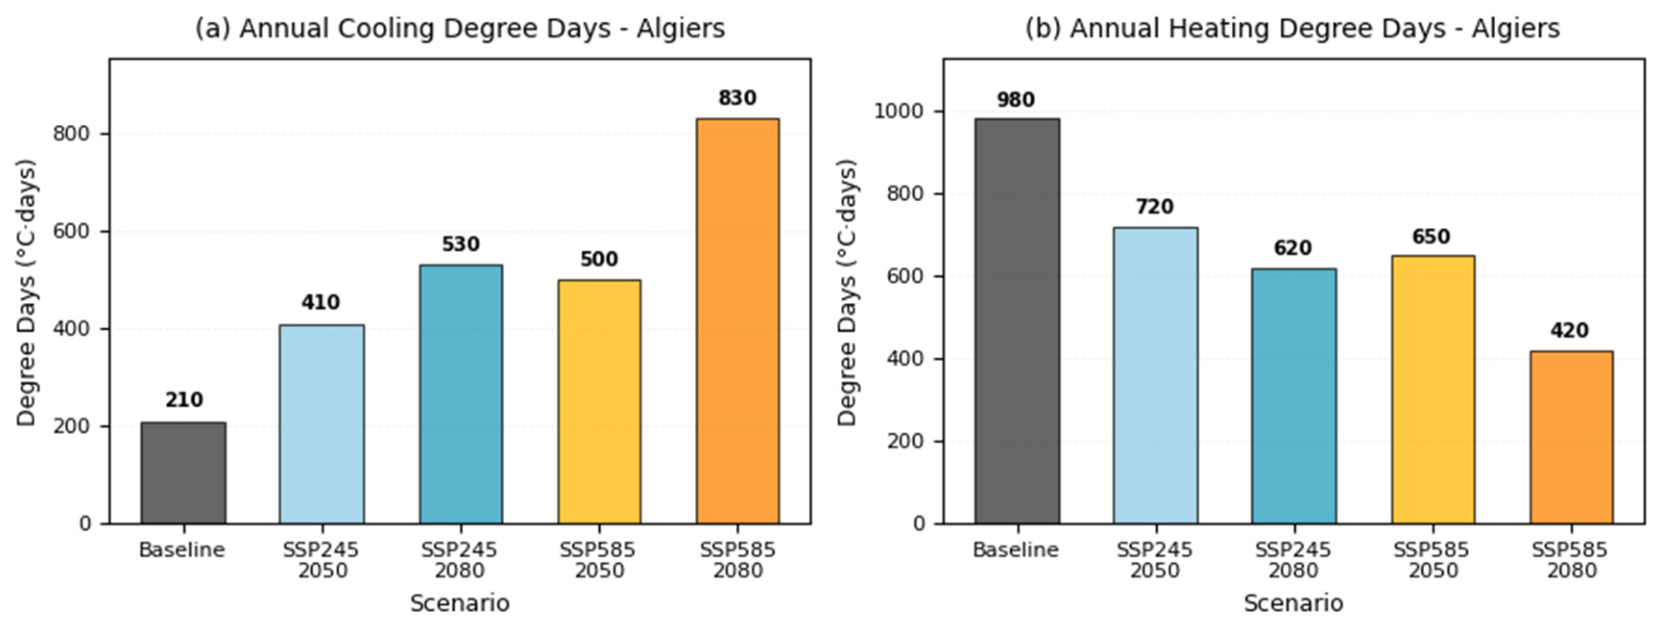
Degree-day analysis (
Figure 9) confirms a structural shift in climatic demand. Baseline conditions remain heating-dominated (HDD = 980 °C·days; CDD = 210 °C·days). Under SSP2-4.5, CDD approximately doubles by mid-century and increases 2.5-fold by 2080, while HDD declines to roughly 620 °C·days. Under SSP5-8.5, end-of-century CDD exceeds 800 °C·days, nearly a fourfold increase, while HDD decreases by more than 55%.
These results demonstrate a transition from a heating-dominated regime to a cooling-dominated one under high-emission pathways. This inversion directly challenges the historical climatic calibration of DTR C3.2/4, whose performance logic is primarily anchored in winter transmission control and single-hour summer peak gains, rather than in cumulative cooling resilience.
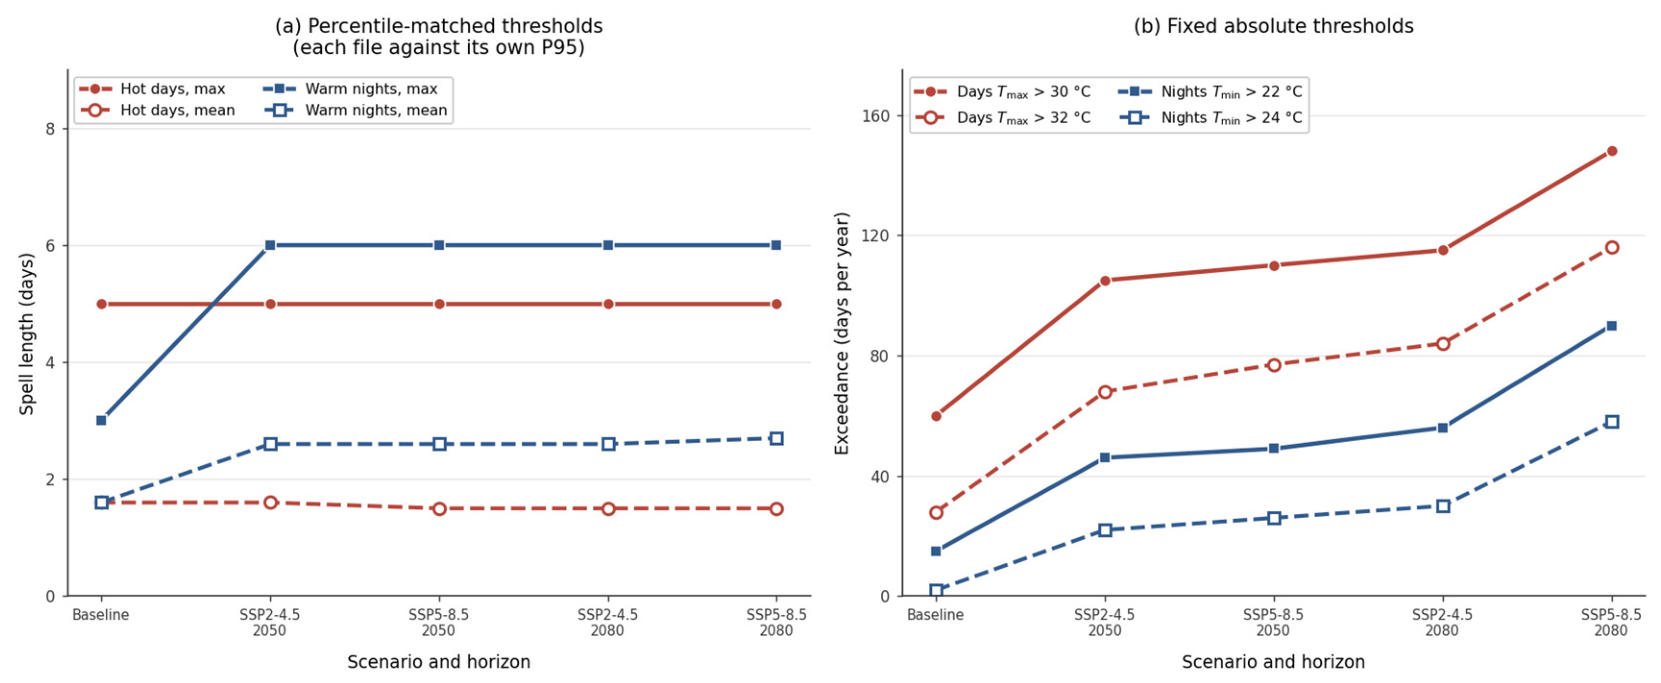
The extent to which the generated files transmit changes in heat-episode persistence is shown in
Figure 10. Under the percentile-matched definition, the maximum hot-day spell is 5 days in every file, from the baseline to SSP5-8.5 in 2080, and the mean hot-day spell falls slightly from 1.7 to 1.6 days. Warm-night spells change once between the baseline and the future files, from 3 to 6 days at the maximum and from 1.7 to 2.6 days on average, and are identical across all four scenario-horizon combinations thereafter. This is the expected signature of the morphing procedure: the transformation applied within each month is affine and therefore monotone, so the rank ordering of days is largely preserved and broadly the same calendar days exceed the percentile threshold in every file.
The single change in the warm-night statistics reflects the separate stretch factor applied to daily minimum temperature, which alters the diurnal range and re-ranks nights differently from days. Under fixed absolute thresholds, the response is, by contrast, substantial. Between the baseline and SSP5-8.5 in 2080, days with Tmax above 30 °C rise from 58 to 143 per year and days above 32 °C from 28 to 113, while nights with Tmin above 22 °C rise from 15 to 88 and nights above 24 °C from 3 to 56, as the summer mean daily maximum temperature rises from 30.3 to 35.9 °C. The two diagnostics together delimit what the files carry: changes in the frequency of threshold exceedance are strongly represented, whereas changes in the duration and clustering of episodes are not. The consequence for the interpretation of the performance indicators is discussed in
Section 5.2.
4.4. Climate-Induced Reconfiguration of HVAC Demand
Heating demand decreases progressively under all scenarios. Relative to the baseline (92.5 kWh·m
−2·year
−1), heating EUI declines by 12–20% under SSP2-4.5 and by up to 34% under SSP5-8.5 by 2080, reflecting milder winter conditions and reduced transmission-driven loads. These results are consistent with documented heating contraction across northern Mediterranean climates under warming trajectories [
19,
20,
32]. Cooling demand exhibits the opposite trajectory. Under SSP2-4.5, cooling EUI more than doubles by mid-century and approaches 105 kWh·m
−2·year
−1 by 2080. Under SSP5-8.5, cooling demand increases by a factor of approximately 4.5 by end-of-century, reaching 159 kWh·m
−2·year
−1. The proportional increase in cooling demand exceeds the proportional growth in CDD, indicating not only higher peak temperatures but also seasonal extension and cumulative thermal loading (
Table 9). Comparable amplification of cooling demand has been reported across Mediterranean and semi-arid contexts [
30,
34,
36].
The combined effect of declining heating and accelerating cooling yields a net increase in total HVAC demand under all scenarios. While moderate warming partially offsets heating reductions through increased cooling, this compensation mechanism breaks down under high-emission conditions. Under SSP5-8.5, the total HVAC EUI rises by more than 70% by 2080 relative to baseline, signalling a transition from a heating-dominated to a cooling-driven energy regime (
Figure 11). This structural inversion is analytically significant: the dominant driver of residential energy demand shifts from winter transmission control to summer thermal resilience.
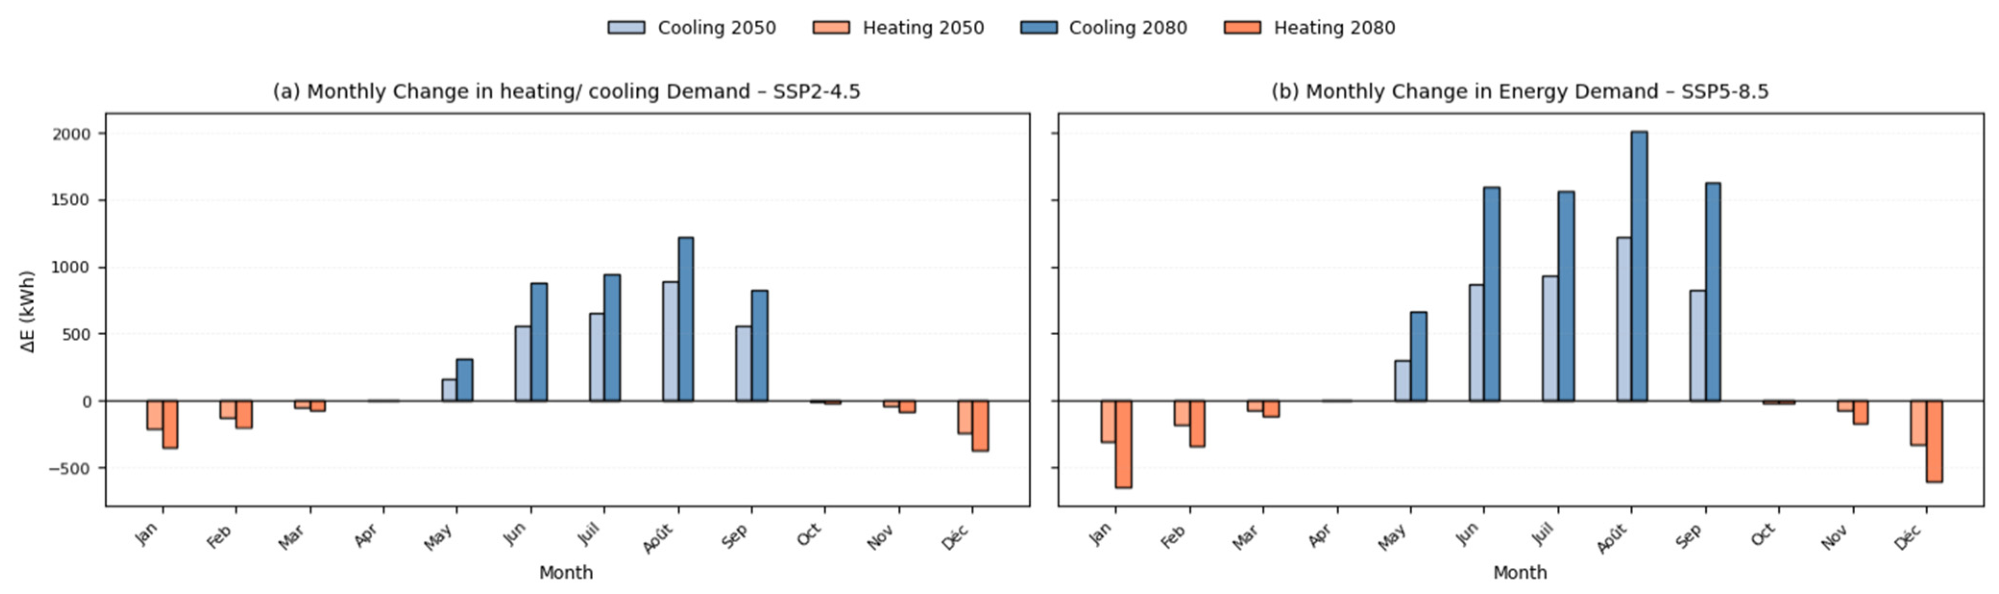
Monthly deviations (
Figure 12) reveal a progressive contraction of the heating season combined with a systematic expansion and intensification of the cooling season under both SSP2-4.5 and SSP5-8.5. Under SSP2-4.5, heating reductions occur across all winter months, with the largest absolute declines observed in January and December. By 2050, reductions remain concentrated within the core heating period (December–February), whereas by 2080 they extend more broadly across the winter season. Concurrently, cooling demand increases significantly during summer and expands into transitional months. Cooling loads emerge earlier (May) and persist through September, with peak increments in July and August. By the end of the century, both the amplitude of summer peaks and the duration of active cooling increase further, reflecting prolonged exposure to elevated outdoor temperatures. Under SSP5-8.5, these seasonal shifts become structurally amplified. Winter heating demand contracts more sharply, particularly by 2080, while cooling demand exhibits sustained increases from late spring to early autumn. Cooling loads begin as early as April and extend into October, indicating a substantial lengthening of the cooling season under high-emission conditions. Peak monthly cooling increments exceed those observed under SSP2-4.5 and reach maximum intensity by the end of the century. Beyond magnitude alone, the temporal extension of cooling demand fundamentally alters the intra-annual load structure of residential energy use.
4.5. Regulatory Margin Erosion and Scenario-Dependent Validity Horizon
Formal compliance with DTR C3.2/4 is preserved across all simulated climate scenarios (
Table 10). Under warming, heating energy demand declines substantially (
Section 4.4), consistent with reduced transmission-driven loads. However, the winter compliance criterion itself (Dᴛ ≤ 1.05·D_ref,
Table 6) depends only on fixed envelope and geometric parameters and contains no climate input; the formal winter compliance margin is therefore invariant to climate scenario by construction, rather than widening under warming. This study accordingly focuses on summer thermal risk, where the compliance criterion is climate-sensitive and where the CPG is observed to emerge. In summer, the compliance margin exhibits systematic contraction under progressive warming. The summer verification margin declines from 7.14% under baseline conditions to 0.88% in 2050 and 0.05% in 2080 under SSP5-8.5. Although technically positive, the margin approaches functional exhaustion. This contraction reflects convergence between projected peak envelope gains and a regulatory threshold calibrated to stationary climatic conditions.
The phenomenon observed is not simply quantitative tightening but structural boundary misalignment. Prescriptive codes such as DTR C3.2/4 embed implicit climatic invariance: verification logic assumes stability of external forcing distributions. Under non-stationary warming, this assumption erodes. Yet because verification remains anchored to a single-hour peak criterion, compliance persists until the threshold is formally breached. The regulatory instrument, therefore, exhibits delayed institutional responsiveness to gradual environmental change. Margin compression thus operates as a latent indicator of declining regulatory robustness. The framework absorbs climatic intensification without adaptive recalibration, masking progressive divergence between formal conformity and systemic exposure. Crucially, the horizon of regulatory exhaustion is emissions-contingent. Assuming the linear reduction rate observed between 2050 and 2080 (- 0.028 percentage points per year) persists beyond the simulation horizon, formal non-compliance under SSP5-8.5 would emerge shortly after 2080, at approximately 2082, under the linear extrapolation assumption. These projections are conditional on the linearity assumption and should be interpreted as indicative validity horizons rather than deterministic breach dates, given that climate forcing and envelope heat-gain relationships may exhibit non-linear behaviour beyond the simulated range.
This key finding repositions building regulation as a dynamic policy instrument whose effective lifespan is co-determined by the climate trajectory. Under static design assumptions, regulatory architectures do not fail discretely; they undergo progressive structural obsolescence. The shrinking compliance margin observed here constitutes an early diagnostic signal of that obsolescence under non-stationary climatic forcing.
4.6. Thermal Comfort Results
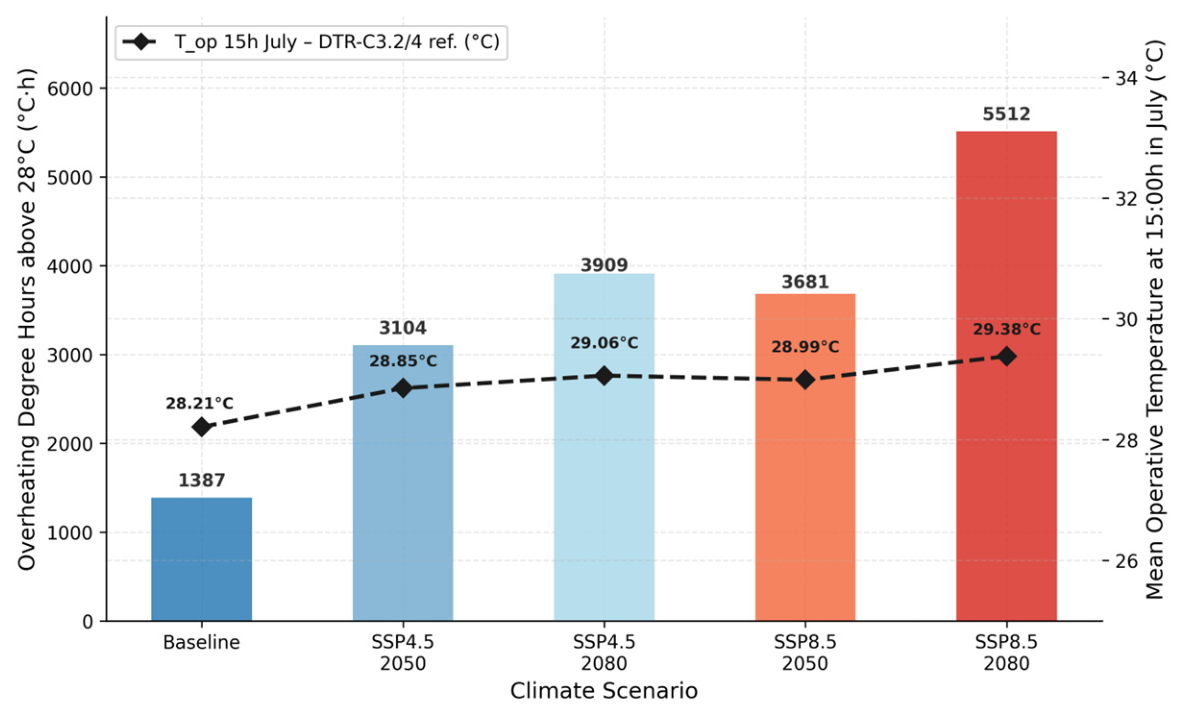
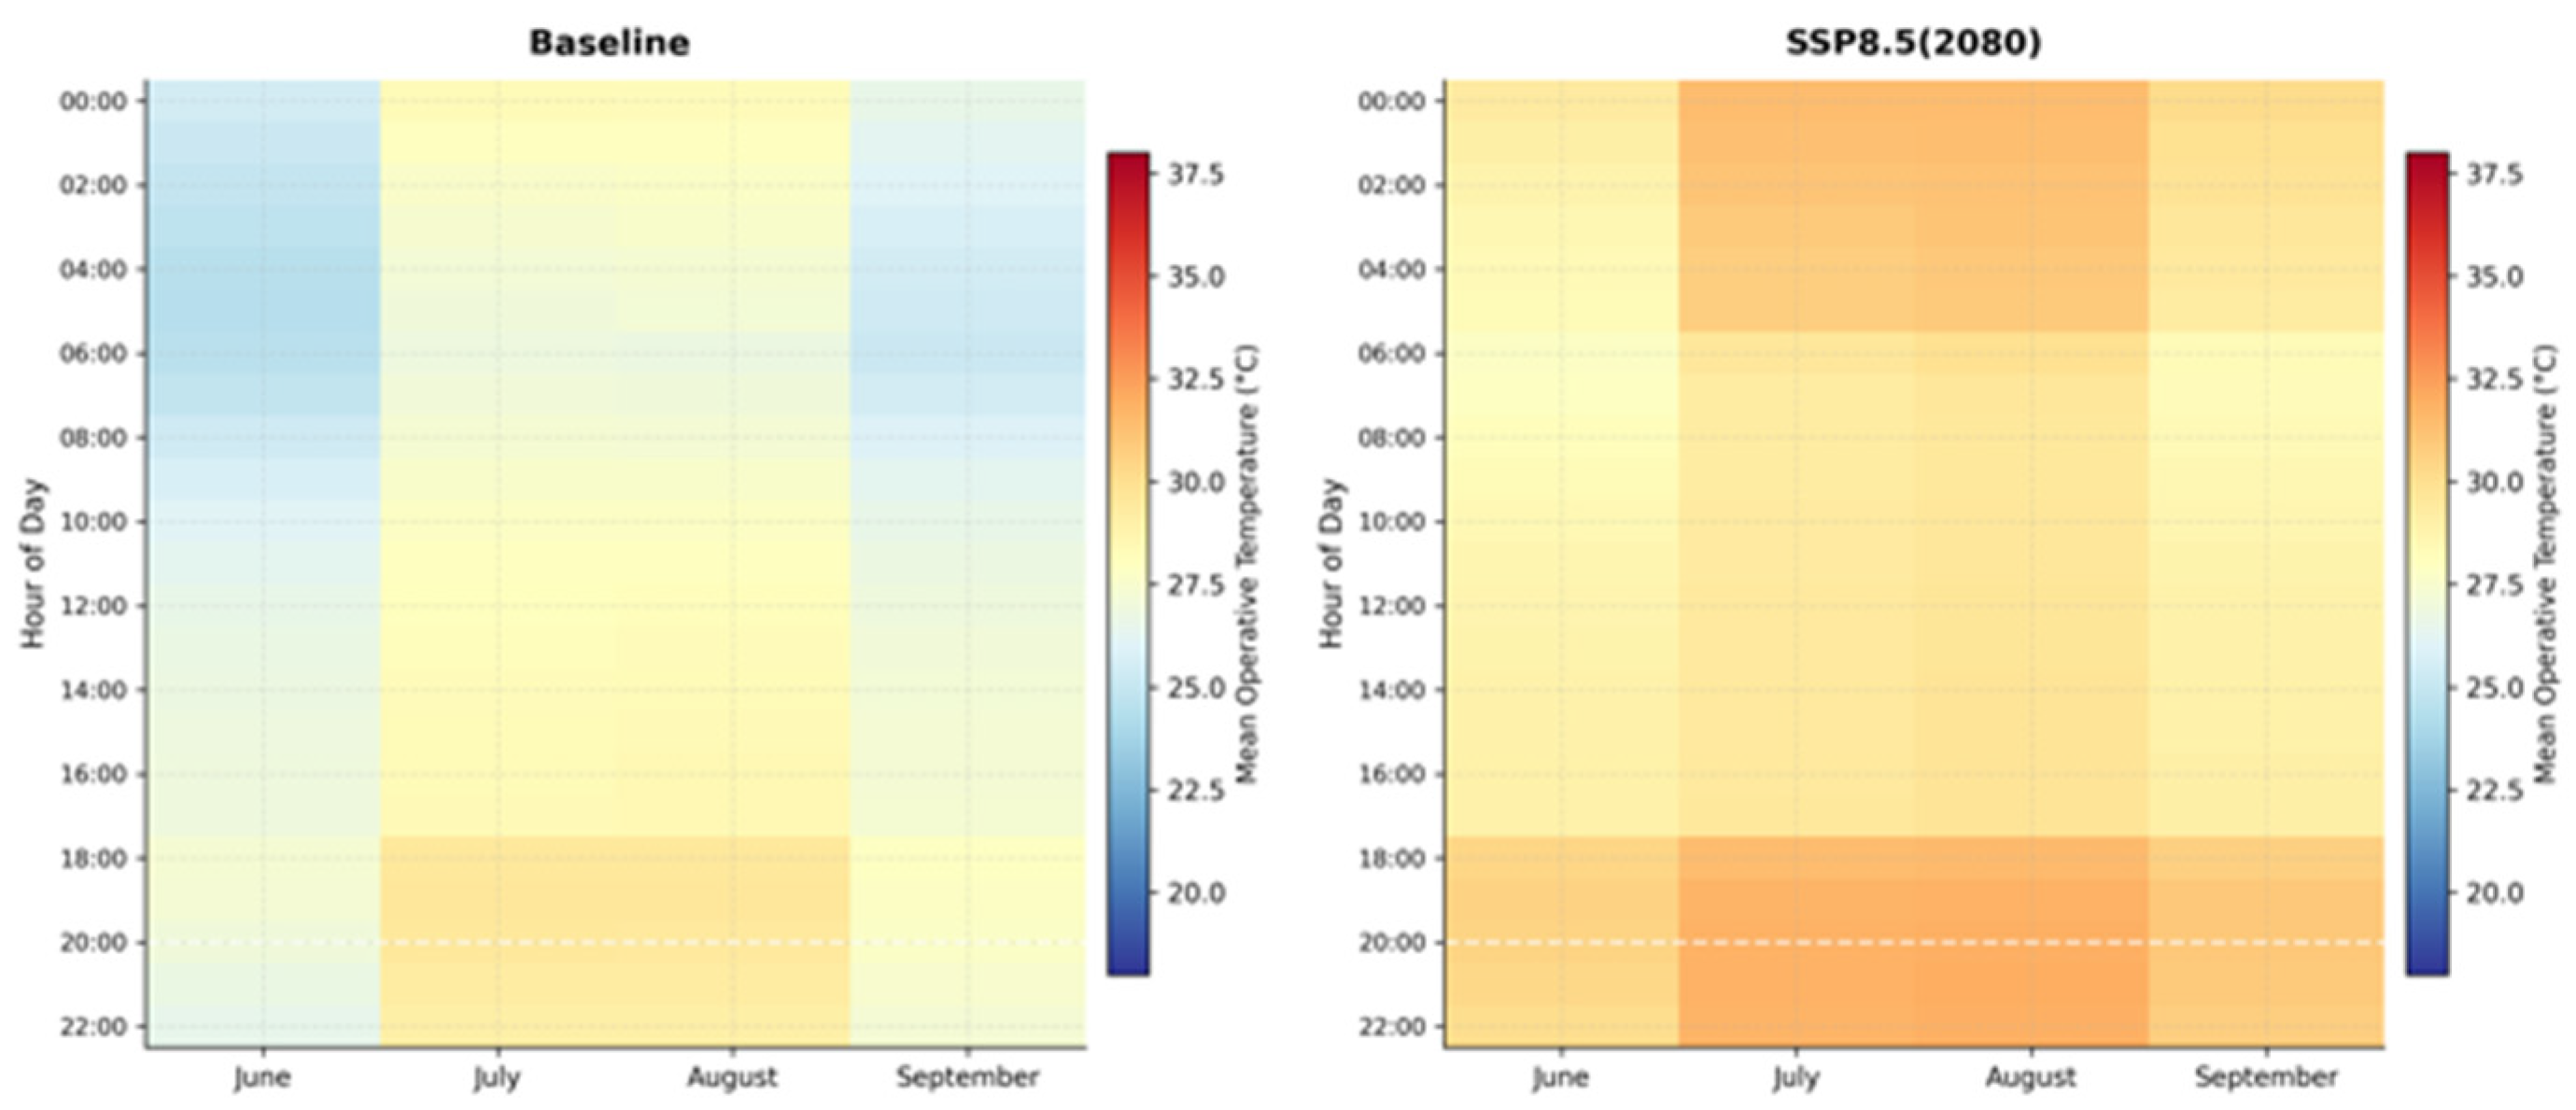
The results reveal a systematic and progressive deterioration of indoor thermal conditions that contrasts sharply with the marginal variation observed in the DTR C3.2/4 compliance indicator (
Figure 13). Under baseline conditions, the operative temperature at 03:00 PM in July averages 28.21 °C, rising to 29.38 °C under SSP5-8.5 end-of-century conditions, a variation of only 1.17 °C. The 1.17 °C operative temperature increment, against a 3.64 °C outdoor forcing (
Table 10), confirms that the envelope performs its attenuation function at the instantaneous compliance point. The regulatory failure lies not in this metric but in its blindness to cumulative thermal loading, as evidenced by the nearly fourfold increase in OHDH
28.
OHDH28 increases from 1387 °C·h under baseline conditions to 3681 °C·h under SSP5-8.5 mid-century (+165%) and 5512 °C·h under SSP5-8.5 end-of-century (+297%), representing a near-fourfold intensification of thermal stress that remains entirely undetected within the DTR C3.2/4 verification framework. Under the moderate pathway,
OHDH28 reaches 3104 °C·h by mid-century and 3909 °C·h by end-of-century, confirming that substantial overheating accumulation occurs even under restrained warming trajectories (
Figure 14). Nocturnal thermal conditions exhibit a comparable deterioration.
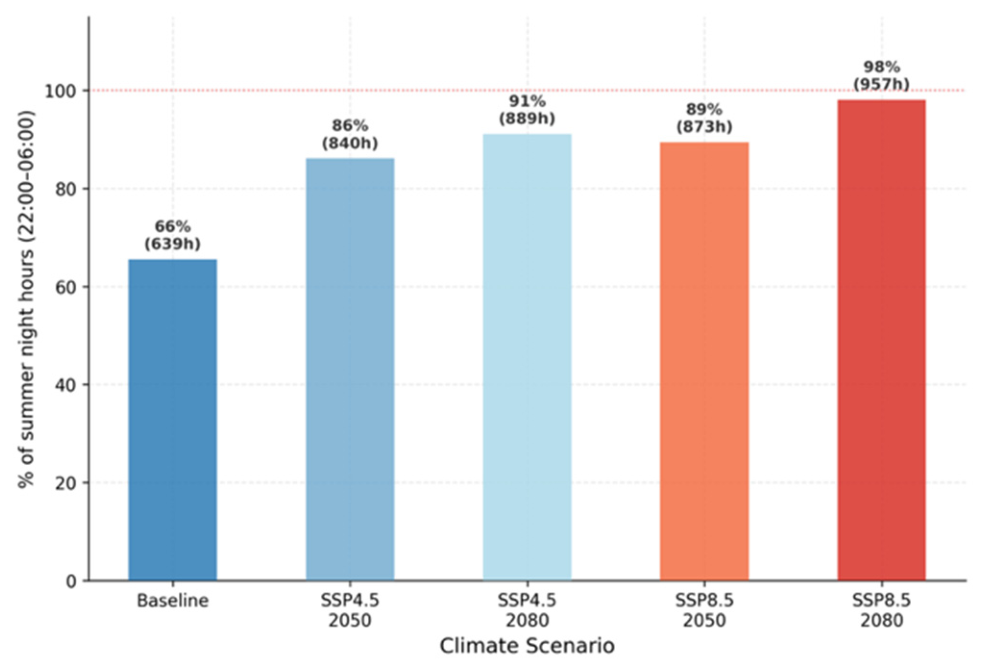
NEH26 increases from 639 h (65.5% of summer night-time hours) at baseline to 957 h under SSP5-8.5 end-of-century, corresponding to 98.1% of summer night-time hours, effectively eliminating nocturnal thermal recovery. This has direct energy policy implications, as it structurally forces mechanical cooling into the night, with consequences for peak electricity demand and grid load profiles. Under SSP2-4.5,
NEH26 reaches 840 h (86.1%) by mid-century and 889 h (91.1%) by end-of-century. Since the DTR C3.2/4 compliance check is restricted to a single daytime reference hour, this near-total suppression of nocturnal cooling goes unregistered within the current regulatory framework (
Figure 15).
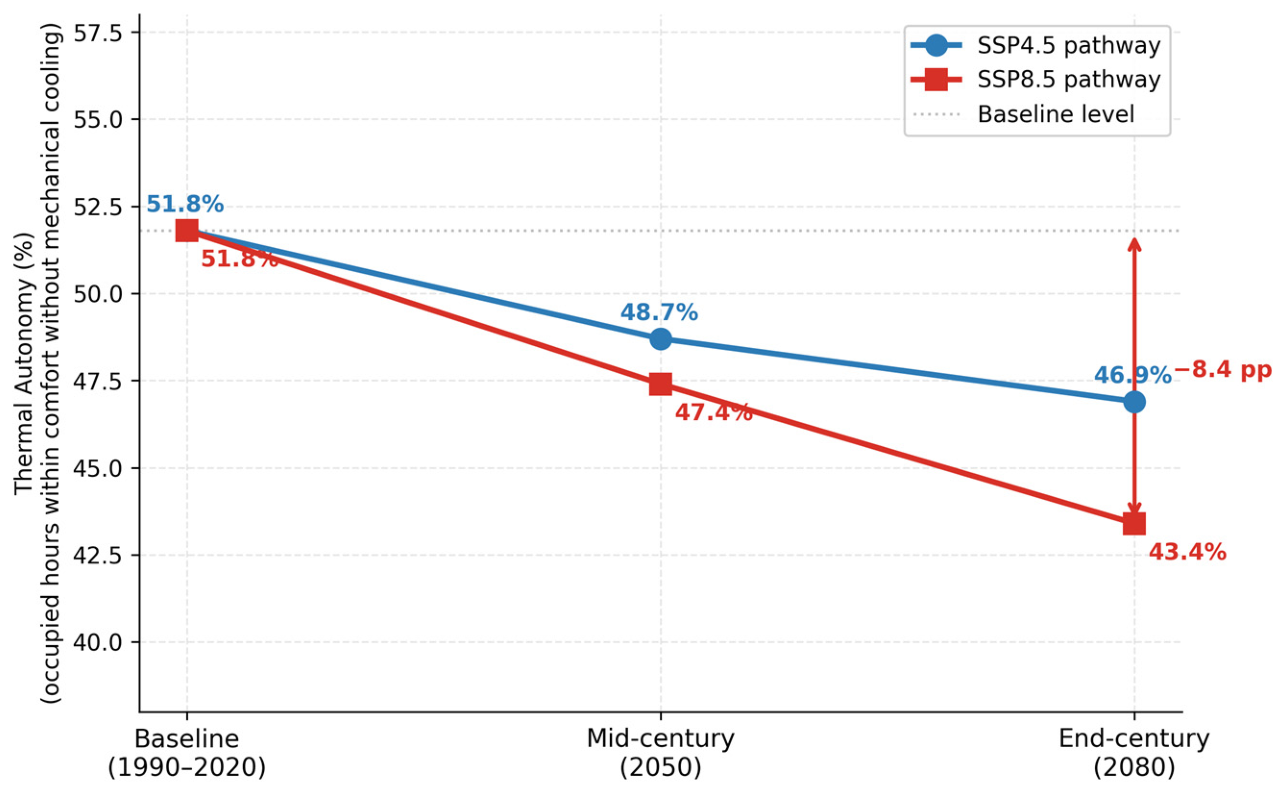
TA declines progressively across all scenarios, from 51.8% at baseline to 46.9% under SSP2-4.5 by end-of-century and 43.4% under SSP5-8.5 by end-of-century (
Figure 16). This 8.4 percentage-point reduction under the high-emissions pathway implies that natural ventilation becomes increasingly unable to maintain comfort during occupied hours, directly amplifying the structural pressure toward mechanical cooling dependency documented in
Section 4.4.
It should be noted that the morphing method, by construction, preserves the temporal variability structure of the baseline climate and may therefore underestimate heatwave persistence and cumulative heat stress under high-emission scenarios [
24]. The CPG reported here should accordingly be interpreted as a conservative lower-bound estimate, and its implications are discussed further in
Section 5.
Taken together, these findings demonstrate that regulatory compliance status, as defined by DTR-C3.2/4, bears no reliable relationship to actual indoor thermal performance under future climate conditions. The divergence between the DTR C3.2/4 indicator (+1.17 °C) and the OHDH28 (+297%) is not a modelling artefact but a structural consequence of evaluating building performance through a single instantaneous metric calibrated to historical climate conditions.
Regarding the sensitivity of the results to building-model assumptions, the OAT analysis revealed indicator-specific parameter dominance (
Figure 17). Under mixed-mode operation, infiltration was the dominant contributor to the sensitivity range of cooling energy, accounting for approximately 51% of the total range under the reference climate and 55% under SSP5-8.5 in 2080. Internal heat gains ranked second, whereas natural ventilation had a comparatively limited effect. For the free-running overheating indicators, by contrast, natural ventilation was the dominant parameter, accounting for approximately 41–45% of the total sensitivity range, followed by internal heat gains and infiltration. TA showed a more balanced response: internal heat gains and infiltration had comparable effects under the reference climate, whereas infiltration became the largest contributor under SSP5-8.5 in 2080.
These results show that parameter rankings depend on both the physical meaning of the indicator and the operating mode. Infiltration dominates the cooling-energy response, whereas natural ventilation dominates the free-running overheating response. Thus, more broadly, air-exchange assumptions are the principal drivers of sensitivity, although their relative influence depends on the indicator considered. Even under the least adverse single-parameter perturbation shown for
OHDH28 under SSP5-8.5 in 2080, cumulative overheating remained approximately 4424 °C·h. This corresponds to an increase of about 219% relative to the historical baseline of 1387 °C·h. The regulatory calculations remained compliant for all tested parameter variants. The projected deterioration is therefore not attributable solely to the calibrated parameterisation. The one-at-a-time design estimates the main effect of each parameter while holding all other inputs at their reference values. It does not capture interactions between infiltration, internal gains and ventilation, nor their combined uncertainty. A global sensitivity analysis is therefore identified as a priority for future work in
Section 6.
5. Discussion
5.1. Climate-Driven Transition in Residential Energy Performance
Under progressive warming, the calibrated archetype remains formally compliant with DTR C3.2/4 across all scenarios, yet the composition of HVAC demand inverts: the heating share falls from 72.3% to 27.6% and the cooling share rises symmetrically, reducing the heating-to-cooling ratio from 2.6 to below 0.4 by 2080 under SSP5-8.5 (
Section 4.4,
Table 8).
This inversion represents a structural redefinition of residential energy needs. In Algeria, heating is predominantly gas-based and cooling almost entirely electric. Therefore, climate warming induces an involuntary fuel transition from a relatively flexible energy carrier to a grid-dependent one. Given the fossil-fuel-dominated electricity mix, declining heating demand may not translate into lower emissions; accelerated cooling growth could increase indirect carbon intensity and summer peak loads, with potential implications for electricity-system planning.
The archetype-level increase in cooling intensity has implications for the residential stock currently under construction. To situate its magnitude, the simulated increase under SSP5-8.5 (124 kWh·m−2·year−1 on a conditioned-floor-area basis, consistent with the billing-data calibration) was applied across the 1.4 million planned AADL dwellings, giving approximately 10 TWh of additional annual electricity demand. This scaling is illustrative rather than predictive and it should be read as an order of magnitude rather than a precise forecast. The AADL programme prescribes a reproducible typology, which supports the assumption of typological homogeneity across the stock; the calculation nevertheless assumes that construction quality, occupancy patterns, and climatic exposure at the deployment locations correspond to those of the Algiers calibration context, and that equipment efficiency and occupant behaviour remain unchanged over the projection horizon. Its purpose is to situate the archetype-level result at the scale of the programme concerned, not to estimate future national electricity demand.
Because cooling demand is concentrated in summer, the additional consumption would be disproportionately concentrated during peak-demand periods; its implications for system peak load, generation adequacy, and network reinforcement are not quantified here and would require dedicated electricity-system modelling (see Limitations,
Section 6).
5.2. Compliance–Performance Gap and Regulatory Logics Under Future Climates
The CPG, as expressed in Equation (9), provides a direct measure of divergence to the unbounded indicators. Between the reference climate and SSP5-8.5 in 2080, the regulatory response increases by only 7.64%, whereas cumulative overheating and cooling energy use intensity increase by 297.4% and 351.2%, respectively. The resulting divergence ratios are 38.9 for
OHDH28 and 46.0 for cooling EUI (
Table 11). Over the same transition, dry-bulb temperature at the prescribed verification points increases by only 1.17 °C, while
OHDH28 rises from 1387 to 5512 °C·h. The comparison therefore reveals a substantial difference between the limited change captured by the regulatory check and the much larger change in cumulative thermal exposure.
NEH26 and thermal autonomy are excluded from the ratio because their ranges are bounded. NEH26 is constrained by the total number of summer night-time hours, whereas thermal autonomy is expressed on a 0–100% scale. As a bounded indicator approaches its upper or lower limit, its relative change is increasingly determined by the remaining distance to that limit rather than by the intensity of the underlying physical change. A comparison with the regulatory response would consequently become difficult to interpret. By contrast, the relative changes in unbounded exceedance indicators can be amplified by the convex relationship between temperature and exceedance intensity: relatively small shifts in the temperature distribution may produce disproportionately large increases in exceedance duration and intensity. A divergence ratio above unity is therefore expected for such indicators on mathematical grounds alone. The stress test is useful because it quantifies the magnitude of this divergence rather than merely identifying its presence.
The exclusion of the bounded indicators does not diminish their diagnostic value. Under SSP5-8.5 in 2080, NEH26 reaches 98.1% of summer night-time hours, while thermal autonomy declines from 51.8% to 43.4% of occupied hours. These changes indicate a near-total loss of nocturnal recovery and an 8.4-percentage-point reduction in passive comfort capacity. Because bounded indicators saturate rather than amplify, their deterioration cannot be attributed solely to the convexity of the exceedance integral. They therefore provide independent evidence that indoor thermal conditions worsen substantially over the same climatic transition.
The divergence ratio does not increase monotonically with the regulatory response. For OHDH28, it is 24.5 under SSP5-8.5 in 2050 but 35.3 under SSP2-4.5 in 2080. This pattern reflects the different temporal scopes of the two types of assessment. The regulatory criterion aggregates design temperature and solar irradiance at a prescribed verification instant, whereas the performance indicators integrate indoor conditions over the entire season. The regulatory response is therefore not expected to track cumulative overheating or cooling demand in a simple linear or monotonic manner. This temporal mismatch is already evident under the reference climate. The archetype exceeds 26 °C during 65.5% of summer night-time hours despite retaining a compliance margin of 7.14%. Warming does not create the entire mismatch; rather, it progressively erodes a margin that had concealed the limitations of the verification procedure. The margin contracts to 0.05% under SSP5-8.5 in 2080, yet the regulatory verdict remains compliant. The criterion therefore moves in the same direction as the changing climate but responds more slowly than the operational-performance indicators, while its binary verdict remains unchanged until the regulatory threshold is crossed.
The resulting pattern is analogous to the “stationarity trap” described in hydrological risk management [
61]. Verification frameworks calibrated under historical climate distributions may progressively underestimate cumulative risk when applied outside the climatic envelope for which they were designed. In the same way that flood-risk assessments based on historical flow distributions may underestimate future inundation, thermal regulations calibrated to historical temperature distributions may underestimate future overheating and cooling requirements.
The gap is particularly pronounced because nocturnal thermal conditions are not assessed within DTR C3.2/4. Even under SSP2-4.5,
NEH26 reaches 86.1% of summer night-time hours by mid-century. Under SSP5-8.5 in 2080, it rises to 957 h, or 98.1% of the summer night-time period, leaving almost no opportunity for nocturnal thermal recovery. Thermal autonomy declines over the same transition from 51.8% to 43.4% of occupied hours, increasing dependence on mechanical cooling. Since summer compliance is evaluated solely at 15:00 in July, neither the near-total suppression of night-time cooling nor the associated decline in passive comfort capacity is registered by the current prescriptive check. These magnitudes are consistent with, and extend, the ranges reported for the Mediterranean basin. The +297% increase in
OHDH28 is of the same order as the multi-fold increases in overheating exposure reported for Mediterranean residential stock under end-of-century warming [
29], and the near-total suppression of nocturnal recovery parallels the heatwave-concentrated overheating documented in southern Spain [
34], driven by the same mechanisms of elevated night-time minima and cumulative heat storage [
35].
Taken together, these results demonstrate that the CPG arises from a verification scope that is temporally misaligned with the physics of cumulative thermal stress. Under non-stationary climatic conditions, formal compliance within the current DTR C3.2/4 framework cannot be interpreted as a reliable proxy for acceptable thermal habitability or operational adequacy.
5.3. Regulatory Mechanisms and Structural Drivers of the Compliance–Performance Gap
The mechanism producing this gap lies in the verification architecture itself. DTR C3.2/4 assesses summer performance through a single instantaneous boundary condition combined with prescriptive, component-level envelope requirements. This architecture embodies a regulatory logic optimised for administrative simplicity and checklist-based enforceability, yet rests on two implicit assumptions that progressive warming undermines: climatic stationarity and the representativeness of a single peak-hour condition. Under historical regimes characterised by regular nocturnal cooling and limited multi-day heat persistence, these assumptions may have been operationally defensible. Yet, under warming scenarios, the drivers of indoor thermal degradation shift from isolated peak exceedance toward cumulative heat storage, suppressed nocturnal recovery, and threshold-driven amplification of overheating intensity. This critique does not imply that DTR C3.2/4 was intended to guarantee thermal comfort or long-term resilience; as a minimum prescriptive standard, it was not designed to provide such guarantees. The argument advanced here is narrower. Any verification architecture, regardless of its stated ambition, rests on a reference condition whose validity is bounded in time. The concern is therefore not the absence of a comfort guarantee, but the absence of a mechanism linking that reference condition to a climate-informed recalibration pathway. In principle, this structural issue may affect any prescriptive minimum standard that lacks forward-looking climate integration, regardless of jurisdiction.
DTR C3.2/4 was initially established in 1997 and revised in 2016, yet its core verification architecture remains anchored to stationary climatic reference conditions. There are ongoing discussions and proposals to develop a broader energy-based, performance-oriented regulatory framework in the country, but no new regulations have yet replaced the DTR format. To avoid conflating instruments with different regulatory objectives,
Table 12 separates two analytical blocks. Block A reports design-scope dimensions for contextual purposes only; these dimensions are not the basis for comparison, as they reflect differences in regulatory objectives rather than structural adequacy. Block B isolates the dimensions that are relevant to the paper’s argument across a deliberately heterogeneous set of frameworks: two energy-oriented codes (the EU EPBD [
62] and the US IECC [
63]), one framework combining energy and summer-comfort verification (RE2020, France [
64]), and one framework specifically targeting summer overheating (UK Approved Document O/CIBSE TM59) [
65]. This comparison does not rank regulatory effectiveness or imply equivalence in scope, legal status, or intended stringency. Its purpose is narrower: to examine whether regulatory benchmarks are explicitly linked to forward-looking climate trajectories. RE2020 and TM59 show that climate-sensitive summer-performance assessment is feasible, including within frameworks focused specifically on summer comfort. However, without a formal recalibration mechanism, progressive warming changes the climatic conditions under which buildings operate, while verification benchmarks remain unchanged, allowing the CPG to widen over time.
Converging evidence supports this structural interpretation: simplified or instantaneous overheating indicators underestimate cumulative thermal risk under climate change [
39]. Buildings satisfying identical prescriptive requirements can exhibit substantially divergent thermal outcomes across climate zones and construction typologies [
66]. Analogous compliance–performance discrepancies have been documented in prescriptive energy codes where component-based verification fails to ensure system-level adequacy under evolving environmental boundary conditions [
4]. These converging findings support the interpretation that the gap identified here reflects a structural property of static verification architectures rather than an anomaly specific to the Algerian regulatory context.
While the quantified magnitude of the gap is specific to the Algiers archetype and climatic conditions examined, and would require replication across additional zones and typologies to establish statistical generalisability, the underlying mechanism is structurally transferable to prescriptive regulations without structured pathways for climatic recalibration. This interpretation is diagnostic rather than prescriptive: it identifies a mechanism through which the CPG may widen under a static verification architecture, but does not, by itself, constitute a recommendation to adopt any specific alternative framework.
A shift toward outcome-based, climate-conditioned verification of the kind used in EPBD, IECC, or RE2020 would carry its own compliance costs. These could include greater dynamic-simulation capacity within the design and certification chain, potential envelope upgrades, and investment in administrative capacity-building. A full cost–benefit assessment of such a transition is beyond the scope of the present paper and is identified as an important direction for subsequent policy-oriented research.
5.4. Regulatory Transition Framework for Climate-Adaptive Thermal Codes
The CPG identified in
Section 5.2 and
Section 5.3 indicates that incremental tightening of prescriptive thresholds is insufficient under progressive warming. A staged restructuring of the verification architecture is required. The transition framework proposed here is not anchored to fixed calendar commitments, but responds to the margin compression and emissions-contingent validity horizon identified in
Section 4.5, with transition points corresponding to mid-century projections under SSP2-4.5, where cumulative overheating and cooling intensity exceed baseline compliance margins, and end-of-century SSP5-8.5 conditions, where peak demand and operative temperature exceedance indicate structural loss of passive resilience. These phases should therefore be interpreted as climate-conditional triggers rather than deterministic timelines.
5.4.1. Phase 1: Diagnostic Integration
Phase 1 focuses on capacity building within the existing regulatory apparatus. Under mid-century warming trajectories where prescriptive compliance retains functional validity, the regulatory intervention is limited to introducing climate-informed performance indicators—cumulative overheating intensity, cooling demand metrics, and nocturnal thermal recovery deficits—as mandatory analytical disclosures at the design review stage but without immediate compliance consequences. The objective is institutional rather than regulatory: building simulation competencies within the design professions, establishing assessor accreditation protocols, standardising future climate datasets, and embedding performance reporting within existing review procedures.
The need for standardised future weather files in building simulation has been documented extensively [
22] and recent evidence confirms that morphing methodology choice produces divergences of up to 40% in summer discomfort hours and 12 kWh·m
−2·year
−1 in annual cooling intensity [
67]. This variability underscores the importance of regulatory standardisation of approved datasets prior to enforceable integration.
Within the Algerian institutional context, the RETA application, which formalises prescriptive envelope checks under DTR C3.2/4 within the Centre for the Development of Renewable Energies (CDER), represents the natural technical vehicle for Phase 1 integration. RETA is a compliance-calculation tool operating under the Ministry of Energy; it does not itself hold the authority to amend the DTR C3.2/4 regulatory text, which rests with the National Centre for Integrated Building Studies and Research (CNERIB) under the Ministry of Housing, Urban Planning and the City (MHUV). Phase 1 is deliberately scoped to avoid requiring this authority: it extends RETA’s disclosure function without amending the regulatory text itself, and is therefore achievable without inter-ministerial regulatory coordination. Extending RETA to incorporate time-integrated performance indicators under approved future climate scenarios constitutes a technically feasible pathway for diagnostic integration without immediate regulatory restructuring and remains consistent with current institutional capacity constraints.
The margin-monitoring indicators introduced in this phase could be assigned to the Intersectoral Energy Management Committee (CIME), an existing national consultative body advising the Minister of Energy on cross-sectoral energy-mastery policy. CIME could review indicators on a defined cadence (e.g., aligned with existing five-year national energy-planning cycles). Its role would remain advisory rather than decisional: formally triggering Phase 2 would still require coordinated action by the Ministries of Energy and Habitat, since amending DTR C3.2/4 itself remains CNERIB’s and the MHUV’s prerogative.
5.4.2. Phase 2: Hybrid Dual-Pathway Regulation
When exceedance frequencies and cooling intensities systematically surpass baseline compliance margins, this framework introduces a hybrid compliance structure in which conformity may be achieved either through strengthened prescriptive baselines or through a verified performance pathway evaluated using regulator-specified future climate datasets. This dual-pathway logic is consistent with documented regulatory transitions in comparable contexts; the World Bank has recommended integrating envelope performance standards with demand-side planning tools to prevent early infrastructure lock-in in rapidly developing cooling markets [
44]. Operationally, Phase 2 mirrors the dual-pathway architecture already codified in the US IECC (
Table 12), in which prescriptive and performance routes coexist and compliance migrates progressively toward simulation as professional capacity matures. Two design elements are decisive. First, the future-climate reference datasets must be regulator-specified rather than analyst-selected, closing the methodological ambiguity identified in
Section 2.1. Second, the trigger for mandatory use of the performance pathway should be tied to the margin-monitoring indicators introduced in Phase 1, so that the transition is activated by observed climatic drift rather than administrative discretion. Hybrid regimes of this type in the Netherlands were sustained by deliberate capacity-building investment [
68], underscoring that the credibility of the pathway rests on the accreditation and audit infrastructure established during Phase 1.
Unlike Phase 1, formalising a performance pathway within DTR C3.2/4 requires amending the regulatory text itself, and therefore requires CNERIB’s technical authorship and the MHUV’s regulatory approval. Accreditation of assessors and simulation practitioners is a plausible mandate for the National Agency for Energy Management and Energy Efficiency (ANMEEE), created in July 2026 through the merger of APRUE and CEREFE. We note that this agency’s mandate for this specific accreditation function is not yet established in practice, and flag it as a plausible institutional vehicle rather than a demonstrated one. Financing capacity-building of the kind documented in the Netherlands [
56] could plausibly draw on the National Fund for Energy Management, Renewable Energy and Cogeneration (FNMEERC), which is funded in part by 1% of Algeria’s oil royalty.
5.4.3. Phase 3: Performance-Integrated Regulation
Under end-of-century warming conditions, outcome-based verification becomes the primary compliance mechanism for residential buildings and high-occupancy typologies. The defining structural feature of this phase is the formal linkage between regulatory revision cycles and updates to nationally approved climate projections, embedding an evidence-driven mechanism for adaptation, directly countering the risk of regulatory lock-in identified in
Section 5.3. Three enabling conditions determine the framework’s viability. First, the availability of standardised, regulator-approved future climate datasets is a prerequisite for all three phases. Second, robust accreditation and audit mechanisms are required to ensure reliability and reproducibility for simulation-based compliance demonstrations. Third, a data governance framework, potentially built upon existing RETA infrastructure and energy certification systems, is necessary to support longitudinal performance monitoring and iterative recalibration of indicators and thresholds. Without feedback mechanisms connecting regulatory outputs to observed building performance, phase transitions risk becoming arbitrary rather than empirically grounded.
The feasibility of this transition framework depends on conditions beyond the thermal performance domain. Highly subsidised electricity tariffs suppress the price signals that would otherwise reward envelope performance, weakening the demand-side rationale for regulatory stringency [
69,
70]. The electricity network itself embodies path dependence: peak demand shifted from winter to summer between 2000 and 2016 alongside rapid air-conditioning uptake [
71], reached a record 19.54 GW in July 2024 [
72], and continues to drive reinforcement investment [
11], a trajectory consistent with the building-scale projections of this study. Finally, institutional responsibility for thermal regulation is itself split across ministries: DTR C3.2/4 authorship sits with CNERIB under the MHUV, while compliance tooling, energy efficiency programming, and prospective accreditation infrastructure sit under Ministry of Energy bodies (CDER and ANMEEE). Any transition of the kind proposed here therefore requires inter-ministerial coordination, not only sectoral capacity-building, as a further precondition alongside the three constraints above.
These constraints are mutually reinforcing: subsidised pricing accelerates air-conditioning adoption, the resulting summer peaks lock infrastructure investment into cooling-dependent load structures, and prescriptive regulation permits the thermally weak envelopes that feed the cycle. Building thermal regulation and electricity distribution planning thus operate as interdependent systems; absent coordination between code revision cycles and utility capacity planning and thermal inadequacy at the building scale are externalised to public infrastructure budgets, reinforcing a second-order regulatory lock-in within Algeria’s electricity governance framework [
69,
71]. Costing this transition (capacity-building investment, accreditation infrastructure, and dataset development and maintenance) is beyond the scope of the present paper.
6. Limitations and Future Research
The limitations are organised into three categories: input-data uncertainty, modelling uncertainty, and scope-related uncertainty. These limitations mainly affect the absolute magnitudes of the results and their extrapolation, whereas the structural findings remain linked to the architecture of the verification procedure.
6.1. Input-Data Uncertainty
The archetype was calibrated against quarterly energy-consumption data, which constrain the aggregate seasonal energy balance under conditioned operation but not the hourly thermal response of individual dwellings. OHDH28, NEH26, and TA were calculated under free-running conditions, with mechanical cooling disabled, and are therefore not directly validated by the utility data. They should be interpreted as model-based projections of passive thermal response rather than as empirically measured estimates.
The calibration produced CV(RMSE) values of 37.18% and 41.49% for calibration and validation, respectively, while the NMBE remained low (−0.03% and +1.31%). This indicates limited systematic bias in the population mean but substantial unexplained dispersion, which is consistent with a population-level rather than dwelling-level calibration [
57,
58]. The residual partitioning is descriptive and does not establish the respective contributions of behaviour, stochastic variability, or measurement error.
Of the 298 dwellings with available billing records, 177 dwellings belonging to the dominant electricity and natural-gas consumption clusters were retained. The resulting archetype therefore represents the central tendency of the available stock rather than its full behavioural and socio-economic diversity, particularly its upper tail of consumption and thermal exposure. In addition, the single-station TMY used for calibration represents statistically typical conditions rather than the specific weather during the billing periods and does not capture local effects such as urban heat islands, shading, or building density [
73]. These limitations may contribute to the unexplained dwelling-level variation.
6.2. Modelling Uncertainty
One composite ensemble-mean weather file was generated for each scenario and time horizon. The simulations therefore represent scenario-conditioned mean responses rather than probabilistic ranges. Moreover, the morphing method preserves the temporal structure of the baseline TMY and cannot generate multi-day heat events absent from that year [
24]. Heatwave persistence, and consequently cumulative overheating in
OHDH28 and
NEH26, may therefore be under-represented. The results should be interpreted as conditional on the selected scenarios, reference year, and morphing method, rather than as conservative bounds.
Occupancy schedules, internal heat gains, and HVAC setpoints were held constant across scenarios, defining the analysis as a ceteris paribus climate-sensitivity experiment rather than a forecast of future operation. Sensitivity to infiltration, internal gains, and natural ventilation were assessed using a one-at-a-time design, which captured the main effects but not parameter interactions. A global sensitivity analysis would be required to quantify these interactions and to incorporate behavioural adaptation and future cooling adoption.
6.3. Scope and Extrapolation Uncertainty
The analysis is based on one archetype in Algiers and one climatic zone. Regulatory calculations may be transferable to the same typology within DTR Zone A because the regulation applies uniform coefficients across the zone; however, the calibrated dynamic response should not be extrapolated without further replication. National-scale electricity estimates also rely on assumptions of uniform dwelling size, construction quality, occupancy, equipment efficiency, behaviour, and grid-emission factors. They should therefore be regarded as order-of-magnitude scaling calculations for Zone A rather than forecasts of national demand.
The proposed transition framework is analytical and illustrative. It does not include cost–benefit, distributional, compliance, construction, household, or administrative assessments. The proposed indicators should consequently be regarded as candidates for diagnostic adoption rather than as validated regulatory requirements.
6.4. Future Research Directions
Five directions follow, broadly mirroring the three sources of uncertainty above: (i) replicating the analysis across other Algerian climatic zones to test generalisability and support stock-weighted national estimates; (ii) using multiple reference years, per-GCM or dynamically downscaled weather files, and full ensemble propagation for interannual variability, heatwave persistence and humidity; (iii) variance-based global sensitivity analysis with endogenous modelling of occupant adaptation and cooling adoption, relaxing the ceteris paribus assumption; (iv) coupling with electricity-system models for load coincidence, generation adequacy, network constraints and tariff effects; and (v) applying the CPG framework in other MENA countries. Across all five, incorporating urban heat-island effects and building-resolved microclimate modelling would improve climatic boundary conditions at every stage, from calibration to scenario projection.
7. Conclusions
This study demonstrates that prescriptive thermal regulation calibrated to historical climatic conditions can become structurally misaligned with progressive warming. By operationalising and quantifying the CPG within Algeria’s DTR C3.2/4 framework, the analysis shows that formal regulatory compliance may persist even as buildings experience substantial deterioration in thermal and energy performance. Under the SSP5-8.5 scenario by 2080, the regulatory verification point shifts by only +1.17 °C, whereas cumulative overheating intensity increases by 297%, from 1387 to 5512 °C·h. At the same time, nocturnal thermal recovery is effectively eliminated, with 98.1% of summer night-time hours exceeding 26 °C, and cooling energy use intensity increases by 351%. The regulatory signal and the underlying performance response therefore diverge by factors of 39 for cumulative overheating and 46 for cooling energy intensity. These results reveal a fundamental limitation of DTR C3.2/4: its stationary climatic reference, single verification hour, and omission of overheating duration and nocturnal conditions make compliance an increasingly unreliable proxy for thermal habitability and operational resilience under climate change. The numerical results should be interpreted as scenario-conditioned estimates whose magnitude depend on the empirical, climatic, behavioural, and modelling assumptions detailed in
Section 6. Nevertheless, these uncertainties do not undermine the principal structural finding. They instead define the range within which the CPG may evolve. The contribution of this study therefore lies not in predicting a single future outcome, but in demonstrating how the architecture of a regulatory verification procedure can be stress-tested against evolving climatic conditions.
Although the analysis is conducted at the building scale, its implications extend to energy-system governance. The projected shift from heating- to cooling-dominated demand suggests a greater summer concentration of residential electricity consumption. In Algeria, where peak electricity demand reached 19.54 GW in July 2024, continued reliance on historically based regulatory assumptions could contribute to a sustained increase in summer residential peaks, precisely the systemic effect that the current verification framework cannot capture. Integrating thermal-performance indicators with updated climate projections would therefore strengthen both the climate relevance of building regulations and the reliability of energy-demand planning and decarbonisation strategies. The findings support a transition from static compliance towards adaptive regulatory governance, for which the three-phase pathway proposed in
Section 5.4 provides a possible institutional route. The costs, administrative requirements, distributional effects, and feasibility of this transition remain beyond the scope of this study and require dedicated policy research, including a full cost–benefit assessment.
Finally, although the empirical demonstration is grounded in Algeria, the mechanism identified is not context-specific. Any prescriptive thermal regulation anchored in fixed climatic reference conditions is potentially vulnerable to the same type of misalignment under progressive warming. The stress-testing framework developed here therefore provides a transferable approach for evaluating the climate resilience of regulatory systems. More broadly, the study shows that building codes are not merely technical instruments: they shape future electricity-demand trajectories, influence exposure to thermal discomfort, and condition the feasibility of energy transitions. Aligning thermal regulation with evolving climatic realities is consequently not only a matter of improving building performance; it is a prerequisite for credible, equitable, and climate-resilient energy governance.





 ,
,