1. Introduction
As urban populations age, nearby public open spaces are becoming increasingly important to everyday life in dense neighbourhoods. Older adults particularly value spaces close to home that support recreation, light exercise, informal social interaction, and contact with nature [
1,
2,
3,
4]. Pocket parks are particularly relevant in dense urban areas because their small scale and accessibility can bring green-space opportunities closer to residents’ daily lives [
5,
6]. Their compact form places paths, planting, facilities, resting areas, activity spaces, and street interfaces in close proximity, making the clarity of spatial information particularly relevant to everyday use.
Research on age-friendly parks and urban green spaces has commonly examined accessibility, path quality, seating, vegetation, facilities, maintenance, opportunities for physical activity, and perceived safety [
7,
8,
9,
10]. These attributes provide a broad account of park usability but offer less insight into how older users interpret space while choosing a route, approaching a facility, avoiding an obstacle, or deciding where to stay. A park may contain suitable paths, seating, lighting, planting, and exercise facilities yet remain difficult to negotiate when views are obstructed, boundaries are indistinct, route cues are interrupted, or circulation overlaps with other activities.
Visual information becomes especially important when age-related changes in contrast sensitivity, depth perception, and visual acuity affect movement. Research on neighbourhood mobility has linked older adults’ experiences to visibility, enclosure, spatial occlusion, and physical barriers [
11,
12]. Experimental studies have also shown that the visibility and contrast of step edges, obstacles, and path cues influence foot placement, obstacle crossing, and gait adaptation [
13,
14,
15,
16]. The design relevance of a visible feature lies not simply in whether it can be seen, but in whether it helps users recognize a spatial change and respond in time. This is particularly important at entrances, turns, level transitions, and shared-use routes, where several sources of spatial information may need to be interpreted simultaneously.
Perceived visual safety overlaps with several established concepts but is not identical to them. Environmental legibility concerns the comprehensibility of spatial organization, while wayfinding refers to orientation and route choice, including the use of visible landmarks at decision points [
17]. Spatial cognition encompasses the broader mental processes involved in understanding and navigating space. General perceived safety may include crime-related and other environmental concerns and does not necessarily correspond directly to objectively measured conditions [
18,
19]. In this study, perceived visual safety refers more specifically to an older adult’s appraisal of whether the visible environment provides enough information to decide how to proceed at a particular location. It concerns seeing what lies ahead, identifying a walkable route, recognizing boundaries and level changes, and anticipating nearby movement.
For questionnaire development, perceived visual safety was organized into five provisional content domains: sightline clarity, boundary legibility, visual comfort, cue continuity, and walking confidence. Sightline clarity, boundary legibility, and cue continuity concern the availability and organization of information used to recognize routes, edges, transitions, and direction. Visual comfort concerns the readability of this information under glare, shadow, reflection, or visual clutter, while walking confidence reflects the user’s perceived ability to act on the information available. Together, the five domains cover the availability of visual–spatial information, its readability, and users’ confidence in proceeding. They were used to organize the preliminary questionnaire, while their empirical structure was examined rather than assumed. The questionnaire addresses subjective appraisals of visible movement conditions rather than clinical visual ability, physical mobility, objectively recorded hazards, or observed wayfinding performance.
Older adults’ park use is shaped by neighbourhood-scale factors such as walkability, perceived environmental quality, park-use intentions, and the organization of activity areas [
20,
21,
22,
23,
24]. Site-level studies have also examined gradients, surface quality, shade, spatial continuity, supporting facilities, and visual character [
25,
26,
27]. Much of this work evaluates park attributes at an aggregate level or treats preference, satisfaction, use, and perceived safety as broad outcomes. Less is known about the particular locations where visual information becomes insufficient for judging a route, boundary, level transition, or nearby movement. Localized difficulties may therefore be overlooked in park-wide assessments, especially in pocket parks where circulation, resting and other stationary activities, planting, facilities, and surrounding street movement meet within a limited area.
This study investigates older adults’ perceived visual safety in four selected pocket parks in Nanjing, China, with particular attention to the locations where movement decisions are made. It evaluates the empirical structure of a preliminary 20-item questionnaire, compares the exploratory 20-item composite across the four cases, and examines associations with six perceived environmental problems while accounting for direct overlap between predictor and outcome content. Interview notes and field records are used to locate reported difficulties and relate them to site-specific spatial conditions. Through this problem-centred multiple-case design, the study aims to clarify how perceived visual-safety problems are situated at particular movement locations and to inform case-specific considerations for age-friendly pocket-park renewal.
2. Materials and Methods
2.1. Study Design and Setting
An exploratory multiple-case design was used to examine older adults’ perceived visual safety during everyday pocket-park use. Each park was treated as a bounded case. Questionnaire data characterized participants’ appraisals, while interview notes and field records were used to locate reported difficulties and relate them to site-specific spatial conditions.
The study was conducted in Gulou District, Nanjing, China. The Seventh National Population Census recorded 940,387 permanent residents in the district [
28]. By the end of 2023, adults aged 60 years or older accounted for 29.2% of its registered population [
29]. Gulou contains established neighbourhoods with ageing populations and a compact urban fabric. Many small public spaces have been created through the renewal of street-edge, roadside, corner, and residual sites. Their proximity to residential areas and neighbourhood walking and activity networks made the district suitable for examining how older adults interpret visible spatial information during park use.
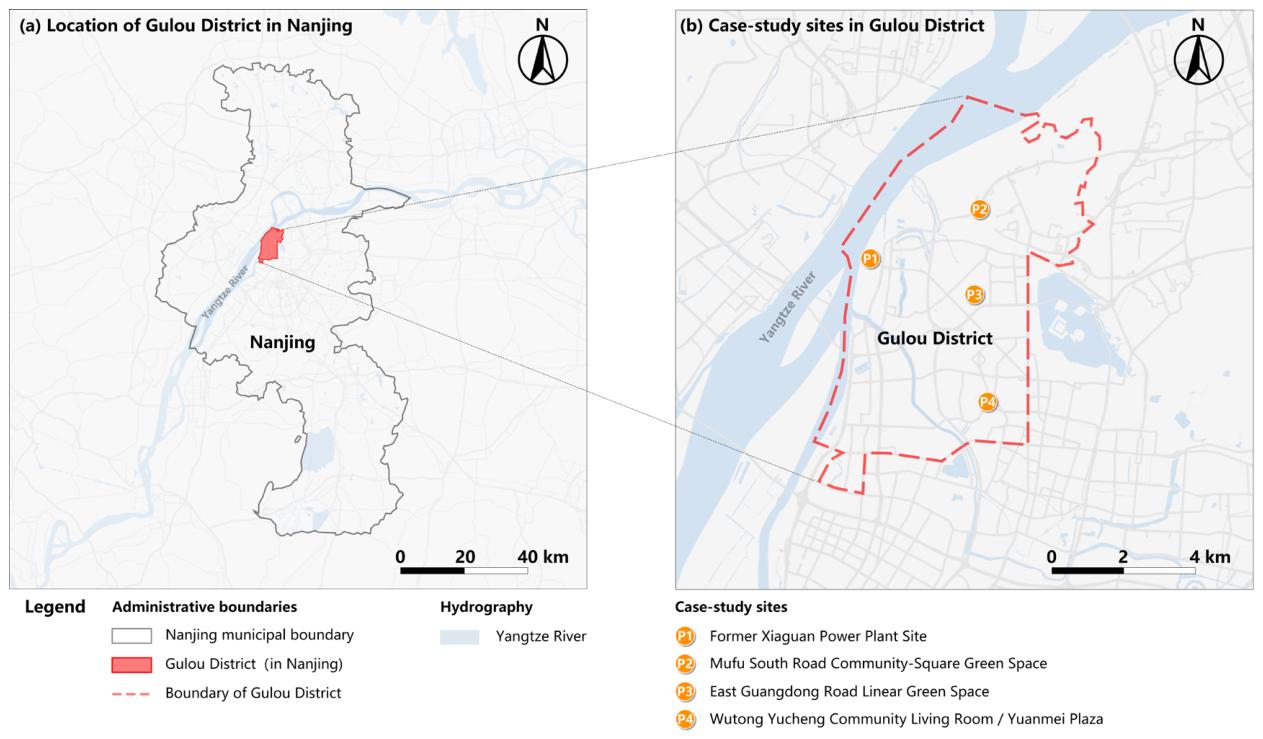
Four pocket parks were purposively selected to vary in area, spatial form, internal circulation, surrounding interfaces, and everyday use: Former Xiaguan Power Plant Site Pocket Park (P1), Mufu South Road Community-Square Green Space (P2), East Guangdong Road Linear Green Space (P3), and Wutong Yucheng Community Living Room/Yuanmei Plaza (P4). Eligible sites were publicly accessible, served nearby neighbourhoods, formed part of local walking and activity networks, and fell within the area range specified in the national Pocket Park Construction Guidelines (Trial) [
30]. The guidelines classify pocket parks as small (400–2000 m
2), medium-sized (2000–5000 m
2), or large (5000–10,000 m
2). P1 was classified as small, P4 as medium-sized, and P2 and P3 as large. At 10,000 m
2, P2 lies at the upper boundary of the specified range. P4 also functions as a community living room and plaza but meets the same accessibility, neighbourhood-service, area, and functional criteria. These spatial descriptors characterize the selected cases and were not treated as general park-type categories in the analysis.
The four cases encompassed compact block-edge, community-square, linear roadside, and plaza/interface settings, with different relationships among circulation, resting and other stationary activities, and surrounding movement.
Figure 1 shows their locations, and
Table 1 summarizes their areas, spatial characteristics, and selection rationale. Questionnaire and interview coverage, principal observation contexts, and the environmental-problem categories represented in the field records for each case are summarized in
Appendix A (
Table A1).
2.2. Participants and Data Collection
Participants were park users aged 60 years or older. Convenience intercept sampling was conducted at the four sites from 21 to 28 October 2025, covering weekdays, weekends, and different periods of the day. Fieldwork hours were neither fixed nor systematically logged. The sample represents older adults encountered while using the selected parks during the study period rather than the wider older population, particularly residents who seldom used or avoided these spaces. Because the numbers of eligible individuals approached and those declining participation were not recorded, a survey response rate could not be calculated.
Before data collection, the research team held several meetings to establish common procedures for approaching potential participants, explaining the study, administering the questionnaire, protecting privacy, and respecting voluntary participation. Eligible users were informed of the study purpose, the intended use of the data, the anonymity of their responses, and their right to decline or withdraw. Verbal informed consent was obtained before participation, and no directly identifying information was collected.
A total of 420 paper questionnaires were collected and entered into Microsoft Excel 2021 (Microsoft Corporation, Redmond, WA, USA). The questionnaires were screened for missing required responses, selections outside the available options, clearly erroneous or internally inconsistent responses, and highly repetitive response patterns. Highly repetitive responses included straight-line completion, defined as selecting the same response option throughout the questionnaire. Thirty-four questionnaires were excluded: 25 had missing required responses, three contained responses that could not be validly coded or were internally inconsistent, and six showed highly repetitive or straight-line response patterns. The six response-pattern exclusions were confirmed through review of the original paper forms. The resulting analytical sample comprised 386 questionnaires, representing 91.9% of those collected: 94 from P1, 104 from P2, 89 from P3, and 99 from P4. This percentage represents the proportion of collected questionnaires retained rather than a survey response rate. Questionnaire completion time and any assistance provided during completion were not systematically recorded.
During questionnaire administration, respondents were invited to share experiences related to the study topics and asked whether they were willing to allow at least 15 min for an interview. Forty-five respondents agreed and were interviewed in Chinese: 9 in P1, 14 in P2, 11 in P3, and 11 in P4. No demographic quotas were applied. The interviews addressed participants’ impressions of the visible environment, locations they found difficult to interpret, obstructed sightlines, recognition of routes and boundaries, route judgement, and walking confidence. Follow-up questions asked where and under what circumstances these experiences occurred. Interviews were conducted by pairs of researchers, with one leading the conversation and the other taking contemporaneous notes. Actual interview durations were not systematically timed. The interviews were not audio-recorded or transcribed verbatim, and the notes were not linked to individual questionnaire responses. They were used as contextual, case-based evidence rather than as material for formal inductive qualitative analysis.
Site observations, photographs, and field notes were collected during the same period. These records documented conditions at entrances, turns, path intersections, planting edges, surface and level transitions, internal routes, activity areas, and interfaces among walking, cycling, parking, exercise, and social activities. They were used to relate participant-reported difficulties to observable spatial conditions within each case.
2.3. Measures
2.3.1. Individual Characteristics and Park-Use Behaviour
The questionnaire recorded gender, age group, income level, and self-reported ease of mobility to characterize the demographic and mobility profiles of the sampled users. Park-use behaviour was measured by walking time from home to the park, visit frequency, and whether participants reported visiting the park at night. These variables were used to describe the sample and were included as covariates in the regression analyses.
2.3.2. Perceived Visual Safety
Perceived visual safety was assessed using a preliminary 20-item questionnaire developed in Chinese for this study. Item development was informed by research on perceived neighbourhood attributes related to walking among Chinese older adults [
31], perceived environmental barriers to outdoor mobility [
32], community wayfinding [
33], route configuration [
34], park lighting [
35], and walking self-confidence [
36], together with preliminary field observations undertaken during questionnaire development. Candidate items were adapted to situations encountered during pocket-park use and organized into five prespecified content domains. Before data collection, the research team reviewed the Chinese questionnaire for content coverage, clarity, readability, and suitability for older respondents. The review did not include external expert assessment, cognitive interviewing, or independent pilot validation. One author translated the items into English, and the other authors checked the wording against the original Chinese questionnaire. The English version was prepared solely for publication and was not administered to participants. The complete English item statements are provided in
Appendix A (
Table A2).
The five domains were sightline clarity, boundary legibility, visual comfort, cue continuity, and walking confidence, with four items assigned to each domain. Sightline clarity, boundary legibility, and cue continuity concerned the availability and organization of visual–spatial information. Visual comfort addressed the readability of this information under glare, shadow, reflection, brightness contrast, or visual clutter. Walking confidence captured participants’ perceived ability to select and follow a route on the basis of the visible conditions around them; it was not intended as a measure of general falls efficacy or physical capacity. Visual comfort and walking confidence were treated as related aspects of visually guided spatial appraisal rather than as equivalent to its core spatial-information components.
Table 2 summarizes the evaluative focus and environmental conditions addressed by each domain.
The five domains served as provisional categories for organizing item content rather than as validated subscales. Their empirical structure was examined as described in
Section 2.4. For descriptive reporting, the four items assigned to each domain were averaged. The mean of all 20 items was calculated as an exploratory 20-item composite and interpreted in light of the measurement-structure analyses.
All items used a five-point Likert-type response format. The Chinese questionnaire paired agreement and satisfaction labels at each response point: 1 = strongly disagree/very dissatisfied, 2 = disagree/dissatisfied, 3 = neutral, 4 = agree/satisfied, and 5 = strongly agree/very satisfied. The paired labels accommodated the agreement- and satisfaction-oriented wording used across the item set while maintaining a common scoring direction. Higher scores indicated a more favourable appraisal of the visible conditions associated with park use.
2.3.3. Perceived Environmental Problems
Six environmental-problem categories were prespecified before formal data collection on the basis of the literature cited in
Section 2.3.2 and preliminary site observations. The categories covered obstruction, unclear spatial boundaries and level transitions, changing light conditions, visual complexity, discontinuous spatial cues, and interference among movement and stationary activities.
The six categories were vegetation/facility obstruction (EV1), boundary ambiguity (EV2), glare or shadow disturbance (EV3), visual complexity (EV4), cue discontinuity (EV5), and interface conflict (EV6). Each category was operationalized as a single Chinese-language item referring to conditions in the park where the respondent was surveyed. The items were specified before the interviews and were not derived from the interview notes. They were treated as separate perceived environmental-problem variables rather than as components of a multi-item scale.
All six items were worded as statements describing potentially problematic conditions and used the five-point response format reported in
Section 2.3.2. For these statement-based items, scoring followed the agreement labels. Higher scores indicated stronger endorsement of the stated problem and greater perceived problem severity. English translations of the complete item statements are presented in
Table 3.
2.4. Quantitative Analysis
Descriptive statistics were calculated for participant characteristics, park-use behaviour, perceived visual safety, and the six environmental-problem ratings. Differences in the exploratory 20-item composite across the four cases were examined using one-way analysis of variance (ANOVA), followed by Tukey’s HSD pairwise comparisons. Eta squared (η2) was calculated as the effect-size estimate.
Internal consistency was assessed using Cronbach’s alpha for the complete item set and Cronbach’s alpha and McDonald’s omega for each prespecified content domain. Factorability was evaluated using the Kaiser–Meyer–Olkin statistic and Bartlett’s test of sphericity. All 20 perceived visual safety items had five response options. Response-category use, item skewness, and excess kurtosis were examined to assess whether treating the items as approximately continuous was reasonable. Exploratory factor analysis used a Pearson correlation matrix, maximum-likelihood extraction, and Promax rotation. The number of factors was determined by parallel analysis. A supplementary five-factor solution was also examined for correspondence with the prespecified content domains.
The primary association analyses comprised six predictor-specific ordinary least-squares regression models. For each focal environmental problem, items with directly overlapping content were removed before the outcome mean was recalculated. Direct overlap was defined as explicit correspondence between the focal problem rating and the content of a perceived visual safety item. The removals were EV1: SC3; EV2: BL1–BL3; EV3: VC1–VC3; EV4: VC4; EV5: CC1–CC4; and EV6: SC2, SC4, BL4, WC2, and WC3. The resulting outcomes contained 19, 17, 17, 19, 16, and 15 items, respectively.
All six environmental-problem ratings were entered simultaneously in each model. The models adjusted for gender, age group, income level, self-reported ease of mobility, walking time to the park, visit frequency, night-time park use, and case membership. Environmental-problem ratings and ordered covariates were entered using their numerical category codes, so their coefficients represent the estimated mean change associated with a one-category increase. Case membership was represented by dummy variables, with P1 as the reference. HC3 robust standard errors and 95% confidence intervals were calculated. Because the outcome composition differed across the six models, their focal coefficients were not compared directly.
A secondary model used the exploratory 20-item composite and retained the same predictors and covariates. Unstandardized coefficients were reported for all models; standardized coefficients for the secondary model were calculated as β = B × SD(X)/SD(Y). Sensitivity analyses treated the ordered covariates as categorical variables and re-estimated the secondary model after omitting each park in turn.
Multicollinearity and model assumptions were examined using variance inflation factors, tolerance values, the Jarque–Bera and Breusch–Pagan tests, externally studentized residuals, leverage values, and Cook’s distance. HC3 robust standard errors were retained irrespective of the Breusch–Pagan result. Case indicators adjusted for average differences among the four sites; multilevel and cluster-robust models were not estimated because only four parks were included.
Analyses were conducted in Python 3.12. All tests were two-tailed, with statistical significance evaluated at p < 0.05. Holm adjustment was applied separately to the six focal environmental-problem tests in the primary analyses, the secondary model, and each sensitivity specification.
2.5. Problem Classification and Evidence Integration
Interview notes, site photographs, field notes, and questionnaire data were integrated at the case level. The interview notes recorded participants’ descriptions of difficult locations and associated movement responses, while the photographs and field notes documented the spatial settings and visible conditions at those locations. The interview notes were treated as contextual, case-based evidence rather than as data for formal inductive thematic analysis. No independent qualitative coding or formal assessment of thematic saturation was conducted, and the interview material was not used to estimate the frequency or prevalence of individual problems.
The interview and field materials were organized by park and according to the six prespecified environmental-problem categories. For each category, the research team compared participants’ descriptions with the relevant locations, spatial arrangements, photographs, and field notes. Classification questions were resolved through discussion among the research team. Questionnaire summaries and association estimates were then considered alongside the case-indexed interview and field materials. This process was used to interpret how each problem appeared within the selected parks and to develop case-specific design implications. The five prespecified perceived visual safety content domains were not used as qualitative themes.
3. Results
3.1. Respondent and Park-Use Characteristics
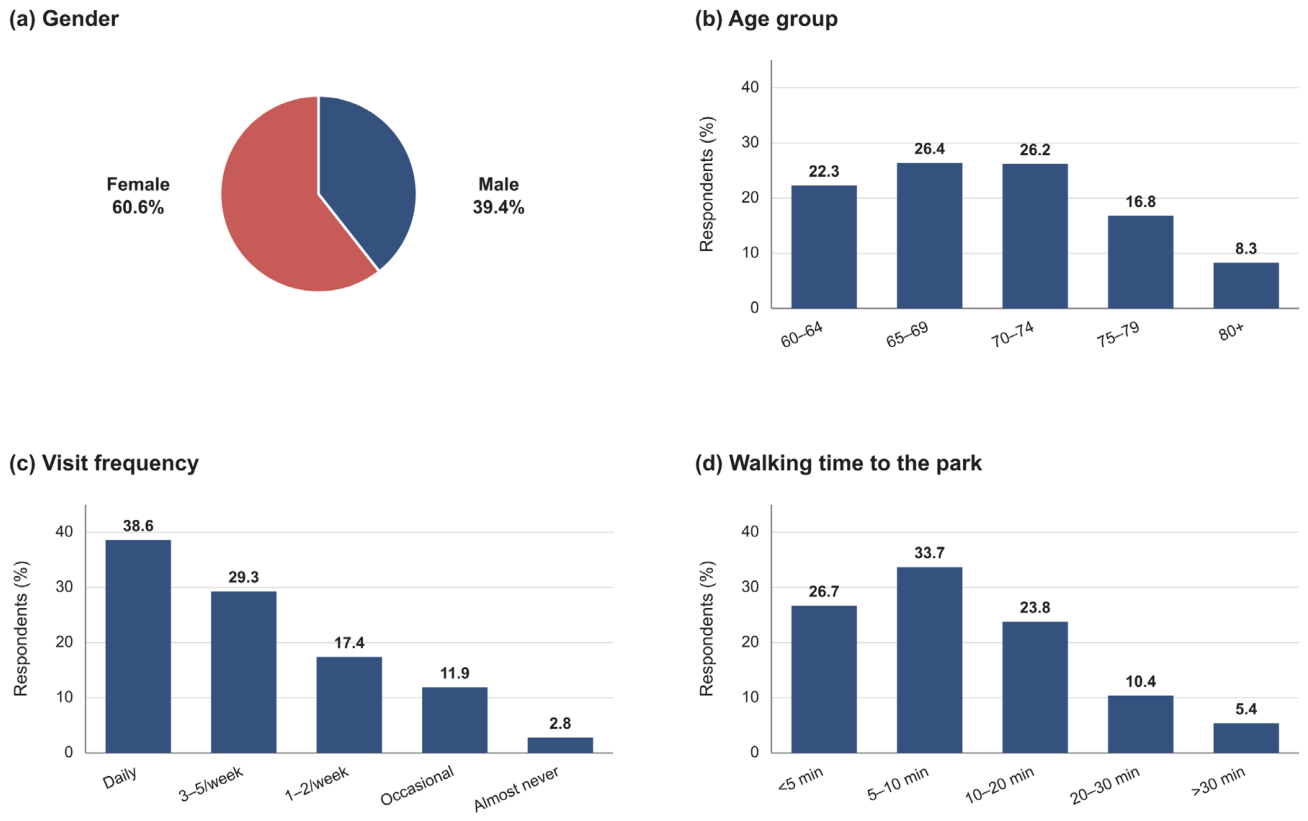
The analytical sample comprised 234 women (60.6%) and 152 men (39.4%). The largest age groups were 65–69 years (
n = 102, 26.4%) and 70–74 years (
n = 101, 26.2%). Daily park use was reported by 149 respondents (38.6%), and 113 (29.3%) visited three to five times per week. A total of 233 respondents (60.4%) lived within a 10-min walk of the park: specifically, 103 (26.7%) reported a walking time of less than 5 min, and 130 (33.7%) reported 5–10 min. Overall gender, age, visit-frequency, and walking-time distributions are shown in
Figure A1, and selected respondent and park-use characteristics for each case are presented in
Table A3, both in
Appendix A.
3.2. Visual-Safety Problems Encountered in Everyday Pocket-Park Use
Across the four cases, the interview notes recorded difficulties at locations where participants needed to interpret routes, boundaries, level changes, sightlines, or nearby movement. Reported responses included slowing before turns or transitions, looking down to judge the walking surface, checking a route repeatedly, changing direction, detouring around unclear areas, and feeling less confident where circulation overlapped with other activities. These accounts referred mainly to entrances, turns, path intersections, planting edges, surface transitions, and shared movement–activity interfaces.
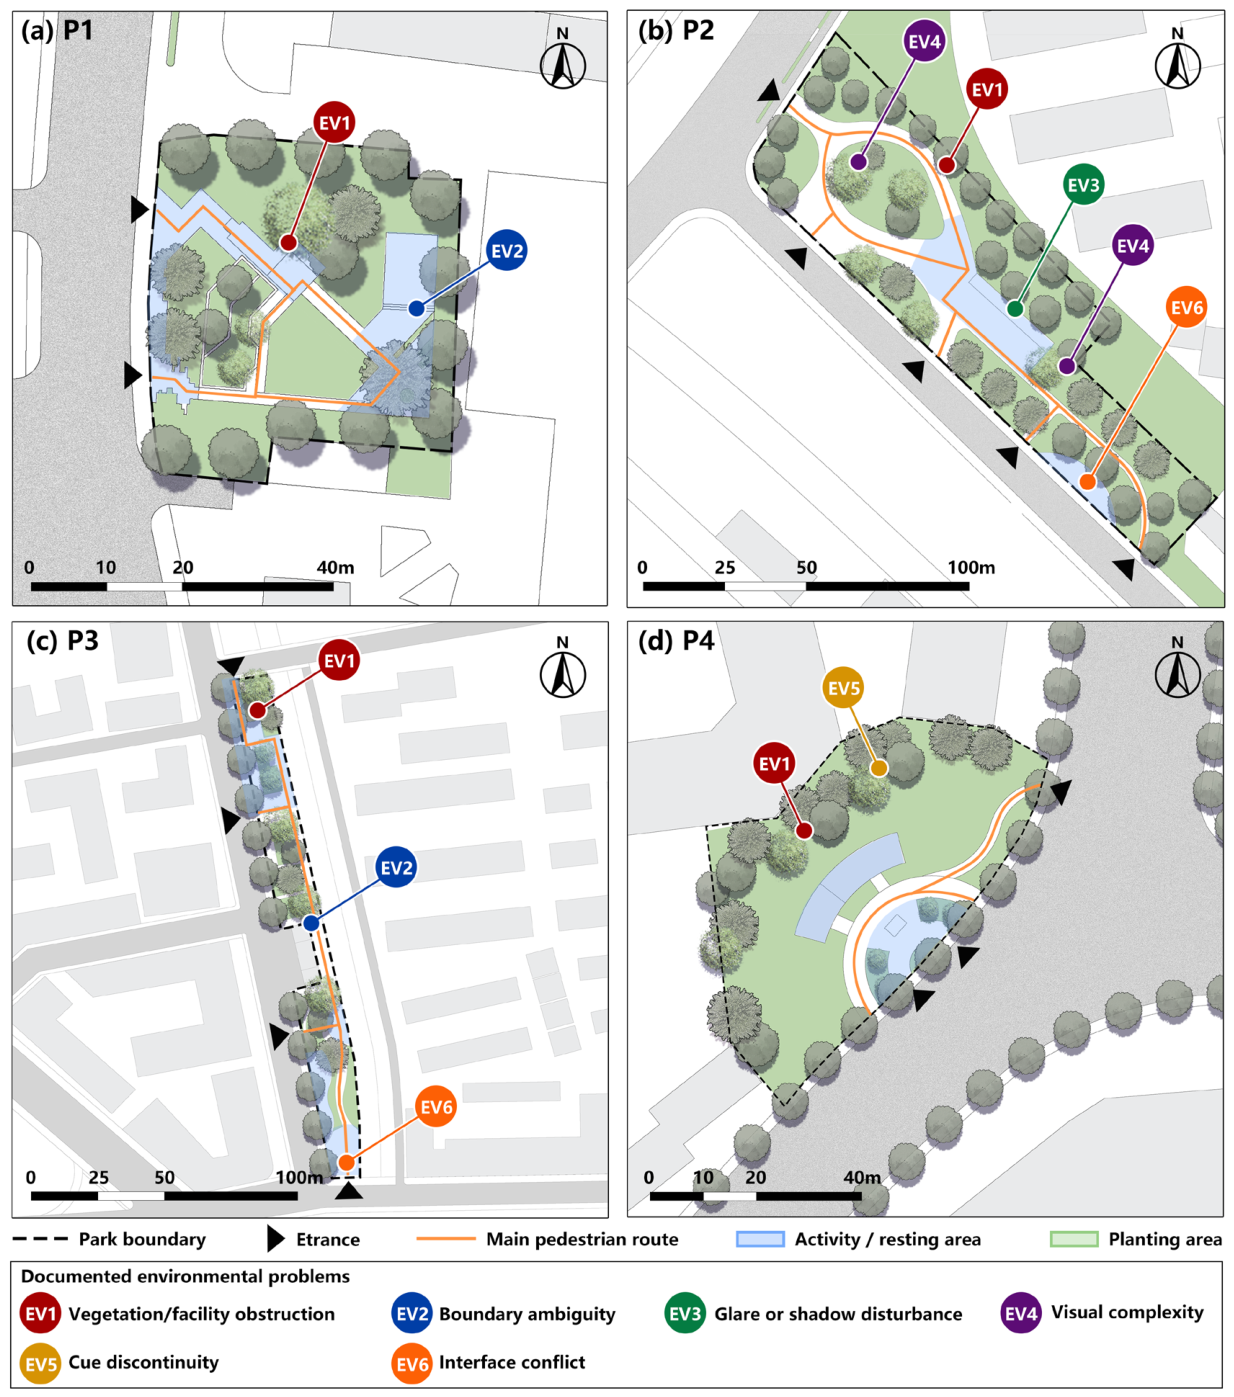
Figure 2 shows the park boundaries, entrances, principal pedestrian routes, activity and resting areas, planting areas, and the approximate locations of documented environmental problems, identified by matching the interview notes and site photographs with the site plans. The documented problems differed across the four cases. At P1, vegetation/facility obstruction and boundary ambiguity were identified near internal routes and level transitions. P2 contained the broadest range of documented problems, including vegetation/facility obstruction, glare or shadow disturbance, visual complexity, and interface conflict. At P3, vegetation/facility obstruction and boundary ambiguity were documented within the park, while interface conflict occurred where entrances and circulation routes adjoined the street. At P4, vegetation/facility obstruction and cue discontinuity were documented along planting edges and minor routes.
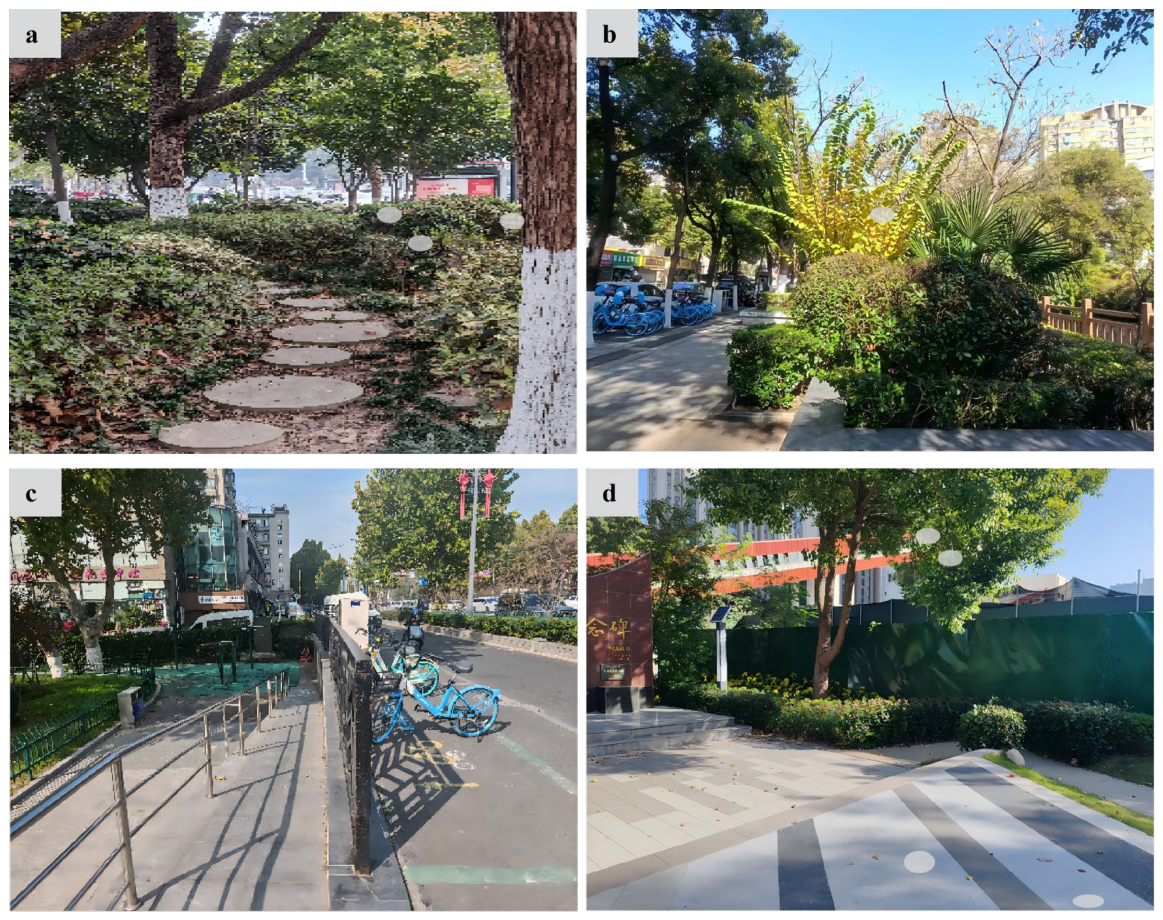
Figure 3 presents one documented field condition from each case: a discontinuous minor route at P4, vegetation-obstructed sightlines at P3, a roadside movement interface at P2, and a poorly legible level transition at P1.
3.2.1. Vegetation and Facility Obstruction
Vegetation or facilities restricted forward views near entrances, turns, and path intersections in all four cases. Participants described difficulty seeing the space beyond these obstructions or anticipating approaching users. Recorded responses included slowing, changing viewing position, and checking ahead before continuing. Field examples included low branches, dense shrubs, street furniture, and other installations located close to walking routes.
3.2.2. Boundary Ambiguity
Boundary ambiguity was documented at P1 and P3. The relevant locations included steps, ramps, kerbs, paving transitions, and edges separating paths from planting or activity areas. Participants described uncertainty about the extent of the walkable surface and reported looking down, slowing, or checking their footing near visually indistinct edges and level changes. The field records identified poorly legible steps at both parks and indistinct park–street boundaries at P3.
3.2.3. Glare or Shadow Disturbance
Glare or shadow disturbance was documented at P2, where glare and uneven brightness occurred beneath a pergola with limited shade and along light–dark transitions. Participants described watching the ground more closely and slowing where shadows or reflections resembled changes in paving or elevation. The reported difficulties concerned the visibility of path edges, surface patterns, obstacles, and minor level changes under changing light conditions.
3.2.4. Visual Complexity
Visual complexity was documented at P2 in areas containing mixed paving patterns, clustered facilities, dense planting, and overlapping activities. Participants described checking route direction and nearby movement before proceeding through visually busy locations. The interview notes also recorded repeated route checking where circulation, resting, and activity areas were not clearly distinguished.
3.2.5. Cue Discontinuity
Cue discontinuity was documented at P4, particularly along minor paths and stepping-stone routes. Gaps between stepping stones and indistinct planting edges made route alignment difficult to identify. Participants described hesitation, repeated route checking, and changes in direction where paving, path alignment, or other route-defining features did not provide continuous guidance.
3.2.6. Interface Conflict
Interface conflict was documented at P2 and P3. P2 contained a roadside interface adjoining an arterial road, while several entrances at P3 opened directly onto the street. Participants described slowing, waiting, detouring, and checking nearby movement where walking routes overlapped with resting, exercise, gathering, bicycle, electric-bicycle, parking, or street-edge activities. The field records also documented parked vehicles and temporary occupation of circulation areas at these interfaces.
Table 4 summarizes the participant responses, corresponding field conditions, and spatial contexts associated with the six problem categories.
3.3. Preliminary Measurement Properties of the Perceived Visual Safety Instrument
Among the 20 perceived visual safety items included in the factor analysis, responses spanned all five categories for 17 items and four categories (2–5) for SC2, VC1, and WC4. Item skewness ranged from −0.525 to −0.247, and excess kurtosis ranged from −0.423 to 0.405, with no marked skewness or kurtosis. The complete questionnaire yielded a Cronbach’s α of 0.890, an average inter-item correlation of 0.287, and corrected item–total correlations ranging from 0.459 to 0.556. Across the five prespecified content domains, Cronbach’s α ranged from 0.718 to 0.804 and McDonald’s ω ranged from 0.719 to 0.804. Boundary legibility had the highest internal-consistency estimates (α = 0.804; ω = 0.804), while visual comfort had the lowest (α = 0.718; ω = 0.719). The item correlation matrix was suitable for exploratory factor analysis (KMO = 0.903; Bartlett’s test of sphericity, χ2(190) = 2556.75, p < 0.001).
Parallel analysis supported a four-factor solution: the fifth observed eigenvalue (1.178) was lower than the corresponding 95th-percentile simulated value (1.231). In the maximum-likelihood Promax solution, primary loadings ranged from 0.683 to 0.776 for sightline clarity, 0.625 to 0.840 for boundary legibility, 0.576 to 0.742 for cue continuity, and 0.598 to 0.832 for walking confidence. The visual-comfort items did not define a separate factor; their largest absolute pattern loadings ranged from 0.197 to 0.286, and their communalities ranged from 0.236 to 0.290. Correlations among the four retained factors ranged from 0.451 to 0.658.
Table 5 summarizes the internal-consistency estimates and pattern-loading ranges, and the complete four-factor pattern matrix is provided in
Appendix A (
Table A4).
In the supplementary five-factor extraction, primary loadings ranged from 0.529 to 0.813, and the visual-comfort items formed a separate factor only when five factors were imposed. For the subsequent analyses, the 20-item mean was retained as a prespecified broad exploratory composite and was not interpreted as evidence of unidimensionality.
3.4. Differences in the Exploratory 20-Item Composite Across the Four Selected Cases
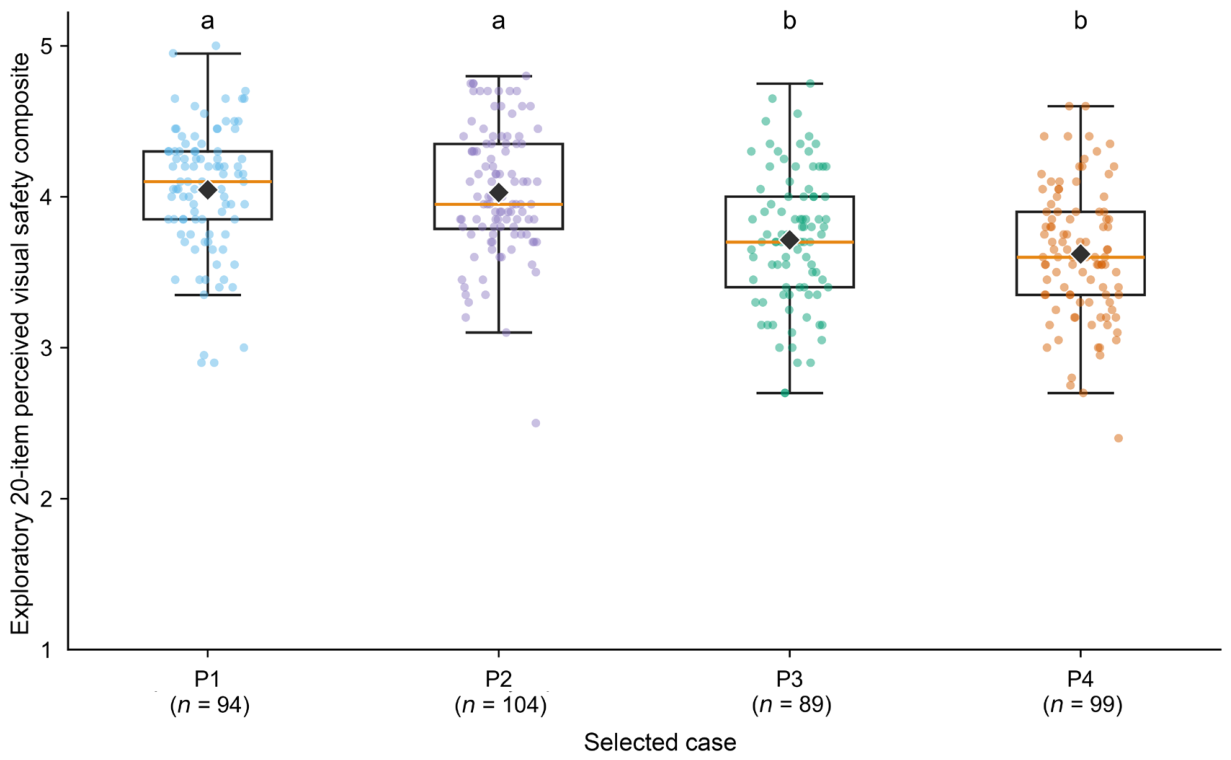
An unadjusted one-way ANOVA showed that the exploratory 20-item composite differed across the four selected cases (F(3, 382) = 24.727, p < 0.001, η2 = 0.163). P1 had the highest mean (M = 4.046, SD = 0.423), followed by P2 (M = 4.029, SD = 0.420), P3 (M = 3.715, SD = 0.448), and P4 (M = 3.621, SD = 0.433). The difference between the highest and lowest case means was 0.425 points.
Tukey’s HSD showed no statistically significant difference between P1 and P2 or between P3 and P4. Exploratory 20-item composite values were significantly higher in P1 and P2 than in P3 and P4. The five prespecified content-domain means followed the same descriptive ordering.
Figure 4 presents the composite-score distributions and Tukey pairwise groupings, while the content-domain and composite-score statistics are reported in
Appendix A (
Table A5).
3.5. Primary De-Overlap and Secondary 20-Item Composite Analyses
In the predictor-specific de-overlap models, none of the six focal associations met the Holm-adjusted significance threshold. Interface conflict was associated with a lower de-overlapped score before correction (B = −0.0658, 95% CI [−0.1161, −0.0156], raw
p = 0.010), but its Holm-adjusted
p value was 0.062. The other five focal associations were also nonsignificant after correction (
Table A6A).
The secondary model using the exploratory 20-item composite explained 25.1% of the variance in the exploratory 20-item composite (R
2 = 0.251; adjusted R
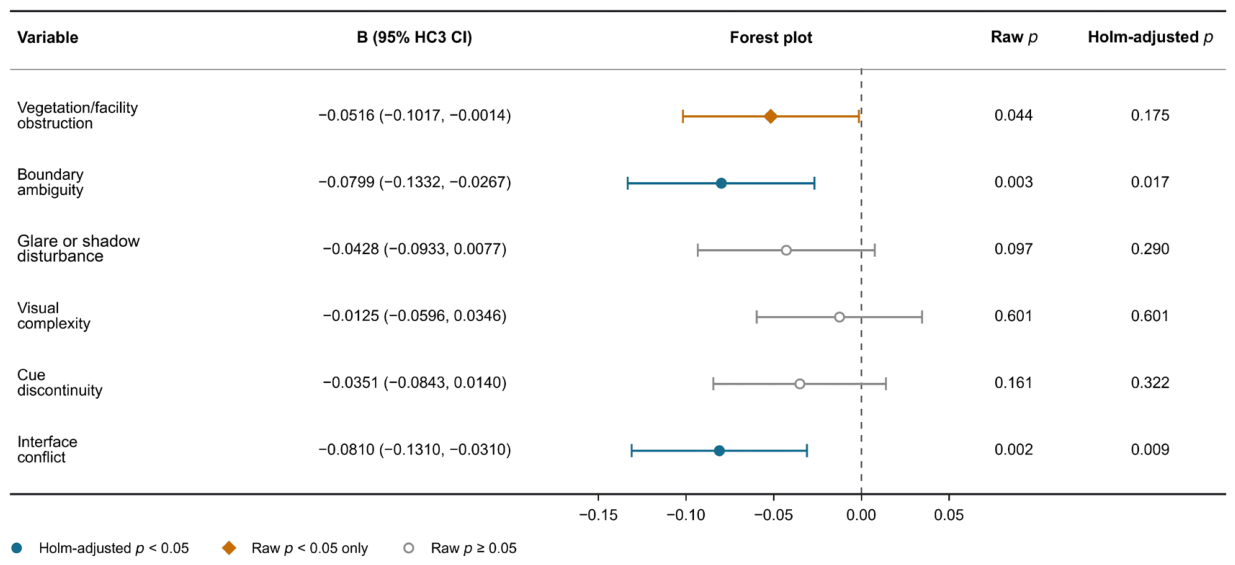
2 = 0.218). Boundary ambiguity (B = −0.0799, 95% CI [−0.1332, −0.0267], Holm-adjusted
p = 0.017) and interface conflict (B = −0.0810, 95% CI [−0.1310, −0.0310], Holm-adjusted
p = 0.009) were associated with lower composite values. Vegetation/facility obstruction met the unadjusted significance threshold (B = −0.0516, raw
p = 0.044) but not the Holm-adjusted threshold (
p = 0.175); the remaining three environmental-problem ratings were not statistically significant. Compared with P1, adjusted composite values were lower in P3 (B = −0.2358,
p < 0.001) and P4 (B = −0.3211,
p < 0.001), whereas P2 did not differ from P1 (B = −0.0089,
p = 0.885).
Figure 5 presents the environmental-problem coefficients from this model. These estimates were treated as secondary because the outcome retained items that overlapped conceptually with some environmental-problem ratings.
For the secondary model, the maximum VIF was 4.615 and the minimum tolerance was 0.217. The Breusch–Pagan test did not indicate heteroskedasticity (
p = 0.811), the maximum Cook’s distance was 0.0256, and the largest absolute externally studentized residual was 3.230. Complete model estimates are reported in
Table A7, with descriptive statistics, correlations, multicollinearity statistics, and diagnostic results shown in
Table A8.
3.6. Sensitivity Analyses of the Secondary 20-Item Composite Model
When the ordered covariates were treated as categorical variables, boundary ambiguity (B = −0.0817, 95% CI [−0.1385, −0.0249], Holm-adjusted p = 0.025) and interface conflict (B = −0.0817, 95% CI [−0.1347, −0.0288], Holm-adjusted p = 0.016) remained associated with lower composite values.
The coefficients for boundary ambiguity and interface conflict were negative in all four leave-one-case-out models, although their statistical significance varied according to the case omitted. After Holm correction, boundary ambiguity remained significant when P1 (
p = 0.027) or P2 (
p = 0.038) was omitted, but not when P3 (
p = 0.068) or P4 (
p = 0.130) was omitted. Interface conflict remained significant when P2 (
p = 0.014), P3 (
p = 0.009), or P4 (
p = 0.040) was omitted. When P1 was omitted, the interface-conflict coefficient was smaller and did not reach statistical significance (B = −0.0560, raw
p = 0.056, Holm-adjusted
p = 0.278). None of the other four environmental-problem ratings was significant after Holm correction in these sensitivity analyses. Complete results are presented in
Appendix A (
Table A6B,C).
4. Discussion
4.1. Principal Findings
Interview notes and field records linked participants’ reported difficulties to entrances, turns, route transitions, level changes, planting edges, and shared movement–activity interfaces. At these locations, users needed to see what lay ahead, distinguish boundaries and level changes, follow route cues, interpret changing light and surface conditions, and anticipate nearby movement. The documented difficulties reflected relationships among routes, planting, facilities, surfaces, and surrounding activities rather than isolated park elements. The exploratory 20-item composite was higher in P1 and P2 than in P3 and P4.
Parallel analysis supported four factors rather than the five prespecified content domains, with the visual-comfort items failing to form a distinct factor. None of the six environmental-problem ratings was significant after Holm correction in the primary de-overlap analyses. Boundary ambiguity and interface conflict were associated with lower composite values in the secondary model, but this outcome retained conceptually overlapping items, and statistical significance varied across the leave-one-case-out analyses. Together, these results support treating the questionnaire evidence as exploratory.
The spatial evidence complements age-friendly park research concerned with access, amenities, maintenance, safety, and opportunities for recreation [
37]. It is also consistent with studies showing that perceived safety reflects both the physical configuration of green spaces and the social and movement conditions encountered within them [
38,
39,
40]. By linking reported uncertainty to specific routes, boundaries, transitions, and shared interfaces, the study provides a spatially resolved account of the situations in which older users may experience difficulty interpreting environmental information during park use.
4.2. Perceived Visual Safety as Situated Spatial Judgement
The findings suggest that perceived visual safety is situated at particular spatial decision points rather than experienced uniformly across an entire park. What mattered was not simply whether individual elements were visible, but whether the available information allowed users to recognize a walkable route, distinguish an edge or level change, and anticipate intersecting movement. Uncertainty arose when these spatial relationships were obscured or difficult to interpret.
This perspective builds on research into environmental legibility and wayfinding. Studies of older adults’ walkway preferences highlight the importance of path surfaces and related design features [
41]. Visibility and perceived safety have also been linked to lighting and greenery [
42], while route complexity and environmental organization shape navigational demands [
43]. These strands of research help explain why conditions at individual decision points may not be fully represented by an appraisal of the park as a whole.
Perceived visual safety is understood here as a subjective appraisal of whether visible environmental information is sufficient to support movement decisions. Reported adjustments such as slowing, looking down, checking a route, or detouring are consistent with the additional effort required to interpret uncertain spatial conditions; they do not necessarily indicate an immediate physical hazard. This distinction separates perceived visual safety from objective hazard assessment and observed wayfinding performance. Within the study’s provisional framework, visual comfort was intended to capture the readability of spatial information under glare, shadow, reflection, or visual clutter, while walking confidence represented the user’s perceived ability to act on the information available. Paths and facilities may therefore be present even when their spatial relationships remain difficult to interpret.
4.3. Interpretation and Sensitivity of the Questionnaire Associations
The attenuation of the associations after directly overlapping outcome items were removed shows that the estimates were sensitive to outcome composition. The associations for boundary ambiguity and interface conflict in the secondary model may partly reflect content shared between the predictors and the exploratory 20-item composite outcome. These results should not be used to rank the six environmental problems or to infer causal environmental effects.
Variation in individual exposure may also have contributed to the weak or inconsistent associations for vegetation/facility obstruction, glare or shadow disturbance, visual complexity, and cue discontinuity. Respondents may have used different routes and encountered different locations, lighting conditions, and activity levels within the same park. Each problem was assessed using a single item referring to the surveyed park rather than exposure at a particular location or time. The vegetation/facility obstruction item also combined several possible sources of restricted visibility and cannot be interpreted as a measure of vegetation quantity. Previous evidence similarly suggests that perceived safety may depend more on spatial organization and signs of disorder than on vegetation cover alone [
44].
The measurement analysis provides additional context for interpreting the associations. The four-factor solution, particularly the absence of a distinct visual-comfort factor, means that the five prespecified content domains are best regarded as provisional content groupings rather than validated subscales. Positive corrected item–total correlations and correlations among the retained factors are consistent with using the 20-item composite as a broad exploratory summary, but not with treating it as a unidimensional measure. The secondary findings were relatively insensitive to the coding of ordered covariates, while their variation across the leave-one-case-out analyses indicates some dependence on case composition. The questionnaire is therefore most useful as an exploratory comparative measure interpreted alongside the interview notes and field records.
4.4. Case-Specific Configurations of Perceived Environmental Problems
The exploratory 20-item composite values did not vary consistently with park area. Despite differing substantially in size and spatial form, P1 and P2 had similar composite values, whereas P3 and P4 had lower values in two contrasting settings. These comparisons direct attention to the relationships among routes, boundaries, sightlines, activity areas, and surrounding movement. Previous research likewise indicates that pocket-park use reflects a combination of internal features and surrounding land uses [
45].
The same problem category could occur in different spatial contexts. Vegetation/facility obstruction was documented in all four cases but affected different routes, turns, entrances, and planting edges. Boundary ambiguity concerned internal level transitions at P1, whereas at P3 it involved both poorly legible steps and indistinct park–street boundaries. P2 combined vegetation obstruction, changing light conditions, visual complexity, and overlapping circulation and activity areas near a major road. At P4, vegetation-obstructed views occurred alongside discontinuous cues on minor paths. These combinations placed different demands on users’ interpretation of routes, transitions, and nearby movement.
Because each spatial configuration was represented by one park, these patterns are case-specific and should not be interpreted as general differences among park types. Park area and spatial form also cannot be separated from maintenance, surrounding land use, activity intensity, and user composition. Taken as case evidence, the comparison shows how the location of a problem and its relationship with adjacent uses shape the circumstances in which it is encountered. Assessing routes, spatial cues, boundaries, and movement interfaces together may provide more informative evidence than considering park size or individual facilities in isolation. This focus on the relationship between environmental arrangements and everyday use is consistent with research on older adults’ informal adaptations in neighbourhood green spaces [
46].
4.5. Implications for Age-Friendly Pocket-Park Renewal
Age-friendly park planning often emphasizes accessibility and environmental equity [
47], while pocket-park renewal in high-density settings also considers where new green spaces should be provided [
48]. The present findings add a more localized concern to this agenda: the spatial decision points at which users interpret routes and surrounding movement. Entrances, turns, intersections, level changes, and movement–activity interfaces deserve particular attention because users must distinguish edges and transitions, determine how to proceed, and anticipate approaching movement.
The interview notes and field records, considered alongside the exploratory questionnaire findings, suggest several potential renewal responses. These include maintaining sightlines, making boundaries and level changes more visually distinct, coordinating route-defining elements, managing glare and visual clutter, and clarifying movement priorities at shared interfaces. Appropriate responses will depend on the conditions at each location. Planting, for example, may provide shade and visual comfort but restrict forward views when positioned close to an entrance, turn, or path intersection.
Table 6 links the six problem categories to relevant locations and potential renewal responses. It is intended to support site-specific observation and consultation with older users, rather than serve as a uniform checklist. The proposed responses should be evaluated following implementation through before-and-after observation and user feedback. Night-time lighting and route visibility should be examined separately under appropriate evening conditions.
4.6. Limitations and Future Research
This cross-sectional study included four purposively selected parks in one district. Each case combined a particular spatial form with its own maintenance conditions, traffic exposure, activity intensity, surrounding land uses, and user composition. Differences among P1–P4 cannot therefore be attributed to any one of these characteristics or interpreted as causal effects. Convenience sampling represented people using the parks during the study period but not residents who seldom visited or avoided them. The numbers of eligible individuals approached and those declining participation were not recorded, so a response rate could not be calculated.
Data collection took place during a single eight-day period in autumn and covered different periods of the day, but fieldwork hours and environmental conditions were not standardized or systematically logged. Seasonal variation, weather, pedestrian flow, and night-time lighting were not evaluated systematically. Information on visual status, corrective-lens use, contrast sensitivity, fall history, and familiarity with the parks was also unavailable. Participants within the same park shared aspects of their environmental context. Case indicators accounted for average differences among the four sites but not for within-park dependence, and four parks were insufficient for reliable multilevel or cluster-robust estimation.
The questionnaire evidence is subject to several measurement constraints. Environmental-problem ratings and perceived visual safety items were completed by the same respondents, leaving the estimates open to common-method variance and conceptual overlap. Each environmental problem was assessed with a single item, preventing internal-consistency assessment and limiting evaluation of discriminant validity. The perceived visual safety questionnaire also remains preliminary. Its response format combined agreement and satisfaction labels, and its development relied on internal review without external expert assessment, cognitive interviewing, or independent pilot testing. The factor structure was examined in the same sample used for the association analyses. Independent validation should test revised response labels and examine the measurement structure using polychoric correlations, ordinal estimators, and new samples.
The interviews were documented through contemporaneous notes rather than audio recordings and verbatim transcripts. The material was organized partly according to the six prespecified problem categories, without independent coding or formal assessment of thematic saturation. It was therefore used as contextual, case-based evidence rather than as a formal inductive thematic analysis. Photographs and field notes helped locate the reported difficulties but did not constitute standardized environmental measurements.
Future research could include a larger number of parks with comparable spatial and interface conditions and recruit both current users and residents who seldom use or avoid these spaces. Data collected across seasons, weather conditions, activity levels, and standardized daytime and evening periods would provide a fuller account of variation in park use. Subjective appraisals could be combined with measures of visual status and park familiarity, visibility analysis, illuminance and luminance measurement, boundary-contrast assessment, environmental audits, pedestrian-flow recording, and behavioural mapping. Longitudinal and before-and-after studies could then examine whether proposed changes to sightlines, boundaries, route cues, and movement interfaces influence park use and perceived visual safety.
5. Conclusions
This study examined older adults’ perceived visual safety in four selected pocket parks in Nanjing using questionnaire responses, interview notes, and field records. The case-based evidence linked participants’ reported uncertainty to spatial decision points, including entrances, turns, path intersections, boundaries, level transitions, and movement–activity interfaces. At these locations, users needed to identify how a route continued, distinguish changes in the walking environment, and anticipate nearby movement.
The questionnaire provided exploratory rather than confirmatory evidence. Factor analysis supported four factors rather than the five prespecified content domains, with visual comfort failing to form a distinct factor. None of the six environmental-problem ratings was significant after Holm correction in the primary de-overlap analyses. Associations for boundary ambiguity and interface conflict appeared in the secondary 20-item composite model, whose outcome retained conceptually overlapping items. Differences among the four parks remain specific to the selected cases and cannot be attributed independently to park area or spatial form.
The findings suggest that age-friendly renewal should consider the legibility of spatial relationships as well as the provision of paths and facilities. Potential responses include maintaining sightlines, making boundaries and level changes easier to distinguish, reinforcing route continuity, and clarifying movement priorities at shared interfaces. These responses require evaluation across a wider range of parks through longitudinal or before-and-after studies. For age-friendly renewal, the central consideration is whether older users can readily interpret the relationships among routes, boundaries, facilities, and surrounding activities during everyday movement.