Article

Model Test Study on Soil-Carrying Effect of Shallow-Buried Rectangular Pipe Jacking

1
Faculty of Engineering, China University of Geosciences, Wuhan 430074, China
2
PowerChina Guiyang Engineering Corp., Ltd., No. 16 Xingqian Road, Guiyang 550081, China
*
Author to whom correspondence should be addressed.
Buildings 2026, 16(18), 3711; https://doi.org/10.3390/buildings16183711 (registering DOI)
Submission received: 15 July 2026 / Revised: 18 August 2026 / Accepted: 15 September 2026 / Published: 17 September 2026

Abstract

Due to the cross-section characteristics of rectangular pipe jacking, the “soil-carrying effect” of overlying soil migration with the pipeline is prone to occur during jacking in shallow strata, resulting in a sharp increase in jacking resistance and large deformation of the strata. In this paper, a visual similarity model test of the soil-carrying effect is carried out for shallow buried large-section rectangular pipe jacking. The experiment innovatively combines VIC-3D digital image correlation technology, a 3D laser scanner and a thin-film pressure sensor to monitor the displacement of deep soil, surface heave and pipe resistance in an all-round and high-precision way. The influence of the overburden ratio and pipe–soil friction coefficient on the evolution of back soil was systematically studied. The results show that the evolution of the soil-carrying effect presents the three-stage characteristics of ‘elasticity-slip-strengthening’, and the smaller the overburden ratio, the larger the friction coefficient. And the smaller the critical displacement of the back soil, the more severe the formation disturbance. Based on the principle of mechanical balance, this paper puts forward the theoretical prediction model of the whole soil-carrying effect, deduces the critical friction coefficient and the critical jacking mileage, and compares it with the experimental results, which provides a scientific basis for the optimization of construction parameters and safety control of shallow buried rectangular pipe jacking.

1. Introduction

As an environmentally friendly construction technology, trenchless pipe jacking technology plays a very important role in serving China’s infrastructure construction and has produced significant social and economic benefits. Compared with the traditional circular pipe jacking, rectangular pipe jacking has the advantages of good adaptability to shallow overburdened soil, high utilization rate of the structural section and a short construction period. It is widely used in urban subway tunnels, utility tunnels, underground parking lots and other construction projects [1,2,3]. However, the difference in geometric section between the two leads to the essential difference in the mechanical response and disturbance mechanism of the soil around the pipe: because of the ‘arch effect’ of the circular pipe jacking, the soil around the pipe is easy to form a self-bearing arch, and the soil disturbance is mostly symmetrically distributed in an arc shape. The top of the rectangular pipe jacking is straight. The overlying soil loses the arch support, and the stress release of the stratum is more intense. The disturbance area is often distributed in a typical micro-concave or shear slip zone [4]. Under this unique boundary condition, the stability of the tunnel in the shallow stratum is very poor. The upper soil is weakly constrained by the surrounding stratum, and it is easy to collapse directly onto the pipe jacking machine and the pipeline. With the increase in the jacking distance, the range and quality of the collapsed soil gradually accumulate, resulting in the shear failure of the overlying soil and the migration of the pipeline. That is, the soil-carrying effect [5,6]. In recent years, the wide application of large-section rectangular pipe jacking in shallow buried strata (buried depth H is usually less than 2~2.5 times the pipe width B) has made the risk of a soil-carrying effect extremely high. As Chen et al. [1] pointed out in a case study of a large-section rectangular pipe jacking project in Suzhou with extremely shallow overburden (buried depth of only 3.5 m), the complex pipe–soil contact state greatly increases the risk of excavation face instability and surrounding soil disturbance. The soil-carrying effect will not only lead to a sharp increase in jacking resistance and limit the jacking length breakthrough, so that the pipeline has the risk of structural damage, but also cause large deformation of the surrounding strata, threatening the safety of surrounding buildings and structures [7]. Therefore, it has become an inevitable requirement for high-quality development in this field to accurately predict the disturbance of surrounding soil and reveal the evolution law of soil-carrying effect.
Scholars at home and abroad have carried out relevant explorations on the mechanism and predictive treatment of the soil-carrying effect. At the theoretical mechanism level, Gao et al. [8] defined the concept of “overall soil-carrying effect” based on the previous overview of the soil-carrying effect and pointed out that, when the friction resistance of the pipe section is greater than the overall resistance of the surrounding soil, the overlying soil failure phenomenon accompanied by the overall displacement of the pipe section will occur. Ma et al. [2] further proposed that the generalized soil-carrying effect is the soil collapse and migration caused by the repeated loading/unloading of the excavation surface, the frictional resistance of the pipe section, the attachment and accumulation of the soil, and other factors. Ma et al. [9] proposed a theoretical analysis model for the whole process of vertical expansion, horizontal expansion and overall back soil stage. Shou et al. [10] have shown that the complexity of the contact state of the pipe–soil interface and the dynamic friction are the key mechanical factors that drive the shear slip and macroscopic deformation of the surrounding soil. In addition, because the friction evolution of the pipe–soil interface is the microscopic core that triggers the back-soil effect, Ma et al. [11] proposed a new pipe–soil mechanical contact model for rectangular pipe jacking and comprehensively discussed the influence of complex contact state and slurry lubrication effect on pipe–soil friction resistance, which provides a solid theoretical basis for the accurate calculation of dynamic friction resistance. At the prediction and control level, based on the measured data, Zhen et al. [12] calculated the critical friction coefficient of soil (pipe) to be 0.35 and preliminarily defined the influence range of the soil-carrying effect. Gao et al. [13] used the numerical method to explore the inhibitory effect of setting the isolation wall on the soil-carrying effect; Dou et al. [14] proposed specific treatment measures such as borehole water injection and partition wall construction in combination with actual projects.
Over the past decade, the mechanism of the soil-carrying effect in rectangular pipe jacking has been extensively debated. Historically, early analytical theories attributed this phenomenon to the collapse of the unloading arch under shallow covers. Subsequent frameworks refined this concept into a global friction-driven instability, emphasizing that macroscopic soil migration occurs when the pipe–soil interface friction exceeds the inherent continuous shear confinement of the surrounding strata [8,15]. To mitigate these hazards in practical engineering, researchers have evaluated various passive countermeasures, including the installation of isolation walls, slurry lubrication optimization, and active face support [12,13,14]. Despite these achievements, a critical research problem persists: conventional theoretical frameworks frequently adapt continuous calculation models derived from circular shield tunneling. These adaptations struggle to accurately capture the distinctive, discontinuous large-deformation characteristics and the rectangular-specific plastic boundary evolutions.
In recent years, scholars have increasingly focused on the micro-kinematics of the soil-carrying effect. State-of-the-art physical model studies—utilizing transparent soil and digital image correlation (DIC) technologies—have successfully visualized the internal staged deformation characteristics (i.e., initial growth, rapid development, and stable attenuation) and identified typical 45° to 55° inclined slip surfaces under shallow covers [16,17]. Furthermore, recent theoretical modifications have attempted to incorporate assumed plastic sliding zones to evaluate failure risks quantitatively [18]. However, current analytical models still fail to dynamically differentiate the temporal transition of lateral shear constraints (from pre-failure static limits to post-failure dynamic slip) during the progressive rupture of granular soil.
To effectively bridge this research gap, the specific research objectives of this study are (1) to visually investigate the dynamic spatial disturbance zoning of the soil-carrying effect using a multi-source monitoring system (combining VIC-3D, 3D laser scanning, and pressure sensors); (2) to quantitatively analyze the mechanism by which varying overburden ratios and interface frictions trigger macroscopic instability; and (3) to propose a novel, structurally conservative theoretical prediction model that incorporates dynamic shear force transitions. By exploring the complex ‘pipeline-soil’ mechanical interaction, this study derives the critical friction coefficient and critical jacking mileage, providing a quantitative scientific basis for parameter optimization and safety control in field applications.

2. Model Test Device and Scheme

2.1. Similarity Criterion and Test Device

In order to reproduce the physical phenomenon of practical engineering, the model test is derived by the dimensional analysis method, which strictly meets the similarity criteria of geometry, mass, load and physical properties of a medium [19]. For the quantitative model test of geotechnical engineering, the geometric similarity ratio of the model is generally 40–60 [20,21,22,23]. Considering the test site and cost, the geometric similarity ratio is 60 in this test to simulate the large-section rectangular pipe jacking with a section size of 9.1 m × 5.5 m. Considering the test site and cost, the geometric similarity ratio ( C l ) is 60 in this test to simulate the large-section rectangular pipe jacking with a prototype section size of 9.1 m × 5.5 m. By selecting length ( L ), density ( ρ ), and gravitational acceleration ( g ) as the fundamental dimensions, the detailed scaling laws for this 1 g gravitational model test ( C g = 1 ) were established. To realistically represent the physical properties of the medium, actual quartz sand was utilized, yielding a density similarity ratio of C ρ 1 . Dimensionless physical parameters require a similarity ratio of 1. Consequently, the internal friction angle scaling ratio is C φ = 1 , and the pipe–soil interface friction coefficient scaling ratio is C μ = 1 . Furthermore, the stress ( σ ) and stiffness ( E ) scale proportionally to the product of density, gravity, and length, resulting in C σ = C E = C ρ C g C l = 60 . Since strain ( ε ) is dimensionless ( C ε = 1 ), the corresponding deformation and displacement ( δ ) strictly follow the geometric scaling law ( C δ = C l = 60 ).
Guided by these stringent scaling laws and in order to visually observe the failure mode of the tunnel face, the model adopts the half-mold method, and the half-mold size of the rectangular pipe jacking model is strictly designed as 7.6 cm × 9.2 cm.
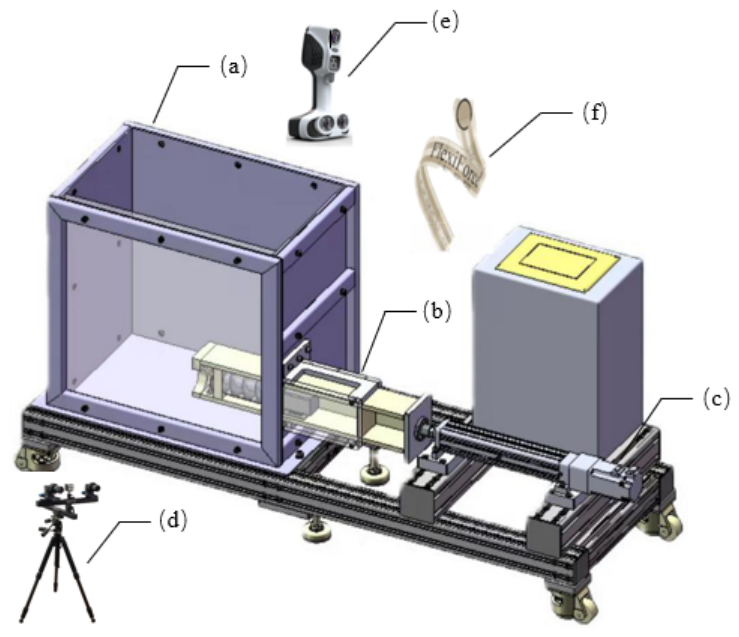
In the design of the model box, in order to eliminate the interference of the boundary effect on the stress and deformation of the soil, the width of the model box is 3 times the width of the pipe section (27.6 cm). The length of the model box is optimized by combining the extended fracture zone of the rectangular pipe jacking calculated by the Terzaghi theory (lateral disturbance of 14.1 cm, longitudinal disturbance of 34.1 cm). Finally, the size of the box is determined to be 50 cm (length) × 30 cm (width) × 50 cm (height). In addition, a double-layer 0.1 mm-thick polyethylene film was pasted on the surface of the acrylic observation panel to reduce the peak friction angle between the sand and the inner wall to 5° [24] to minimize the side wall friction interference. The model box is shown in Figure 1.
Traditional settlement nails, LVDT and membrane earth pressure cells have defects such as easy disturbance of soil, less point coverage and the ‘embedding effect’. This paper introduces a multivariate non-contact monitoring system:
(1)
VIC-3D measurement system: Based on the digital image correlation (DIC) method, the full-field displacement of deep soil is obtained without contact, providing high-precision strain and displacement measurements. Standard stereo-calibration procedures were performed prior to testing to ensure sub-pixel accuracy;
(2)
3D laser scanner: To minimize measurement uncertainties, the equipment was rigorously calibrated before the tests, and the spatial data acquisition accuracy was strictly set to 0.03 mm. Combined with a difference algorithm, it yields high-precision, full-coverage surface morphology point cloud data;
(3)
Thin film pressure sensors: To eliminate traditional embedding effects, these sensors were specifically calibrated using the actual quartz sand medium utilized in the tests. This process established a precise functional relationship between the applied pressure and the sensor output, successfully controlling the measurement error within a range of 4% to 8%. The generated calibration files were directly imported into the acquisition system for real-time, high-precision monitoring of the pipe–soil interface pressure.

2.2. Test Materials and Working Conditions

The particle size composition index of the soil used in the test is shown in Table 1. The actual similarity ratio of the soil used in the test is similar to the theory, as shown in Table 2. The test medium is mainly silt with a particle size of 0.075 mm, effective particle size d10 = 0.058 mm, average particle size d50 = 0.355 mm, non-uniformity coefficient Cu = 6.55, and gradation coefficient Cc = 1.31. Black quartz sand with the same hardness (hardness of 7) was mixed as speckle material. After determination, the test soil density was ρ = 1.78 g/cm3, and the internal friction angle was φ = 35.6°, basically meeting the requirements of a similar ratio.
A total of 6 groups of working conditions were carried out in the test, and the front of the excavation panel was controlled to be a passive earth pressure state. The main control variables are the covering soil ratio Z/H (0.5,1.0,1.5) and the friction coefficient of the pipe–soil interface μ (0.56,0.72). The experiment was carried out at a constant speed of 0.092 mm/s (0.1% H per second).
The selection of the experimental variables was strictly grounded in typical field conditions encountered in rectangular pipe jacking projects. Since rectangular pipe jacking is primarily advantageous for shallow underground developments, actual engineering applications typically feature an overburden ratio ( Z / H ) of less than 2.0 to 2.5. Consequently, the chosen ratios of 0.5, 1.0, and 1.5 represent the critical spectrum from extremely shallow to moderately shallow depths where the soil-carrying effect is most prone to occur. Furthermore, the pipe–soil interface friction is a decisive factor in triggering the soil-carrying effect. With the internal friction angle of the test sand being 35.6°, the theoretical upper bound for the interface friction coefficient (representing complete lubrication failure in the field) is approximately tan 35.6 0.72 . A coefficient of 0.56 reflects a standard operational condition with typical concrete–soil interactions and partial lubrication. To maintain strict physical control in the model test, these specific friction coefficients (0.56 and 0.72) were achieved exclusively through the mechanical polishing of the pipe surfaces. These selected parameters effectively bracket the practical scenarios required to study the dynamic evolution of the soil-carrying effect.
To ensure the reliability and repeatability of the model tests, the model ground was prepared using the air pluviation method. Oven-dried quartz sand was utilized to completely eliminate the influence of moisture-induced apparent cohesion, ensuring that the soil behavior was strictly governed by its internal friction angle. During the placement process, the sand was continuously poured from a calibrated, constant drop height at a uniform horizontal speed. This technique allowed for precise control over the compaction degree, successfully achieving the target density of 1.78 g/cm3 across all test scenarios. Furthermore, a laser level was employed during the filling process to monitor and guarantee the strict flatness and uniformity of each soil layer. The standardization of this preparation procedure ensured identical initial stress states and high repeatability for all 6 experimental working conditions.

2.3. Experimental Methodology and Procedure

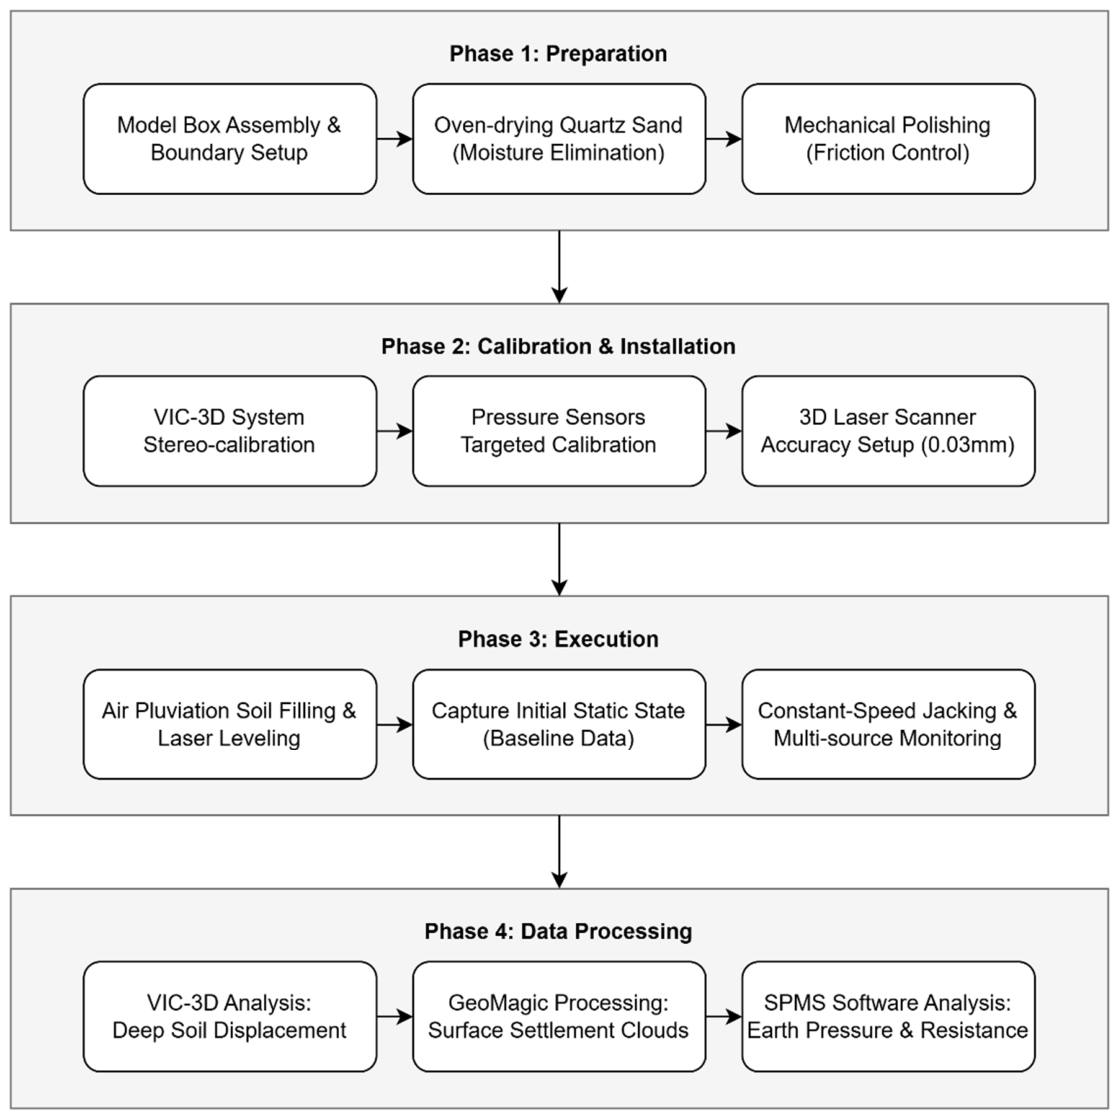
To provide a clear and comprehensive understanding of the experimental execution, the overall methodology is systematically illustrated in the flowchart (Figure 2). The experimental workflow is strictly divided into four interconnected phases:
First, in the Preparation Phase, the physical boundaries of the model box were assembled. The quartz sand was fully oven-dried to eliminate moisture, and the model pipes underwent strict mechanical polishing to achieve the specific targeted pipe–soil friction coefficients ( 0.56 and 0.72 ), ensuring no chemical variables were introduced. Second, during the Calibration and Installation Phase, the advanced multi-source monitoring system was configured. This involved the stereo-calibration of the VIC-3D system, the 0.03 mm accuracy setup for the 3D laser scanner, and the specific calibration of the thin-film pressure sensors utilizing the testing sand to mitigate embedding effects.
Subsequently, the Execution Phase commenced with the model ground reconstruction via the air pluviation method, verified continuously by a laser level. Following the capture of the initial static state, the servo electric cylinder drove the pipe model at a constant speed of 0.092 mm/s, while the monitoring equipment acquired real-time data simultaneously. Finally, in the Data Processing Phase, the raw data was synthesized. The VIC-3D software computed the deep soil displacement fields, the GeoMagic Wrap software (V2021.0.0.3008) processed the surface point clouds into settlement contours, and the SPMS software (V1.2) analyzed the dynamic jacking resistance and earth pressure variations.

3. Test Results and Analysis

3.1. Displacement Evolution Law of Deep Soil Mass

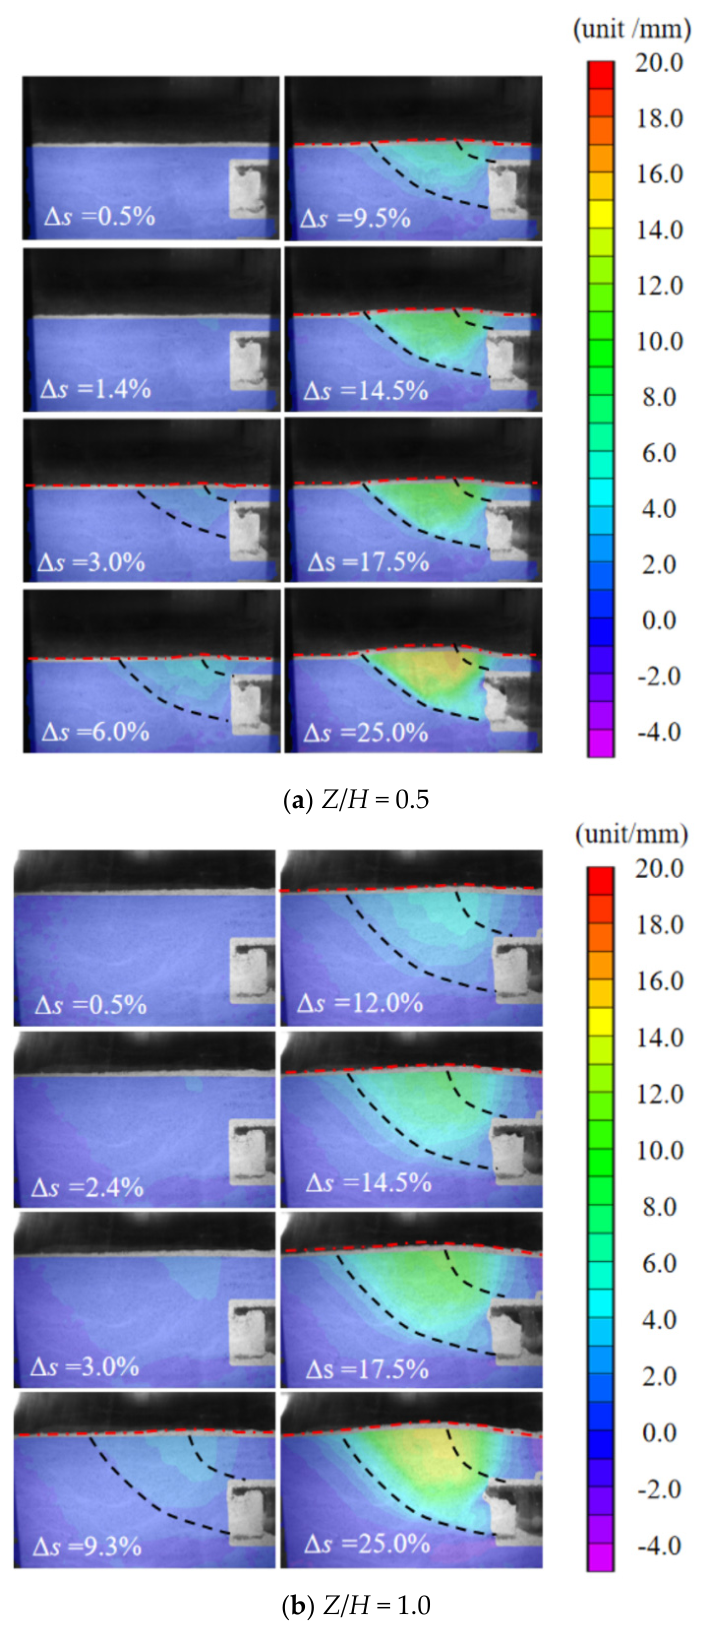
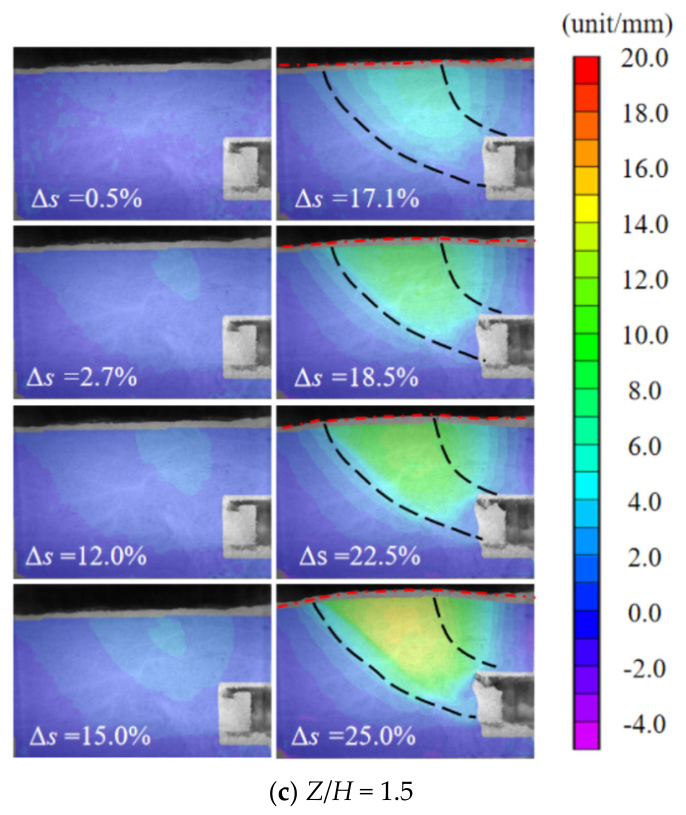
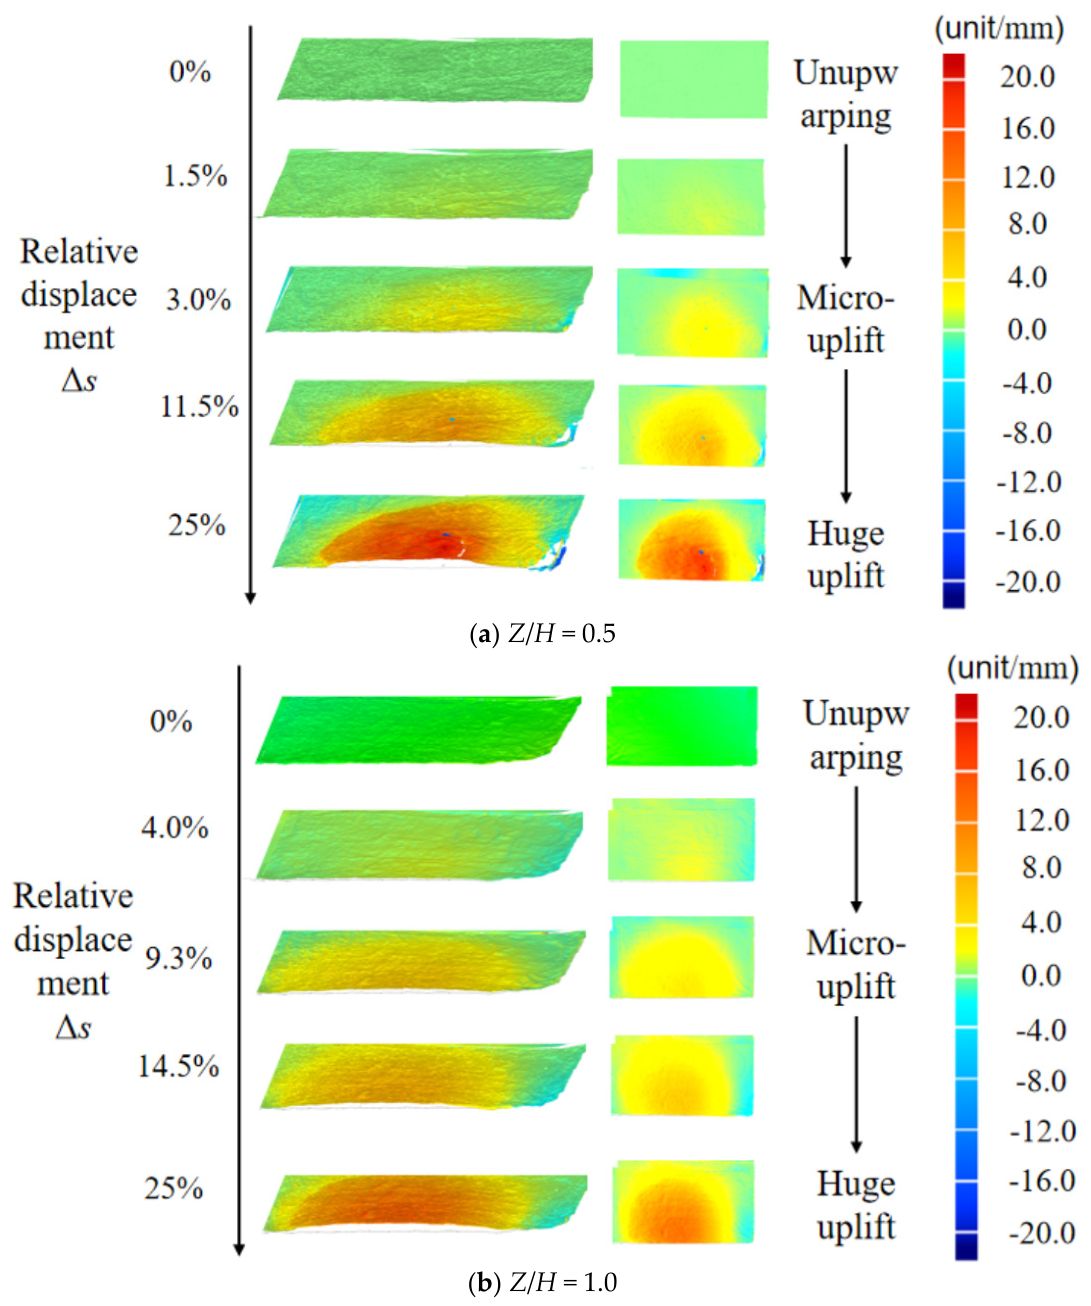
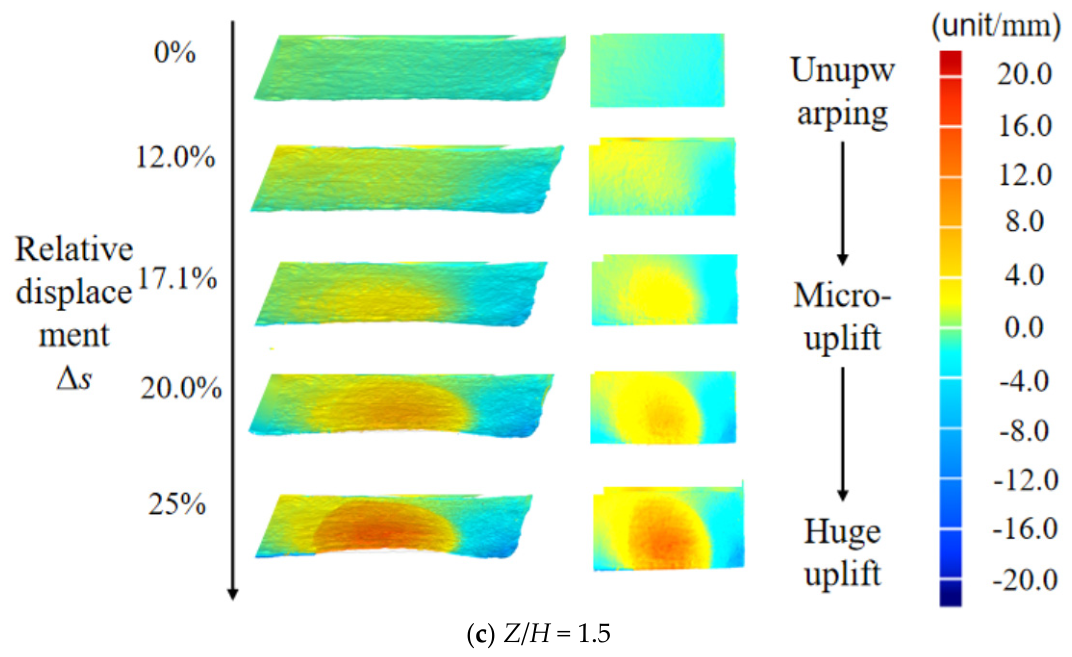
Combined with the analysis of the VIC 3D displacement cloud map in Figure 3, the soil damage under different overburden ratios starts from the bottom of the excavation surface and gradually extends to the surface in a parabolic form. Under the condition of shallow burial (Z/H = 0.5), the ratio of the actual displacement to the height of the pipe joint is defined as the relative displacement. When it reaches 3.0%, the deformation of the deep soil extends to the surface, which quickly triggers the soil-carrying effect, and the parabolic shear band appears. As the relative displacement continues to increase, the plastic deformation of the soil in the shear band increases significantly, but the parabolic boundary no longer extends outward. For medium burial (Z/H = 1.0) and deep burial (Z/H = 1.5) conditions, the critical relative displacement required for deformation to extend to the surface is greatly delayed, and it needs to reach 9.3% and 17.1%, respectively, to trigger surface deformation.
It is important to clarify the theoretical rationale for selecting the specific overburden ratios ( Z / H = 0.5 , 1.0 , 1.5 ). From a geomechanical perspective, this interval represents the critical transitional zone for the soil-carrying effect. For extremely shallow depths ( Z / H < 0.5 ), the overlying soil lacks sufficient thickness to develop any arching effect, typically leading to immediate localized cave-ins rather than a progressive drag mechanism. Conversely, when Z / H approaches or exceeds 2.0 (deep burial), the structural soil arching becomes dominant, robustly suppressing the upward propagation of shear bands and preventing the macroscopic soil-carrying effect entirely. Therefore, investigating the 0.5 to 1.5 spectrum effectively captures the complete evolution from high vulnerability to the progressive suppression of the soil-carrying failure.
It can be seen that, with the increase in the overburden ratio, the influence of pipe jacking on the displacement of deep soil is significantly reduced. The smaller the overburden ratio is, the more easily the deep soil deformation extends to the surface, and the more easily the soil-carrying effect occurs. According to the Mohr–Coulomb failure criterion and Rankine’s passive earth pressure theory, the theoretical shear rupture surface develops at an angle of 45 + φ / 2 relative to the horizontal plane. Our experimental observations corroborate this theory, indicating that, while the absolute vertical extent of the failure zone depends on the burial depth, the geometric inclination and lateral expansion pattern of the slip range are fundamentally governed by the soil’s internal friction angle ( φ ).

3.2. Surface Displacement Response and Settlement Deformation Characteristics

(1)
Vertical displacement evolution law
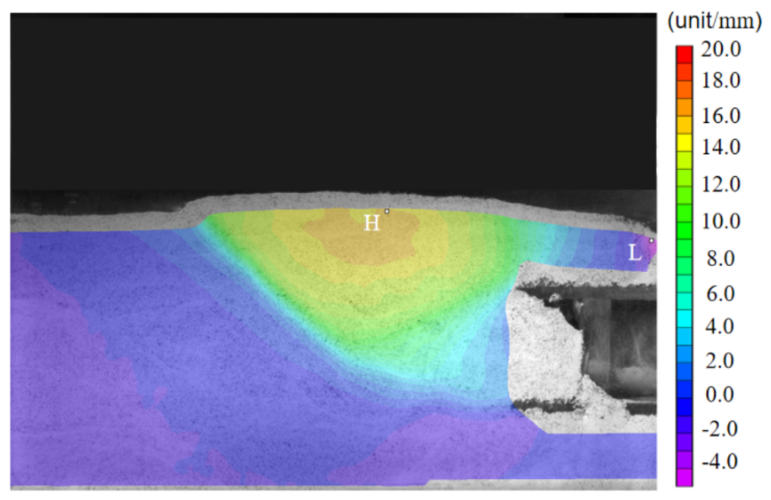
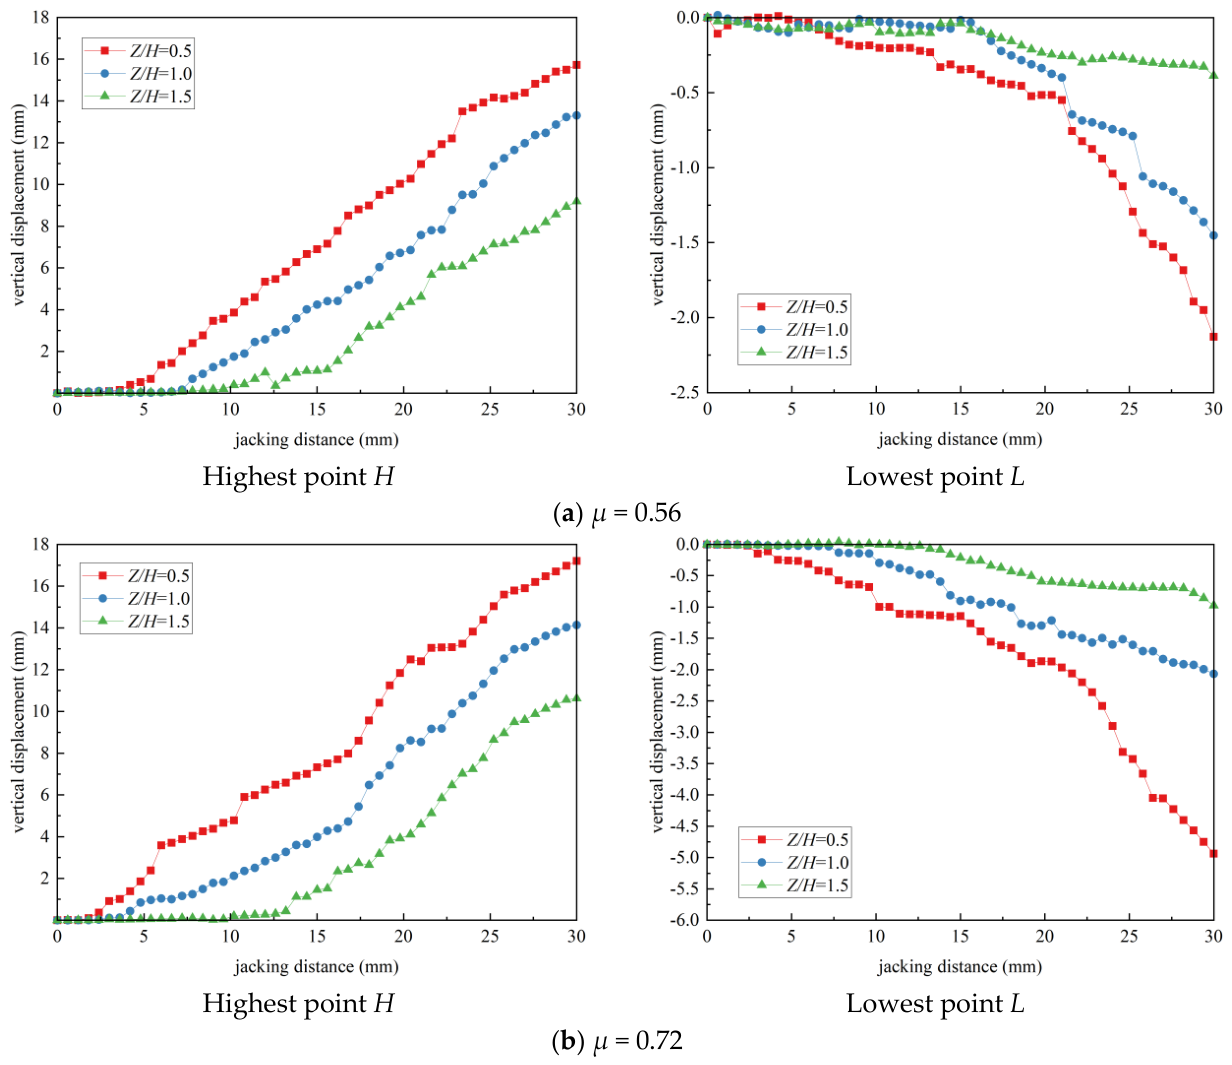
The VIC-3D software is used to analyze the data, and the maximum and minimum points of the vertical displacement of the back soil (the uplift is positive and the settlement is negative) are extracted as shown in Figure 4. The curve of the displacement with the jacking distance is shown in Figure 5. The occurrence of the soil-carrying effect will lead to a significant front uplift and rear subsidence phenomenon on the surface. It can be seen from the figure that, in the early stage of pipe jacking, there is no obvious vertical uplift and settlement of the surface soil. With the increase in jacking distance, the soil-carrying effect is activated, and the uplift amplitude of the back soil area increases with the increase in jacking distance. The specific performance is that, as the overburden ratio Z/H increases, the uplift amplitude increases. With the uplift of the soil in the soil-carrying effect area, the soil behind the surface settles, and the trend is that the soil in front of the back soil drags the soil behind the back soil. Therefore, the uplift of the soil in front of the back soil is greater than the settlement of the soil behind the back soil. With the increase in the overburden ratio Z/H, the settlement amplitude decreases. The jacking distance at which settlement begins to occur is greater than the trigger point of the soil-carrying effect.
The minimum point of vertical displacement is similar to the vertical displacement of the highest point, but the displacement is obviously smaller than at the highest point, and the vertical displacement amplitude of the highest point is larger. With the increase in jacking distance, the displacement of the highest point under different overburden ratios is more gentle than that of the lowest point.
The trend of vertical displacement of soil under different friction coefficients with the change in overburden ratio is generally similar. With the increase in overburden ratio, the surface uplift amplitude decreases, and the settlement of soil behind the surface decreases. However, under the same buried depth, the increase in the pipe–soil friction coefficient will greatly deteriorate the surface deformation. Under the condition of Z/H = 0.5, when the friction coefficient increases from 0.56 to 0.72, the maximum vertical uplift caused by jacking 30 mm increases from about 15 mm to about 17 mm, and the settlement increases from about 2.3 mm to 4.8 mm.
It is worth noting that, after a rigorous re-verification of the raw data, the stepwise and scattered patterns observed in the settlement curves of the lowest point (L) (Figure 5) are confirmed as true physical phenomena rather than instrument noise. Point L is positioned at the trailing edge of the migrating soil block. As the block is dragged forward by the pipe, a temporary trailing void is generated. The surrounding soil intermittently collapses to fill this void, and this discontinuous, episodic localized shear failure manifests as the scattering and stepwise settlement data.
(2)
Evolution law of longitudinal horizontal displacement
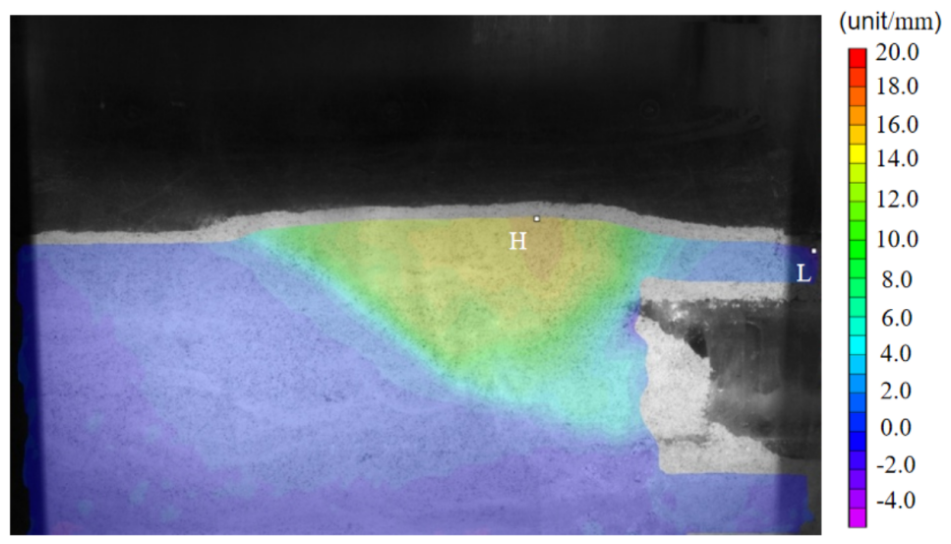
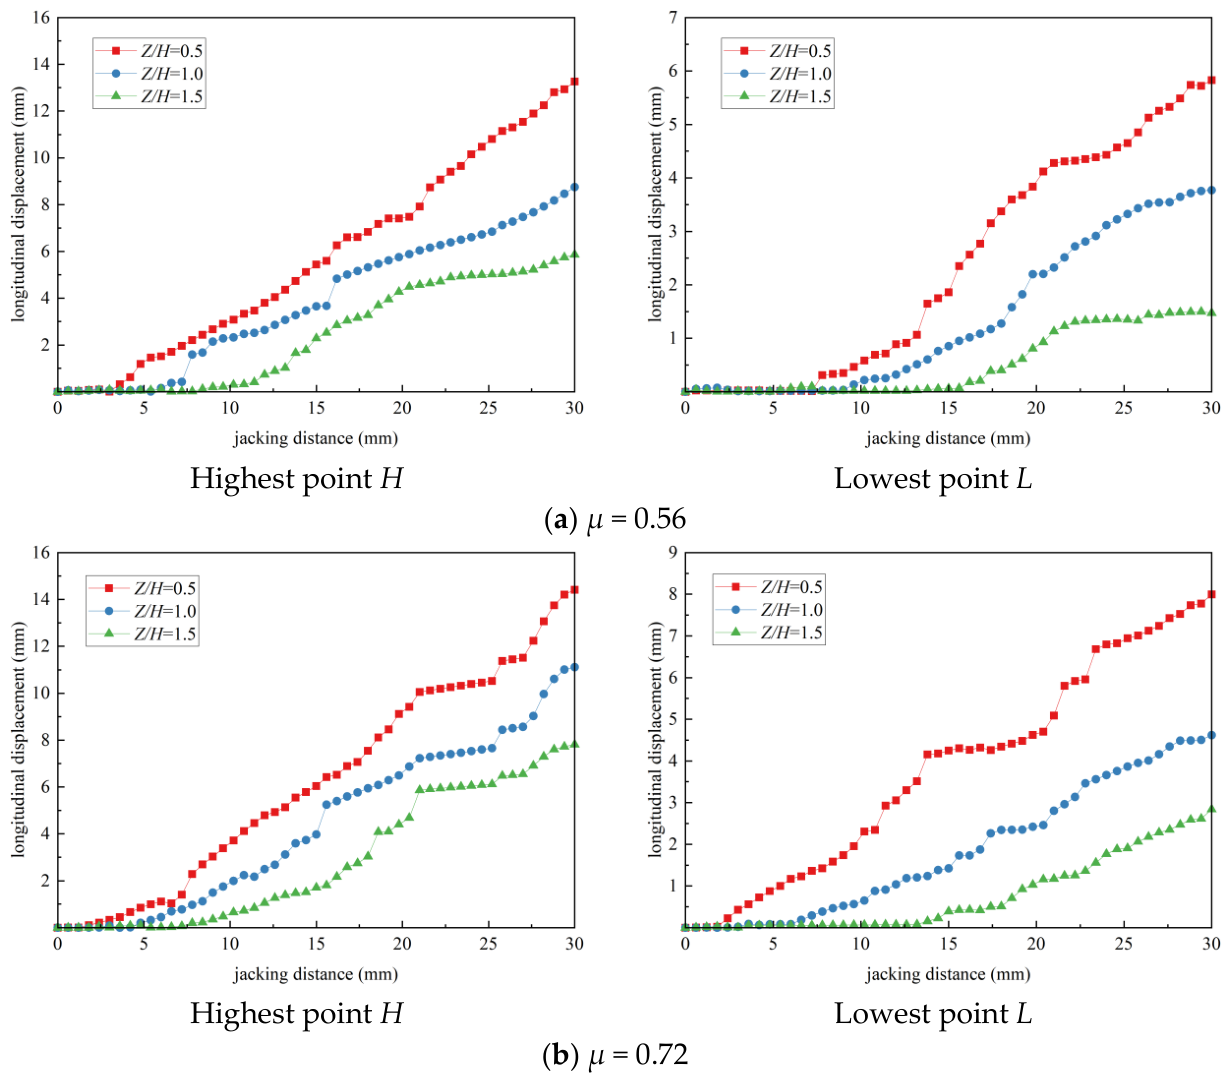
Longitudinal horizontal displacement is a key index to determine the strength of the soil effect. The longitudinal horizontal displacement points at the maximum and minimum points of surface displacement under different overburden ratios are extracted, as shown in Figure 6. The variation of longitudinal horizontal displacement with jacking distance is shown in Figure 7. From the figure, it can be seen that the surface displacement points (the highest point H and the minimum point L) observed in the test have no obvious longitudinal displacement at the initial stage of jacking and then rise stepwise with the increase in distance, and the soil effect appears and continues to strengthen.
The longitudinal horizontal displacement is the largest when the overburden ratio is Z/H = 0.5, indicating that, when the buried depth is small, the overlying soil constraint is weak, and the pipe jacking is more likely to cause the horizontal displacement of the surface soil and trigger the soil-carrying effect. When Z/H = 1.0, the longitudinal horizontal displacement of the surface soil is smaller than that when Z/H = 0.5. When Z/H = 1.5, the longitudinal horizontal displacement of the soil in the back soil area is the smallest, indicating that the buried depth is deepened. The inhibitory effect on the lateral deformation of the soil is more significant, resulting in a smaller horizontal displacement. In addition, the horizontal displacement of the highest point H is always greater than that of the lowest point L near the end of the tube, and the curve of the highest point rises earlier. The highest point has an early disturbance response and a large displacement amplitude due to the soil arching effect and upper soil extrusion. Due to the strong three-way constraint near the tail of the pipe, the lowest point is mainly subjected to passive compression at the initial stage. The response lags behind, and the displacement is small.
The plastic deformation law of surface soil under different friction coefficients is similar. The increase in the friction coefficient will significantly increase the displacement response. When the friction coefficient is μ = 0.72, the interface shear stress is larger, which leads to the aggravation of the extrusion and lateral drag effect of the front soil. The shallow buried displacement is 20%~40% higher than that when μ = 0.56. The friction coefficient is μ = 0.56. The propagation range of shear disturbance is small, and the displacement accumulation rate is lower, especially in deep burial. The displacement of μ = 0.56 is 30% lower than that of μ = 0.72.
(3)
Evolution law of surface subsidence and three-dimensional deformation
Taking the friction coefficient as an example, the three-dimensional cloud map of surface deformation under different overburden ratios is shown in Figure 8. The three-dimensional deformation evolution of the surface caused by pipe jacking follows the three stages of ‘initial stress disturbance, shear band formation and dynamic instability critical point’, and the deformation degree and trigger nodes are significantly delayed or weakened with the increase in the overburden ratio Z/H:
(a)
Initial stress disturbance stage: It is mainly manifested as small elastic deformation and compression uplift of soil caused by cutterhead cutting. When Z/H = 0.5, it enters this stage when the relative displacement is 1.5~3.0%, resulting in a small uplift of 4.0~5.0 mm. However, the Z/H = 1.0 and 1.5 conditions lag to the relative displacement of 4% and 17.1%, respectively, before the local limited small uplift occurs;
(b)
Shear band formation stage: The soil is transferred to the plastic state, and the shear band expands along the pipe wall. In the case of Z/H = 0.5, during the relative displacement of 3.0–11.5%, the uplift increased to 8.0–12.0 mm, and a small settlement of −4.0–−8.0 mm began to appear behind the pipe jacking. In the middle and deep buried conditions (Z/H = 1.0, 1.5), the uplift range began to expand from the local to the wider area at this stage, and the plastic deformation characteristics gradually appeared;
(c)
Critical stage of dynamic instability: Significant uplift and subsidence damage occurs on the surface. When Z/H = 0.5, the dynamic instability occurs when the relative displacement exceeds 11.5%, and the extreme value reaches 12~20 mm of uplift and−8.0~−16.0 mm of settlement. Although the soil-carrying effect reaches the maximum when the relative displacement reaches 25% under Z/H = 1.0 and 1.5 conditions, the uplift amplitude and deformation range decrease significantly with the increase in the overburden ratio.
With the increase in relative displacement, the influence of the soil-carrying effect on soil settlement is gradually intensified. The larger the overburden ratio is, the larger the critical displacement triggered by the soil-carrying effect is, and the influence intensity and settlement evolution rate of the soil-carrying effect on the surface uplift and subsidence are gradually weakened.
To quantitatively evaluate the severity of soil deformation, a normalized displacement parameter ( δ / H ) is introduced. Statistical comparisons reveal that the dynamic response is highly sensitive to interface friction. Under the shallowest condition ( Z / H = 0.5 ), increasing the friction coefficient from μ = 0.56 to μ = 0.72 drives the normalized maximum vertical heave ( δ h e a v e / H ) from approximately 16.3 % to 18.5 % . Concurrently, the normalized maximum settlement ( δ s e t t l e m e n t / H ) statistically doubles, surging from roughly 2.5 % to 5.2 % . This indicates that, while increased friction moderately exacerbates surface uplift, it drastically amplifies the trailing settlement due to intensified soil dragging. These normalized indicators quantitatively validate that minimizing the interface friction is paramount for controlling disproportionate ground settlement.

3.3. Soil-Carrying Effect Evolution Stage and Disturbance Zoning

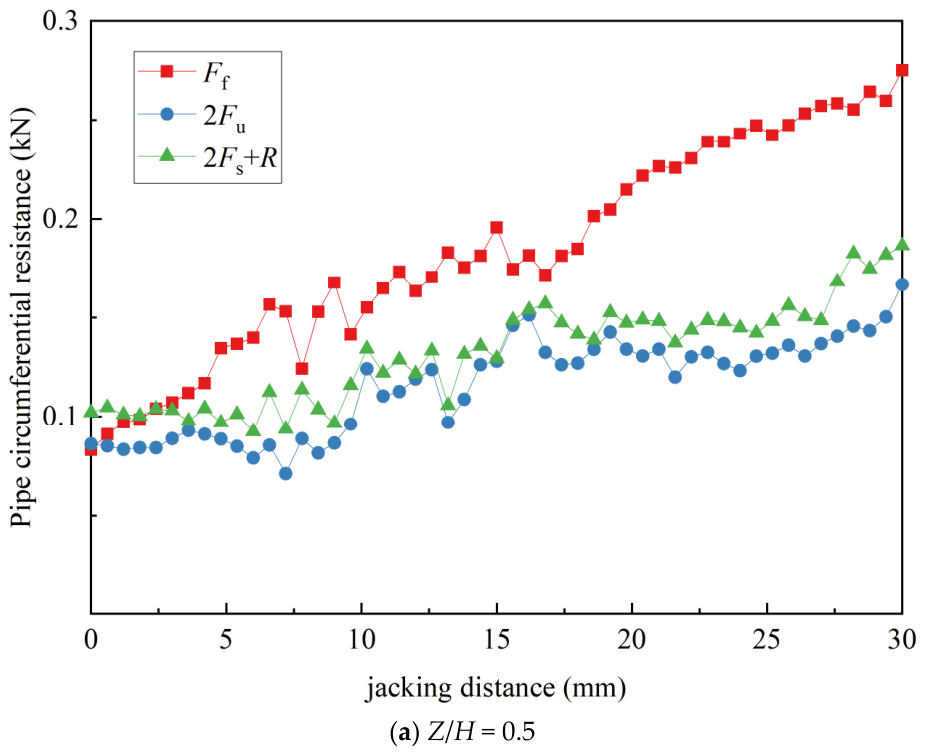
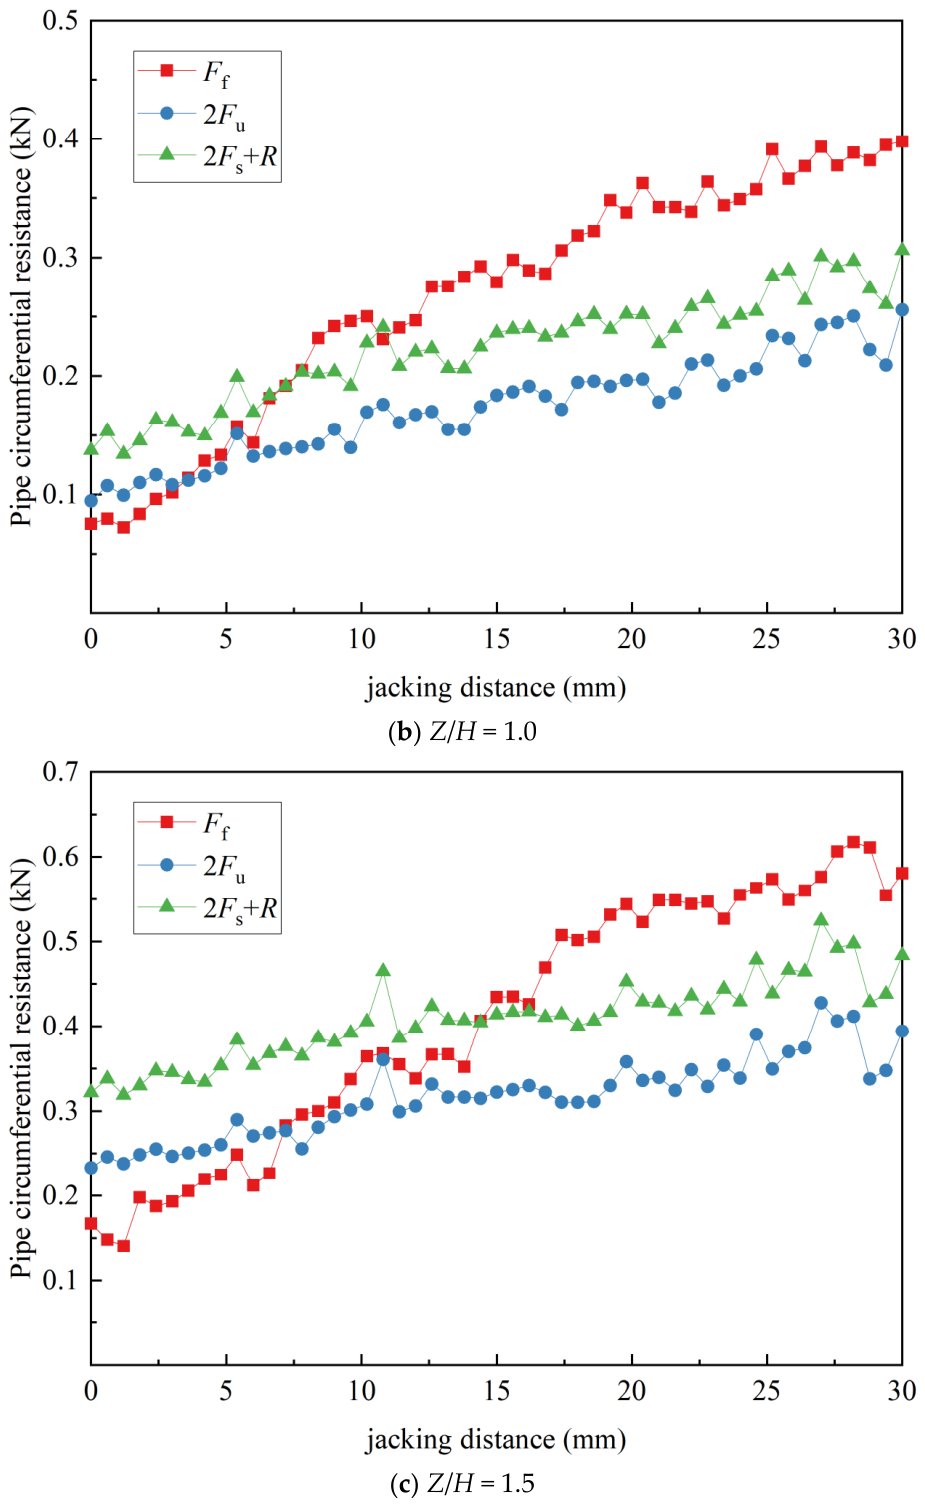
The evolution of the soil-carrying effect is essentially determined by the dynamic game between the drag force of the pipe section on the overlying soil and the resistance provided by the surrounding soil. Taking the disturbed soil directly above the excavation face as a whole, the main driving force is the friction resistance Ff of the main pipe section, and the binding force to resist instability undergoes dynamic evolution with the deformation of the soil. The lateral boundary provides a unilateral shear limit binding force Fu before rupture, and after the shear rupture, it is transformed into a unilateral shear slip binding force Fs. In addition, it also includes the limit resistance R of the front soil. Combined with the variation law of the pipe resistance measured by the test with the jacking distance (Figure 9), it can be seen that its evolution presents the three-stage characteristics of ‘elasticity-slip-strengthening’:
Additionally, the data in Figure 9 exhibits noticeable scattering and fluctuation during the resistance growth. After rechecking the sensor acquisition protocols, this fluctuation is attributed to the classic “stick-slip” frictional behavior at the pipe–soil interface. As the pipe advances, the interface cyclically alternates between static and dynamic friction. Concurrently, the localized micro-collapse and iterative reformation of the soil arch cause cyclic stress accumulation and sudden release, translating into the scattered resistance patterns observed in the dynamic pushing process.
Discussion on Stress Redistribution and Earth Pressure Evolution.
The macroscopic variations in displacement and jacking resistance are fundamentally driven by dynamic stress redistribution. During the initial elastic stage, the earth pressure field remains relatively stable. However, as the interface friction mobilizes the ultimate shear constraint ( F u ), localized shear deformation disrupts the initial stress equilibrium, leading to the deterioration of the soil arching effect. The surrounding stable soil loses its capacity to vertically suspend the moving overlying soil block, resulting in a pronounced concentration of vertical earth pressure acting directly on the pipe’s top panel. Concurrently, the longitudinal migration of the soil block causes the earth pressure at the front excavation face to sharply transition from an at-rest state toward a fully passive state, thereby mobilizing the ultimate frontal resistance ( R ). This complex stress transfer mechanism provides a comprehensive explanation for why total jacking resistance surges simultaneously with surface heave.
Rather than relying on visual observations of displacement, the transitions between the three evolutionary stages of the soil-carrying effect are strictly defined by quantitative mechanical indicators. These indicators represent the dynamic equilibrium between the driving frictional resistance ( F f ) and the resisting forces ( F u , F s , R ):
(1)
The initial elastic stage (Quantitative criterion: F f < 2 F u ): When the jacking distance is small, the total frictional resistance ( F f ) is insufficient to overcome the sum of the ultimate shear constraints on both sides ( 2 F u ). The soil remains in an elastic deformation state, and the resistance around the pipe rises slowly;
(2)
The shear slip trigger stage (Quantitative criterion: F f > 2 F u ): The critical transition into this stage is mathematically triggered when F f exceeds 2 F u . Breaking this quantitative threshold signifies that the soil’s shear surface is fully penetrated, accelerating the resistance growth rate and initiating macroscopic slip. Taking Z/H = 0.5 as an example, the jacking of only 1.2 mm breaks through the critical value. However, the Z/H = 1.0 and 1.5 conditions are delayed to 4.0 mm and 7.8 mm, respectively;
(3)
Back soil-strengthening stage (Quantitative criterion: F f > 2 F s + R ): The final stage transition occurs when the driving force F f surpasses the combined resistance of the bilateral shear slip constraint ( 2 F s ) and the ultimate passive resistance of the front soil ( R ). Meeting this condition indicates that the front soil is severely squeezed, contributing additional resistance and marking the full mobilization of the soil-carrying effect.
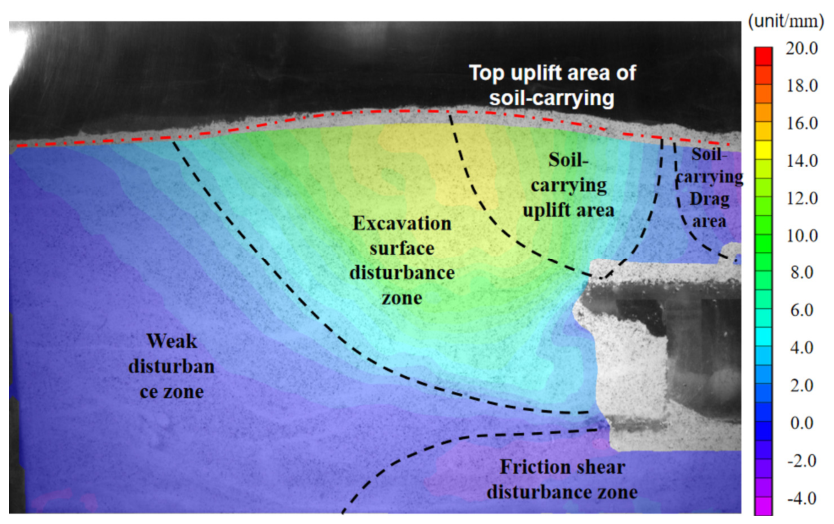
Based on the above macroscopic spatial displacement characteristics and mechanical evolution differences, the surrounding soil disturbance range caused by rectangular pipe jacking construction is divided into six characteristic areas: back soil uplift area (large plastic deformation), back soil drag area (causing rear settlement consolidation), back soil top uplift area, excavation surface disturbance area (parabolic shear zone), friction shear disturbance area and weak disturbance area, as shown in Figure 10.
In addition, combined with the soil displacement field and the disturbance zone in Figure 10, it can be seen that, in the evolution process of the soil-carrying effect, the soil in the back soil lifting area (that is, the area directly above the pipe section) is mainly manifested as the overall translation and lifting with the pipeline. Because the relative shear deformation of the soil in this area is very small, it shows the kinematic characteristics of the approximate rigid body on the macro level. The experimental observation results provide an objective basis for the establishment of the overall soil mechanics model and the introduction of corresponding physical assumptions in the subsequent theoretical derivation.
To objectively delineate the six characteristic disturbance zones, quantitative criteria and displacement thresholds were introduced based on the VIC-3D strain and displacement fields, rather than relying on qualitative approximations:
(1)
Kinematic Shear Boundary: The primary boundary separating the soil-carrying uplift area and excavation surface disturbance zone from the surrounding static soil is defined by the shear rupture surface. This surface is quantitatively determined by tracking the locus of peak displacement gradients, achieved by smoothly connecting the convex sharp points of the equivalent plastic deformation contour lines extracted from the DIC data;
(2)
Directional Displacement Thresholds: The transition between the top uplift area of soil carrying and the soil-carrying drag area is strictly governed by the sign of the vertical displacement vector. The boundary is drawn precisely where the vertical displacement equals zero ( Δ v = 0 ), distinguishing expansive shear dilatancy (positive uplift) from trailing consolidation (negative settlement);
(3)
Minimal Disturbance Limit: The boundary of the weak disturbance zone is quantitatively defined by a low-magnitude displacement threshold, encompassing the far-field soil where deformation transitions from plastic to purely elastic.

3.4. Comparison with the Existing Literature and Significance of Test Results

The macro-level evolutionary patterns observed in this study resonate strongly with the latest advancements in the field. For instance, recent independent physical simulations and theoretical studies also identified distinct multi-stage settlement–heave transitions and highlighted that critical slip surfaces typically form at inclinations of approximately 45° to 55° under extremely shallow overburden conditions [19,20]. However, the profound significance of the current study lies in capturing the micro-kinematics of the discrete shear rupture evolution. While previous continuum-based numerical simulations and macroscopic models often approximate the ground response as smoothed continuous curves, our high-precision multi-source monitoring provides direct physical evidence of the discontinuous void-filling mechanics of granular soil. Specifically, the scattered, step-wise settlement observed at the trailing edge of the migrating soil block (Point L) exposes the episodic nature of localized shear failures—a critical granular mechanical phenomenon that is frequently obscured in conventional analyses.

4. Prediction Model and Verification of Soil Effect Theory

4.1. Establishment of Theoretical Calculation Model

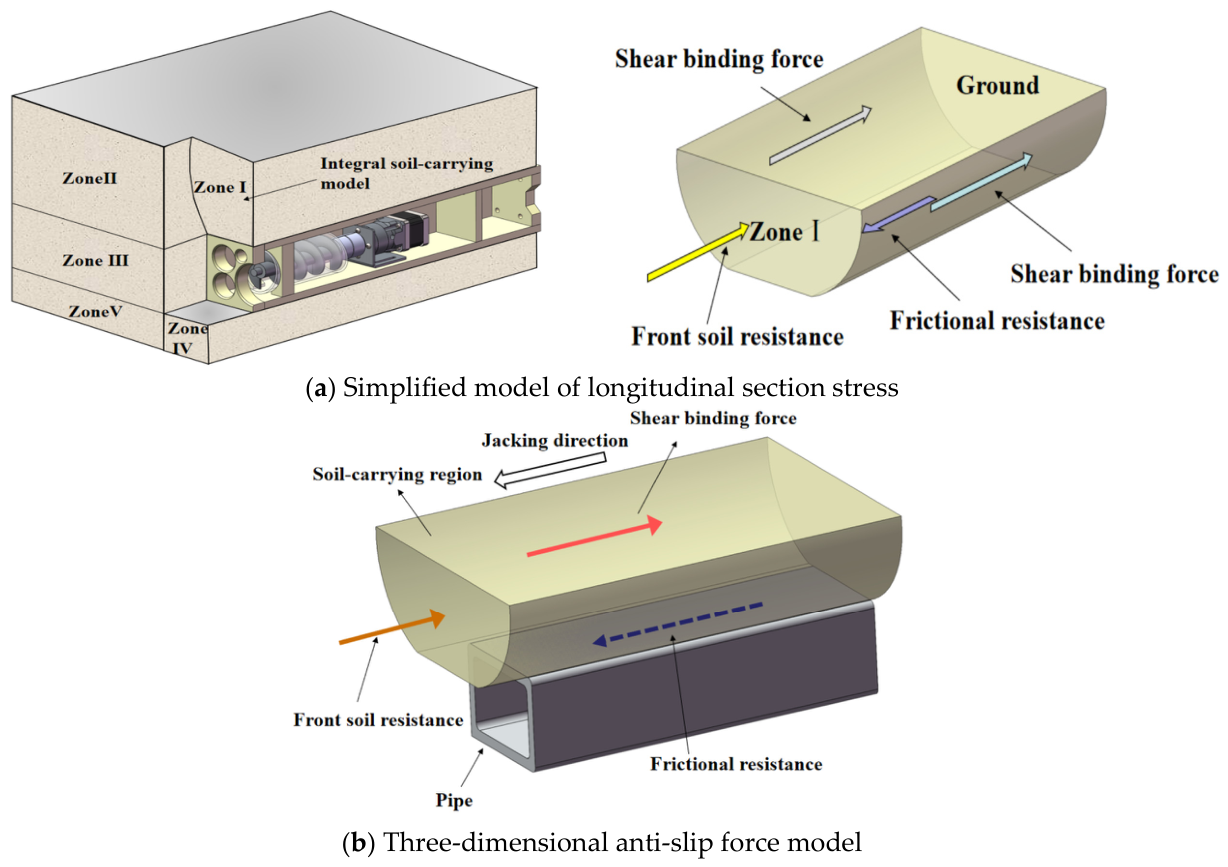
Based on the model test results in Section 3.3, it can be seen that the soil above the excavation face (i.e., the back soil uplift zone) shows obvious overall migration characteristics when the soil-carrying effect occurs, and its internal relative shear deformation is very small. In order to establish a theoretical prediction model for the soil-carrying effect of shallow buried large-section rectangular pipe jacking, the quantitative calculation method of each macroscopic mechanical boundary (pipe friction resistance, lateral restraint force and front-end resistance) shown in Figure 9 is explored. Based on the experimental phenomena, the following four simplified force assumptions are proposed for the overall back soil area directly above the pipe jacking (defined as area I):
(a)
The soil in zone I above the pipe jacking is simplified as a rigid body;
(b)
The gravity of the soil in zone I is completely borne by the pipe jacking machine, and the vertical constraint of the soil in zone II on the soil in zone I is ignored;
(c)
The frictional resistance, the shear binding force on both sides and the passive binding force of the front soil in the horizontal direction of the soil in zone I are simplified as the external force of the rigid body;
(d)
The friction resistance of the soil in zone I is greater than the ultimate shear binding force on both sides, which is the prerequisite for the overall soil effect. The friction resistance of the soil in zone I is greater than the sum of the shear slip constraint force on both sides and the passive constraint force of the front soil, which is the failure condition caused by the overall soil effect.
Based on the above assumptions, a two-dimensional longitudinal section force model of the overall soil-carrying effect is established along the jacking direction, as shown in Figure 11. At the same time, combined with the dynamic evolution process of the overall instability failure, the overall soil-carrying effect is expressed as:
F f 2 F u     ( prerequisite ) F f 2 F s R ( failure   condition )
In the formula, Ff is the frictional resistance of the main pipe in the soil of zone I; Fu is the unilateral shear limit constraint force of soil in zone I; Fs is the unilateral shear slip constraint force of soil in zone I; and R is the ultimate resistance of the front soil.
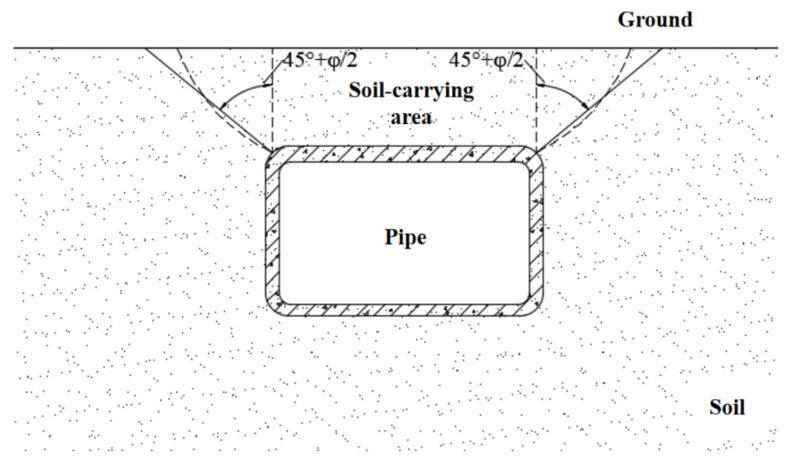
According to the back soil model test results, the back soil area is a curved surface expansion. Considering that the complexity of the back soil boundary trace equation is not conducive to actual use, the back soil boundary line of the above working conditions is simplified, as shown in Figure 12. According to the critical failure condition, the prediction formula for jacking distance is deduced, which provides a reference for design and construction.
As shown in Figure 12, the cross section of the simplified back soil area is an inverted trapezoid. According to the shear strength failure criterion, after the shear slip surface is formed, the unilateral shear constraint force Fs of the whole back soil area is:
F s = τ f d S = 0.5 K γ h 0 2 L tan φ cos 45 + φ / 2
In the formula, K is the lateral earth pressure coefficient; K = 1 sin φ ; γ is the average bulk density of the overlying soil; h0 is the average thickness of the overlying soil; L is the jacking mileage at a certain time; and φ is the effective internal friction angle of the overlying soil. Because the overall back soil area conforms to the Rankine passive earth pressure condition, the resistance of the front soil to the back soil area is;
R p = 0.5 γ h 0 K p + 2 c K p h 0 B + h 0 tan 45 + φ / 2
In the formula, Kp is the passive earth pressure coefficient; K p = tan 2 45 + φ / 2 ; and c is soil cohesion. Therefore, the discriminant conditions for the formation of the overall back soil area are:
μ γ B L K γ h 0 L tan φ cos 45 + φ / 2 0.5 γ h 0 K p + 2 c K p B + h 0 tan 45 + φ / 2
It should be noted that the earth pressure calculation theory in the above theoretical formula is the soil column theory, which only conforms to the overall soil-carrying effect condition that the rupture slip line penetrates the surface, as shown in the above diagram. For the condition that the rupture slip line does not penetrate the surface, the earth pressure calculation method can refer to the modified Terzaghi earth pressure theory calculation.
From the above, the friction coefficient of pipe–soil is an important construction control index. Considering the cohesion of pipe–soil, Equation (4) is combined and simplified, and the following can be obtained:
μ K h 0 tan φ sec 45 + φ / 2 A + 0.5 γ h 0 K p + 2 c K p A + h 0 tan 45 + φ / 2 γ A L
Let the first term on the right side of the above inequality be μa and the second term be μb. When other parameters are constant, it can be seen that, no matter how long the jacking mileage L is, the soil-carrying effect will not occur. By observing the second term μb and the whole inequality, it can be seen that the friction coefficient μ of the pipe (machine) soil is inversely proportional to the jacking mileage L. That is, the larger the friction coefficient μ of the pipe (machine) soil, the smaller the jacking mileage of the overall soil-carrying effect. Therefore, the on-site construction should implement drag reduction measures as far as possible according to the value less than μa to ensure that no soil-carrying effect occurs.
According to the critical failure condition of the whole soil-carrying effect, the critical jacking mileage is derived:
L 0.5 γ h 0 K p + 2 c K p B + h 0 tan 45 + φ / 2 μ γ B K γ tan φ sec 45 + φ / 2

4.2. Comprehensive Validation of the Theoretical Model

To ensure that the theoretical model is robust and reliable before its application in engineering practice, a comprehensive two-tiered validation framework was established. First, the model’s internal accuracy is quantitatively verified against the 1 g physical model test results obtained in this study. Second, to demonstrate its general applicability to real-world field problems, the model is further validated against an independent, published case history.
The jacking distance of the test is 30 mm, and the half-mode size parameter of the outer contour of the pipe section model is 76 mm × 92 mm, which is a shallow overburden, large cross-section and long-distance rectangular pipe jacking project. The calculation parameters are shown in Table 3.
(1)
Checking the discriminant conditions for the formation of the overall back soil area.
Substituting the above conditions into Equation (4), we can obtain:
When Z/H = 0.5:
μ j t γ B L j + μ g t γ B L g K γ h 0 L tan φ cos 45 + φ / 2 0.5 γ h 0 K p + 2 c K p B + h 0 tan 45 + φ / 2 = 0.935 0
When Z/H = 1.0:
μ j t γ B L j + μ g t γ B L g K γ h 0 L tan φ cos 45 + φ / 2 0.5 γ h 0 K p + 2 c K p B + h 0 tan 45 + φ / 2 = 1.512 0
When Z/H = 1.5:
μ j t γ B L j + μ g t γ B L g K γ h 0 L tan φ cos 45 + φ / 2 0.5 γ h 0 K p + 2 c K p B + h 0 tan 45 + φ / 2 = 1.962 0
The calculation shows that the overall soil effect must appear in the test, which is consistent with the test results.
(2)
Calculation of critical friction coefficient
μ ¯ = K h 0 tan φ sec 45 + φ / 2 B + 0.5 γ h 0 K p + 2 c K p B + h 0 tan 45 + φ / 2 γ B L = 0.54
Therefore, the soil-carrying effect will occur under the conditions of the pipe–soil friction coefficients of 0.56 and 0.72 in this experiment.
(3)
Calculation of critical jacking mileage
Substituting the known parameters into Equation (6), the critical jacking mileage is:
When the friction coefficient is 0.56 and the overburden ratio Z/H = 0.5:
L = 0.5 γ h 0 K p + 2 c K p B + h 0 tan 45 + φ / 2 μ ¯ γ B K γ tan φ sec 45 + φ / 2 = 2.3   mm
Similarly, the critical jacking mileages of Z/H = 1.0 and Z/H = 1.5 can be calculated to be 7.2 mm and 14.7 mm, respectively. According to the previous research, the actual mileage positions of Z/H = 0.5, Z/H= 1.0 and Z/H = 1.5 are 2.8 mm, 8.6 mm and 15.7 mm, respectively. To objectively evaluate the accuracy of the proposed mechanical model, quantitative error metrics, including Absolute Error (AE) and Percentage Error (PE), were calculated for the critical jacking mileage under the condition of μ = 0.56 , as summarized in Table 4.
As demonstrated in Table 4, the theoretical predictions align closely with the experimental observations. For medium-to-deep burial conditions ( Z / H 1.0 ), the Absolute Error is constrained within 1.5 mm, and the Percentage Error ranges from approximately 6% to 16%. The data quantitatively confirms that the predicted critical distances are consistently smaller than the actual occurrences. This systematic deviation, yielding a conservative error margin, is primarily attributed to the model’s intentional simplification of 3D spatial constraints (i.e., rigid-body assumptions and neglecting partial vertical suspension from surrounding soil) during the mechanical transition from pre-failure limit constraints to post-failure shear slip constraints. Overall, the quantitative error measures validate that the model is both sufficiently accurate for engineering estimation and inherently safe for guiding early-warning interventions.

4.3. Model Applicability, Limitations and Future Validation

While the proposed theoretical prediction model has been rigorously validated against the 1 g physical model test results in this study, the direct application of this work to real-world engineering problems requires careful consideration of its current limitations and necessary future validation steps.
First, the current formulation is established under controlled laboratory conditions using homogeneous, oven-dried quartz sand, effectively isolating variables such as moisture and soil heterogeneity. In actual field applications, factors such as groundwater fluctuations, cohesive soil layers, and dynamic slurry migration can introduce complex hydro-mechanical coupling effects that are beyond the scope of the present simplified framework.
Second, before deploying the critical friction coefficient ( μ a ) and critical jacking distance ( L ) for precise quantitative control in specific projects, site-specific calibration is strongly recommended. Future work will focus heavily on bridging this laboratory-to-field gap by gathering extensive field monitoring data and full-scale case histories to further refine, validate, and expand the general applicability of the proposed model for complex geotechnical environments.

4.4. Application in Parameter Optimization and Safety Control

The theoretical models for the critical friction coefficient ( μ a ) and critical jacking mileage ( L ) provide quantitative tools for optimizing construction parameters and enforcing safety control in real-field problems.
(1)
Optimization of Construction Parameters: First, μ a acts as a direct optimization target for lubrication strategies. Engineers can quantitatively formulate the bentonite mud’s viscosity and injection volume to ensure the actual pipe–soil friction stays below μ a . Second, the critical jacking distance ( L ) is instrumental in optimizing the layout of the jacking system. If a designated tunnel drive exceeds the calculated L , it quantitatively dictates the necessity and optimal spacing of Intermediate Jacking Stations (IJS) to segment the continuous longitudinal accumulation of shear stresses;
(2)
Dynamic Safety Control Protocol: For real-time safety control, it is recommended to establish an allowable operating friction limit defined as μ a l l o w a b l e = μ a / K (where K is a safety factor ranging from 1.2 to 1.5). During construction, the active interface friction can be continuously back-calculated from the real-time-monitored total jacking force. If this active friction surges and approaches μ a l l o w a b l e , it serves as an immediate safety trigger. Construction must be temporarily halted to execute emergency protocols—such as high-pressure re-lubrication at the cutterhead or activating the Intermediate Jacking Stations (IJS)—preventing the transition into the macroscopic strengthening stage.
Comparison of the prediction model with existing frameworks: When compared to contemporary theoretical frameworks, the proposed prediction model aligns with the foundational consensus that the pipe–soil interface friction serves as the primary mechanical driver for instability. While recent advanced studies have attempted to refine classical limit equilibrium equations by incorporating specific fracture angles or assuming static plastic domains [9,20], a significant limitation remains in their temporal treatment of boundary forces. Traditional and modified analytical models frequently adopt a constant lateral shear strength throughout the entire jacking process. In contrast, the theoretical framework proposed herein rigorously distinguishes between the pre-failure ultimate shear constraint force ( F u ) and the post-failure dynamic shear slip constraint force ( F s ). The academic and practical significance of modeling this dynamic force transition is that it actively prevents the theoretical overestimation of the surrounding soil’s self-supporting resistance. Consequently, this model systematically yields a conservative and highly reliable critical jacking mileage ( L ) tailored for safe engineering practice.

5. Conclusions

Based on the visual physical model tests and the theoretical analysis of the soil-carrying effect in shallow-buried rectangular pipe jacking, the major findings are summarized as follows:
(1)
The overburden ratio ( Z / H ) significantly dictates the severity of the soil disturbance. A smaller ratio ( Z / H = 0.5 ) triggers extensive plastic deformation and surface settlement, whereas a larger ratio ( Z / H = 1.5 ) effectively suppresses the upward propagation of the shear band;
(2)
The pipe–soil interface friction is the primary mechanical driver for the instability. Increased friction drastically amplifies the displacement response, triggering severe surface heave and trailing settlement;
(3)
The evolution of the soil-carrying effect follows a distinct three-stage mechanism governed by dynamic force transitions: the initial elastic response stage, the shear slip plastic development stage, and the final dynamic instability strengthening stage;
(4)
Based on kinematic characteristics and displacement gradients, the surrounding soil disturbance is quantitatively categorized into six distinct zones, including the top uplift area, the trailing drag area, and the excavation face disturbance zone;
(5)
The proposed theoretical prediction model, integrating the critical friction coefficient ( μ a ) and the critical jacking mileage ( L ), accurately aligns with the experimental results and provides a structurally conservative boundary for safe construction control.
Limitations: While the proposed theoretical model and experimental findings provide a solid basis for safe construction control, this study still possesses certain constraints. Primarily, the current methodology relies on 1 g physical model tests using dry homogeneous sand, which inherently excludes the complex hydro-mechanical coupling effects of groundwater and inherent soil cohesion. Future research will focus on comprehensive field monitoring and large-scale centrifuge tests to further validate and refine the theoretical framework for complex strata.

Author Contributions

Conceptualization, J.G., H.M. and K.L.; Methodology, J.G., H.M., K.L. and P.Z.; Validation, J.G., H.M., K.L. and P.Z.; Formal analysis, J.G. and K.L.; Investigation, J.G., H.M. and P.Z.; Writing—original draft, J.G.; Writing—review & editing, K.L., P.Z., Y.Z., X.Z. and L.Z.; Visualization, J.G.; Supervision, H.M., K.L., P.Z., Y.Z., X.Z. and L.Z.; Project administration, P.Z., Y.Z., X.Z. and L.Z.; Funding acquisition, P.Z., Y.Z., X.Z. and L.Z. All authors have read and agreed to the published version of the manuscript.

Funding

This work was supported by the National Natural Science Foundation of China (No. 52008383), and also financially supported by the Research Project of PowerChina Guiyang Survey, Design and Research Institute Co., Ltd. (Project No. YJ2023-01).

Data Availability Statement

The original contributions presented in this study are included in the article. Further inquiries can be directed to the corresponding author.

Conflicts of Interest

Authors Yunlong Zhang, Xiaoyi Zheng and Lingfeng Zhou were employed by PowerChina Guiyang Engineering Corp., Ltd. The remaining authors declare that the research was conducted in the absence of any commercial or financial relationships that could be construed as a potential conflict of interest.

References

  1. Chen, X.L.; Ma, B.S.; Najafi, M.; Zhang, P. Long rectangular box jacking project: A case study. Undergr. Space 2021, 6, 101–125. [Google Scholar] [CrossRef] [Scilit]
  2. Ma, P.; Shimada, H.; Ma, B.; Huang, S.; Zhou, H. Research status and development trends of key technologies of rectangular pipe jacking. Tunn. Constr. 2022, 42, 1677–1692. (In Chinese) [Google Scholar]
  3. Zheng, S.; Wang, C.; Luo, Z.; Zhang, Y.; Chen, J.; Li, X. Factors Influencing Pipe Stress Responses in Pipe Jacking in Bedrock: Field Monitoring and Numerical Simulation. J. Pipeline Sci. Eng. 2025, 6, 100320. [Google Scholar] [CrossRef] [Scilit]
  4. Wen, J.; Zhang, P.; Xiang, T. Comparative research on the pipe-soil frictional resistances of circular and rectangular pipe sections during trenchless pipe jacking. PLoS ONE 2024, 19, e0297537. [Google Scholar] [CrossRef] [Scilit] [PubMed]
  5. Peng, L.; Wang, Z.; Ye, Y.; Yang, W. The development and research status of rectangular pipe jacking technology. Tunn. Constr. 2015, 35, 1–8. (In Chinese) [Google Scholar]
  6. Yu, B.; Chen, C. Pipe Jacking Construction Technology; People’s Transportation Publishing House: Beijing, China, 2003. (In Chinese)
  7. Huang, C.; Liu, J.; Huang, J.; Fu, P.; Yang, S.; Liu, K.; Wu, C. Numerical and Experimental Study on the Influence of Large-Section Rectangular Pipe Jacking Construction on Existing Subway Tunnels: A Case Study. Infrastructures 2026, 11, 53. [Google Scholar] [CrossRef] [Scilit]
  8. Gao, Y.; Feng, C.; Cheng, P. Study on the ‘overall soil effect’ of shallow buried rectangular pipe jacking. J. Geotech. Eng. 2018, 40, 1936–1942. (In Chinese) [Google Scholar] [CrossRef]
  9. Ma, X.; Su, D.; Wu, Y.; Wu, J.; Yang, W.; Wang, L.; Chen, X. Theoretical analysis model for the whole process of soil-carrying effect of shallow buried rectangular pipe jacking. J. Fuzhou Univ. (Nat. Sci. Ed.) 2024, 52, 569–576. (In Chinese) [Google Scholar] [CrossRef]
  10. Shou, K.; Yen, J.; Liu, M. On the frictional property of lubricants and its impact on jacking force and soil–pipe interaction of pipe-jacking. Tunn. Undergr. Space Technol. 2010, 25, 469–477. [Google Scholar] [CrossRef] [Scilit]
  11. Ma, P.; Shimada, H.; Sasaoka, T.; Hamanaka, A.; Moses, D.N.; Dintwe, T.K.M.; Matsumoto, F.; Ma, B.; Huang, S. A new method for predicting the friction resistance in rectangular pipe-jacking. Tunn. Undergr. Space Technol. 2022, 123, 104338. [Google Scholar] [CrossRef] [Scilit]
  12. Zhen, L.; Zhang, X.; Li, X. Application and treatment measures of discrimination method for overall soil-carrying effect of shallow buried rectangular pipe jacking. Mod. Tunn. Technol. 2022, 59, 167–171. (In Chinese) [Google Scholar] [CrossRef]
  13. Gao, H.; Wu, J.; Yang, W.; Su, D.; Wu, Y.; Chen, X. Study on the inhibitory effect of isolation wall on the soil-carrying effect of pipe jacking. Mod. Tunn. Technol. 2022, 59, 1120–1126. (In Chinese) [Google Scholar] [CrossRef]
  14. Dou, X.; Wang, H.; Cao, W.; Wang, J.; Zhao, L.; Ran, J. Cause analysis and treatmnt measures of integral soil-carrying effect of shallow buried rectangular pipe jacking. Tunn. Constr. (Chin. Engl.) 2019, 39, 473–479. [Google Scholar]
  15. Xiong, J. Key Force Analysis of Rectangular Pipe Jacking. Master’s Thesis, School of Engineering and Technology, China University of Geosciences, Beijing, China, 2013. (In Chinese) [Google Scholar] [CrossRef]
  16. Li, G.; Shan, R.; Zhang, J.; Dou, H.; Zhou, B.; Wang, Y.; Zheng, P. Experimental Study on Soil-Back Effect Dominated by Over-Excavation Annular Gap in Construction of Shallow-Buried Large-Section Long-Distance Rectangular Pipe Jacking. Rock Soil Mech. 2026, 1–17. (In Chinese) [Google Scholar] [CrossRef]
  17. Hong, C.; Wei, G.; He, Y.; Chen, H. Experimental Study on Scaled-Model Test of Back-soil Effect in Shallow-buried Rectangular Pipe Jacking Construction. J. Railw. Sci. Eng. 2026, 1–12. (In Chinese) [Google Scholar] [CrossRef]
  18. Wei, G.; Hong, C.; Chen, H. Research on Theory and Numerical Simulation of Overall Back-soil Effect of Shallow-buried Rectangular Pipe Jacking. Ground Improv. 2026, 8, 236–247. (In Chinese) [Google Scholar]
  19. Xiao, W. Preliminary Study on Shield Tunnel Model Test Based on Transparent Soil. Master’s Thesis, Wuhan University of Technology, Wuhan, China, 2011. (In Chinese) [Google Scholar]
  20. Chen, R.; Li, J.; Chen, Y.; Kong, L. Model test on the stability of dry sand shield excavation face. J. Geotech. Eng. 2011, 33, 117–122. (In Chinese) [Google Scholar]
  21. Xu, Q.; Zhu, H.; Liao, S.; Fu, D.; Yu, N.; Wang, C. Model test study on ground adaptability of shield tunneling in sandy soil. J. Rock Mech. Eng. 2006, 25, 2902–2909. (In Chinese) [Google Scholar]
  22. Li, J.; Liu, W.; Zou, J.; Zhao, Y.; Gong, X. Large-scale model tests on face instability of shallow shield tunnels in sand. Chin. J. Geotech. Eng. 2018, 40, 562–567. (In Chinese) [Google Scholar] [CrossRef]
  23. Lin, H. Excavation Face Stability Test and Particle Flow Numerical Simulation of Shield Tunnel; Southeast University: Nanjing, China, 2016. (In Chinese) [Google Scholar]
  24. Tognon, A.R.; Rowe, R.K.; Brachman, R.W.I. Evaluation of side wall friction for a buried pipe testing facility. Geotext. Geomembr. 1999, 17, 193–212. [Google Scholar] [CrossRef] [Scilit]
Figure 1. The overall schematic diagram of the model box. (a) Model box; (b) model rectangular tube; (c) servo cylinder and control system; (d) VIC-3D measurement system; (e) 3D laser scanner; (f) thin-film pressure sensor.
Buildings 16 03711 g001
Figure 2. Flowchart of the experimental methodology and procedure.
Buildings 16 03711 g002
Figure 3. Soil instability process.
Buildings 16 03711 g003aBuildings 16 03711 g003b
Figure 4. Extract of the vertical displacement point diagram.
Buildings 16 03711 g004
Figure 5. Soil vertical displacement diagram.
Buildings 16 03711 g005
Figure 6. Extract the point diagram of longitudinal horizontal displacement.
Buildings 16 03711 g006
Figure 7. Change in longitudinal displacement of soil.
Buildings 16 03711 g007
Figure 8. Three-dimensional map of surface deformation.
Buildings 16 03711 g008aBuildings 16 03711 g008b
Figure 9. Variation diagram of resistance around the pipe.
Buildings 16 03711 g009aBuildings 16 03711 g009b
Figure 10. Partition diagram of soil disturbance under soil-carrying effect.
Buildings 16 03711 g010
Figure 11. The concept of the whole soil-carrying effect theory and the three-dimensional mechanical calculation model.
Buildings 16 03711 g011
Figure 12. Mechanical calculation diagram of soil effect.
Buildings 16 03711 g012
Table 1. Index of particle size composition of test soil.
Indicator CategoryPhysical MeaningFormulaExperiment Value
Boundary particle size d60Particles smaller than this size account for 60% of the total mass.According to the value of particle fraction curve0.380 mm
Mean particle diameter d50Particles smaller than this size account for 50% of the total mass.0.355 mm
Medium particle diameter d30Particles smaller than this size account for 30% of the total mass.0.170 mm
Effective particle diameter d10Particles smaller than this size account for 10% of the total mass.0.058 mm
Coefficient of uniformity CuRepresents the dispersion degree of soil particle size.Cu = d60/d106.55
Grading factor CcIndicates whether an intermediate particle size is missing or not.Cc = (d30)2/(d10 × d60)1.31
Table 2. Test soil similarity ratio.
CategoryDensity ρ (g/cm3)Cohesion c (kPa)Angle of Internal Friction φ (°)
Prototypical physical quantities1.943.833.4
Experimental physical quantities1.78035.6
Ratio of similitude0.92/1/1.07/1
Table 3. Calculation parameters of formation and pipe section.
Friction CoefficientOverlying Soil Bulk Density γ
(kN/m3)
Covering Soil Ratio Z/HForce of Cohesion c
(kPa)
Angle of Internal Friction φ
(°)
Tube Width B
(mm)
Tube Height H
(mm)
Tube Thickness t
(mm)
0.56/0.7217.80.5/1.0/1.5035.6769210
Table 4. Quantitative error analysis of critical jacking mileage ( μ = 0.56 ).
Overburden Ratio ( Z / H )Actual Mileage (mm)Predicted Mileage (mm)Absolute Error (mm)Percentage Error (%)
0.52.82.30.517.9
1.08.67.21.416.3
1.515.714.71.06.4
Disclaimer/Publisher’s Note: The statements, opinions and data contained in all publications are solely those of the individual author(s) and contributor(s) and not of MDPI and/or the editor(s). MDPI and/or the editor(s) disclaim responsibility for any injury to people or property resulting from any ideas, methods, instructions or products referred to in the content.