1. Introduction
Tunnel systems are widely used in transportation, mining, and underground logistics as essential infrastructure for subsurface space utilization [
1,
2,
3,
4]. Their construction inevitably disturbs the original hydrogeological balance, altering the interaction between surrounding rock and groundwater [
5,
6,
7]. As excavation proceeds, stress redistribution within the rock mass enhances fracture permeability and promotes groundwater seepage into the tunnel through fracture networks [
8], leading to persistent wall dampness and a gradual increase in internal humidity that ultimately forms a typical high-humidity tunnel environment [
9]. Under ventilation, moisture retained on rock surfaces continuously evaporates into the airflow and is transported downstream, leading to continuous accumulation of humidity within the tunnel [
10]. In extreme cases, the relative humidity of airflow can reach 95% or even saturation [
11]. Environments with relative humidity exceeding 60% are generally classified as high-humidity environments [
12]. Prolonged exposure to high-temperature and high-humidity conditions significantly affects workers’ blood pressure, heart rate, and body temperature, leading to reduced physical performance, increased fatigue, and impaired concentration [
13,
14,
15]. In addition, high humidity also degrades the insulation performance of electrical equipment installed in tunnels and increases the risk of leakage and short-circuit failures [
16]. Therefore, investigating the mechanisms and characteristics of moisture exchange between airflow and humid rock walls is essential for predicting humidity distributions and provides a basis for effective dehumidification, environmental improvement, and safe tunnel operation.
Tunnel ventilation is a critical component of tunnel construction and operation [
17,
18]. Heat and mass transfer between airflow and humid rock walls involve coupled interactions among the temperature, humidity, and flow fields, forming a complex non-equilibrium transport process [
19,
20]. Extensive studies have systematically investigated airflow-induced temperature variations in tunnels, particularly the heat transfer associated with flow–rock interactions under non-isothermal conditions, using field experiments [
21,
22], theoretical analyses [
23,
24,
25], and numerical simulations [
26,
27]. Accurate determination of the unstable heat transfer coefficient between airflow and surrounding rock is essential for analyzing such problems. Xue et al. [
28] proposed an analytical method based on boundary layer theory to determine convective heat transfer coefficients and demonstrate good agreement for fractured rock masses; Chen et al. [
29] accounted for the non-uniform longitudinal distribution of airflow velocity under forced ventilation and derived a corresponding formulation for the heat transfer coefficient. In addition, numerous studies have focused on the cooling effect of ventilation on surrounding rock. Zhu et al. [
30] quantitatively analyzed the influence of airflow parameters on the temperature field and its temporal evolution through similarity simulation experiments, demonstrating that, under steady-state conditions, high airflow velocity is the dominant factor affecting the surrounding rock temperature field. Zeng et al. [
24] developed a dynamic temperature field model to determine optimal ventilation parameters for cooling high-temperature tunnels using mechanical ventilation. Although these studies have provided a detailed understanding of tunnel heat transfer, most treat the tunnel environment primarily as a thermal problem and do not explicitly account for moisture evaporation, vapor transport, and their feedback on heat transfer.
Compared with dry tunnels, humid tunnels are characterized by active moisture evaporation and vapor transport. These processes are strongly coupled with heat transfer, thereby increasing the complexity of the tunnel thermal–moisture environment [
31,
32]. Xu et al. [
33] demonstrated that neglecting evaporation and latent-heat effects can lead to considerable errors in airflow temperature prediction. For groundwater-affected surrounding rock, Bai and Ma [
34,
35] investigated the effects of fracture characteristics on fluid–rock heat transfer, while Chen et al. [
36] developed a coupled heat-transfer and seepage model for sparsely fractured rock masses. More recently, Zhao et al. [
37] validated a coupled temperature–humidity model against field measurements for mechanically ventilated hot-humid tunnels, while Chen et al. [
38] developed a coupled heat–moisture model considering ventilation and hot-water inflow to predict tunnel temperature and humidity. Wang et al. [
39] further incorporated inlet air conditions, ventilation volume, and hot-water quantity into a three-dimensional thermal–humidity model. Zhang et al. [
40] considered fissure water and spatially distributed humid porous regions, demonstrating that the extent and distribution of moisture sources can affect airflow humidity. Sun et al. [
41] developed a bidirectional rock–air heat–moisture model incorporating seepage water, allowing moisture transport within the surrounding rock to be explicitly considered.
The above investigations show that groundwater-related processes have been increasingly incorporated into tunnel thermal and humidity modeling. Nevertheless, most existing studies have focused on localized seepage, hot-water inflow, or high-geothermal environments, while the cumulative effect of continuous wall evaporation on airflow humidification along the ventilation path has received less attention. In long ventilated tunnels, continuous evaporation not only adds moisture to the airflow but also alters the thermal environment through latent heat exchange, leading to a progressive evolution of temperature and humidity downstream. A better understanding of this longitudinal evolution is therefore essential for characterizing the development of high-humidity conditions in ventilated tunnels.
This study aims to develop a fully coupled thermo–moisture–flow model capable of simultaneously simulating turbulent airflow in the intake tunnel, transient heat transfer in the surrounding rock, convective heat transfer, and moisture migration within airflow. Latent heat effects associated with water phase change are incorporated, and the model is validated against relevant experimental data. Then, the established model is used to investigate the spatiotemporal evolution of the tunnel moisture environment. According to the cross-sectional distribution of relative humidity, the moisture transfer process is identified and divided into three stages: dry cooling, dew condensation (partial wet cooling), and fog condensation (complete wet cooling) [
42]. Two transition interfaces are identified between these stages, and their distances from the ventilation inlet are defined as “condensation distance” and “fogging distance,” respectively. These indicators are used to assess the risk level associated with high-humidity environments. Furthermore, the effects of key parameters—including the initial temperature difference between surrounding rock and airflow, the initial relative humidity of airflow, wall surface humidity, and ventilation velocity—on the moisture transfer process are systematically analyzed. Based on these analyses, regression equations are developed to predict the risks of condensation and fogging in the intake tunnel under humid wall conditions, providing a practical tool for risk assessment and ventilation strategy optimization in tunnel engineering applications.
2. Mathematical Model
The present study considers the latent heat effects associated with evaporation of liquid water from the tunnel wall surface, which influences the overall temperature field within the tunnel. Under the influence of geological activity and ground stress, groundwater infiltrates fractures in the surrounding rock and accumulates within rock strata. As a result, tunnel wall surfaces are often moist, leading to more complex temperature and humidity distributions compared with those in dry tunnels. When a temperature difference exists between incoming airflow and surrounding rock, convective heat transfer occurs between them. Simultaneously, water on the wall surface evaporates, absorbing heat from the surroundings and increasing the enthalpy of the airflow. Phase change at the wall interface introduces water vapor into the airflow, continuously increasing its humidity. The humidity increases along the ventilation path and gradually stabilizes over time.
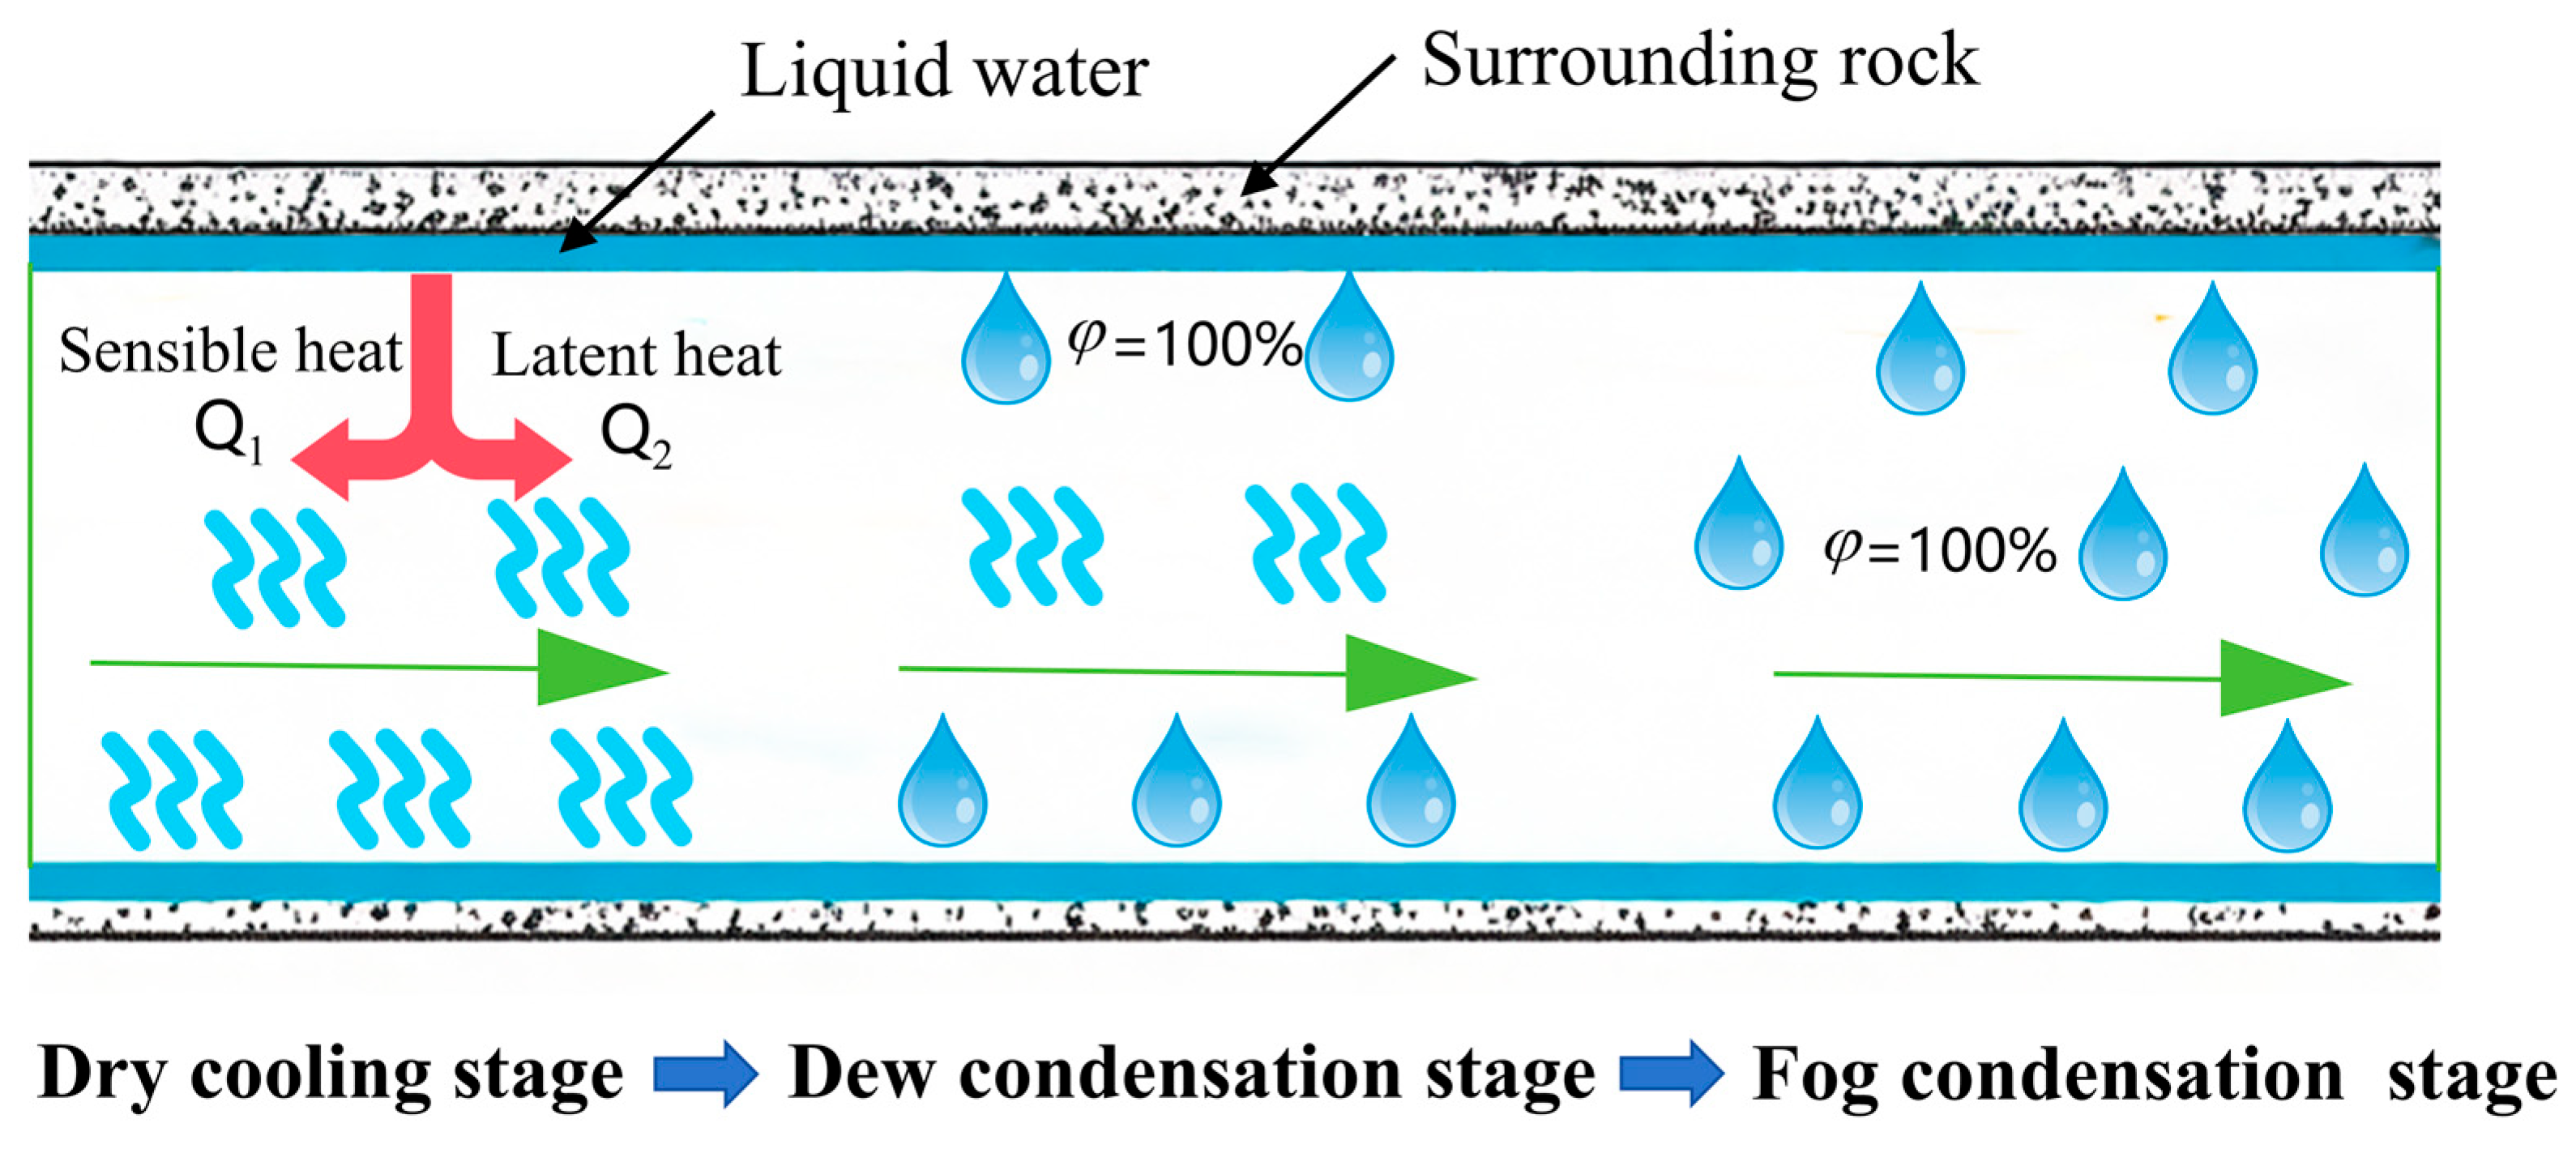
The cross-sectional distribution of relative humidity exhibits distinct characteristics across three stages, as is shown in
Figure 1. During the dry cooling stage, the relative humidity of airflow gradually increases toward saturation, with lower air temperature and higher relative humidity near the wall boundary layer. In the dew condensation stage, air near the wall boundary layer reaches saturation first due to cooling and moisture absorption, whereas the relative humidity farther from the wall remains relatively low. In the fog condensation stage, the relative humidity throughout the cross-section reaches 100%. Under the action of condensation nuclei, fog is formed and condensed. The rate of water evaporation also depends on factors such as wall temperature, ventilation velocity, and initial air humidity [
43,
44,
45]. To accurately characterize heat transfer and moisture migration during tunnel ventilation under humid conditions, a fully coupled thermo–moisture–flow numerical model for the fluid–solid system is developed, and the key influencing factors governing the evolution of the humidity field are systematically investigated.
2.1. Basic Assumptions
The primary objective of this study is to investigate humidity distribution in a humid tunnel using a coupled conduction–convection heat and mass transfer model. To simplify the analysis while ensuring model validity and accuracy, the following assumptions are adopted:
- (1)
Surrounding rock and airflow in the tunnel are treated as homogeneous, isotropic continua with constant physical properties throughout the simulation.
- (2)
Both surrounding rock and airflow obey the law of energy conservation.
- (3)
Air and water vapor are treated as compressible fluids, and thermal radiation is neglected.
- (4)
For the water-rich tunnel conditions considered in this study, the pores of the surrounding rock are assumed to be saturated with liquid water, and sufficient water is assumed to be continuously available at the wall surface to sustain evaporation.
- (5)
The moisture transfer process during evaporation at the tunnel wall is assumed to be isothermal.
These assumptions simplify the coupled model while retaining the dominant heat and moisture transfer processes. Assumption (1) neglects the effects of fractures, stratification, and spatial variations in rock properties, whereas Assumption (4), which assumes a continuous water supply at the tunnel wall, may overestimate long-term humidity accumulation when near-wall drying occurs. Therefore, the applicability of the present model is mainly limited to tunnels with relatively uniform rock properties and sufficient moisture supply, while more complex geological and moisture conditions should be considered in future studies.
2.2. Governing Equations
2.2.1. Governing Equations for Airflow
The conservation of momentum equations (Navier–Stokes equations) are employed to describe airflow motion within the tunnel [
46].
where
is the density of fluid,
is the velocity of airflow,
is the gas pressure in the roadway,
is the kinetic viscosity,
is the unit matrix, and
is the momentum source term.
The air inside the tunnel is in a turbulent state. To explain the convective–conductive coupling effect near the wall surface, a
turbulence model is adopted. This model has an exact solution for the transport of air shear stress at the boundary [
47].
The equations of airflow motion are as follows:
The
equation can be written as:
The
equation is as follows:
where
is the density of fluid;
and
are the kinetic energy and dissipation rate of the turbulence kinetic energy, respectively;
is the turbulence production terms;
is the dynamic viscosity coefficient; and
is the turbulent dynamic viscosity coefficient, which is defined as:
In addition, , , , , and are the constant parameters of the turbulence model, and their values are , , , , and .
2.2.2. Governing Equations for Temperature Field
The heat transfer mode in the rock is mainly through heat conduction. The heat transfer equation can be expressed as [
37,
48]:
The main form of heat transfer between airflow and the wall surface is convective heat transfer, which can be calculated using the following equation:
where
is the specific heat capacity of the airflow or solid;
is the velocity vector;
and
are the temperatures of the airflow and solid;
and
are the heat source of the airflow and solid; and
and
are the heat conduction coefficients that vary with temperature.
2.2.3. Governing Equations of the Humidity Field
While the airflow is conducting heat exchange, due to the existence of the concentration difference in water vapor, along with the mass transfer of water vapor in the airflow, it is expressed as [
49]:
where
is the molar flux of the water vapor;
is the diffusion coefficient of the water vapor, taken as 2.6 × 10
−5 m
2/s; and
is the water vapor concentration. The water vapor concentration is expressed as
, where
is relative humidity and
is the vapor saturation concentration, which is primarily determined by the ambient temperature. The governing equation is presented in Equation (8).
where
is saturation vapor pressure,
is the environment temperature, and
is the gas molar constant, whose value is set as 8.314 J/(mol·K).
2.3. Physical Models and Boundary Conditions
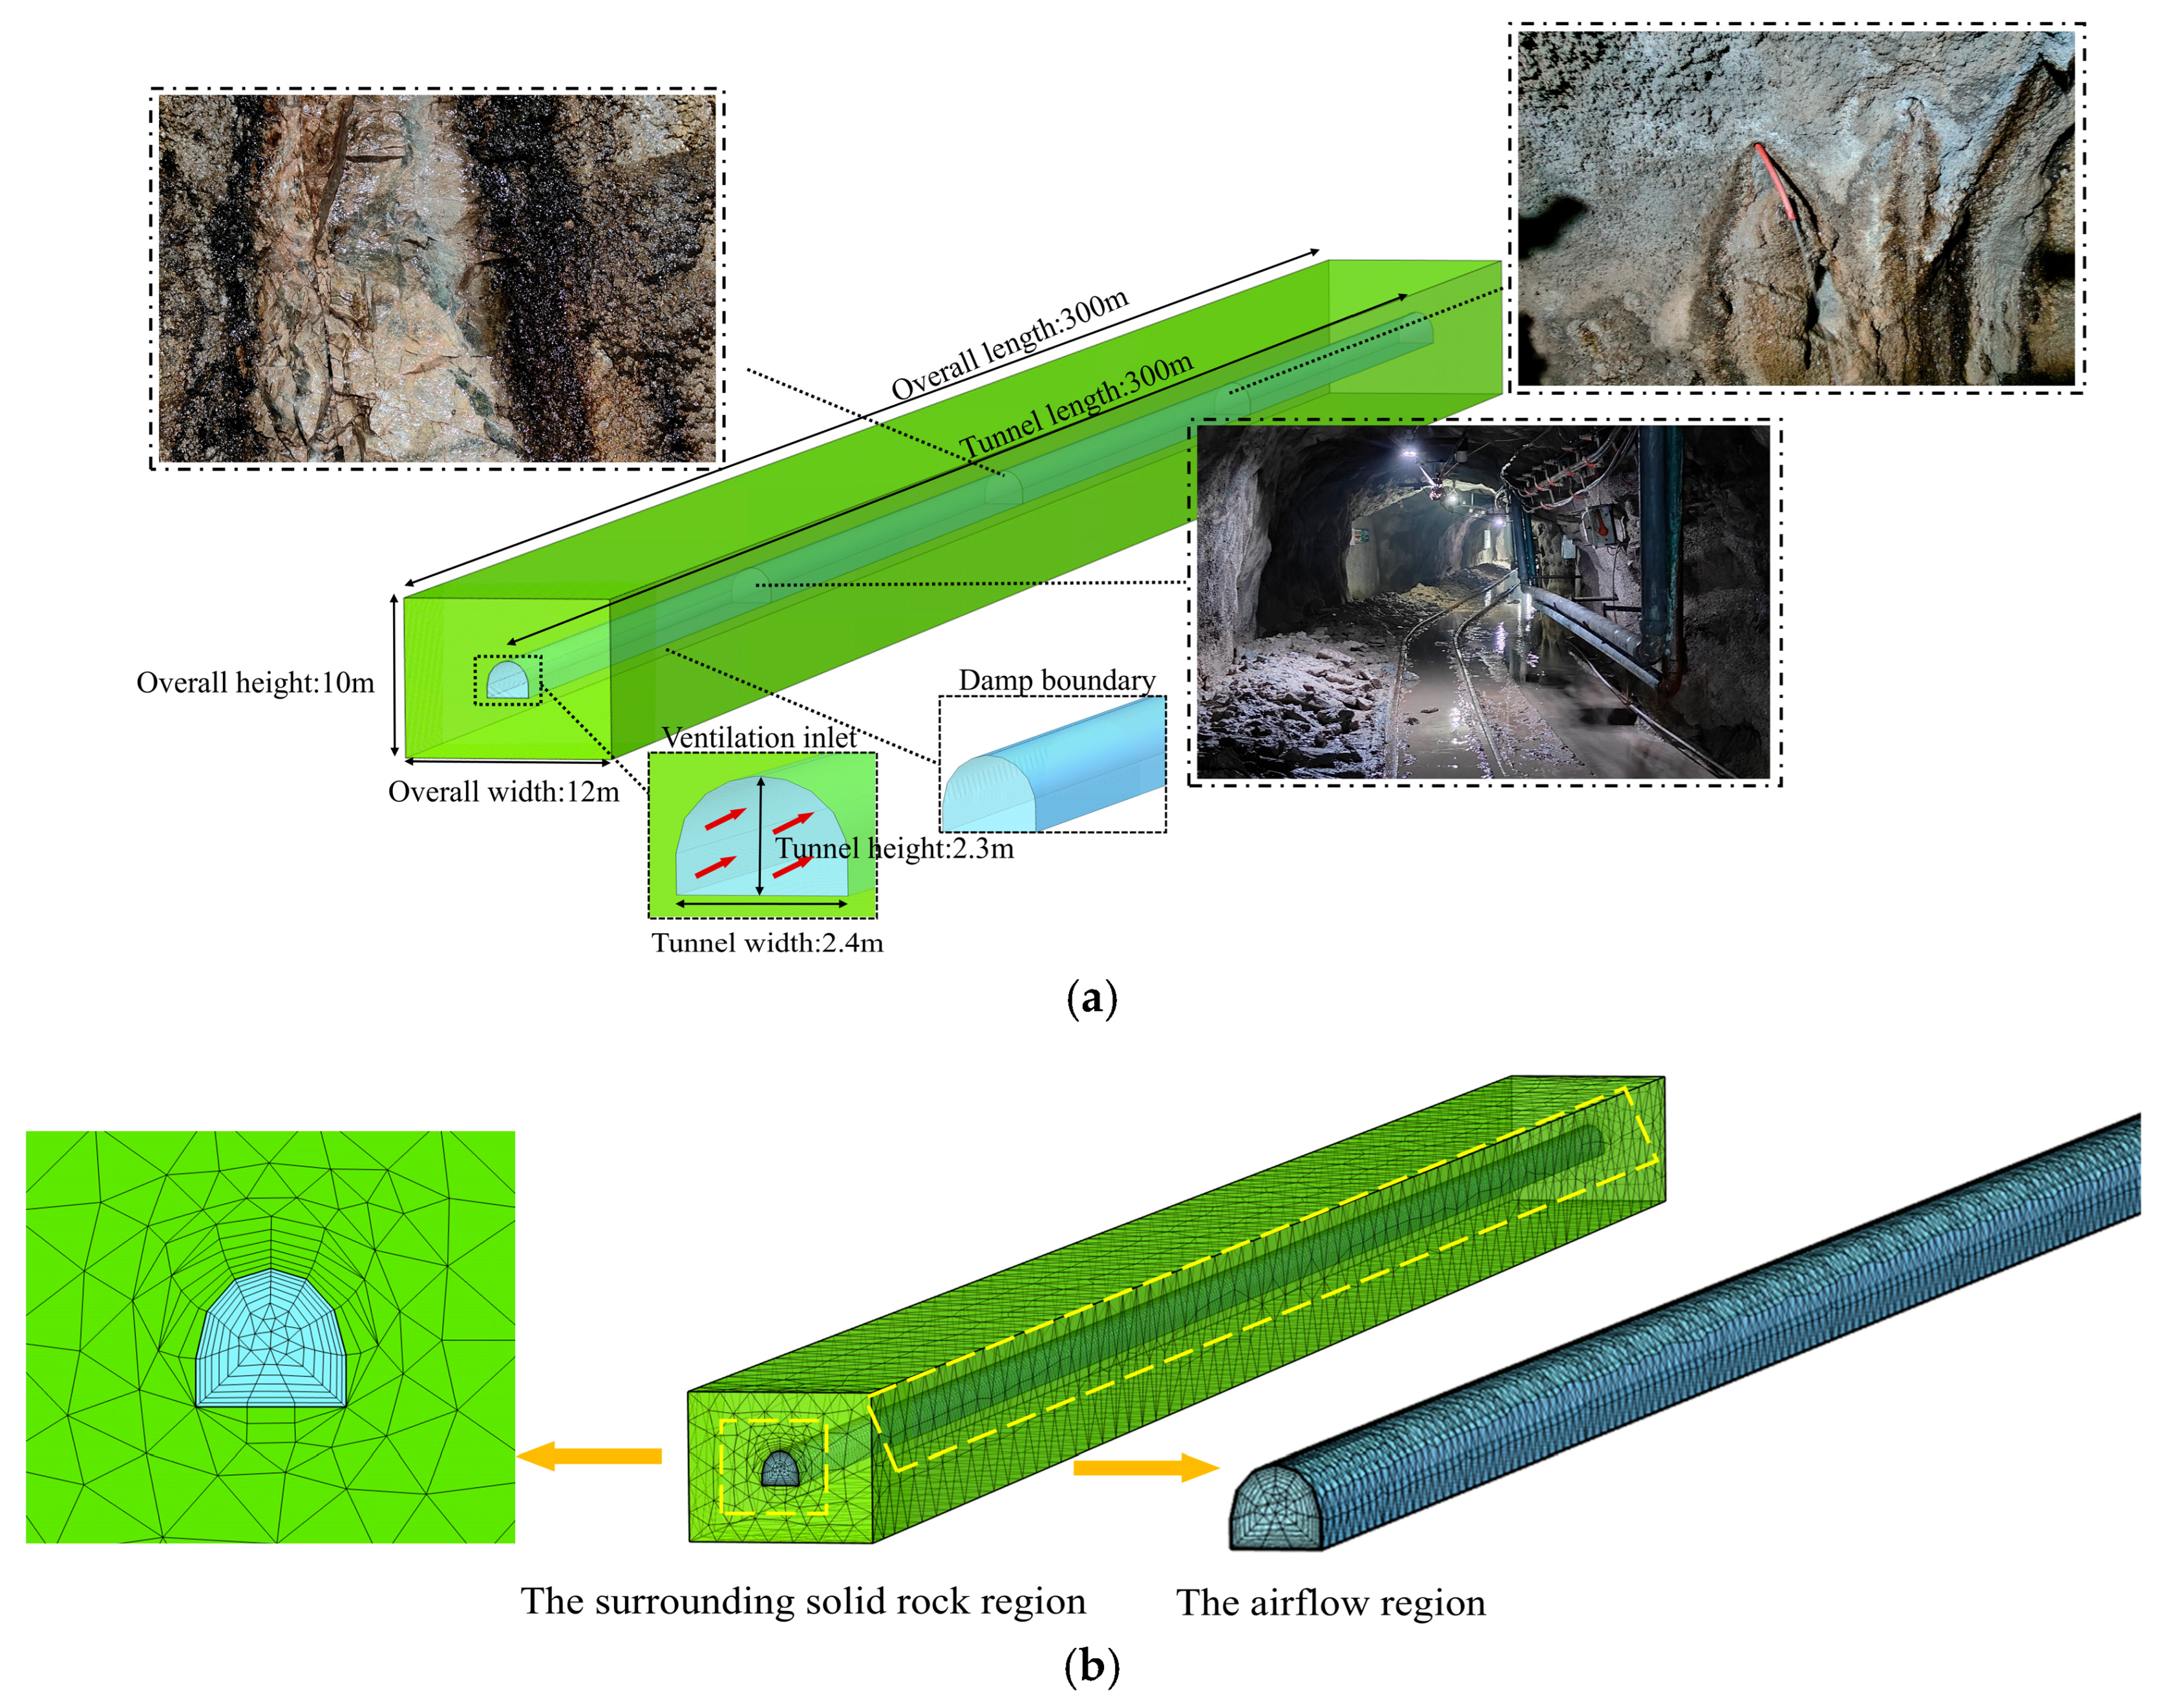
A three-dimensional, full-scale numerical model was developed in COMSOL Multiphysics 6.3 to simulate the coupled airflow, heat-transfer, and moisture transfer processes in the intake tunnel. The geometric configuration was established according to the actual tunnel geometry and field conditions, with the corresponding field photograph shown in
Figure 2a. The tunnel has an arched cross-section with a width of 2.4 m, a straight-wall height of 1.1 m, an arch rise of 1.2 m, a total height of 2.3 m, and a length of 300 m. As illustrated in
Figure 2b, the computational domain consists of two main regions: the surrounding solid rock region and the airflow region. The airflow region represents the internal space through which the ventilation air flows. The surrounding solid rock region encloses the airflow region and accounts for heat storage and conduction within the rock mass. To minimize the influence of the external boundaries on heat conduction, the surrounding solid rock region extends 12 m horizontally and 10 m vertically from the tunnel boundary, thereby improving the reliability of the calculated thermal field.
The model was established following a sequential procedure. First, the surrounding solid rock region and airflow region were constructed and treated as homogeneous and isotropic continua with constant physical properties. Ventilation air was prescribed to enter the tunnel at a specified velocity and flow toward the outlet. Next, the interface between the two regions was defined as a coupled heat- and moisture-transfer boundary, accounting for convective heat transfer, wall evaporation, moisture transport, and latent-heat exchange. The Turbulent Flow (k–ε), Moisture Transport in Air, and Heat Transfer in Moist Air interfaces were then implemented. A segregated solution strategy was adopted to improve numerical stability. The turbulent airflow field was first solved under steady-state conditions, and the converged flow field was subsequently used for the transient heat and moisture transfer calculation. During the transient calculation, the coupled variables were solved sequentially and iteratively updated between the segregated solution groups. A relative tolerance of 0.01 was specified as the convergence criterion, and each solution step was considered converged only when the residuals of all segregated solution groups satisfied the prescribed tolerance.
The total transient simulation duration was set to 40 h, with two temporal resolutions adopted to account for the different evolution stages of the temperature and humidity fields. During the first 5 h of ventilation, a relatively small time step of 3 min was used because the thermal and moisture conditions undergo a rapid transient adjustment. In this stage, the temperature difference between the airflow and tunnel wall, wall evaporation, and humidity distribution vary markedly; therefore, a finer temporal resolution is required to capture the short-term evolution of the coupled heat and moisture transfer processes. After approximately 5 h, the variations in temperature and humidity gradually weaken, and the heat and moisture exchange between the airflow region and the surrounding solid rock region approaches a quasi-steady state. Accordingly, the time step was increased to 1 h for the remaining simulation period. Since the variations between adjacent time levels are relatively small during this stage, the larger time step reduces the computational cost while maintaining sufficient temporal resolution to describe the long-term evolution of the thermal and humidity fields.
Since a damp boundary condition is applied to tunnel walls in the model, the surface is assumed to be covered by a continuous liquid water film. Under airflow conditions, continuous mass exchange of water vapor occurs between the liquid film and surrounding air. The surface evaporation flux under airflow conditions is determined using Equation (9) [
33].
where
represents the wall moisture factor, a larger
indicates a wetter wall surface and greater evaporation potential, with
corresponding to a fully saturated wall condition.
is the relative surface roughness,
is the saturated concentration,
is the vapor concentration,
is the molar mass of water vapor, and
is the mass transfer coefficient, which determines the velocity of the mass transfer process and is controlled by the ventilation velocity. It is defined as:
The mass transfer coefficient
is calculated using the empirical correlation adopted from Yu et al. [
50] This velocity-based correlation is applicable to turbulent forced-convection air humidification and accounts for the enhanced wall-to-air moisture transfer at higher airflow velocities. Therefore, it is considered suitable for estimating the evaporation rate from the tunnel wall in the present study.
When moisture evaporates from the surface of the surrounding rocks, it absorbs latent heat from the outside. The heat flux absorbed during evaporation depends on the evaporation rate and can be defined as:
where
is the latent heat of the vaporization of water.
There will also be heat convection between airflow and the wall surface. This heat flux can be described as:
where
represents the convective heat transfer coefficient, while
and
are the air temperature and the temperature of the surrounding rocks, respectively, and they are the thermal conductivity values. In this study, the convective heat transfer coefficient is calculated using the thermal wall function, as detailed in [
47]:
The temperature of the outer surface of the rock is set to a constant value of
°C. The outer boundary of the rock is defined as thermally insulated, with zero heat flux, and the initial temperature of the rock is assumed to be equal to this boundary temperature. The tunnel outlet is specified as an open boundary, where a reference pressure of 0 Pa is imposed. The initial velocity of airflow along the tunnel is set to 1 m/s, while the initial temperature of airflow is
°C, applied uniformly throughout the model. The remaining parameters of the model are shown in
Table 1.
2.4. Grid Independence Analysis and Model Validation
2.4.1. Grid Independence Analysis
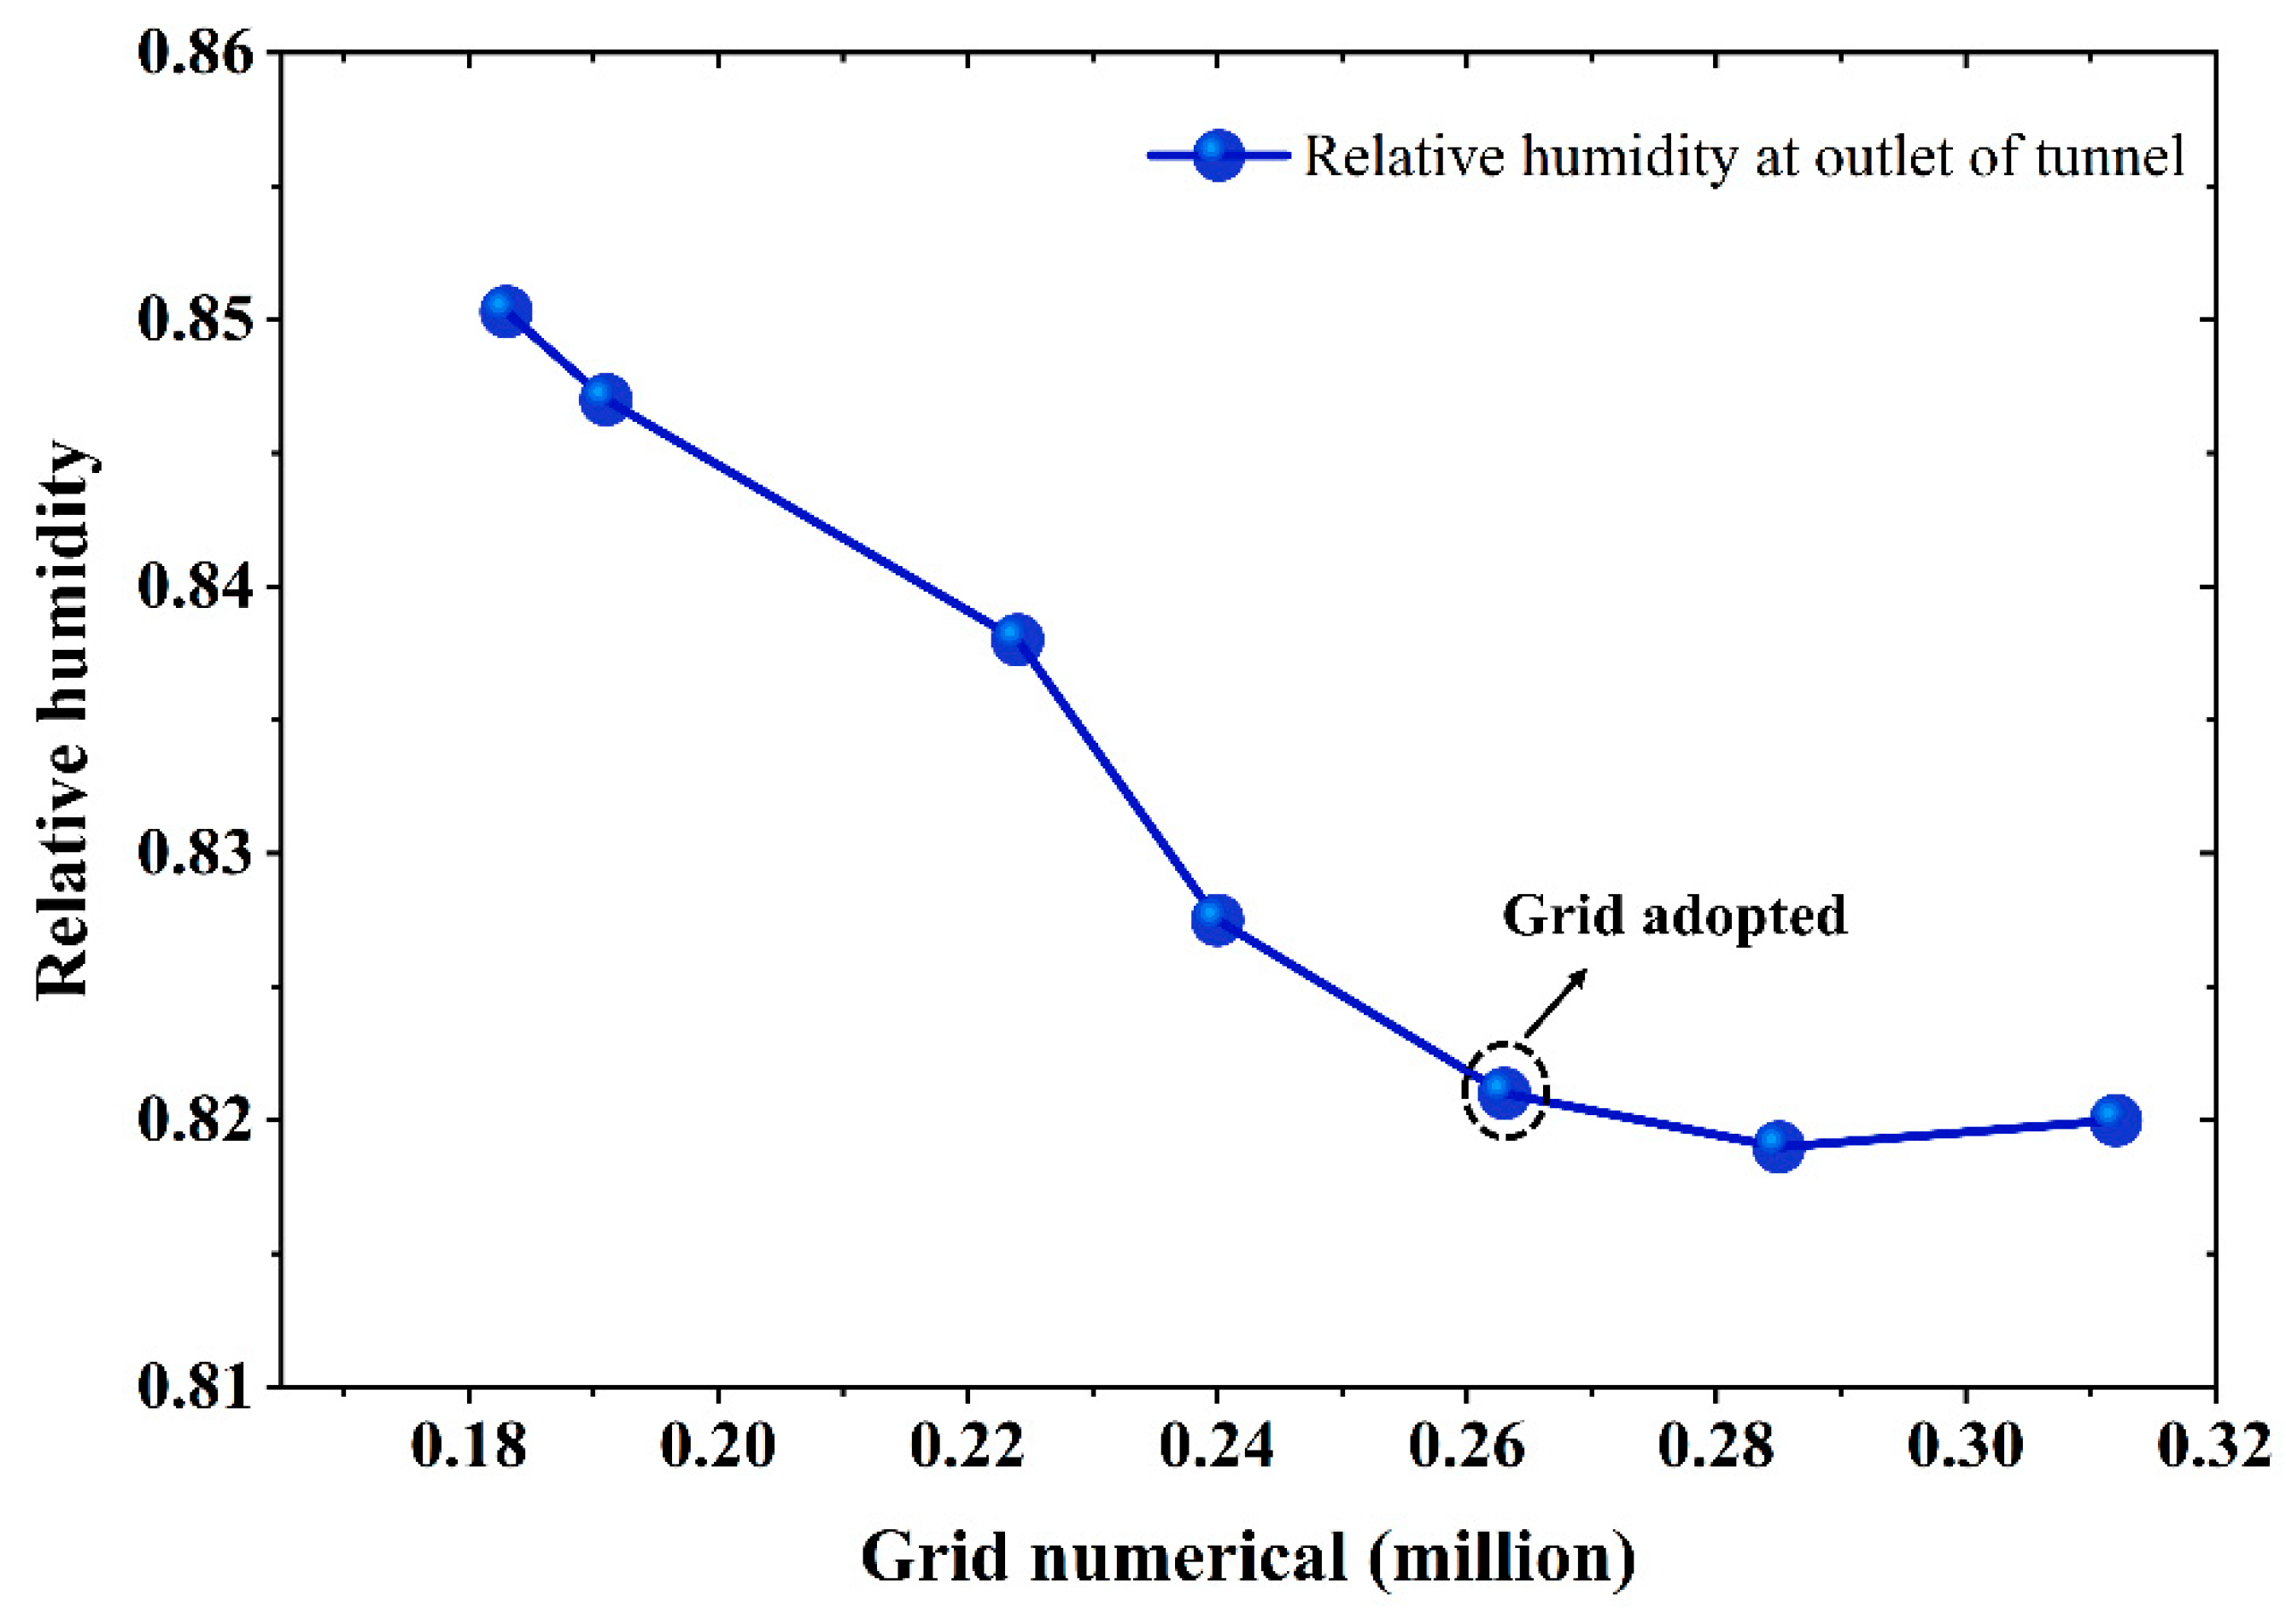
To improve calculation accuracy and efficiency, local mesh refinement was applied in critical regions of the physical model. In the vicinity of the humid wall surface, intense heat and mass transfer occur between airflow, surrounding rock, and the liquid water adhering to the rock surface. Accordingly, a refined boundary layer mesh was applied at the airflow–rock interface (
Figure 2b) to enhance numerical convergence and computational accuracy, and a grid independence study was conducted to verify mesh quality. The initial conditions used for the grid independence study are listed in
Table 2. The basic parameters are consistent with those in
Table 1, with additional details provided in
Section 2.3. The results are presented in
Figure 3, indicating that the predicted relative air humidity stabilizes as the number of mesh elements increases. Considering both computational cost and accuracy, a mesh consisting of 2.6 × 10
5 elements was selected.
2.4.2. Model Validation
Zhao et al. [
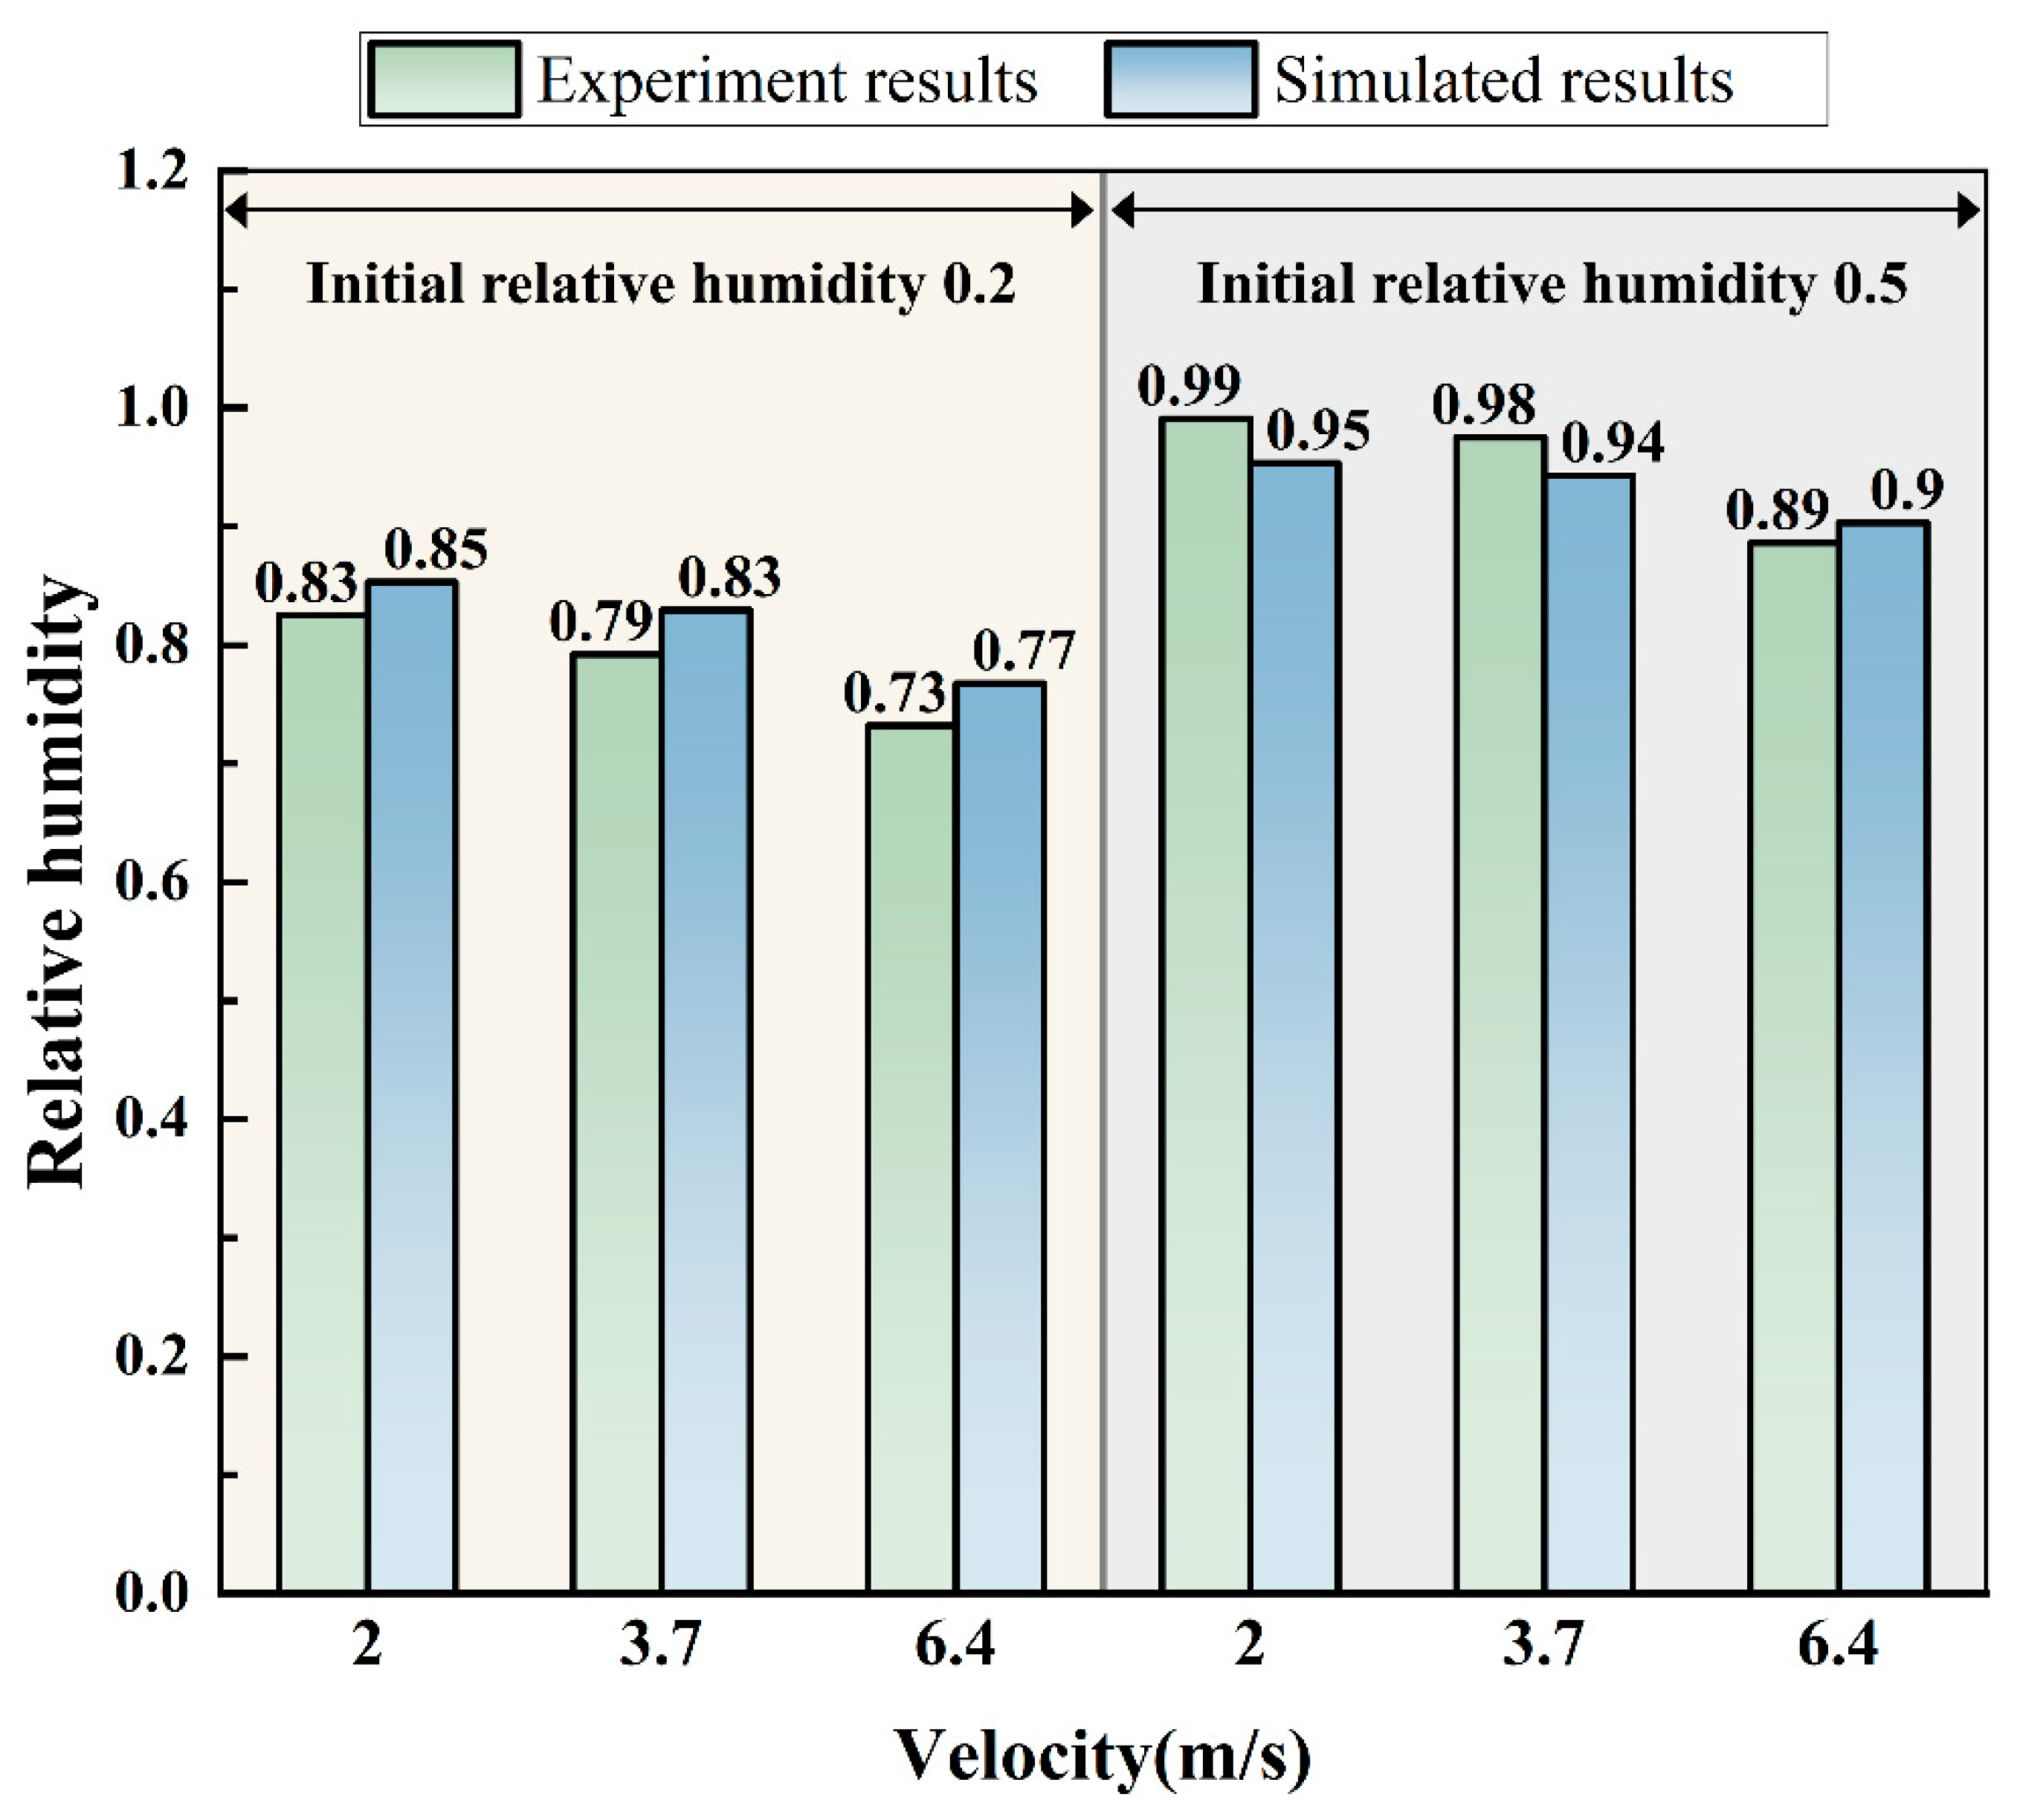
51] constructed a similar experimental simulation platform to analyze the heat and moisture transfer process in a roadway with moisture present. They measured the relative humidity of airflow at the outlet under different operational conditions. The data used to verify the model in this study were sourced from their research. Six sets of experimental results under typical working conditions were selected, and the model’s initial conditions were aligned with these conditions, as shown in
Table 3. All other model parameters and boundary conditions were kept consistent with those specified in
Section 2.3. The relative humidity values of airflow at the outlet, obtained from the simulation, were compared with experimental measurements. As shown in
Figure 4, the numerical simulation results are in good agreement with Zhao’s experimental data. The deviations between calculated and measured values for each working condition are all less than 5%. These deviations may arise from the non-uniform distribution of moisture on the wall surface during the experiments, as well as from inherent measurement system errors. Therefore, the developed model is capable of accurately predicting heat and moisture transfer processes in a roadway with a humid wall surface.
3. Results and Discussion
3.1. Spatiotemporal Characteristics of Humidity Distribution
In this study, the heat- and moisture-transfer characteristics of the humid tunnel were systematically investigated based on the established numerical model. The analysis focused on the evolution of the thermal and humidity fields and the effects of the main influencing parameters under continuous ventilation. The selected parameters and their ranges were determined according to the field conditions and practical ventilation requirements, and the resulting numerical data were further used to quantify the development of condensation and fogging.
3.1.1. Spatial Distribution of Heat and Mass Transfer Behavior
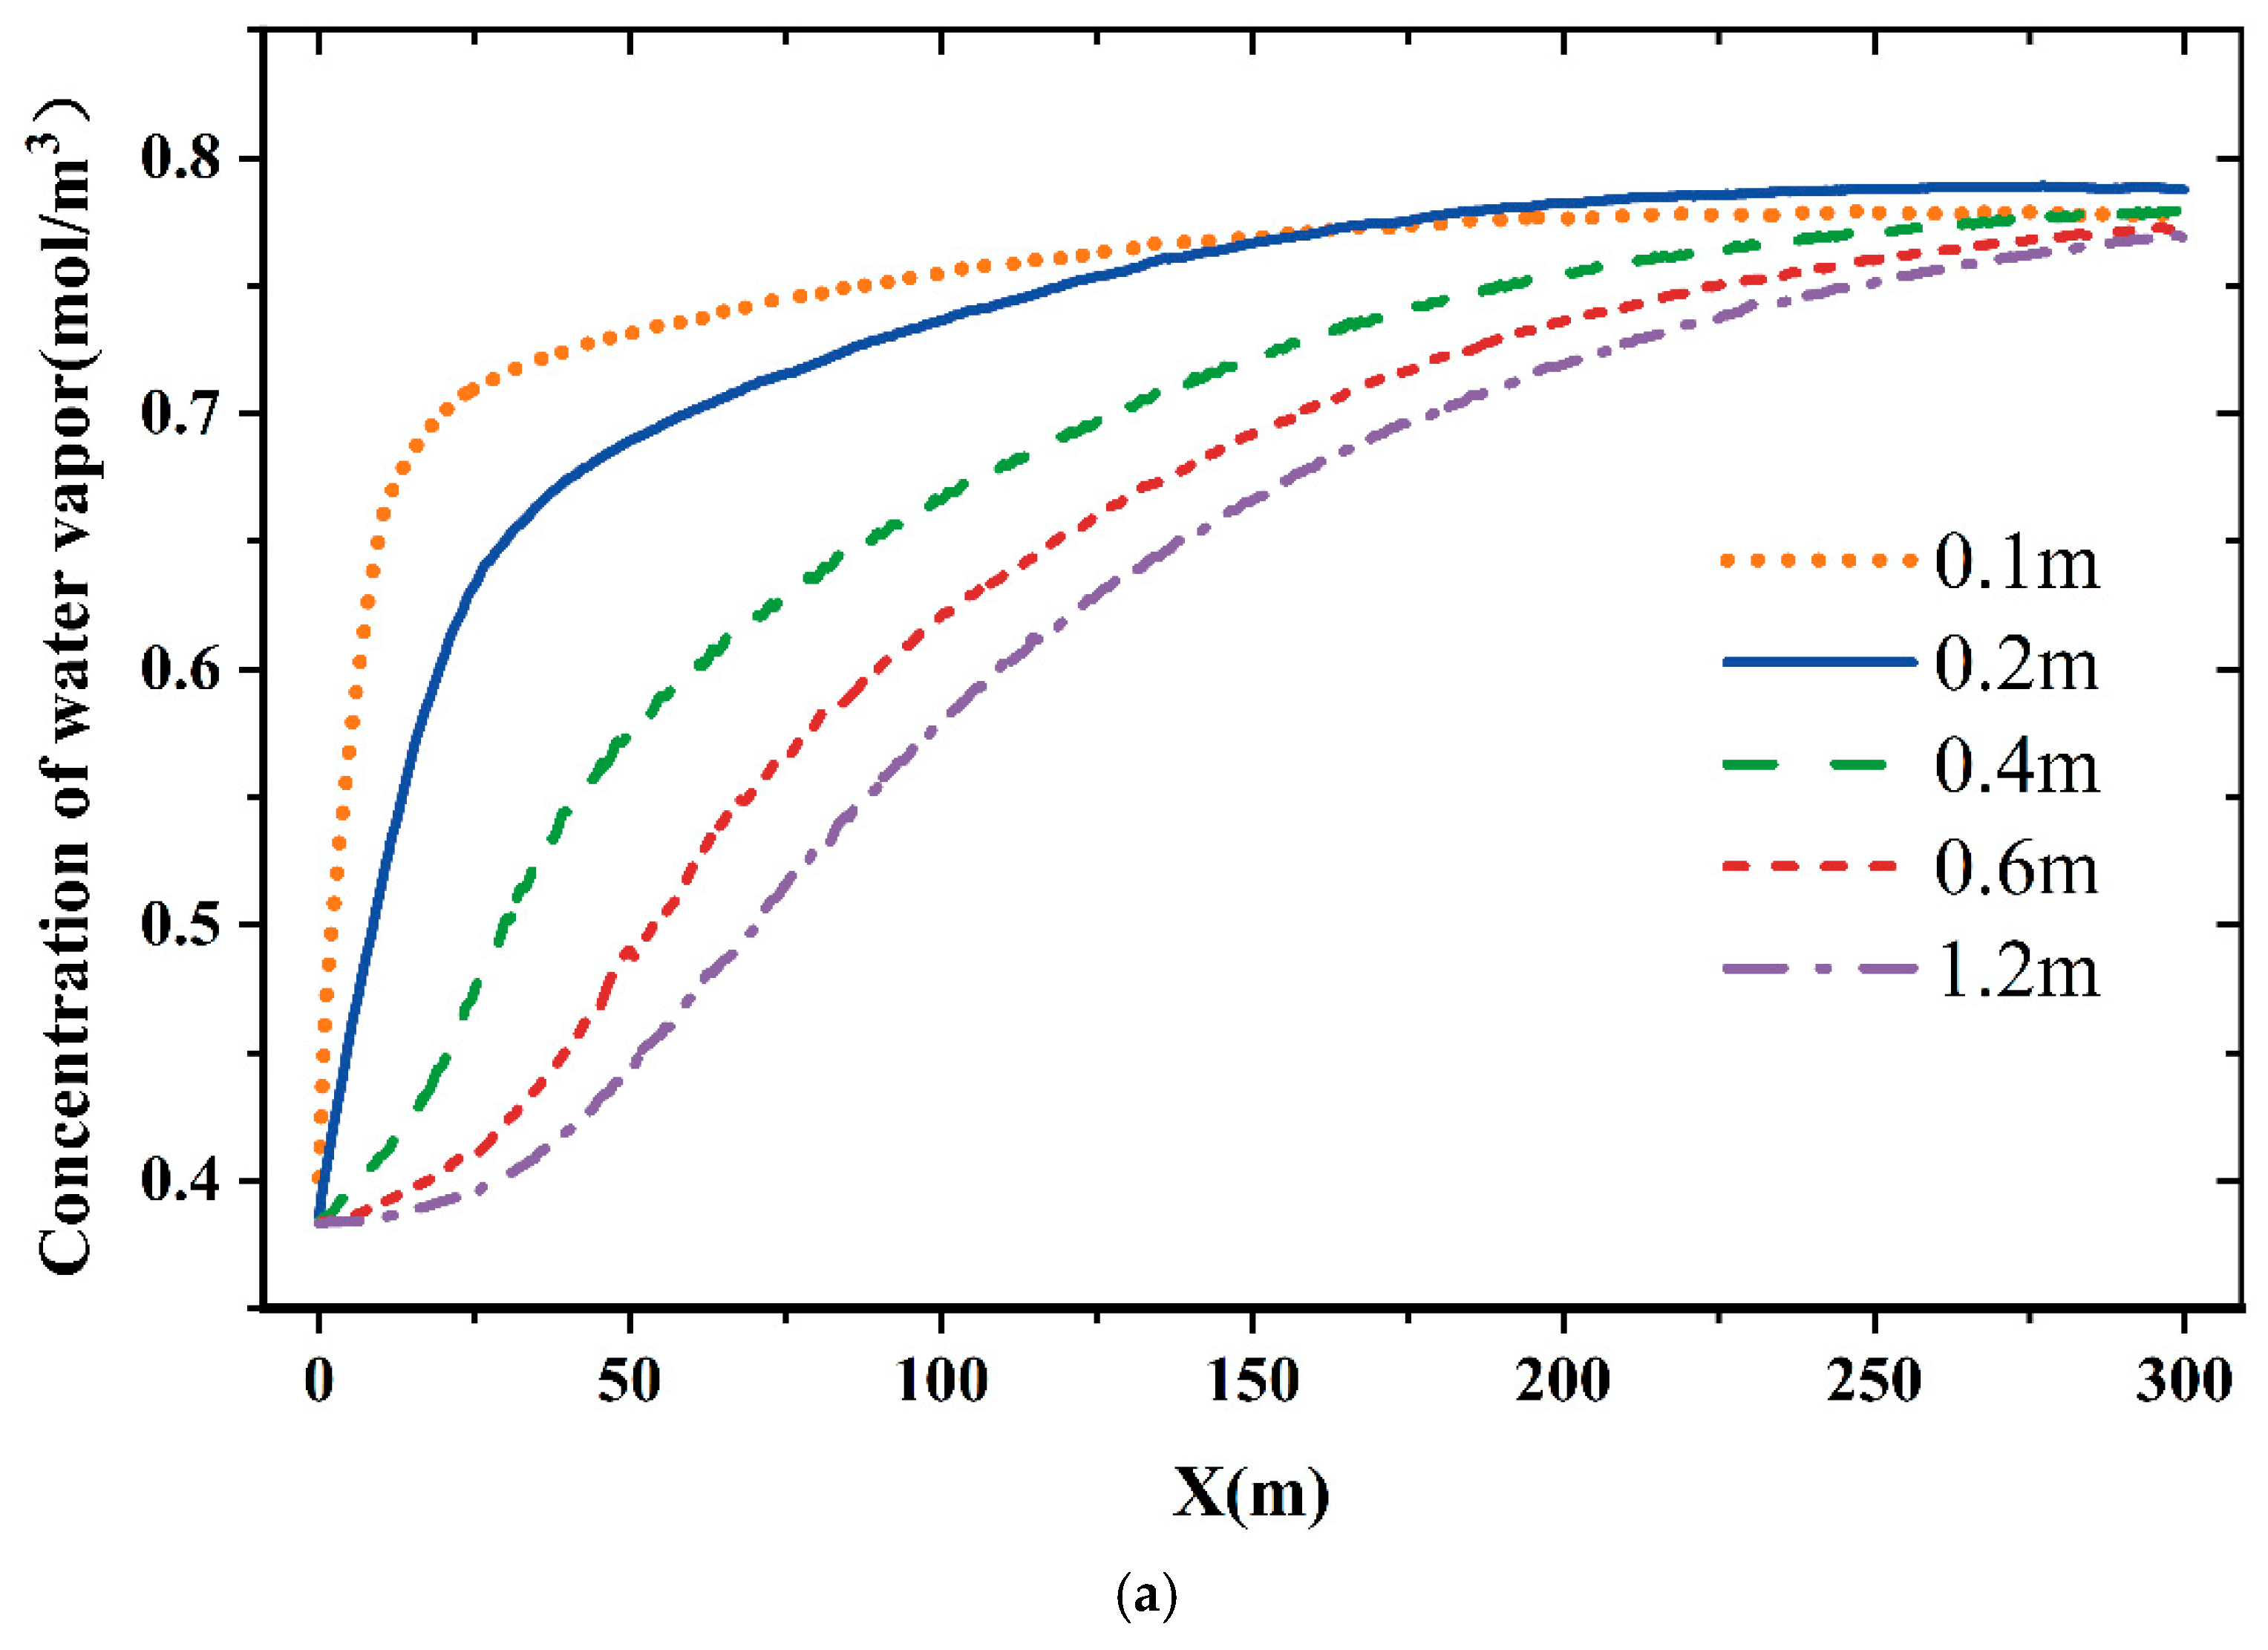
Figure 5a illustrates variation in water vapor concentration along the ventilation distance at different wall distances, after the temperature and humidity fields approach a quasi-steady state following 24 h of ventilation. The distribution of water vapor concentration along the ventilation distance exhibits a pattern of rapid initial increase, followed by stabilization. In the entrance section of the tunnel (0–50 m), a strong humidity gradient exists between the near-wall airflow and the saturated wall surface, which drives intensive evaporation from the moist wall into the moving airflow. It results in the water vapor concentration near the wall (d = 0.1 m) increasing sharply in this region. As airflow absorbs moisture along its path, water vapor concentration gradually approaches a near-saturation state, after which the rate of increase diminishes and eventually stabilizes toward the outlet. At the tunnel outlet, the water vapor concentration at each monitoring location converges to approximately 0.786 mol/m
3. It indicates the development of a fully developed mass transfer regime where axial gradients become negligible. Upon analyzing the lateral distribution of water vapor concentration at a given ventilation distance, the concentration increases more significantly as one approaches the wall boundary in the inlet area. At the center of the roadway (d = 1.2 m), the concentration is the lowest across the entire cross-section. This occurs due to the time lag in the diffusion process of water vapor from the wall surface to the central area. Furthermore, under the influence of the flow field, the airflow moves at high speed along the axial direction, and the limited lateral mixing time hinders the achievement of complete diffusion balance in the inlet section. As the ventilation distance increases, enhanced cumulative mixing gradually reduces radial concentration gradients. The flow eventually reaches a fully developed state near the outlet, where the water vapor concentration becomes nearly uniform across the cross-section.
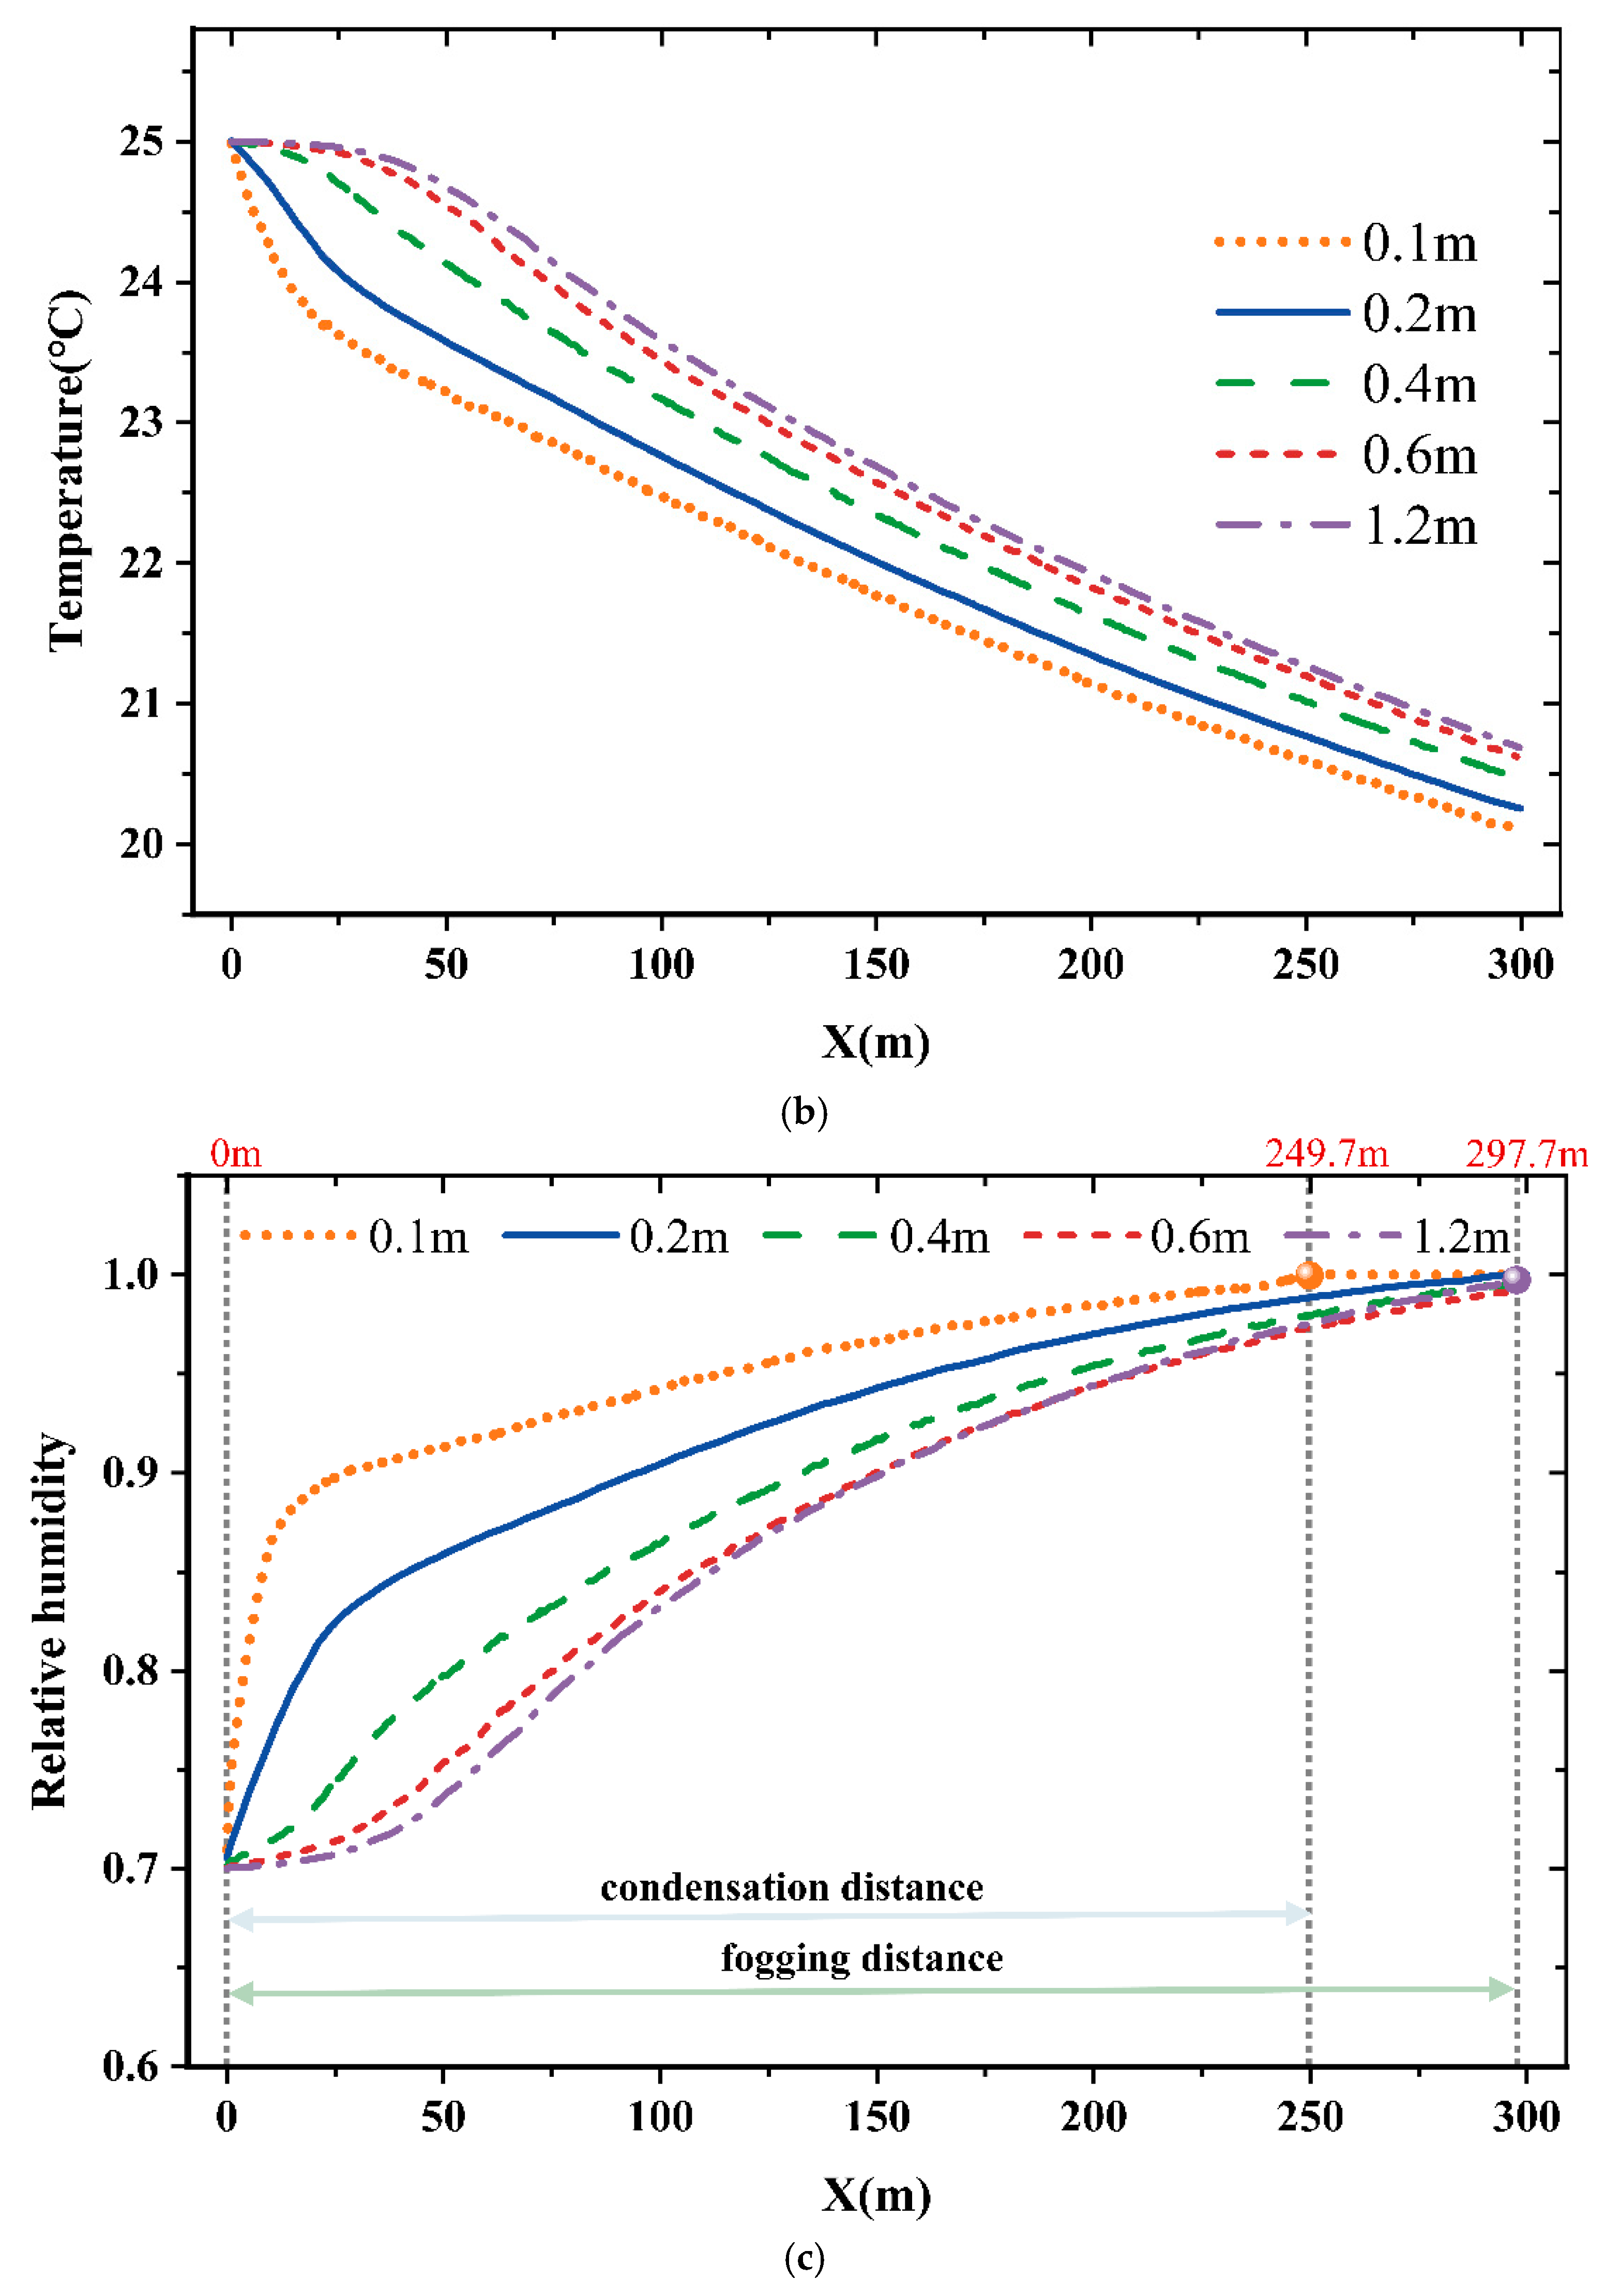
Figure 5b illustrates the variation in airflow temperature along the ventilation distance. A comparison with the distribution characteristics of water vapor concentration in
Figure 5a reveals that the two exhibit opposite trends. In the entrance region of the tunnel, the near-wall airflow (d = 0.1 m) temperature decreases rapidly from the initial value of 25 °C; meanwhile, the rate of temperature reduction gradually diminishes with increasing ventilation distance, eventually reaching approximately 20 °C at the outlet. From the perspective of lateral distribution, the near-wall region consistently exhibits lower temperatures compared with the central flow region along the entire tunnel length. This behavior can be attributed to two coupled mechanisms: air in the boundary layer directly contacts the cooler wall surface and, through convective heat transfer, continuously releases heat to the surrounding rock; and the water evaporation process on the wall surface absorbs a significant amount of latent heat from vaporization, further reducing the temperature of airflow near wall.
The decrease in airflow temperature leads to a decrease in saturated vapor pressure, thereby lowering the relative humidity of the airflow. Therefore, the spatial distribution of relative humidity in airflow is jointly influenced by spatial distributions of temperature and water vapor concentration, as shown in
Figure 5c. At a position 249.7 m from the inlet, the near-wall airflow first reaches saturation, causing the moisture transfer process to transition from the dry cold stage to the dew condensation stage, with water beginning to condense. This position is defined as the “condensation distance.” At a position 297.7 m from the inlet, airflow at the tunnel’s center axis also reaches saturation in terms of moisture transfer, entering the fog condensation stage, where fog is generated due to the action of condensation nuclei. This position is defined as the “fogging distance.” The magnitudes of the condensation distance and fogging distance serve as key indicators for evaluating the high-humidity risk in tunnels.
A further comparison of spatial distributions of water vapor concentration, airflow temperature, and relative humidity reveals that in the entrance region of the tunnel, the rapid increase in relative humidity is driven by simultaneous moisture absorption and heat exchange processes. Beyond approximately 150 m from the inlet, the water vapor concentration stabilizes, but airflow temperature has not yet reached thermal equilibrium with surrounding rock. The continuous decrease in temperature becomes the dominant factor driving the further increase in relative humidity.
3.1.2. Temporal Distribution of Heat and Mass Transfer Behavior
As shown in
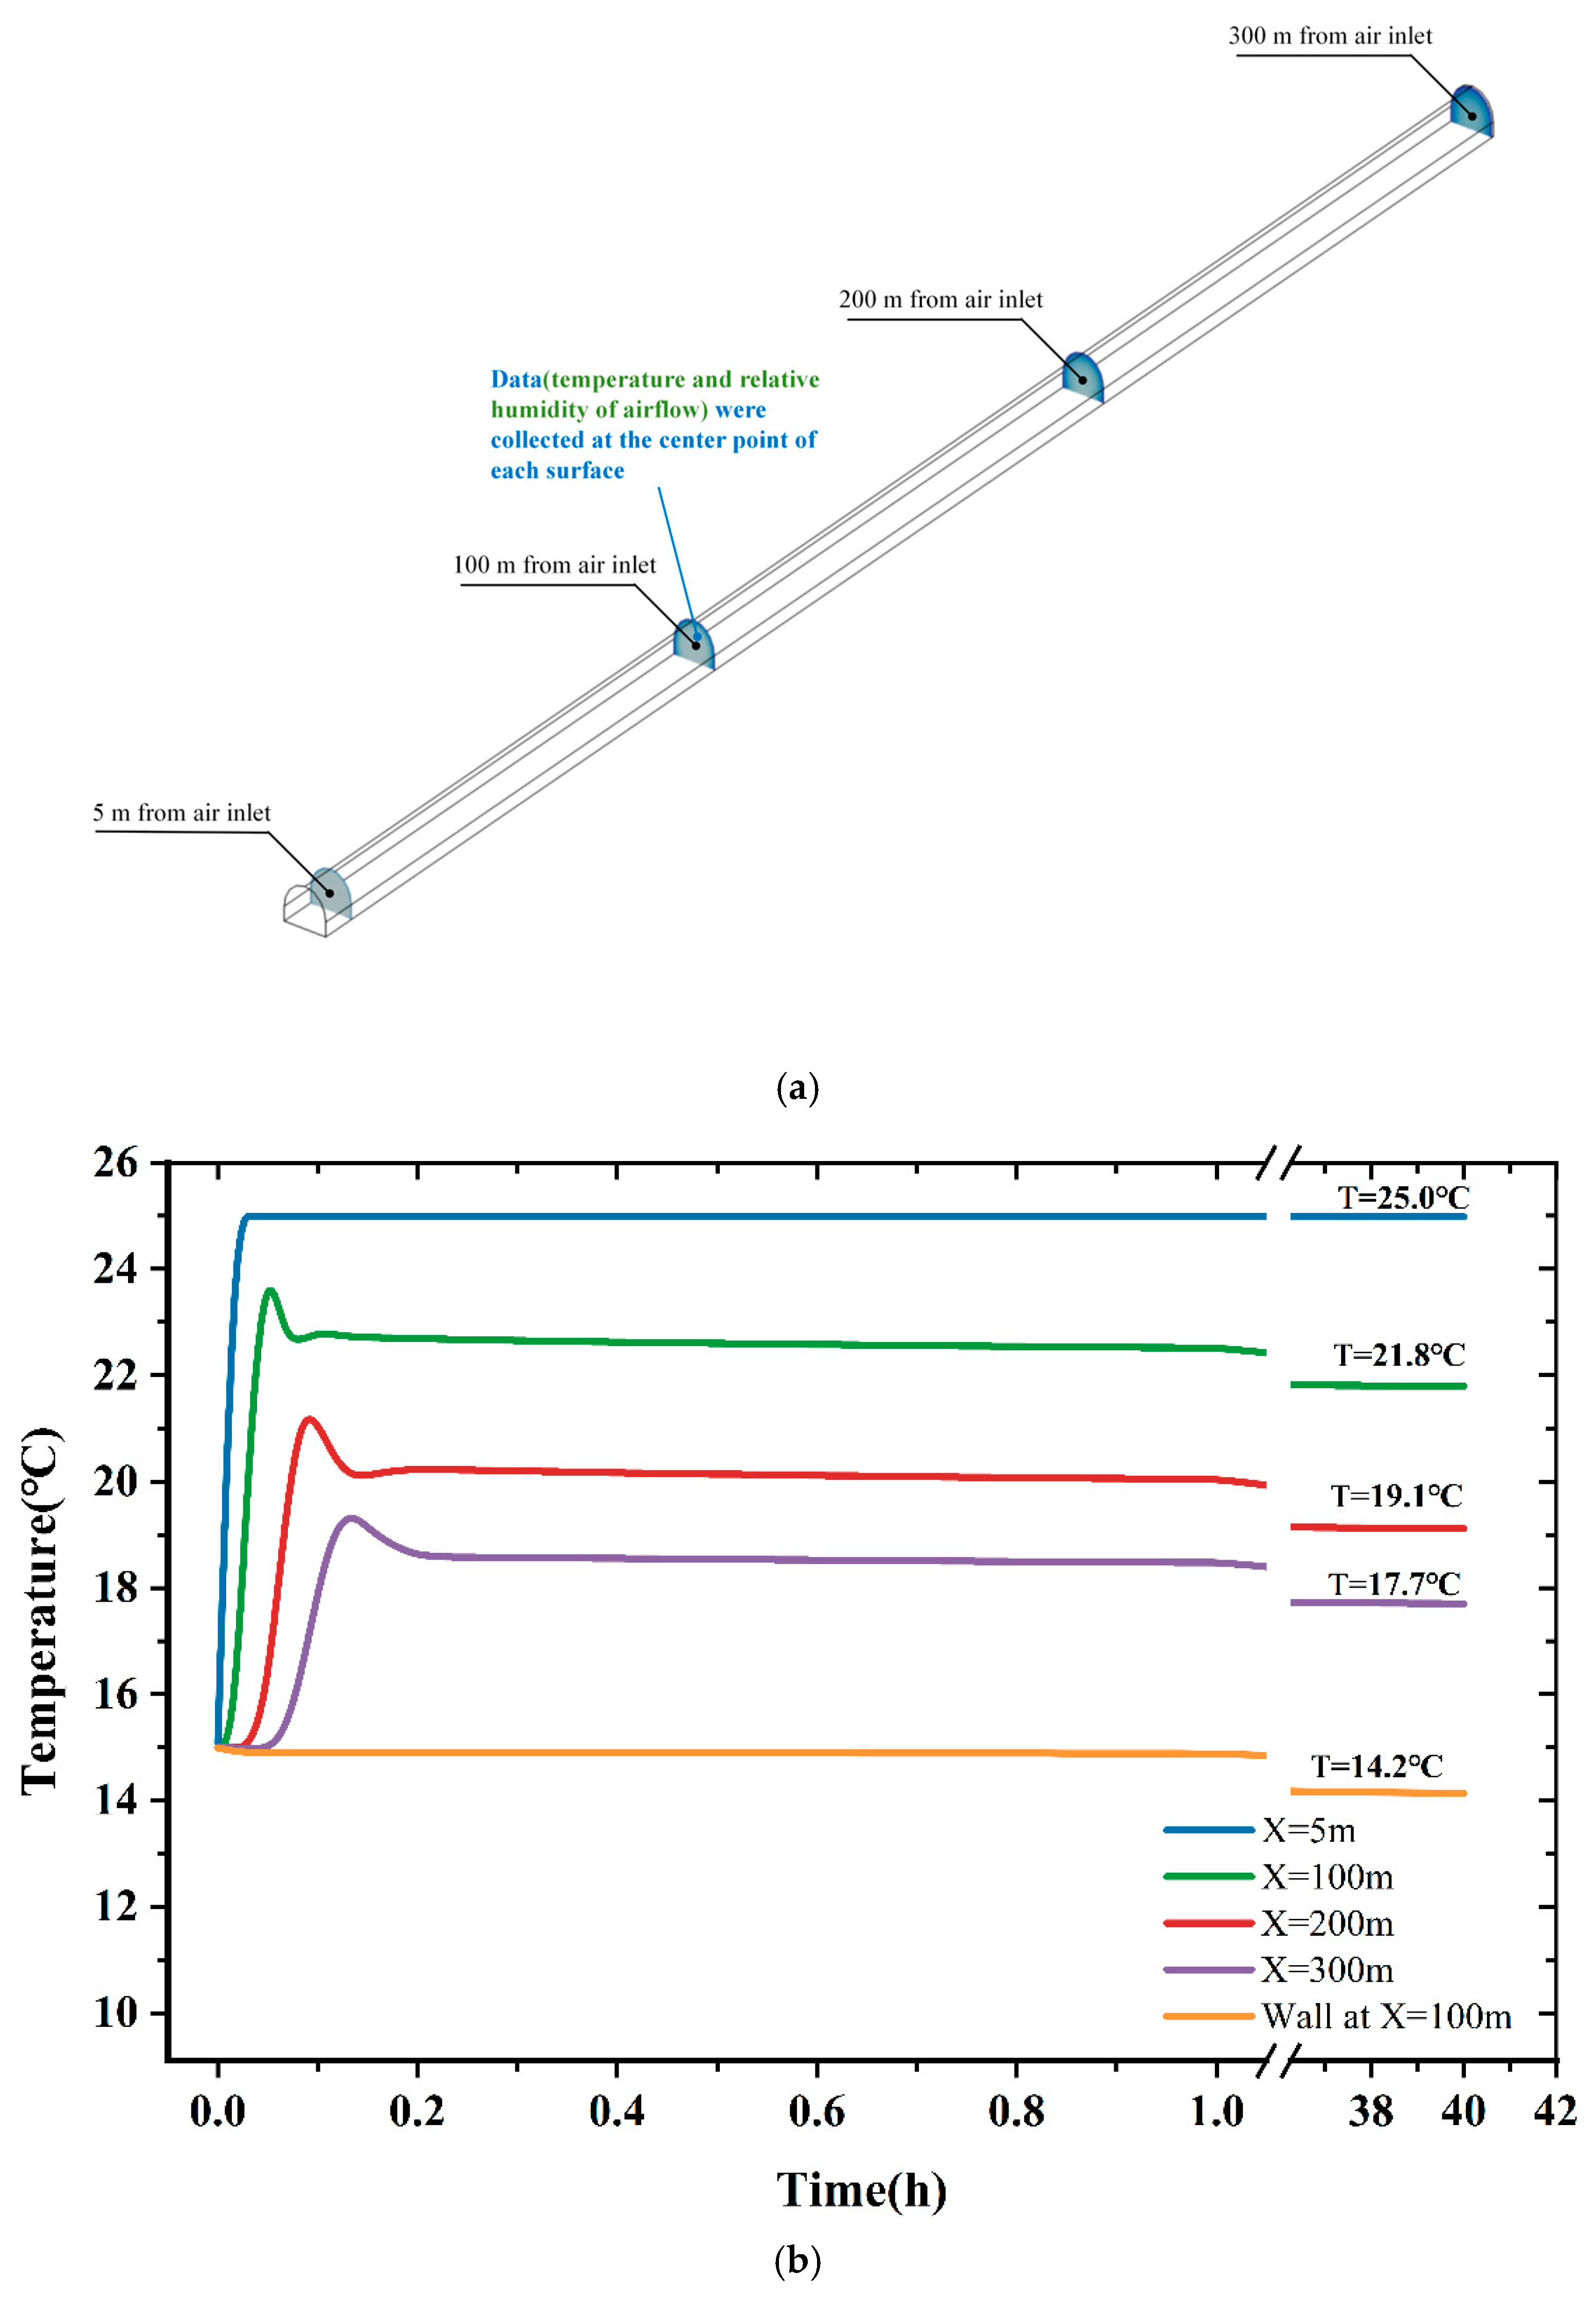
Figure 6a, four cross-sections located 5, 100, 200, and 300 m from the air inlet were selected, and the center point of each cross-section was used to extract the airflow temperature and relative humidity. The corresponding temperature variations are presented in
Figure 6b. At each monitoring point, the airflow temperature rises rapidly when the ventilation airflow first reaches the corresponding position and then gradually decreases with increasing ventilation time. Meanwhile, the tunnel-wall temperature also decreases during the ventilation process. At 100 m, for example, the wall temperature decreases to 14.2 °C after 40 h, approximately 0.8 °C below the initial surrounding rock temperature. Although sensible heat is transferred from the airflow to the surrounding rock, evaporation from the humid wall continuously consumes latent heat. When the latent heat consumption exceeds the convective heat input, the wall temperature decreases, which in turn contributes to the gradual reduction in airflow temperature.
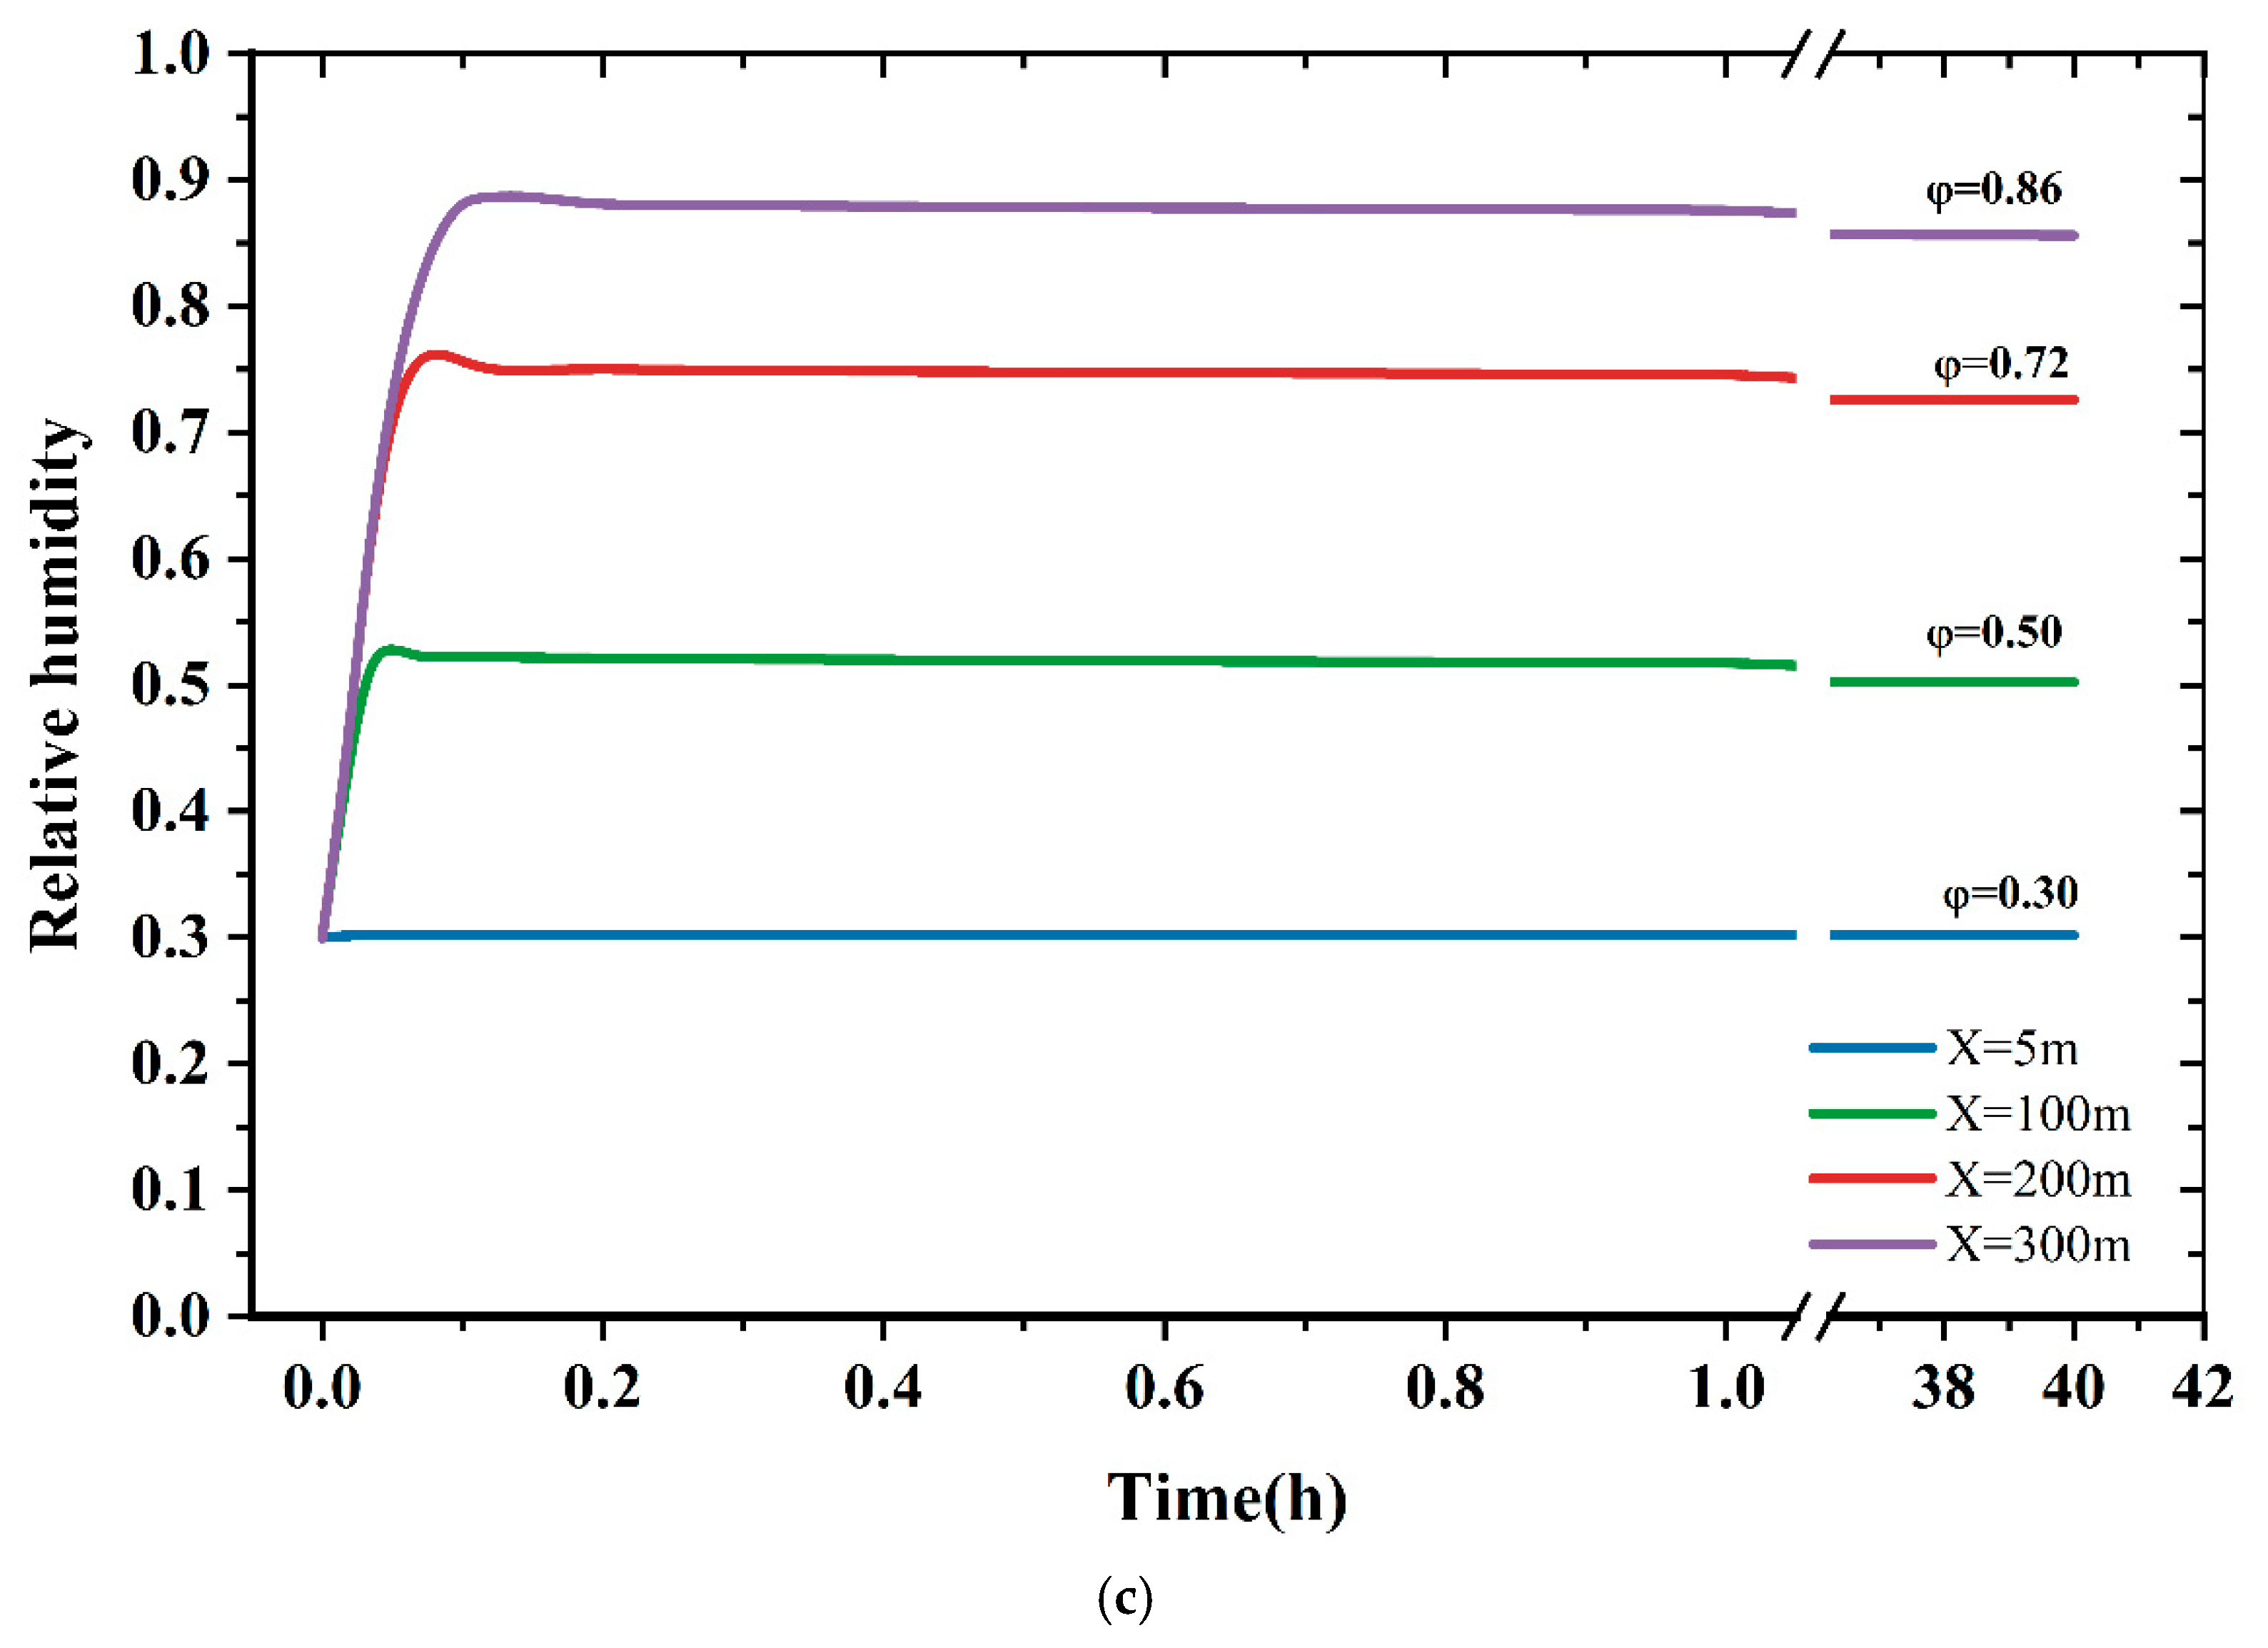
The evolution of relative humidity is shown in
Figure 6c. After the airflow reaches each monitoring location, the relative humidity increases rapidly and then gradually approaches a stable value. At the outlet, the relative humidity rises to approximately 0.86 and subsequently remains nearly constant. Because the tunnel is continuously ventilated, the local moisture level is jointly controlled by water-vapor supply from wall evaporation and axial moisture transport by the airflow. As ventilation proceeds, these processes gradually reach a dynamic balance, resulting in a stable humidity distribution along the tunnel. The stabilized relative humidity values at 5, 100, 200, and 300 m are approximately 0.30, 0.50, 0.73, and 0.86, respectively.
3.2. Sensitivity Analysis
In the ventilation system of a humid tunnel, heat and moisture transfer processes are influenced by multiple factors. To elucidate the mechanisms by which these factors influence the evolution of airflow’s thermal and moisture environment, four key sensitive parameters were selected for analysis: the initial temperature difference between airflow and surrounding rock, wall surface humidity, the initial relative humidity of airflow, and ventilation velocity. All subsequent analyses were performed using the COMSOL model described above following a single-factor approach. Specifically, only one parameter was varied in each simulation, while all other model parameters and boundary conditions were kept unchanged. The corresponding results were extracted from predefined monitoring points or along the centerline of the roadway. The former two reflect the intrinsic properties of the tunnel system, whereas the latter two characterize the external conditions of incoming airflow. These factors influence the wall surface evaporation rate, convective heat transfer intensity, and water vapor transport processes, thereby affecting the temporal and spatial distributions of airflow temperature and moisture content, and ultimately determining the evolution of relative humidity in the tunnel.
The following sections focus on these four sensitive factors, in conjunction with simulation results, to examine their influence characteristics and underlying mechanisms on the thermal and moisture environment of humid tunnel.
3.2.1. Influence of Initial Temperature Difference Between Airflow and Surrounding Rock
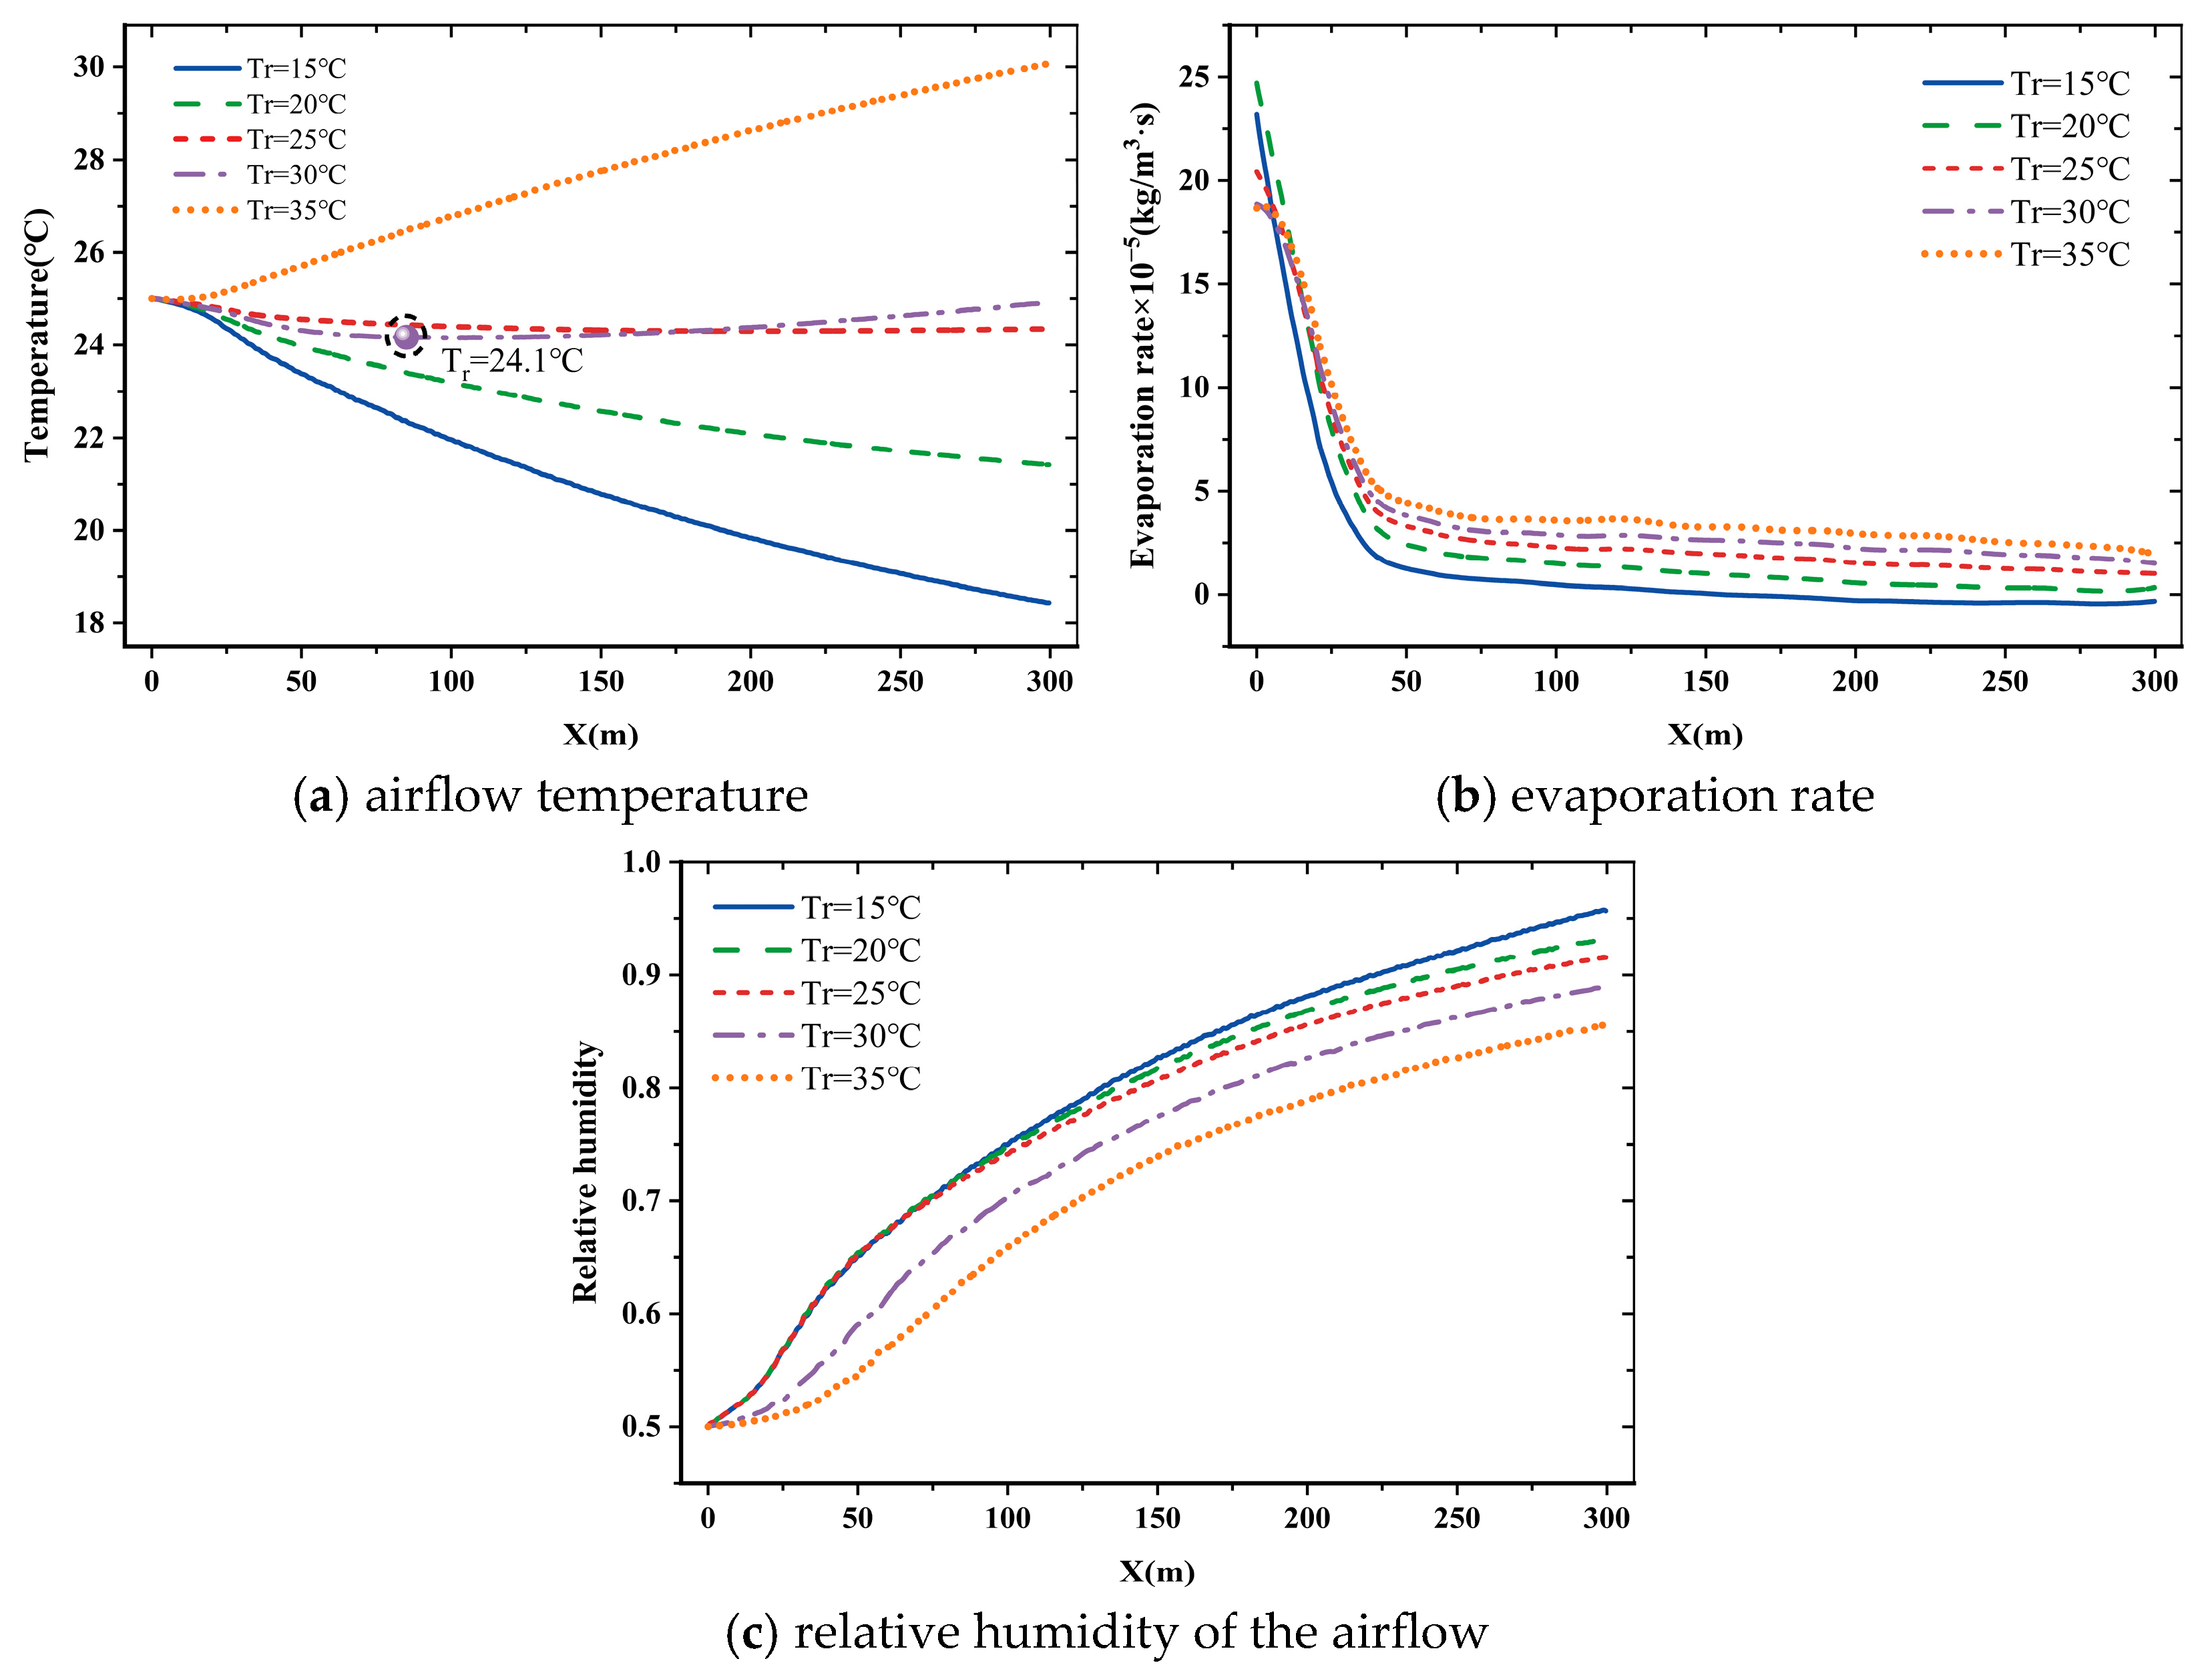
The intake air temperature is fixed at 25 °C. The initial surrounding rock temperatures are set to 15, 20, 25, 30, and 35 °C, corresponding to initial rock–air temperature differences of −10, −5, 0, 5, and 10 °C, respectively. These conditions are selected to represent the variation in surrounding rock temperature with tunnel depth.
Figure 7 shows the variations in airflow temperature, relative humidity, and wall evaporation rate along the centerline of the roadway.
As shown in
Figure 7a,b, airflow temperature exhibits a brief decreasing trend during the early stage of ventilation. In this period, substantial moisture evaporates from the wall surface, and the latent heat of evaporation dominates the local heat exchange process, absorbing significant heat and leading to a decrease in airflow temperature. With increasing ventilation distance, the evaporation rate gradually decreases, and convective heat transfer becomes the dominant mechanism. Airflow temperature gradually approaches that of surrounding rock. Under initial temperature differences of −10 °C, 0 °C, and 10 °C, the outlet air temperature changes by −6.7 °C, −0.8 °C, and +5.0 °C relative to the inlet temperature, respectively. At a temperature difference of 5 °C, the outlet air temperature decreases by 0.9 °C and reaches a minimum of 24.1 °C. Compared with the dry-tunnel assumption, wall evaporation lowers the airflow temperature by approximately 1 °C on average. This cooling effect becomes more pronounced at lower surrounding rock temperatures.
The evolution of relative humidity is shown in
Figure 7c. Lower surrounding rock temperatures lead to higher relative humidity levels in the airflow. However, the wall evaporation rate remains relatively low under low-temperature conditions, indicating that the increase in relative humidity is not driven by enhanced moisture supply but rather by the reduction in saturation vapor pressure. In such cases, even limited water vapor content can result in high relative humidity. Overall, shallow tunnels with lower surrounding rock temperatures are more susceptible to high-humidity conditions, and this tendency becomes more pronounced as the temperature difference between airflow and surrounding rock increases, particularly under summer ventilation scenarios.
3.2.2. Influence of Wall Surface Humidity
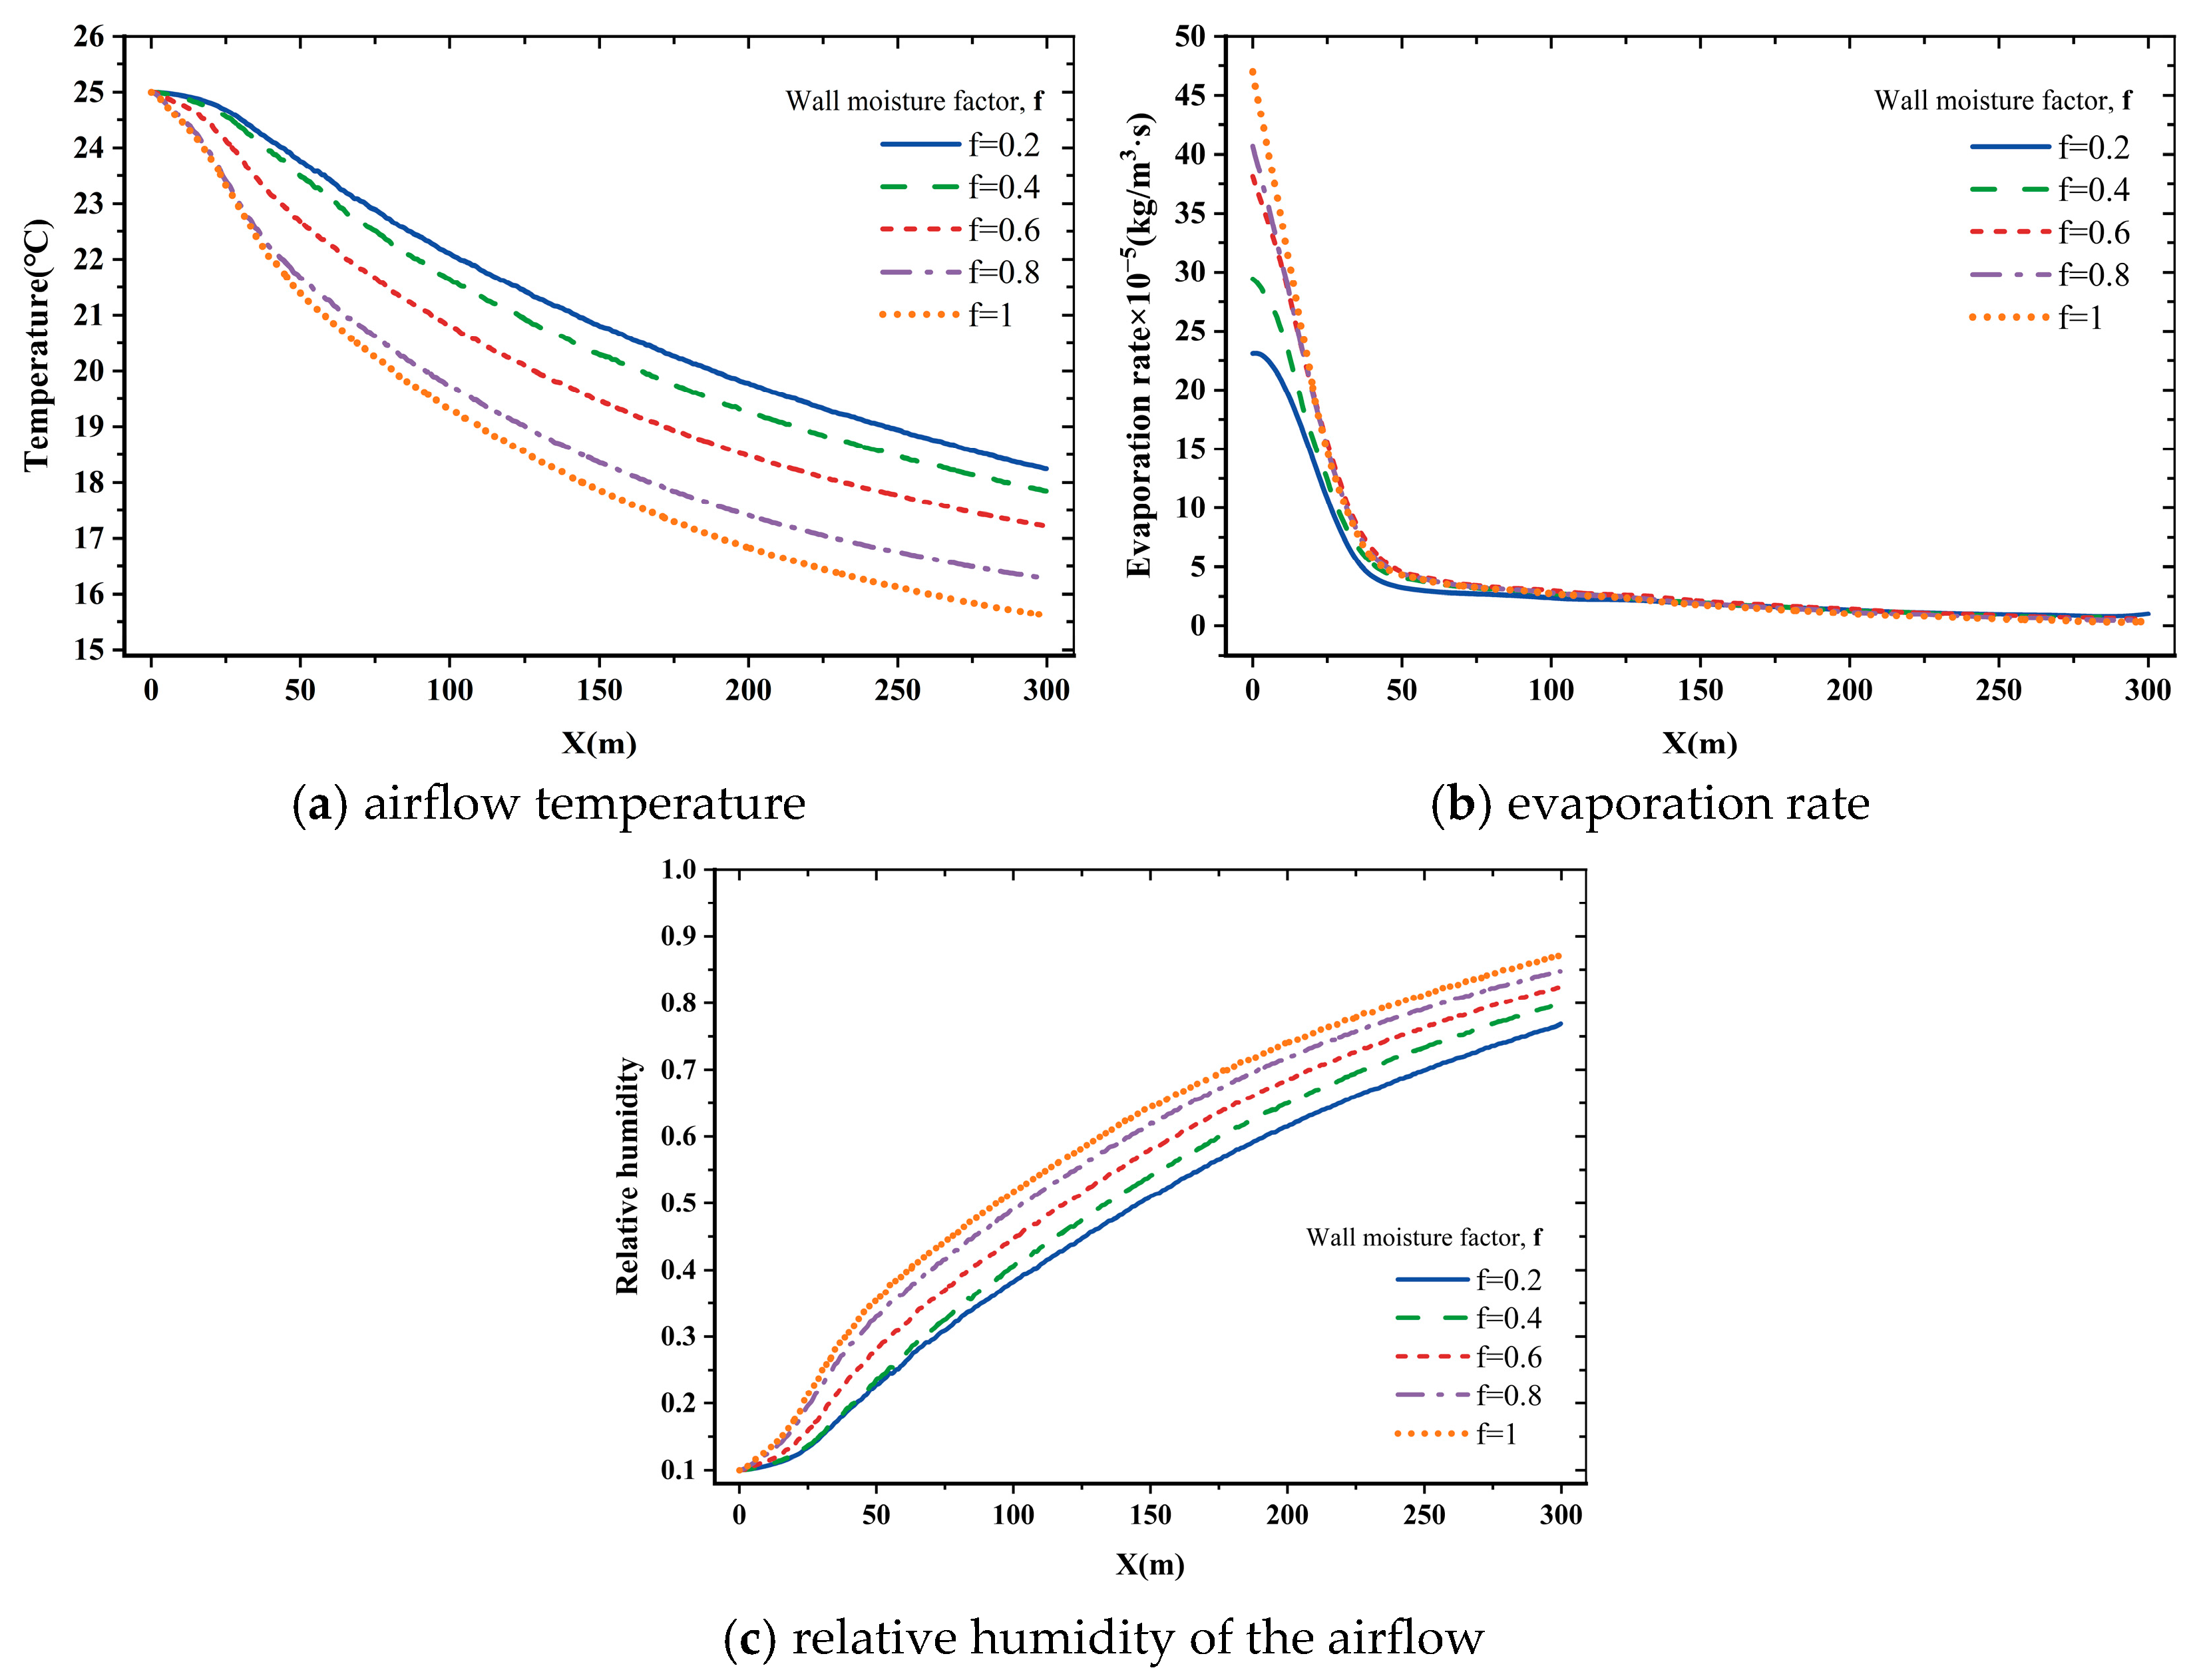
The magnitude of wall surface humidity directly affects the rate of water vapor exchange between airflow and the wall surface, thereby regulating latent heat transfer. Here, represents the wall moisture factor defined in Equation (9).
Figure 8a,b show that within 50 m of the entrance, higher wall surface humidity significantly enhances water evaporation. Evaporation absorbs latent heat, leading to a rapid decrease in airflow temperature. As ventilation distance increases beyond 100 m, the evaporation rate gradually decreases; evaporation curves nearly overlap and ultimately stabilize at approximately 5 × 10
−6. At the outlet, the airflow temperature reaches its highest value of approximately 18.2 °C at
, whereas it decreases to about 15.6 °C at
, representing a reduction of 2.6 °C and highlighting the strong cooling effect induced by wall moisture. The evolution of relative humidity is shown in
Figure 8c, where the influence of wall surface humidity is most pronounced within the first 100 m from the entrance. With increasing ventilation distance, the relative humidity under different wall humidity conditions follows a similar increasing trend. However, under a fully saturated wall condition (
), the airflow relative humidity remains consistently highest, and high-humidity conditions become more pronounced, thereby limiting the effectiveness of dehumidification.
3.2.3. Influence of Initial Relative Humidity of Airflow
The initial relative humidity of airflow is a key factor influencing wall surface evaporation. As shown in
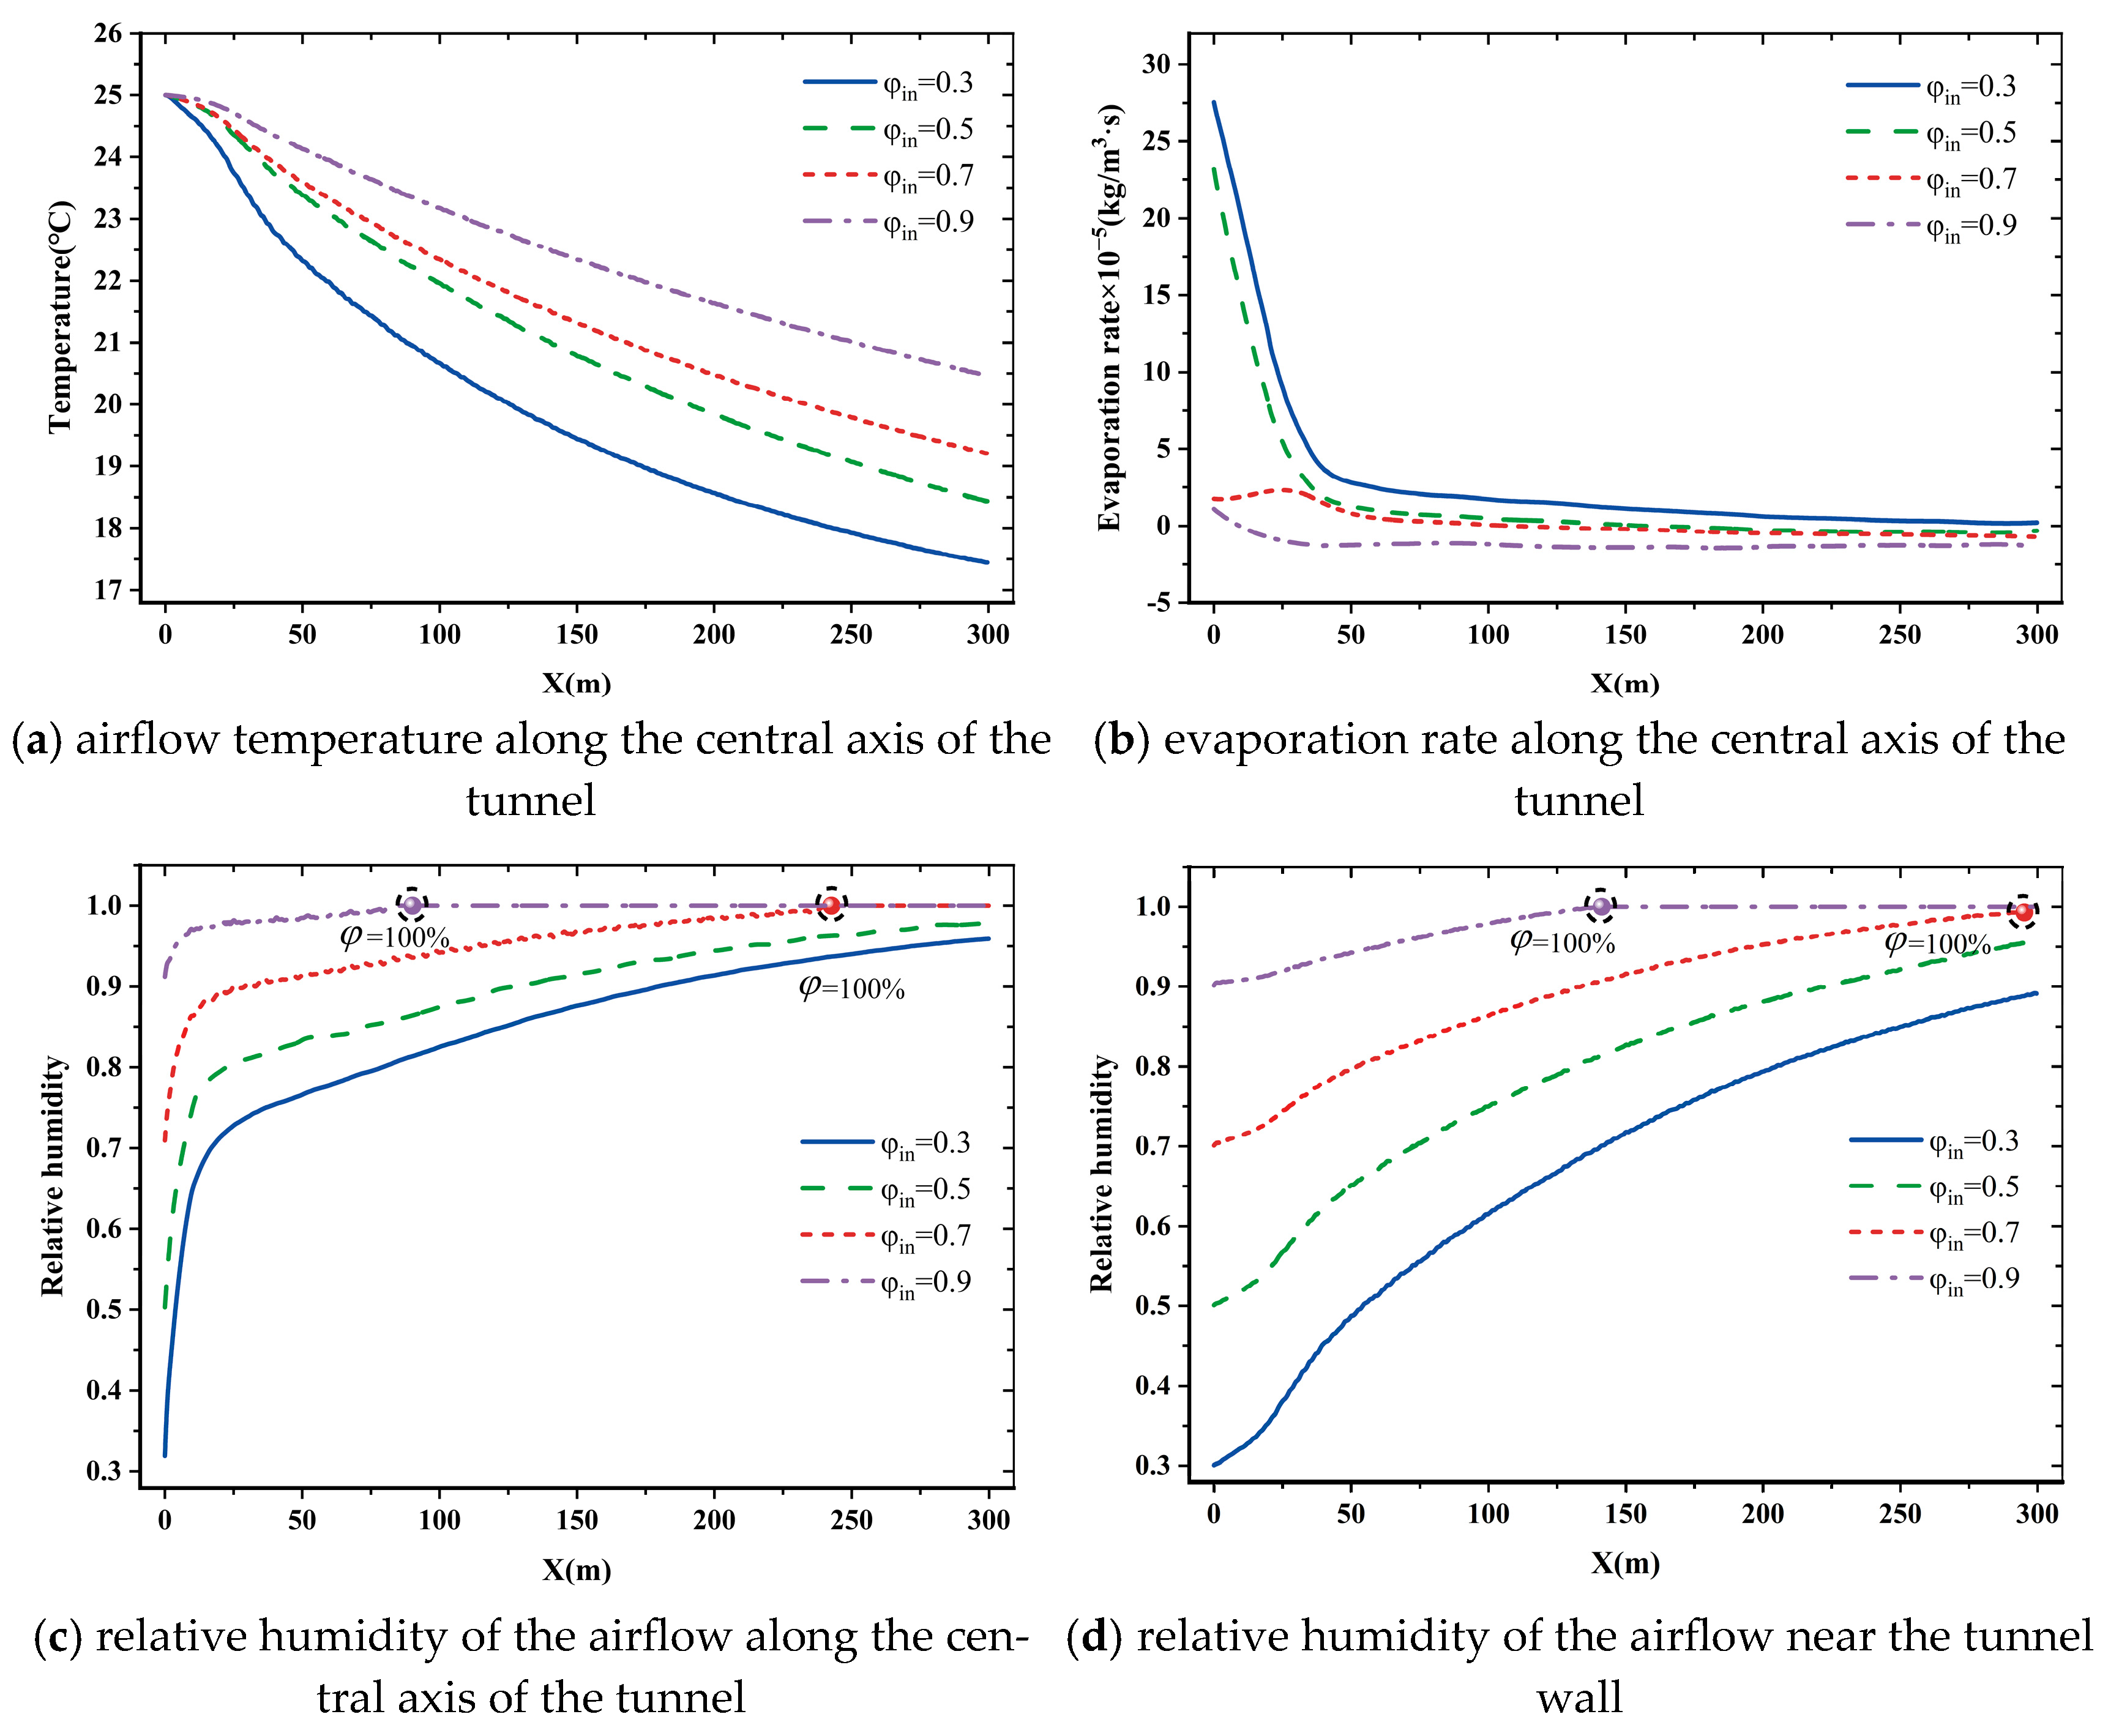
Figure 9a, variations in initial relative humidity significantly affect outlet airflow temperature. With increasing initial relative humidity, the rate of temperature decrease along the ventilation path gradually weakens. When the initial relative humidity reaches 0.9, outlet airflow temperature is only 4.5 °C lower than at the inlet, which is markedly smaller than that observed under low-humidity conditions. This indicates that a high-humidity environment inhibits moisture evaporation from the wall surface, thereby weakening the contribution of latent heat to airflow cooling.
Figure 9b shows that when the initial relative humidity exceeds 0.7, the wall evaporation rate becomes negative during the later stage of ventilation. This suggests that the near-wall airflow reaches saturation as the temperature decreases, leading to vapor condensation on the wall surface. The evaporation process thus transitions into condensation, entering a moisture accumulation stage. Under initial relative humidity conditions of 0.7 and 0.9, the corresponding condensation distances are 89.8 m and 247.3 m, respectively, as shown in
Figure 9c. In the subsequent ventilation stage, the wall surface no longer supplies moisture to airflow but instead becomes a sink for water vapor. As sensible heat exchange between airflow and the wall surface continues to reduce airflow temperature and moisture diffuses toward unsaturated regions, high-humidity airflow is more likely to reach full saturation at specific locations. Meanwhile, dust particles in the tunnel can act as condensation nuclei for fog formation, thereby exacerbating operational risks. Under initial relative humidity conditions of 0.9 and 0.7, the corresponding fog formation distances are 137.8 m and 300 m, respectively, as shown in
Figure 9d.
3.2.4. Influence of Ventilation Velocity
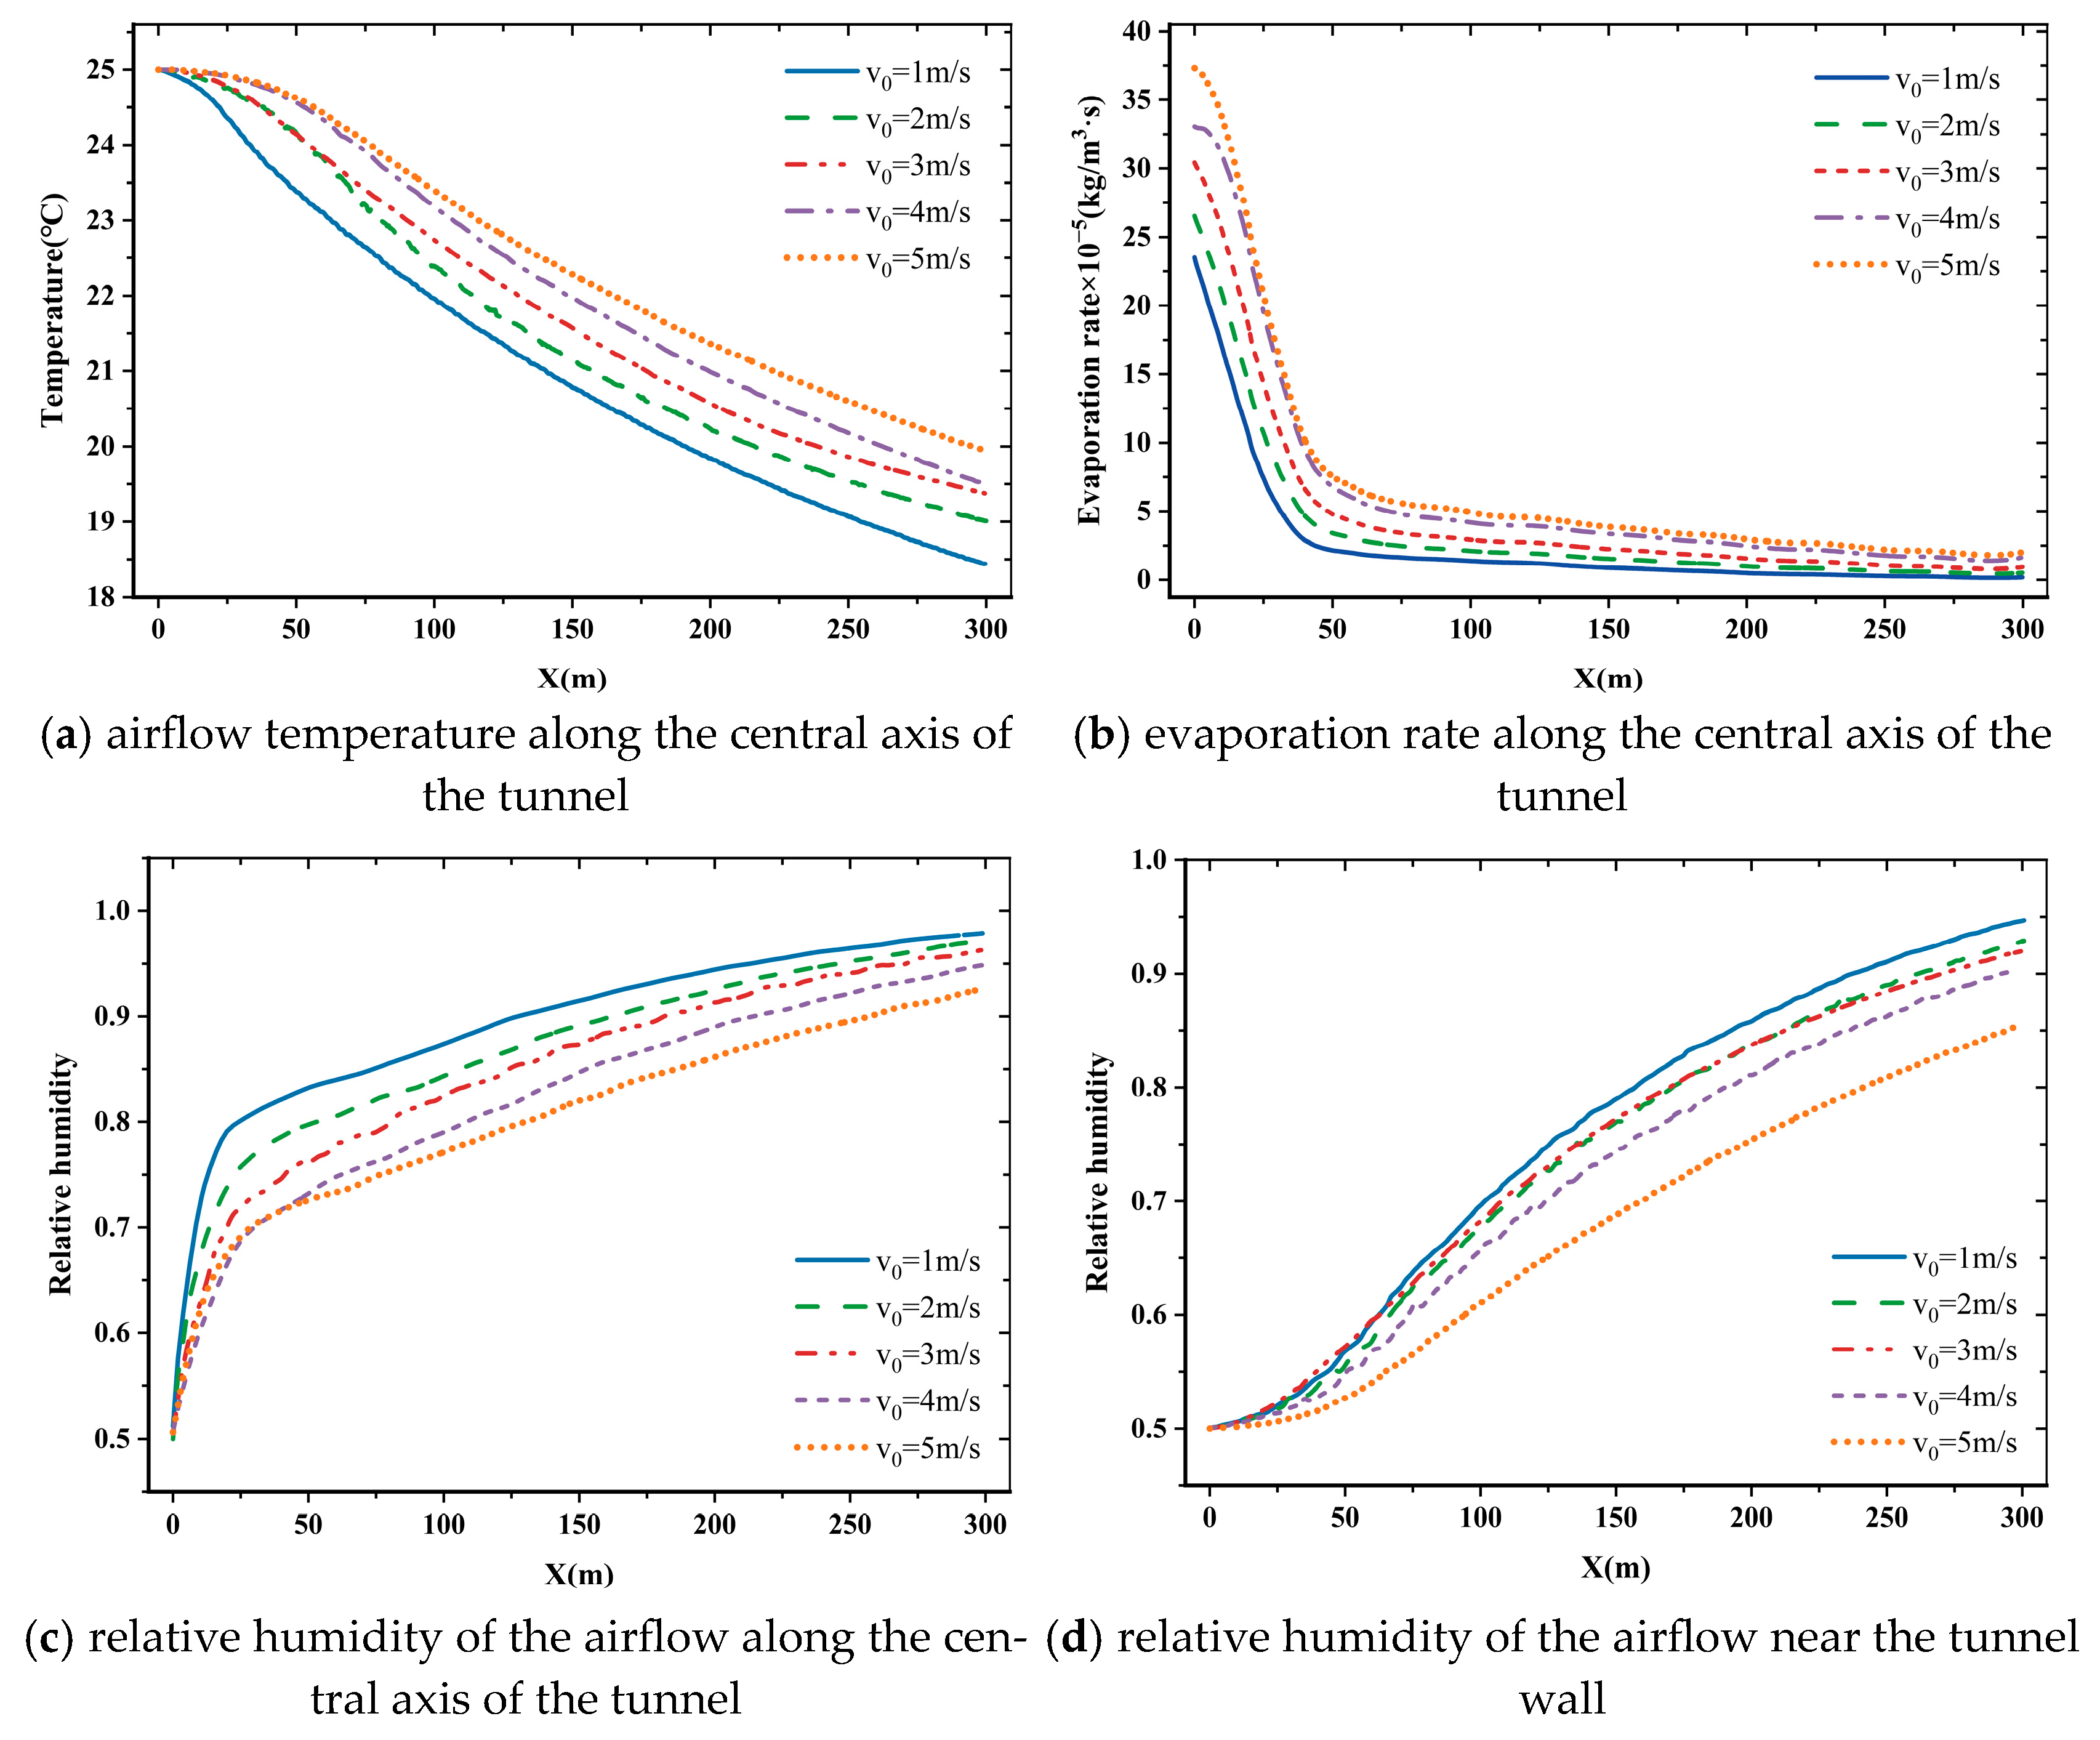
Increasing ventilation velocity is a common engineering approach for regulating the thermal and moisture environment in tunnels.
Figure 10a,b illustrate the spatial evolution of airflow temperature and the wall evaporation rate under different ventilation velocities. As ventilation velocity increases, the evaporation rate of moisture on the wall surface increases, and the evaporation process requires greater heat absorption, primarily from airflow and surrounding rock. Notably, the temperature profiles indicate that higher ventilation velocities lead to a smaller reduction in airflow temperature along the tunnel. This behavior is attributed to the increased convective heat transfer intensity between airflow and the wall surface. As a result, rock temperature under high-ventilation-velocity conditions becomes significantly higher than that under low-velocity conditions after a certain ventilation period, thereby weakening the overall cooling effect on airflow.
Figure 10c,d show the spatial distribution of relative humidity. When ventilation velocity increases from 1.0 m/s to 5.0 m/s, outlet relative humidity decreases from 0.95 to 0.85. This reduction is influenced not only by the increase in airflow temperature but also by the reduced residence time available for moisture transport. Under high-ventilation-velocity conditions, the time available for water vapor to diffuse from the high-humidity wall region to the relatively dry central region is limited, preventing the cross-sectional distribution from reaching equilibrium and thereby suppressing humidity accumulation. Overall, increasing ventilation velocity provides an effective and economically efficient approach for mitigating high-humidity conditions in tunnel environments.
3.3. Equation for the Influence of the Moisture Transfer Stage
When surrounding rock temperature is relatively low and the tunnel wall is highly humid, the incoming airflow from the tunnel entrance quickly reaches a saturated state across the entire cross-section after sufficient humidification over a certain distance, increasing the likelihood of fog formation in downstream regions. The results presented in
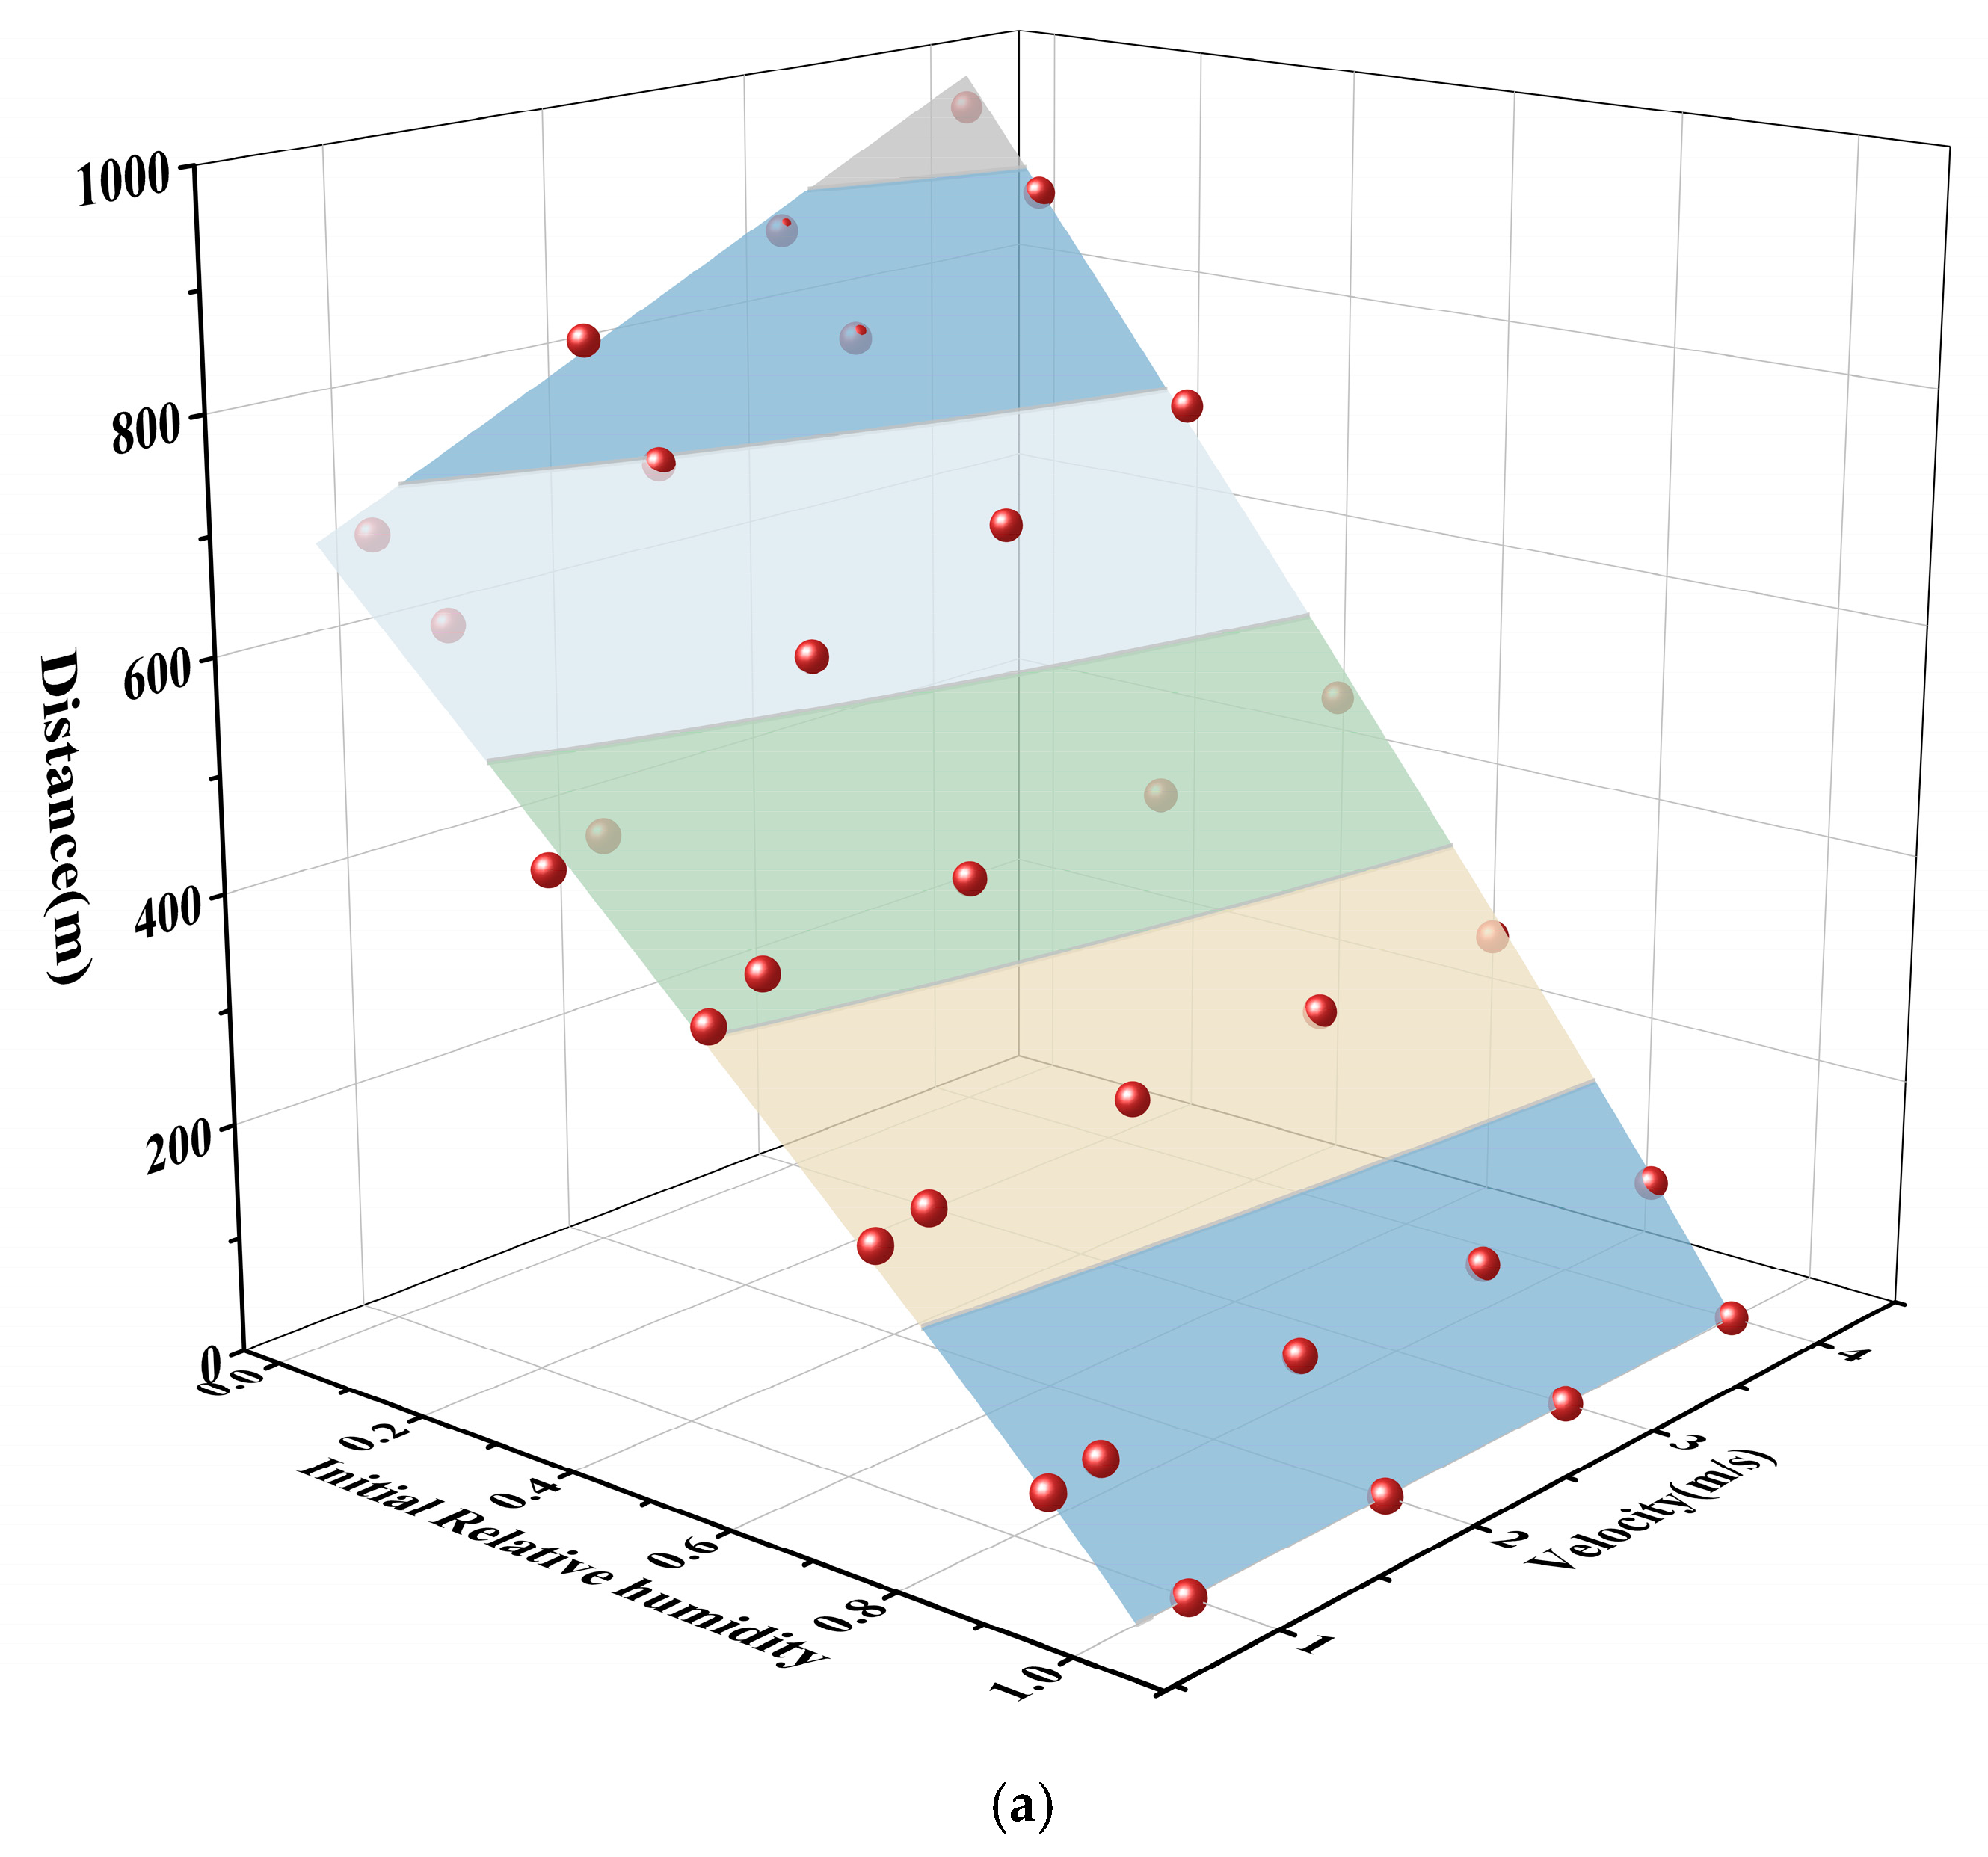
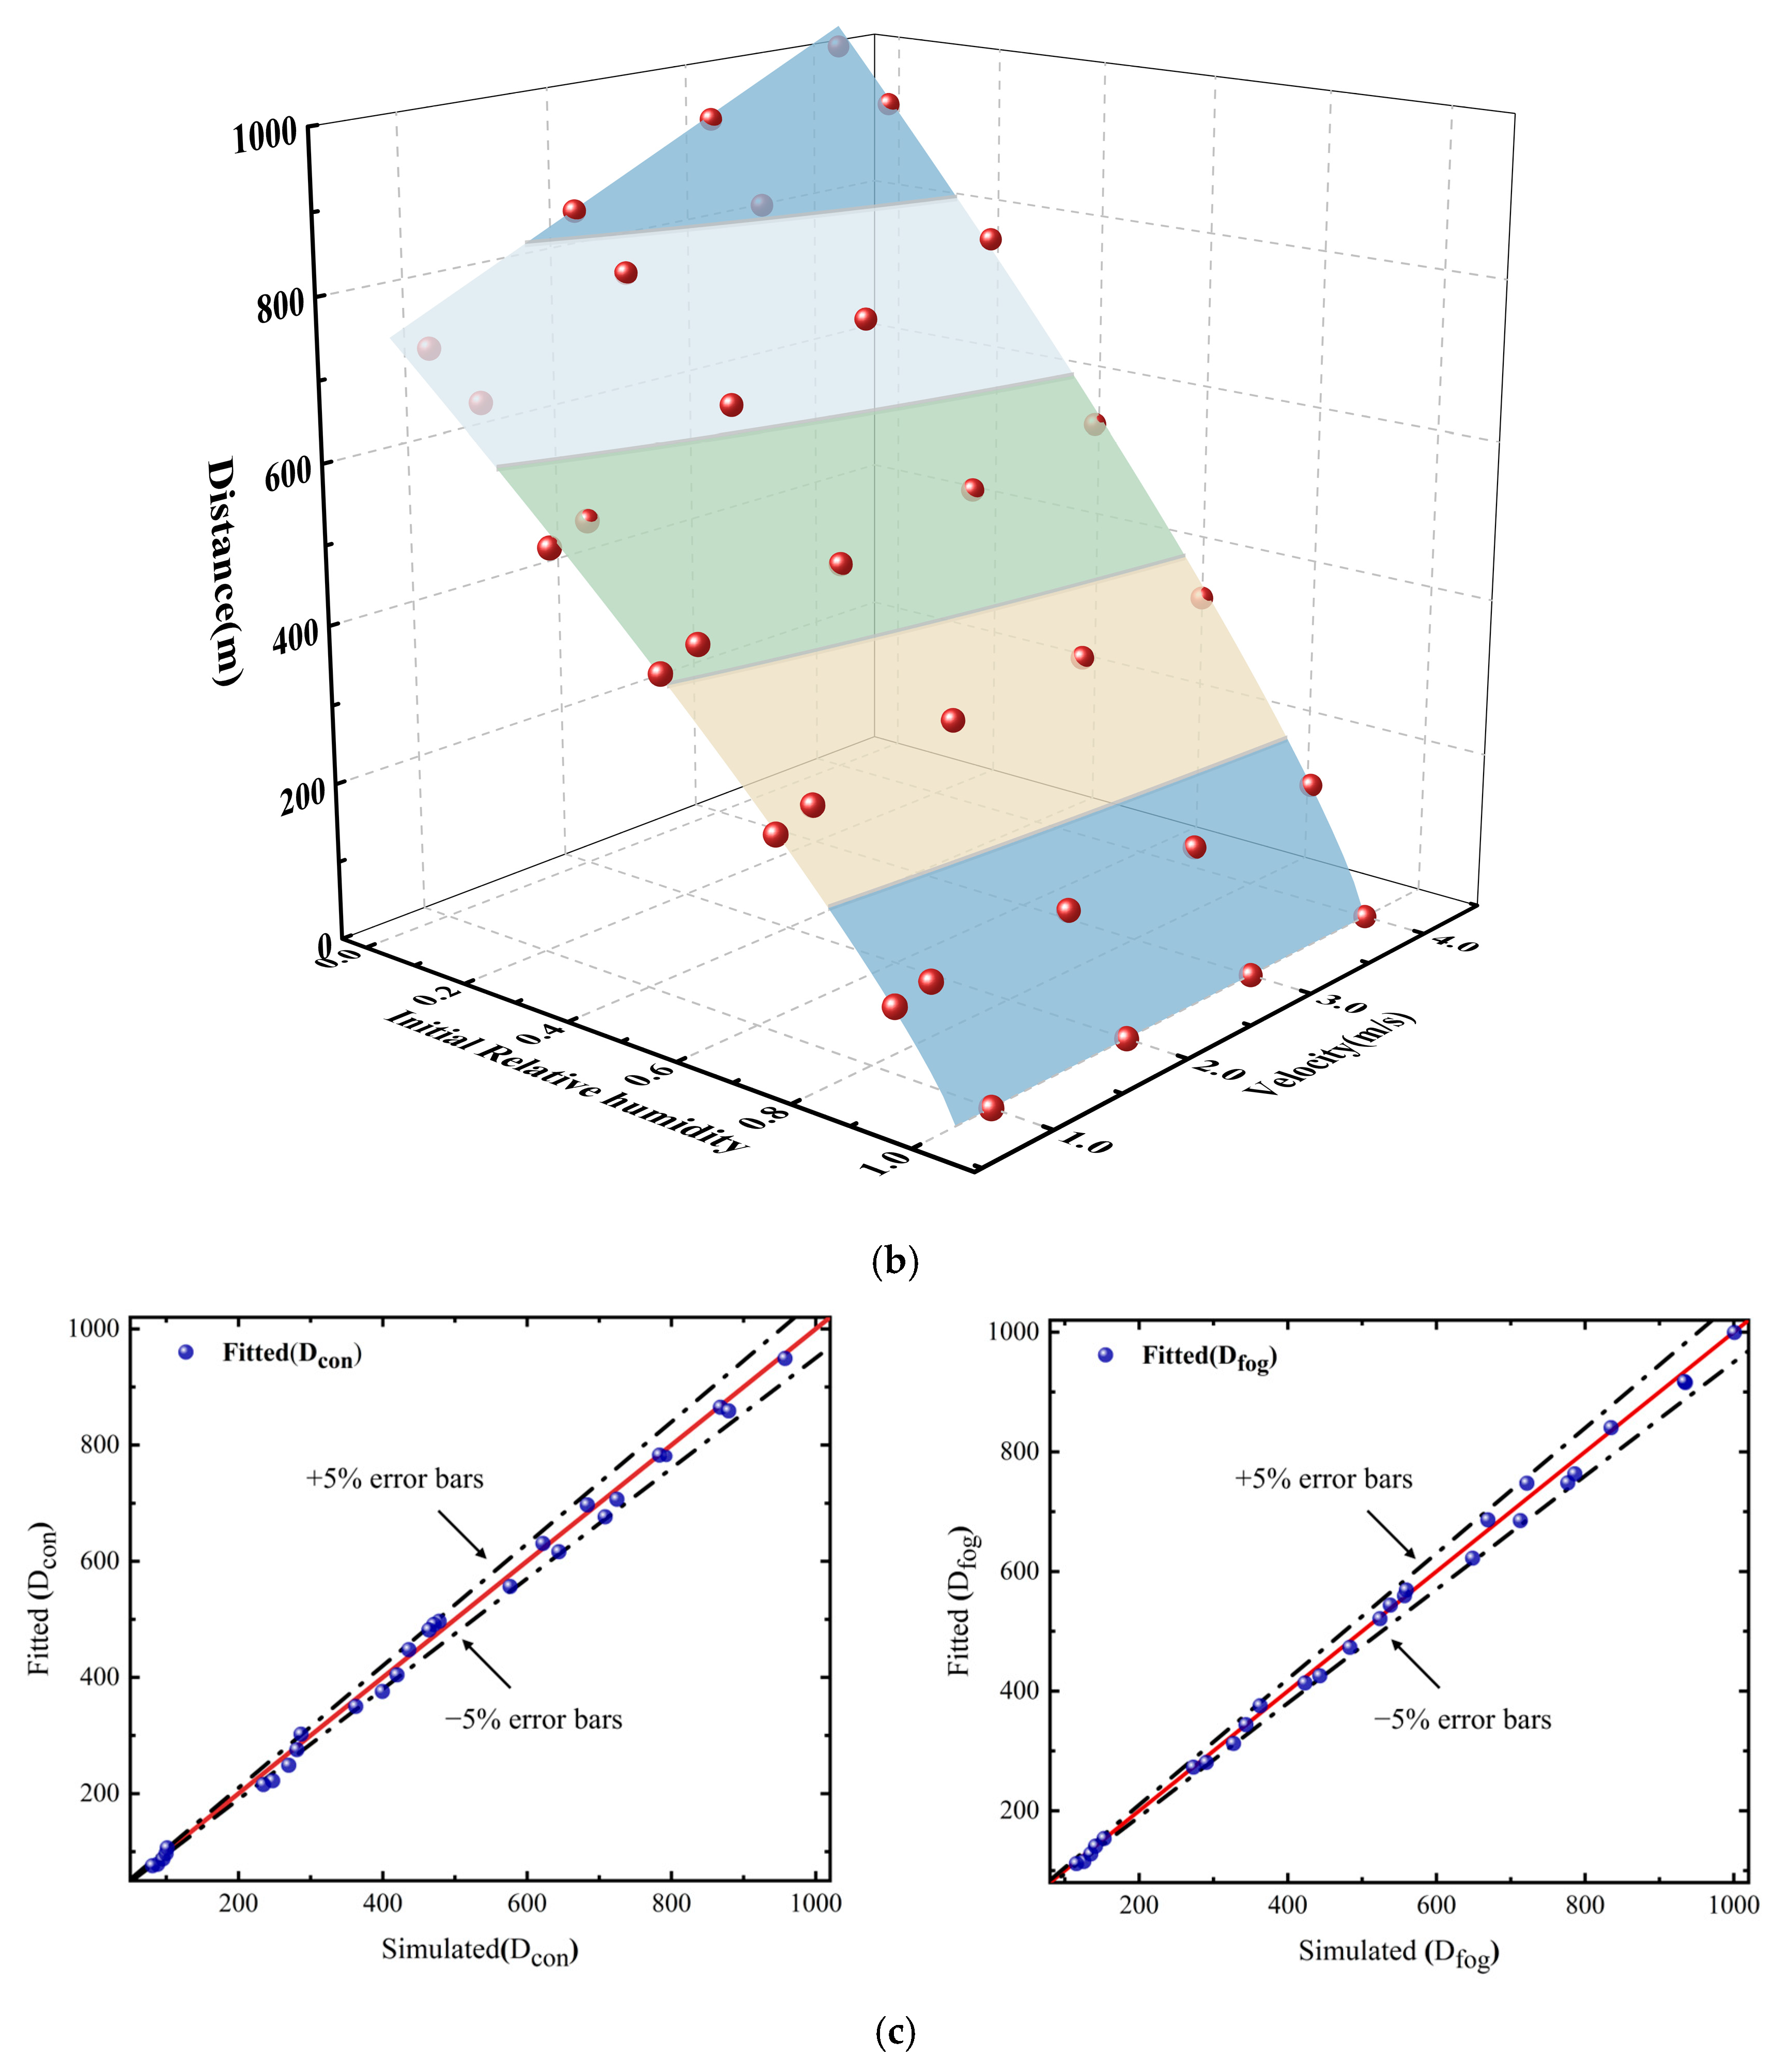
Section 3.3 demonstrate that appropriate regulation of airflow parameters such as reducing the initial relative humidity and increasing ventilation velocity can delay the onset of dew condensation and fog formation. To further quantify these effects, 32 sets of three-dimensional numerical data were obtained, in which ventilation velocity and initial relative humidity were treated as independent variables, while condensation distance and fogging distance were used as dependent variables. Based on these data, nonlinear surface fitting was performed using Origin, and the resulting fitted relationships are shown in
Figure 11a,b. The fitted relationships are expressed as follows:
where
is the initial relative humidity of airflow,
is ventilation velocity, and
,
and
are related parameters. When
indicates the condensation distance, the values of
,
and
are 0.95, 10, and 73 respectively. When
represents the fogging distance, the values of
,
and
are 0.813, 10, and 79 respectively.
The proposed regression equations are applicable within the investigated ranges of 0.5–4.0 m/s for ventilation velocity and 0–100% for inlet relative humidity . Lower velocities may not fully satisfy the turbulent-flow assumption adopted in the model, whereas excessively high velocities may introduce stronger flow disturbances and increase prediction uncertainty. Since the actual tunnel ventilation conditions generally fall within this range, the equations are considered applicable to practical operating conditions.
To quantitatively evaluate the goodness-of-fit of the regression equations for condensation and fogging distances, the coefficient of determination (R
2) and root mean square error (RMSE) were introduced. R
2 reflects the overall agreement between the regression-predicted and simulated values, while RMSE characterizes the magnitude of the prediction error. These indicators are calculated as follows:
where
is the simulated value,
is the value predicted by the regression equation,
is the mean of the simulated values, and
is the number of data points.
The calculated goodness-of-fit statistics are summarized in
Table 4. For the condensation-distance regression, R
2 and RMSE are 0.9957 and 17.32 m, respectively, while those for the fogging-distance regression are 0.9969 and 14.80 m, respectively. The R
2 values close to 1 and relatively low RMSE values indicate good overall agreement between the regression-predicted and simulated results.
Figure 11c further presents the relative errors between the regression-predicted and simulated values. The mean relative errors are approximately 4.32% for the condensation distance and 2.45% for the fogging distance. Most data points exhibit relative errors below 5%, although slightly larger deviations occur under several conditions, particularly at shorter distances. Combined with the high R
2 values and low RMSE values, the relative-error analysis demonstrates that the proposed regression equations can satisfactorily reproduce the condensation and fogging distances within the investigated parameter range and can therefore be used to assess the associated high-humidity risks in the tunnel.
Increasing ventilation velocity and reducing the initial relative humidity of airflow both extend the condensation distance and fogging distance, thus mitigating the high-humidity risk in the tunnel. However, when the initial relative humidity of inlet airflow is already high, increasing ventilation velocity from 1 m/s to 4 m/s only results in an extension of the fogging distance by 15.3 m. In this case, the tunnel continues to face a significant risk of high humidity. Using a dehumidifier to absorb moisture from incoming airflow and reduce its relative humidity at the entrance would be a more effective method. In contrast, when the initial relative humidity of inlet airflow is below 0.5, increasing ventilation velocity can effectively delay moisture saturation and enhance moisture removal in tunnels with humid walls, significantly extending the distance required for the airflow to reach saturation. This allows the airflow to maintain a safe humidity range over a longer distance and thereby reduces the likelihood of fog formation.