Article

Fringe Belts in Guangzhou: Morphological Evolution and Value Assessment

1
School of Architecture, South China University of Technology, Guangzhou 510641, China
2
State Key Laboratory of Subtropical Building Science, South China University of Technology, Guangzhou 510641, China
*
Author to whom correspondence should be addressed.
Buildings 2026, 16(18), 3681; https://doi.org/10.3390/buildings16183681
Submission received: 23 July 2026 / Revised: 12 September 2026 / Accepted: 14 September 2026 / Published: 16 September 2026

Abstract

Fringe belts serve as the “growth rings” of urban expansion, bearing witness to the historical development and evolution of cities. Previous studies on urban morphology often focused on qualitative research, lacking quantitative measurement of various values in the context of high-density megacities. This study uses the main urban area of Guangzhou as a case study, reconstructs morphological periods based on the city’s history of over 2000 years, combines multi-source spatiotemporal data to accurately identify natural and artificial fixation lines, and scientifically defines and divides the spatial ranges of four urban fringe belts: inner, middle, middle-outer, and outer. This study has constructed a quantitative measurement framework integrating function and space, relying on remote sensing land surface temperature inversion, land use models, nighttime lights, and POI data to determine the ecological, economic, and social functions of the fringe belts in Guangzhou. The results demonstrate that (1) Guangzhou fringe belts exhibit distinct hierarchical spatial expansion pathways: leapfrog expansion, linear extension and stratified renewal. (2) Fringe belts constitute composite spaces with notable ecological value, exhibiting relatively favorable local thermal environmental characteristics within high-density built-up environments. Moreover, the natural patches contained within fringe belts demonstrate strong morphological resilience. (3) The economic and social functions of fringe belts strengthened while exhibiting uneven spatial changes, while spatial functions shifted from predominantly production and institutional uses toward more diverse urban functions. Nighttime light intensity increased overall, with widening absolute differences among units but declining relative dispersion, indicating overall brightening alongside persistent spatial variation in nighttime illumination. This work creates a novel paradigm for value evaluation, adapting Western urban morphological theory to a Chinese megacity while offering an effective tool for urban resilience and landscape regulation.

1. Introduction

Core areas, peripheral areas, boundaries, corridors, and networks are the different categories of urban spatial structure. Fringe belts refer to low-density built-up areas originally located at the urban periphery, composed of diverse land uses, and gradually integrated into the internal urban fabric over time. Embedded within the urban structure like “growth rings”, fringe belts provide an important means of tracing and monitoring urban evolution [1]. As spatial structures left over from different stages of urban expansion, fringe belts not only record the historical boundaries of cities and the evolution of land use, but, where relatively well preserved, may also possess potential ecological and planning value because of their concentrations of green spaces, open spaces, public institutions and so on. Accordingly, this study first systematically clarifies the conceptual scope and defining characteristics of fringe belts, thereby establishing a clear research context and methodology framework.
The fringe belt concept was first introduced around 90 years ago. Based on this conceptual framework, the field of urban morphology has developed an increasingly comprehensive research system. In the Chinese context, this study further clarifies and extends the definition of the fringe belt, examines its morphological characteristics and land-use patterns, and interprets its formation mechanisms under the influence of multiple factors. A framework for analyzing the evolution of urban structures is built on this foundation, along with historical and geographical features of metropolitan areas. In terms of land use, morphological composition, and property rights, fringe belts differ markedly from central residential areas and central business districts (CBDs) in both spatial form and social function [2]. They therefore constitute key areas for observing the dynamic extension or disruption of socioeconomic and cultural processes during urban development, as well as for interpreting urban identity. The driving mechanisms underlying their expansion and transformation are multidimensional, involving administrative and policy regulation, economic forces, accumulated socio-cultural and historical influences, changing demographic structures, and shifts in industrial technologies [3,4]. Furthermore, quantitatively assessing the diverse values of fringe belts, revealing the complex spatial interactions among different fringe belts, and identifying their dynamic evolutionary characteristics can further demonstrate the significance of fringe belt areas for conservation-oriented research.
Lefebvre also stressed that urban structures are fundamentally composites of various agents and human production [5], whereas Kropf et al. investigated the dialectical interaction between human society and urban structures during the process of urban construction [6]. While highlighting the effects of fringe belts evolution on social development, scholars should also consider how social activities transform fringe belt environments. In megacities with populations exceeding ten million, how do fringe belts meet urban needs through functional networks that transcend administrative boundaries and generate dynamic reciprocal feedback with social systems? How do fringe belts and social systems co-evolve through continuous interaction, jointly shaping geographical, ecological, and sociocultural dimensions of the urban environment while facilitating the articulation of urban spatial patterns?
However, previous studies on edge zones have primarily relied on qualitative descriptions, lacking the support of quantitative analysis. In particular, insufficient attention has been paid to their multidimensional values and socioeconomic characteristics. Accordingly, another focus of this study is spatial value. By integrating multi-source data mining and extraction, digital analytical and processing techniques, and urban–rural complex ecosystem theory, this study seeks to measure and evaluate the spatial values and spatiotemporal evolution of the economic, social, and natural systems of Guangzhou fringe belts at the macro scale. It will fill the gap in digital technology and value determination for the fringe belts research framework, while contributing a well-substantiated empirical case to the study of fringe belts in Chinese cities.

2. Theoretical Foundations and Research Status

2.1. Theoretical Foundations and Evolutionary Processes of Fringe Belts

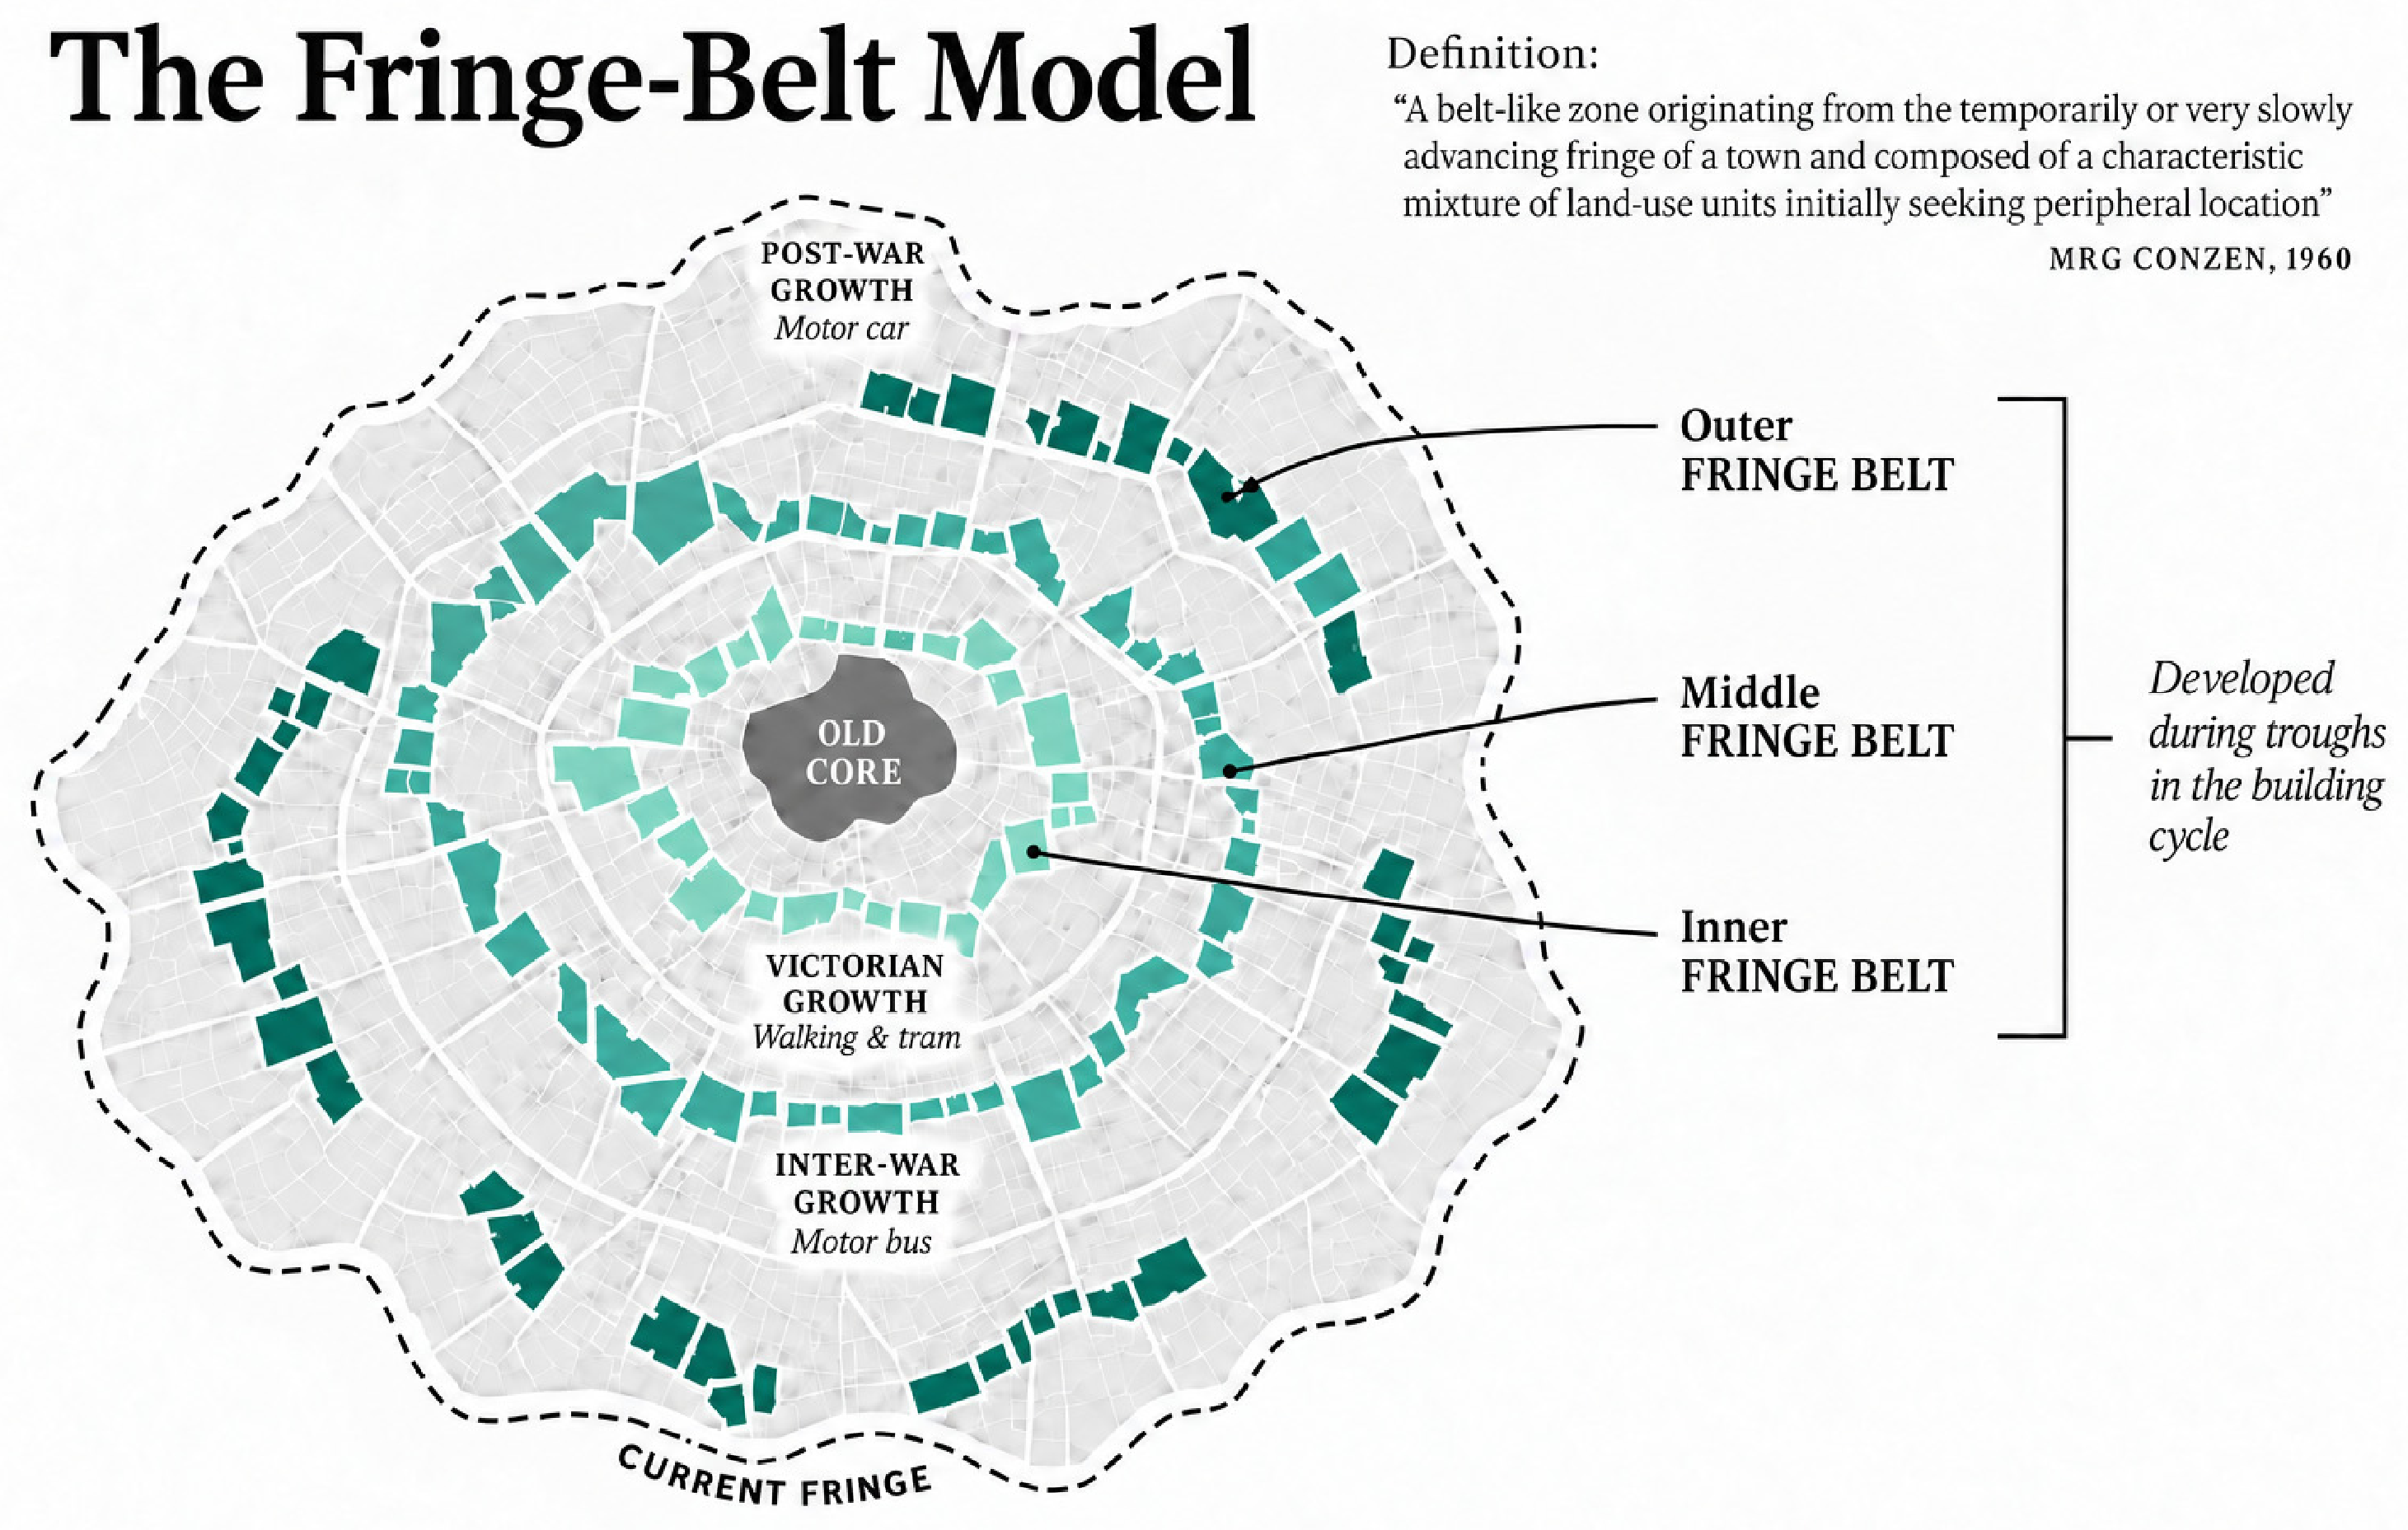
The Fringe Belt is a key concept in the Conzenian School for interpreting the historical spatial structure of cities and its evolution. The idea can be traced back to Louis’s study on the urban space of Berlin in 1936, and was subsequently developed by M. R. G. Conzen, Whitehand, and other scholars [7,8,9] (Figure 1). Unlike the Urban Fringe, which primarily refers to the current peripheral location of a city, fringe belts are historically embedded morphological zones that emerge during phases of urban development and are retained through subsequent phases of urban expansion.
The Fixation Line is a core element in the spatial structure and formation mechanism of fringe belt. It generally refers to a linear feature that constrains the continuous outward expansion of the built-up area during a historical period, including city walls and defensive structures, rivers, mountains, railways, and certain administrative or property boundaries. The earliest fringe belts generally formed in close association with fixation lines, with institutional land uses such as parks, schools, military facilities, and industrial sites concentrated along both sides of or beyond these lines. In addition to the spatial influence of fixation lines, the formation of fringe belts also exhibits a clear historical periodicity. Conzen introduced the concept of the Morphological Periods to describe the distinctive imprint left on the urban fabric by socioeconomic conditions and construction activities during different historical phases. Whitehand further explained the economic mechanisms underlying fringe belt formation through the concepts of the building cycle and bid-rent theory [10,11]. During housing construction booms, intensive residential development promotes the continuous outward expansion of the city. When residential construction slows, large institutional land users gain opportunities to occupy relatively inexpensive peripheral land, thereby creating fringe belts characterized by diversified land uses and larger plot sizes. From this perspective, fringe belts can be regarded as a form of spatial sedimentation resulting from discontinuous urban growth. As successive morphological periods unfold, cities may consequently develop inner, middle, and outer fringe belts [7].
As cities continue to expand, existing fringe belts undergo an important process of internalization, whereby fringe belts originally associated with the urban edge are gradually incorporated into the internal morphological structure of the city as the built-up area extends beyond them [1,3]. During this process, fixation lines, plot boundaries, relationships with the street network, and certain land uses may be retained, allowing historical fringe belts to remain identifiable within the contemporary urban fabric. Subsequently, fringe belts are subject to continuous land reuse and morphological transformation in response to changing urban functions and land demands. Previous studies have categorized these transformations as intensification, land-use change, alienation, reduction, intrusion, and migration [8,12,13]. Intensification refers to an increase in development intensity while the original land use and plot structure are largely retained. Land-use change involves the conversion of specific functions, while the new use continues to preserve the basic morphological characteristics of the fringe belts. Alienation, by contrast, occurs when fringe belt plots are converted into high-density residential or commercial land uses, resulting in the gradual loss of their original fringe belt characteristics.
Taken together, classical fringe belt theory provides an integral historical-morphological framework for understanding urban development. Fixation lines and their surrounding areas constitute the spatial basis for fringe belt formation; morphological periods reveal the historical conditions under which fringe belts emerge; internalization explains how fringe belts are transformed from peripheral zones into components of the internal city; and land reuse reflects their preservation, adjustment, and dissolution during subsequent urban development. Through this framework, fringe belts are no longer understood merely as static aggregations of low-density land uses, but rather as important spatial units through which historical urban boundaries, morphological continuity, and changes in land-use functions can be examined.

2.2. Building the System for Evaluating Spatial Value

With the advancement of fringe belt research, the focus of scholars has gradually shifted from the identification and preservation of historical forms toward the contemporary planning values of fringe belt. Since the late 1990s, fringe belt studies have increasingly intersected with urban planning, landscape management, and ecological research, while the object of inquiry has expanded from their formation and evolution to questions concerning their persistence and utilization. Studies by Barke and others have suggested that fringe belts possessing significant historical, social, cultural, or natural value are more likely to retain their original spatial characteristics [12]. This indicates that the persistence of fringe belts is determined not only by morphology itself, but also by the multiple values embedded within these spaces. Therefore, for fringe belts that have already been internalized within the urban fabric, research needs to move beyond the question of whether their morphology has been preserved toward an examination of what values these spaces continue to provide in the contemporary city.
Among these values, ecological value has received considerable attention in recent fringe belt research. Existing studies have shown that fringe belts, due to their concentrated distribution of parks, cemeteries, campuses, military facilities, and other similar institutions, typically feature high proportions of green space, open space, and permeable surfaces, playing important roles in biodiversity conservation, ecological connectivity, stormwater regulation, and urban microclimate improvement [14,15,16]. Hazar and Ozkan’s study of abandoned military sites further demonstrated that some fringe belts characterized by prolonged enclosure and low development intensity have retained relatively intact vegetation communities and may therefore function as potential ecological corridors within urban green-space systems [17]. These findings suggest that low development intensity should not be equated with low value. On the contrary, some fringe belts perform ecological functions that are difficult to replace with high-intensity urban development precisely because of their long-term preservation.
The social and economic values of fringe belts likewise need to be incorporated into the assessment framework. In terms of social functions, parks, campuses, public institutions, waterfront spaces, and cultural facilities in fringe belts not only provide public services but also influence residents’ leisure recreation, social interactions, and spatial accessibility. Gu Kai’s study of Auckland waterfront fringe belts showed that intensive redevelopment may lead to a reduction in publicly accessible waterfronts and public corridors, indicating that fringe belt renewal also concerns the preservation of public space and social value [4]. In recent years, points of interest (POIs), human activity data, and multi-source spatiotemporal datasets have provided new methods for spatial measurement [18,19,20]. Chen, Ge, and He, in their study of Baiyun District in Guangzhou, integrated POI, road network, land-use, and heatmap data to identify differences in functional agglomeration and human activity across different areas, providing a transferable methodological approach for evaluating the actual social and economic activity of fringe belts [21]. At the economic level, once fringe belts become incorporated into the city, they are often exposed to strong redevelopment pressures. Their economic value, however, cannot simply be equated with land prices or potential real-estate returns. Kubat and others have found that former industrial sites, sports facilities, and other fringe belt spaces can easily disappear under intensive development when they are regarded as inefficient land [22]. Economic value assessment should therefore also consider the industries, services, and other urban functions currently accommodated within these spaces, rather than solely judging their utilization efficiency based on development intensity.
This study develops a framework for assessing the spatial value of urban fringe belts. Within this framework, spatial value encompasses both the spatial manifestation of human activity intensity and the role of fringe belts as physical carriers of functions that support sustainable development. On the one hand, the duration, frequency, and diversity of human activities occurring within fringe belts can, to a certain extent, reflect the real-time socioeconomic vitality of these spatial units. On the other hand, fringe belts themselves possess substantial capacities for spatial self-organization and functional accommodation. In megacities with populations exceeding ten million, they can provide safe, accessible, and highly mixed-use spaces, while their high proportions of permeable soft surfaces and mature vegetation communities can also form urban biodiversity hotspots and natural sponges. Methodologically, this study integrates multi-source data, including remote sensing, land use, POIs, and human activity data, to quantify the current value of Guangzhou fringe belts across three dimensions: ecological environment, economic activity, and social function. This framework enables comparison of value differences among different fringe belts and provides a basis for their subsequent conservation and regeneration.

3. Research Area, Data, and Methods

3.1. Multi-Scale Delineation of the Research Area

This study selects Guangzhou, a major city in South China, as a representative case. Guangzhou combines a history of more than 2000 years with the characteristics of a megacity that has undergone sustained and rapid expansion, resulting in a spatial evolution marked by strong historical continuity and considerable complexity. Since modern times, the demolition of city walls and road construction have reshaped traditional urban boundaries, while natural geographical features such as the Pearl River and the Baiyun Mountain, together with artificial elements including railways and transport infrastructure, have continued to influence urban expansion and the formation of fringe belts during different historical periods. Meanwhile, modern industrial development, new-town construction following the Reform and Opening-up, and the restructuring of urban functions have produced a spatial pattern characterized by the superimposition of multiple historical periods and the coexistence of diverse land-use types. These characteristics provide a relatively complete historical sequence for examining the formation, internalization, and subsequent land reuse of fringe belts, making Guangzhou a representative case for analyzing the spatial manifestation of classical fringe belt theory in the context of high-density Chinese cities.
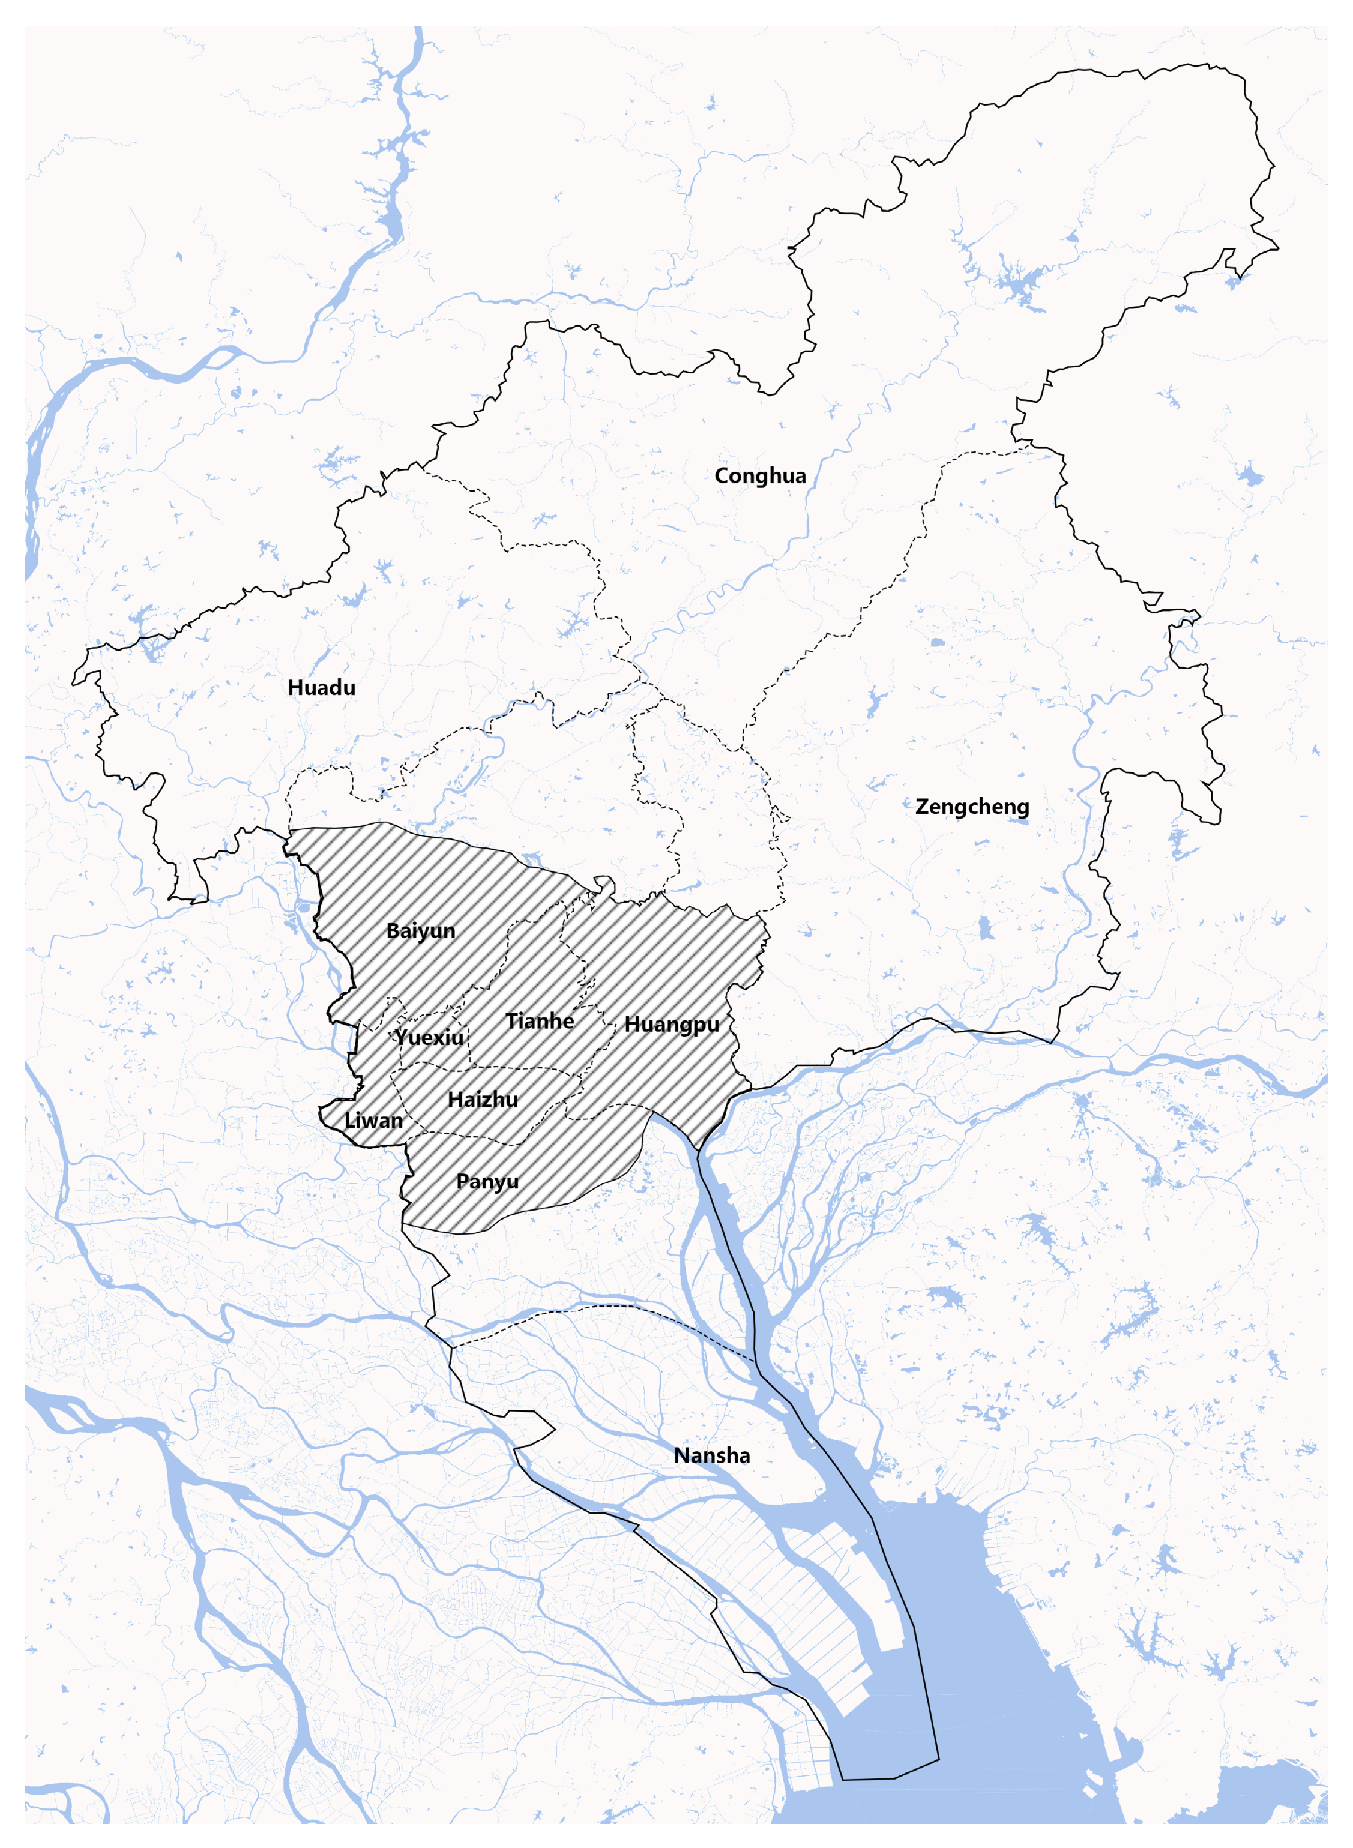
Urban expansion of Guangzhou exhibits distinct cross-regional and multi-scalar characteristics, and the formation and evolution of fringe belts are not entirely constrained by current administrative boundaries. To provide relatively comprehensive coverage of Guangzhou traditional urban core and its main expansion directions, and to identify fringe belts formed in different periods as well as their land-use differences, this study defines the research scope according to the spatial structure of the main urban area specified in the draft of the “Guangzhou Urban Master Plan (2017–2035)”. Specifically, the study area includes the entirety of Yuexiu, Liwan, Tianhe, and Haizhu districts; the area of Baiyun District south of the North Second Ring Expressway; the area of Huangpu District south of Jiulong Town; and the area of Panyu District north of the Guangming Expressway, covering a total area of approximately 1110 km2. This area encompasses both Guangzhou’s historic urban core and early industrial expansion zones, as well as the principal built-up areas formed through eastward, southward, and northward urban expansion since the Reform and Opening-up. It therefore provides a unified spatial basis for identifying fringe belts at different historical stages and different locational levels (Figure 2).

3.2. Identification and Delineation of Guangzhou Fringe Belts

The delineation of Guangzhou fringe belts in this study is based on the historical-morphological approach developed in Conzenian School. M. P. Conzen has classified fringe belt land uses into five categories: open space, infrastructure, industrial facilities, low-density residential buildings, and recreational facilities [16]. This study is based on the identification of land use type, while also taking into account the characteristics of Guangzhou modern urban expansion. The delineation process comprehensively considers the formation periods of individual plots, their relationships with fixation lines and historical urban expansion boundaries, and whether they were subsequently internalized through urban expansion or continued to constrain urban form. The specific division method is shown in Table 1.

3.3. Multi-Source Spatiotemporal Data Extraction, Cleaning, and Vectorization Alignment Procedure

This study creates a multi-source spatiotemporal dataset that includes historical urban maps, contemporary aerial imagery, remote sensing image data, and socioeconomic data because the time span of this research is extensive and involves morphological shifts spanning nearly a century, in addition to the multidimensional measurement of contemporary socioeconomic functional performance.
The Guangzhou Local Chronicles Compilation Committee and the Guangzhou Urban Construction Archives provided scanned paper maps and historical atlases from the Ming and Qing dynasties to the Republic of China, which the authors used to restore landscape morphology and plot boundaries during historical periods. City maps from important historical nodes were chosen as the basic morphological skeleton to guarantee the scientific validity and reproducibility of spatial pattern assessments across different historical morphological periods. In particular, these consist of: the China Historical Map and Table Compilation Society’s 1948 Detailed Street Map of Guangzhou (scale 1:9000); the Guangdong Army Surveying Bureau’s 1923 Complete Map of Guangzhou (scale 1:4000); and the 1:12,000 scale Guangzhou Road Plan Map created in the same year by the Guangzhou Municipal Public Works Bureau. Additional sources included the 1955 Guangzhou Aerial Imagery Atlas (scales 1:12,000, 1:16,000, 1:32,000), the 1978 Historical Imagery Atlas of Guangzhou (scales 1:5000, 1:8000), the 2010 Guangzhou Topographic Survey Map, current Google Earth high-precision satellite remote sensing imagery, and master urban plan texts from different eras (2001–2010, 2011–2020).
This study uses ArcGIS 10.7 (Esri, Redlands, CA, USA) to perform topological registration and geometric correction of the scanned historical maps for their digital integration. This work uses a “feature point locking” technique to get around geometric distortion obstacles brought on by disparities in surveying standards in old maps. To ensure that the root-mean-square error (RMSE) of control points was strictly controlled within a comparable range, nonlinear polynomial geometric corrections were applied to each historical map by locating and locking stable morphological anchors that have not changed over a century, such as surviving ancient building sites, important topological nodes of historical mountain and water systems, and traditional street intersections. Once registration was completed, using the plot as the minimum unit for division and data extraction on each historical map, all morphological elements—including street systems, plot combinations, and building footprints—were manually vectorized to establish a spatial database of fringe belt morphological characteristics.
This study integrates remote sensing, land-use, POI, and nighttime light data to assess the functional and environmental performance of Guangzhou’s fringe belts. Surface thermal conditions were assessed using the Landsat 8 Collection 2 Level-2 surface temperature product acquired on 26 August 2025. Following cloud masking and quality control, ST_B10 values were converted to degrees Celsius using the USGS scaling coefficients. Simultaneously, Huang Xin’s team at Wuhan University built models to capture impervious surfaces, landscape waters, and soft green space features to produce CLCD land-use data [23] for the research area. Nighttime light data for 2005 and 2025 were obtained from the dataset developed by Yu Bailang’s team at East China Normal University [24]. POI records for the corresponding years were compiled separately and classified into economic and social categories. Duplicate records and points outside the study area were removed, and records were screened for the location and classification information required for analysis. After coordinate-system harmonization, the POI data were spatially matched to the delineated fringe-belt polygons and aggregated using a common 100 m grid. These attributes were linked to the historical morphological units to construct an integrated spatial database.

3.4. Mathematical Techniques and Multidimensional Spatial Value Measurement Models

(1)
Model for Measuring Ecological and Natural Value
This study constructs a quantitative model of ecological value from two dimensions: the surface thermal environment and the morphological persistence of ecological land. The assessment of the surface thermal environment was based on the Landsat 8 Collection 2 Level-2 Land Surface Temperature product acquired on 26 August 2025 to characterize the surface thermal conditions of the fringe belts. Cloud, cloud-shadow, and invalid pixels were removed using QA_PIXEL, while ST_QA was further applied for quality control. Pixels with uncertainties greater than 7 K were excluded, resulting in 99.34% of the data being retained as valid observations. Land surface temperature was converted from ST_B10 to degrees Celsius using the standard scaling coefficients provided by the USGS. Fifteen non-overlapping distance bands, each 100 m wide, were constructed from 0 to 1500 m outside the fringe-belt boundary. All 30 m pixels that passed quality control within each buffer zone were statistically analyzed to calculate COUNT, MEAN, and STD, thereby characterizing the spatial gradient of land surface temperature within and around the fringe belts. Another component examines changes in ecological land using CLCD land-use data for 1985, 2005, and 2025. The areas and proportions of different land-use types and their changes across the three study years were calculated separately for the fringe belts and the remaining parts of the main urban area. Attention was paid to changes in farmland, green spaces, waters, and impervious surfaces to assess the morphological persistence of ecological land within the fringe belts during urban expansion.
(2)
Models for Measuring Economic and Social Functions
This study uses POI and nighttime light data to assess the economic and social functional performance of Guangzhou fringe belts between 2005 and 2025. POIs are classified into economic and social categories according to their functional attributes. Their counts, densities, and growth rates are calculated within the complete fringe belt extent of each respective year to compare the relative growth of the two facility categories. Local densities are calculated using a common 100 m grid, and identical class intervals are applied to map their spatial distributions.
To ensure spatial comparability, the grid is clipped to the intersection of the fringe belt extents in the two years. Boundary cells are retained, and fragments are consolidated by grid ID to create paired units with valid data for both years. Total POI density is calculated by dividing the POI count in each unit by its actual area, while nighttime light values are extracted at representative points located within the units. Each indicator is min–max normalized using its common minimum and maximum across the pooled data from both years. The normalized indicators are then combined with equal weights to calculate comprehensive vitality, allowing comparison of its mean and changes within individual units.
In addition, the mean, standard deviation, and coefficient of variation of unnormalized nighttime light intensity are calculated for the paired units. These statistics describe the overall level of nighttime illumination, absolute differences among units, and relative dispersion, respectively, complementing the analyses of facility distribution and comprehensive vitality.

4. Guangzhou Fringe Belts: Morphological Identification and Spatiotemporal Development

4.1. Guangzhou Morphological Periodization and Expansion Boundaries

The morphological period refers to the historical stages during which the evolution of the city’s physical environment, under the regulation of specific political regimes, economic cycles, or major planning milestones, where exhibit considerable similarity in architectural styles, land-use patterns, and spatial textures. This work closely integrates macro-historical narration with spatial analysis, systematically reviewing the urban fabric of Guangzhou over its history of more than 2000 years and the process of its modernization transformation [25,26,27,28,29]. Through digital geometric correction and multi-source data cross-verification, this study creates a spatiotemporal analytical framework for the transformation of Guangzhou urban space from a closed, triple-walled defense system to a contemporary, multi-centric metropolis. The scope of fringe belts in each epoch can be defined scientifically using this framework as the morphological skeleton.
Traditional agricultural culture and maritime trade coexisted harmoniously from the late Ming and early Qing dynasties to the mid-to-late Qing dynasty, and the center core’s location remained stable for 2000 years. The Ming and Qing brick and stone city walls, the moats, the Xiguan river and canal system, and the hilly terrain of the eastern suburbs are the main sources used to define the inner fringe belt during this time. These physical boundaries constitute linear obstacles that hinder the continuous expansion of the core built-up area, guiding the early accumulation of extensive and non-residential land uses.
From the early Republic of China to the early modern era, the military defense function of traditional city walls gradually declined. The “demolishing walls to build roads” campaign launched in 1918 opened up roads on the original city wall foundations, breaking the three-tiered city defense pattern [30]. The Lanhu typhoon shelter, the Pantang water system margins, the planned road construction lines, and contemporary railway all became spatial boundaries during this time, creating new physical red lines around the old city contour and serving as the new baseline for defining the fringe belts.
In the first three decades after the founding of the People’s Republic of China (1950–1978), under the dominance of the planned economy and the principle of “production before living”, Guangzhou underwent a complete transformation of its urban functions. The red lines of external trunk roads such as Guanghua Highway, and the physical embankments of the Pearl River’s front and back channels have been extensively artificialized. Meanwhile, a large number of Danwei compounds—enclosed socio-spatial organizational forms established during the planned-economy period that integrated workplaces, residential functions, and everyday services—were constructed. Their enclosing walls created strong institutional boundaries, profoundly reshaping the spatial structure of the urban periphery.
The implementation of the paid land-use system led to a boom in commercial housing development during the period from Reform and Opening-up to the establishment of the market economy (1979–2003), which caused metropolitan space to spread from a single center into multi cluster expansions toward the east (“Eastward Advance”) and south (“Southward Extension”). In this phase, the Huangpu Economic and Technological Development Zone’s land requisition bounds, the Tianhe New District’s planning boundaries, and the ring expressway network all became edges directing the sprawl of the urban built-up area. In the meantime, ecological green wedges and the basic farmland protection lines have evolved as new limits to manage chaotic urban sprawl.
During the new urbanization and high-quality transformation period since 2004, Guangzhou has entered a stage of quality improvement characterized by multi-centric and networked structure since 2004. A complex modern edge network is created by the interweaving of the multi-core central points, the physical rail transit network and national-level ecological conservation control red lines, such as Baiyun Mountain and northern mountain massifs. These components have created unbreakable ecological barriers while encouraging axial leapfrog development for the metropolis.

4.2. Guangzhou’s Differentiated Fringe Belts: Their Evolutionary History and Spatial Delineation

(1)
Spatiotemporal Changes in the Inner Fringe Belt
The morphological origins of the Guangzhou inner fringe belt can be traced back to the completion of the Ming and Qing city walls and their surrounding defensive open spaces. In the early Qing era, the Xiguan plain, as the hinterland outside the city walls, had a crisscrossing network of river canals and fish ponds, which formed a natural boundary and gave birth to low-density morphological units initially composed of orchards, nurseries, religious temples, and the military training grounds of the Eastern and Northern Parade Grounds. The prosperity of the silk weaving industry and the establishment of the Shisanhang Factories in 1685 caused foreign trade activities and workshops to spread centrifugally beyond the city walls. This resulted in a drastic functional replacement of the inner fringe belt of Xiguan from agricultural fields to shops and workshops, with many plots along canals converted into commercial docks and handicraft workshops.
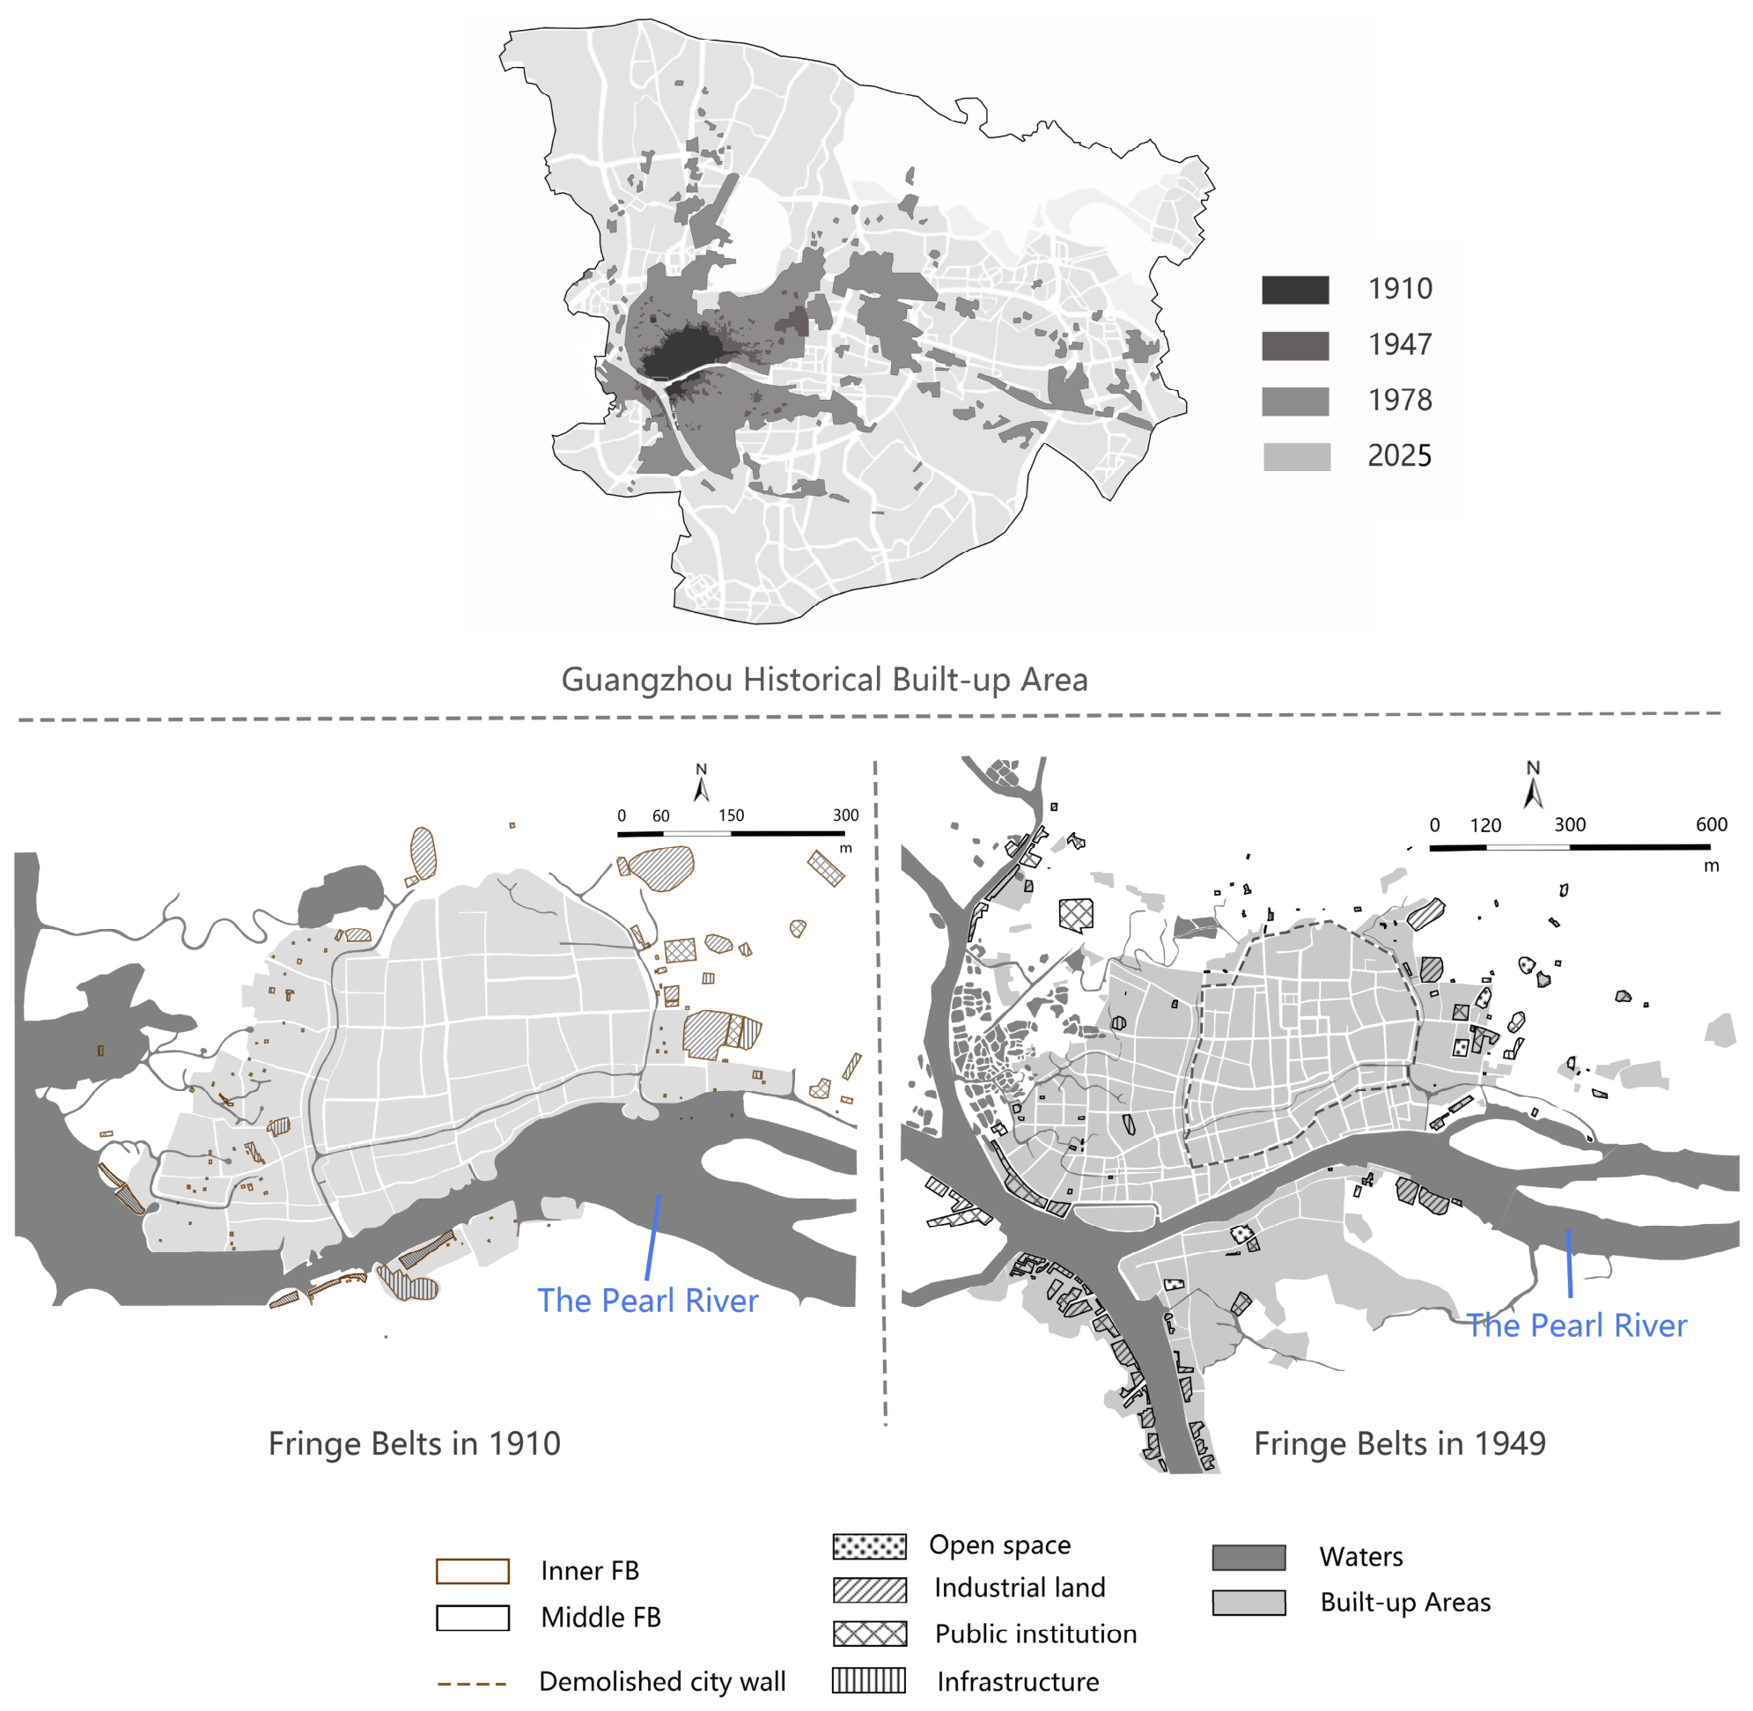
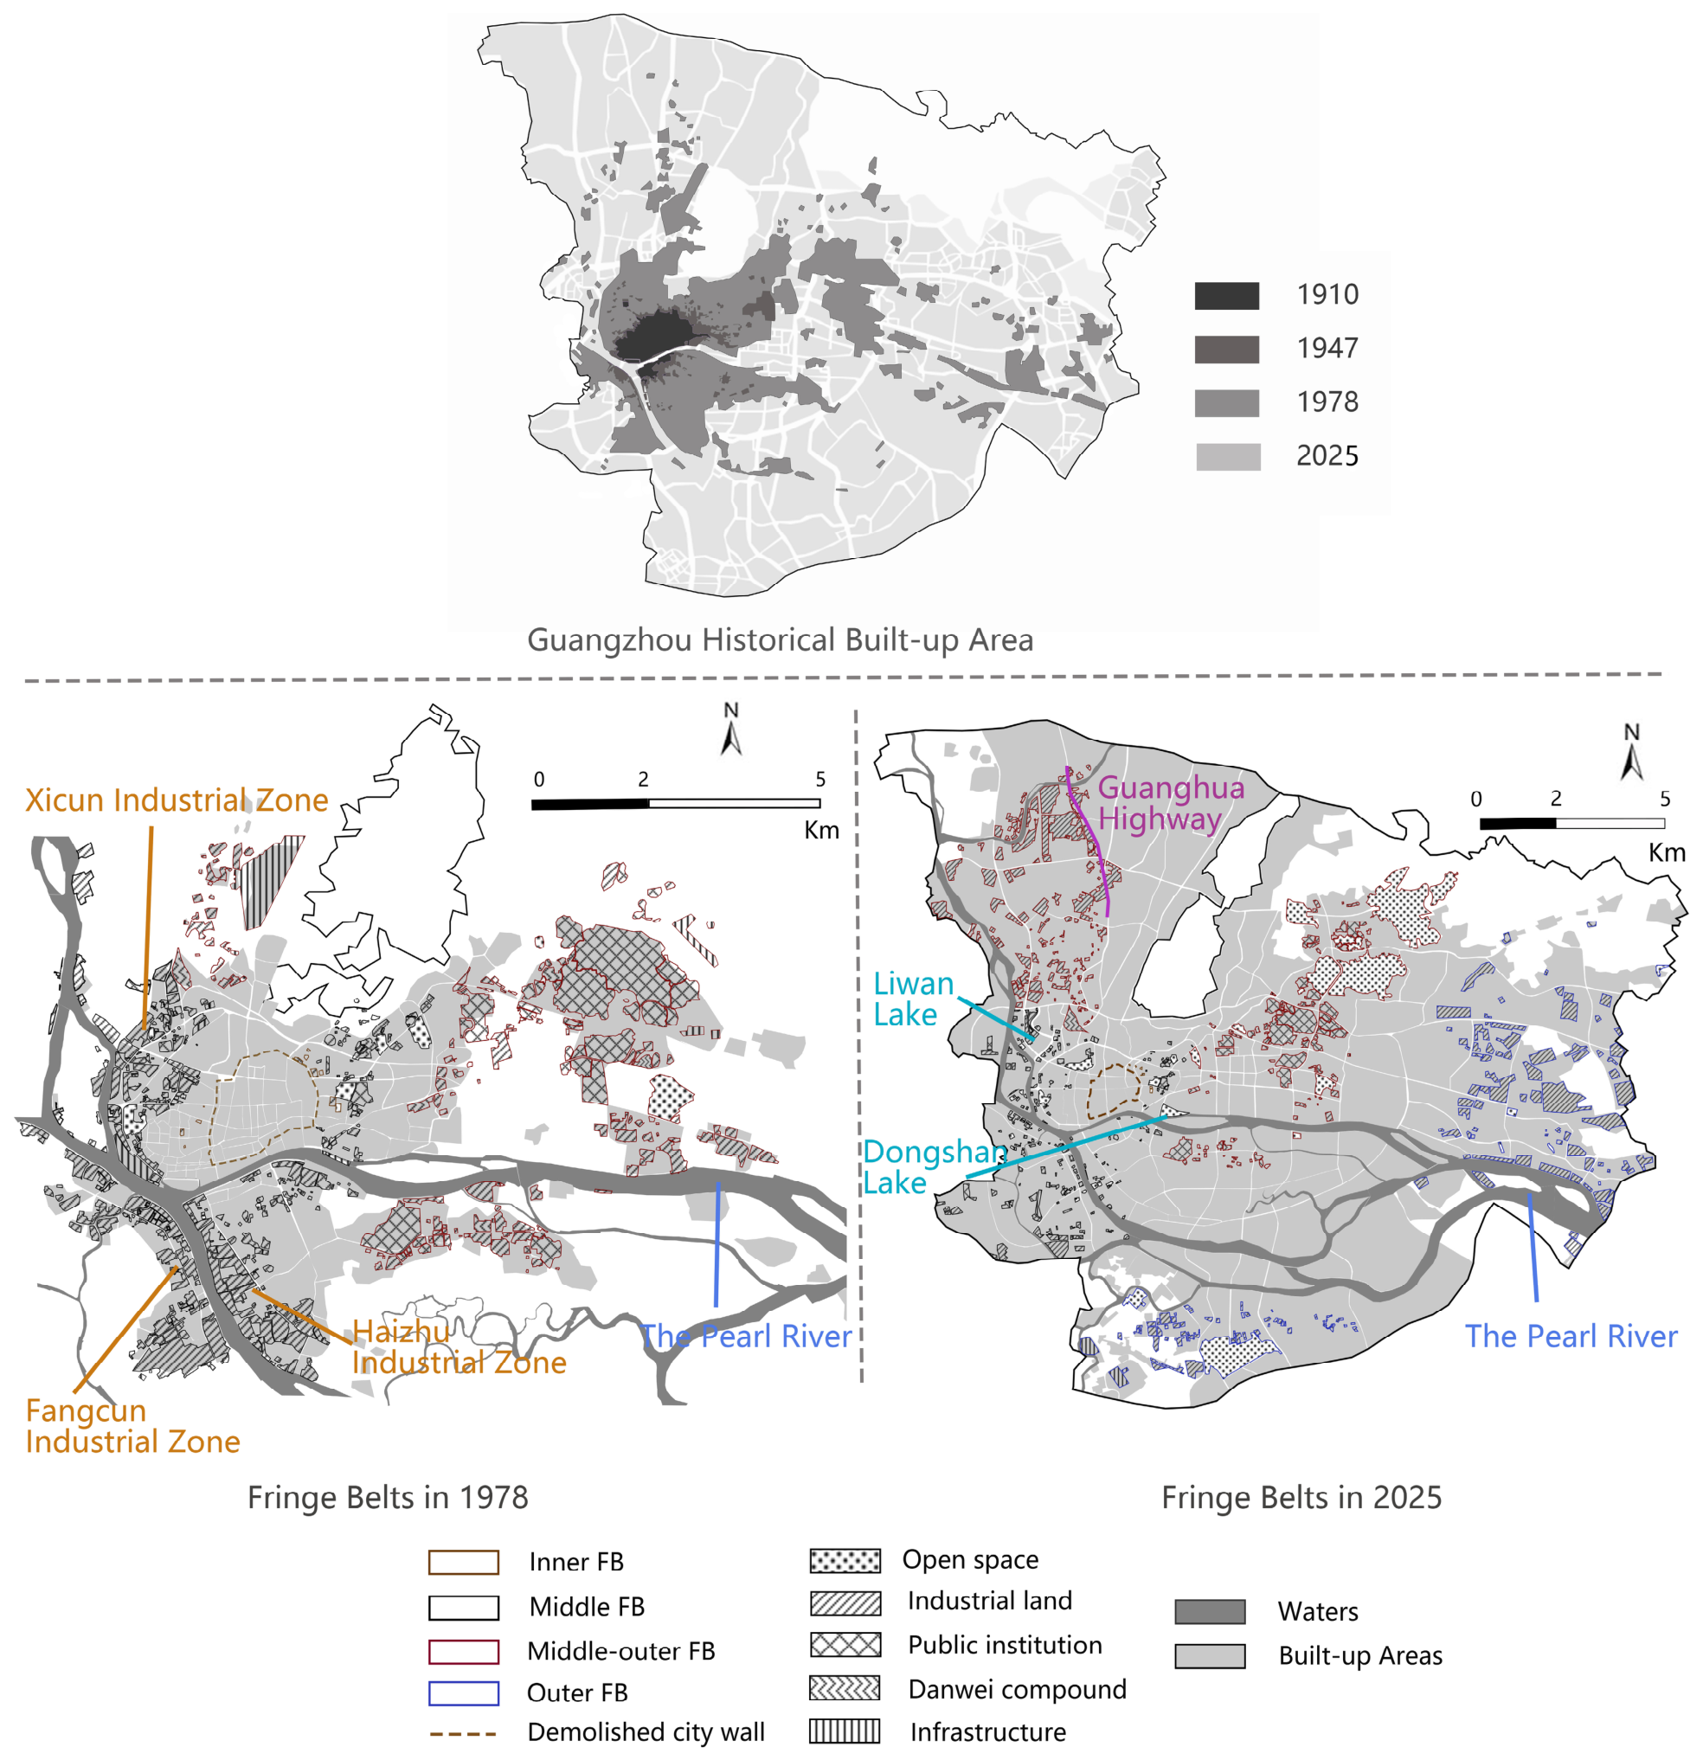
During the early years of the Republic of China and the founding of the People’s Republic of China, the inner fringe belt encountered significant changes. Prior to liberation, city walls were demolished for road development, while after the founding of the People’s Republic, urban centers became saturated and faced growing spatial constraints. High-intensity land redevelopment processes were sparked by the steepening of land-price gradients. Large expanses of extensive land along Xiguan and the Xihao River have gradually been eroded and absorbed by homogenous, high-density residential streetscapes. In contrast, public institutions in the eastern and northern suburbs, such as stadiums and nursing homes which rely on former military sites or uneven mountainous terrain, have retained their spatial characteristics intact due to their single property ownership. The original inner fringe belt plots underwent alienation over the course of nearly a century of evolution. They have almost completely been embedded and dissolved into the central core of the modern multi-core megacity, except for a few large-scale historical building complexes and religious green spaces that have survived authentically (Figure 3).
(2)
Spatiotemporal Changes in the Middle Fringe Belt
The division of the fringe belts originates from the leapfrog expansion of cities into suburban areas such as Henan during the late Qing Dynasty to the Republic of China period. The complete demolition of city walls in the early 20th century removed the physical barrier of the ancient city, and the Pearl River waterway and modern railways became the fixation lines for the growth of fringe belts. In the comprehensive industrial metropolis construction period under the governance of Chen Jitang and in the early years of the founding of the People’s Republic of China (1950–1978), which prioritized production over living, the government systematically deployed large-scale production factors in the western and southern edges of the city, successively completing the Xicun Industrial Zone, Fangcun Industrial Zone, and Haizhu Industrial Avenue Industrial Zone. Guangzhou’s first continuous belt-like fringe belt, spanning more than 10 km2, was formed by vast tracts of shipbuilding, steelmaking, chemical industries, and warehousing that spread constantly along the front and back channels of the Pearl River.
The middle fringe belt’s spatial pattern was fully developed by 1978. In addition to massive industrial units, it also encompassed large open spaces like Liwan Lake and Dongshan Lake, which were produced by voluntary citizen excavation. However, the middle fringe belt encountered previously unprecedented replacement pressures in the tide of commercialized development after the reform and opening up, with the implementation of Guangzhou “retreat from secondary industries and advance into tertiary industries” policy and industrial relocation schemes. Large-scale functional changes were made to highly accessible waterfront industrial parcels, which were soon replaced by high-density commercial areas or modern residential communities. This has led to a significant reduction in middle fringe belt in the later stages. The initially continuous industrial corridor showed high fragmentation and isolated ruptures during existing property redevelopment (Figure 4).
(3)
Spatiotemporal Changes in the Middle-Outer and Outer Fringe Belts
Between 1950 and 1971, the distribution of large-scale public infrastructure along the Guanghua Highway and the planning of the Shipai and Wushan higher education and culture zones in the eastern suburbs served as major components for the gradual establishment of the middle-outer fringe belt’s pattern. Due to the fact that this area was originally mostly wide farmlands and natural hilly forests, a sizable morphological cluster consisting of large enclosed scientific research and educational units such as South China Institute of Technology and South China Agricultural College was developed. According to data, the middle-outer fringe belt was completely dominated by governmental institutions and infrastructure land in 1978. It created a typical collage structure by relying on uneven, low-density street blocks like the Overseas Chinese Village, which was constructed in 1954. As it evolves spatially and becomes embedded as part of the city center, the public institutions on the east side of the middle-outer fringe belt maintained their original geographic locations relatively well, while the industrial land on the west side has developed northward along the upper reaches of the Pearl River, constrained by the boundaries of the farmland protection zone.
Following the 1980s, the outer fringe belt totally separated from the early concentric ring expansion mode due to the aggressive intervention of Guangzhou’s macro spatial development strategies of “Eastward Advance, Southward Extension, and Northern Optimization,” displaying notable leapfrog development characteristics of an export-oriented metropolis. Under policy guidance, the industrial clusters in the Huangpu Economic and Technological Development Zone in the east were first established in the outskirts of the city. Subsequently, the withdrawal of Panyu from being a city and its transformation into a district in the south led to intense interactions between ultra large-scale industrial and residential clusters. After 2000, the operation of the new Baiyun International Airport is locked in the outer fringe belt of the northern airport economic infrastructure. As a result, the outer fringe belt exhibits a highly dispersed spatial pattern. Table 2 summarizes the land-use composition of the identified fringe belts in 2025, it is possible to scientifically reconstruct the quantitative evolution characteristics of Guangzhou fringe belt.
The developmental features of Guangzhou fringe belts are systematically examined in this study. Through the analysis of fringe belts at the city-wide scale, the study finds that Guangzhou fringe belts have distinct hierarchical characteristics: the inner fringe belt is centered around the old city from the Ming and Qing dynasties, its formation heavily influenced by city wall remnants; the middle fringe belt is dominated by industrial corridors from the Republican to the planned economy eras, concentrated along the industrial heritage zones of the Pearl River; the middle-outer fringe belt is located in the transitional zone between newly planned area and the old city. Its spatial form is shaped by natural mountain massifs in the northern part of the city and the highway network, continuously adjusting its domain by absorbing urban ecological functions; the outer fringe belt is mainly influenced by policy regulations and emerges as an enclave at the edge of the city.
Three common types of Guangzhou fringe belts expansion are identified by the study: “leapfrog development” in the outer fringe belt, “belt-like elongation” in the middle (and middle-outer) fringe belts, and “stratified renewal” in the inner fringe belt. These different fringe belts are connected by the Pearl River channel, which functions like a bloodstream, creating an organically connected “core-periphery” spatial structure. This approach provides a unique viewpoint for developing policies related to the preservation of historic urban cores and the creation of new towns.

5. Spatial Value Analysis of Guangzhou Fringe Belts

5.1. Ecological and Natural Value of Guangzhou Fringe Belts

(1)
Fringe Belts Exhibit Favorable Surface Thermal Environmental Characteristics
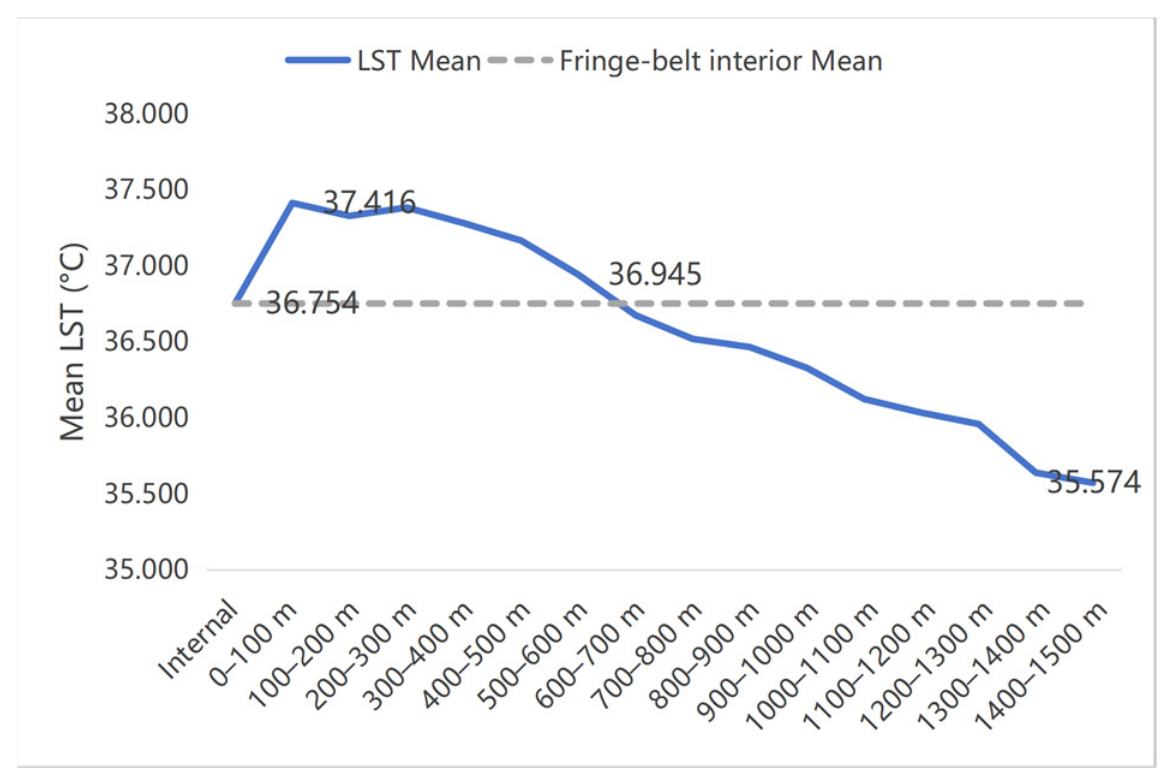
Land surface temperature (LST) statistics for 2025 show that the mean LST within Guangzhou’s Fringe Belts was 36.75 °C, lower than the 37.42 °C recorded in the adjacent 0–100 m buffer zone. Mean temperatures across the 100–500 m buffer zones also remained higher than those within the Fringe Belts, before declining to 36.94 °C in the 500–600 m zone. Overall, fringe belts exhibited relatively lower surface temperatures within an approximately 600 m surrounding area, indicating a certain degree of local thermal environmental advantage (Figure 5).
Guangzhou fringe belts themselves contain substantial green space and low-density open areas, while their surrounding zones span areas of varying development intensity and urban location. The combined effects of these ecological spatial elements contribute to the thermal characteristics of fringe belts, enabling them to retain a certain degree of ecological regulation capacity within the high-density urban environment.
(2)
Green Spaces in the Fringe Belt Demonstrate Strong Morphological Resilience in the City
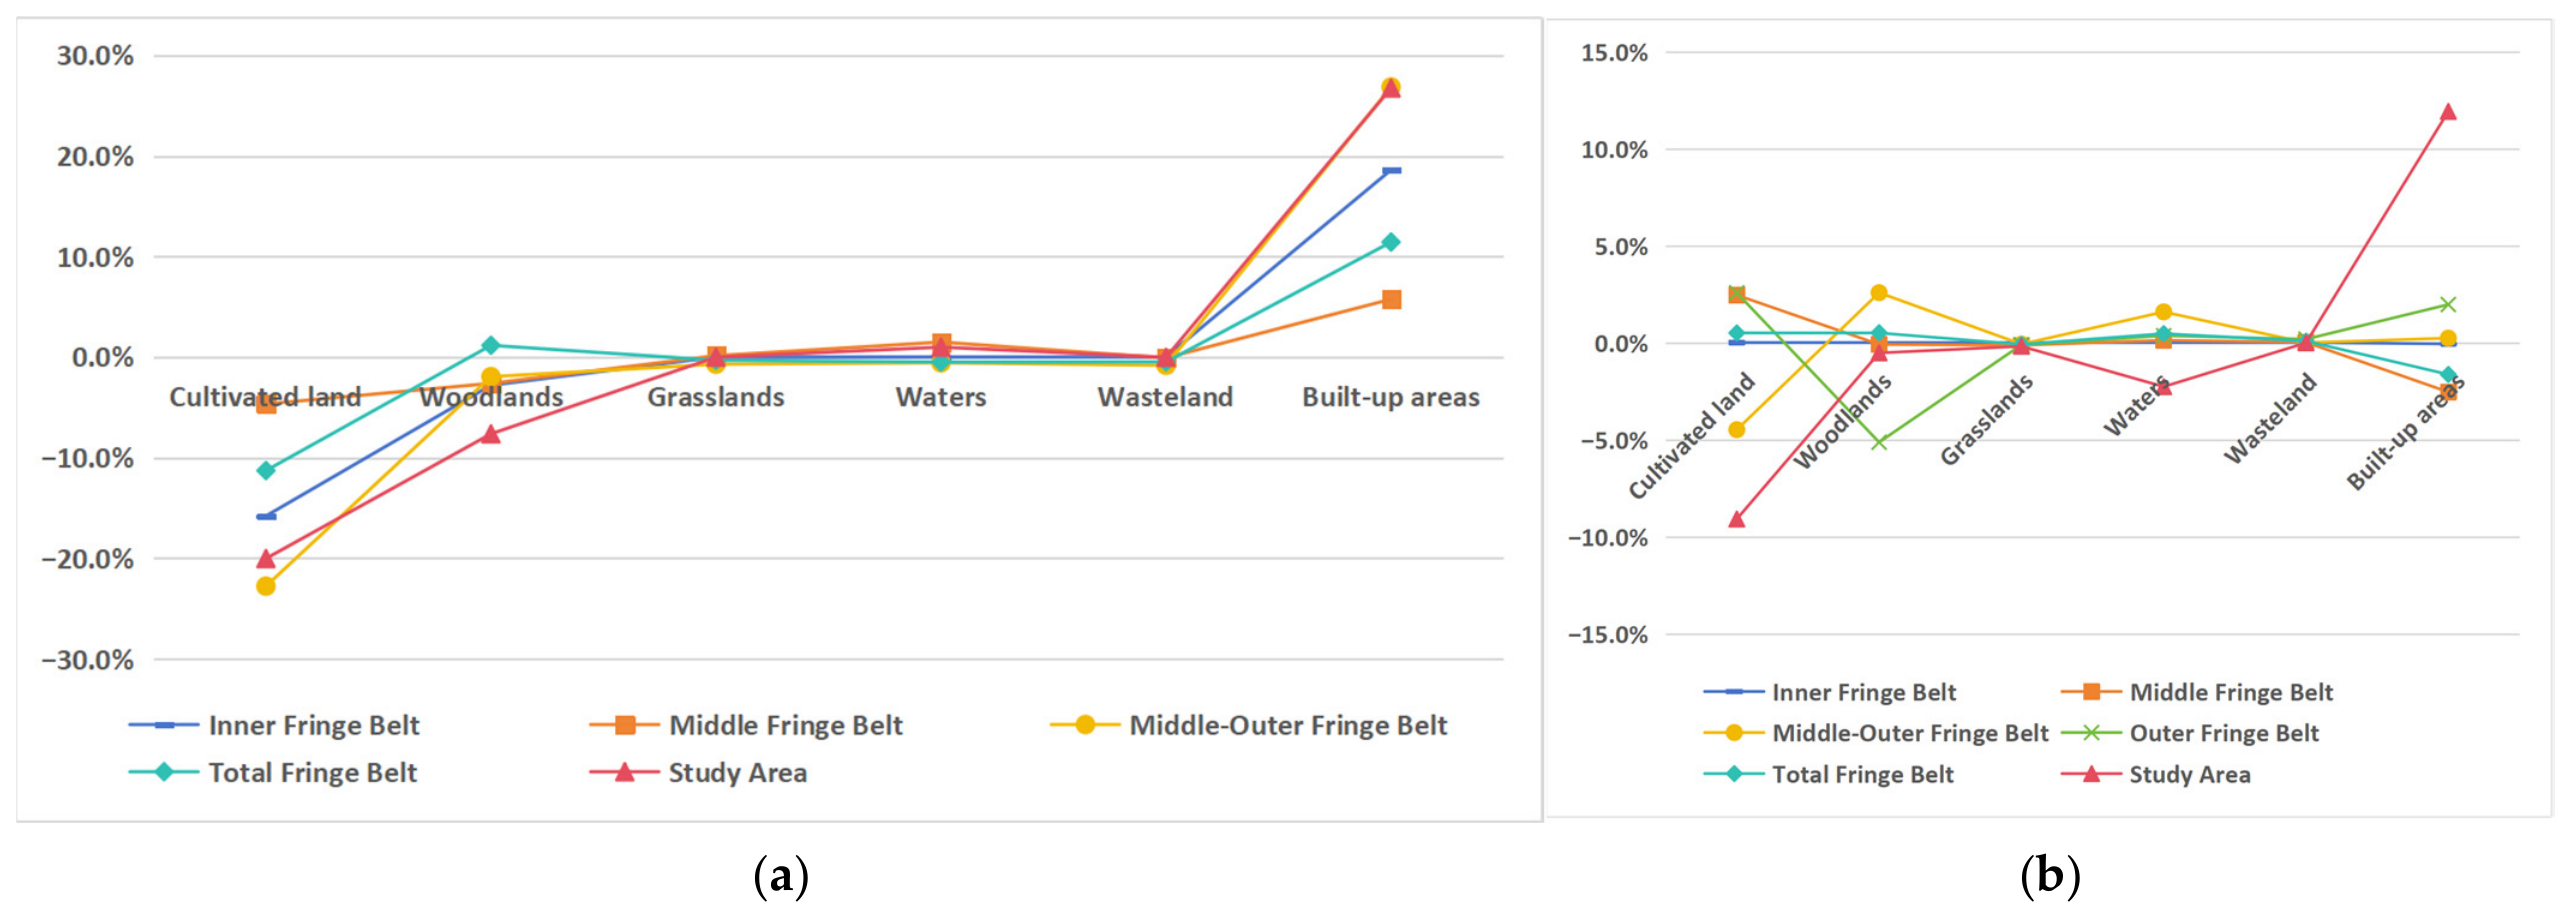
The evolution of land structures in the central core vs. the outlying belts exhibits different matrix substitution and ecological locking characteristics, according to an analysis of the interannual fluctuations in land-use data across both areas. Cultivated land in the central core steadily decreased by almost 10% between 1985 and 2025 as a result of passive conversion into construction land through unsustainable growth, which led to a dramatic increase in the percentage of impervious surfaces. Nonetheless, a distinct morphological stability appeared in the several fringe belt levels, where the amount of land-use change was consistently less than that of the entire studied region. This provides compelling evidence that the fringe belts’ big institutions and designated green areas have great property-right stability and functional continuity, which enable them to successfully fend off the fragmented degradation caused by real estate development.
Water resources within the fringe belts showed a steady or even slightly increasing trend against the overall decline against the backdrop of declining cultivated land and the strict constraints of natural fixation lines like the Pearl River shipping channels and canal networks, as well as the urban “blue line” protection planning. Their function as locked “ecological patches” amid high-density urban growth is highlighted by their successful preservation. Positive indications of the “Secondary-to-Tertiary Industry Shift” and the development of an ecological society have also surfaced in the fringe belts, where industrial land is being transformed back into green areas and picturesque waterways (Figure 6).

5.2. Economic and Social Functional Performance of Guangzhou Fringe Belts

(1)
Economic Facility Clustering and Changes in Comprehensive Vitality
To ensure spatial comparability, a common 100 m grid was clipped to the intersection of the fringe belts identified in the two years. Boundary cells were retained, and fragments were consolidated by grid ID, yielding 3596 paired units with valid POI and nighttime light data for both years. Each indicator was min–max normalized using a common reference range pooled across the two years, and the normalized indicators were combined with equal weights.
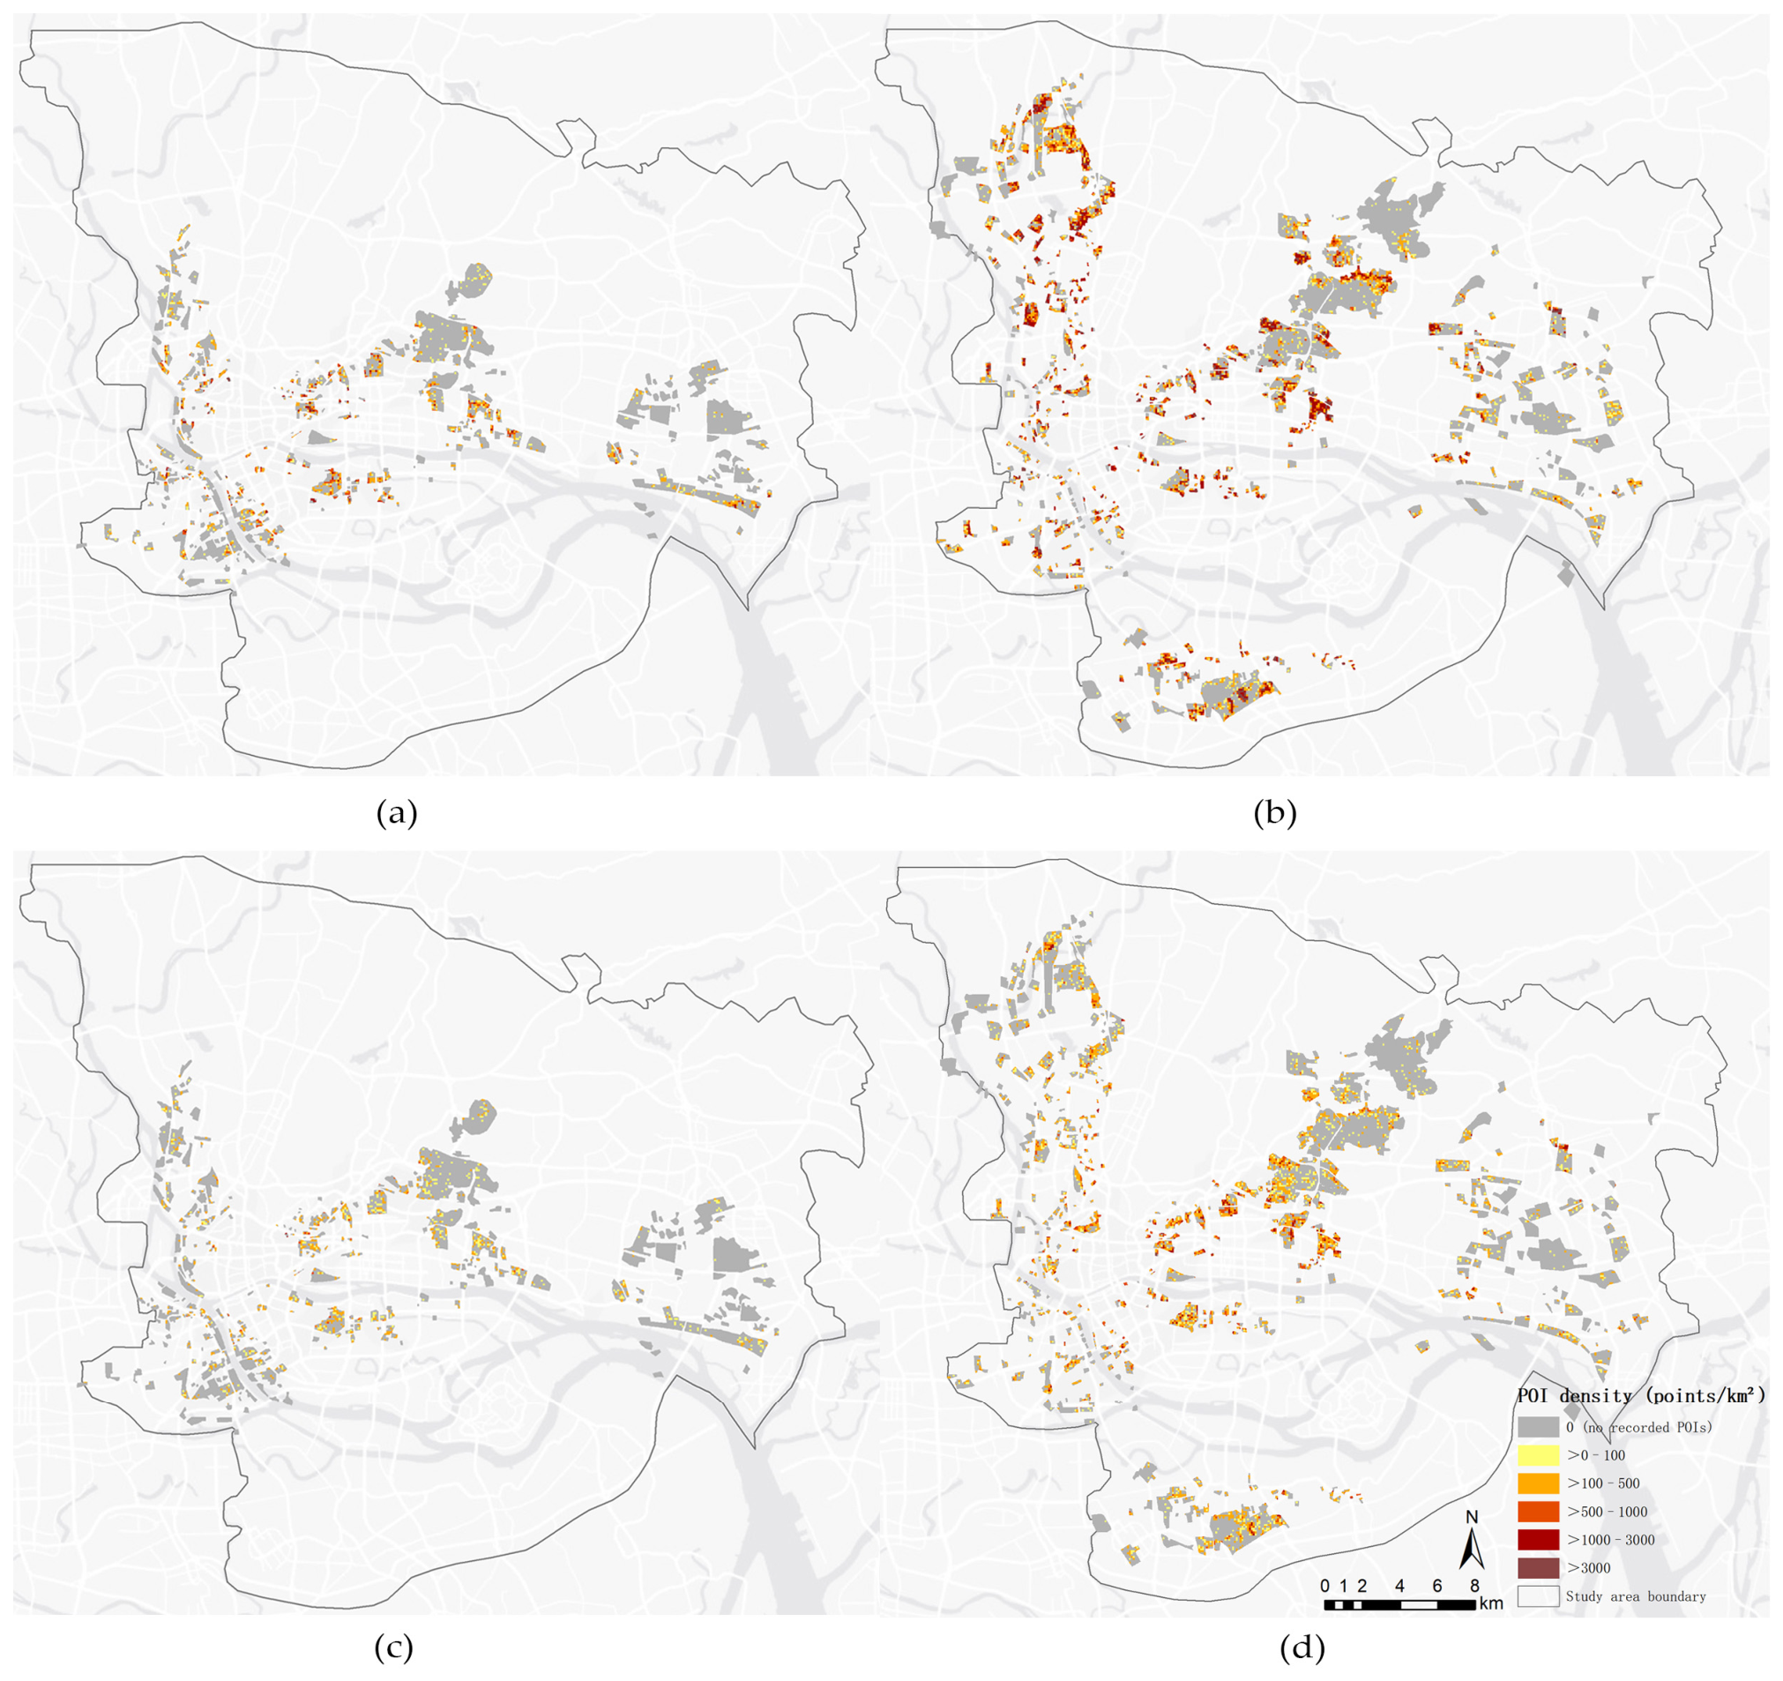
Between 2005 and 2025, the number of economic POIs within Guangzhou fringe belts increased markedly, with density rising from 93.48 to 309.80 POIs/km2. These statistics refer to the complete fringe belt extent in each respective year. In 2005, economic POIs were scattered mainly across the western, southwestern, and central parts of the study area, while some northern and eastern parcels contained fewer recorded facilities. By 2025, cells with nonzero densities covered a wider area, higher-density patches had become more numerous in the northwest and central areas, and localized clusters had emerged in the south (Figure 7a,b). Overall, Guangzhou fringe belts accommodated more economic facilities, combining a wider distribution with localized clustering. Spatial differences in growth indicate that economic functions intensified selectively, with facility-rich and low-density parcels continuing to coexist.
Mean comprehensive vitality across the paired units increased from 0.0564 to 0.1734, a rise of 207.61%, although some units experienced declines, indicating spatial variation in these changes (Table 3). Combining economic and social POIs with nighttime light data, this index represents overall socioeconomic functional performance and cannot be equated directly with economic output.
(2)
Growth in Social Facilities and Expansion of Their Spatial Distribution
Social POIs also exhibited a clear outward expansion in their distribution. Their density increased from 24.83 to 94.26 POIs/km2, with both their number and density growing faster than those of economic POIs. In 2005, social facilities were relatively scattered, and many fringe-belt units contained no recorded social POIs. By 2025, facilities had become more widespread in the northwestern, central, and southern areas, with additional scattered records in the east. Under the same density classification, higher-density patches remained less prevalent for social POIs than for economic POIs (Figure 7c,d).
The share of social facilities in the combined total of economic and social POIs increased from 20.98% to 23.33%. Their rising density and relative share indicate that Guangzhou fringe belts accommodated more social service facilities alongside economic activities. The dispersed distribution of additional facilities across multiple areas, together with localized clustering, suggests a broader spatial presence of social service functions, although facility provision remained uneven among parcels. However, growth in this category reflects recorded facility numbers and clustering and does not directly demonstrate improvements in public service accessibility, affordability, or actual use.
(3)
Increasing Nighttime Light Intensity and Internal Variation
Between 2005 and 2025, mean nighttime light intensity across the 3596 paired units increased from 10.44 to 31.84, indicating an overall rise in nighttime illumination within the fringe belts. Over the same period, the standard deviation increased, while the coefficient of variation declined from 1.03 to 0.52. Thus, absolute differences among units widened, but dispersion relative to the overall mean decreased. Changes in nighttime light therefore combined overall brightening with reduced relative variation.
These results indicate that differences in nighttime illumination within the fringe belts did not increase proportionately with the overall rise in brightness. However, summary statistics alone cannot establish whether this growth was concentrated in particular parcels or extended along a specific spatial direction.
Therefore, the functional evolution of fringe belts should not be interpreted as a simple transition from peripheral land to uniformly intensified urban space. Rather, internalization and land reuse have produced a more heterogeneous functional structure characterized by differentiated daily rhythms. The classification represents the relative relationship between standardized POI intensity and nighttime light intensity and should not be interpreted as direct measurements of actual facility use or nighttime consumption.

6. Conclusions and Discussion

6.1. Key Findings

This study first identifies four fringe belts structures within the main urban area using historical maps and satellite pictures of Guangzhou and a long-sequence historical retrospective. The Guangzhou fringe belts have strong hierarchical features and are tightly controlled by both natural and artificial fixation lines. The Ming and Qing ancient city core is the center of the inner fringe belt, which displays stratified renewal because of residential encroachment and capitalization before being internalized and assimilated. The Pearl River’s primary shipping channel and contemporary transportation arterial right-of-way lines connect the middle and middle-outer fringe belts, which exhibit linear extension features through industrial corridors and Danwei compounds. Driven by urban planning policy, the outer fringe belt presents a distinct enclave pattern of leapfrog expansion in the urban periphery, serving as a carrier for enormous open areas, large transport facilities, and high-tech industrial parks.
Secondly, fringe belts, together with the natural fixation features on which they are anchored, such as waters and mountains, form composite spaces with notable ecological value and exhibit relatively favorable local thermal environmental conditions within high-density built-up areas. Although extensive surface imperviousness in metropolitan areas has contributed to the degradation of ecological functions, natural patches within Fringe Belts have been relatively well-preserved owing to stable land tenure and regulatory controls such as ecological redlines.
Thirdly, changes in the economic and social functions of fringe belts combined a broader distribution of facilities with localized clustering. Between 2005 and 2025, the densities of both economic and social POIs increased markedly, alongside a rise in the relative share of social facilities. Comprehensive vitality and mean nighttime light intensity both increased within the area common to the two years, indicating that Guangzhou fringe belts accommodated more economic activities and social service facilities, although functional performance continued to vary among parcels.

6.2. Theoretical Contributions

The findings of this study are consistent with the classic fringe belts research of the Conzenian School, and also present important differences caused by the natural geography and institutional environment of Guangzhou. On the one hand, the formation and transformation of Guangzhou fringe belts are closely related to fixation lines, morphological periods, internalization, and land reuse. This indicates that the historical morphological framework established by the Conzenian School is still applicable in high-density megacities in China. On the other hand, Guangzhou has not formed the regular inner, middle, outer fringe belts structure commonly seen in classic cases, but has formed a non-concentric spatial pattern with four levels coexisting, showing characteristics such as strip extension and enclave transition. The existence of such differences indicates that the formation mechanism of the fringe belts has undergone spatial reconstruction under the influence of strong planning intervention, Danwei allocation, infrastructure investment, property rights boundaries, and other factors.
From an ecological perspective, the findings of this study are broadly consistent with those of previous studies, that is, green spaces, waterfront spaces, campuses, public institutions, and other low-density land with concentrated distribution in fringe belts may still maintain certain ecological and landscape functions after internalization. The fringe belt has ecological potential [14,15,16,17]. Another study suggests that urban green spaces often exhibit local low-temperature characteristics, and the spatial differences in LST are influenced by various factors such as land cover, vegetation, water bodies, urban form, and observation scale. Micro urban form factors such as street greening and building height can also significantly affect the local thermal environment [31,32,33]. For Guangzhou, these quantitative results further support the view that the natural patches within fringe belts exhibit relatively strong morphological continuity, presenting relatively favorable local thermal environment characteristics. However, the research results in Guangzhou also limit the existing studies on the ecological significance of fringe belts. The ecological and environmental performance is not evenly distributed across all marginal plots, but mainly concentrated in water bodies, green spaces, and relatively continuous open spaces. Industrial and post-industrial land may have significantly different environmental characteristics. Similarly, the observed surface temperature differences between the fringe belts and adjacent areas only represent local thermal environment differences on the selected observation date, and cannot prove that the fringe belts can independently produce a universal cooling effect.
In terms of economic and social functions, existing research on fringe belts mainly focuses on historical forms, land use changes, and planning significance. Based on POI, nighttime lighting, and other multi-source data, which have gradually been used to identify the background of urban functional agglomeration and human activities [18,19,20,21], this paper innovatively combines them with the historical form recognition of edge zones, establishing a connection between the historical formation and contemporary functions of edge zones to examine the functional changes that occur after edge zones are incorporated into the internal structure of cities.

6.3. Research Limitations and Future Directions

This study still has certain limitations. On one hand, the identification of fringe belts and the reconstruction of historical evolution rely to some extent on historical maps formed under different periods, scales, and surveying standards. Differences in map projection, symbol expression, paper deformation, and scanning quality may all lead to positional errors. Although this study reduced the relevant errors through geometric correction and feature point matching, it still cannot completely eliminate the uncertainty in the reconstruction of historical boundaries and plot positions. Therefore, the boundary of the fringe belts determined based on historical maps (before 1949) should be understood as a historically interpreted morphological area, rather than a boundary with uniform cadastral accuracy. Subsequent research can combine more historical data to continuously cross validate the identification results.
On the other hand, POI and nighttime lighting are both spatial proxy indicators. The change in the number of POIs may reflect an increase in facility supply or spatial agglomeration, as well as be affected by changes in data coverage, classification standards, and digital map collection methods. Nighttime lighting data may be affected by numerical saturation, light spillover effects, sensor differences, and cross year or cross sensor calibration in high brightness central urban areas, thereby compressing differences between high-intensity areas or affecting the determination of long-term variation amplitude. Standardization and data preprocessing can improve comparability, but they cannot completely eliminate these uncertainties. Subsequent research can combine mobile data, population and employment distribution, facility capacity, travel time, and actual facility usage data, and conduct sensitivity tests using different calibration methods and weighting schemes.

Supplementary Materials

The following supporting information can be downloaded at: https://www.mdpi.com/article/10.3390/buildings16183681/s1. Supplementary Data: Land-use statistics, 2025 LST analysis, POI and nighttime-light data, and paired-grid comprehensive vitality results for Guangzhou fringe belts.

Author Contributions

Conceptualization, S.H.; methodology, S.H.; investigation, S.H.; data curation, S.H.; writing—original draft preparation, S.H.; visualization, S.H.; writing-editing, S.H.; writing—review, Y.T.; supervision, Y.T.; project administration, Y.T.; funding acquisition, Y.T. All authors have read and agreed to the published version of the manuscript.

Funding

This research was funded by National Natural Science Foundation of China grant number [42271240].

Institutional Review Board Statement

Not applicable.

Informed Consent Statement

Not applicable.

Data Availability Statement

The original contributions presented in this study are included in the article and Supplementary Material. Further inquiries can be directed to the corresponding author.

Conflicts of Interest

The authors declare no conflicts of interest.

References

  1. Whitehand, J.W.R. Fringe belts: A neglected aspect of urban geography. Trans. Inst. Br. Geogr. 1967, 41, 223–233. [Google Scholar] [CrossRef] [Scilit] [PubMed]
  2. Ünlü, T. Thinking about fringe belts: A Mediterranean perspective. Urban Morphol. 2013, 17, 5–20. [Google Scholar] [CrossRef] [Scilit]
  3. Whitehand, J.W.R.; Morton, N.J. The fringe belt phenomenon and socioeconomic change. Urban Stud. 2006, 43, 2047–2066. [Google Scholar] [CrossRef] [Scilit]
  4. Gu, K. Exploring the fringe belt concept in Auckland: An urban morphological idea and planning practice. N. Z. Geogr. 2010, 66, 44–60. [Google Scholar] [CrossRef] [Scilit]
  5. Lefebvre, H. State, Space, World: Selected Essays; Brenner, N., Elden, S., Eds.; University of Minnesota Press: Minneapolis, MN, USA, 2009; Available online: https://www.jstor.org/stable/10.5749/j.ctttsrv7 (accessed on 13 September 2026).
  6. Kropf, K. The Handbook of Urban Morphology; John Wiley & Sons: Hoboken, NJ, USA, 2017. [Google Scholar] [CrossRef] [Scilit]
  7. Whitehand, J.W.R. British urban morphology: The Conzenian tradition. Urban Morphol. 2001, 5, 3–10. [Google Scholar] [CrossRef] [Scilit]
  8. Conzen, M.R.G. Alnwick, Northumberland: A Study in Town-Plan Analysis. In Institute of British Geographers Publication 27; Philpot & Co., Ltd.: London, UK, 1960. [Google Scholar] [CrossRef] [Scilit]
  9. Conzen, M.P. How cities internalize their former urban fringes: A cross-cultural comparison. Urban Morphol. 2009, 13, 29–51. [Google Scholar] [CrossRef] [Scilit]
  10. Whitehand, J.W.R. Urban-rent theory, time series and morphogenesis: An example of eclecticism in geographical research. Area 1972, 4, 215–222. Available online: https://www.jstor.org/stable/20000692 (accessed on 13 September 2026).
  11. Whitehand, J.W.R. Building cycles and the spatial pattern of urban growth. Trans. Inst. Br. Geogr. 1972, 56, 39–55. [Google Scholar] [CrossRef] [Scilit] [PubMed]
  12. Barke, M. The changing urban fringe of Falkirk Scott. Geogr. Mag. 1974, 90, 85–97. [Google Scholar] [CrossRef] [Scilit]
  13. Whitehand, J.W.R.; Morton, N.J. Fringe belts and the recycling of urban land: An academic concept and planning practice. Environ. Plan. B Plan. Des. 2003, 30, 819–839. [Google Scholar] [CrossRef] [Scilit]
  14. Hopkins, M.I.W. The ecological significance of urban fringe belts. Urban Morphol. 2012, 16, 41–54. [Google Scholar] [CrossRef] [Scilit]
  15. Hazar, D.; Kubat, A.S. The fringe belt development process of Istanbul. In Proceedings of the 23rd International Seminar on Urban Form (ISUF), Nanjing, China, 8–10 July 2016; Available online: https://www.academia.edu/download/61111268/Proceedings_of_the_23rd_International_Seminar_on_Urban_Form20191103-127238-1rdsyu5.pdf (accessed on 13 September 2026).
  16. Zhang, Y. A spatio-temporal study of fringe belts and urban green spaces in Birmingham, UK. Urban Morphol. 2019, 23, 27–44. [Google Scholar] [CrossRef] [Scilit]
  17. Hazar, D.; Özkan, S.P. Çeper Kuşakların Kamusal ve Ekolojik Değeri: İzmir Askeri alanlar Örneği. Kent Akad. 2020, 13, 10–21. [Google Scholar] [CrossRef] [Scilit]
  18. Long, Y.; Tang, J.X. Large-scale quantitative measurement of urban street spatial quality: Progress in research. Urban Plan. 2019, 43, 107–114. (In Chinese) [Google Scholar]
  19. Wang, N.; Wu, J.S.; Li, S. Spatial characteristics of urban vitality and the mechanism of built environment impact based on multi-source data: A case study of Shenzhen. Trop. Geogr. 2021, 41, 1280–1291. (In Chinese) [Google Scholar] [CrossRef]
  20. Wang, C.G.; Wang, B.; Wang, Q.Z. Nonlinear relationship and threshold effects between urban vitality and built environment: A case study of the central core of Guangzhou. Prog. Geogr. 2023, 42, 79–88. (In Chinese) [Google Scholar] [CrossRef] [Scilit]
  21. Chen, H.; Ge, J.; He, W. Quantifying Urban Vitality in Guangzhou Through Multi-Source Data: A Comprehensive Analysis of Land Use Change, Streetscape Elements, POI Distribution, and Smartphone-GPS Data. Land 2025, 14, 1309. [Google Scholar] [CrossRef] [Scilit]
  22. Kubat, A.S. Exploring the Fringe-Belt Phenomenon in a Multi-Nuclear City: The Case of Istanbul. ICONARP Int. J. Archit. Plan. 2019, 7, 95–134. [Google Scholar] [CrossRef] [Scilit]
  23. Yang, J.; Huang, X. The 30 m Annual Land Cover Datasets and Its Dynamics in China from 1985 to 2025 (Version 1.0.5). Zenodo 2026, 13, 3907–3925. [Google Scholar] [CrossRef]
  24. Chen, Z.; Yu, B.; Yang, C.; Zhou, Y.; Yao, S.; Qian, X.; Wang, C.; Wu, B.; Wu, J. An extended time series (2000–2018) of global NPP-VIIRS-like nighttime light data from a cross-sensor calibration. Earth Syst. Sci. Data 2021, 13, 889–906. [Google Scholar] [CrossRef] [Scilit]
  25. Zeng, Z.X. Historical Geography of Guangzhou; Guangdong People’s Publishing House: Guangzhou, China, 2024; ISBN 978-7-218-17269-9. (In Chinese) [Google Scholar]
  26. Fu, C.L. (Ed.) Guangzhou Urban Development and Construction; China Social Sciences Press: Beijing, China, 1994; ISBN 7-5004-1572-9. (In Chinese) [Google Scholar]
  27. Zhou, X. The Evolution of Guangzhou Urban Morphology; China Architecture & Building Press: Beijing, China, 2005; ISBN 7-112-07262-X. (In Chinese) [Google Scholar]
  28. Xie, S.L. Research on the Protection of the Spatial Structure of Guangzhou Ancient City. Ph.D. Thesis, South China University of Technology, Guangzhou, China, 2015. ISBN 978-7-5603-7152-8. (In Chinese) [Google Scholar]
  29. Chen, D.G. The History of Guangzhou Urban Development; Jinan University Press: Guangzhou, China, 1996; ISBN 7-81029-581-0. (In Chinese) [Google Scholar]
  30. Huang, F.Y.; Qiu, J.; Zheng, L.M. (Eds.) Chronicles of Guangzhou Streets and Wards; Guangdong People’s Publishing House: Guangzhou, China, 1994. (In Chinese) [Google Scholar]
  31. Bowler, D.E.; Buyung-Ali, L.; Knight, T.M.; Pullin, A.S. Urban greening to cool towns and cities: A systematic review of the empirical evidence. Landsc. Urban Plan. 2010, 97, 147–155. [Google Scholar] [CrossRef] [Scilit]
  32. Zhou, D.; Xiao, J.; Bonafoni, S.; Berger, C.; Deilami, K.; Zhou, Y.; Frolking, S.; Yao, R.; Qiao, Z.; Sobrino, J.A. Satellite Remote Sensing of Surface Urban Heat Islands: Progress, Challenges, and Perspectives. Remote Sens. 2019, 11, 48. [Google Scholar] [CrossRef] [Scilit]
  33. Li, H.; Cai, Y.; Yang, Y.; Cai, X. Assessing the influence of urban scene characteristics on urban heat island: An interpretable machine learning approach in New York City. Urban Clim. 2025, 62, 102542. [Google Scholar] [CrossRef] [Scilit]
Figure 1. The fringe belt model in relation to building cycles, adapted from [8,9].
Buildings 16 03681 g001
Figure 2. Location of the study area in Guangzhou. The solid black lines indicate administrative boundaries, the hatched area represents the study area.
Buildings 16 03681 g002
Figure 3. Evolution of Guangzhou and its fringe belts (1910, 1949).
Buildings 16 03681 g003
Figure 4. Evolution of Guangzhou and its fringe belts (1978, 2025).
Buildings 16 03681 g004
Figure 5. Mean LST by distance from the fringe belt.
Buildings 16 03681 g005
Figure 6. Changes in the proportion of different land-use areas: (a) From 1985 to 2005; (b) From 2005 to 2025.
Buildings 16 03681 g006
Figure 7. Spatial distribution of economic and social POI densities within Guangzhou fringe belts in 2005 and 2025: (a) economic POIs, 2005; (b) economic POIs, 2025; (c) social POIs, 2005; (d) social POIs, 2025.
Buildings 16 03681 g007
Table 1. Layer-specific criteria for Guangzhou fringe belts. Panel (A) Formation and morphology. Panel (B) Identification criteria.
(A)
LevelFormation PeriodFixation Lines and SupportsDominant Land UsesMorphological Characteristics
InnerLate Ming–Qing; formed by the early Qing; gradually disappeared during twentieth-century expansionMing–Qing walls and moatsReligious and military institutions; parade grounds; orchards and nurseries; parks; public institutionsDiscontinuous low-density plots around the walled core; later renewal, fragmentation, and residual enclaves
MiddleLate Qing–1978; consolidated under the planned economyPearl River waterways; modern railwaysShipbuilding, steelmaking, chemical industries, factories, warehouses, port uses, and urban lakesInitially a continuous riverside industrial belt; later fragmented and functionally replaced
Middle-outerMainly 1950–1978; principal structure established in 1950–1971Guanghua Highway and other arterial roads; northern mountains; basic farmland boundaries; policy supportUniversities and research institutes; public institutions; Danwei compounds; infrastructure; industrial landLarge enclosed Danwei sites and irregular low-density plots; collage or mosaic structure; strong institutional persistence after internalization
OuterPost-1979, especially after 2000Development-zone and land-requisition boundaries; airport, railway, and port operational boundaries; policy supportTransport facilities; high-technology parks; open and ecological spacesDispersed, polycentric, nodal, enclave-like, and leapfrog development along metropolitan expansion axes
(B)
LevelInclusion CriteriaExclusion Criteria
InnerFormed along or beyond the walled-city edge; linked to early fixation lines; retaining identifiable plots, land uses, street relationships, or other morphological tracesDense commercial, workshop, wharf, or residential areas; central-city parks and institutions without peripheral origins; areas included solely because of proximity to former walls
MiddleIndustrial, infrastructural, institutional, or open-space plots formed at the urban edge; linked to river or railway fixation lines; later internalized with parcel or corridor morphology retainedIndustrial land unrelated to a historical urban edge; redeveloped high-density residential and commercial land
Middle
-outer
Planned-economy institutional, educational, infrastructural, or Danwei sites formed at the suburban edge; linked to roads, mountains, farmland boundaries, or institutional controls; retaining enclosed, large-plot, or low-density morphologyOrdinary gated communities, urban villages, and villas; campuses or institutions not formed at the urban edge
OuterFormed at the built-up edge; linked to recent fixation lines or expansion boundaries; continuing to constrain growth or undergoing internalization; retaining enclave, nodal, or corridor morphologyOrdinary peripheral residential and commercial development; pre-existing rural settlements and urban villages; general agricultural land; independent nature conservation areas
Table 2. Land Area in the Fringe Belts Used for Various Purposes in 2025 (km2).
InfrastructureDanwei CompoundsPublic InstitutionsIndustrial and Post-Industrial LandOpen SpaceTotal Area
Middle Fringe Belt0.650.233.638.326.0018.83
Middle-Outer Fringe Belt0.171.5313.0023.077.6345.41
Outer Fringe Belt1.280.001.3333.5812.5348.72
Total Area2.101.7617.9664.9726.16112.96
Table 3. Descriptive statistics of composite vitality within the common extent of Guangzhou fringe belts, 2005–2025.
YearSpatial MinSpatial MaxSpatial MeanMean Growth Rate (%)
200500.67240.0564
202500.57950.1734207.61
Disclaimer/Publisher’s Note: The statements, opinions and data contained in all publications are solely those of the individual author(s) and contributor(s) and not of MDPI and/or the editor(s). MDPI and/or the editor(s) disclaim responsibility for any injury to people or property resulting from any ideas, methods, instructions or products referred to in the content.