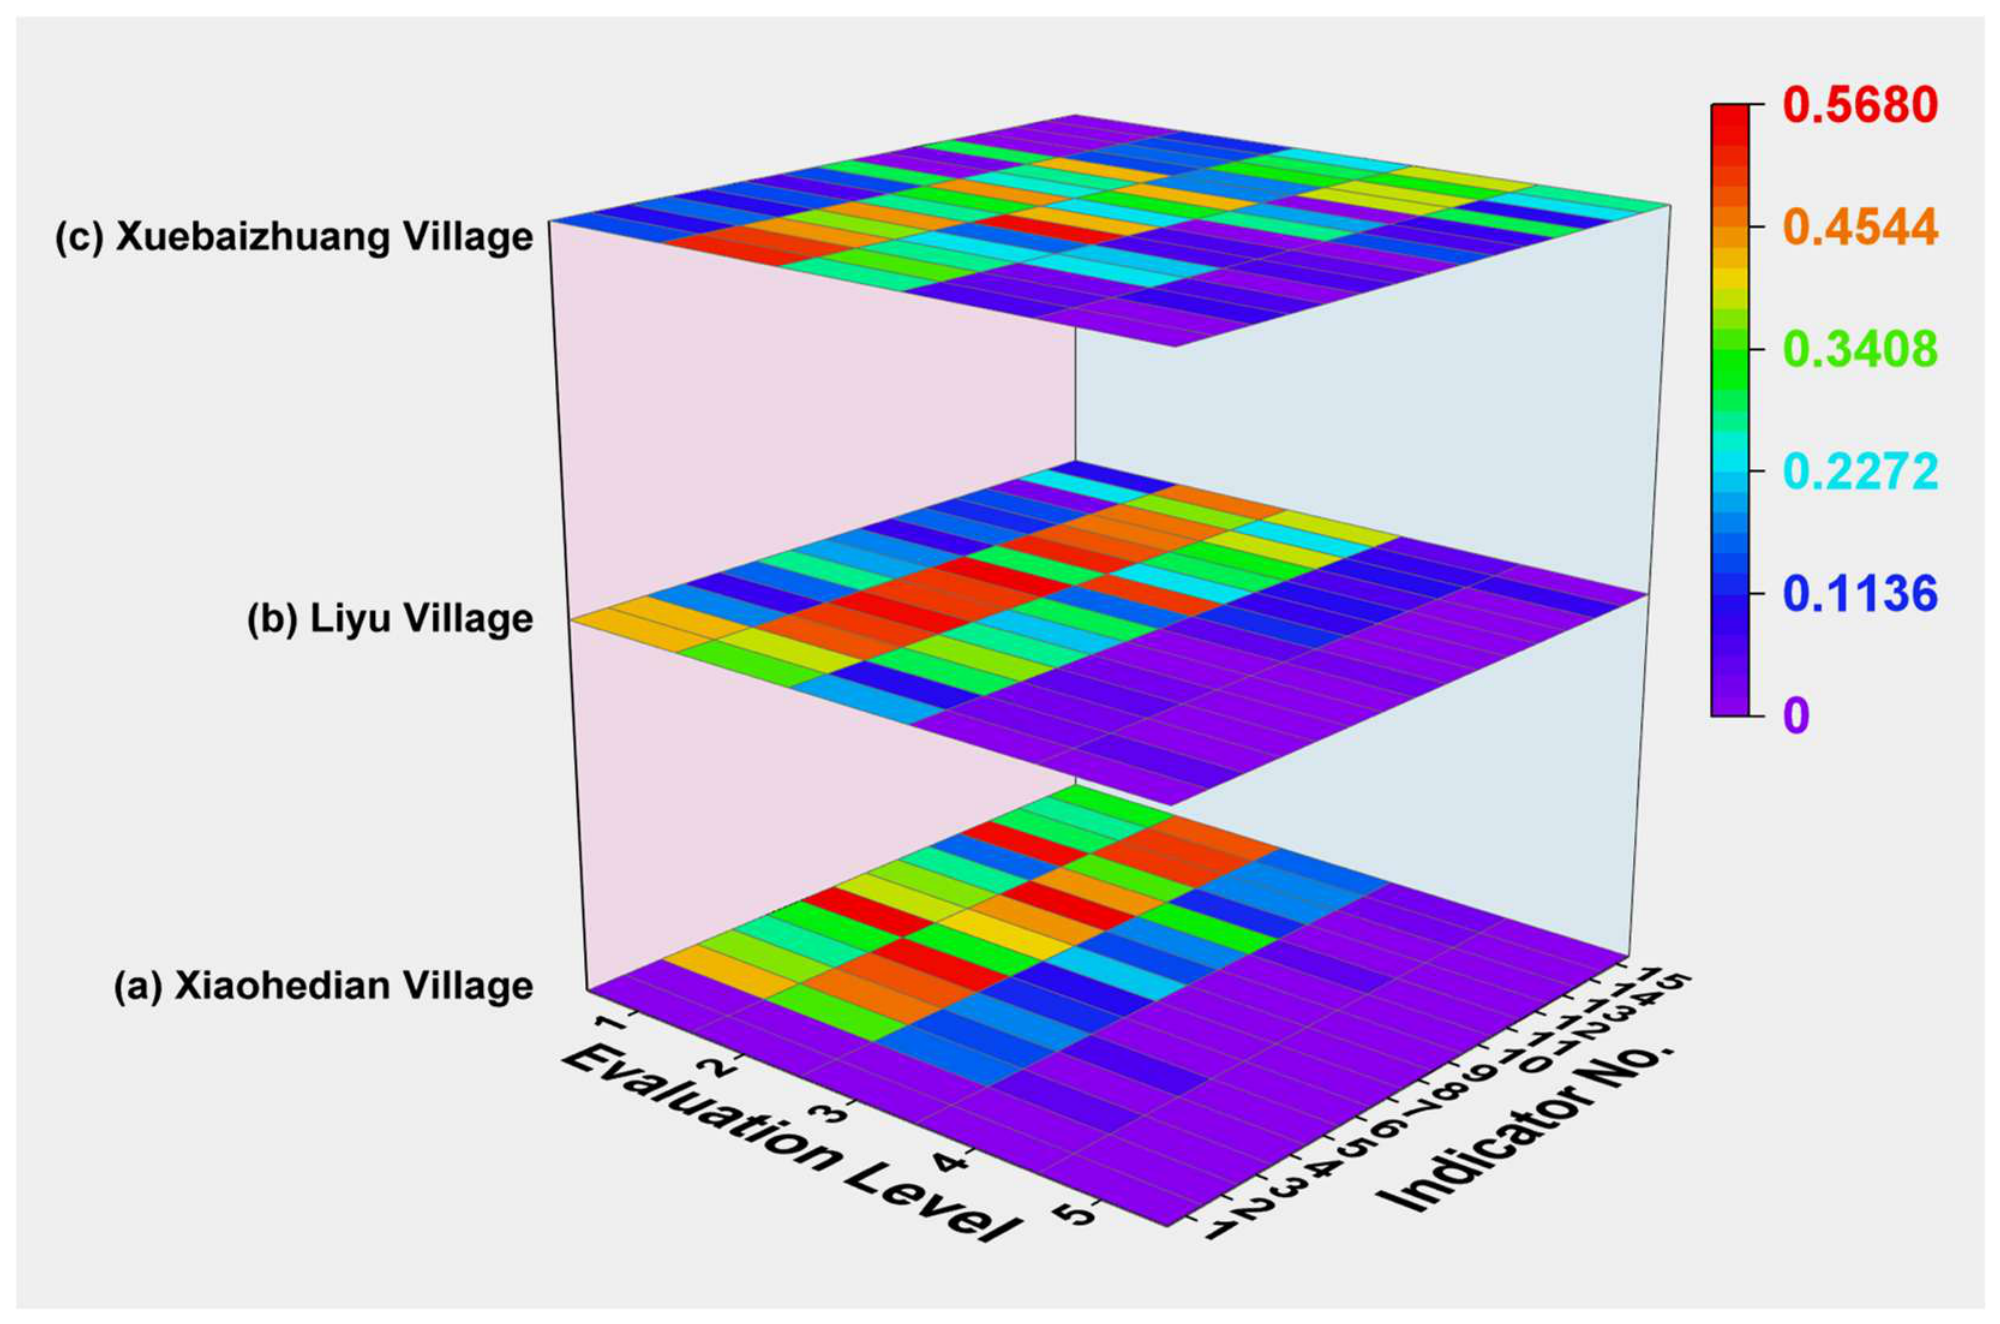
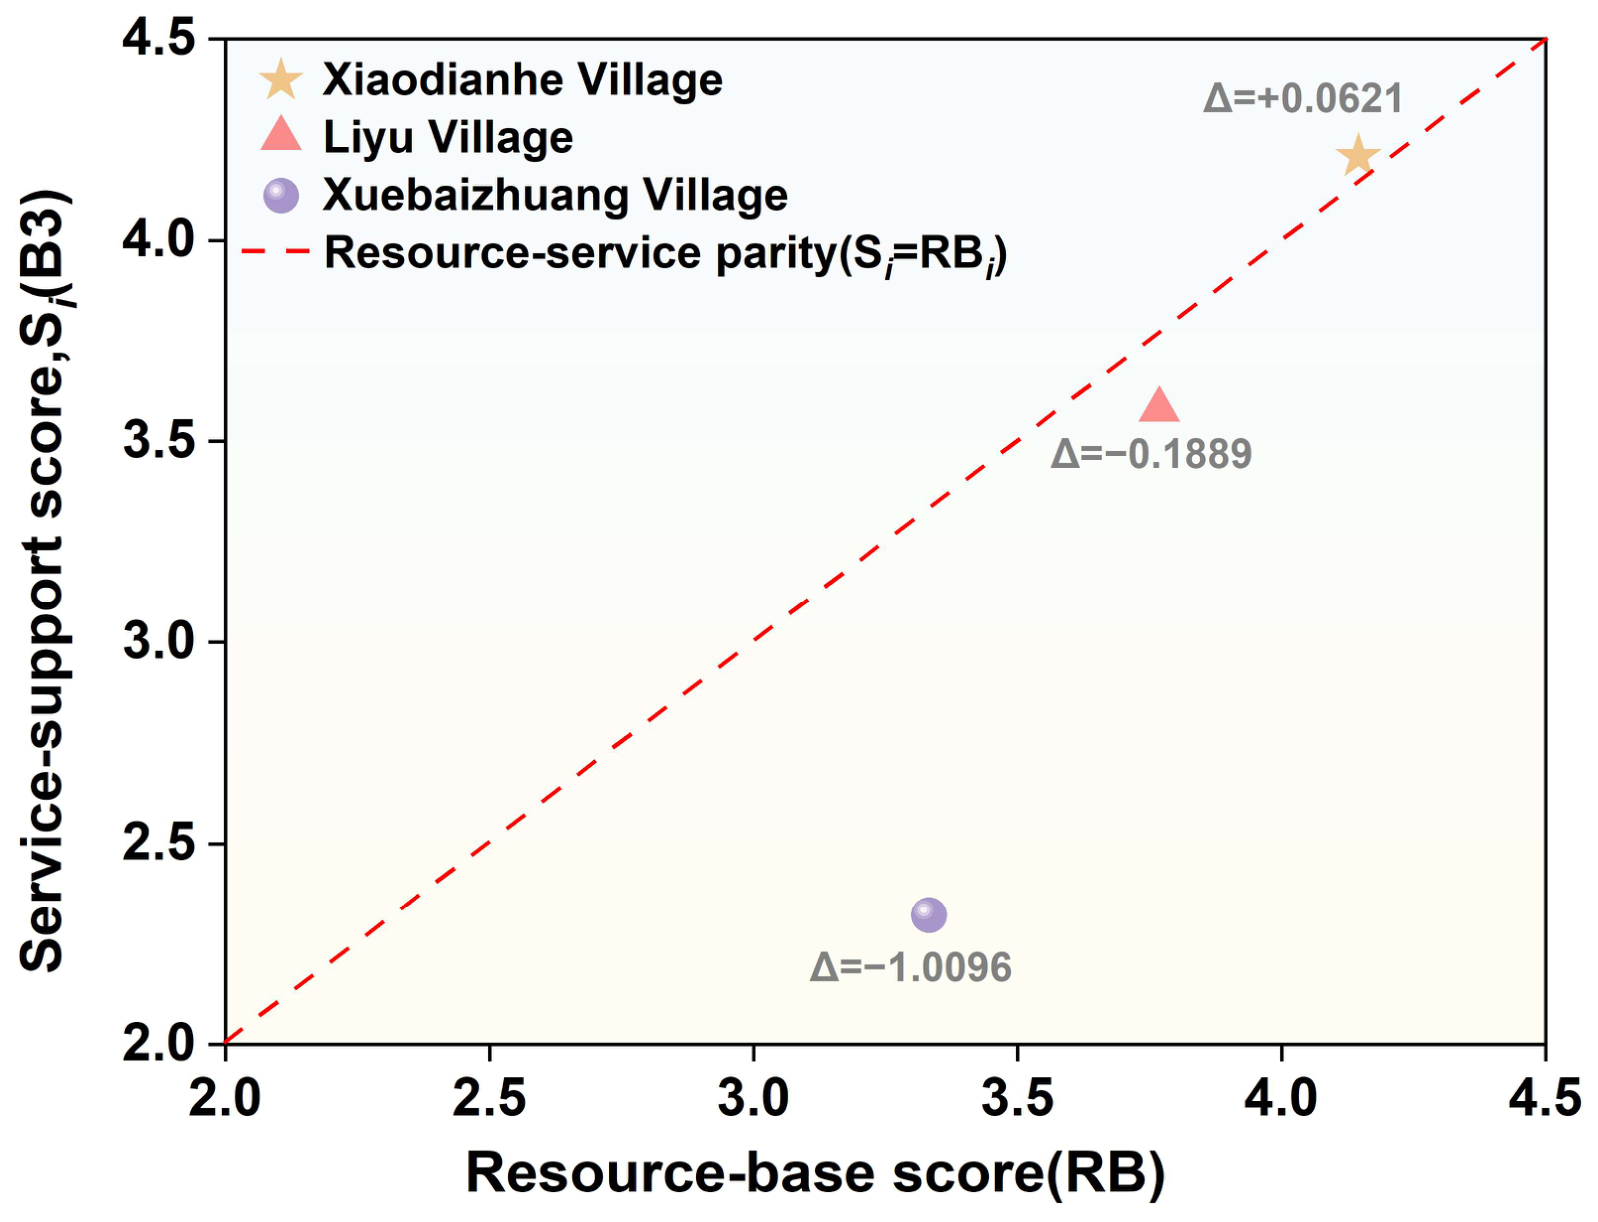
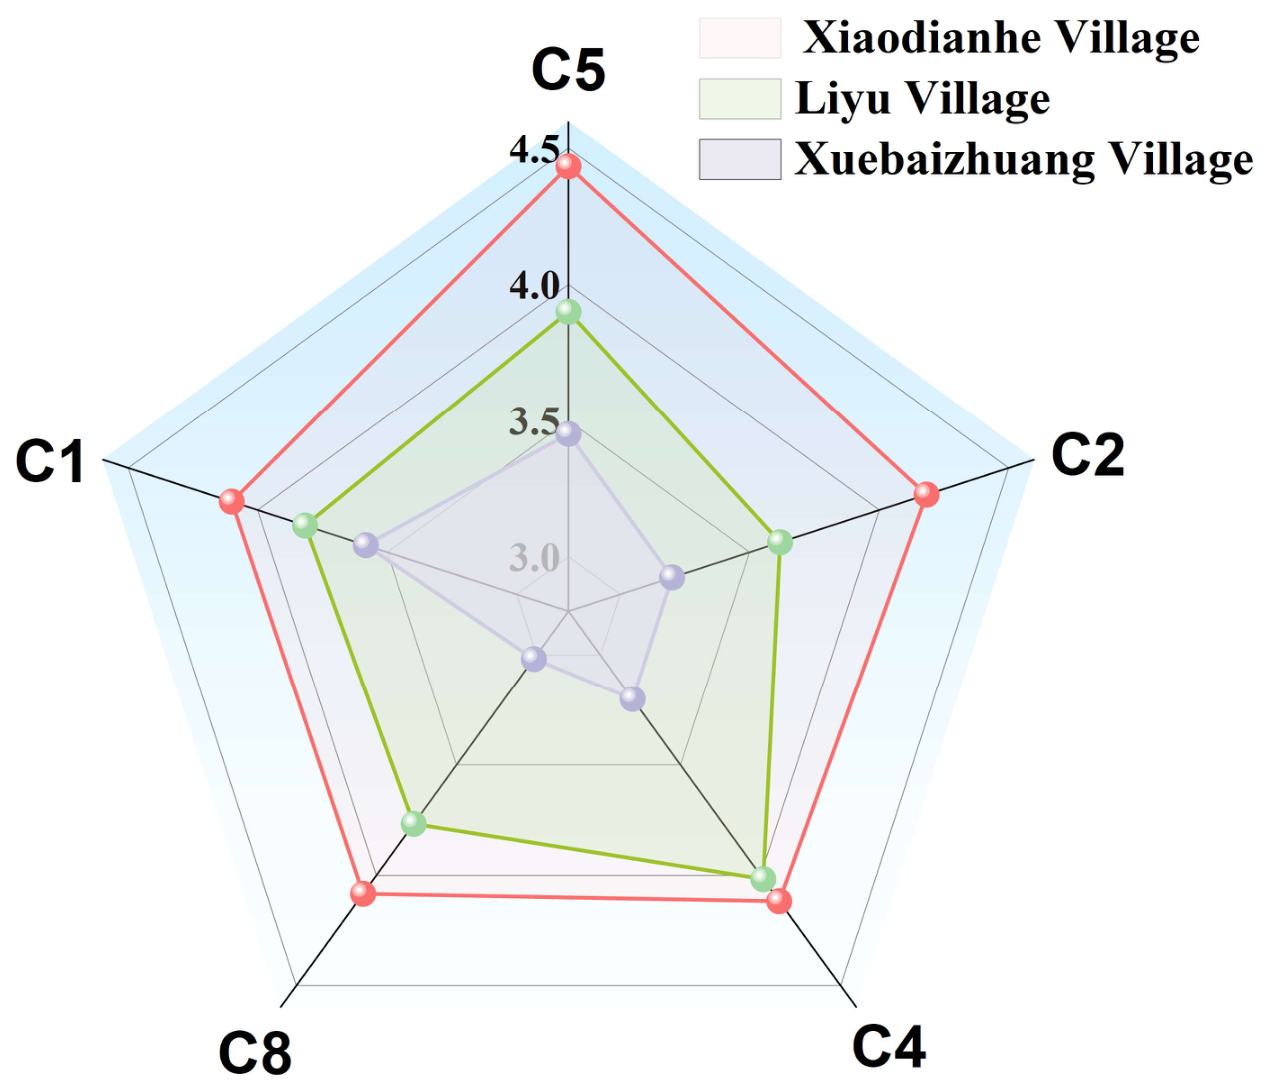
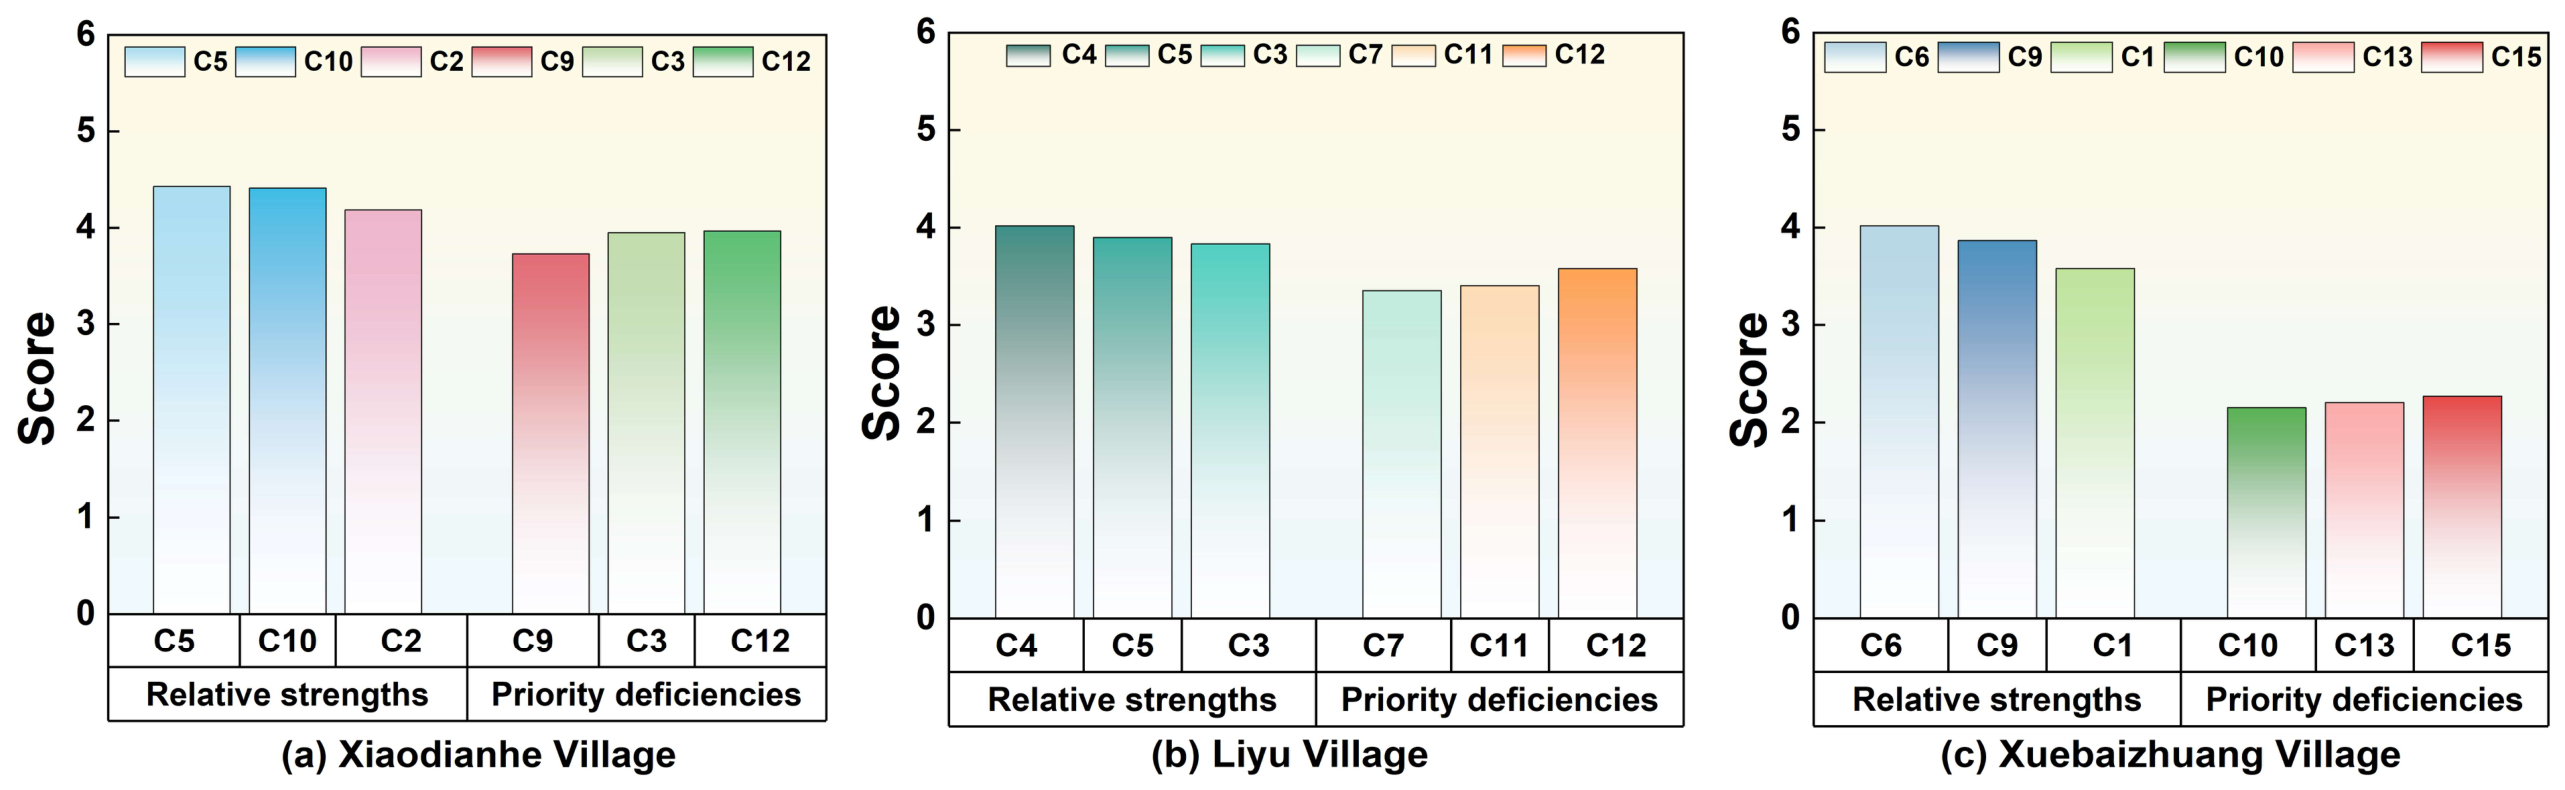
This section describes the study area, case-selection rationale, evidence sources, participant recruitment, indicator system, AHP-weighted fuzzy comprehensive evaluation, resource–service diagnostic measures, and robustness procedures. Field investigation, UAV imagery acquired using a DJI Mini 3 (SZ DJI Technology, Inc., Shenzhen, China), and resource inventories were used to operationalize and verify the assessment content, whereas expert pairwise comparisons and questionnaire ratings provided the direct numerical inputs. The UAV imagery was used primarily as visual evidence to support field verification and resource identification, and no specialized photogrammetric or three-dimensional modelling software was used for image processing. Questionnaire data organization, AHP matrix calculations, fuzzy comprehensive evaluation, resource–service diagnostic calculations, and robustness analyses were performed using WPS Office 2025 (Beijing Kingsoft Office Software, Inc., Beijing, China).
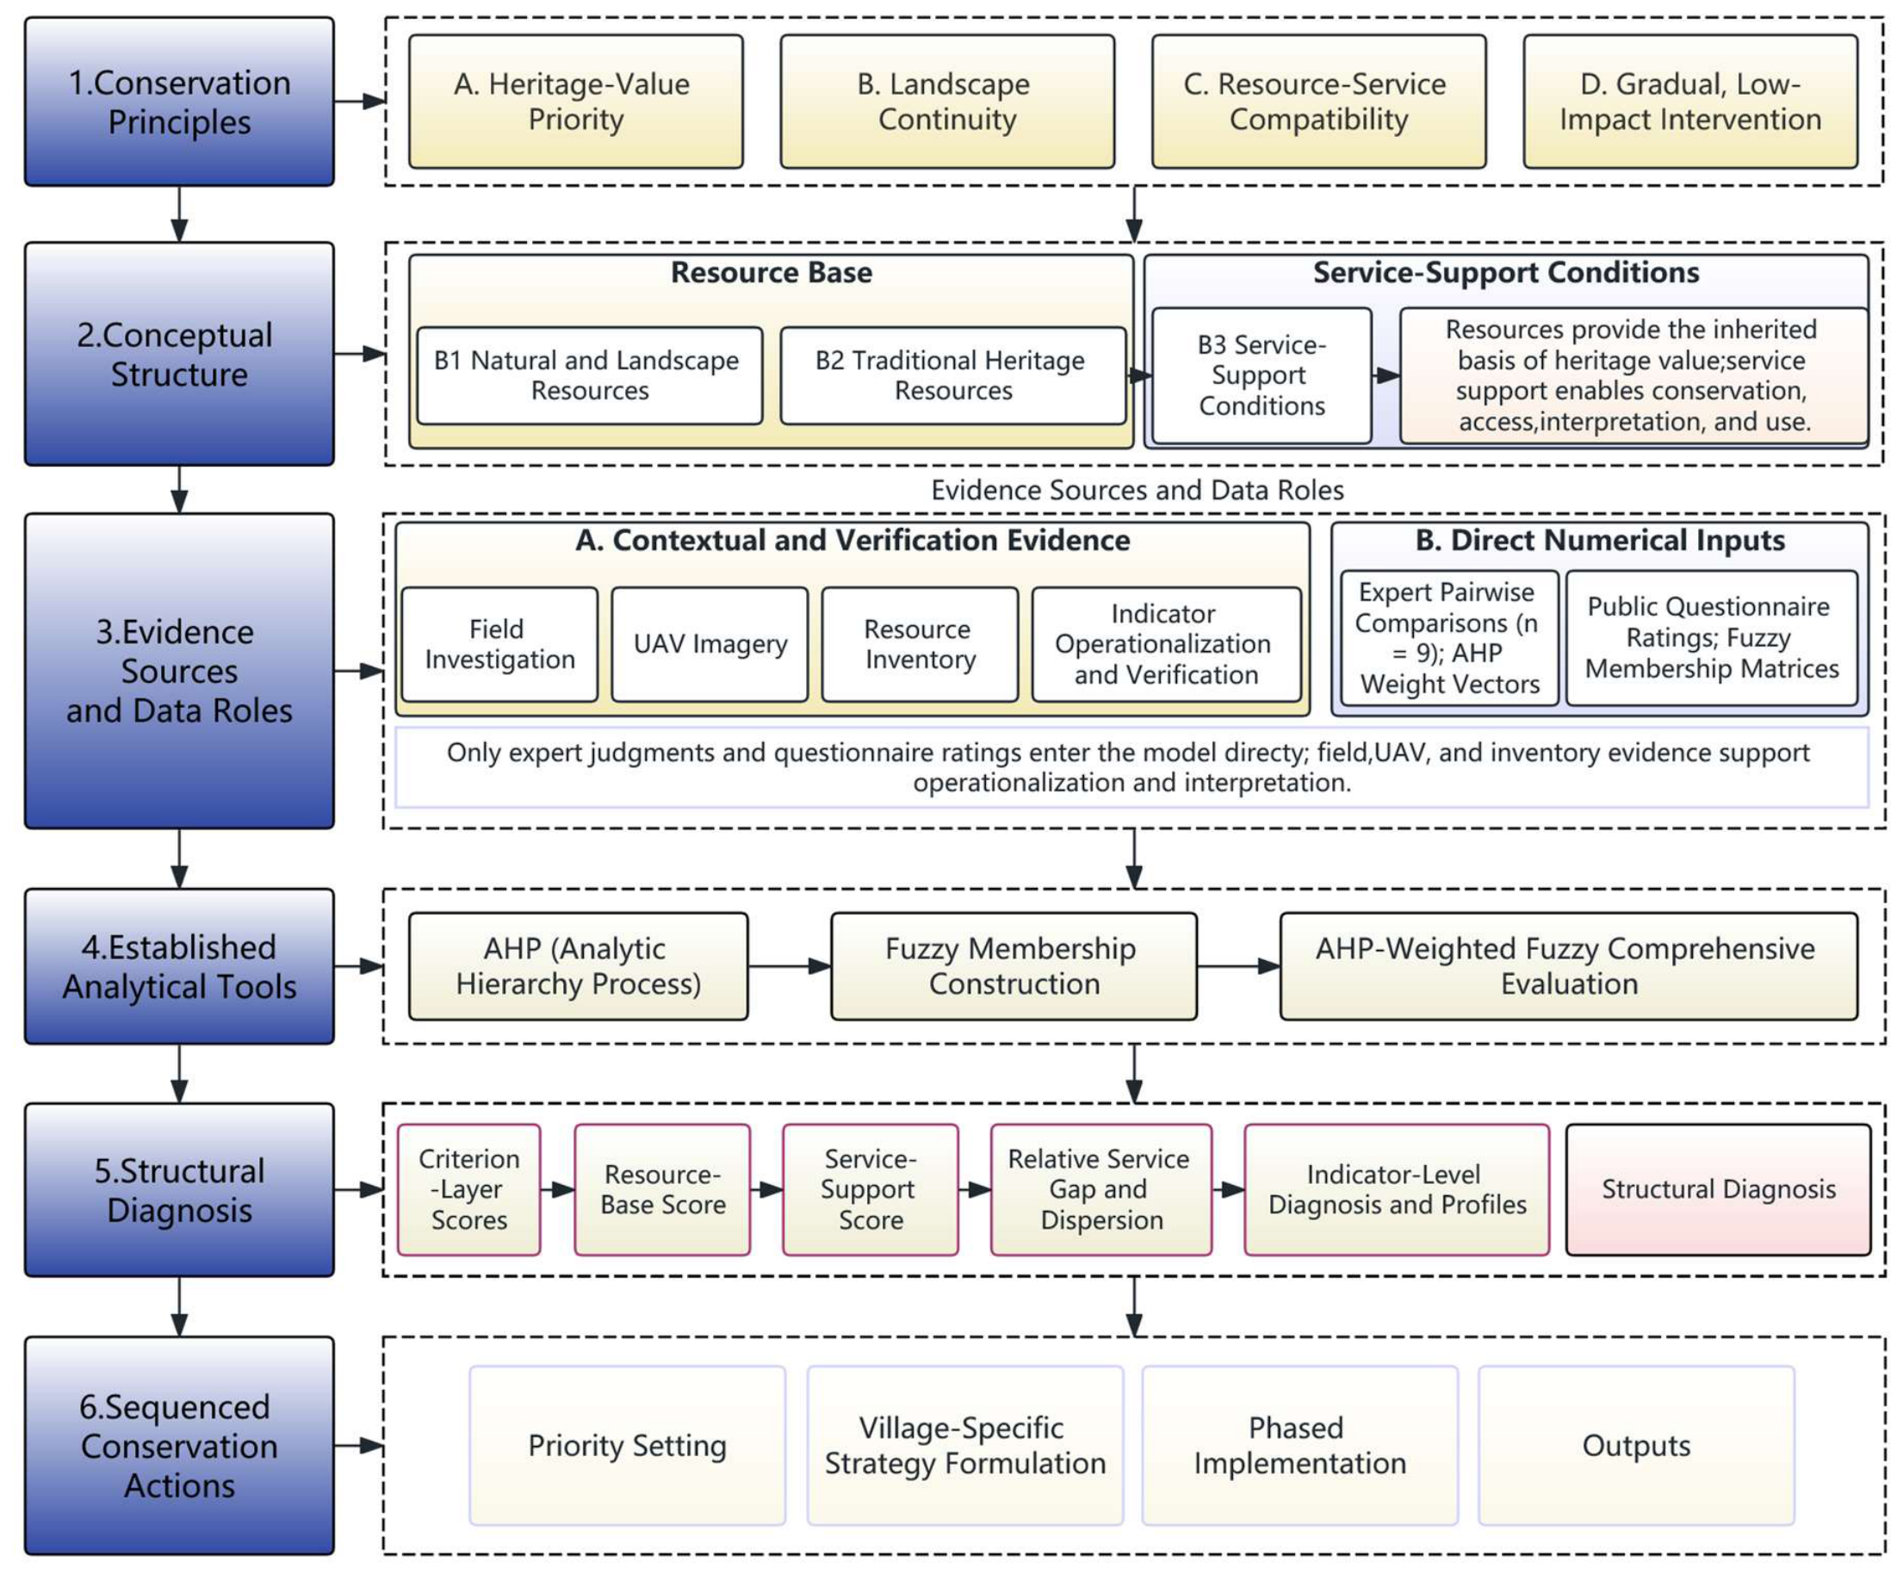
Figure 1 summarizes the analytical workflow, and the following subsections provide the information required to reproduce the case comparison and calculations.
2.1. Study Area and Case Selection
The study adopted purposive case selection rather than statistical sampling. Xiaodianhe, Liyu, and Xuebaizhuang were selected according to four criteria: (1) location within the same township and Southern Taihang mountain system, thereby limiting broad differences in administrative, climatic, and regional cultural contexts; (2) retention of identifiable mountainous settlement forms, vernacular architecture, agricultural landscapes, and local cultural practices; (3) observable variation in heritage preservation, accessibility, service provision, public-space improvement, and community operation; and (4) availability of comparable field observations, UAV imagery, resource inventories, expert judgments, and questionnaire data. The cases were not selected to predetermine the final diagnostic profiles, which were derived from the subsequent criterion- and indicator-level results.
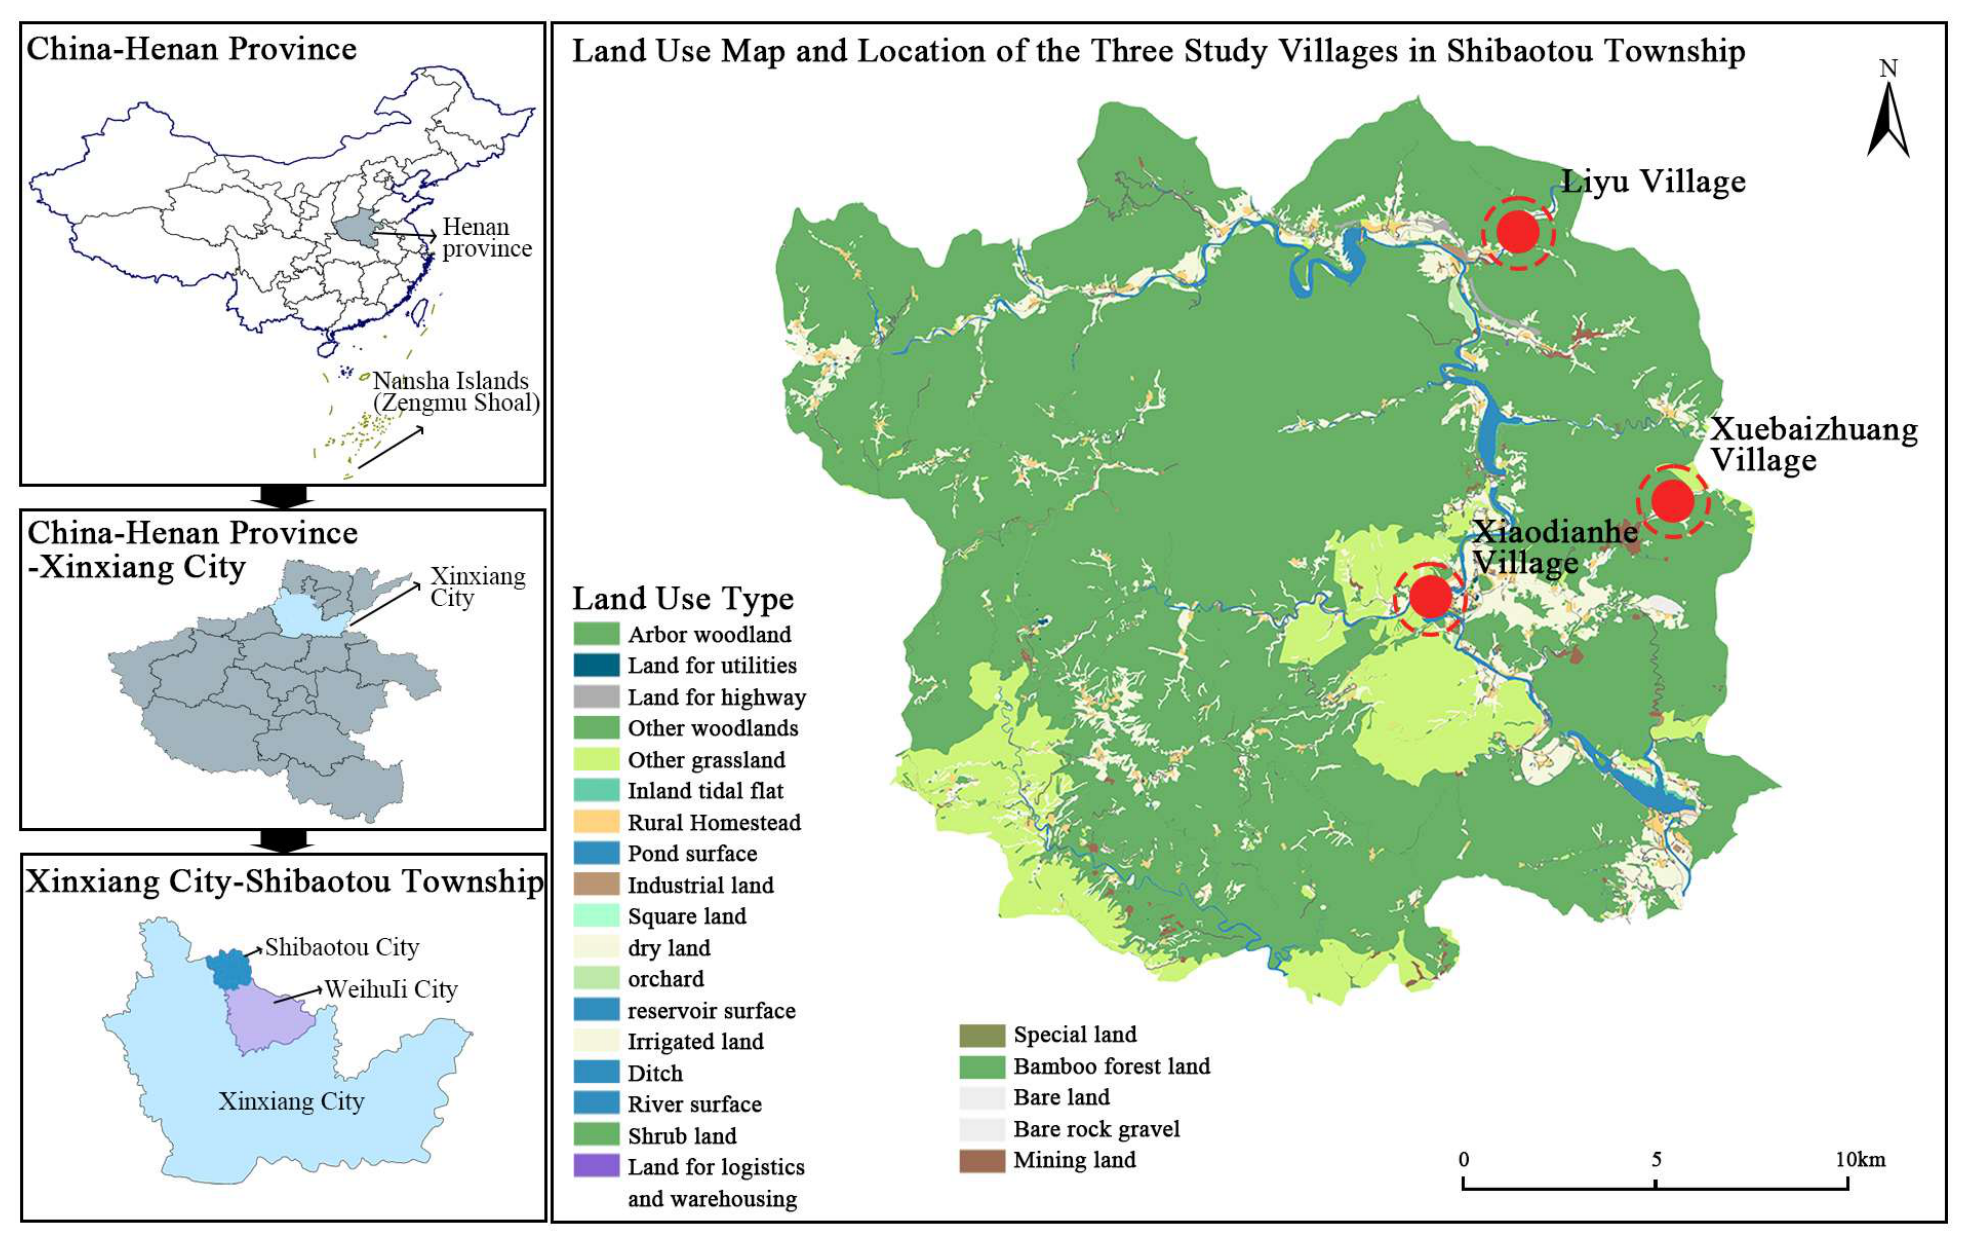
The three villages are located in Shibaotou Township, Weihui City, Henan Province, on the eastern foothills of the Southern Taihang Mountains (
Figure 1). Their proximity provides a broadly comparable geographical, administrative, and regional-policy context, while their differences in inherited resources and service-support conditions permit controlled comparison. The cases are analytically representative of mountainous villages characterized by mountain–valley terrain, vernacular settlement structures, agricultural cultural landscapes, and uneven service provision, but they are not statistically representative of all traditional villages in China. Application to other regions would require recalibration of the indicators, weights, and diagnostic thresholds.
Liyu covers approximately 520 ha and has an average elevation of about 505 m. Its cultivated land, woodland, water systems, traditional courtyards, stone-paved routes, and the Huanggu’an site form an integrated mountain–water–farmland–settlement landscape. Xiaodianhe is located approximately 26 km from central Weihui and retains a Qing-dynasty residential complex of about 50,000 m2, comprising 10 courtyards, 23 quadrangle compounds, and 86 individual buildings. It is designated as a Chinese Traditional Village and was included in the second batch of National Key Rural Tourism Villages in 2020. Xuebaizhuang, situated deeper in the mountains, has a settlement history of more than 660 years and retains a Ming-dynasty stone gate, the Xiulou structure, stone dwellings, and an agricultural landscape historically associated with apple cultivation.
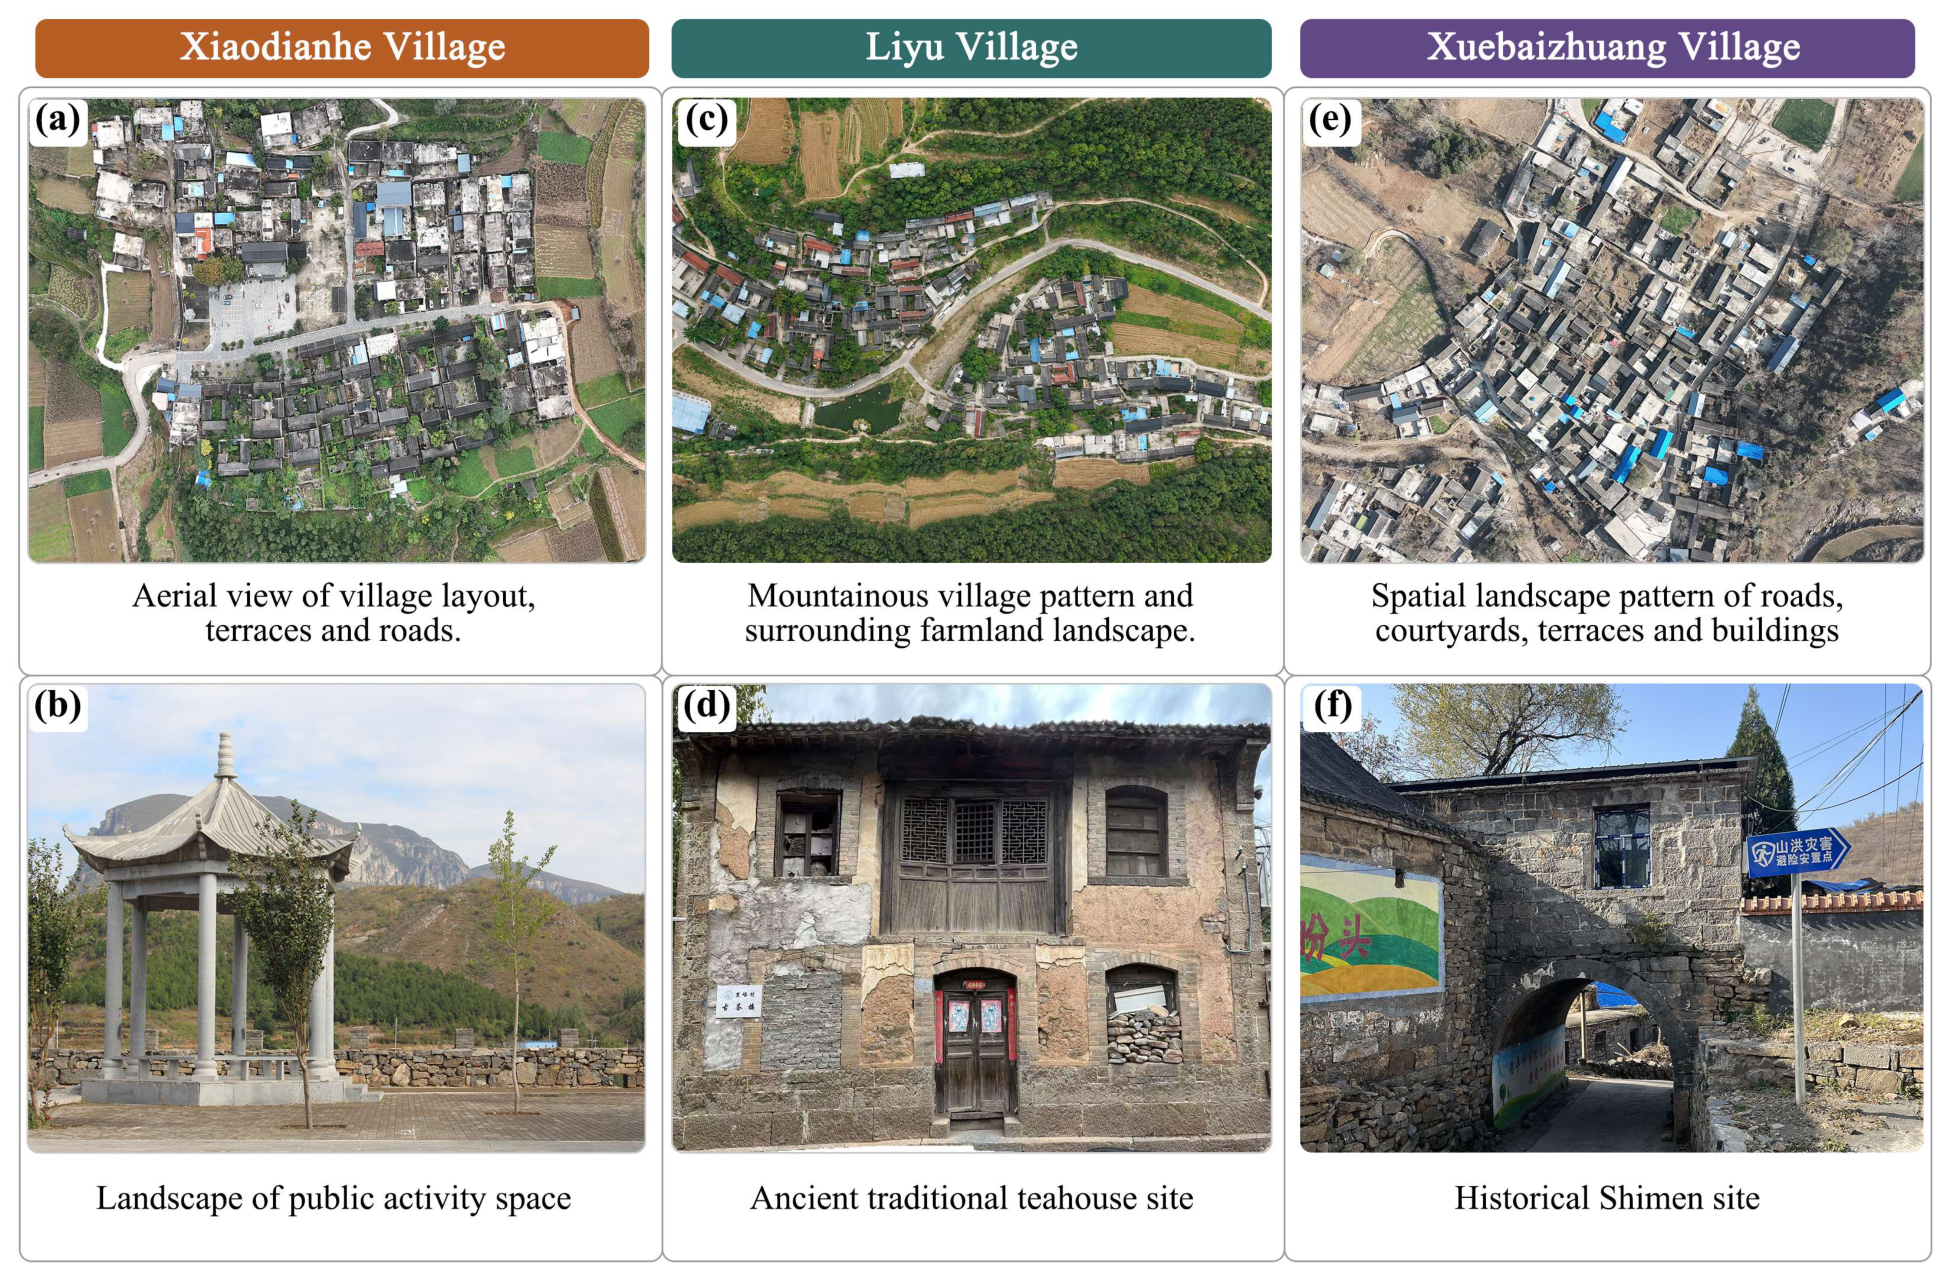
The three cases combine contextual similarity with differences relevant to the proposed framework. Xiaodianhe presents comparatively strong heritage preservation and accessibility; Liyu is characterized by an integrated valley, settlement, architectural, and agricultural landscape; and Xuebaizhuang retains distinctive mountain and stone-built heritage but has comparatively limited accessibility, routine maintenance, and service support.
Figure 2 provides representative UAV and field-survey evidence of these conditions. These preliminary descriptions establish the comparative context and should not be interpreted as final evaluation results. The Chinese characters visible on the signage indicate the local village name and public information at the survey site.
2.2. Evidence Sources, Participants, and Quality Control
Candidate indicators were initially identified through a literature review of Web of Science, China National Knowledge Infrastructure, and related academic and policy sources. Searches used terms including “traditional villages”, “village landscapes”, and “heritage conservation”, with priority given to empirical studies, policy documents, research reports, and representative conservation cases published during the preceding decade. The preliminary indicator pool covered natural and landscape resources, traditional heritage resources, accessibility, facilities, management, and community participation. Field investigation, UAV imagery, and resource inventories were subsequently used to verify whether the candidate indicators were observable and applicable to all three villages, while the expert panel reviewed their conservation relevance and practical applicability. In the final screening, three considerations were used jointly: explicit support in the reviewed literature, observability and applicability across all three cases based on field, UAV, and inventory evidence, and expert-assessed conservation relevance and practical applicability. The final indicator system and operational definitions are presented in
Section 2.3.
Five complementary evidence streams were used: field investigation, UAV imagery, resource inventories, expert pairwise comparisons, and questionnaire ratings. Field investigation included georeferenced observation, photographic documentation, route inspection, facility inspection, and problem recording. UAV imagery was used to verify settlement morphology, land-use relationships, water and valley systems, vegetation patterns, road connections, building distribution, and spatial continuity. Resource inventories recorded the presence, condition, distribution, and functional status of natural, heritage, and service-support elements. These three evidence streams supported indicator operationalization, preparation of standardized assessment materials, condition verification, and interpretation of the results, but they were not assigned independent coefficients or entered directly into the numerical model. The direct numerical inputs were the expert pairwise comparisons used to determine AHP weights and the questionnaire ratings used to construct fuzzy membership matrices.
The expert panel comprised nine specialists with 15–25 years of relevant research or professional experience (mean: 19.7 years): four professors, two associate professors, two researchers, and one rural-construction management practitioner. Their disciplinary backgrounds included landscape architecture (two experts), architecture (two), urban and rural planning (two), and rural tourism (three), and all nine were familiar with both traditional villages and the study area. The panel was purposively selected to provide complementary expertise across the three evaluation domains: landscape and environmental assessment for B1, vernacular architecture and settlement conservation for B2, and spatial planning, tourism services, management, and community participation for B3. Professional experience, disciplinary relevance, and familiarity with the study context were used as the principal selection criteria. Each expert independently completed four reciprocal pairwise-comparison matrices, and the corresponding judgments were aggregated using the geometric mean after individual consistency testing. Detailed anonymized expert profiles are provided in
Supplementary Table S6.
The questionnaire survey was conducted from April to June 2026. Each village contributed 60 valid responses, yielding 180 responses in total. For sampling and subsequent respondent-group analyses, respondents were assigned to three mutually exclusive recruitment categories: (1) residents or respondents with long-term familiarity with local conditions (R/F; n = 30 per village), (2) on-site visitors (V; n = 15 per village), and (3) respondents recruited on the basis of relevant professional or disciplinary backgrounds (P; n = 15 per village). Residents or respondents with long-term familiarity were approached during household and public-space surveys with assistance from local contacts and community organizations. Visitors were recruited at village entrances, historic streets, and principal residential or heritage areas after completing a substantive visit. Professional-background respondents (P) were invited through Henan Institute of Science and Technology and had training or experience in landscape architecture, architecture, rural tourism, urban and rural planning, or related fields. Participation was voluntary and anonymous, and the study purpose and assessment procedures were explained before participation. Ethical review and approval were waived because the study involved only non-interventional, anonymous questionnaire and expert assessments and posed no more than minimal risk to participants.
The professional-background respondents (P) completed the same public-rating questionnaire as the R/F and V groups and did not participate in the AHP weighting process; they were therefore analytically distinct from the nine experts who provided the pairwise comparisons used to derive the AHP weights. All respondents evaluated the current condition of the same 15 indicators using the same five ordered grades: excellent, good, moderate, poor, and very poor. For each village, the frequency distribution of the five grades was converted into an indicator-level fuzzy membership vector. The resulting membership matrices were subsequently combined with the AHP weight vectors, as described in
Section 2.4.
Of the 180 valid responses, 159 were based on direct on-site observation and 21 were completed through image-assisted assessment. The image-assisted responses were provided by professional-background respondents (P) who could not complete an on-site assessment, including six for Xiaodianhe, six for Liyu, and nine for Xuebaizhuang. For each village, respondents received a standardized package containing UAV images of overall settlement morphology, ground-level photographs of the principal natural, heritage, and service-support conditions, and a concise factual village profile. The same indicator definitions, image materials, presentation sequence, written instructions, and five-grade scale were used for respondents assessing the same village. Researchers clarified only the meanings of indicators or rating categories when necessary and did not suggest particular scores or comparative judgments.
Respondent-group membership, reported professional background, and assessment mode were treated as separate variables. For all respondent-group analyses, group membership was defined by the three mutually exclusive recruitment categories described above (R/F, V, and P), rather than simply by whether a respondent reported relevant professional training. The sample comprised 81 male and 99 female respondents. In total, 49 respondents reported relevant professional training or experience; this number exceeded the 45 respondents assigned to the P group because four respondents recruited into the R/F or V groups also reported relevant professional experience. Full distributions by village, age, sex, occupation, respondent group, professional background, visit experience, and assessment mode are provided in
Supplementary Table S2. The variable definitions and coding used in the respondent-group and assessment-mode robustness analyses are provided in
Supplementary Table S7.
The questionnaire was not designed as a psychometric scale measuring a single latent construct. Instead, the 15 indicators were treated as formative and independently interpretable criteria defined by observable and non-interchangeable components. Cronbach’s alpha was therefore not used as the primary measure of validity. Content validity was supported through literature-based indicator development, field investigation, resource inventories, and expert review of indicator relevance and applicability. Accordingly, the indicator, criterion, and target-layer results should be interpreted as questionnaire-derived, evidence-informed comparative perceptions of observable village conditions rather than direct technical audits of building condition, heritage authenticity, ecological performance, tourism-management effectiveness, or governance capacity.
2.3. Heritage-Oriented Resource–Service Framework and Indicator System
The framework evaluates the current resource–service structure of each village rather than heritage value, tourism performance, or conservation effectiveness alone. Natural and landscape resources (B1) and traditional heritage resources (B2) constitute the inherited environmental and cultural resource base. Service-support conditions (B3), including accessibility, internal routes, accommodation, management, catering, and community participation, represent the enabling conditions for maintenance, interpretation, day-to-day access, and appropriate use. The three dimensions are analytically related but not interchangeable: strong service provision cannot compensate for the loss of authenticity, integrity, or landscape continuity, while a low service-support score does not necessarily indicate low heritage value.
Differentiated conservation was guided by four principles: heritage-value priority, landscape continuity, resource–service compatibility, and gradual low-impact intervention. Conservation priorities were therefore derived by first identifying the strength and observable condition of inherited resources and then examining whether service-support conditions were broadly commensurate with that resource base. The framework does not assume that additional facilities or higher composite scores necessarily produce better conservation outcomes.
Figure 3 summarizes the analytical sequence from evidence acquisition and indicator construction to AHP weighting, fuzzy comprehensive evaluation, structural diagnosis, and sequenced conservation priorities. AHP was used to determine the relative importance of the criterion and indicator layers, while fuzzy comprehensive evaluation aggregated the five-grade questionnaire distributions. Criterion-level information was retained after aggregation to identify resource–service gaps, structural imbalance, and high-weight deficiencies.
The framework comprises one target layer, three criterion layers, and 15 indicators (
Table 1). The indicator system was derived from literature-based screening and subsequently refined through field investigation, resource inventories, UAV-supported condition verification, and expert review. To make the academic basis of the framework explicit,
Table 1 identifies the principal literature supporting each indicator. B1 and B2 describe the inherited resource base, whereas B3 describes enabling and support capacity. Field investigation, UAV imagery, and resource inventories were used to verify the observable content and applicability of the indicators rather than to assign independent numerical coefficients. Detailed operational definitions, evidence sources, grading guidance, and model-entry procedures are provided in
Supplementary Table S3.
RQ1 was addressed through criterion- and indicator-level weights, RQ2 through the criterion-, target-, and structural-diagnostic results, and RQ3 through the translation of these results into village-specific conservation priorities.
2.3.1. Natural and Landscape Resources
Natural and landscape resources describe the inherited environmental setting and its observable landscape condition rather than serving as direct measurements of biodiversity or ecosystem functioning. The mountain–valley terrain, water and gully systems, woodland, cultivated land, and settlement relationships of the three villages provided the empirical basis for evaluating C1–C3.
Mountain landforms and visual landscape (C1)assess the recognizability of ridges, slopes, valleys, and terrain structure, together with visual openness, spatial depth, landscape layering, and access to viewing points. Higher ratings indicate a clearly legible and visually coherent mountainous setting, while lower ratings indicate weak landform recognition, obstructed views, or intrusive spatial disturbance [
15,
16].
Water bodies and gully landscapes (C2)include permanent and seasonal water features, gullies, dry channels, drainage systems, and their associated banks and slopes. The assessment considered continuity, visibility, naturalness, accessibility, visual coherence, and observable disturbances such as sedimentation, litter, excessive hard revetment, or intrusive construction [
17].
Vegetation and ecological landscape (C3)evaluate vegetation coverage, structural and visual diversity, continuity, condition, and coordination with the settlement and surrounding farmland. The resulting score represents respondents’ comparative perception of vegetation and ecological landscape quality rather than a technical ecological or biodiversity assessment [
18,
19].
2.3.2. Traditional Heritage Resources
Traditional heritage resources comprise the tangible and intangible cultural elements inherited through the long-term development of the villages. These include settlement patterns, vernacular buildings, agricultural landscapes, local customs, material remains, products, and culinary knowledge. The six indicators assess their observable condition, continuity, legibility, and local distinctiveness rather than determining statutory heritage significance.
Traditional settlement environment (C4)evaluates settlement morphology, street texture, spatial continuity, environmental coordination, and the extent of visually intrusive construction. Higher ratings indicate that the historic settlement structure remains legible and coherent within its landscape setting [
20,
21].
Traditional mountain vernacular architecture (C5)assesses the retention, condition, integrity, and recognizability of traditional dwellings, regional construction forms, materials, and historic architectural fabric. The rating reflects observable architectural condition and character rather than a complete professional assessment of heritage significance [
22,
23].
Mountain agricultural landscape and production culture (C6)cover terraced fields, orchards, cultivated land, production spaces, and associated agricultural practices. The assessment considered landscape continuity, visibility, continued use, and the recognizability of traditional production activities [
24,
25].
Folk activities and local cultural memory (C7)include customs, festivals, rituals, oral traditions, collective activities, and other locally transmitted practices. Ratings focused on visibility, participation, community recognition, and perceived continuity rather than measuring cultural identity as a single latent construct [
26,
27].
Material cultural remains (C8)include historic structures, bridges, wells, inscriptions, stone components, archaeological remains, and production-related features. The assessment considered diversity, physical condition, legibility, maintenance, spatial distribution, and relationships with the wider settlement environment [
28].
Local products and culinary resources (C9)include distinctive ingredients, agricultural products, processed goods, traditional dishes, preparation knowledge, and associated local practices. Ratings considered diversity, local distinctiveness, availability, continuity, authenticity, and presentation [
29,
30].
2.3.3. Service-Support Conditions
Service-support conditions describe the enabling capacity for routine maintenance, interpretation, access, visitor use, and community involvement. They do not represent heritage value and cannot compensate for the loss of inherited resources. The six indicators cover external access, internal movement, accommodation, management, catering, and community participation.
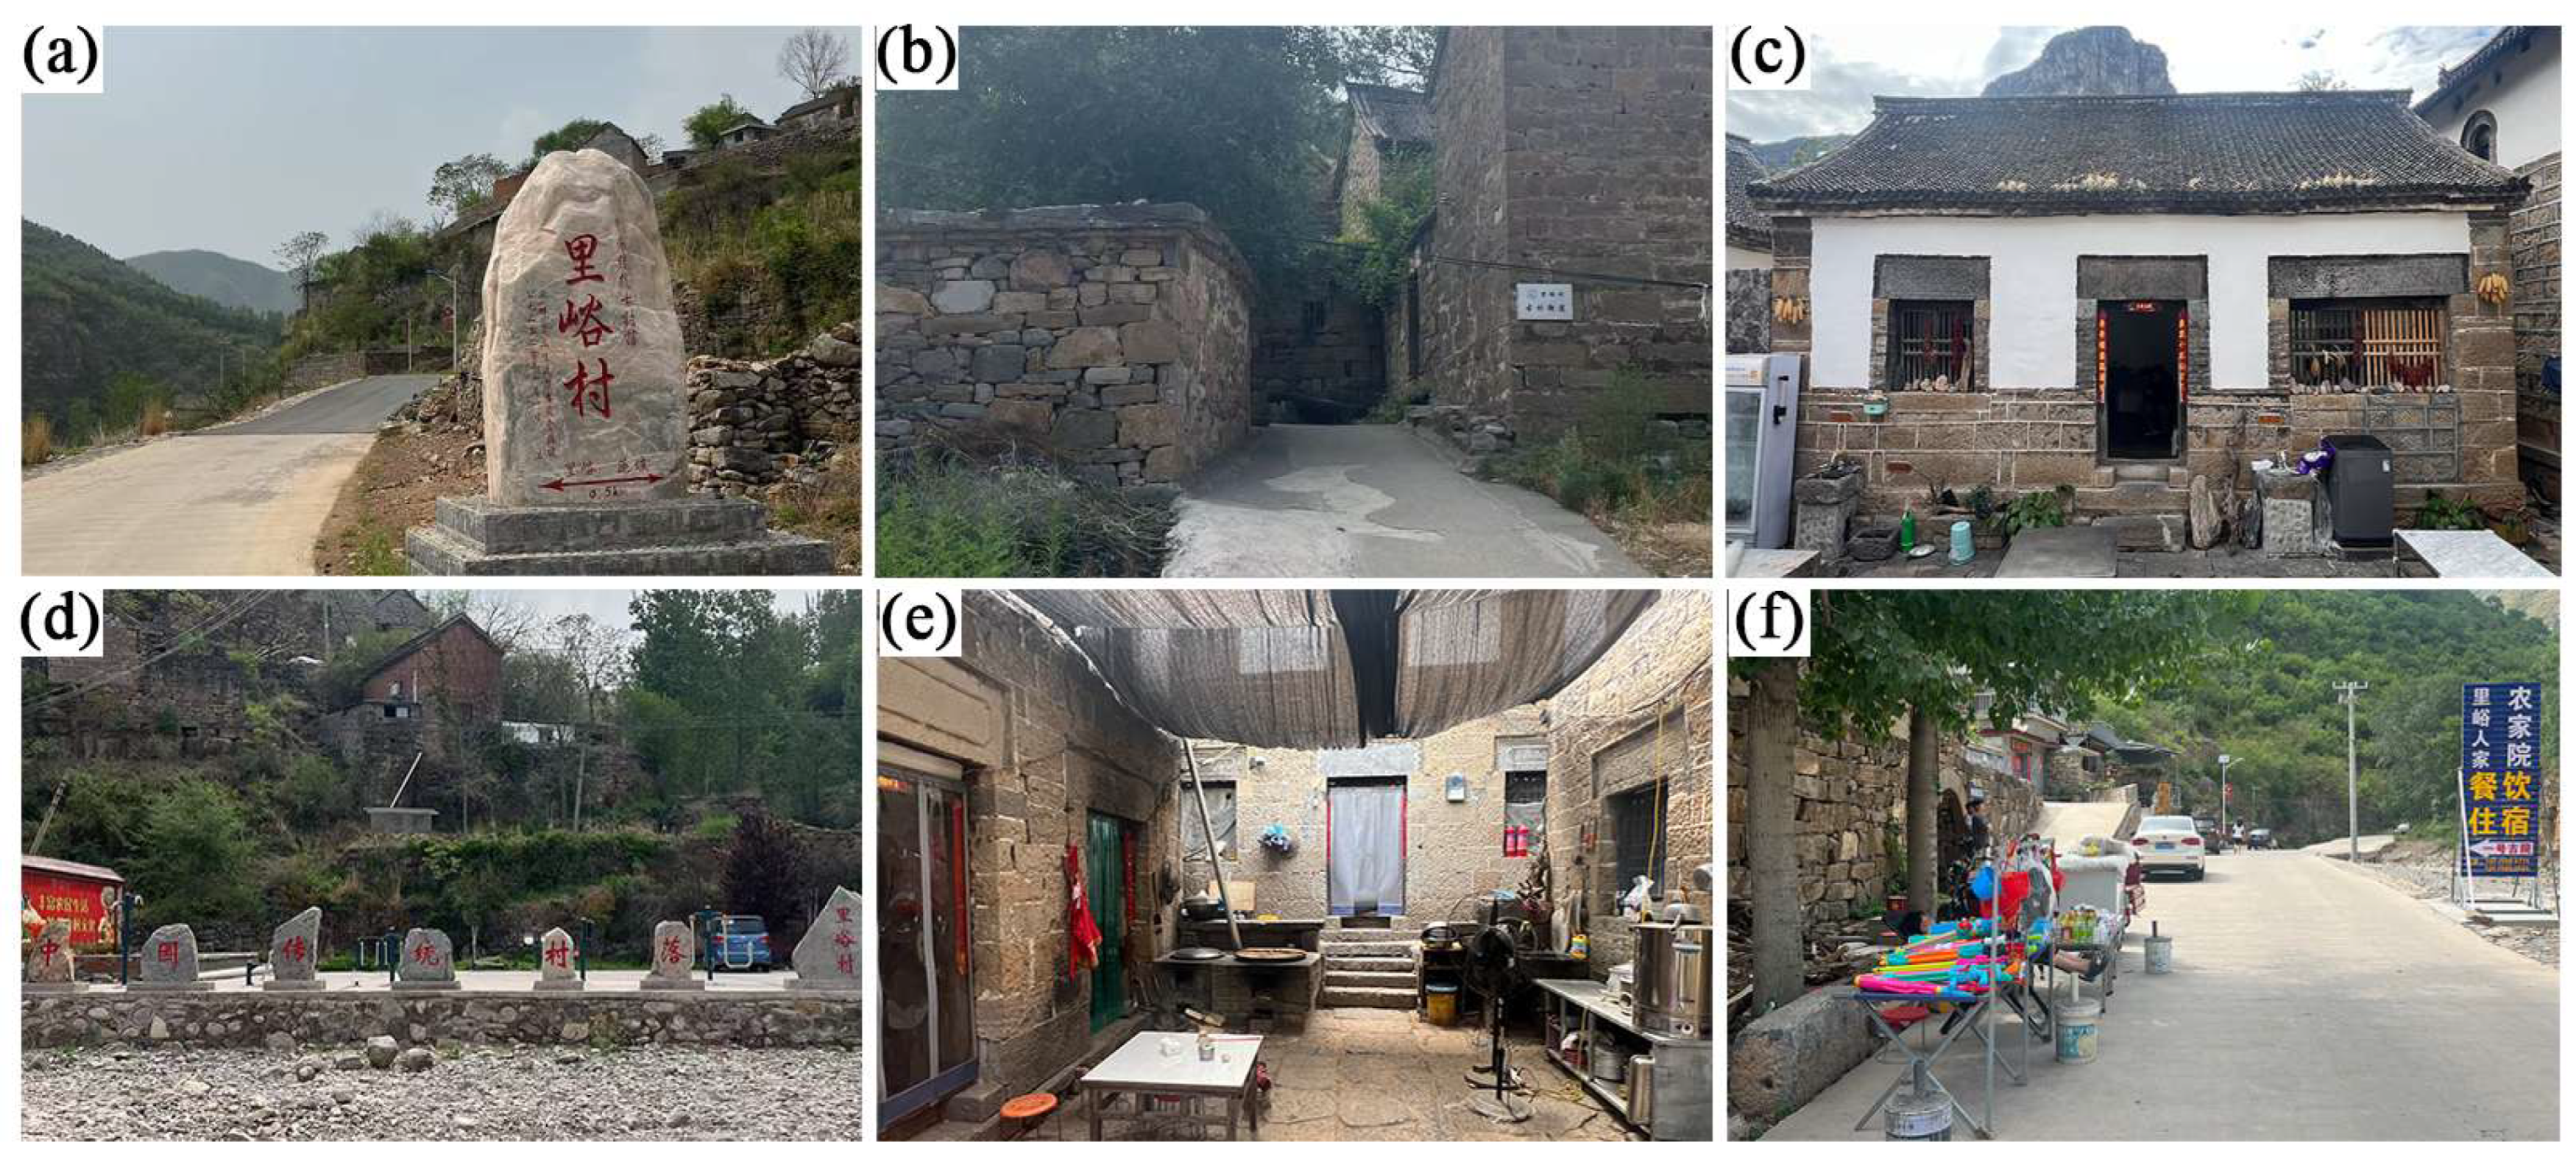
Figure 4 provides illustrative field evidence of the observable conditions assessed under C10–C15; the photographs were not entered into the model as independent numerical variables.
External transport accessibility (C10) evaluates travel convenience, travel time, road connection and condition, reliability, and observable routine safety when reaching the village from external transport routes. It reflects practical access conditions rather than regional transport development as a whole [
31,
32].
Accessibility of internal roads and tourist routes (C11) assesses route continuity, walkability, legibility, signage, normal-use safety, and connections among residential areas, public spaces, and principal heritage or landscape nodes [
33,
34,
35].
Accommodation and stay conditions (C12) evaluate the availability, capacity, hygiene, comfort, operational condition, and compatibility of accommodation with village character. The score reflects perceived support for overnight or extended visits rather than the commercial performance of accommodation businesses [
36].
Tourism service and management capacity (C13) covers reception, information provision, interpretation, environmental maintenance, routine visitor management, and operational coordination. Questionnaire ratings represent observable service experiences rather than a comprehensive institutional audit of local governance [
37].
Catering provision and service conditions (C14) assess facility availability, food variety, local character, hygiene, service efficiency, operational stability, and compatibility of the dining environment with the village setting [
38,
39].
Cultural tourism operations and community participation (C15) evaluate organized tourism operation, resident participation, local governance, employment and entrepreneurship opportunities, collaboration, coordination, and perceived benefit-sharing. Higher scores indicate more visible and organized local involvement rather than proof of equitable long-term outcomes [
5,
6].
For C10–C13, references to safety concern only observable and perceived day-to-day conditions of road travel, pedestrian movement, accommodation, and visitor management under normal operating conditions. The framework did not assess hazard probability, exposure, physical vulnerability, emergency response, evacuation, or post-disaster recovery. These indicators should therefore not be interpreted as measures of disaster safety or village resilience.
2.3.4. Indicator Operationalization, Scoring Rules, and Model Entry
Each indicator was operationalized through observable components identified from the literature and verified through field investigation, UAV imagery, and resource inventories. These evidence sources defined what respondents evaluated, confirmed the applicability of the indicators to the three villages, and supported the preparation of standardized assessment materials. They were not assigned independent numerical coefficients and did not directly determine village scores.
All respondents evaluated the same 15 indicators using the ordered evaluation set
, corresponding to the score vector
. For each village and indicator, the numbers of responses in the five categories were divided by the 60 valid village-specific responses to form a five-element membership vector, whose elements summed to 1. Higher grades consistently represented stronger condition, continuity, accessibility, adequacy, or participation, depending on the indicator, whereas lower grades represented deterioration, fragmentation, insufficiency, weak accessibility, or limited organization. The indicator-specific observable components and grade directions are detailed in
Supplementary Table S3.
Expert judgments and questionnaire ratings performed different numerical functions. The aggregated expert pairwise comparisons determined the criterion- and indicator-level AHP weights, whereas the questionnaire-derived membership vectors represented the assessed condition of each village. The local indicator weights were combined with the corresponding membership matrices to obtain the B1, B2, and B3 criterion-layer results, after which the criterion-layer weights were used to derive the target-layer evaluation. The detailed equations and matrix operations are presented in
Section 2.4.
This procedure maintained a clear distinction between contextual evidence and numerical model inputs. Field investigation, UAV imagery, and resource inventories supported indicator definition and result interpretation, while only expert-derived weights and questionnaire-derived membership vectors entered the AHP-weighted fuzzy comprehensive evaluation directly. The AHP supporting materials, including the aggregated pairwise-comparison matrices, anonymized individual expert judgments, consistency results, and full-precision weights, are provided in
Supplementary Table S4, whereas the complete questionnaire-derived frequencies and membership values for all 15 indicators across the three villages are provided in
Supplementary Table S5.
2.4. Resource Evaluation Model for the Three Traditional Villages
Throughout this study, the analytic hierarchy process (AHP) refers exclusively to the derivation of criterion- and indicator-level weights from reciprocal pairwise-comparison matrices, whereas fuzzy comprehensive evaluation refers to the aggregation of questionnaire-derived five-grade membership vectors. The term fuzzy AHP (FAHP) is not used because the expert judgments were expressed using Saaty’s conventional 1–9 reciprocal scale rather than fuzzy-number comparisons. The combined procedure is therefore termed AHP-weighted fuzzy comprehensive evaluation. The analytical model comprised four stages: AHP weight determination, fuzzy membership construction and score aggregation, resource–service structural diagnosis, and robustness analysis.
The methodological design was selected to match three characteristics of the research problem. First, the predefined heritage-oriented hierarchy required a transparent procedure for deriving normative relative priorities among criteria and indicators, for which AHP provides pairwise comparison and consistency testing. Second, the village conditions were assessed through five ordered questionnaire grades rather than precise physical measurements; fuzzy comprehensive evaluation therefore preserves the distribution of judgments across the five grades instead of reducing them immediately to a single value. Third, the research objective was structural diagnosis rather than ranking alone, requiring the B1, B2, and B3 results to remain separately interpretable after aggregation. AHP weighting, fuzzy comprehensive evaluation, and the subsequent resource–service diagnosis therefore perform complementary rather than interchangeable analytical functions.
2.4.1. AHP Weight Determination and Consistency Testing
The analytic hierarchy process (AHP) was used to derive the relative weights of the three criterion layers and the 15 indicators within the predefined hierarchical structure [
40]. Each of the nine experts independently completed four reciprocal pairwise-comparison matrices: matrix
, comparing natural and landscape resources (B1), traditional heritage resources (B2), and service-support conditions (B3); matrix
, comparing C1–C3; matrix
, comparing C4–C9; and matrix
, comparing C10–C15. This procedure produced 36 individual judgment matrices.
AHP was selected for the weighting stage because it provides a structured means of decomposing a multidimensional decision problem into a hierarchy, eliciting relative priorities through pairwise comparisons, and examining the internal consistency of expert judgments [
40]. These characteristics are particularly relevant to the present study, in which the relative conservation importance of three criterion layers and 15 indicators had to be determined within a predefined hierarchical framework.
Step 1. Construction of Pairwise-Comparison Matrices
For expert
, the reciprocal judgment matrix was expressed as:
where
denotes expert
judgment of the importance of element
relative to element
within the same hierarchical level. Pairwise importance was assessed using Saaty’s 1–9 scale and its reciprocals, as shown in
Table 2 [
40].
Step 2. Aggregation of Expert Judgments
The elicitation consisted of one independent round rather than a Delphi process. All experts were assigned equal importance. The consistency of each individual matrix was examined before aggregation. Corresponding pairwise judgments were then aggregated entry by entry using the geometric mean:
where
is the judgment provided by expert
, and
is the corresponding group judgment. The geometric-mean values formed the aggregated group matrix:
The same procedure was applied separately to matrices A, B1, B2, and B3. The complete aggregated matrices, individual- and group-level consistency results, and full-precision weights are provided in
Supplementary Table S4.
Supplementary Table S4h–k additionally report all independent pairwise-comparison judgments provided by the nine anonymized experts. Because the diagonal elements of each reciprocal judgment matrix equal 1 and the remaining reciprocal entries satisfy
, these values permit reconstruction of all 36 individual judgment matrices and independent reproduction of the geometric-mean aggregation.
Step 3. Derivation of Local and Global Weights
The priority vector of each aggregated judgment matrix was derived using the principal eigenvector method:
where
is the maximum eigenvalue of the aggregated matrix and
is its corresponding principal right eigenvector. The eigenvector was normalized to obtain the weight vector:
Matrix
generated the criterion-layer weight vector
, whereas matrices
,
, and
generated the corresponding local indicator-weight vectors. The global weight of indicator
was calculated as:
where
is the local weight of indicator
under its parent criterion
, and
is its global weight in the target-layer evaluation. Full-precision weights were used in all calculations, while rounded values were used only for presentation.
Step 4. Consistency Testing
The logical consistency of each individual and aggregated judgment matrix was evaluated using the consistency index
and consistency ratio
:
where
is the matrix order and
is the average random consistency index corresponding to that order. The
values used in the consistency test are provided in
Table 3. A judgment matrix was regarded as acceptably consistent when
; otherwise, the corresponding pairwise judgments required reassessment.
In this study, matrices
and
were of order 3 and therefore used
, whereas matrices
and
were of order 6 and used
. The same CR < 0.10 criterion was applied to all 36 individual matrices and the four aggregated group matrices. Individual and group-level consistency results are reported in
Supplementary Table S4e,f, while the anonymized pairwise judgments underlying the 36 individual matrices are provided in
Supplementary Table S4h–k.
2.4.2. Fuzzy Comprehensive Evaluation and Score Derivation
Fuzzy comprehensive evaluation combined the AHP-derived weights with the five-grade questionnaire distributions. For each village, only questionnaire ratings entered the membership and score calculations; field investigation, UAV imagery, and resource inventories were used to define and verify the observable indicator content and to support result interpretation rather than as additional numerical variables.
Let
denote Xiaodianhe, Liyu, and Xuebaizhuang, respectively;
denote the criterion layers;
denote the indicators within criterion layer
; and
denote the evaluation grades. The factor sets were defined as:
The evaluation set was
, corresponding to excellent, good, moderate, poor, and very poor, with the score vector:
For village
, the membership degree of indicator
in criterion layer
to evaluation grade
was calculated from the questionnaire frequency as:
where
is the number of respondents selecting grade
, and
is the number of valid ratings for the corresponding village and indicator. The indicator-level membership vector was expressed as:
The membership vectors of all indicators within criterion layer
were arranged by row to form the village-specific membership matrix.
where
and
.
Let
denote the local AHP weight vector of the indicators within criterion layer
. The corresponding criterion-layer fuzzy evaluation vector was calculated as:
The largest component of identifies the dominant evaluation grade of village at criterion layer .
Let
denote the criterion-layer AHP weight vector. The three criterion-layer evaluation vectors were arranged as:
The target-layer fuzzy evaluation vector was then calculated as:
The largest component of identifies the dominant target-layer evaluation grade.
Indicator, criterion, and target-layer scores were obtained by defuzzifying the corresponding five-grade membership vectors:
where
is the score of indicator
,
is the score of criterion layer
, and
is the target-layer score for village
. The maximum-membership grade and the defuzzified score were interpreted jointly: the former identifies the dominant grade, whereas the latter summarizes the complete five-grade distribution.
The complete village-specific membership matrices are provided in
Supplementary Table S5, and the complete numerical calculation for the Xiaodianhe
criterion is retained in
Section 3.2.1. All calculations used full-precision numerical values. Principal criterion- and target-layer scores and AHP weights are reported to four decimal places, whereas robustness-scenario summary scores are reported to three decimal places for compact cross-scenario comparison. Inferential test statistics are reported as specified in the corresponding tables.
2.4.3. Resource–Service Structural Diagnosis
The structural diagnosis used the defuzzified criterion-layer scores , , and obtained from Equation (14), where denotes the village. No additional weights, questionnaire data, or membership matrices were introduced at this stage.
The inherited resource base was represented by the arithmetic mean of the natural and landscape resource score and the traditional heritage resource score:
The equal mean treats and as two co-constitutive dimensions of the inherited resource base. It serves only as a transparent diagnostic reference and does not replace the AHP-weighted target-layer score. Using the original AHP weights at this stage would allow the higher weight of traditional heritage resources to dominate the resource-base reference, whereas Equation (15) addresses the separate question of whether service support is broadly commensurate with both inherited resource dimensions.
The service-support score and relative service gap were defined as:
A negative indicates that service-support conditions lag behind the resource base, whereas a positive value indicates that the service-support score exceeds the resource-base reference. This difference is a descriptive diagnostic measure rather than a statistical test.
To test whether the diagnosis depended on the equal-mean specification, two alternative resource-base calculations were used. First, the AHP weights of
and
were renormalized within the resource domain:
Second, the better-performing resource dimension was used as a conservative reference:
These alternative calculations were used only for sensitivity analysis. They did not replace the principal equal-mean gap, the criterion-layer scores, or the target-layer evaluation.
Criterion-level dispersion was calculated as
A smaller indicates a relatively balanced criterion structure, whereas a larger value indicates a more pronounced internal imbalance.
Diagnostic profiles were identified through the joint interpretation of
,
, the fuzzy evaluation grade of service-support conditions, and indicator-level deficiencies, particularly deficiencies involving relatively important indicators. On the five-grade scale, 0.10 points correspond to one tenth of the interval between adjacent grades and were used to distinguish near parity from a practically meaningful difference; 0.50 points correspond to half of one grade interval and were used to identify a substantial gap. These values are transparent operational rules for comparing the three cases rather than statistically validated or universally applicable cut-off values (
Table 4).
The thresholds were not applied mechanically. A diagnostic profile was retained only when the direction of the gap remained consistent under the equal-mean, AHP-weighted, and strongest-resource specifications and when it was supported by the service-support grade and indicator-level evidence. No case in this study exhibited ; such a result would not automatically indicate an optimal condition, because excessive or incompatible service development could still threaten heritage authenticity and landscape continuity. The resulting profiles are descriptive and do not demonstrate that the proposed interventions will necessarily improve conservation outcomes.