Article

Seismic Response Amplification Mechanisms and Base-Isolation Retrofit Evaluation of a 500 kV Three-Phase Transformer with Steel Supports


1
College of Civil Engineering, Tongji University, Shanghai 200092, China
2
Earthquake Research Institute, The University of Tokyo, Tokyo 113-0032, Japan
3
School of Civil Engineering, Southeast University, Nanjing 211189, China
4
School of Engineering, Tohoku University, Sendai 980-0835, Japan
*
Author to whom correspondence should be addressed.
Buildings 2026, 16(18), 3643; https://doi.org/10.3390/buildings16183643
Submission received: 8 August 2026 / Revised: 7 September 2026 / Accepted: 11 September 2026 / Published: 13 September 2026
(This article belongs to the Special Issue Multi-Hazard Resilience for Sustainable Building Structure)

Abstract

The effects of steel supports on the dynamic characteristics and seismic demands of large three-phase power transformers remain insufficiently quantified. A three-dimensional finite-element model of a 500 kV three-phase transformer was developed to compare configurations without steel support (NS) and with steel support (WS). Modal characteristics and seismic bushing responses were evaluated under seven three-component ground motions. Frequency-response characteristics and global tank rotations were then analyzed, and a double friction pendulum (DFP) base-isolation retrofit was assessed. The lowest natural frequency of the WS model was 1.47 Hz, lower than the 1.84 Hz obtained for the NS model. For the representative X-direction response of high-voltage bushing A, the dominant low-frequency peak of the frequency-response function shifted from approximately 1.89 to 1.64 Hz, while its magnitude increased from approximately 8 to 19. The mean peak maximum principal tensile stress at the root of bushing A increased by 83.1%. The WS model also exhibited greater tank rocking and torsional responses, whose peaks were positively associated with the peak root stresses of bushings A and B. For representative high-voltage bushing B, the DFP retrofit achieved a mean isolation efficiency of approximately 60%. These results elucidate the mechanisms by which steel supports amplify the seismic response of the large 500 kV three-phase power transformer and provide a numerical evaluation of the effectiveness of a DFP base-isolation retrofit for this transformer.

1. Introduction

A reliable power supply is essential to the stable functioning of modern society. Power transformers are complex engineered systems whose design requires rigorous analytical and optimization methods [1]. Previous reviews have identified high-voltage substation equipment, particularly porcelain components, as a major concentration point for seismic damage in electric power systems [2]. Natural-hazard-induced grid interruptions in China can also cause substantial economic losses and delay the restoration of interdependent lifeline systems, including water supply and communications [3]. Post-earthquake investigations following the 1994 Northridge [4], 2008 Wenchuan [5,6], and 2010 Chile earthquakes [7] documented damage to electric power infrastructure and interruptions to service, while the 2011 Tohoku earthquake and tsunami also caused substantial damage to power infrastructure [8]. During the 2010–2011 Christchurch earthquake sequence, transmission-level service was restored within one day after each principal event, although the February 2011 earthquake caused extensive damage to underground cables [9]. During the 2022 Luding earthquake, all high-voltage transformer bushings at the investigated 500 kV substation were damaged [10,11]. Moreover, porcelain transformer bushings have exhibited a marked discrepancy between their performance in laboratory qualification tests and their observed performance during earthquakes [12]. Accordingly, IEEE Std 693 specifies requirements for the seismic design and qualification of substation equipment, whereas IEC TS 61463 specifies seismic qualification methods and requirements for bushings [13,14].
The seismic response of an installed transformer bushing cannot be evaluated independently of its supporting and connecting structures. Bellorini et al. conducted field dynamic tests and finite-element analyses of a 160 MVA, 230/135 kV power transformer to evaluate the amplification from the ground to the bushing flange and the response factor of the bushing itself [15]. Tests on 230 kV porcelain bushings showed that flexible mounting reduced the natural frequency of the bushing–support system and increased its seismic response, whereas a ring-type retrofit improved bushing performance under strong excitation [16]. Field tests and analytical models further showed that the flange-level amplification factor of a 500 kV bushing remained within the value of 2.0 specified in IEEE 693, whereas that of a 230 kV bushing approached twice this value [17]. Finite-element time-history analyses of several transformer–bushing systems also demonstrated that the dynamic interaction between the transformer and its bushings should not be neglected [18]. Full-scale shake-table tests showed that the flexibility of the transformer roof promoted rocking of the bushing–turret assembly and significantly altered the installed dynamic characteristics of the bushing [19]. Corresponding numerical analyses indicated that substantial seismic amplification may occur when the fundamental frequencies of the bushing and transformer tank are close [20]. Subsequent numerical and experimental studies further demonstrated that increasing the flexural stiffness of the transformer roof can reduce bushing seismic response [21,22]. Finite-element analysis of an earthquake-damaged 500 kV transformer, together with experimental and numerical investigations of 220 kV and 500 kV tank–turret systems, revealed substantial amplification of ground motion as it was transmitted through the tank and turret to the bushing mounting location [23,24]. Physical tests and numerical simulations of an 1100 kV bushing validated the applicability of the corresponding finite-element model to seismic response assessment [25]. Further studies showed that increasing connection rotational stiffness can reduce the response of the oil-side portion of the bushing [26], that appropriate selection of flange materials and detailing can improve bushing seismic performance [27], and that modifying the configuration of a sidewall-mounted turret can reduce the dynamic response of an 1100 kV bushing [28]. Based on several numerical cases, Bender and Farid demonstrated that bushing-response amplification is jointly governed by the tank–bushing frequency relationship, mounting stiffness, and dynamic coupling, and that increasing mounting stiffness does not necessarily reduce the response in every configuration [29,30]. A shake-table test of a 1:2.5-scale 220 kV transformer–bushing system further confirmed that the flexural compliance of the tank roof substantially affects bushing response and seismic amplification and revealed differences between the responses in the two horizontal directions [31].
Supporting structures can introduce additional dynamic interaction into electrical equipment systems. A parametric study of general substation equipment–support systems showed that the mass, height, and stiffness of the supporting structure affect both the fundamental frequency of the combined system and the dynamic amplification at the equipment–support interface [32]. The flexural stiffness of steel supporting structures can also alter the bending-moment, and displacement demands of surge arresters [33]. Full-scale tests of 1100 kV UHV-GIS bushing–support-frame systems similarly demonstrated that frame bracing and joint stiffness significantly affect bushing seismic response [34]. In addition, tests and parametric analyses of a full-scale 220 kV disconnect-switch–circuit-breaker system showed that the conductor sag-to-span ratio and the frequency ratio of the connected units affect their dynamic interaction and may amplify equipment response [35]. Collectively, these studies demonstrate the importance of bushing mounting flexibility, dynamic transmission through the tank–turret–bushing assembly, and the support and connection conditions of electrical equipment. For the 500 kV three-phase transformer examined in this study, which has a total mass of 582 t, a large flexible tank, multiple turrets, and three spatially distributed high-voltage bushings, further investigation is required to quantify the support-induced redistribution of low-frequency modal response and the resulting changes in the responses of multiple bushings. The transmission of tank rocking and torsional motion into seismic demands at the roots of the individual bushings also requires clarification. Previous studies have addressed structural performance assessment and the development of passive vibration-control systems for engineering applications [36,37,38,39]. Friction-pendulum systems generate restoring forces through gravity and spherical sliding geometry [40]. Analytical, experimental, and numerical studies have investigated the application of friction-pendulum and related base-isolation systems to power transformers [41,42,43,44,45]. Related work has also examined the mechanical behavior of double-concave friction-pendulum bearings and developed a double friction pendulum (DFP) parameter-optimization method for transformer–bushing systems [46,47].
Accordingly, this study develops a three-dimensional finite-element model of a 500 kV three-phase transformer and compares two otherwise identical configurations without and with steel supports. Natural frequencies, mode shapes, cumulative effective modal mass ratios, and bushing stress, displacement, and acceleration responses are examined to identify the changes induced by the supports. Frequency-response characteristics and tank rocking and torsional responses are subsequently analyzed to interpret the amplification mechanism. Finally, a DFP base-isolation retrofit is numerically evaluated under the same ground motions to quantify reductions in bushing-root stress and the dominant low-frequency acceleration response. The study therefore links support-induced changes in system dynamics to seismic-demand amplification and assesses the potential of a DFP retrofit to improve the seismic performance of the transformer.

2. Finite Element Modeling and Dynamic Characteristics

2.1. Structural Characteristics of Transformers

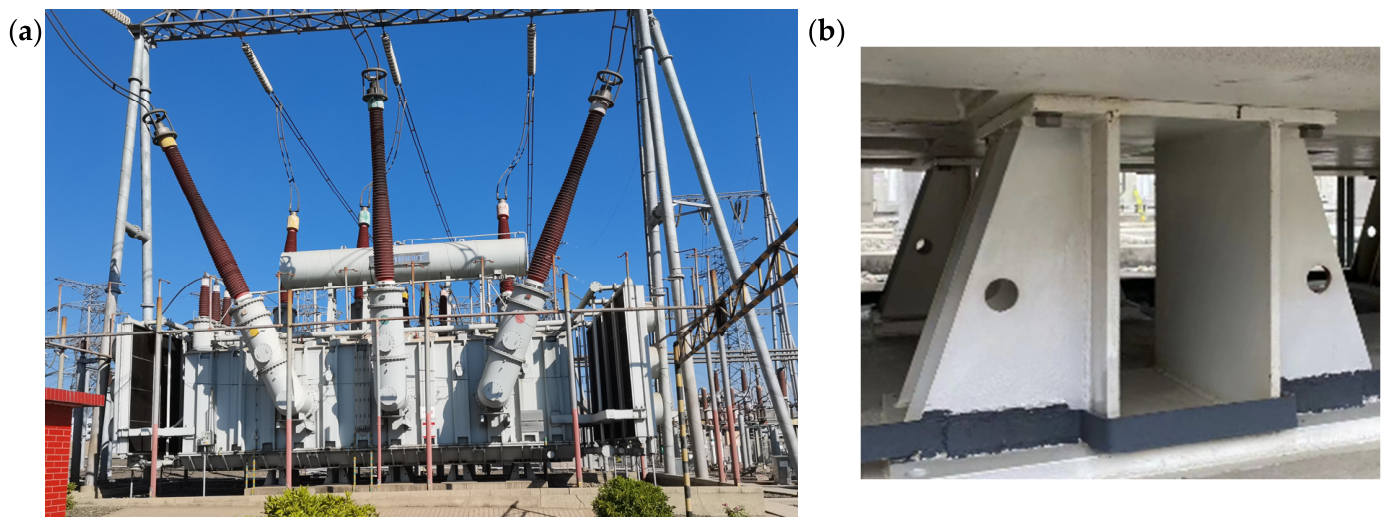
The object investigated is a 500 kV three-phase power transformer mounted on steel support pedestals, hereafter referred to as steel supports. As shown in Figure 1, the transformer assembly comprises the main tank, active part (core and windings), insulating oil, radiators, an oil conservator, high-, medium-, and low-voltage bushings, bushing turrets, and steel supports. The oil conservator is installed above the transformer tank, whereas the radiators are connected to the tank sidewalls through dedicated brackets. The three high-voltage bushings, denoted HV-A, HV-B, and HV-C, are mounted on L-shaped turrets attached to the tank sidewall. The medium- and low-voltage bushings are installed on their respective turrets.
The transformer tank has overall dimensions of 12.73 m × 4.44 m × 4.22 m and is fabricated from welded Q235A steel plates. The bottom plate, top cover, and sidewalls are each 16 mm thick. Each high-voltage bushing is 8.83 m long and incorporates a ceramic housing as its principal load-carrying component. According to the manufacturer, the ceramic housing has a flexural strength of 50 MPa. Each steel support is 580 mm high and is fabricated from Q235 steel; the top and bottom plates are 600 and 900 mm wide, respectively. The total modeled mass of the transformer assembly is 582 t, comprising 333 t for the active part, 138 t for the insulating oil, 13.3 t for five radiators (2.66 t each), 6.9 t for three high-voltage bushings (2.30 t each), and 90.8 t for the remaining components. The representation of these masses and the connection idealizations adopted in the finite-element model are described in Section 2.2.

2.2. Finite-Element Model of the 500 kV Transformer

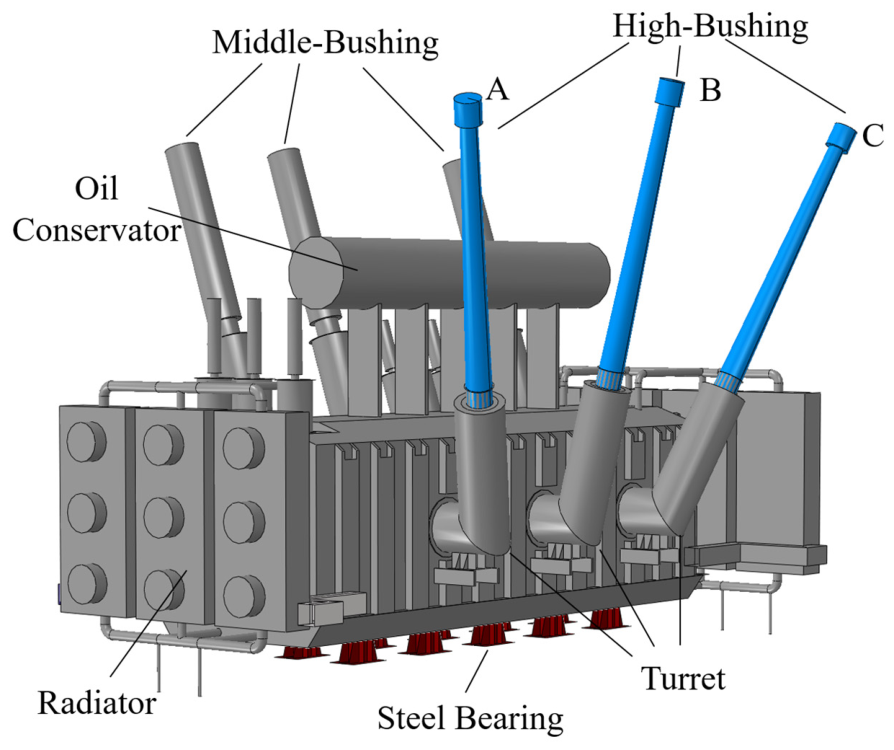
A three-dimensional finite-element (FE) model of the 500 kV transformer (Figure 2) was developed in Abaqus 2021 based on the actual dimensions and component masses described in Section 2.1. The model included the principal components governing structural stiffness and inertia, namely the tank, active part, transformer oil, bushings, bushing turrets, oil conservator, radiators, stiffeners, and steel supports. The thin-walled components, including the tank, stiffeners, bushing housings, turrets, oil conservator, and radiators, were modeled using shell elements. The transformer core and windings were represented by an equivalent solid body with a total mass of 333 t. The main tank was fully filled with oil. The 138 t oil mass was represented by an equivalent distributed mass on the internal tank surfaces to approximate its inertial contribution, without explicitly resolving fluid–structure interaction or hydrodynamic pressure. The interfaces between individual components were modeled using Tie constraints to enforce displacement compatibility. The bushing, tank, and steel supports were modeled as intact, linear-elastic components without simulating damage or post-failure response. The material properties assigned to the model components are summarized in Appendix B.
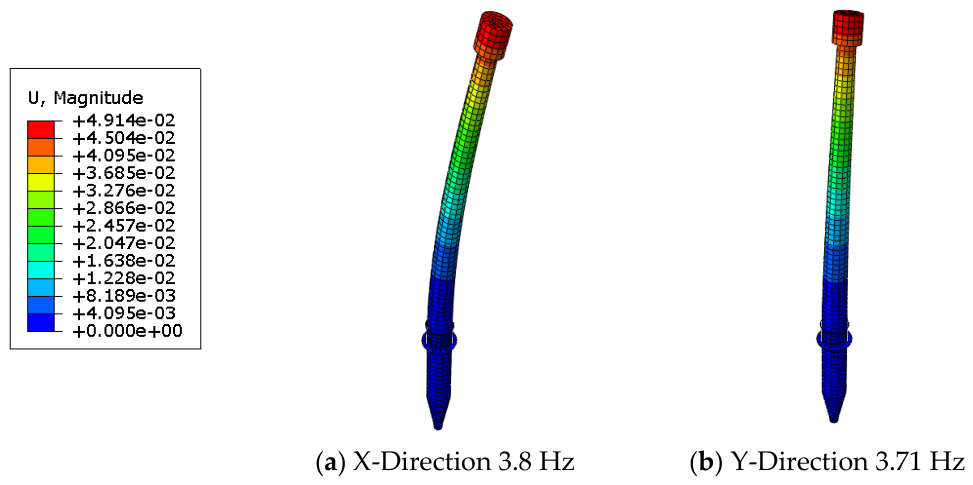
Two baseline configurations were established to isolate the influence of the steel supports. The model with the Q235 steel supports is denoted WS, whereas the corresponding model without the supports is denoted NS. In the WS model, the steel supports were explicitly modeled, with Tie constraints at their interfaces with the tank and full restraint at their lower ends. These conditions idealized intact connections and a rigid foundation. In the NS model, the steel supports were removed, and the tank bottom was directly fixed to the foundation. Except for the support configuration and the corresponding foundation restraints, the two models employed identical component geometries, mass representations, material properties, connection assumptions, and analysis settings. The finite-element modeling approach adopted in this study follows previous numerical and experimental investigations of transformer–bushing systems [47,48,49]. High-voltage bushings are among the most seismically vulnerable components of power transformers and constitute the focus of response analyses. Therefore, a standalone modal analysis of the high-voltage bushing model was conducted, and the calculated natural frequencies were compared with experimental results reported for comparable 500–550 kV bushings [50,51]. The corresponding mode shapes and frequency comparison are presented in Appendix A.

2.3. Natural Frequencies and Mode Shapes

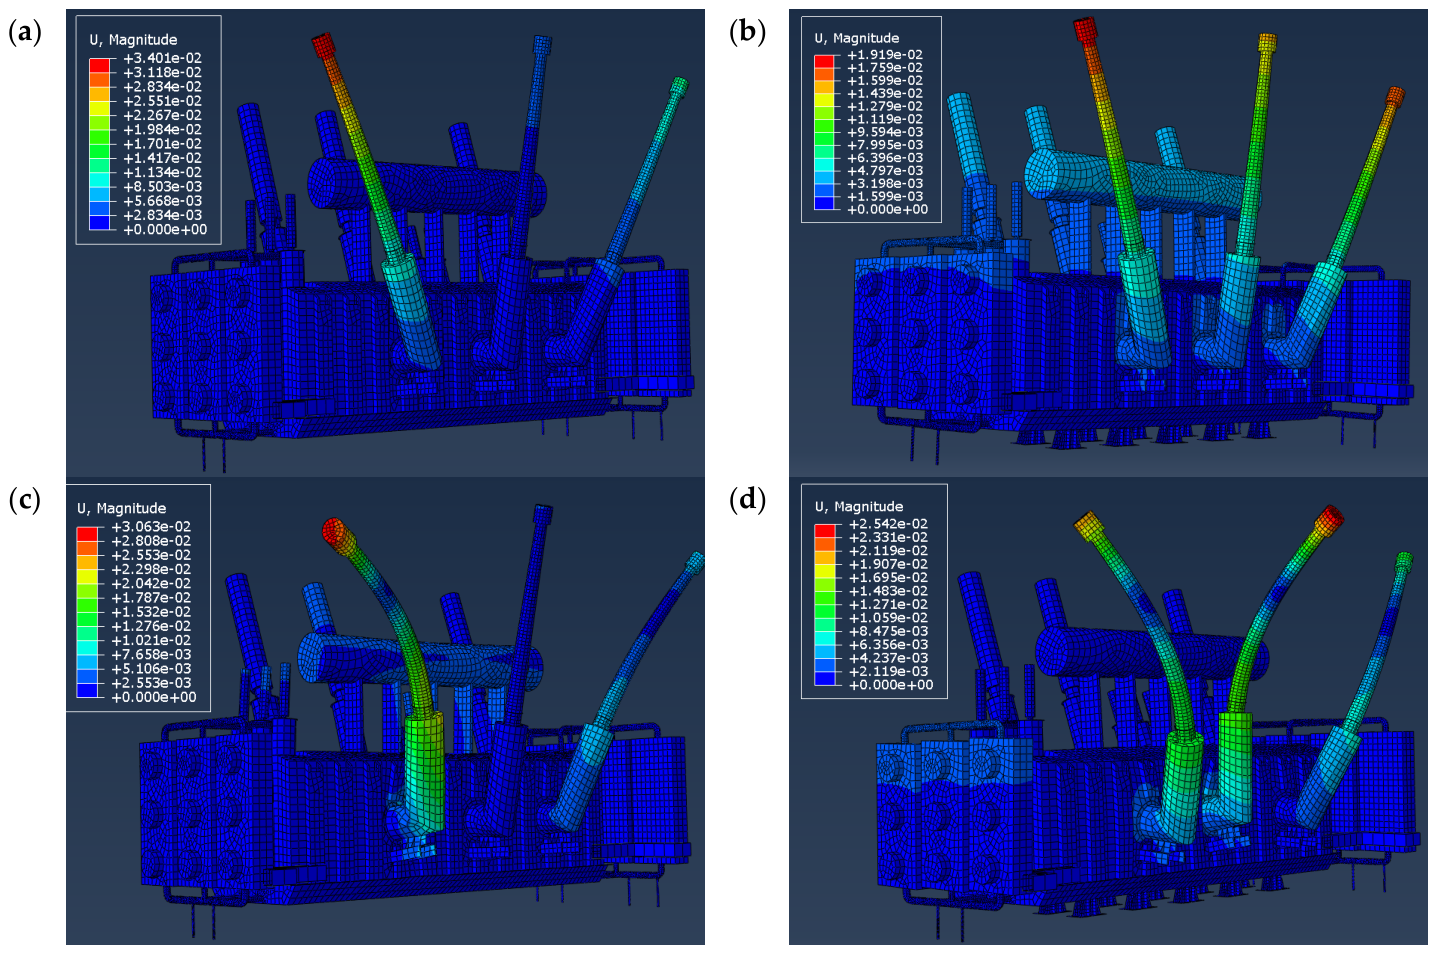
Natural frequencies and mode shapes are key indicators of the dynamic characteristics of a structure. Because transformer bushings are among the components most susceptible to seismic damage, the modal characteristics of the transformer–bushing system are examined in this section. Eigenvalue analyses were performed in Abaqus for the models without steel support (NS) and with steel support (WS). The selected bushing-dominated modes within the frequency range of 1–10 Hz are summarized in Table 1 and Table 2, and representative mode shapes are presented in Figure 3.
As shown in Table 1 and Table 2, the lowest eigenfrequency decreases from 1.84 Hz in the NS model to 1.47 Hz in the WS model. This downward shift primarily affects the low-frequency first-bending branch about the Y-axis. By contrast, the frequency ranges associated with first bending about the X-axis and second bending about both horizontal axes overlap substantially between the two configurations. The lower fundamental frequency reflects the increased flexibility introduced by the tank–support subsystem, while its influence on the seismic displacement and stress responses is evaluated in the subsequent sections.
As shown in Figure 3a,b, the representative first-bending mode of the NS model is dominated by the deformation of bushing A. In the WS model, however, the Y-axis bending of bushing A is accompanied by simultaneous bending of bushings B and C in the same direction. A similar change is observed in the representative second-bending modes shown in Figure 3c,d. In the NS model, the deformation is concentrated primarily in the second bending of bushing A about the X-axis. By contrast, bushings A and B simultaneously exhibit second bending about the X-axis in the WS model. These results indicate that the steel supports produce a more distributed modal deformation and suggest coupled modal deformation among the bushings.

2.4. Modal Participation Factors

To evaluate the influence of the steel supports on the modal mass distribution, the effective modal masses of the NS and WS models were accumulated over the modes within the 1–10 Hz frequency range. The resulting band-limited cumulative effective modal mass ratios in the three translational directions are summarized in Table 3.
As shown in Table 3, the WS model exhibits higher cumulative effective modal mass ratios than the NS model in all three translational directions. The ratio increases markedly from 1.73% to 10.61% in the X-direction and from 1.64% to 3.69% in the Y-direction, whereas only a slight increase from 1.31% to 1.40% is observed in the Z-direction. These results indicate that the steel supports redistribute a larger proportion of the horizontal translational modal mass into the 1–10 Hz range, particularly in the X-direction. Together with the downward shift of the low-frequency modal branch identified in Section 2.3, this redistribution can increase the contribution of these modes under ground motions with substantial spectral energy in the same frequency range.

3. Ground-Motion Input and Comparative Seismic Response Analysis

3.1. Selection and Input of Ground Motions

The transformer examined in this study is installed at a substation in Sichuan Province, China. According to GB 50260-2013 [52], Site Class II and design earthquake Group III correspond to a basic characteristic period of 0.45 s. The seismic fortification intensity is 9, and the design basic ground acceleration is 0.40 g. The target response spectrum adopted in the present analyses used a characteristic period of 0.50 s.
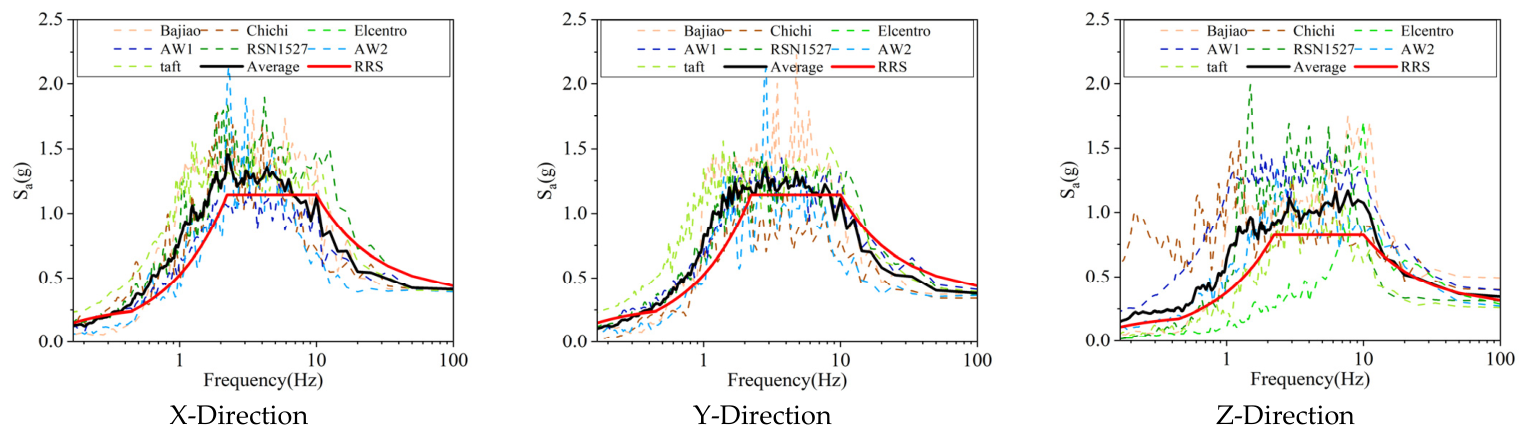
To comprehensively evaluate the seismic response of the transformer while accounting for site effects, seven ground motion records were selected as input motions, including five natural records (RSN1527, Taft, El Centro, Chi-Chi, and Bajiao) and two artificial records. Detailed information on the five natural ground-motion records is provided in Appendix C. Figure 4 presents the acceleration response spectra of the seven selected ground motions, along with their average spectrum and the site-specific design response spectrum. The average spectrum of the seven records provides a good fit to the target design spectrum, satisfying the code requirements. The ground motions were applied simultaneously in three directions with amplitude ratios of X:Y:Z = 1:0.85:0.65 to obtain the seismic responses of critical components. The peak ground acceleration (PGA) in the principal direction (X direction) was set to 0.4 g, with a damping ratio of 2%.

3.2. Seismic Stress Response Analysis

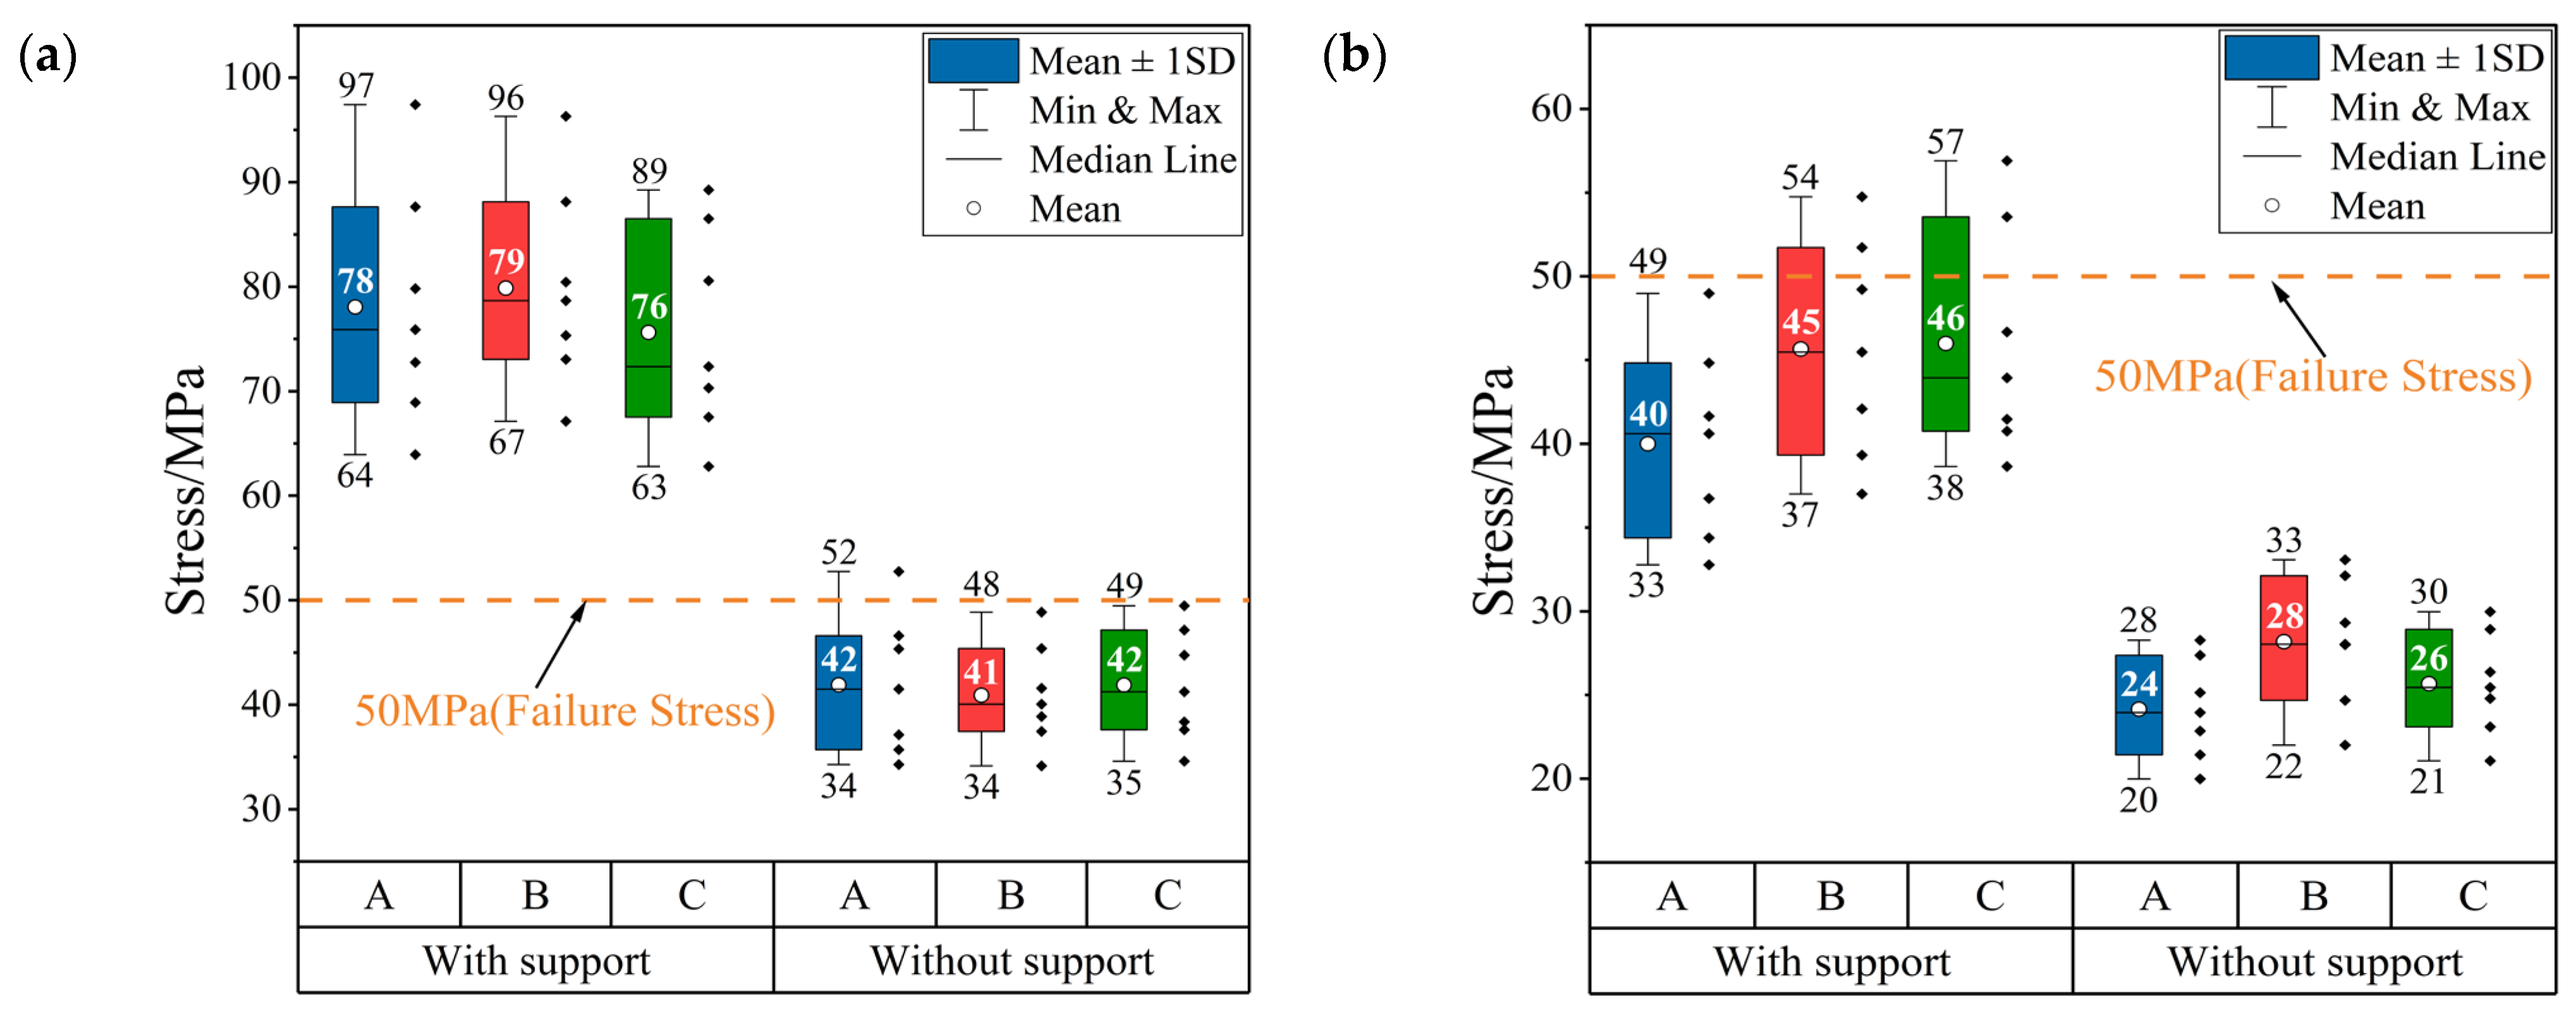
Post-earthquake investigations of 500 kV transformer bushings have identified the flange and end-fitting regions as critical damage locations [10,11]. A previous investigation of a comparable 500 kV transformer [47] documented tearing at the flange root of bushing HA and fracture at the roots of the porcelain housings of bushings HB and HC. The present study focuses on the latter porcelain-fracture mode. Because porcelain is a brittle material governed primarily by tensile fracture, the peak maximum principal tensile stress at the root of the air-side porcelain housing immediately above the flange was adopted as the primary stress-response measure. In the transformer considered here, each 8.83-m-long high-voltage bushing is mounted on a sidewall turret and behaves as a slender cantilever. The peak bushing-root stress was therefore adopted as a primary response measure. For each of the seven ground motions, the peak root stresses of the high- and medium-voltage bushings were extracted from the NS and WS models. Their distributions are summarized in Figure 5.
In the WS model, the mean peak root stresses of high-voltage bushings A, B, and C were 78.06, 79.87, and 73.91 MPa, respectively. Moreover, the record-wise peak stress of each high-voltage bushing exceeded the ultimate flexural strength of 50 MPa under all seven ground motions. The nominal strength-to-demand ratios based on the mean peak stresses, calculated as 50 / σ ¯ p e a k , were 0.63, 0.65, and 0.68 for bushings A, B, and C, respectively. Thus, the calculated mean demands of all three high-voltage bushings exceeded the specified reference strength in the WS model. High-voltage bushing A was selected to quantify the support effect. Its means peak root stress increased from 42.62 MPa in the NS model to 78.06 MPa in the WS model, corresponding to an increase of 83.1%. Its nominal strength-to-demand ratio consequently decreased from 1.17 to 0.63. Figure 5b shows a similar support-induced increase in the root stresses of the medium-voltage bushings, although their mean demands remained lower than those of the high-voltage bushings. Overall, the comparison shows that the steel supports substantially increased root stress of the bushings and provides the response basis for the isolation retrofit evaluated in Section 5.

3.3. Seismic Displacement Response Analysis

Power transformers are generally connected to adjacent substation equipment through flexible conductors. If the relative movement between connected terminals exceeds the available conductor slack, the resulting interaction may introduce additional tensile demand into both the bushing and the adjacent equipment [35]. Therefore, the bushing-top displacement relative to the ground was evaluated for the transformer models. For each ground motion, the peak ground-relative displacement in each horizontal direction was extracted, and the resulting record-wise peak values were averaged over the seven motions. The results are summarized in Table 4.
The installation of steel supports markedly increased the displacement demand of all three high-voltage bushings. In the X direction, the average peak displacements of bushings A, B, and C increased from 162, 146, and 167 mm without steel support to 371, 352, and 344 mm with steel support, respectively. These changes correspond to increases of 129.0%, 141.1%, and 106.0%. When averaged over the three bushings, the X-direction displacement increased from 158.3 to 355.7 mm, representing an overall increase of 124.6%. A similar, although less pronounced, increase was observed in the Y direction. The peak displacements of high-voltage bushings A, B, and C increased from 92, 86, and 87 mm to 181, 136, and 162 mm, respectively. The corresponding three-bushing average increased from 88.3 to 159.7 mm, or by 80.8%.
Although the absolute displacements of the medium-voltage bushings were lower than those of the high-voltage bushings, their relative increases were equally pronounced. In the X direction, the displacements of medium-voltage bushings A, B, and C increased from 49, 59, and 46 mm to 125, 118, and 111 mm. The corresponding three-bushing average increased from 51.3 to 118.0 mm, representing an increase of 129.9%. In the Y direction, the respective displacements increased from 23, 28, and 22 mm to 63, 58, and 57 mm. The phase-averaged value consequently increased from 24.3 to 59.3 mm, or by 143.8%. Thus, the steel-support effect extended to the medium-voltage components and was not confined to the slenderer high-voltage bushings. These results indicate that the steel-supported configuration produced a broad increase in bushing-top displacement while also increasing the variation among bushings at different installation positions. The connection layout and conductor slack should therefore be checked explicitly when steel-supported transformers are installed in high-seismicity regions.

3.4. Seismic Acceleration Response Analysis

To characterize acceleration amplification along the bushing assemblies, responses were evaluated at four locations: the ground input, turret bottom (TB), turret top (TT), and bushing top (BT). The acceleration amplification factor (AAF) was defined as
AAF = max t a ( t ) PGA
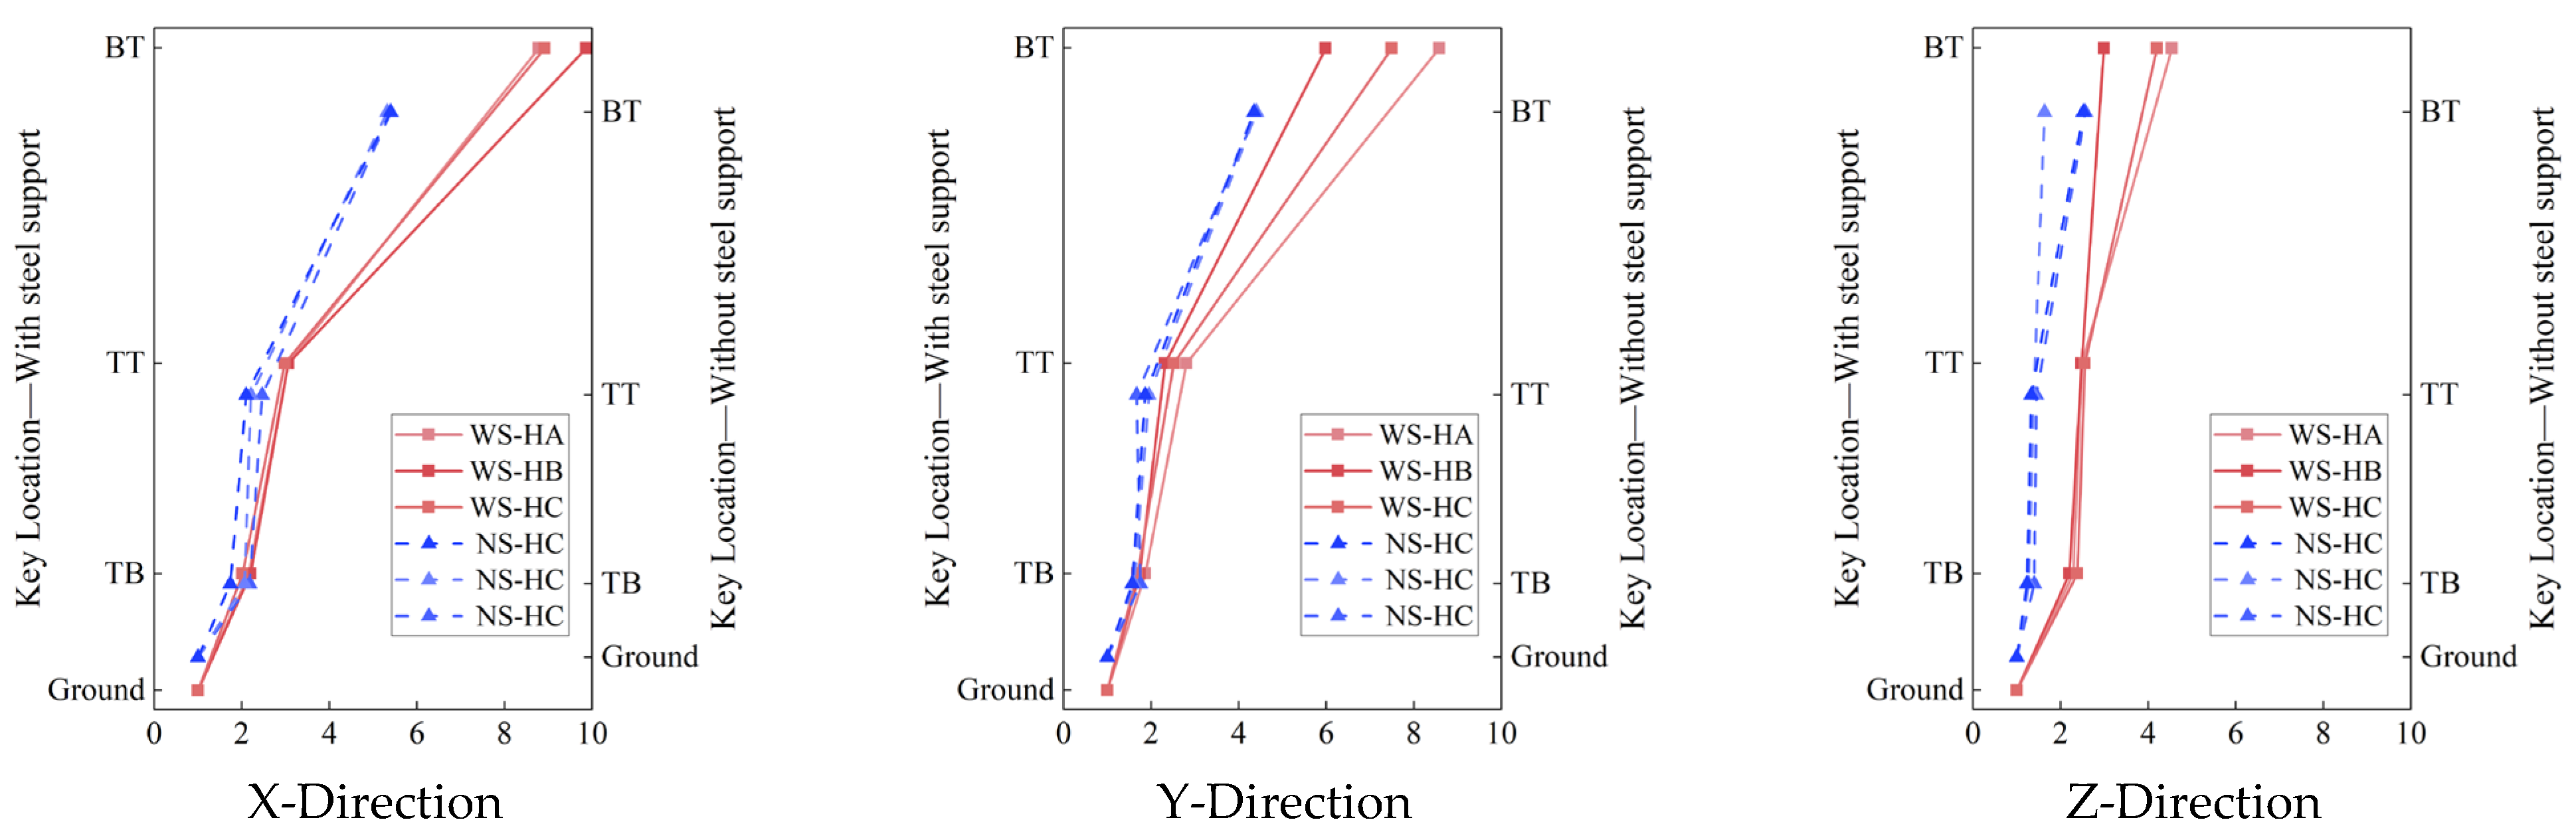
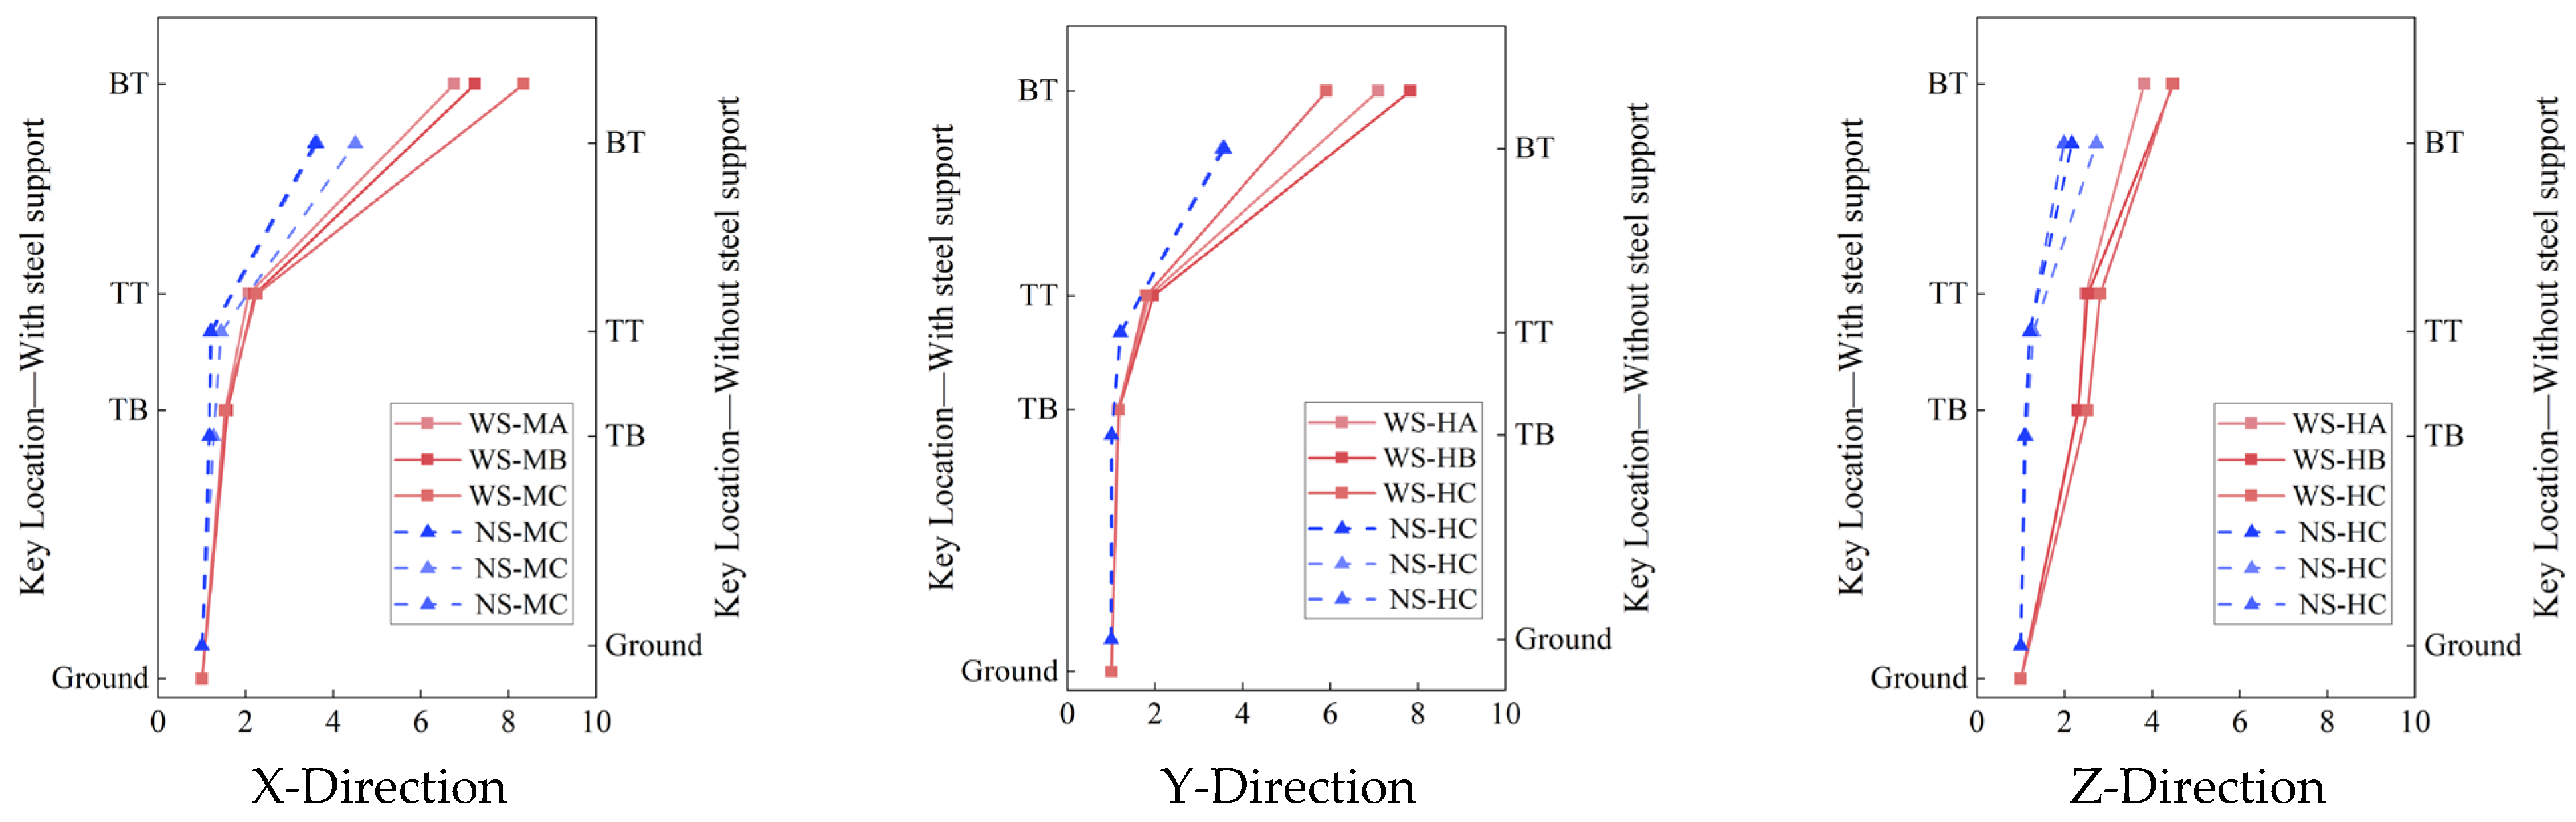
where a(t) is the absolute acceleration response time history and PGA is the peak ground acceleration of the corresponding input component. The factors were calculated separately for the seven ground motions and then averaged. Figure 6 and Figure 7 compare the resulting profiles for the three high- and medium-voltage bushings, respectively.
For the high-voltage bushings, the record-averaged bushing-top factors were higher in the WS model. In the X direction, the factors ranged from 8.78 to 9.86 in the WS model, compared with 5.32–5.40 in the NS model. The average value increased from 5.37 to 9.19, corresponding to an increase of approximately 71%. In the Y direction, the corresponding ranges were 5.99–8.58 and 4.35–4.41, and the phase-averaged value increased from 4.38 to 7.35, or by approximately 68%. In the Z direction, the factors increased from 1.63–2.56 in the NS model to 2.99–4.54 in the WS model. The corresponding phase average increased from 2.24 to 3.91, representing an increase of approximately 75%.
The response profiles show that the steel-support effect varied along the height of the assembly. In the X direction, the high-voltage turret-top factors were approximately 2.98–3.06 with steel supports and 2.10–2.21 without steel supports. The difference between the two configurations then increased sharply from the turret top to the bushing top. A similar pattern was observed in the Y direction. In contrast, the Z-direction difference was already evident at the turret bottom and turret top. Moreover, the Z-direction response did not increase monotonically between every pair of locations. The steel supports therefore changed not only the bushing-top response but also the distribution of acceleration demand along the tank–turret–bushing transmission path. The medium-voltage bushings exhibited the same overall increase. In the X direction, the bushing-top factors ranged from 5.76 to 8.35 with steel supports, compared with 3.57–4.50 without steel supports. Their average increased from 3.90 to 7.11, corresponding to an increase of 82.4%. In the Y direction, the bushing-top factors increased from 3.53–3.58 to 5.91–7.82, and the average increased from 3.56 to 6.94, or by 95.3%. In the Z direction, the respective ranges were 3.81–4.48 and 1.98–2.73. The average consequently increased from 2.29 to 4.25, representing an increase of 85.6%.
Across the two voltage classes and three excitation directions, the phase-averaged bushing-top acceleration amplification factor increased by approximately 68–95% in the WS model. For the analyzed transformer and ground-motion set, these results, together with the stress and displacement responses, show that the steel supports increased the acceleration demands on both the high- and medium-voltage bushings. Section 4 subsequently examines the spectral characteristics and coupled motions responsible for the observed amplification.

4. Analysis of Seismic Response Amplification Mechanisms

4.1. Frequency-Response Characteristics Analysis

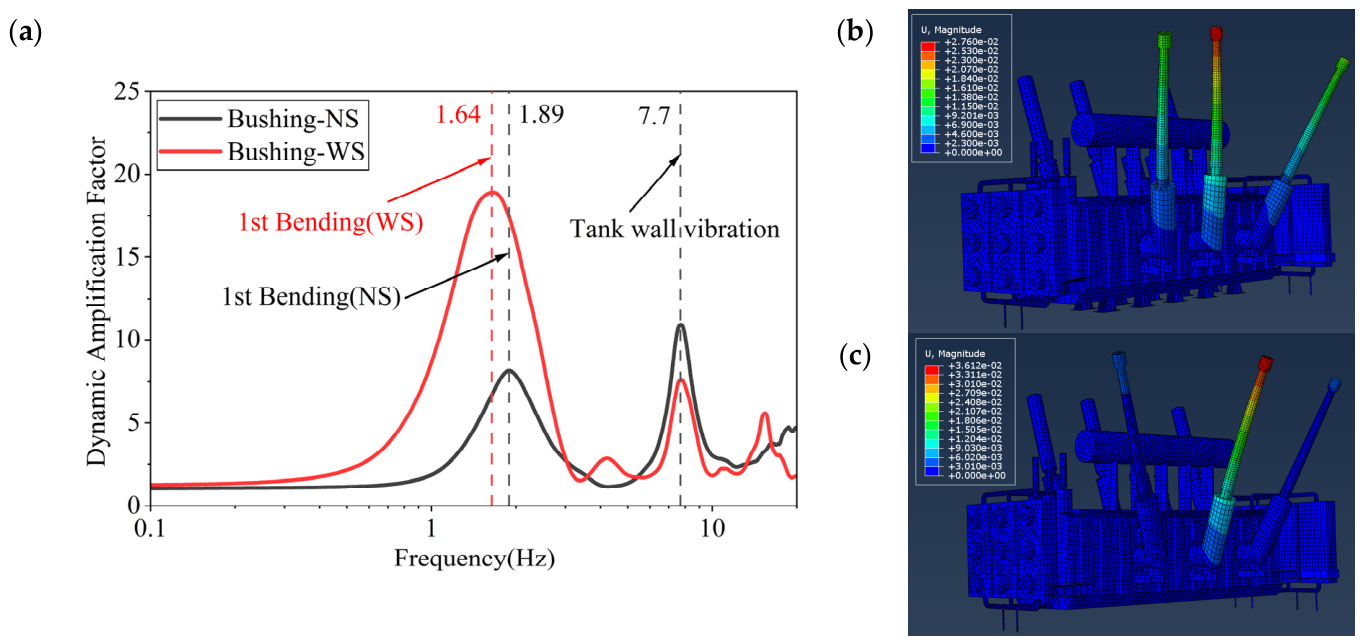
To clarify the frequency-domain origin of the response increases reported in Section 3, the X-direction response of high-voltage bushing A was selected as a representative case. Figure 8 compares the frequency-response functions (FRFs) of the transformer configurations with steel support (WS) and without steel support (NS), together with the corresponding mode shapes. This comparison characterizes how the steel supports redistribute the dynamic amplification among the principal vibration branches of the transformer-bushing system.
Without steel support, the dominant low-frequency peak occurs at approximately 1.89 Hz, with a dynamic amplification factor of about 8. After the steel supports are introduced, the corresponding peak shifts to approximately 1.64 Hz, while its magnitude increases to about 19. The associated mode shapes identify both peaks as the first-order bending response of high-voltage bushing A about the Y axis. These frequencies are also consistent with the first-order bending ranges reported in Table 1 and Table 2: 1.84–1.98 Hz without steel support and 1.47–1.92 Hz with steel support. The steel supports therefore reduce the characteristic frequency of this bending branch by approximately 13% while increasing its frequency-response amplitude by more than twofold. This result indicates that the supports strengthen the transmission of ground motion through the low-frequency first-bending branch.
A different trend is observed in the higher-frequency range. The secondary peak near 7.7 Hz is associated with tank-wall vibration. Its magnitude decreases from approximately 11 in the NS configuration to approximately 8 in the WS configuration. Thus, the steel supports do not amplify the response uniformly over the entire frequency range. Instead, they redistribute the frequency-dependent amplification: the dominant response becomes concentrated in the low-frequency first-bending range, whereas the contribution of the 7.7 Hz tank-wall vibration to the X-direction response of bushing A is reduced. This redistribution is consistent with the increased seismic response observed in Section 3 and indicates that the enhanced low-frequency bending branch is an important contributor to the response amplification.

4.2. Tank Rocking and Torsional Responses

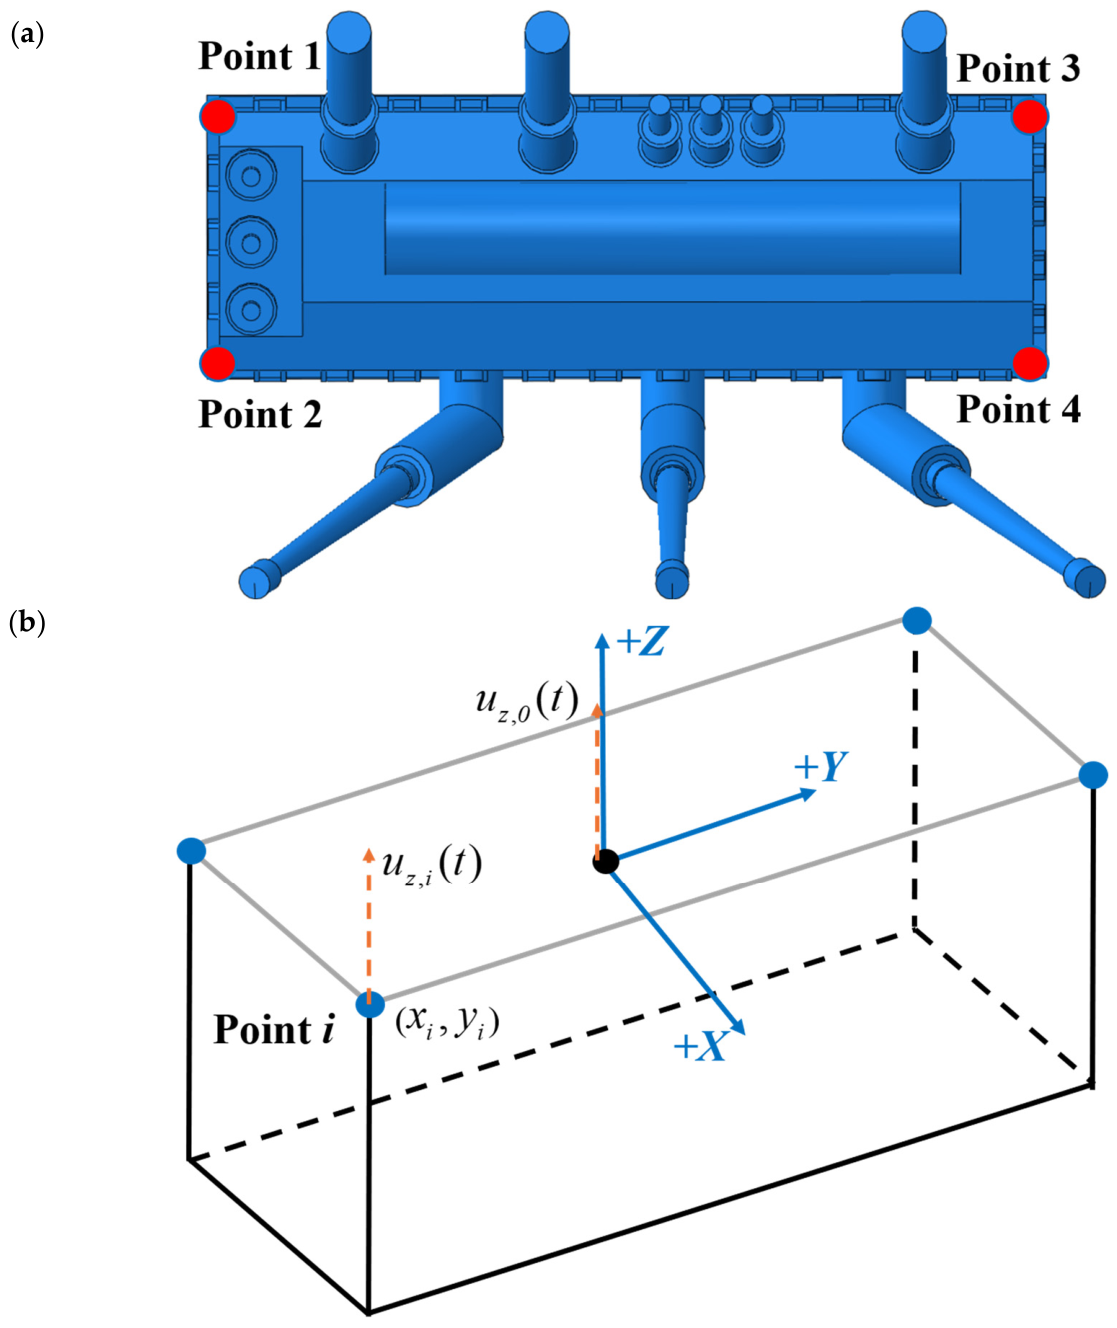
To investigate the kinematic mechanism underlying the spectral amplification identified in Section 4.1, the rocking and torsional rotations of the transformer tank were estimated from the translational displacement histories of four corner points. As illustrated in Figure 9, the four points were located on the same horizontal reference plane. The coordinate origin O was defined at the centroid of this plane, xi and yi denote the horizontal coordinates of point i relative to O. The vertical displacements at the origin and point i are denoted by u z , 0 ( t ) and u z , i ( t ) , respectively.
Under the small-rotation assumption, the vertical displacement at corner i can be expressed as
u z , i ( t ) = u z , 0 ( t ) + θ x ( t ) y i θ y ( t ) x i
where u z , 0 denotes the vertical translation at the centroid of the four-point plane. The θ x and θ y are the rocking rotations about the X and Y axes, respectively. The vertical translation was calculated as the mean of the four vertical displacements. The two rocking rotations were obtained from the differences between the mean vertical displacements of the corresponding opposite edges. The resultant rocking rotation was then calculated as
θ R ( t ) = θ x 2 ( t ) + θ y 2 ( t )
For the torsional response, the common horizontal translations were first removed from the corner displacements. The rotation about the vertical axis was subsequently estimated as
θ z ( t ) = i y i u ˜ x , i ( t ) + x i u ˜ y , i ( t ) i x i 2 + y i 2
where u ˜ x , i and u ˜ y , i denote the horizontal displacements relative to their respective four-point averages. The peak values of θ R and θ z were calculated for each of the seven ground motions.
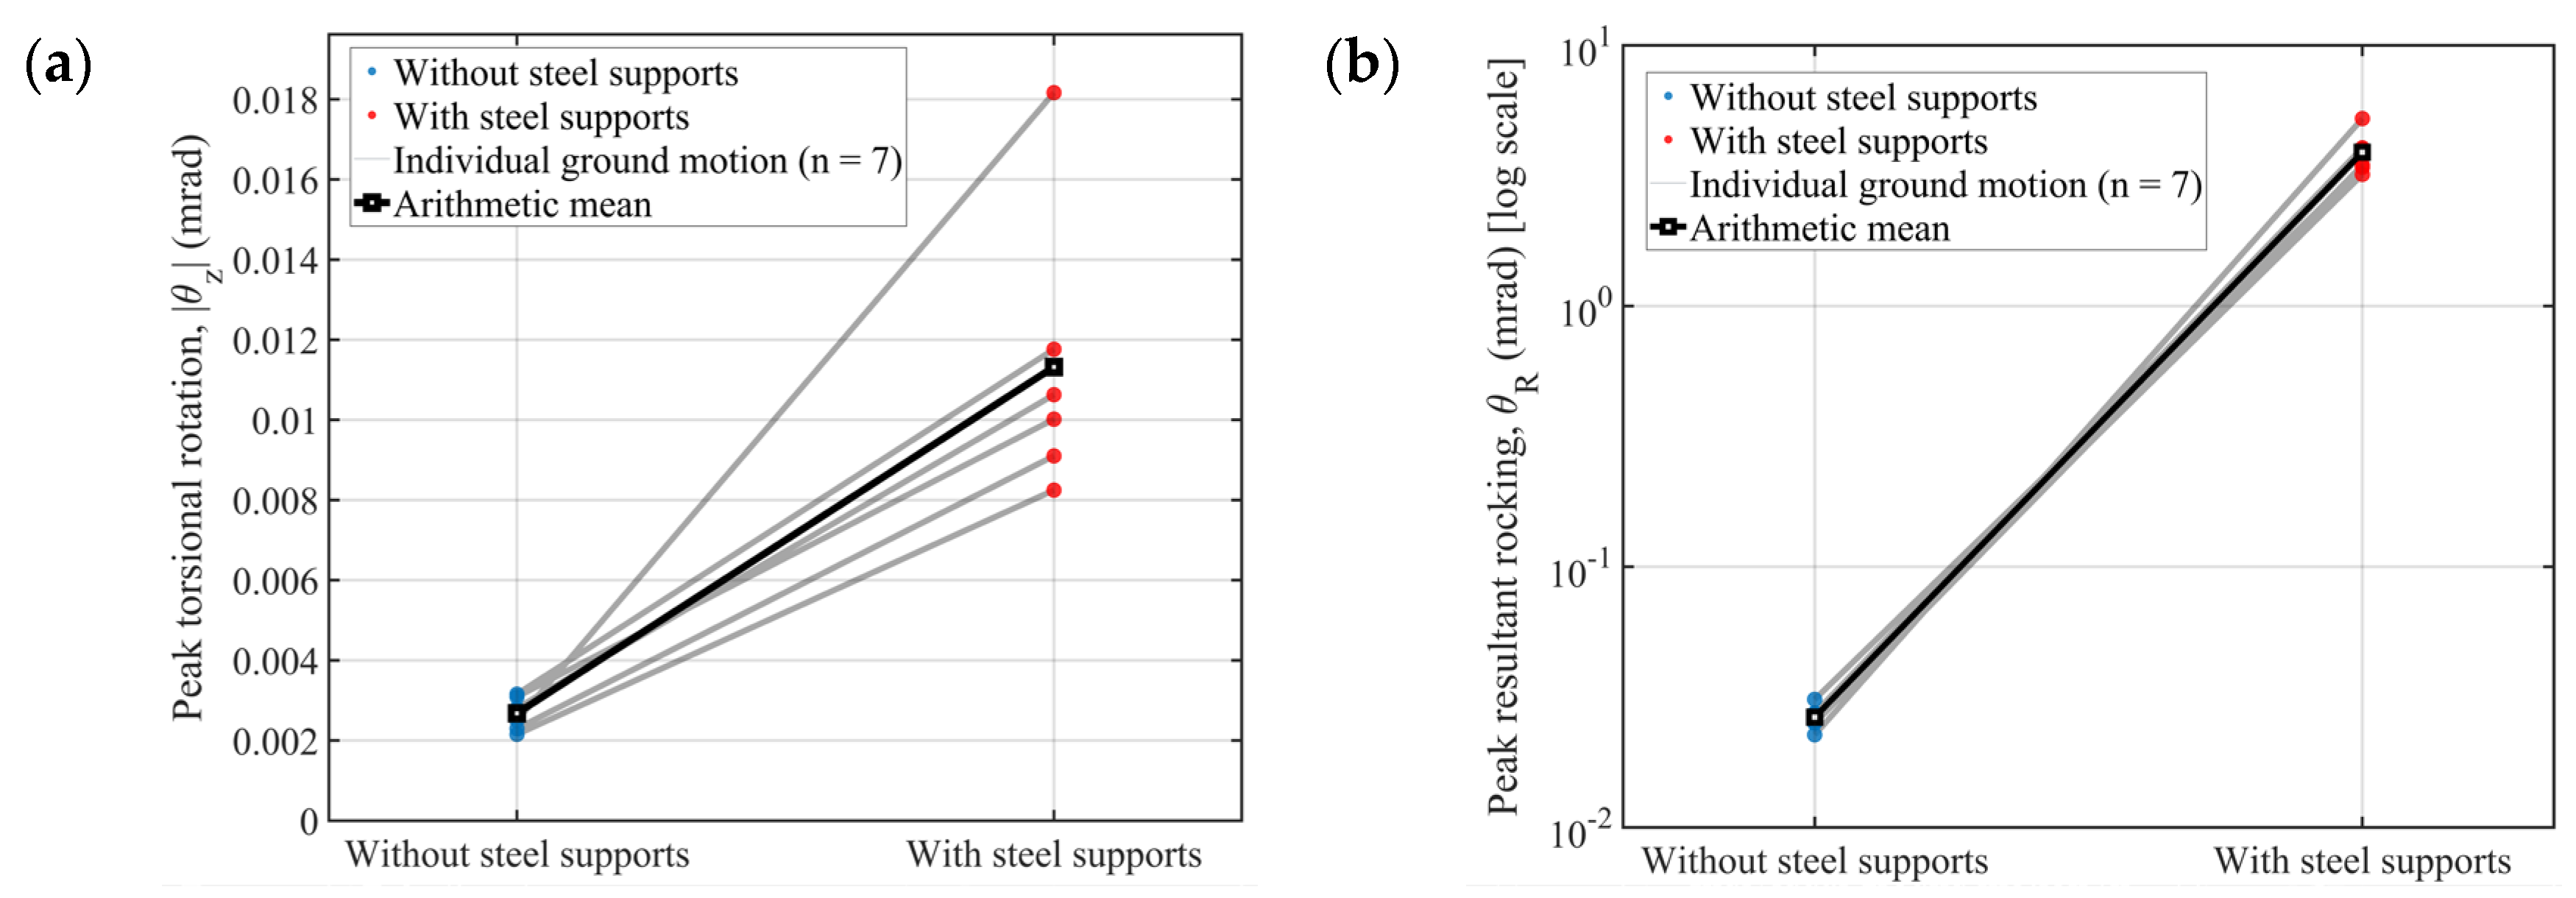
Figure 10 compares the peak rotational responses of the WS and NS models. Under all seven ground motions, the WS model exhibits larger peak absolute torsional rotations and peak resultant rocking rotations than the NS model. The arithmetic mean of the peak absolute torsional rotations increases from 0.00268 mrad in the NS model to 0.01132 mrad in the WS model, corresponding to an amplification factor of approximately 4.22. The arithmetic mean of the peak resultant rocking rotations increases from 0.02646 to 3.89109 mrad. These consistent trends across the seven ground motions show that the steel supports markedly amplify the global rotational response of the transformer tank, with rocking exhibiting the larger relative change.
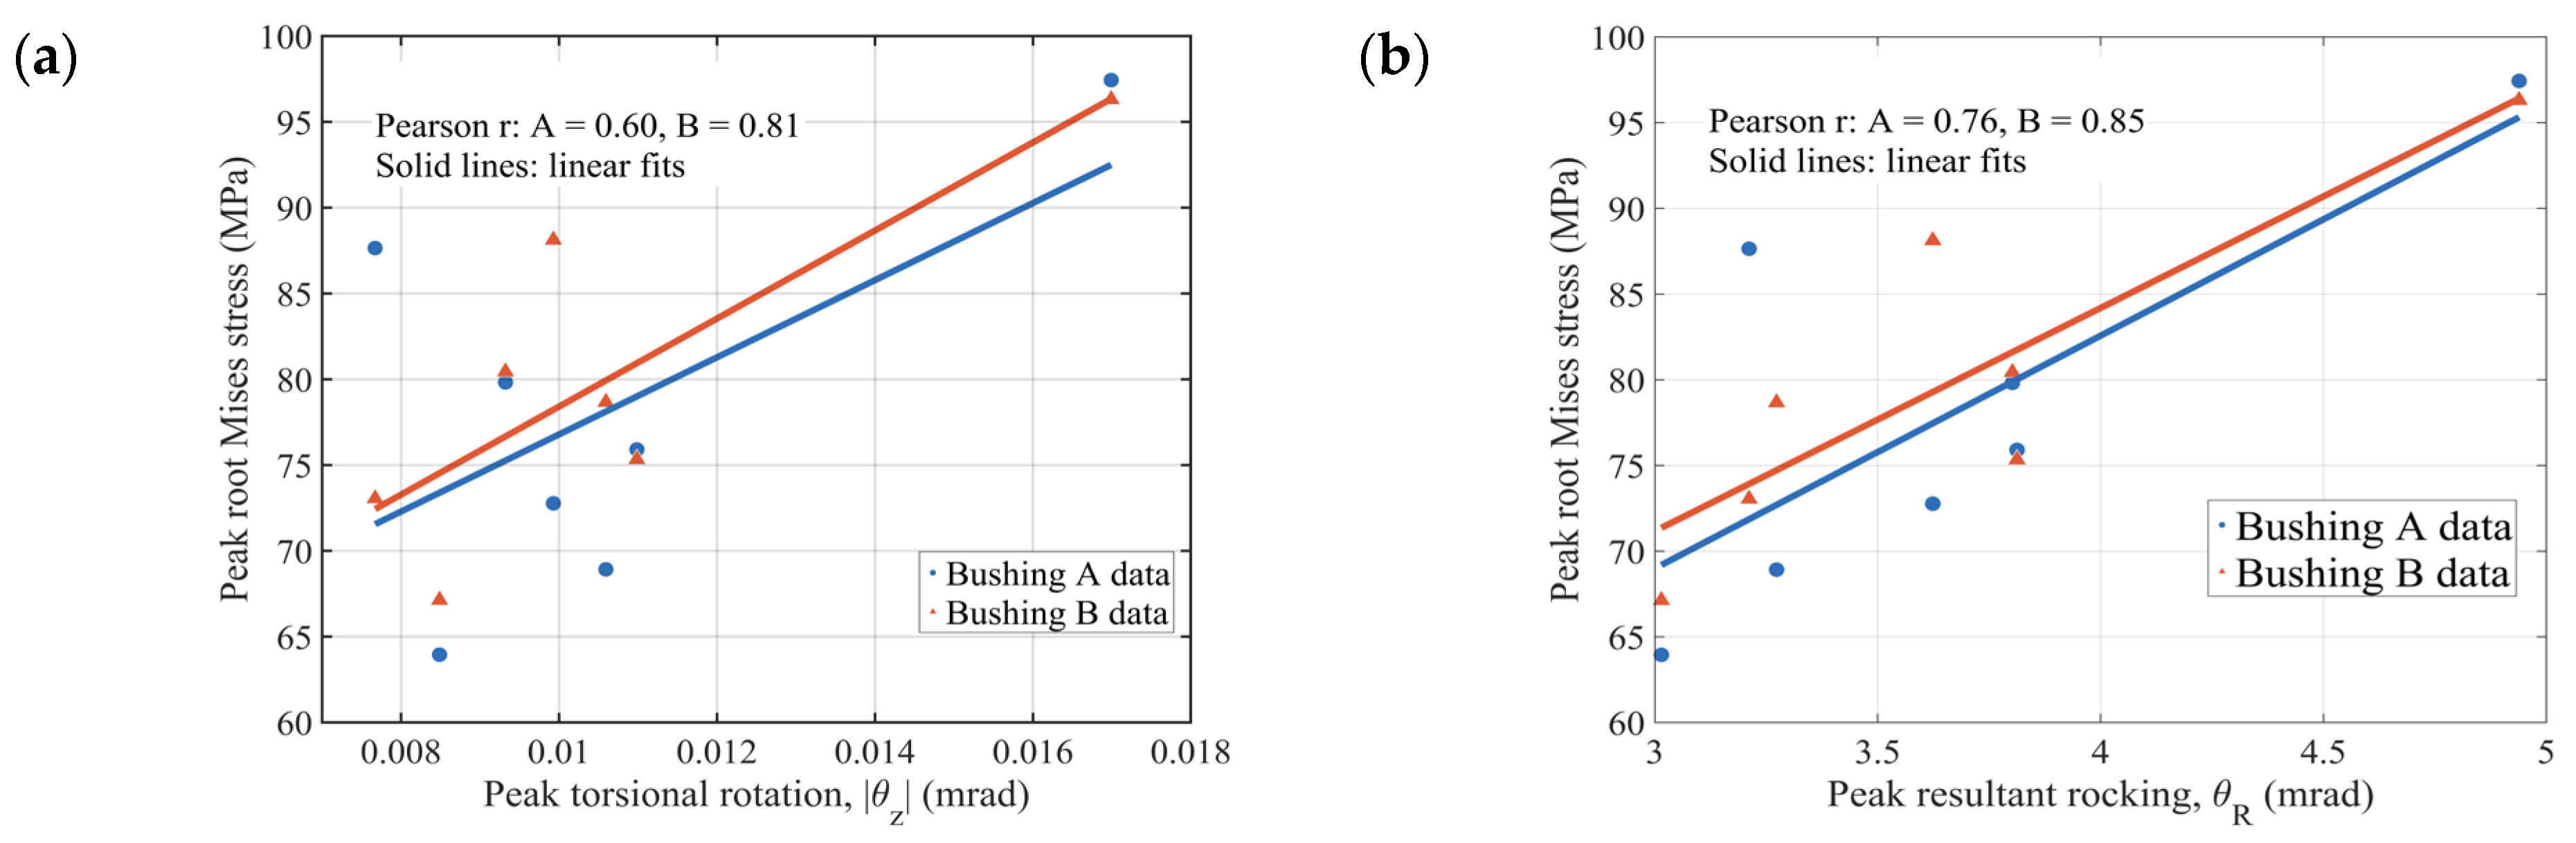
Figure 10 compares the peak rotational responses of the transformer configurations with steel supports (WS) and without steel supports (NS). Under all seven ground motions, the WS model exhibited larger peak absolute torsional rotations and peak resultant rocking rotations than the NS model. The arithmetic mean of the peak absolute torsional rotations increased from 0.00268 mrad in the NS model to 0.01132 mrad in the WS model, corresponding to an amplification factor of approximately 4.22. The arithmetic mean of the peak resultant rocking rotations increased from 0.02646 to 3.89109 mrad. The consistent trends across the seven ground motions show that the steel support amplified the global rotational response of the transformer tank, with rocking exhibiting the larger relative change. To examine whether the amplified tank rotations are associated with the bushing stress response, Figure 11 presents the relationship between the peak tank rotations and the peak maximum principal tensile stresses at the porcelain-housing roots of high-voltage bushings A and B in the WS model. For bushing A, the Pearson correlation coefficients between the peak bushing-root stress and the peak torsional and resultant rocking rotations are 0.60 and 0.76, respectively. The corresponding coefficients for bushing B are 0.81 and 0.85. All four relationships are positive, with stronger associations observed for bushing B. For both bushings, the root stress also shows a stronger association with rocking than with torsion.
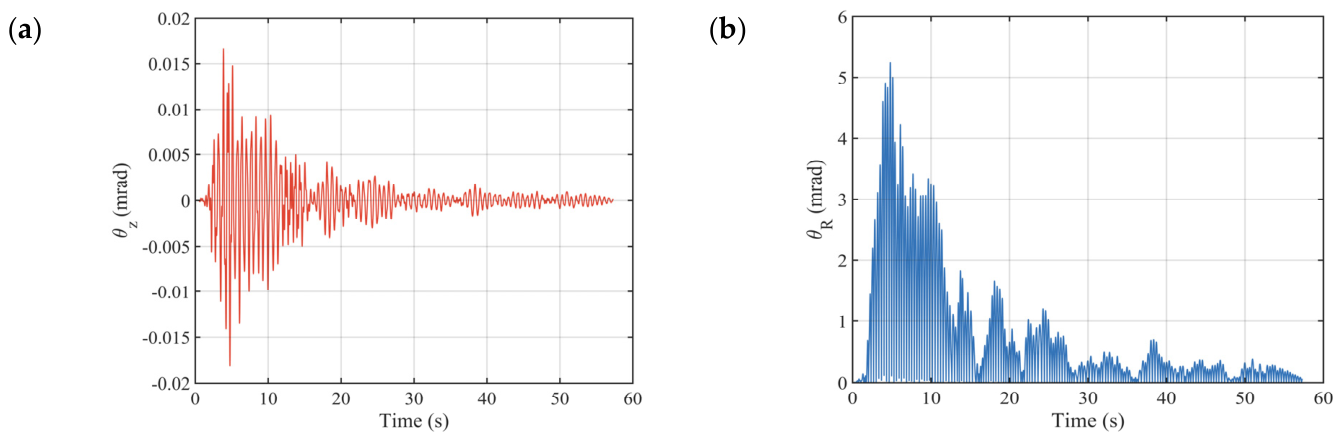
The response comparisons in Section 3 and the rotational analysis presented here provide complementary evidence of the influence of the steel support. Section 3 quantifies the increases in the peak root stresses of the high-voltage bushings, whereas Figure 10 shows that the same change in support configuration markedly amplifies tank rocking and torsion. The positive associations in Figure 11 show that ground motions producing larger peak tank rotations generally also produce higher peak root stresses. This relationship is consistent with the kinematic transfer of tank motion to the bushings. Tank rocking changes the instantaneous inclination of the turret attachment region and the orientation of the bushing mounting flange, whereas tank torsion produces position-dependent tangential displacements about the vertical axis. Through the tank–turret–flange assembly, these rotational motions are transmitted to the bushing bases as additional translational and rotational inputs and may therefore contribute to the bushing root-stress demand. To further examine the temporal development of the amplified rotations, Figure 12 presents the torsional and resultant rocking rotation histories of the WS model under the RSN1527 ground motion. The absolute torsional rotation reaches a peak value of 0.01816 mrad at approximately 4.76 s, whereas the resultant rocking rotation reaches a peak value of 5.239 mrad at approximately 4.81 s.
Taken together, Section 4.1 and Section 4.2 identify mechanisms underlying the amplified bushing response. The detailed analysis of bushing A showed that the steel supports selectively enhanced the response associated with the low-frequency first bending mode rather than producing uniform broadband amplification. At the system level, the steel support also amplifies rocking and torsion. Within the WS model, the peak tank rotations are positively associated with the peak root stresses of bushings A and B, with stronger associations observed for bushing B. These results are consistent with amplified tank rotations contributing to the increased bushing root-stress demand.

5. Isolation Retrofit and Performance Assessment

5.1. Seismic Isolation Bearing Arrangement and Design

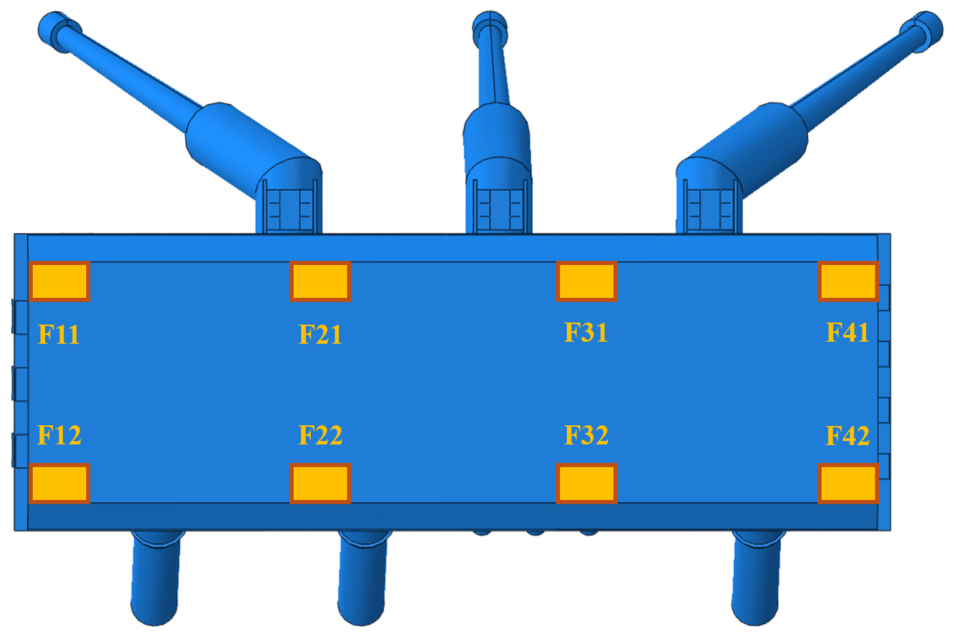
The response amplification identified in Section 3 and Section 4, particularly the increased root stresses of the high-voltage bushings, motivated the evaluation of a base-isolation retrofit. Double friction pendulum (DFP) bearings were introduced beneath the existing steel supports, and their performance was evaluated by comparing the original steel-supported model (WS) with the isolated model (ISO). In the ISO model, eight DFP bearings were installed between the steel-supported transformer assembly and the foundation. As shown in Figure 13, the bearings were arranged in two rows and four columns. The center-to-center spacing between the two rows in the transverse direction was 4.0 m, whereas that between adjacent columns in the longitudinal direction was 3.0 m. Conceptually, installation could be carried out during a planned outage using controlled lifting and temporary supports, with locally adapted foundation interfaces and connections to transfer loads through the bearings. Conductors, pipes and grounding connections would need to accommodate the isolation movement, with appropriate seismic gaps, displacement restraints and access for inspection and maintenance. These provisions require design and verification of the actual equipment and site conditions.
All eight DFP bearings were assigned identical nominal properties. The sliding-surface curvature radius was 774 mm; the effective friction coefficient was 0.11; and the equivalent yield displacement was 2.5 mm. In the finite-element model, an equivalent nonlinear force–displacement relationship was used to represent horizontal sliding, frictional energy dissipation, and gravity-induced restoring action. In Abaqus, the bearings were modeled using Bushing connectors with horizontal elastic–plastic behavior and kinematic hardening, together with finite vertical elastic stiffness. The sliding-surface curvature radius governed the gravitational restoring stiffness, the friction coefficient controlled the sliding resistance and energy-dissipation capacity, and the yield displacement defined the transition from the initial response branch to the sliding branch. The WS and ISO models were subjected to the same seven ground motions, input intensities, and structural damping parameters described in Section 3. For each analysis, the initial equilibrium state under self-weight was established before the ground-motion excitation was applied. The peak root stresses of the high-voltage bushings were adopted as the primary performance measure, enabling the stress-reduction effectiveness of the DFP isolation scheme to be quantified.

5.2. Assessment of Seismic Isolation Efficacy

The WS model was adopted as the pre-isolation baseline. Under each ground motion, its peak bushing root stresses were compared with those of the ISO model. The isolation efficiency based on the peak root stress was defined as
η = 1 σ i s o p e a k σ W S p e a k × 100 %
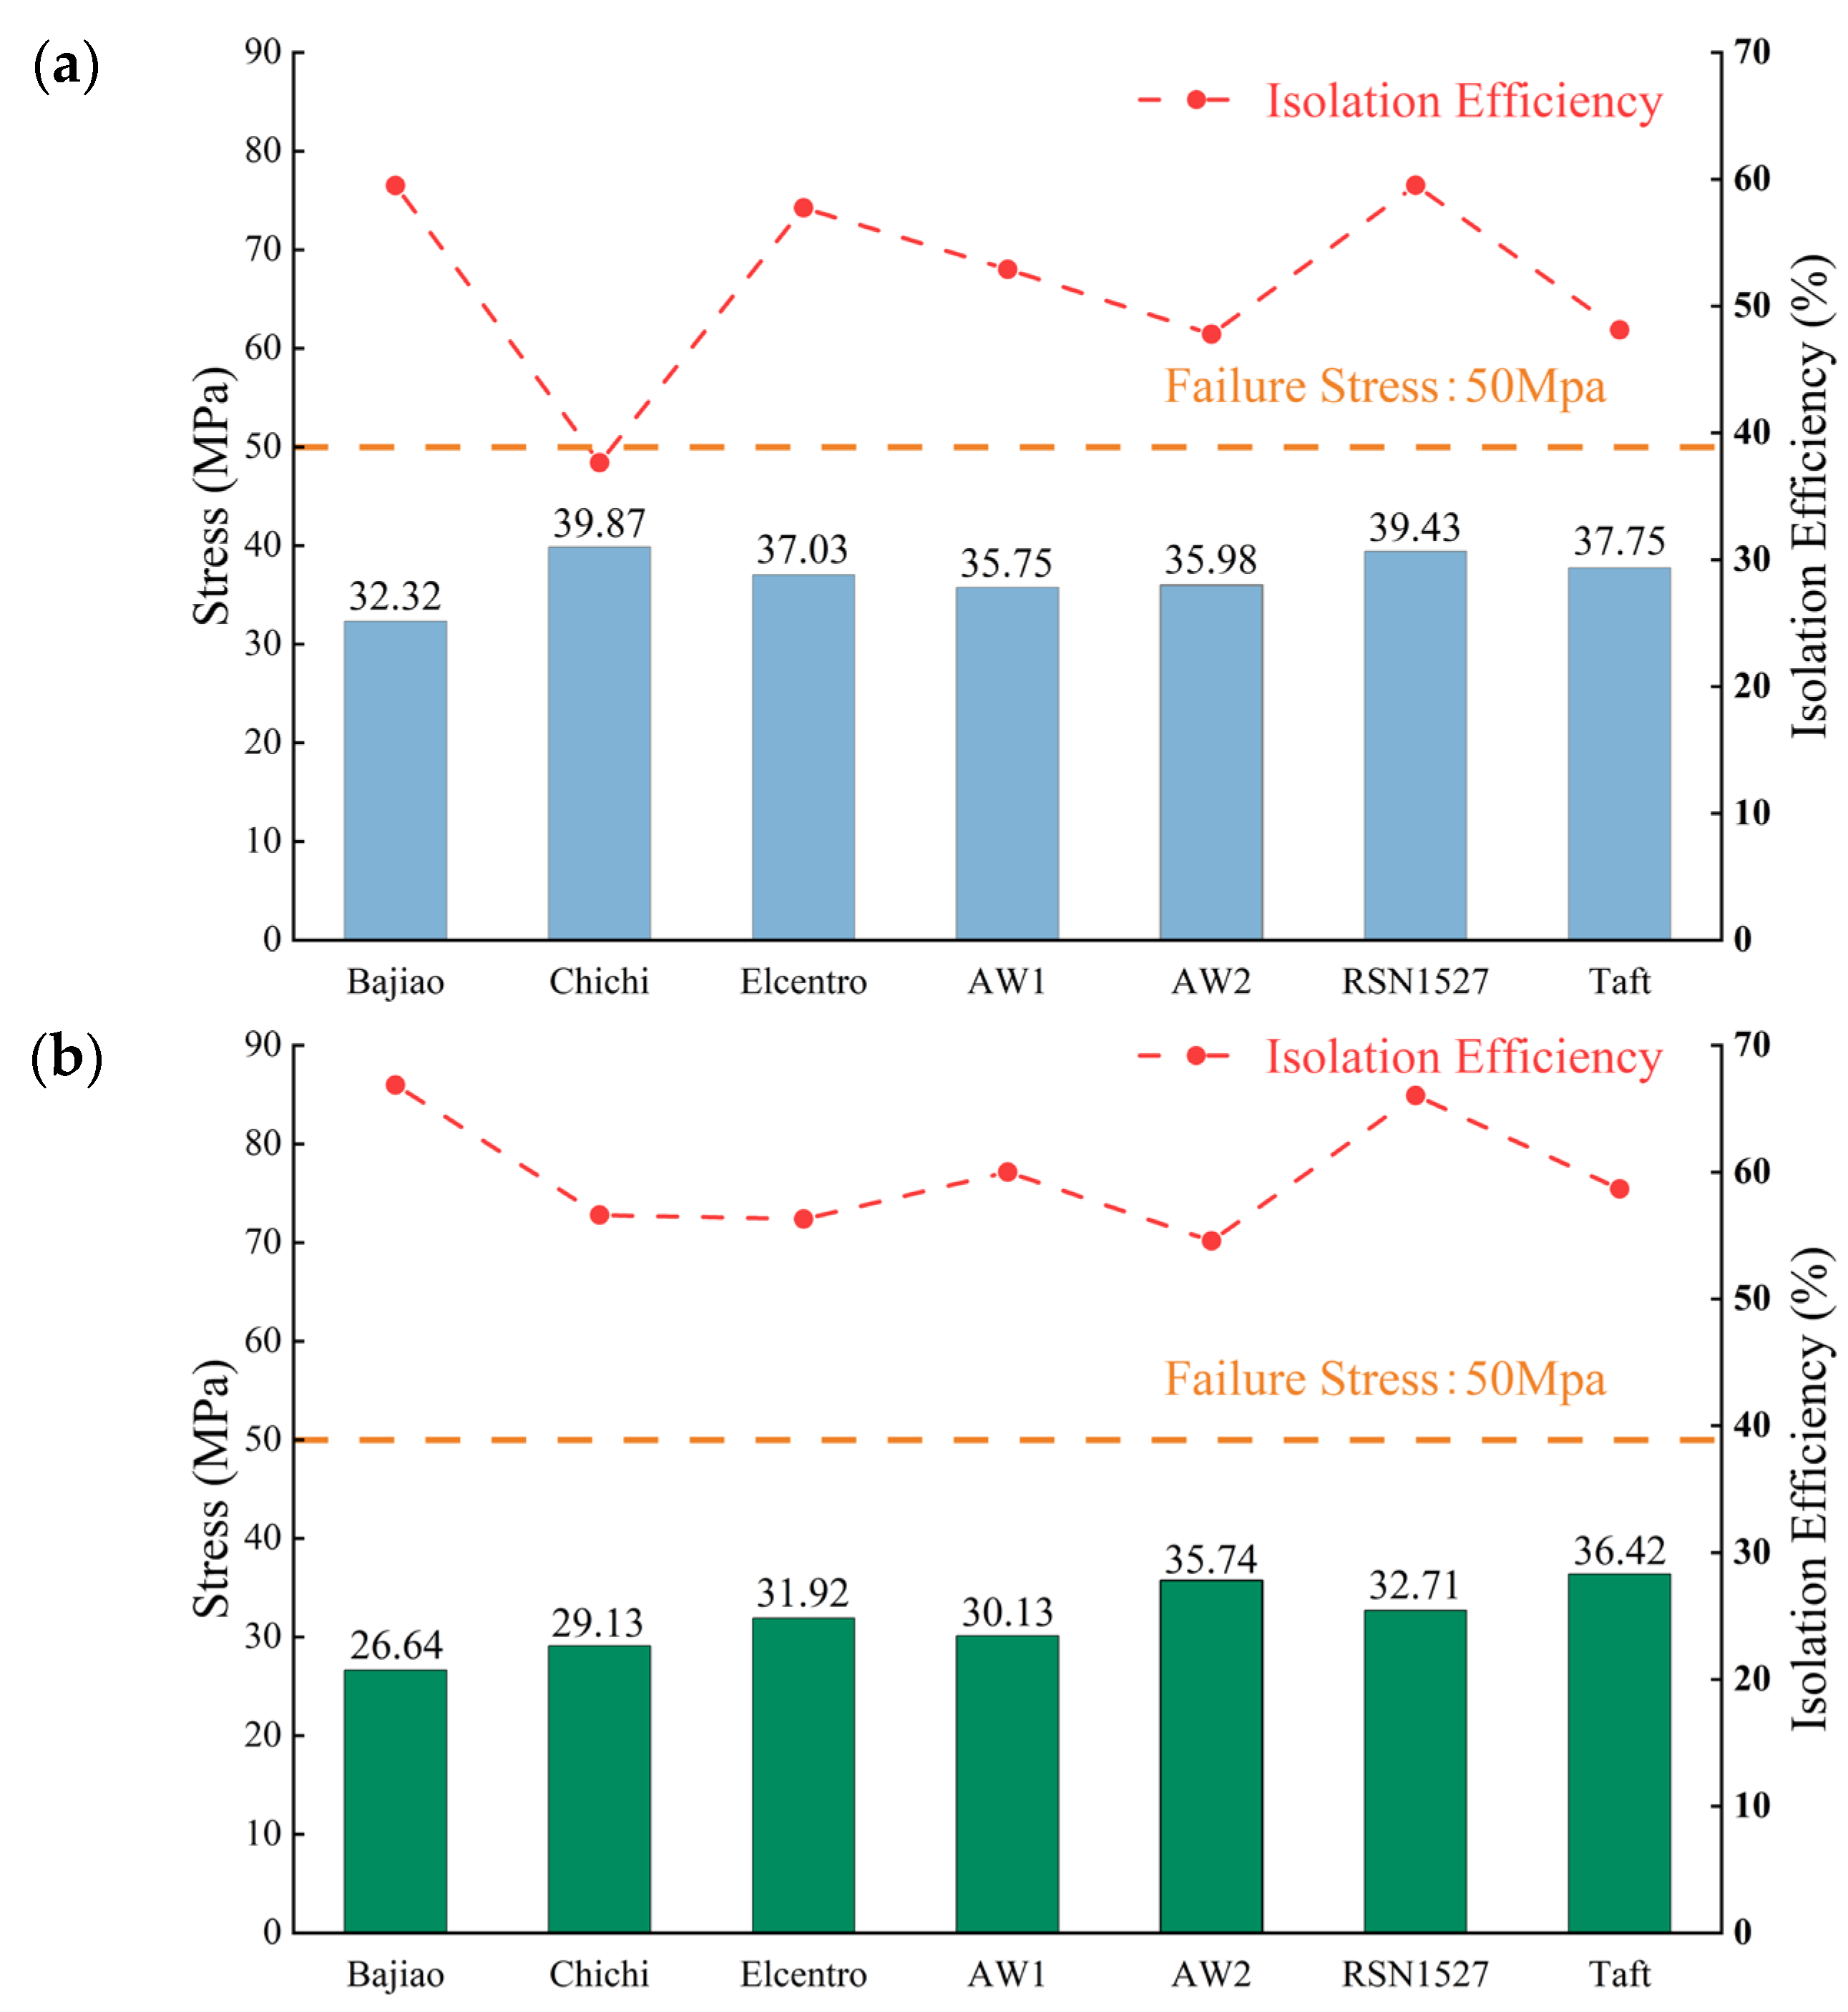
where σ i s o p e a k and σ W S p e a k are the peak maximum principal tensile stresses at the porcelain-housing roots obtained from the ISO and WS models under the same ground motion, respectively. The value of η represents a reduction in peak root stress after isolation. High-voltage bushings A and C have symmetric mounting configurations, whereas bushing B is installed in a different configuration. Figure 14 presents the peak root stresses in the ISO model and the corresponding isolation efficiencies for these two representative bushings A and B.
As shown in Figure 14a, the isolated peak root stresses of bushing A ranged from 32.32 to 39.87 MPa, with a mean of 36.88 MPa. The minimum value of 32.32 MPa occurred under the Bajiao ground motion, whereas the maximum value of 39.87 MPa occurred under the Chi-Chi ground motion. The corresponding isolation efficiencies ranged from approximately 38% to 60%, with a mean value of approximately 52%. Although the degree of reduction varied among the ground motions, isolation reduced the peak root stress in every case. Figure 14b presents the corresponding results for bushing B. Its isolated peak root stress ranged from 26.64 to 36.42 MPa, with an arithmetic mean of 31.81 MPa. The minimum value of 26.64 MPa was obtained under the Bajiao ground motion, and the maximum value of 36.42 MPa occurred under the Taft ground motion. The isolation efficiencies ranged from approximately 64% to 66%, with a mean value of approximately 59%. Before isolation, the peak maximum principal tensile stresses at the porcelain-housing roots of bushings A and B exceeded the manufacturer-specified reference strength of 50 MPa under all seven ground motions, indicating an elevated risk of bushing failure. After the DFP bearings were introduced, all peak values remained below this reference strength. The maximum isolated stresses of bushings A and B were 39.87 and 36.42 MPa, respectively. These values were 10.13 and 13.58 MPa below the 50 MPa thresholds. Within the ground motions and isolation parameters considered in this study, the DFP bearings therefore reduced the root-stress demands of both representative bushing mounting configurations to below the specified strength.
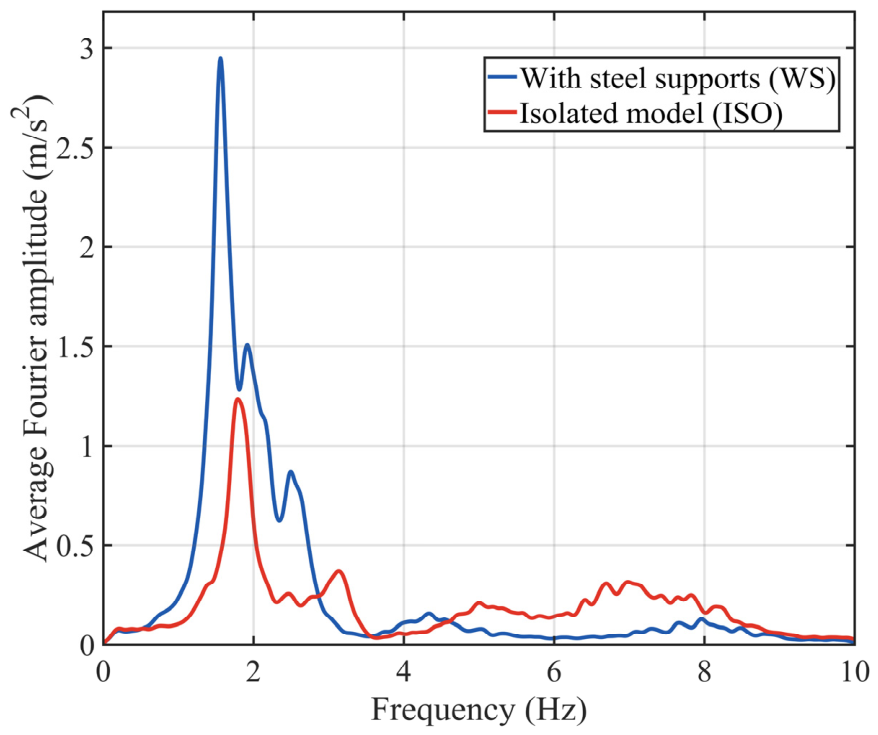
To examine the isolation effect in the frequency domain, the X-direction acceleration at the top of high-voltage bushing A was selected as a representative response. Figure 15 compares the Fourier amplitude spectra averaging over the seven ground motions. The WS model exhibited a pronounced dominant spectral peak near 1.6 Hz, with an amplitude of approximately 2.9 m/s2. In the ISO model, the maximum spectral amplitude was reduced to approximately 1.2 m/s2 near 1.8 Hz. The isolation system therefore substantially attenuated the dominant low-frequency acceleration response. Although the ISO spectrum exceeded the WS spectrum over parts of the higher-frequency range, these components remained below approximately 0.4 m/s2. Their amplitudes were considerably smaller than the dominant low-frequency peak of the WS model. Overall, Figure 14 and Figure 15 show that the DFP isolation system reduced the peak root stresses associated with both representative bushing mounting configurations and attenuated the dominant low-frequency acceleration response of bushing A. These complementary results demonstrate the effectiveness of the proposed isolation scheme within the range of ground motions and bearing parameters considered in this study.

6. Conclusions

This study investigated the seismic response amplification induced by steel supports in a 500 kV transformer and evaluated a double friction pendulum (DFP) base-isolation retrofit. The main conclusions are as follows:
(1)
Compared with the configuration without steel supports (NS), the configuration with steel supports (WS) exhibited higher peak root stresses, bushing-top displacements, and acceleration responses.
In the WS model, the mean peak maximum principal tensile stresses at the roots of all three high-voltage porcelain housings exceeded the manufacturer-specified reference strength of 50 MPa, indicating an elevated risk of bushing failure associated with tensile fracture of the porcelain housing.
(2)
Steel support enhanced the low-frequency first-bending response of high-voltage bushing A and amplified the rocking and torsional motions of the transformer tank, with the relative amplification of rocking being more pronounced. Both types of rotational response were positively correlated with the peak root stresses of high-voltage bushings A and B. These results are consistent with amplified tank rotations contributing to increased bushing seismic demand through the tank–turret–flange assembly.
(3)
The DFP retrofit effectively reduced the seismic stress demand on the high-voltage bushings. For bushings A and B, the peak maximum principal tensile stresses were reduced by approximately 38–67% under the seven ground motions, and all calculated values after isolation remained below the manufacturer-specified reference strength of 50 MPa. The average Fourier spectrum of bushing A also showed substantial attenuation of the dominant low-frequency acceleration response. These results demonstrate that the proposed isolation scheme improves the seismic safety margin of the high-voltage bushings within the ground motions and bearing parameters considered in this study.

Author Contributions

Conceptualization, Y.D.; methodology, Y.D.; software, Y.D., J.X. and X.L.; validation, Y.D.; formal analysis, L.Z., J.X. and X.L.; investigation, Y.D., L.Z., J.X. and W.L.; writing—original draft, Y.D.; writing—review & editing, L.Z. and W.L.; supervision, X.L. and W.L. All authors have read and agreed to the published version of the manuscript.

Funding

This research received no external funding. Yukun Du received a personal scholarship from the China Scholarship Council (CSC).

Data Availability Statement

The original contributions presented in this study are included in the article. Further inquiries can be directed to the corresponding author.

Conflicts of Interest

The authors declare no conflicts of interest.

Appendix A

Figure A1. First-order bending mode shapes of the standalone 500 kV bushing: (a) X-direction mode at 3.80 Hz; (b) Y-direction mode at 3.71 Hz.
Buildings 16 03643 g0a1
Table A1. Comparison of the first-mode frequencies of high-voltage bushings.
BushingLength/mMass/tNatural Frequency
XY
550 kV [50]7.71.784.314.14
500 kV [51]8.1/3.673.3
500 kV (this Study)8.82.33.83.71

Appendix B

Table A2. Material parameter settings for each component.
MaterialDensity (kg/m3)Poission’s RatioElastic Modulus/Gpa
Q23578500.33206
High-Strength Ceramic75000.380
Al27000.370
Silicon Steel76500.28200

Appendix C

Table A3. Information on the natural ground-motion records.
RecordStationDateMagnitudeVs30 (m/s)
RSN1527TCU1001999Mw 7.62535.13
TaftTaft Lincoln School1952Mw 7.36385.43
El CentroEl Centro Array Station 91940Mw 6.9213.44
Chi-ChiCHY0101999Mw 7.62538.69
BajiaoBajiao, Shifang2008Ms 8.0379.3

References

  1. Amoiralis, E.I.; Tsili, M.A.; Kladas, A.G. Transformer design and optimization: A literature survey. IEEE Trans. Power Deliv. 2009, 24, 1999–2024. [Google Scholar] [CrossRef] [Scilit]
  2. Schiff, A.J. (Ed.) Guide to Improved Earthquake Performance of Electric Power Systems; ASCE Manuals and Reports on Engineering Practice No. 96; American Society of Civil Engineers: Reston, VA, USA, 1999. [Google Scholar]
  3. Xie, Q.; Zhu, R. Earth, wind, and ice. IEEE Power Energy Mag. 2011, 9, 28–36. [Google Scholar] [CrossRef] [Scilit]
  4. Schiff, A.J. (Ed.) Northridge Earthquake: Lifeline Performance and Post-Earthquake Response; TCLEE Monograph No. 8; American Society of Civil Engineers: New York, NY, USA, 1995. [Google Scholar]
  5. Zhao, B.; Taucer, F. Performance of infrastructure during the May 12, 2008 Wenchuan earthquake in China. J. Earthq. Eng. 2010, 14, 578–600. [Google Scholar] [CrossRef] [Scilit]
  6. Tang, A.K. (Ed.) Wenchuan, Sichuan Province, China, Earthquake of 2008: Lifeline Performance; TCLEE Monograph No. 39; American Society of Civil Engineers: Reston, VA, USA, 2014. [Google Scholar]
  7. Tang, A.K.; Eidinger, J.M. (Eds.) Chile Earthquake of 2010: Lifeline Performance; TCLEE Monograph No. 36; American Society of Civil Engineers: Reston, VA, USA, 2013. [Google Scholar]
  8. Eidinger, J.; Davis, C.; Tang, A.; Kempner, L. M9.0 Tohoku Earthquake, March 11, 2011: Performance of Water and Power Systems; G&E Engineering Systems Inc.: Oakland, CA, USA, 2012. [Google Scholar]
  9. Kwasinski, A.; Eidinger, J.; Tang, A.; Tudo-Bornarel, C. Performance of electric power systems in the 2010–2011 Christchurch, New Zealand, earthquake sequence. Earthq. Spectra 2014, 30, 205–230. [Google Scholar] [CrossRef] [Scilit]
  10. Zhu, W.; Xie, Q.; Liu, X.; Mao, B.; Xue, Z. Towards 500 kV power transformers damaged in the 2022 Luding earthquake: Field investigation, failure analysis and seismic retrofitting. Nat. Hazards 2024, 120, 6275–6305. [Google Scholar] [CrossRef] [Scilit]
  11. Zhu, W.; Wu, M.; Xie, Q. Comparison of engineering failures and seismic responses of 500 kV transformer-bushing systems in the 2022 Luding earthquake. Earthq. Eng. Eng. Vib. 2024, 23, 1029–1041. [Google Scholar] [CrossRef] [Scilit]
  12. Whittaker, A.S.; Fenves, G.L.; Gilani, A.S.J. Earthquake performance of porcelain transformer bushings. Earthq. Spectra 2004, 20, 205–223. [Google Scholar] [CrossRef] [Scilit]
  13. IEEE Std 693-2018; IEEE Recommended Practice for Seismic Design of Substations. Institute of Electrical and Electronics Engineers: New York, NY, USA, 2019.
  14. IEC TS 61463:2016; Bushings—Seismic Qualification, Edition 2.0. International Electrotechnical Commission: Geneva, Switzerland, 2016.
  15. Bellorini, S.; Salvetti, M.; Bettinali, F.; Zafferani, G. Seismic qualification of transformer high voltage bushings. IEEE Trans. Power Deliv. 1998, 13, 1208–1213. [Google Scholar] [CrossRef] [Scilit]
  16. Gilani, A.S.; Whittaker, A.S.; Fenves, G.L. Seismic evaluation and retrofit of 230-kV porcelain transformer bushings. Earthq. Spectra 2001, 17, 597–616. [Google Scholar] [CrossRef] [Scilit]
  17. Villaverde, R.; Pardoen, G.C.; Carnalla, S. Ground motion amplification at flange level of bushings mounted on electric substation transformers. Earthq. Eng. Struct. Dyn. 2001, 30, 621–632. [Google Scholar] [CrossRef] [Scilit]
  18. Ersoy, S.; Saadeghvaziri, M.A. Seismic response of transformer–bushing systems. IEEE Trans. Power Deliv. 2004, 19, 131–137. [Google Scholar] [CrossRef]
  19. Filiatrault, A.; Matt, H. Experimental seismic response of high-voltage transformer–bushing systems. Earthq. Spectra 2005, 21, 1009–1025. [Google Scholar] [CrossRef] [Scilit]
  20. Filiatrault, A.; Matt, H. Seismic response of high-voltage electrical transformer–bushing systems. J. Struct. Eng. 2006, 132, 287–295. [Google Scholar] [CrossRef] [Scilit]
  21. Koliou, M.; Filiatrault, A.; Reinhorn, A.M. Seismic response of high-voltage transformer–bushing systems incorporating flexural stiffeners I: Numerical study. Earthq. Spectra 2013, 29, 1335–1352. [Google Scholar] [CrossRef] [Scilit]
  22. Koliou, M.; Filiatrault, A.; Reinhorn, A.M. Seismic response of high-voltage transformer–bushing systems incorporating flexural stiffeners II: Experimental study. Earthq. Spectra 2013, 29, 1353–1367. [Google Scholar] [CrossRef] [Scilit]
  23. Ma, G.-L.; Xie, Q. Seismic analysis of a 500-kV power transformer of the type damaged in the 2008 Wenchuan earthquake. J. Perform. Constr. Facil. 2018, 32, 04018007. [Google Scholar] [CrossRef] [Scilit]
  24. Ma, G.-L.; Xie, Q.; Whittaker, A.S. Dynamic interaction of high-voltage power transformer bushings, turrets, and tanks. Earthq. Spectra 2018, 34, 397–421. [Google Scholar] [CrossRef] [Scilit]
  25. Ma, G.-L.; Xie, Q.; Whittaker, A.S. Physical and numerical simulations of the seismic response of a 1100 kV power transformer bushing. Earthq. Spectra 2018, 34, 1515–1541. [Google Scholar] [CrossRef] [Scilit]
  26. He, C.; Xie, Q.; Yang, Z.; Xue, S. Seismic evaluation and analysis of 1100-kV UHV porcelain transformer bushings. Soil Dyn. Earthq. Eng. 2019, 123, 498–512. [Google Scholar] [CrossRef] [Scilit]
  27. He, C.; Xie, Q.; Zhou, Y. Influence of flange on seismic performance of 1100-kV ultra-high voltage transformer bushing. Earthq. Spectra 2019, 35, 447–469. [Google Scholar] [CrossRef] [Scilit]
  28. Ma, G.-L.; Xie, Q.; Whittaker, A.S. Seismic performance assessment of an ultra-high–voltage power transformer. Earthq. Spectra 2019, 35, 423–445. [Google Scholar] [CrossRef] [Scilit]
  29. Bender, J.; Farid, A. Seismic vulnerability of power transformer bushings: Complex structural dynamics and seismic amplification. Eng. Struct. 2018, 162, 1–10. [Google Scholar]
  30. Bender, J.; Farid, A. Predicting power-transformer bushings’ seismic vulnerability: Mounting stiffness and coupling. J. Perform. Constr. Facil. 2019, 33, 04019023. [Google Scholar] [CrossRef] [Scilit]
  31. Wang, M.; He, J. Shake table test and finite element model for evaluating seismic performance of 220 kV transformer–bushing systems. Earthq. Spectra 2023, 39, 1755–1778. [Google Scholar] [CrossRef] [Scilit]
  32. Mohammadi, R.K.; Akrami, V.; Nikfar, F. Dynamic properties of substation support structures. J. Constr. Steel Res. 2012, 78, 173–182. [Google Scholar] [CrossRef] [Scilit]
  33. Li, S.; Tsang, H.-H.; Cheng, Y.; Lu, Z. Considering seismic interaction effects in designing steel supporting structure for surge arrester. J. Constr. Steel Res. 2017, 132, 151–163. [Google Scholar] [CrossRef] [Scilit]
  34. He, C.; Xie, Q.; Yang, Z.; Xue, S. Influence of supporting frame on seismic performance of 1100-kV UHV-GIS bushing. J. Constr. Steel Res. 2019, 161, 114–127. [Google Scholar] [CrossRef] [Scilit]
  35. Xie, Q.; He, C.; Yang, Z.; Xue, S. Influence of flexible conductors on the seismic responses of interconnected electrical equipment. Eng. Struct. 2019, 191, 148–161. [Google Scholar] [CrossRef] [Scilit]
  36. Tahmasebinia, F.; Wang, Y.; Wu, S.; Ho, J.; Shen, W.; Ma, H.; Sepasgozar, S.M.E.; Marroquin, F.A. Advanced Structural Analysis of Innovative Steel–Glass Structures with Respect to the Architectural Design. Buildings 2021, 11, 208. [Google Scholar] [CrossRef] [Scilit]
  37. Chen, B.; Dai, Y.; Wang, W.; Wang, Y.; Luo, L.; Dai, P.; Lim, J. An experimental study on web-bearing resistance of cold-formed steel sigma-shaped sections with web holes under interior-two-flange loading case. Thin-Walled Struct. 2024, 205, 112579. [Google Scholar] [CrossRef] [Scilit]
  38. Zhang, L.; Zhang, R.; Xia, Y.; Zhao, Z. A lightweight pendulum tuned mass inerter system for enhanced vibration control. Eng. Struct. 2025, 338, 120555. [Google Scholar] [CrossRef] [Scilit]
  39. Zhang, L.; Xue, S.; Chen, T.; Xie, L.; Zhang, R.; Yang, Z. Performance assessment of crank inerters integrated into base-isolated structures for multi-level seismic protection. Eng. Struct. 2026, 357, 122490. [Google Scholar] [CrossRef] [Scilit]
  40. Zayas, V.A.; Low, S.S.; Mahin, S.A. A simple pendulum technique for achieving seismic isolation. Earthq. Spectra 1990, 6, 317–333. [Google Scholar] [CrossRef] [Scilit]
  41. Ersoy, S.; Saadeghvaziri, M.A.; Liu, G.-Y.; Mau, S.T. Analytical and experimental seismic studies of transformers isolated with Friction Pendulum System and design aspects. Earthq. Spectra 2001, 17, 569–595. [Google Scholar] [CrossRef] [Scilit]
  42. Murota, N.; Feng, M.Q.; Liu, G.-Y. Earthquake simulator testing of base-isolated power transformers. IEEE Trans. Power Deliv. 2006, 21, 1291–1299. [Google Scholar] [CrossRef]
  43. Saadeghvaziri, M.A.; Feizi, B.; Kempner, L.; Alston, D. On seismic response of substation equipment and application of base isolation to transformers. IEEE Trans. Power Deliv. 2010, 25, 177–186. [Google Scholar] [CrossRef] [Scilit]
  44. Kitayama, S.; Lee, D.; Constantinou, M.C.; Kempner, L. Probabilistic seismic assessment of seismically isolated electrical transformers considering vertical isolation and vertical ground motion. Eng. Struct. 2017, 152, 888–900. [Google Scholar] [CrossRef] [Scilit]
  45. Lee, D.; Constantinou, M.C. Combined horizontal–vertical seismic isolation system for high-voltage–power transformers: Development, testing and validation. Bull. Earthq. Eng. 2018, 16, 4273–4296. [Google Scholar] [CrossRef] [Scilit]
  46. Fenz, D.M.; Constantinou, M.C. Behaviour of the double concave Friction Pendulum bearing. Earthq. Eng. Struct. Dyn. 2006, 35, 1403–1424. [Google Scholar] [CrossRef] [Scilit]
  47. Li, X.; Xie, Q.; Wen, J. Double friction pendulum-based isolation optimization for transformer-bushing systems. Eng. Struct. 2024, 320, 118909. [Google Scholar] [CrossRef] [Scilit]
  48. Xie, Q.; He, C.; Jiang, B.; Yang, Z. Linear-elastic analysis of seismic responses of porcelain post electrical equipment. Eng. Struct. 2019, 201, 109848. [Google Scholar] [CrossRef] [Scilit]
  49. Yang, Z.; He, C.; Xie, Q. Seismic performance and stiffening strategy of transformer bushings on sidewall cover plates. J. Constr. Steel Res. 2020, 174, 106268. [Google Scholar] [CrossRef] [Scilit]
  50. Lu, J. Research on Structural Damage Identification Methods for Substation Equipment under Seismic Excitation. Master’s Thesis, Tongji University, Shanghai, China, 2021. (In Chinese) [Google Scholar]
  51. Cao, M.; Zhou, F.; Tan, P. Shaking table test and theoretic analysis on seismic performance of transformer isolation system with bushings. J. Vib. Shock 2012, 31, 22–29. (In Chinese) [Google Scholar]
  52. GB 50260-2013; Code for Seismic Design of Electrical Installations. China Planning Press: Beijing, China, 2013.
Figure 1. Transformer and steel-support configuration: (a) overall view of the 500 kV three-phase transformer; (b) steel supports beneath the transformer tank.
Buildings 16 03643 g001
Figure 2. Finite element model of the transformer. A, B, and C denote the three phase-specific high-voltage bushings.
Buildings 16 03643 g002
Figure 3. Representative mode shapes of the transformer–bushing system: (a) first bending about the Y-axis in the NS model; (b) first bending about the Y-axis in the WS model; (c) second bending about the X-axis in the NS model; (d) second bending about the X-axis in the WS model.
Buildings 16 03643 g003
Figure 4. Average response spectrum and required response spectrum.
Buildings 16 03643 g004
Figure 5. Peak maximum principal tensile stresses at the bushing roots: (a) high-voltage bushings; (b) medium-voltage bushings.
Buildings 16 03643 g005
Figure 6. Acceleration amplification factor of high-voltage bushings.
Buildings 16 03643 g006
Figure 7. Acceleration amplification factor of medium-voltage bushings.
Buildings 16 03643 g007
Figure 8. Comparison of average frequency-response functions (FRFs) and bushing mode shapes with and without steel supports: (a) average FRFs of high-voltage bushing A in the X direction; (b) first-order bending mode in the NS model; (c) first order bending mode in the WS model.
Buildings 16 03643 g008
Figure 9. Four-point procedure for estimating transformer-tank rotations: (a) locations of the four reference points on the tank-top plane; (b) coordinate axes and vertical-displacement definitions.
Buildings 16 03643 g009
Figure 10. Comparison of transformer-tank rotational responses with and without steel support: (a) peak torsional rotation; (b) peak resultant rocking rotation.
Buildings 16 03643 g010
Figure 11. Relationships between transformer-tank rotational responses and the maximum principal tensile stresses at the roots of high-voltage bushings A and B: (a) torsional rotation–stress relationship; (b) resultant rocking rotation–stress relationship.
Buildings 16 03643 g011
Figure 12. Representative transformer-tank rotational responses under the RSN1527 ground motion with steel supports: (a) torsional rotation time history; (b) resultant rocking rotation time history.
Buildings 16 03643 g012
Figure 13. Schematic layout of the double friction pendulum isolation bearings.
Buildings 16 03643 g013
Figure 14. Peak maximum principal tensile stresses at the porcelain-housing roots in the isolated model and the corresponding isolation efficiencies relative to the WS model: (a) high-voltage bushing A; (b) high-voltage bushing B. The horizontal dashed line denotes the manufacturer-specified ultimate flexural strength of the porcelain housing (50 MPa).
Buildings 16 03643 g014
Figure 15. Fourier amplitude spectra of the X-direction acceleration at the top of high-voltage bushing A, averaged over the seven ground motions, for the WS and ISO models.
Buildings 16 03643 g015
Table 1. Dominant modes and frequencies of the transformer–bushing system (without steel support).
OrderFrequency/HzMode
1–31.84–1.98First-order bending of high-voltage bushing around the Y-axis
4–62.29–2.43First-order bending of high-voltage bushing around the X-axis
19–208.02–8.25Second-order bending of high-voltage bushing around the Y-axis
22–248.25–8.51Second-order bending of high-voltage bushing around the X-axis
Table 2. Dominant modes and frequencies of the transformer–bushing system (with steel support).
OrderFrequency/HzMode
1–31.47–1.92First-order bending of high-voltage bushing around the Y-axis
42.26First-order bending of high-voltage bushing around the X-axis
52.27First-order bending of high-voltage bushing AC around the X-axis,
First-order bending of high-voltage bushing B around the Y-axis
6–72.37–2.6First-order bending of high-voltage bushing around the X-axis
22–238.01–8.04Second-order bending of high-voltage bushing around the Y-axis
248.22Second-order bending of high-voltage bushing around the X-axis
258.24Second-order bending of high-voltage bushing around the Y-axis
26–278.47–8.51High-voltage bushing undergoes second-order bending around the X, Y axis
Table 3. Cumulative modal participation ratios (1–10 Hz) of the transformer–bushing system.
ConfigurationDirection
XYZ
NS1.73%1.64%1.31%
WS10.61%3.69%1.40%
Table 4. Average peak seismic displacement of bushings at the top.
DirectionTypePeak Displacement (mm)
High VoltageMedium Voltage
ABCABC
XWith steel support371352344125118111
Without steel support162146167495946
YWith steel support181136162635857
Without steel support928687232822
Disclaimer/Publisher’s Note: The statements, opinions and data contained in all publications are solely those of the individual author(s) and contributor(s) and not of MDPI and/or the editor(s). MDPI and/or the editor(s) disclaim responsibility for any injury to people or property resulting from any ideas, methods, instructions or products referred to in the content.