1. Introduction
Industrial heritage is a material record of industrialization and a spatial resource through which historical memory, local identity, and public culture can be retained and reinterpreted. In China, the transition from incremental expansion to stock-based urban renewal has shifted the focus of industrial heritage practice from the conservation of individual buildings toward adaptive reuse, public accessibility, and the continuous use of inherited sites. National planning and heritage-conservation policies have reinforced this transition by emphasizing urban renewal and the systematic protection and utilization of historical and cultural resources. The regeneration of a former industrial compound therefore involves more than architectural restoration or functional replacement. It requires the reorganization of enclosed production spaces into legible, accessible, and usable public environments while preserving the material character and spatial order of the industrial site. External spaces are central to this process because entrances, roads, courtyards, open grounds, and retained industrial structures mediate public access, spatial orientation, and everyday activity.
The vitality of external spaces has consequently become an important concern in industrial heritage regeneration. Jiang et al. [
1] used space syntax to quantify the external spatial morphology of four industrial heritage creative parks in Tianjin and identified spatial conditions that constrained usability. Zheng et al. [
2] evaluated cultural expression in reused industrial heritage from the perspective of public users, emphasizing public acceptance and feedback in post-occupancy optimization. Zhang and Ren [
3] interpreted industrial heritage regeneration through spatial production, drawing attention to the reorganization of spatial order and publicness. Xia et al. [
4] used user-satisfaction analysis to examine the combined influence of spatial layout, environmental sustainability, social impact, and other renewal dimensions. Within these renewed settings, public art and installation art are frequently used to reinforce place identity, interpret industrial memory, organize pedestrian movement, and create opportunities for interaction. Matthews and Gadaloff [
5] examined public art as a tool for placemaking and urban renewal; Milne and Pojani [
6] focused on the conditions that make public art engaging and interactive; and Zhou et al. [
7] discussed its social, cultural, and sustainability contributions. He et al. [
8] examined the spatial intervention of installation art in urban public space, while Tan et al. [
9] investigated the relationship between public art, perceived value, and walking intention. These studies establish the broader value of artistic intervention, but they rarely distinguish how different placement modes operate within the spatial hierarchy of a single industrial heritage site. At the same time, street-view imagery has become an important source for pedestrian-scale urban analysis [
10,
11]. Visual features extracted from street-view images have been used to characterize urban environments [
12], quantify street spatial quality [
13], evaluate pedestrian-scale visual perception [
14], and examine associations between built form and street vitality [
15,
16]. Recent reviews also identify persistent limitations in the interpretation of user perception, the treatment of group heterogeneity, and the acquisition of user-centered public-space data [
17].
Recent studies of historical urban areas have combined space syntax, points-of-interest data, and multi-source urban data to map the distribution and formation of spatial vitality [
18,
19]. Street-view semantic information has also been integrated with spatial predictors to describe dominant visual composition at the pedestrian scale [
20]. These approaches demonstrate the value of fine-grained spatial and visual measurement, but their application to installation art in industrial heritage external spaces remains limited. In particular, the visual presence of an installation, its relationship with retained industrial heritage elements, and its position within the public-space hierarchy are rarely examined within the same analytical unit.
This study addresses this gap through a unit-based analysis of the Zhengzhou Oil & Chemical Plant Creative District. An installation art placement path is defined as the way in which an installation is embedded in external space through its spatial location, interface relationship, physical mode of placement, and dominant spatial role. Pedestrian-scale visual perception refers to the visual field experienced from a normal walking viewpoint rather than from aerial or plan-based observation. Spatial vitality is defined through observed use intensity, staying capacity, and activity diversity. Three image-based indicators are introduced: IVI measures the proportion of the pedestrian visual field occupied by installation art; OPN measures the combined proportion of sky and open pedestrian ground; and FOC measures the concentration of installation art and retained industrial heritage elements within the central visual field. The study asks: (1) What visual structures characterize the four installation art placement paths? (2) How are these visual differences associated with subjective perception and observed public-space use? (3) How does the role of installation art vary among entrance and core node spaces, main-axis spaces, secondary-axis spaces, and edge spaces? The contribution lies in distinguishing four recurrent placement paths, integrating visual, perceptual, and behavioral evidence within the same 18 research units, and interpreting installation art within the inherited spatial hierarchy of the industrial compound.
2. Materials and Methods
2.1. Study Area and Research Design
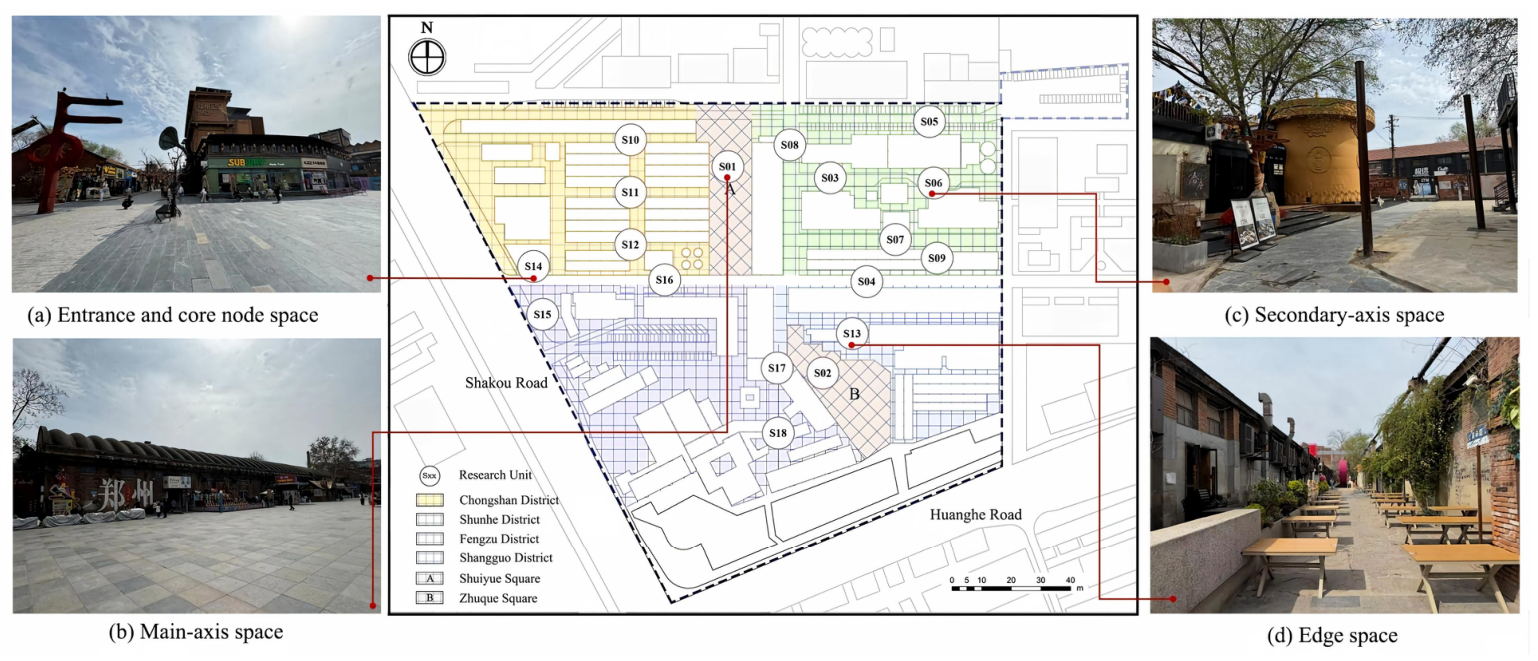
The Zhengzhou Oil & Chemical Plant Creative District is located in Jinshui District, Zhengzhou, Henan Province, China. The site covers approximately 119 mu (about 7.9 ha), with an above-ground floor area of approximately 37,000 m
2 (
Figure 1). It was redeveloped from the former state-owned Zhengzhou Oil and Fat Chemical Plant and now accommodates cultural and creative industries, technological innovation, entertainment, and food and beverage services. The regenerated site retains a comparatively complete industrial heritage fabric, including production facilities, storage tanks, pipe-rack networks, workshops, former offices, and auxiliary buildings. The terrain is generally flat; spatial hierarchy and pedestrian orientation are therefore formed primarily by the inherited road network, building interfaces, retained industrial structures, installation art, and the organization of internal circulation [
21].
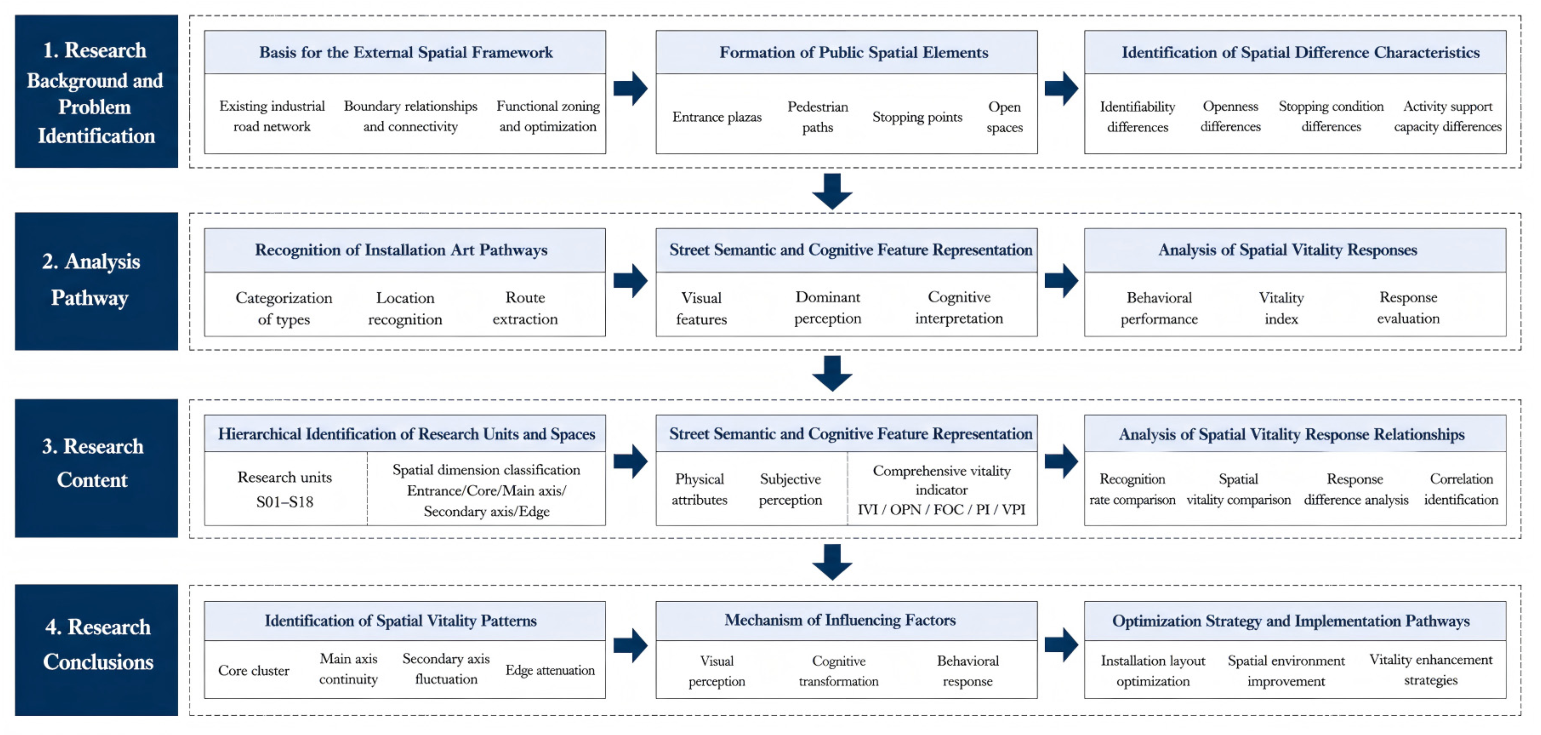
The external spaces were renewed incrementally around the original industrial road framework, interface relationships, and functional zones. Entrance plazas, pedestrian axes, courtyards, stay nodes, exhibition interfaces, and transitional edges coexist within the site, but they differ substantially in legibility, openness, enclosure, staying conditions, and activity-supporting capacity. These differences provide the spatial basis for examining how installation art is embedded in the inherited industrial environment and how its visual role varies across the public-space system (
Figure 2).
The external spaces were first divided into 18 research units and classified by spatial hierarchy. Installation art placement paths were then identified from their location, interface relationship, physical integration, and principal spatial role. Street-view images, unit-specific questionnaires, and behavioral observations were collected within the same research-unit system. IVI, OPN, FOC, PI, and VPI were calculated at the unit level, followed by comparisons among spatial hierarchies and placement paths and by Grey Relational Analysis of the relationships between perceptual indicators and spatial vitality. The complete research-unit-level dataset for the visual, perceptual, and vitality indicators is provided in
Table S1.
2.2. Research Unit Delineation, Installation Art Placement Path Identification, and Dataset Construction
Five categories of data were collected: spatial morphology, installation art, street-view images, behavioral observation, and subjective perception. Spatial morphological data recorded roads, plazas, entrances, interfaces, circulation routes, public facilities, and retained industrial heritage elements. Installation art records included location, physical form, interface relationship, accessibility, and integration with surrounding facilities. Street-view images provided pedestrian-scale visual information. Behavioral observation recorded pedestrian flow, staying behavior, and activity types, while the questionnaire measured users’ evaluations of the immediate spatial unit. All data were indexed by the same research-unit code.
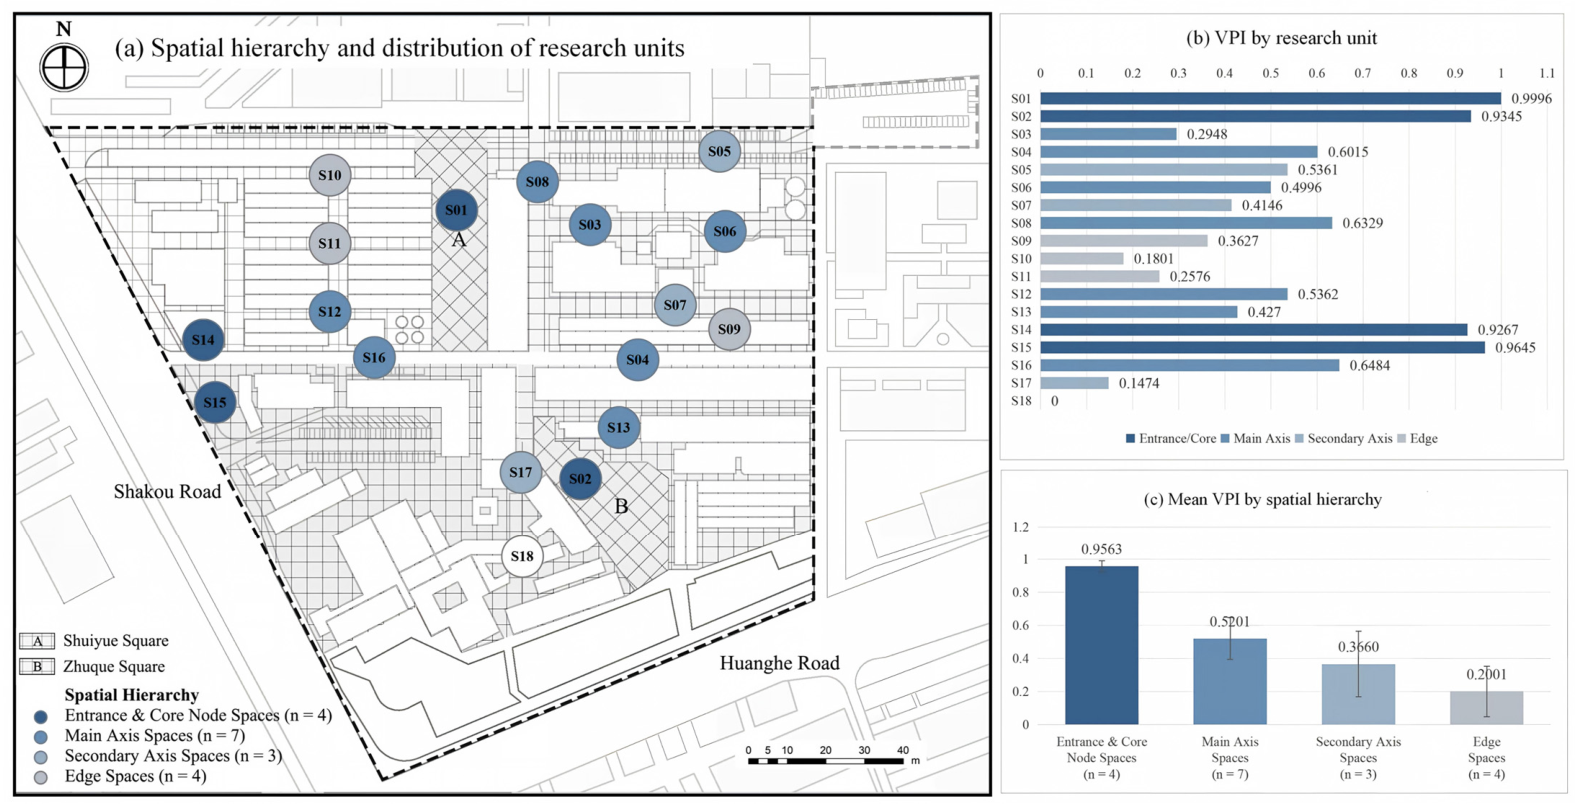
Research units were delineated from publicly accessible external spaces rather than from administrative parcels or individual buildings. The division followed four principles: continuity of spatial boundaries, coherence of pedestrian use, clear differences in enclosure or route transition, and capacity to support public activity. Adjacent areas were separated when their interface condition, circulation role, installation configuration, or activity-supporting facilities changed substantially. Enclosed or inaccessible areas and spaces without realistic public-use potential were excluded. Eighteen units were identified and coded S01–S18 (
Figure 1).
The 18 units were further classified into four spatial hierarchies: entrance and core node spaces, main-axis spaces, secondary-axis spaces, and edge spaces (
Figure 1). This classification combines the position of each unit in the overall site structure with its circulation role, interface condition, and public-use function. Entrance and core node spaces organize arrival, orientation, distribution, and gathering. Main-axis spaces provide continuous movement and connect major display, commercial, and service areas. Secondary-axis spaces support local connection, spatial transition, and short stays. Edge spaces mediate the boundary between the renewed district and its surrounding urban fabric. The hierarchy reflects the spatial sequence of arrival and concentration, primary continuity, secondary connection, and edge transition. Its interpretation draws on established urban-design concepts of paths, nodes, edges, imageability, and observed public-space behavior.
Installation art placement paths were identified from spatial location, interface relationship, physical mode of embedding, and dominant spatial role (
Table 1). The classification was not based on artistic style, material, or color alone. Visual identification-oriented installations occupy entrances or important nodes and appear as frontal or freestanding visual anchors. Functional activation-oriented installations are integrated with seating, play, exhibition, commercial, or interactive facilities. Spatial guidance-oriented installations form linear, repeated, or directional sequences along corridors, turns, and intersections. Environmental atmosphere-oriented installations are attached to or embedded within façades, boundaries, and transitional interfaces. Field photographs, site plans, and observation records were reviewed together when a unit displayed more than one characteristic.
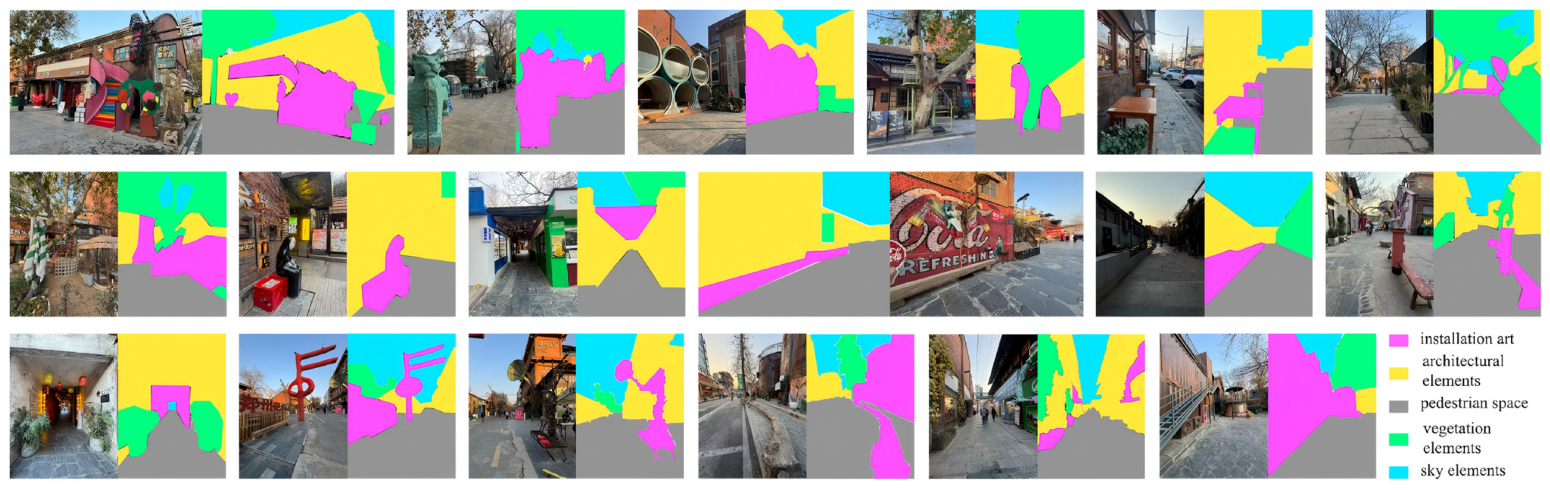
For each unit, one representative image was selected from the dominant pedestrian approach at an eye height of approximately 1.6 m. Images were collected under broadly comparable daylight and weather conditions, without zoom, and temporary obstructions were avoided where possible. The images were manually annotated in two stages. First, each image was divided into five mutually exclusive classes: installation art, building/interface, pedestrian/open ground, vegetation, and sky. Second, an auxiliary binary mask identified retained industrial heritage elements within the building/interface class for the calculation of FOC. All category boundaries were checked against the original photographs before pixel areas were exported and calculated. This procedure is referred to throughout the paper as manual pixel-level street-view semantic annotation.
2.3. Development of Perception and Spatial Vitality Indicators
2.3.1. Street-View Semantic Annotation and Visual Structure Indicators
Three visual structure indicators were calculated from the annotated images. The Installation Visibility Index (IVI) describes the visual exposure of installation art; the Openness Index (OPN) represents the proportion of sky and open pedestrian ground; and the Visual Focality Index (FOC) describes the concentration of installation art and retained industrial heritage elements within the central pedestrian visual field. All three indicators are image-based proportions calculated at the research-unit level (
Figure 3).
The Installation Visibility Index (IVI) was used to measure the visual exposure of installation art in each research unit. It was calculated as the proportion of installation-art pixels in the total valid image area.
where
represents the Installation Visibility Index of research unit
,
represents the pixel area of installation art in the street-view image of research unit
, and
represents the total valid pixel area of the image. A higher
value indicates that installation art occupies a larger proportion of the pedestrian visual field.
The Openness Index (OPN) was used to describe the degree of visual openness and spatial permeability. It was calculated as the proportion of sky pixels and open-ground pixels in the total valid image area.
where
represents the Openness Index of research unit
,
represents the pixel area of sky elements,
represents the pixel area of open ground, and
represents the total valid pixel area of the image. A higher
value indicates a stronger sense of visual openness and spatial permeability.
FOC was used to describe the degree to which the two principal salient categories—installation art and retained industrial heritage elements—were concentrated in the central 40% of the image width. Retained industrial elements were identified through the secondary binary mask described in
Section 2.2. The index therefore captures central visual organization rather than general visual complexity.
where
represents the Visual Focality Index of research unit
,
represents the pixel area of installation art located within the central visual field, and
represents the pixel area of retained industrial heritage elements located within the central visual field.
represents the total pixel area of installation art in the image, and
represents the total pixel area of retained industrial heritage elements in the image. A higher
value indicates that the main visual elements are more concentrated in the central field of view.
Accordingly, the visual structure of each research unit was expressed by three indicators: IVI, OPN, and FOC.
where
represents the visual-structure indicator set of research unit
. These indicators were calculated for all 18 research units and were later used for grouped comparison and Grey Relational Analysis.
2.3.2. Subjective Perception Measurement and Subjective Perception Index
Subjective perception was measured through an on-site questionnaire administered within the same 18 research units. Respondents evaluated the immediate spatial unit rather than the creative district as a whole. Four five-point Likert items addressed spatial recognition, walking and staying comfort, willingness to participate in place-based activities, and overall attractiveness. Together, the four items formed the Subjective Perception Index (PI).
The recognition item asked whether the installation art and surrounding spatial elements made the unit easy to identify and remember. The comfort item concerned the experience of walking or staying in the unit. The participation item measured willingness to remain and engage in activities rather than simply pass through, with interaction, photography, and consumption provided as examples. The final item requested an overall evaluation of attractiveness. The questionnaire also recorded age and visit frequency. Respondents aged 18–30 and 31–45 each accounted for approximately 40% of the sample; respondents aged 46–60 and over 60 each accounted for approximately 10%. Approximately 40% were first-time visitors and 60% had visited the district previously.
The survey was conducted on the morning of 14 November 2025 and the afternoon of 25 January 2026, covering a working-day morning and a weekend/holiday afternoon. A total of 320 valid questionnaires were collected, with 9–28 responses per unit and an average of 17.8 responses per unit. The four perception items showed acceptable internal consistency (Cronbach’s α = 0.868), indicating that they could be combined to represent the overall subjective evaluation of each spatial unit. Therefore, the Subjective Perception Index (PI) was calculated as the arithmetic mean of the four items. Because the number of responses varied among units, PI was interpreted as a descriptive unit-level measure rather than a statistical estimate of population-level perception, and was analyzed together with visual and behavioral indicators.
For each unit, PI was calculated as the arithmetic mean of the unit-level scores for recognition, comfort, participation, and overall attractiveness. Equal weighting was adopted so that the four perceptual dimensions contributed consistently to the composite index.
where
represents the Subjective Perception Index of research unit
i,
represents the mean score of recognition,
represents the mean score of comfort,
represents the mean score of participation, and
represents the mean score of overall attractiveness. A higher
value indicates a more positive overall perception of the spatial unit.
2.3.3. Behavioral Observation and Spatial Vitality Index
Behavioral observation recorded the actual use of the same 18 external-space units. Three components of spatial vitality were measured: pedestrian flow intensity, stay ratio, and activity diversity. The observation sheet distinguished passing, standing, sitting, photographing, social interaction, commercial consumption, children’s play, and other identifiable public activities.
Observations were undertaken during the same two fieldwork periods as the questionnaire survey, and each research unit was observed for 30 min in each period. Following established public-life observation procedures, two trained observers used a standardized recording sheet and a common activity-classification protocol. Staying behavior was recorded when a user remained within the unit to stand, sit, interact, take photographs, consume, play, or undertake another identifiable activity rather than moving continuously through the space. Ambiguous cases were checked against field notes and photographs after each observation period.
Pedestrian flow intensity was calculated as the average number of observed users in each research unit across the two observation periods.
where
represents the pedestrian flow intensity of research unit
,
represents the number of observed users in research unit i during observation period
, and
represents the number of observation periods. In this study,
. A higher
value indicates a higher level of pedestrian use.
The stay ratio was calculated as the proportion of staying users among all observed users in the two observation periods.
where
represents the stay ratio of research unit
,
represents the number of staying users in research unit
during observation period
, and
represents the total number of observed users in the same research unit and observation period. A higher
value indicates that the space has a stronger ability to support staying behavior.
Activity diversity was calculated as the mean number of identifiable activity categories recorded in each unit across the two observation periods.
where
represents the activity diversity of research unit
,
represents the number of identifiable activity types observed in research unit
during observation period
, and
represents the number of observation periods. In this study,
. A higher
value indicates that the space supports more diverse public activities.
Because
,
, and
have different units and value ranges, min–max normalization was applied before aggregation.
where
represents the original value of a behavioral indicator in research unit
,
represents the normalized value, and
and
represent the maximum and minimum values of the corresponding indicator across all 18 research units. The normalization boundary was determined by the complete set of research units rather than by each spatial type separately. After normalization, all indicator values range from 0 to 1.
The Spatial Vitality Index (VPI) was calculated as the average value of the three normalized behavioral indicators.
where
represents the Spatial Vitality Index of research unit
, and
,
, and
represent the normalized values of pedestrian flow intensity, stay ratio, and activity diversity, respectively. Equal weights were adopted because the three indicators represent complementary dimensions of spatial vitality: use intensity, staying capacity, and activity richness. A higher
value indicates a higher level of spatial vitality.
VPI was calculated separately for each of the 18 units. Mean VPI values were then calculated by spatial hierarchy and placement-path type to compare group-level patterns (
Table 2). Because all units were normalized against the same 18-unit range, the resulting group means were measured on a common scale.
2.4. Spatial Visualization and Response Analysis
The 18 research units cover the principal publicly accessible external-space system of the district. Unit-level mapping and grouped charts were used to describe the spatial distribution of IVI and VPI and to compare the four spatial hierarchies and placement-path types. Grey Relational Analysis (GRA) was then applied to compare the normalized variation pattern of VPI with those of IVI, OPN, FOC, and PI. The grey relational degree provides a comparable measure of the closeness between each indicator sequence and the VPI sequence within the 18-unit dataset.
In Grey Relational Analysis, the Spatial Vitality Index was used as the reference sequence.
where
represents the reference sequence formed by the Spatial Vitality Index values of all research units, and
n represents the number of research units. In this study,
.
The comparison sequences included the Installation Visibility Index, Openness Index, Visual Focality Index, and Subjective Perception Index.
where
represents the
-th comparison sequence. In this study, the four comparison sequences were IVI, OPN, FOC, and PI.
represents the value of indicator
in research unit
.
Before calculating the grey relational degree, all comparison sequences were normalized using the min–max method.
where
represents the normalized value of indicator
in research unit
, and
and
represent the maximum and minimum values of indicator
across all 18 research units.
The VPI reference sequence was normalized in the same way.
where
represents the normalized VPI value of research unit
, and
and
represent the maximum and minimum values of VPI across all 18 research units.
After normalization, the absolute difference between the normalized VPI sequence and each normalized comparison sequence was calculated.
where
represents the absolute difference between the normalized VPI value and the normalized value of comparison indicator
in research unit
. A smaller
value indicates that the two indicators have a more similar variation trend in that research unit.
The grey relational coefficient was then calculated.
where
represents the grey relational coefficient between VPI and comparison indicator
in research unit
.
and
represent the minimum and maximum absolute difference values among all comparison sequences, and
represents the distinguishing coefficient. In this study,
was adopted.
Finally, the grey relational degree was calculated by averaging the grey relational coefficients of all research units.
where
represents the grey relational degree between VPI and comparison indicator
. A higher
value means that the variation trend of the comparison indicator is more consistent with that of spatial vitality. In this study, the grey relational degree was used to compare the associations between VPI and IVI, OPN, FOC, and PI.
Through this process, the study quantitatively compared the relationships between installation visibility, spatial openness, visual focality, subjective perception, and spatial vitality. The results provide a basis for explaining how installation art placement paths are associated with spatial vitality within the external spaces of the industrial heritage creative district.
3. Results
3.1. Installation Art Visibility and Street-View Visual Structure
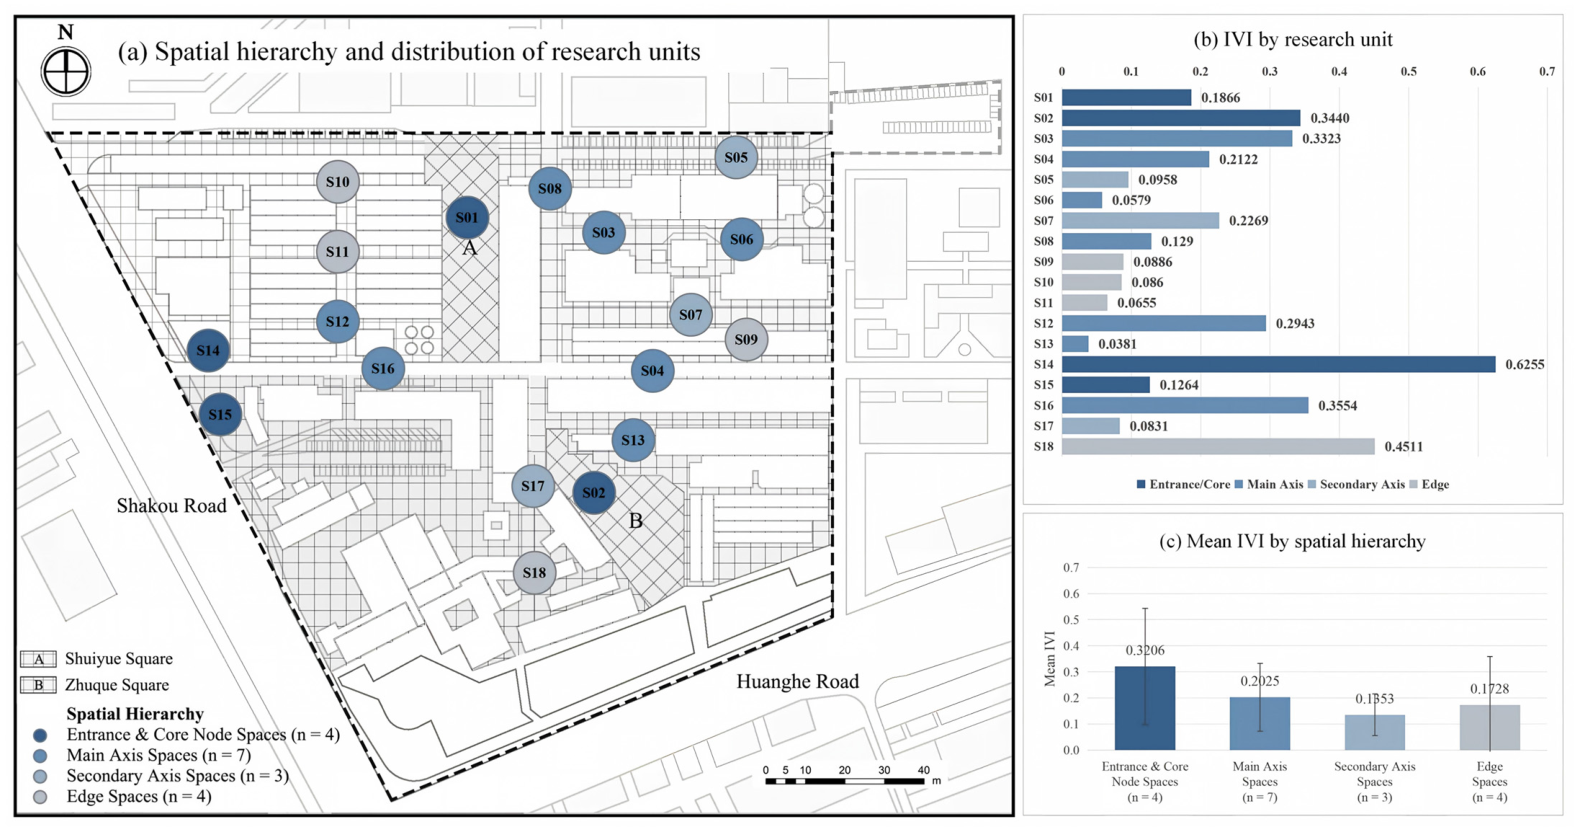
The Installation Visibility Index varied considerably across the 18 research units, indicating marked differences in the visual exposure of installation art within the pedestrian field of view (
Figure 4). IVI ranged from 0.0381 in S13 to 0.6255 in S14. At the spatial-hierarchy level, entrance and core node spaces recorded the highest mean IVI (0.3206), followed by main-axis spaces (0.2025), edge spaces (0.1728), and secondary-axis spaces (0.1353). Installation art was therefore generally more visible in spaces associated with arrival, orientation, and activity concentration, while its visual presence was weaker in local connecting spaces and transitional segments. Considerable variation was also found within the same spatial hierarchy. Along the main axis, IVI ranged from 0.0381 in S13 to 0.3554 in S16. S03 and S12 also recorded relatively high values of 0.3323 and 0.2927, respectively, whereas S06, S08, and S13 showed lower levels of visual exposure. A position along the principal pedestrian route did not therefore correspond to a uniform installation-art presence. Higher-IVI units generally contained installations located close to the dominant pedestrian approach, with a frontal or relatively unobstructed relationship to the circulation route. Lower values were more common where installations were embedded within building interfaces, positioned obliquely to pedestrian movement, or partly screened by vegetation, retained industrial heritage elements, and other foreground objects. Entrance and core node spaces combined comparatively high visibility with strong internal differentiation. S14 recorded the highest IVI because the installation occupied a substantial proportion of an open approach view and formed a large-scale visual anchor. In other entrance and node units, installation art shared the visual field with industrial buildings, commercial façades, pedestrian activity, and retained production structures. Secondary-axis spaces generally presented a more localized visual relationship, as installations were frequently integrated with façades, landscape elements, or small activity areas rather than positioned as independent landmarks. Edge spaces were more uneven: an installation could occupy a relatively large proportion of a confined image even when the research unit had limited spatial centrality. Overall, IVI was shaped by installation scale, viewing distance, placement orientation, interface enclosure, visual obstruction, and pedestrian approach direction. High visibility was most frequently associated with freestanding or frontally positioned installations in entrance and node spaces, whereas lower visibility occurred where installations were incorporated into continuous interfaces or secondary circulation routes.
3.2. Spatial Vitality Response Across Research Units and Spatial Hierarchies
Spatial vitality showed a pronounced hierarchical distribution across the external-space system (
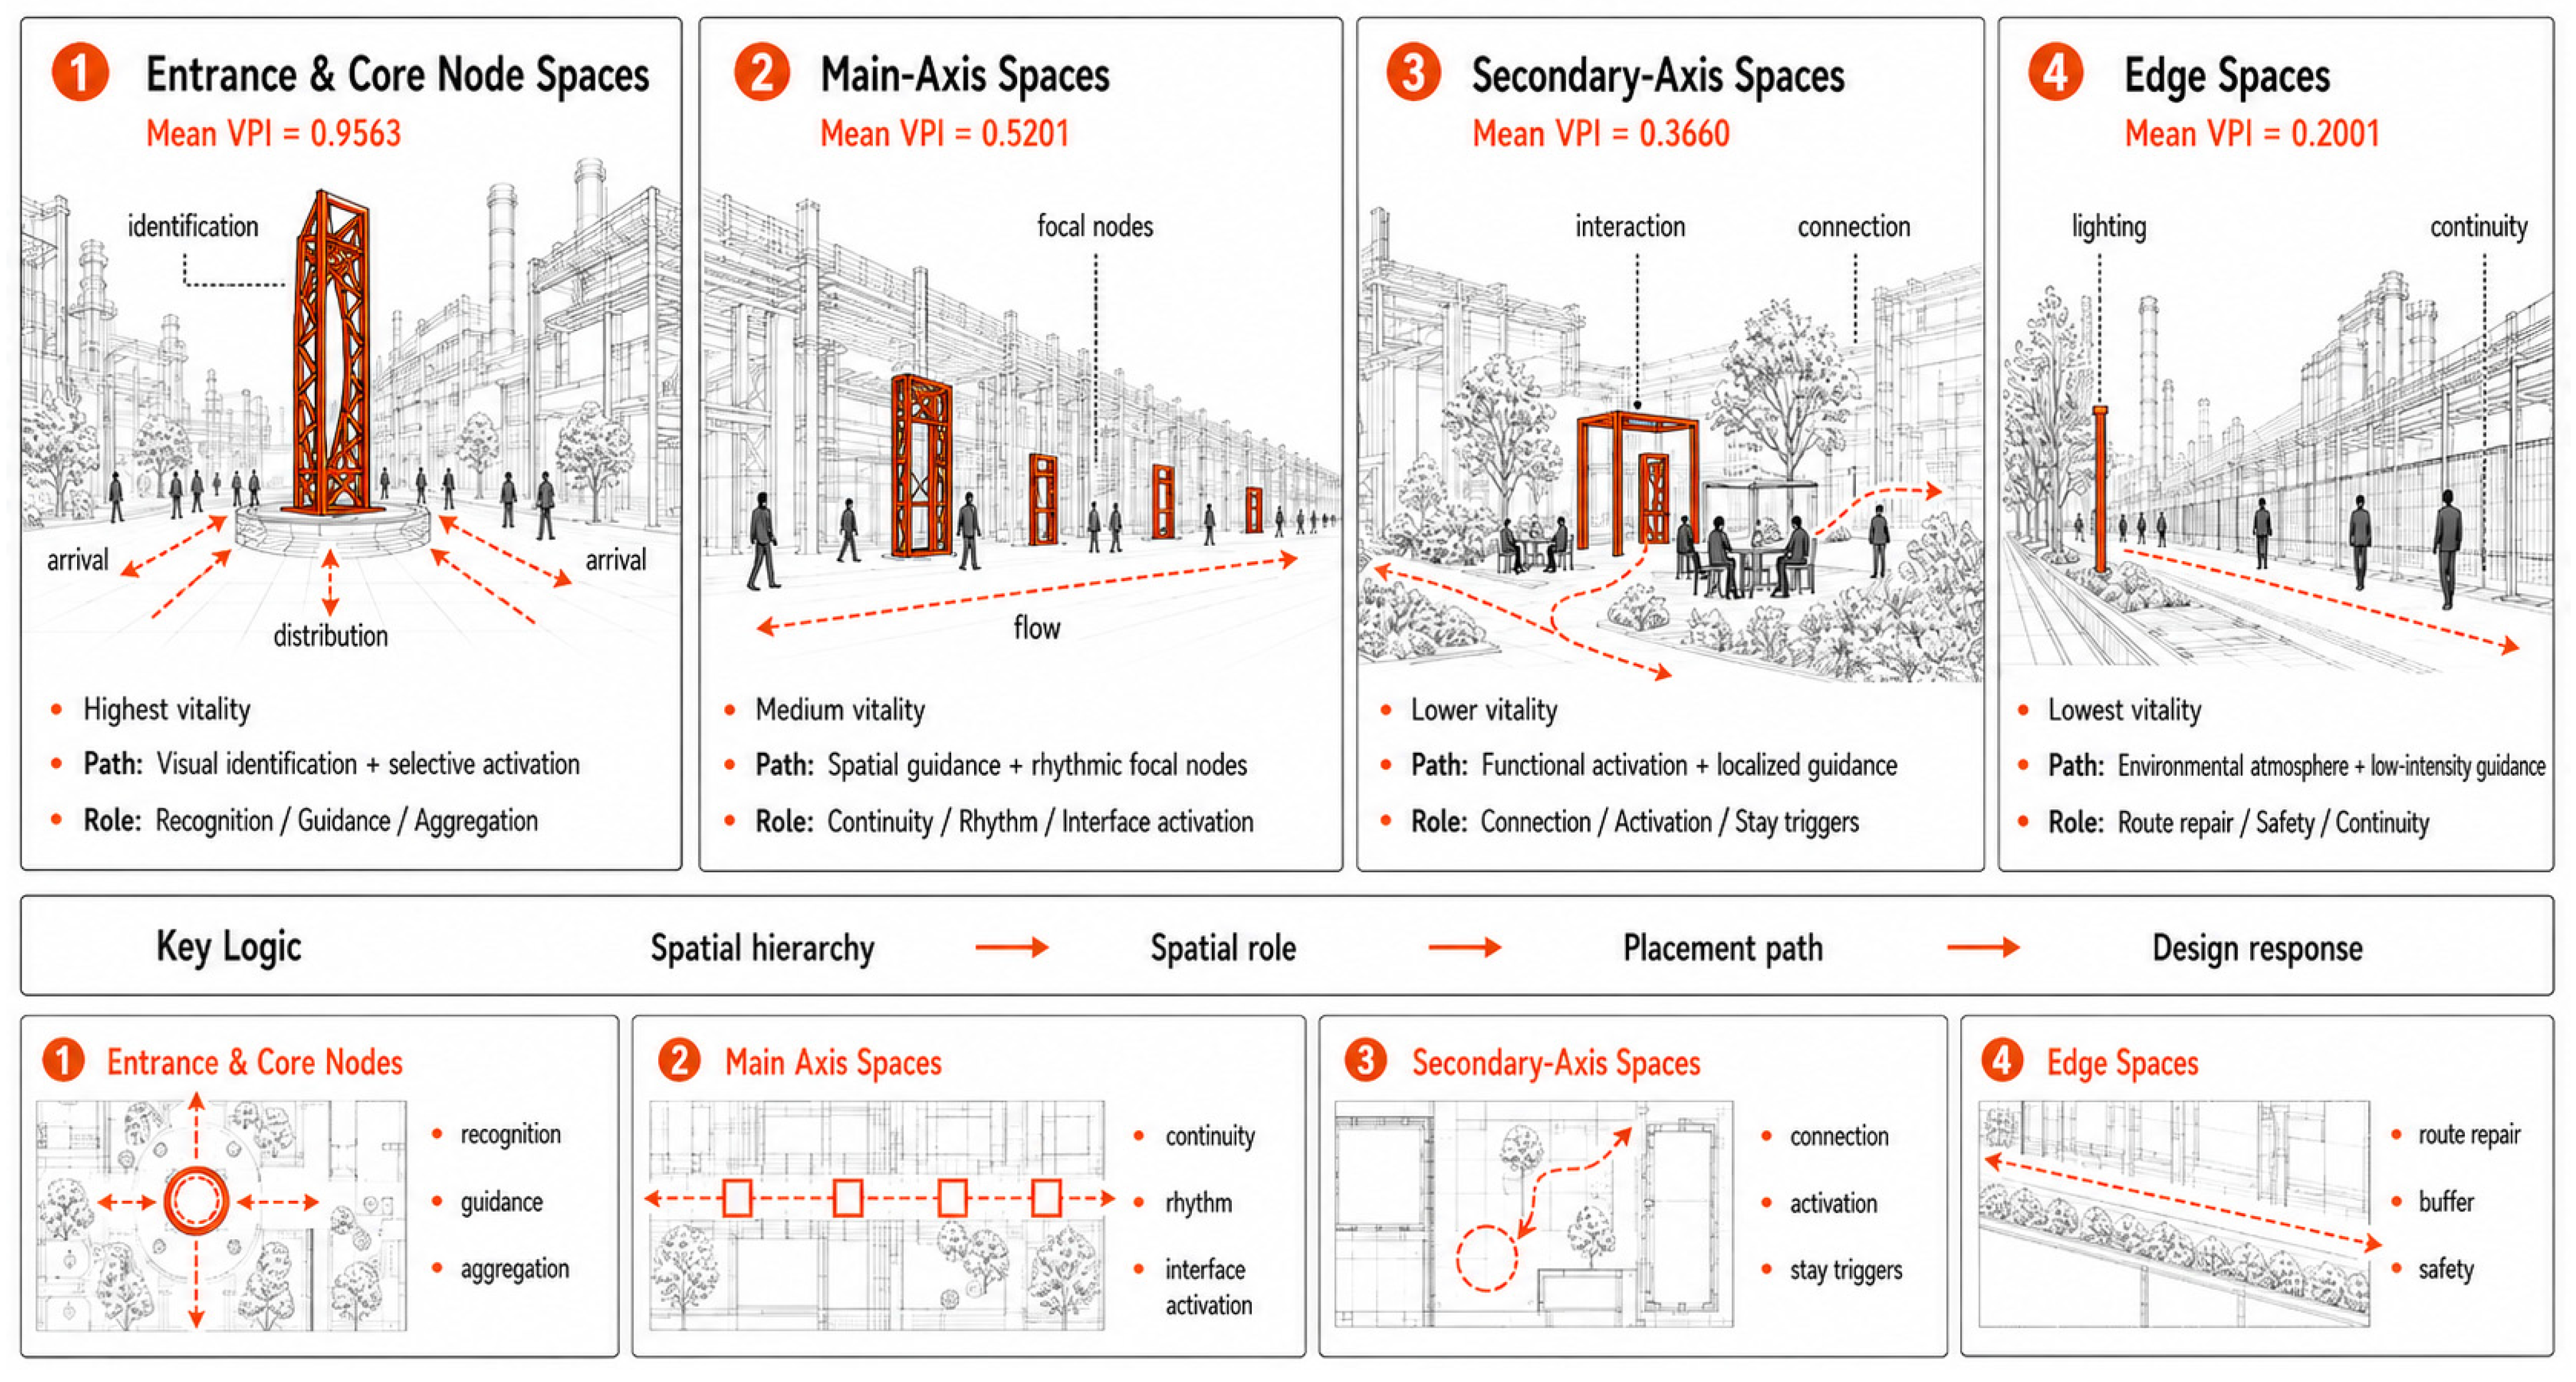
Figure 5). The four entrance and core node units—S01, S02, S14, and S15—recorded VPI values of 0.9996, 0.9345, 0.9267, and 0.9645, respectively. These spaces formed the most intensively used parts of the district, combining prominent positions in the pedestrian network with open gathering areas, surrounding public functions, and conditions that supported both movement and staying activities. Main-axis spaces displayed greater internal variation. Their mean VPI was 0.5201, while individual values ranged from 0.2948 in S03 to 0.6484 in S16. S08 and S04 also recorded relatively high values of 0.6329 and 0.6015, respectively. The uneven distribution along the main axis indicates that continuity within the circulation network did not produce equivalent levels of public use. Units located near active interfaces, route intersections, service functions, or identifiable nodes generally performed better than segments dominated by through-movement. Secondary-axis spaces recorded a mean VPI of 0.3660. S05 reached 0.5361, while S07 and S17 recorded 0.4146 and 0.1474, respectively. Where a secondary route was connected to an activity node, courtyard, or local stay space, it was capable of supporting moderate public use. By contrast, units functioning mainly as transitional links showed lower pedestrian flow, stay ratios, and activity diversity. Edge spaces had the lowest mean VPI (0.2001). S09 recorded the highest edge-space value at 0.3627, followed by S11 at 0.2576 and S10 at 0.1801, while S18 had the minimum value in the dataset (0.0000). The lower vitality of these units corresponded to their peripheral position, weaker functional frontage, limited pedestrian catchment, and reduced capacity to support extended stays. At the spatial-hierarchy level, mean VPI declined from 0.9563 in entrance and core node spaces to 0.5201 in main-axis spaces, 0.3660 in secondary-axis spaces, and 0.2001 in edge spaces. The resulting pattern may be summarized as core concentration, uneven main-axis continuity, secondary-axis attenuation, and edge decline.
3.3. Differences Among Installation Art Placement Paths
The three street-view visual indicators were grouped according to the four installation art placement paths (
Table 3). The results reveal differences in the relationship among installation art, pedestrian routes, surrounding interfaces, and the central visual field.
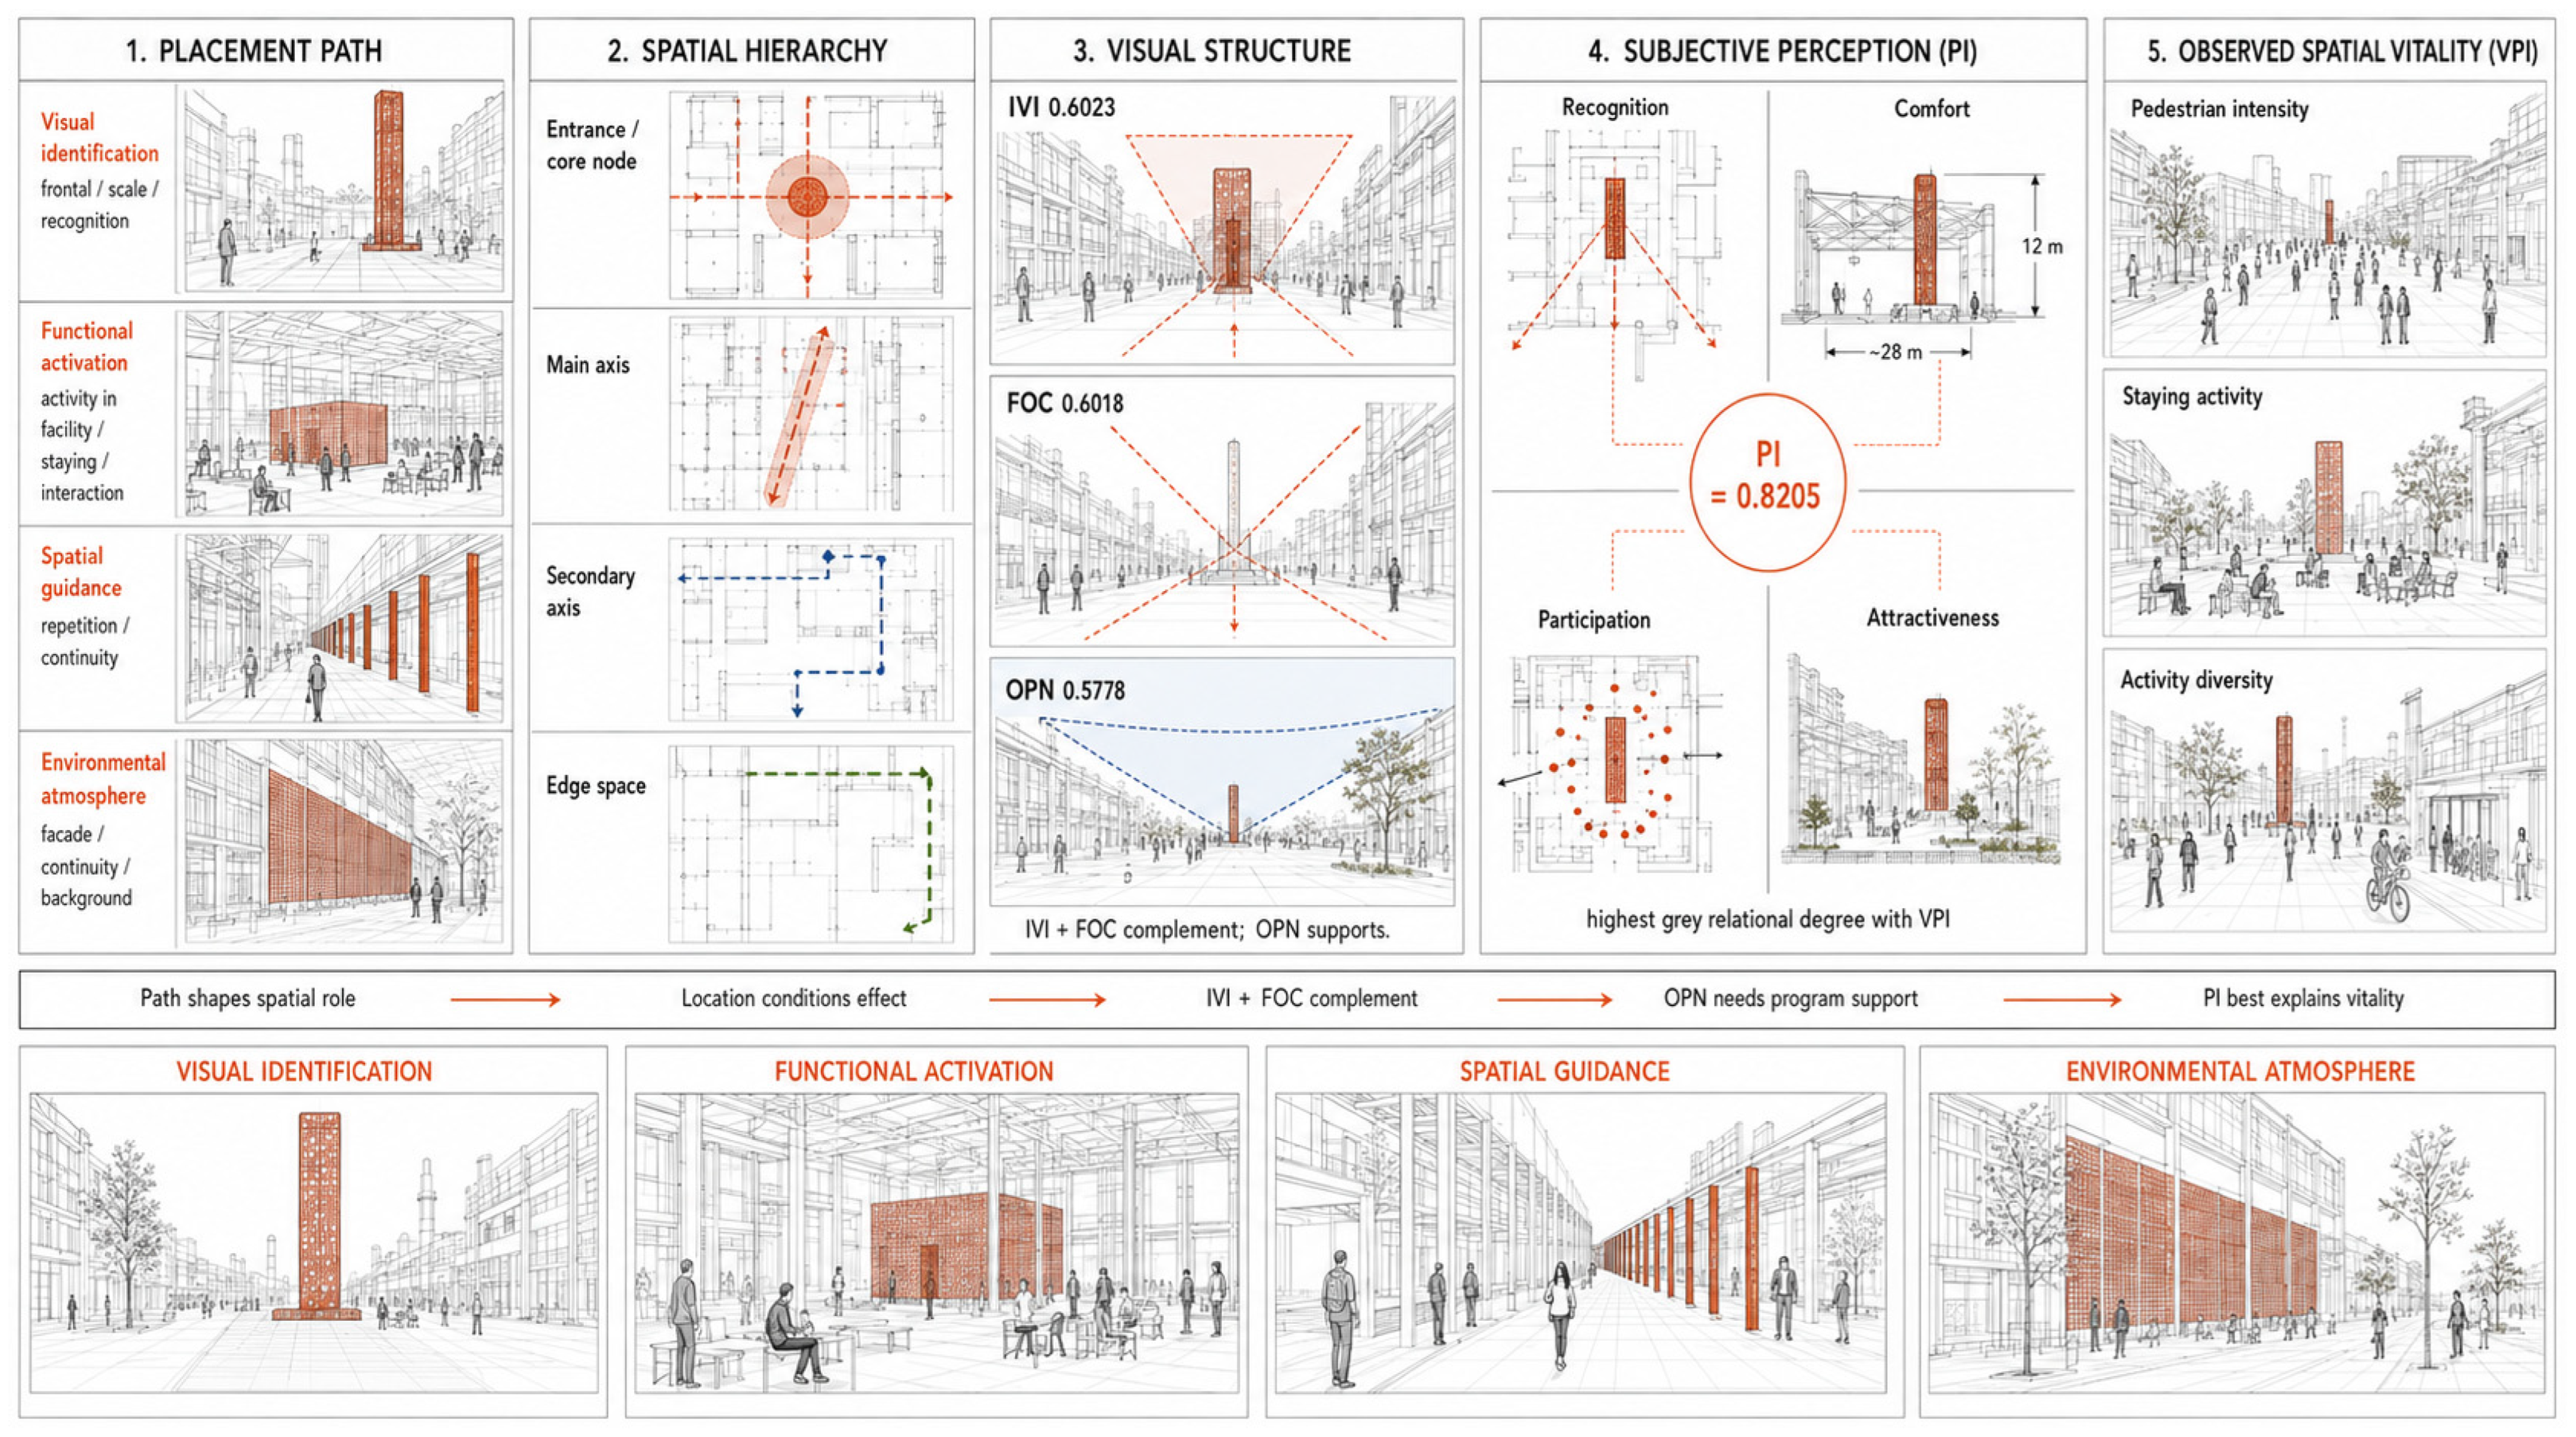
The visual identification-oriented path recorded the highest mean IVI (0.2495) and FOC (0.2826). Its installations were mainly located at entrances, forecourts, and core nodes, where they appeared as frontal, freestanding, or spatially separated objects. These configurations increased both the proportion of installation art within the street-view image and the concentration of salient elements near the central field of view. The functional activation-oriented path had a similar mean IVI (0.2403) and FOC (0.2676), while recording the highest mean OPN (0.4385). These units were generally located in courtyards and activity spaces where installations were associated with seating, interaction, exhibition, play, or commercial use. Their visual structure combined relatively strong installation exposure with a larger proportion of sky and open pedestrian ground. The spatial guidance-oriented path also showed high openness (OPN = 0.4365), but lower IVI (0.1837) and FOC (0.2032). Installations in these units were distributed along corridors, turning points, intersections, and repeated interfaces. Their visual role depended more on sequence, rhythm, and directional continuity than on the dominance of a single object. The environmental atmosphere-oriented path recorded the lowest mean IVI (0.1591), OPN (0.1805), and FOC (0.1681). These installations were commonly attached to façades, boundaries, retained industrial structures, or transitional interfaces. Their visual character was expressed through material continuity, surface treatment, color, texture, and integration with the industrial heritage setting rather than through an independent focal object. The four placement paths can therefore be distinguished as landmark anchoring, activity integration, sequential guidance, and background atmosphere shaping. High openness and high installation visibility were not equivalent conditions: the functional activation-oriented and spatial guidance-oriented paths had almost identical OPN values, but differed in IVI and FOC because the installations occupied different positions within the pedestrian visual sequence.
3.4. Spatial Vitality Responses Under Different Installation Art Placement Paths
Mean VPI differed among the four installation art placement paths. The visual identification-oriented path recorded the highest grouped value (0.7731), followed by the environmental atmosphere-oriented path (0.4810), the functional activation-oriented path (0.4557), and the spatial guidance-oriented path (0.3193). The six visual identification-oriented units showed a wide range of VPI values. Four units—S01, S02, S14, and S15—were located at entrances or core nodes and recorded values above 0.92. S08, situated on the main axis, had a VPI of 0.6329, whereas the edge-space unit S10 recorded 0.1801. The high grouped mean was therefore strongly associated with the concentration of visual identification-oriented installations at the principal entrances and central nodes of the district. The environmental atmosphere-oriented path had the second-highest mean VPI, despite recording the lowest mean values for IVI, OPN, and FOC. Its three units ranged from 0.4146 to 0.6015, indicating that installations integrated with façades and transitional interfaces could coexist with moderate public use when the surrounding spaces were connected to active circulation or adjoining functions. Functional activation-oriented units recorded a mean VPI of 0.4557, while the spatial guidance-oriented path had the lowest mean value and the widest internal range. Guidance-oriented units extended across main-axis, secondary-axis, and edge spaces, with VPI values ranging from 0.0000 to 0.6484. Higher values occurred where sequential installations were positioned along active circulation routes or near intersections, whereas lower values were concentrated in peripheral and weakly connected segments. The ranking of the visual indicators did not directly reproduce the ranking of VPI. The observed vitality of each placement path was related to both the form of installation-art intervention and the spatial hierarchy, surrounding functions, interface conditions, and pedestrian connectivity of the corresponding research units.
3.5. Association Between Perceptual Indicators and Spatial Vitality
Grey Relational Analysis compared the VPI sequence with IVI, OPN, FOC, and PI across the 18 research units. The resulting grey relational degrees are presented in
Table 4.
PI recorded the highest grey relational degree with VPI (0.8205). Across the 18 units, the combined evaluation of recognition, comfort, participation, and overall attractiveness followed the variation in observed public-space use more closely than any individual street-view indicator. Higher PI values were generally concentrated at entrances, core nodes, and active main-axis units, while lower values occurred more frequently in secondary-axis and edge spaces with weaker staying conditions and lower activity diversity. IVI and FOC recorded grey relational degrees of 0.6023 and 0.6018, respectively. The difference between the two values was only 0.0005, indicating that installation visibility and central focal organization had almost identical levels of correspondence with VPI. IVI described the proportion of installation art within the pedestrian visual field, while FOC represented the concentration of installation art and retained industrial heritage elements within the central field of view. OPN recorded the lowest grey relational degree (0.5778), although it remained close to IVI and FOC. Functional activation-oriented and spatial guidance-oriented units both had high mean OPN values, but their VPI values varied substantially. Open views and large proportions of sky and pedestrian ground provided spatial capacity for movement and flexible use, but did not necessarily correspond to high pedestrian flow, staying behavior, or activity diversity.
Overall, the association strength followed the order:
The difference between IVI and FOC was negligible, while PI was more clearly separated from the three image-based indicators. At the visual level, IVI, FOC, and OPN described specific properties of the pedestrian street-view environment. At the experiential level, PI integrated users’ evaluations of visual legibility, comfort, participation, and overall spatial attractiveness. Spatial vitality corresponded more closely to this composite spatial experience than to any single visual variable. Taken together, the results reveal a connected pattern among pedestrian-scale visual structure, subjective perception, and observed public-space use. Installation visibility and focal organization formed identifiable visual conditions, while openness provided varying degrees of spatial capacity. Their relationships with VPI differed according to spatial hierarchy, interface organization, adjoining functions, and pedestrian circulation.
5. Conclusions
This study investigated the relationships among installation art placement paths, pedestrian-scale visual structure, subjective perception, and spatial vitality in 18 external-space units of the Zhengzhou Oil & Chemical Plant Creative District. Manual pixel-level street-view semantic annotation, unit-specific questionnaire surveys, behavioral observation, and Grey Relational Analysis were integrated within a common research-unit framework. By matching visual, perceptual, and behavioral evidence at the same micro-spatial scale, the study examined how installation art was embedded within the inherited spatial structure of an industrial heritage creative district and how different spatial configurations corresponded with variations in public-space use.
The first research question concerned the visual characteristics of different installation art placement paths. The results identified four distinct spatial–visual profiles. The visual identification-oriented path showed relatively high installation visibility and central focality and was mainly associated with entrances, forecourts, and core nodes. The functional activation-oriented path combined relatively high visibility with open settings that accommodated staying, interaction, exhibition, or commercial activity. The spatial guidance-oriented path was characterized by high openness, repeated visual cues, and sequential organization along pedestrian routes. The environmental atmosphere-oriented path was more closely integrated with façades, boundaries, retained industrial structures, and transitional interfaces. These findings indicate that the visual role of installation art depends not only on the form of the artwork, but also on its position, orientation, interface relationship, viewing distance, and relationship with pedestrian movement.
The second research question addressed the relationships among visual structure, subjective perception, and observed use. The Subjective Perception Index recorded the highest grey relational degree with the Spatial Vitality Index (0.8205). The relational degrees of IVI (0.6023) and FOC (0.6018) were almost identical, while OPN was slightly lower (0.5778). Across the 18 units, spatial vitality therefore corresponded more closely with the combined evaluation of recognition, comfort, participation, and overall attractiveness than with any single street-view indicator. Installation visibility and central focal organization nevertheless remained relevant components of pedestrian-scale spatial legibility, while openness functioned as a broader spatial condition whose relationship with public use varied according to location, function, and interface organization. These results describe patterns of association within the case study and should not be interpreted as evidence of a causal sequence from visual exposure to perception and behavior.
The third research question concerned the role of installation art across different spatial hierarchies. Spatial hierarchy presented the clearest vitality gradient. Mean VPI decreased from 0.9563 in entrance and core node spaces to 0.5201 in main-axis spaces, 0.3660 in secondary-axis spaces, and 0.2001 in edge spaces. The external-space system therefore exhibited a pattern of core concentration, uneven main-axis continuity, secondary-axis attenuation, and edge decline. Although the visual identification-oriented path recorded the highest grouped VPI (0.7731), four of its six units were located at entrances or core nodes. Its higher grouped vitality should therefore be understood in relation to the strategic position, pedestrian demand, surrounding functions, and gathering capacity of these spaces. Placement path and spatial hierarchy cannot be treated as independent explanatory factors in the present dataset.
The findings support a hierarchy-sensitive approach to installation art allocation in industrial heritage regeneration. Entrance and core node spaces benefit from clearly identifiable focal elements that reinforce arrival, orientation, and place memory while retaining sufficient capacity for gathering and pedestrian distribution. Main-axis spaces require continuity, rhythmic visual cues, and coordination between installation art, retained industrial structures, and active interfaces. Secondary-axis spaces are more suited to localized interventions that strengthen route connection and support short-term staying or interaction. In edge spaces, installation art is more appropriately combined with boundary improvement, wayfinding, lighting, safety perception, and the interpretation of retained industrial fabric. In all four hierarchies, installation art should be coordinated with circulation, facilities, spatial programming, and heritage conservation rather than introduced as an isolated visual object.
The principal contribution of this study lies in establishing a micro-spatial analytical framework that links installation art placement, pedestrian-scale visual structure, subjective perception, and observed public-space use within the same research units. The four-path typology also provides a spatially grounded vocabulary for distinguishing landmark anchoring, activity integration, sequential guidance, and atmospheric embedding in industrial heritage creative districts. Rather than attributing spatial vitality directly to installation art, the framework situates artistic intervention within the broader relationships among spatial hierarchy, interface condition, functional support, and pedestrian experience.
Several limitations should be acknowledged. The study was based on a single industrial heritage creative district, and the distribution of placement paths across spatial hierarchies was uneven. Behavioral observations covered two fieldwork periods, and the number of questionnaire responses varied among research units. The survey did not fully control for occupation, resident–visitor status, and other forms of respondent heterogeneity. In addition, one representative street-view image was used for each unit, which limited the representation of multiple viewing directions and temporal changes. Future research should incorporate comparative cases, repeated observations across seasons and time periods, stratified user surveys, multi-view or dynamic image sampling, and longitudinal or quasi-experimental designs. These extensions would enable more robust testing of the placement-path typology and provide stronger evidence regarding the relationships among artistic intervention, spatial perception, and public-space vitality.
Overall, installation art in industrial heritage creative districts is best understood as part of the spatial organization of the regenerated site. Its contribution depends on how visual exposure, spatial hierarchy, interface relationships, public functions, pedestrian circulation, and retained industrial heritage elements are coordinated within the external-space system.