Article

Static Axial–Flexural Behavior of RC Beam-End Plastic Hinges Under Spatial Frame Effects

1
College of Civil and Transportation Engineering, Shenzhen University, Shenzhen 518060, China
2
School of Civil Engineering & Transportation, South China University of Technology, Guangzhou 510641, China
*
Author to whom correspondence should be addressed.
Buildings 2026, 16(17), 3504; https://doi.org/10.3390/buildings16173504
Submission received: 7 July 2026 / Revised: 28 August 2026 / Accepted: 31 August 2026 / Published: 2 September 2026
(This article belongs to the Section Building Structures)

Abstract

Reinforced concrete (RC) beams undergo axial elongation during inelastic flexural deformation. In frame structures, this elongation is restrained by adjacent columns and slabs, inducing axial compression and beam overstrength, thereby amplifying force demands on columns and joints. Although previous studies have examined beam elongation restraint in planar frames and slab participation in isolated beam–column subassemblies, the combined restraint provided by columns and continuous floor slabs in spatial frame systems remains insufficient. This study conducted static vertical loading tests on twelve restrained RC beams within a three-dimensional frame system. The beams were detailed to reduce the mid-span flexural resistance, allowing the beam-end plastic hinges to contribute predominantly to the response. Compared with the unrestrained beams, the restrained frame beams developed more pronounced flexural–shear crack patterns in the beam-end plastic hinge regions and were more prone to premature concrete crushing before tensile rebar yielding under stronger spatial restraint. Higher spatial restraint also limited the tensile strain development of slab rebars, reducing the effective overhanging flange width. The restraint-induced axial compression ratios ranged from 0.13 to 0.46, and the combined effect of axial compression and slab contribution increased the beam-end flexural strength by 57% to 225%. Compared with the tensile contribution of slab rebars, restraint-induced axial compression was the dominant source of strength enhancement, accounting for 64% to 86% of the total enhancement. These findings highlight the need to consider spatial restraint in RC beam design.

1. Introduction

During flexural deformation, reinforced concrete (RC) beams develop axial elongation [1,2,3,4,5,6]. This elongation arises primarily from flexural crack opening associated with the development of tensile plastic strains in the longitudinal rebars [7,8]. Prior to concrete crushing, elongation may reach 2% to 4% of the beam depth [9,10]. In frame structures, beam elongation is restrained by the adjacent columns and floor slabs, introducing axial compression [11,12]. To examine this restraint effect, previous studies have conducted tests on axially restrained beams and restrained beam–column subassemblies. Tests on restrained RC beams showed that restraint-induced axial compression significantly enhances flexural strength and reduces ductility [4,5,13,14,15,16]. Subsequent tests on restrained beam–column subassemblies reported axial compression ratios reaching up to 0.25, resulting in flexural overstrength ranging from 40% to 150% [6].
The combined effects of restraint-induced beam axial compression and flexural overstrength can substantially amplify force demands on adjacent joints and columns, leading to severe damage [17,18,19,20]. Experimental studies on RC beam–column subassemblies reported increases in joint shear demands of 61% to 120%, accompanied by severe joint damage [20]. Numerical analyses by Wu et al. [21] further revealed that moment demands on exterior columns increased by 241% to 302%. These findings indicate that beam elongation restraint may shift damage from ductile beam plastic hinges towards columns and joints, thereby weakening the seismic resistance of frame structures. However, existing evidence on beam restraint effects has been obtained from planar frame tests, which can capture the restraint provided by columns but cannot represent the additional restraint contribution of floor slabs.
The role of floor slabs has instead been studied mainly from the perspective of flexural participation. It is widely recognized that the tensile contribution of slab rebars increases beam flexural strength and may, therefore, undermine the strong-column–weak-beam strength hierarchy [22,23,24,25]. This contribution is commonly idealized using the effective flange width, within which the slab rebars are assumed to reach yield strength. Extensive tests have been conducted on isolated beam–column joint subassemblies with cantilever slabs on both sides of the beam [26,27,28,29,30,31,32]. These tests capture the slab participation in beam flexural deformation and have led to empirical equations for effective flange width, which have been adopted in design codes [33,34] to account for the flexural strength enhancement provided by slab rebars. Nevertheless, the boundary conditions of these isolated subassemblies remain insufficient for exploring beam elongation restraint in frame structures. The cantilever-slab boundary neglects the continuity of floor slabs, while the single-column boundary cannot reproduce the restraint provided by adjacent columns in a continuous frame. In frame structures, continuous slabs and parallel beams form an integrated substructure that not only participates in beam flexural deformation but also restrains beam axial elongation [35,36].
Therefore, two critical gaps remain: studies on beam elongation restraint have neglected the restraint contribution of floor slabs, whereas studies on slab participation have mainly focused on the flexural strength contribution of slab rebars while overlooking the combined restraint imposed by columns and slabs on beam elongation. To address these gaps, this study conducted monotonic static vertical loading tests on twelve restrained RC beams within a three-dimensional frame system that simulated the realistic boundary conditions for these beams. Based on these experiments, the study evaluated the effects of spatial location, longitudinal rebar ratio and shear span ratio on damage patterns, beam elongation, axial compression, strength enhancement and effective flange width. The findings provide experimental evidence for assessing restraint-induced beam axial compression and the resulting beam-end flexural enhancement, and highlight the need to consider these effects in RC beam design.

2. Test Program

2.1. Details of Frame Structure and Beam Specimens

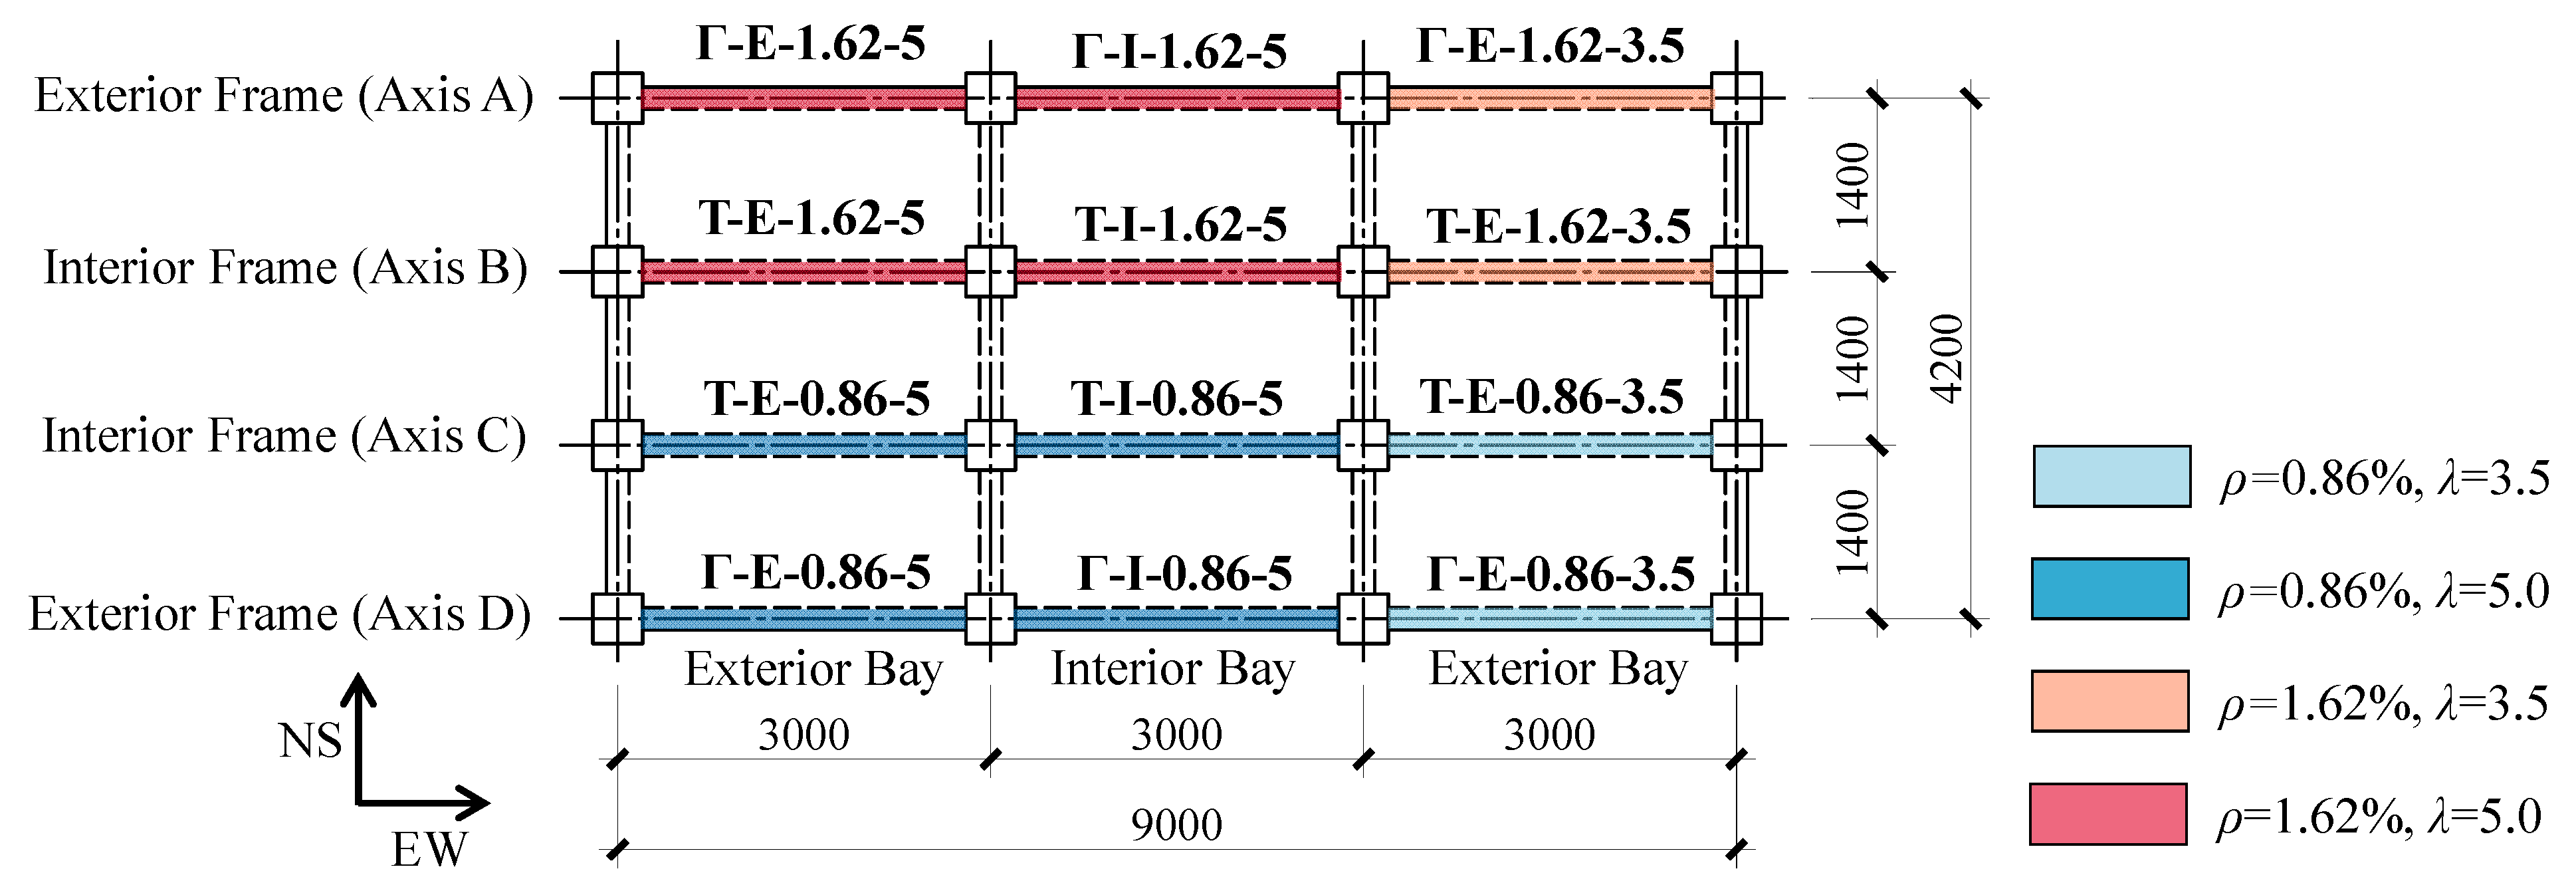
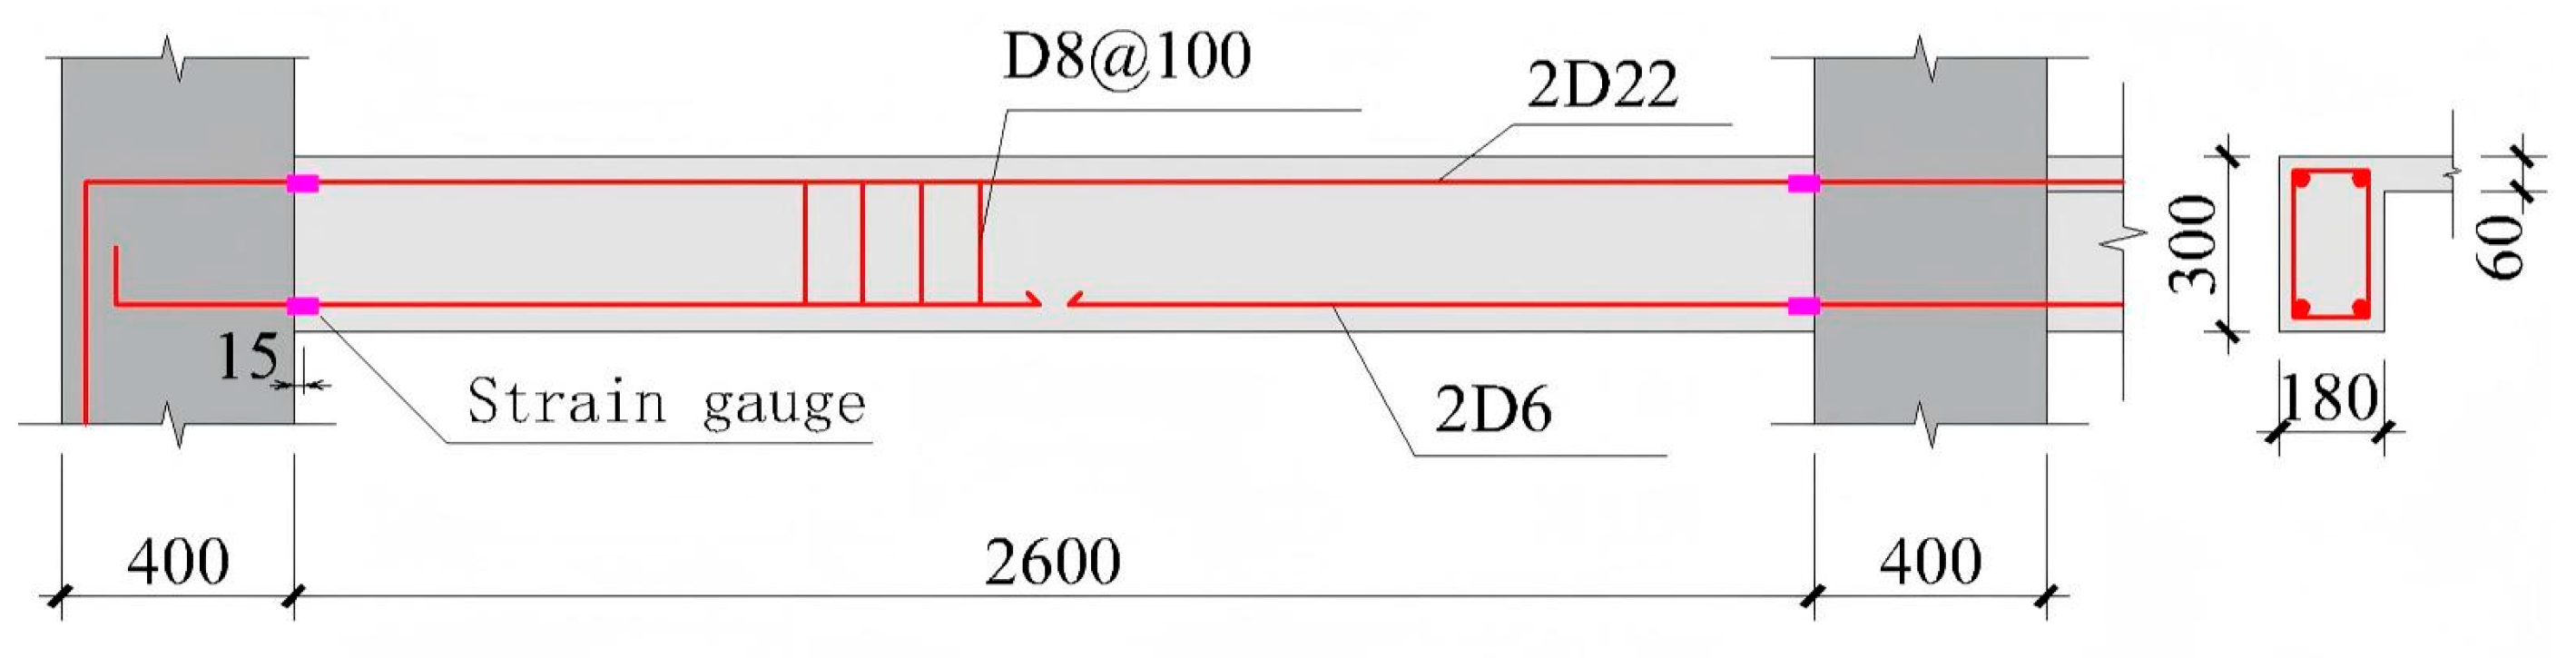
As shown in Figure 1, the frame structure comprised three bays in both the EW and NS directions, with a span of 3000 mm and 1400 mm, respectively. The “test floor” contained twelve beam specimens arranged in the EW direction. The slabs on the test floor had a thickness of 60 mm and were reinforced with two layers of 6 mm diameter rebars spaced 250 mm in both directions. The beams on the “reaction floor” served as reaction beams for the loading system. No slab was cast on the reaction floor, thereby providing the necessary working space for experimental loading. Each tested frame beam had a width × height of 180 mm × 300 mm and a clear span of 2600 mm, with 8 mm diameter stirrups spaced at 100 mm (D8@100). The bottom longitudinal rebars consisted of two 6 mm diameter rebars, which were curtailed at the mid-span section to minimize their flexural contribution, ensuring that the beam-end plastic hinges contributed predominantly to the load capacity of the tested beams. This detailing enabled the mechanical behavior of the beam-end plastic hinges under spatial restraint to be investigated.
The experimental variables of the frame beams included spatial location, top longitudinal rebar ratio ρ and shear span ratio λ. As shown in Figure 2, the planar frames containing tested beams were classified as either exterior or interior frames according to their locations within the spatial frame structure. Beams in interior frames were connected to slabs on both sides and, therefore, had T-shaped cross sections, while beams in exterior frames were connected to a slab on only one side and had inverted L-shaped cross sections. The tested beams were further classified according to their position within the planar frame, namely exterior-bay and interior-bay beams.
The details of the frame beams are summarized in Table 1. Two top longitudinal rebar ratios ρ, 0.86% and 1.62%, representing two contrasting values within the minimum and maximum bounds, and two shear span ratios λ, 3.5 and 5.0, were considered. λ was calculated by
λ = a / h 0 ,
where a is the distance from the loading point to the beam end and h0 is the effective depth of the beam section.
The frame beams located on Axes A and B adopted the larger ρ of 1.62%, whereas those on Axes C and D adopted the smaller ρ of 0.86%. Within each planar frame, the interior-bay beam and the western exterior-bay beam adopted the larger λ of 5.0 and were subjected to single-point loading at mid-span. In contrast, the eastern exterior-bay beam adopted the smaller λ of 3.5, which was achieved using two-point loading. The frame beams were labeled as “section type-bay position-ρ-λ”. The section type was associated with the frame location: T represents beams in interior frames forming T-shaped cross sections, while Γ represents beams in exterior frames forming inverted L-shaped cross sections. The bay position is denoted by E and I, representing exterior-bay and interior-bay beams, respectively. For example, T-I-1.62-5 denotes a T-shaped beam in the interior bay, with ρ = 1.62% and λ = 5.0; its rebar details are shown in Figure 3.

2.2. Material Properties

Based on compression tests conducted on 6 standard concrete cylinder samples, the compressive strength of the concrete used for the test floor was 33.9 MPa. The mechanical properties of the different steel rebar types, obtained from uniaxial tensile tests of 3 samples per type, are summarized in Table 2.

2.3. Loading and Measurement Setup

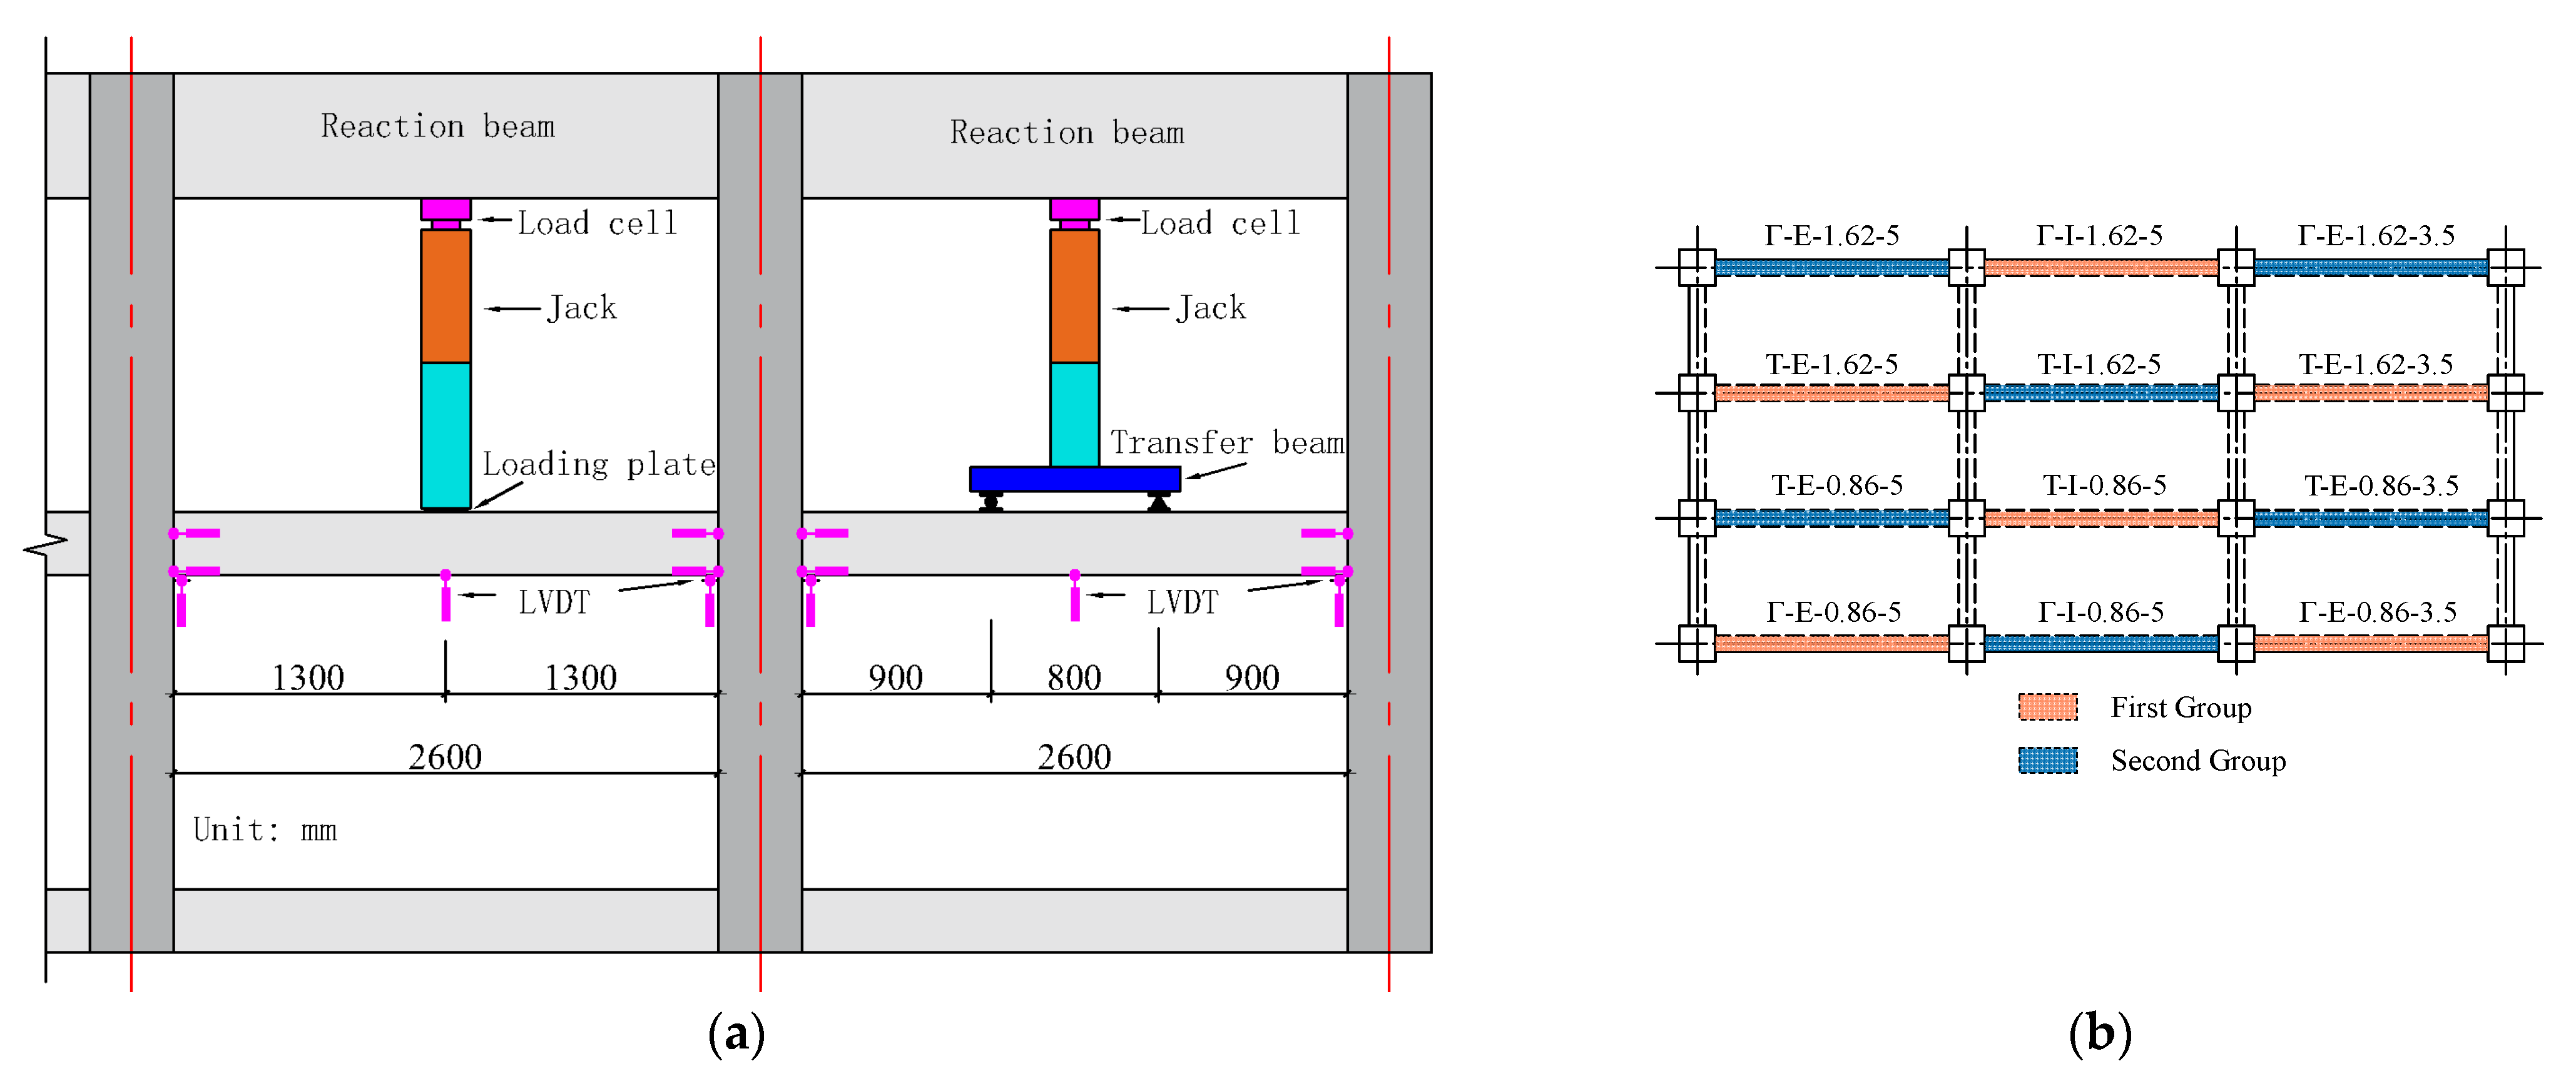
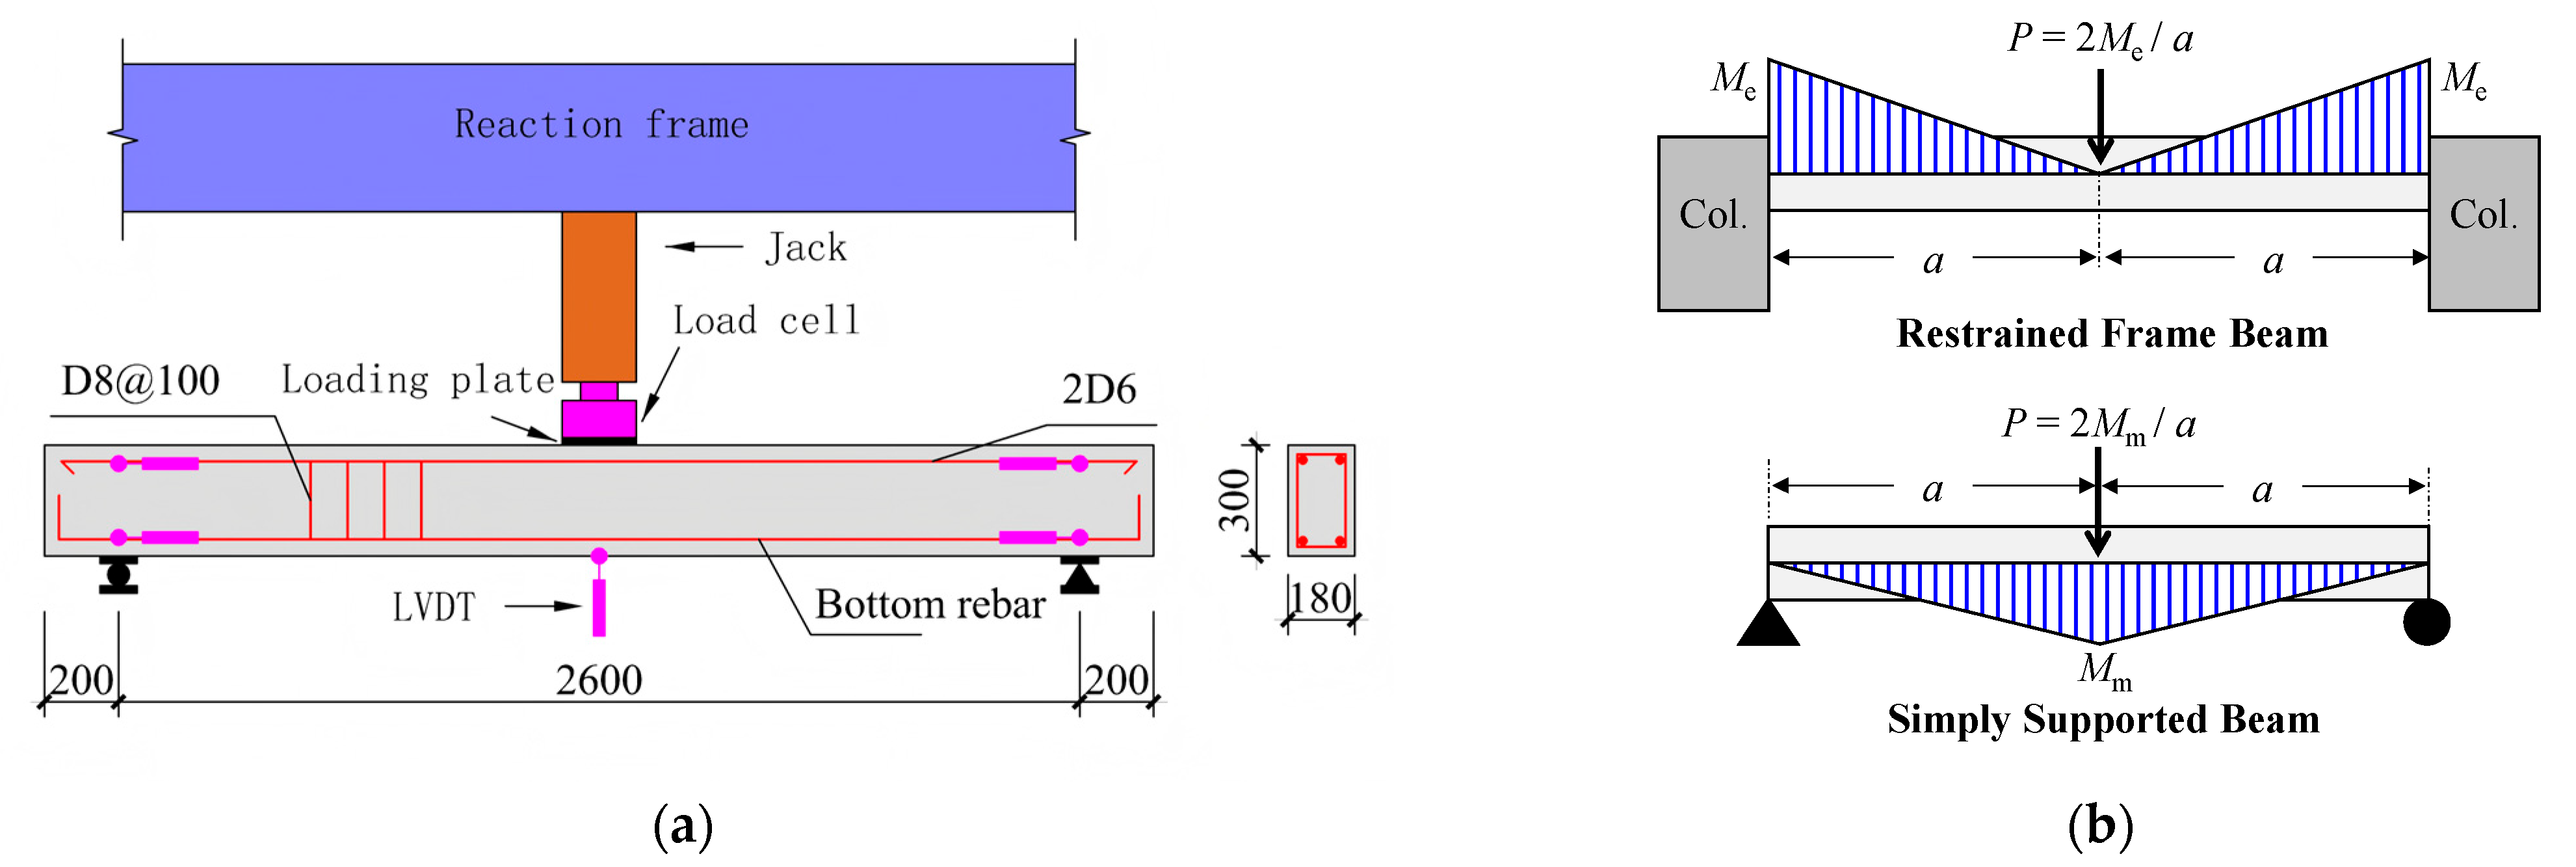
Vertical loading was applied to the tested beams using either single-point or two-point loading, as presented in Figure 4a. For the interior-bay beams and the western exterior-bay beams, a concentrated load was applied at mid-span, corresponding to a = 1300 mm and λ = 5.0. For the eastern exterior-bay beams, two-point loading was adopted, corresponding to a = 900 mm and λ = 3.5. The initial loading stage was load-controlled with an increment of 10 kN. After concrete cracking was observed at the beam-end plastic hinges, the load increment was increased to 20 kN. Once softening was observed in the load–deflection curve, the loading protocol was switched to displacement control with an increment of 2 mm.
Figure 4b shows the loading sequence of the tested beams. The specimens in the first loading group were tested before those in the second loading group. Within each loading group, the specimens were loaded independently and sequentially. This loading sequence ensured that the adjacent slabs and beams of the first-group specimens remained undamaged before testing. In contrast, the adjacent slabs and beams of the second-group specimens had already experienced damage induced by the preceding tests, which may have partially reduced the spatial restraint levels.
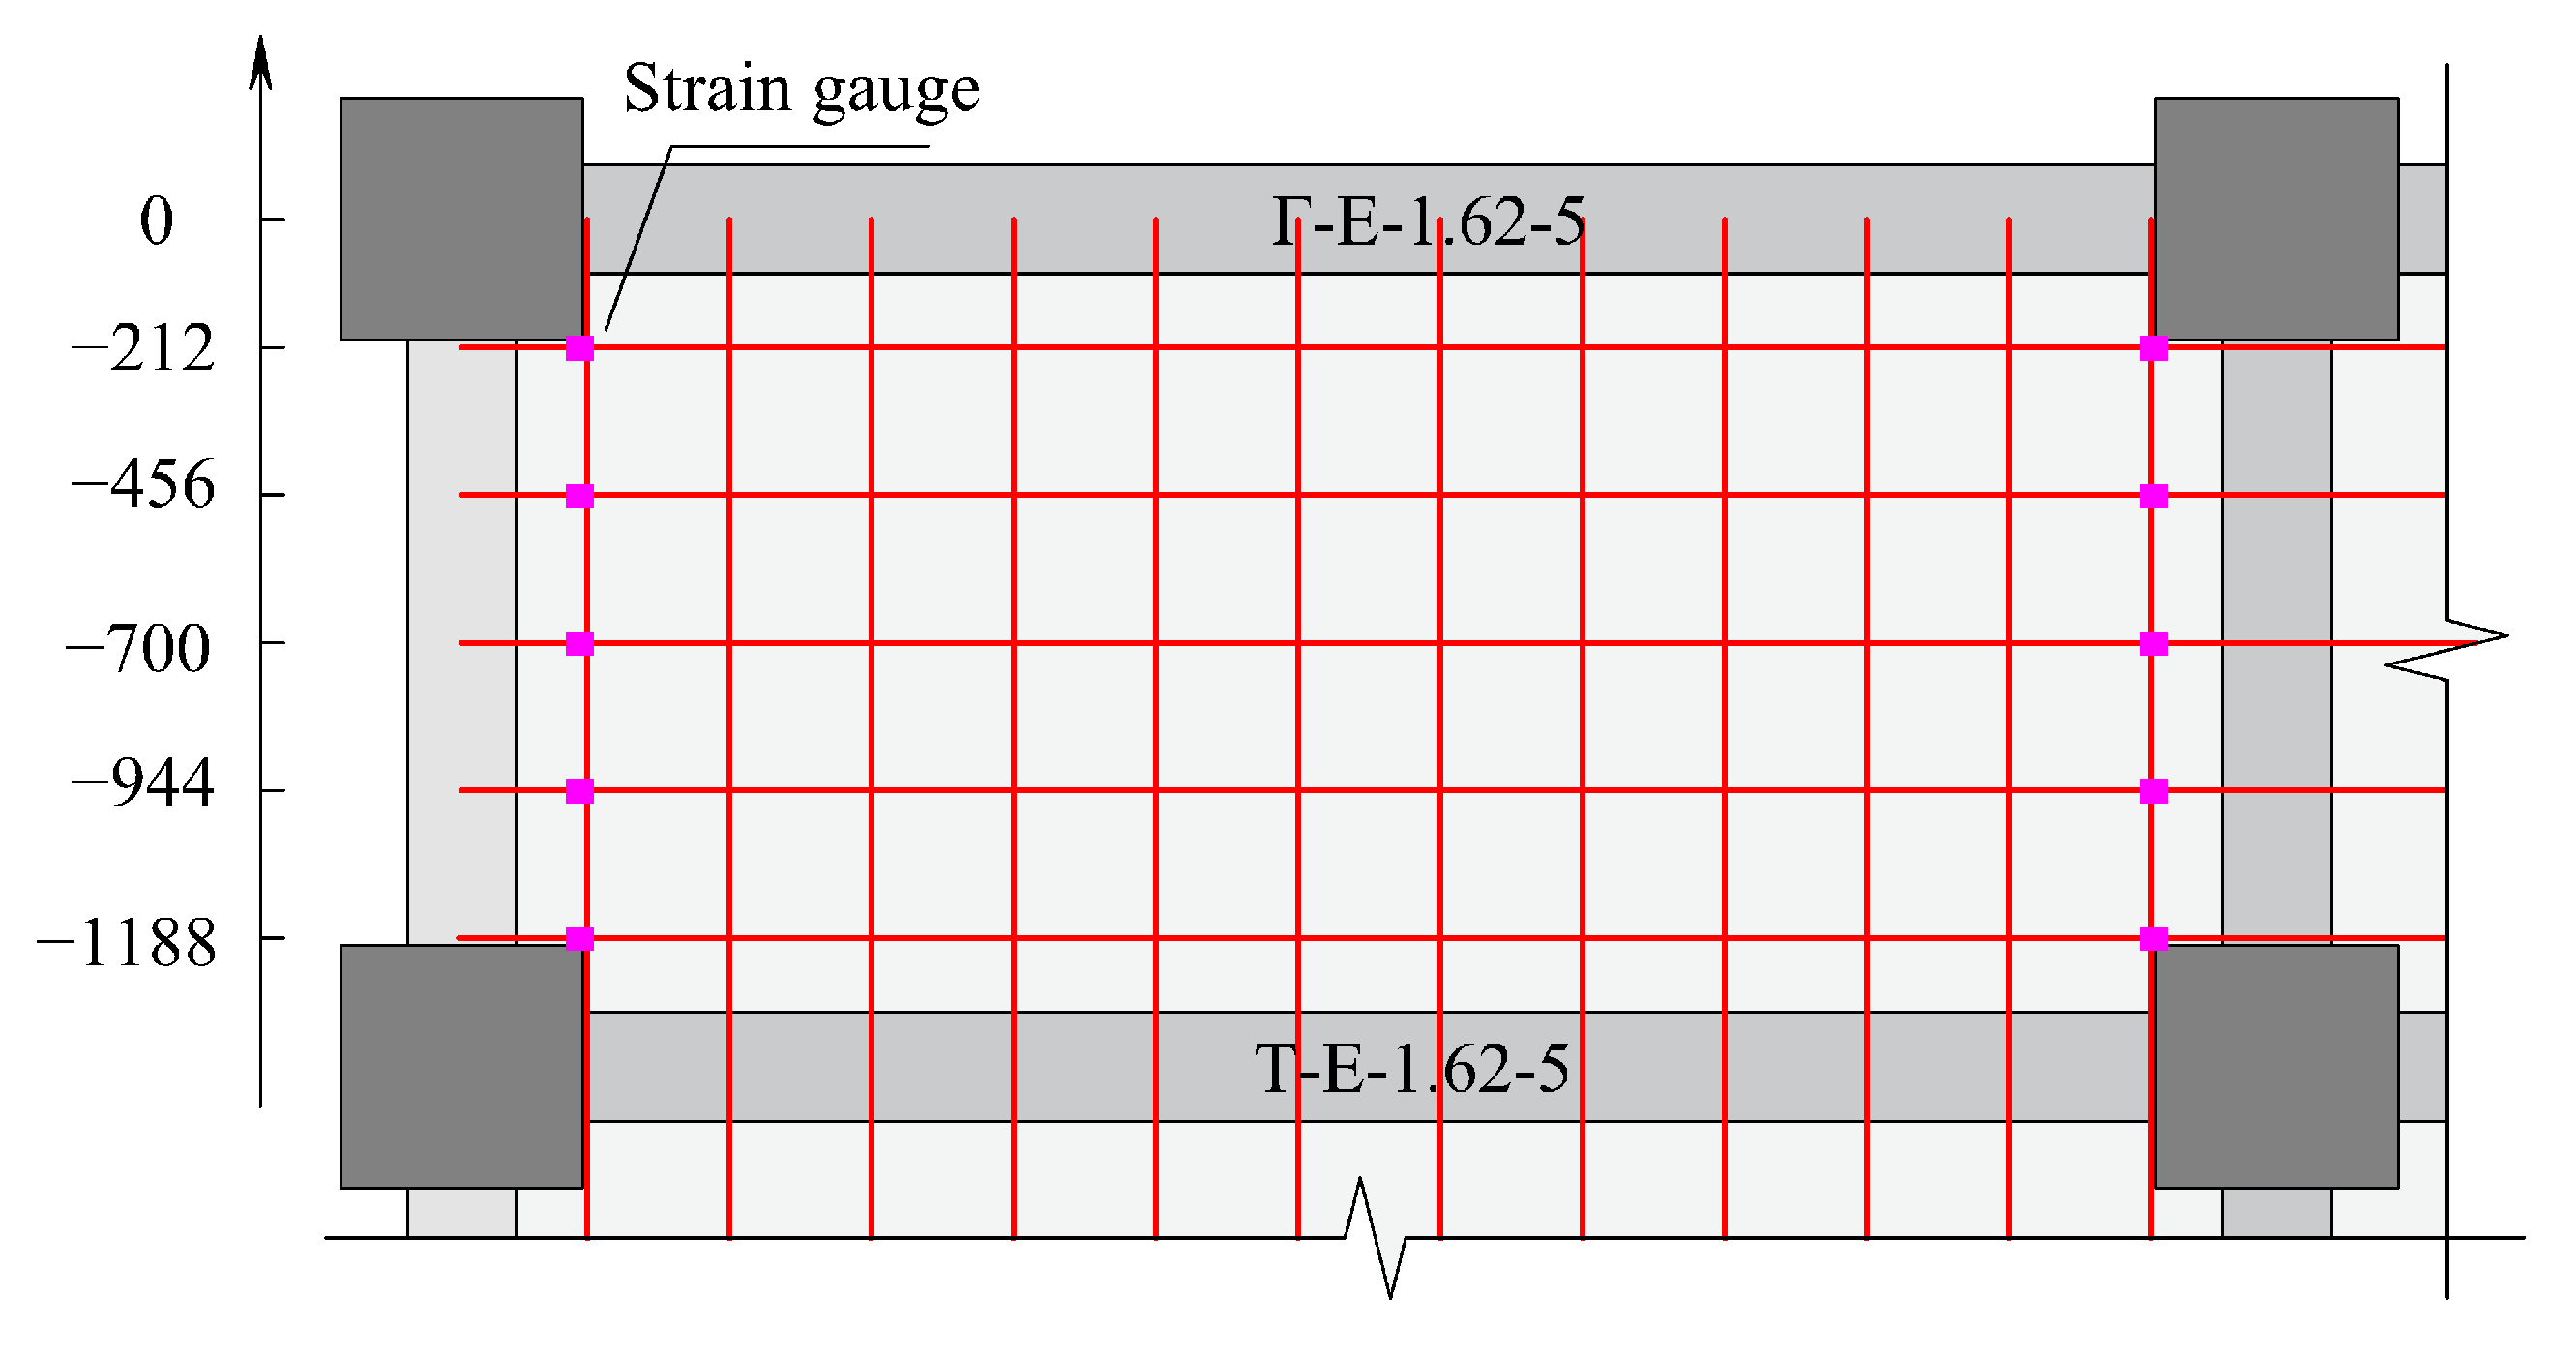
The instruments consisted of linear variable displacement transducers (LVDTs) and strain gauges. As shown in Figure 4a, the mid-span deflection and horizontal displacements at the beam ends were measured using LVDTs. The measured horizontal displacements were used to calculate the beam elongation. As shown in Figure 3, strain gauges were attached to the top and bottom longitudinal rebars at the beam ends. Taking Specimen Γ-E-1.62-5 as an example, Figure 5 shows the layout of strain gauges on the rebars of the adjacent slab. These gauges were attached to the EW-direction top rebars of the slabs near the edges of the NS transverse beams to measure the slab rebar strains at the beam ends.

2.4. Unrestrained Comparison Beams

Two simply supported rectangular beams were designed as unrestrained comparison specimens and were designated as “R-ρ-λ”. These specimens were used as references to isolate the effects of slab rebars and spatial restraint on the mechanical behavior of the frame beams. Accordingly, they were fabricated using the same concrete and rebar materials as the frame beams, and were designed with corresponding rebar ratios and shear span ratios. The sectional geometry and rebar details of the simply supported beams are summarized in Table 3.
Figure 6a presents the loading setup for the simply supported beams. A concentrated load was applied at mid-span, corresponding to a = 1300 mm and λ = 5.0. Initially, the specimens were loaded under load control with an increment of 5 kN. After concrete cracking, the load increment was increased to 10 kN. Once rebar yielding occurred, the loading protocol was switched to displacement control with a displacement increment of 2 mm.
Figure 6b presents the idealized moment diagrams of the frame beams and the simply supported rectangular beams. For the frame beams, the two beam ends were idealized as fixed supports. Owing to the curtailment of the bottom longitudinal rebars at mid-span, the mid-span section was designed to sustain a limited moment. The mid-span moment was, therefore, neglected in the idealized mechanism, and the load capacity was assumed to be governed by the beam-end moments. For a symmetric beam-end rebar arrangement, the theoretical load capacity can be expressed as P = 2Me/a, where Me is the flexural capacity of the beam-end sections.
For the simply supported rectangular beams, the theoretical load capacity is given by P = 2Mm/a, where Mm is the flexural capacity of the mid-span section. Therefore, by designing the mid-span section of the simply supported beams with the same sectional geometry and rebar details as the beam-end sections of the frame beams, the simply supported beams can serve as unrestrained comparison specimens. These specimens provide a reference for isolating the effects of slab rebars and spatial restraint on the mechanical behavior of the frame beams.

3. Experimental Results

3.1. Damage Pattern

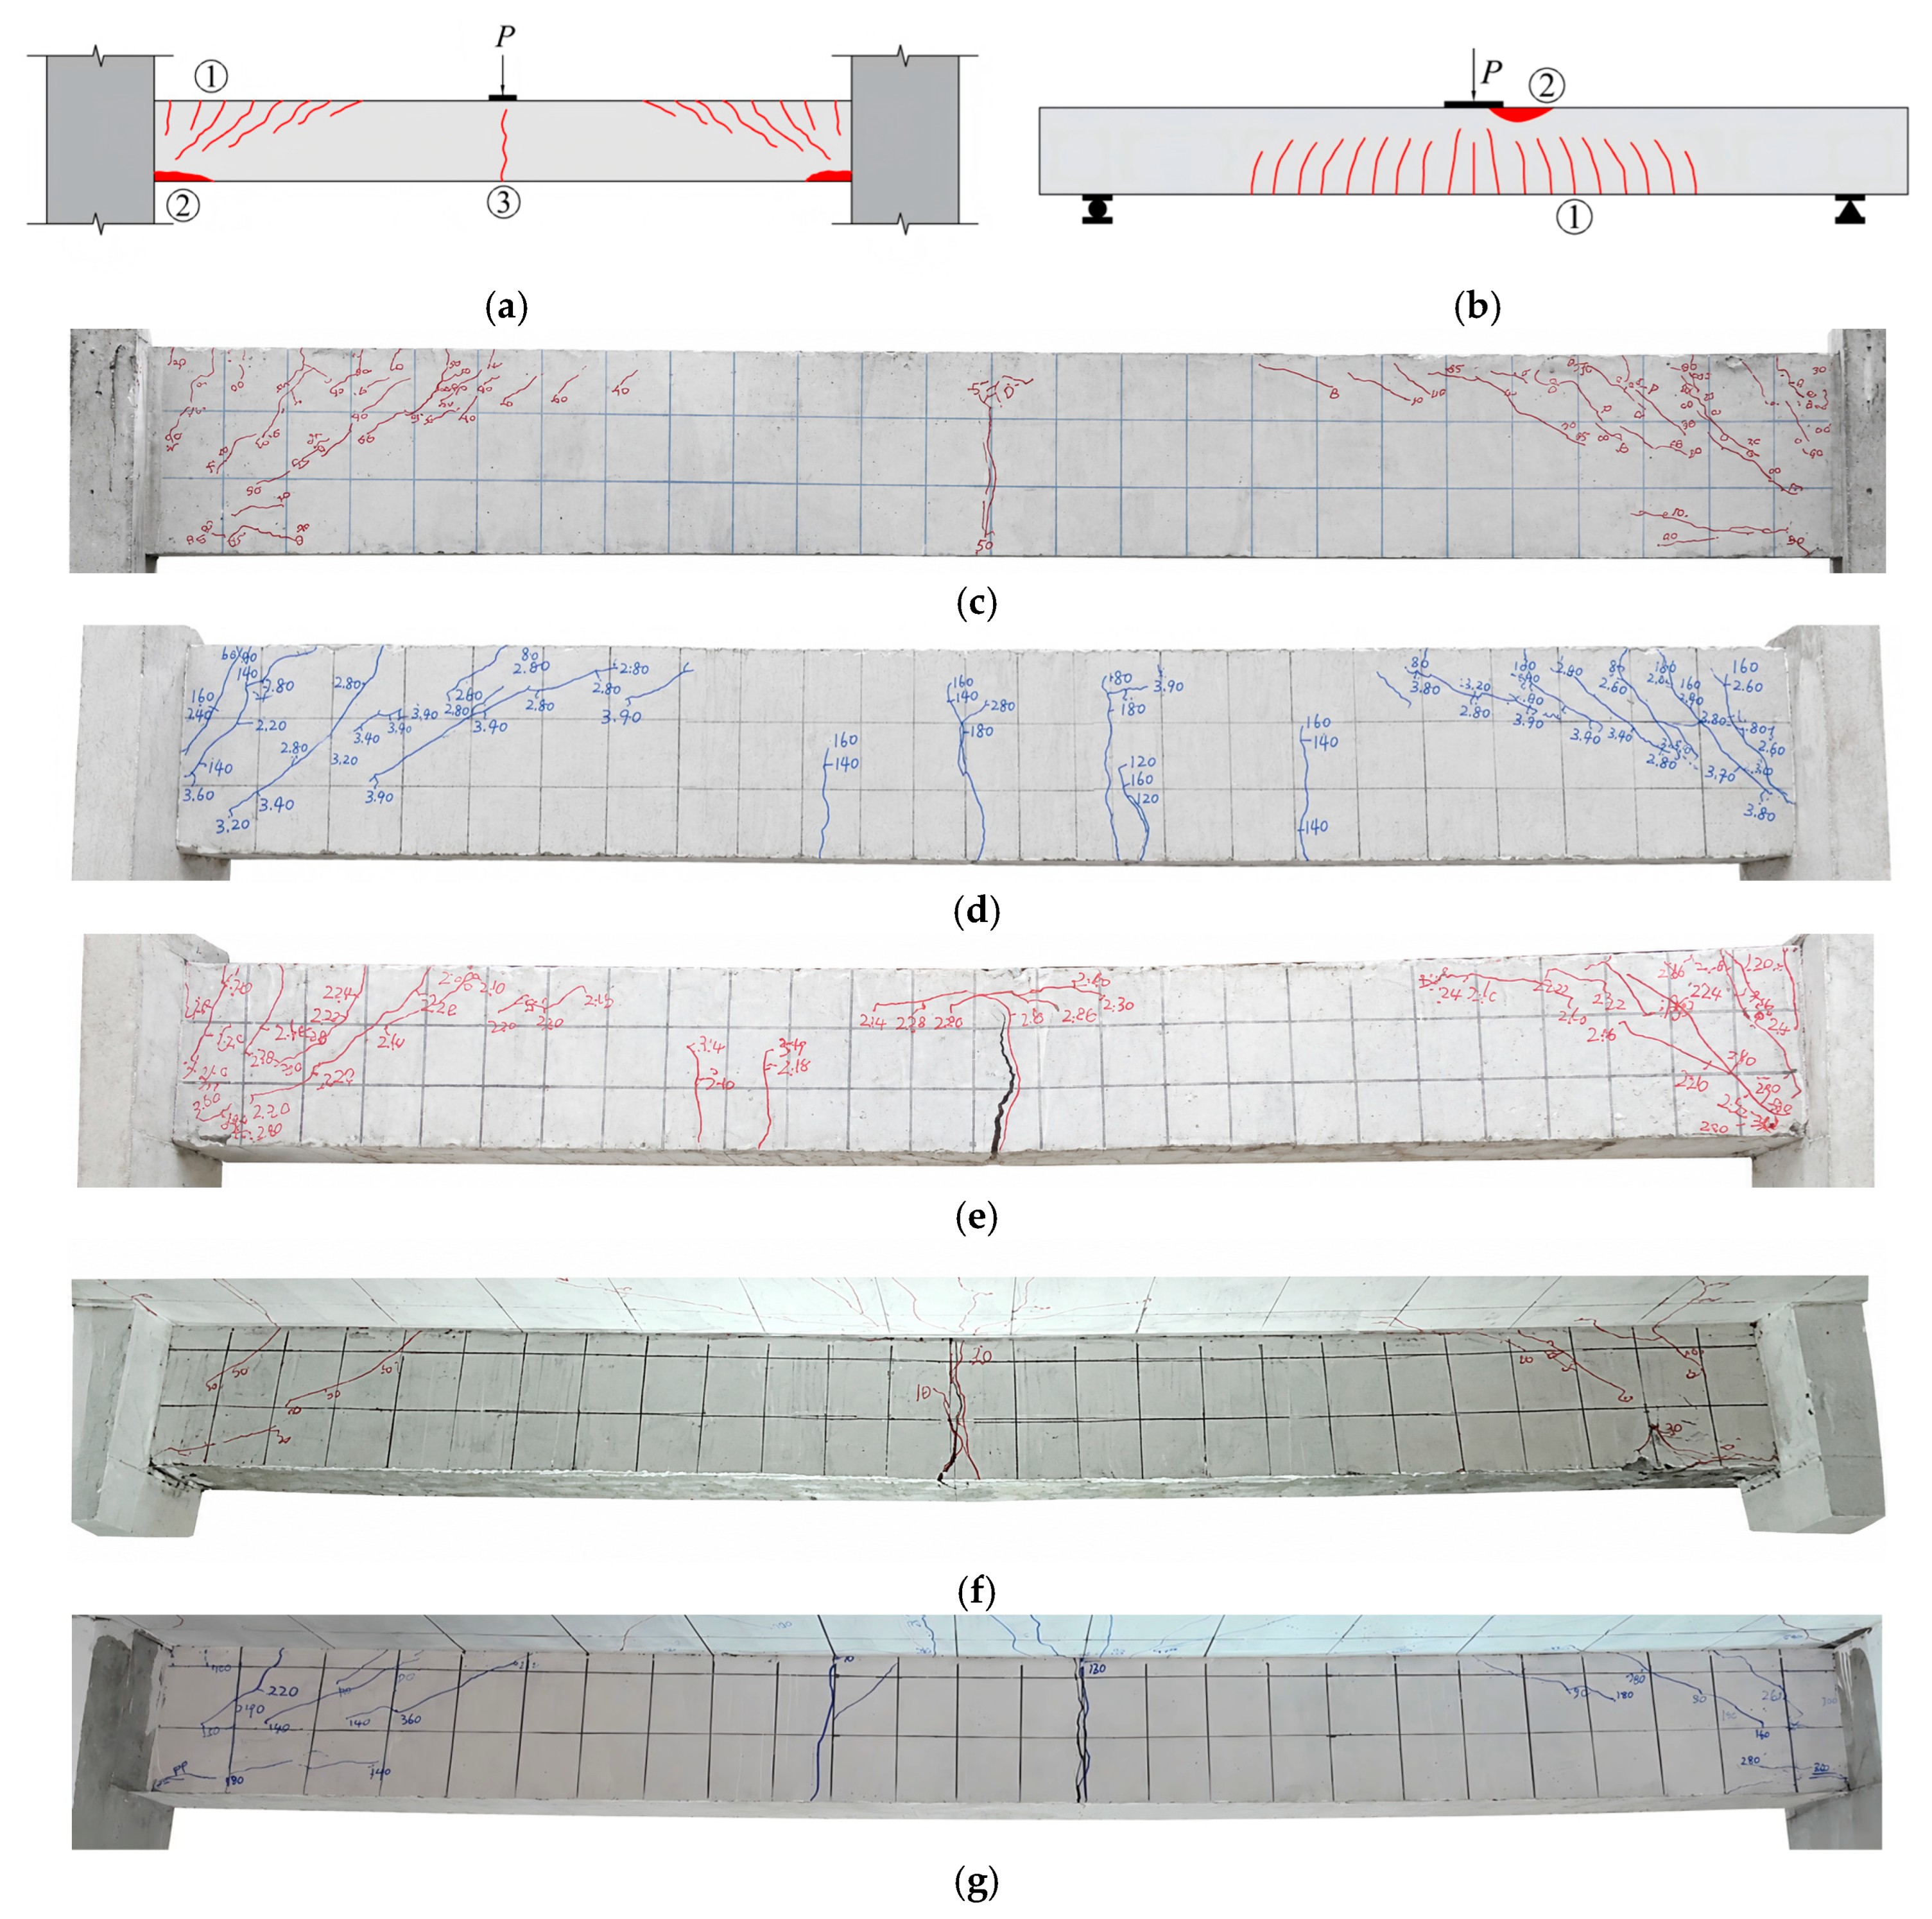
In the early loading stage, a vertical crack (③ in Figure 7a) formed at the bottom of the mid-span of the restrained beam due to the curtailment of the bottom longitudinal rebars at mid-span, indicating the formation of the mid-span hinge. Subsequently, flexural cracks (① in Figure 7a) appeared successively at the top of the two beam-end regions. As the load progressed, additional cracks developed in these regions, and the cracked zone gradually extended toward mid-span. These cracks propagated downward toward the support and evolved from flexural cracks into flexural–shear cracks, with larger inclination angles observed for cracks located farther from the beam ends. With further loading, concrete spalling (② in Figure 7a) occurred at the bottom of the beam-end regions.
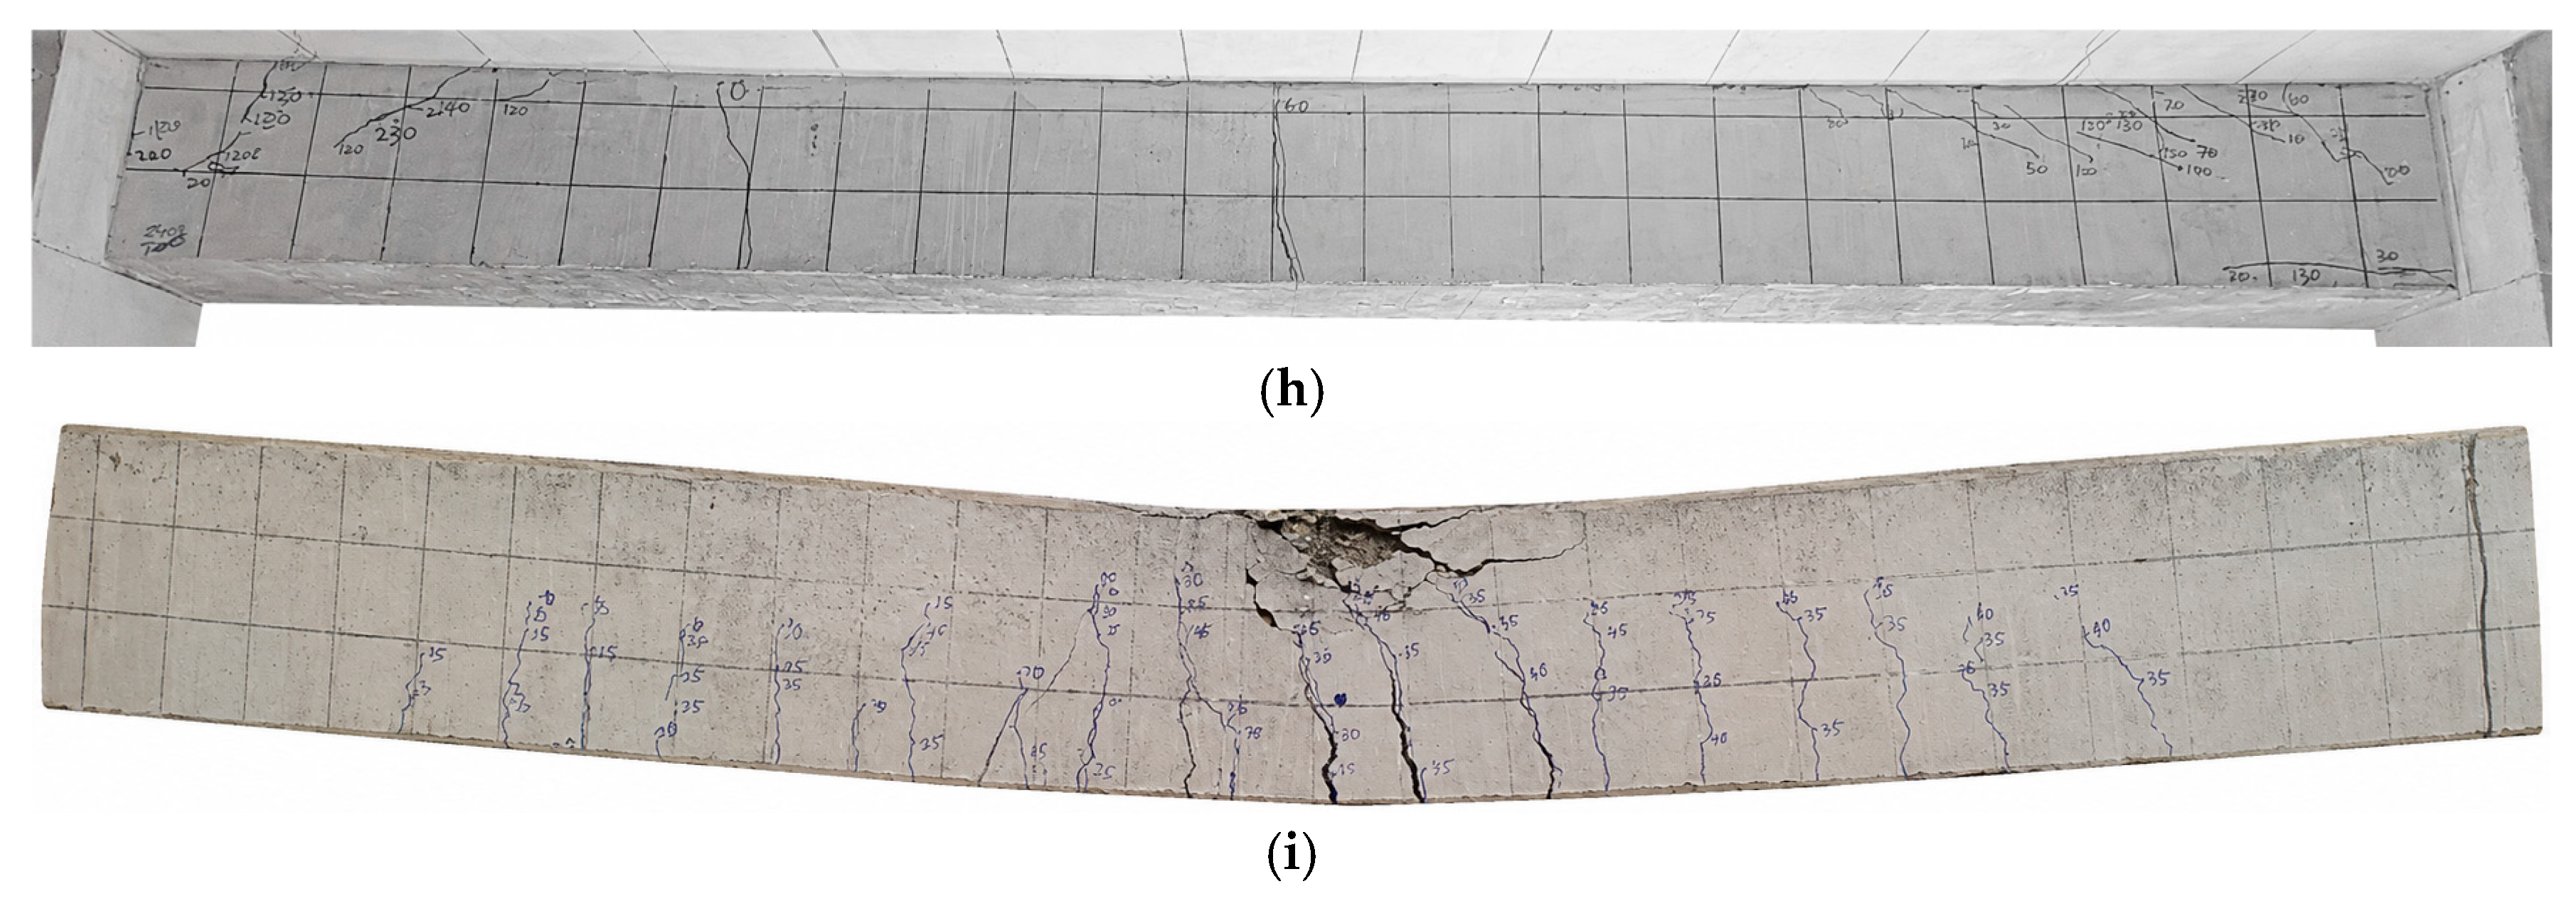
After concrete cover spalling, two different damage patterns were observed. The first pattern was classified as ductile flexural failure, in which the beams continued to sustain additional load and concrete crushing occurred only after yielding of the top longitudinal rebars. This pattern was mainly observed in the exterior-frame exterior-bay beams, where the spatial restraint was relatively weak. The second pattern was classified as brittle flexural failure, in which premature concrete crushing occurred before yielding of the top rebars. This pattern was more common in the interior-frame beams and exterior-frame interior-bay beams, where stronger spatial restraint generated higher axial compression and thereby accelerated concrete crushing at the beam-end regions. The load P and deflection Δ corresponding to concrete cracking, concrete spalling and top rebar yielding are summarized in Table 4.
Figure 7 presents the failure modes of representative restrained frame beams and unrestrained comparison beams. Although the observed damage patterns were still classified as flexural failure since no inclined crack penetrated the full beam depth, the restrained frame beams developed more pronounced flexural–shear crack patterns than the unrestrained beams, suggesting that spatial restraint increased the shear-deformation component in their overall response. Spatial restraint reduced the deformation ductility of the beam-end regions, causing the damage patterns to approach balanced flexural failure.
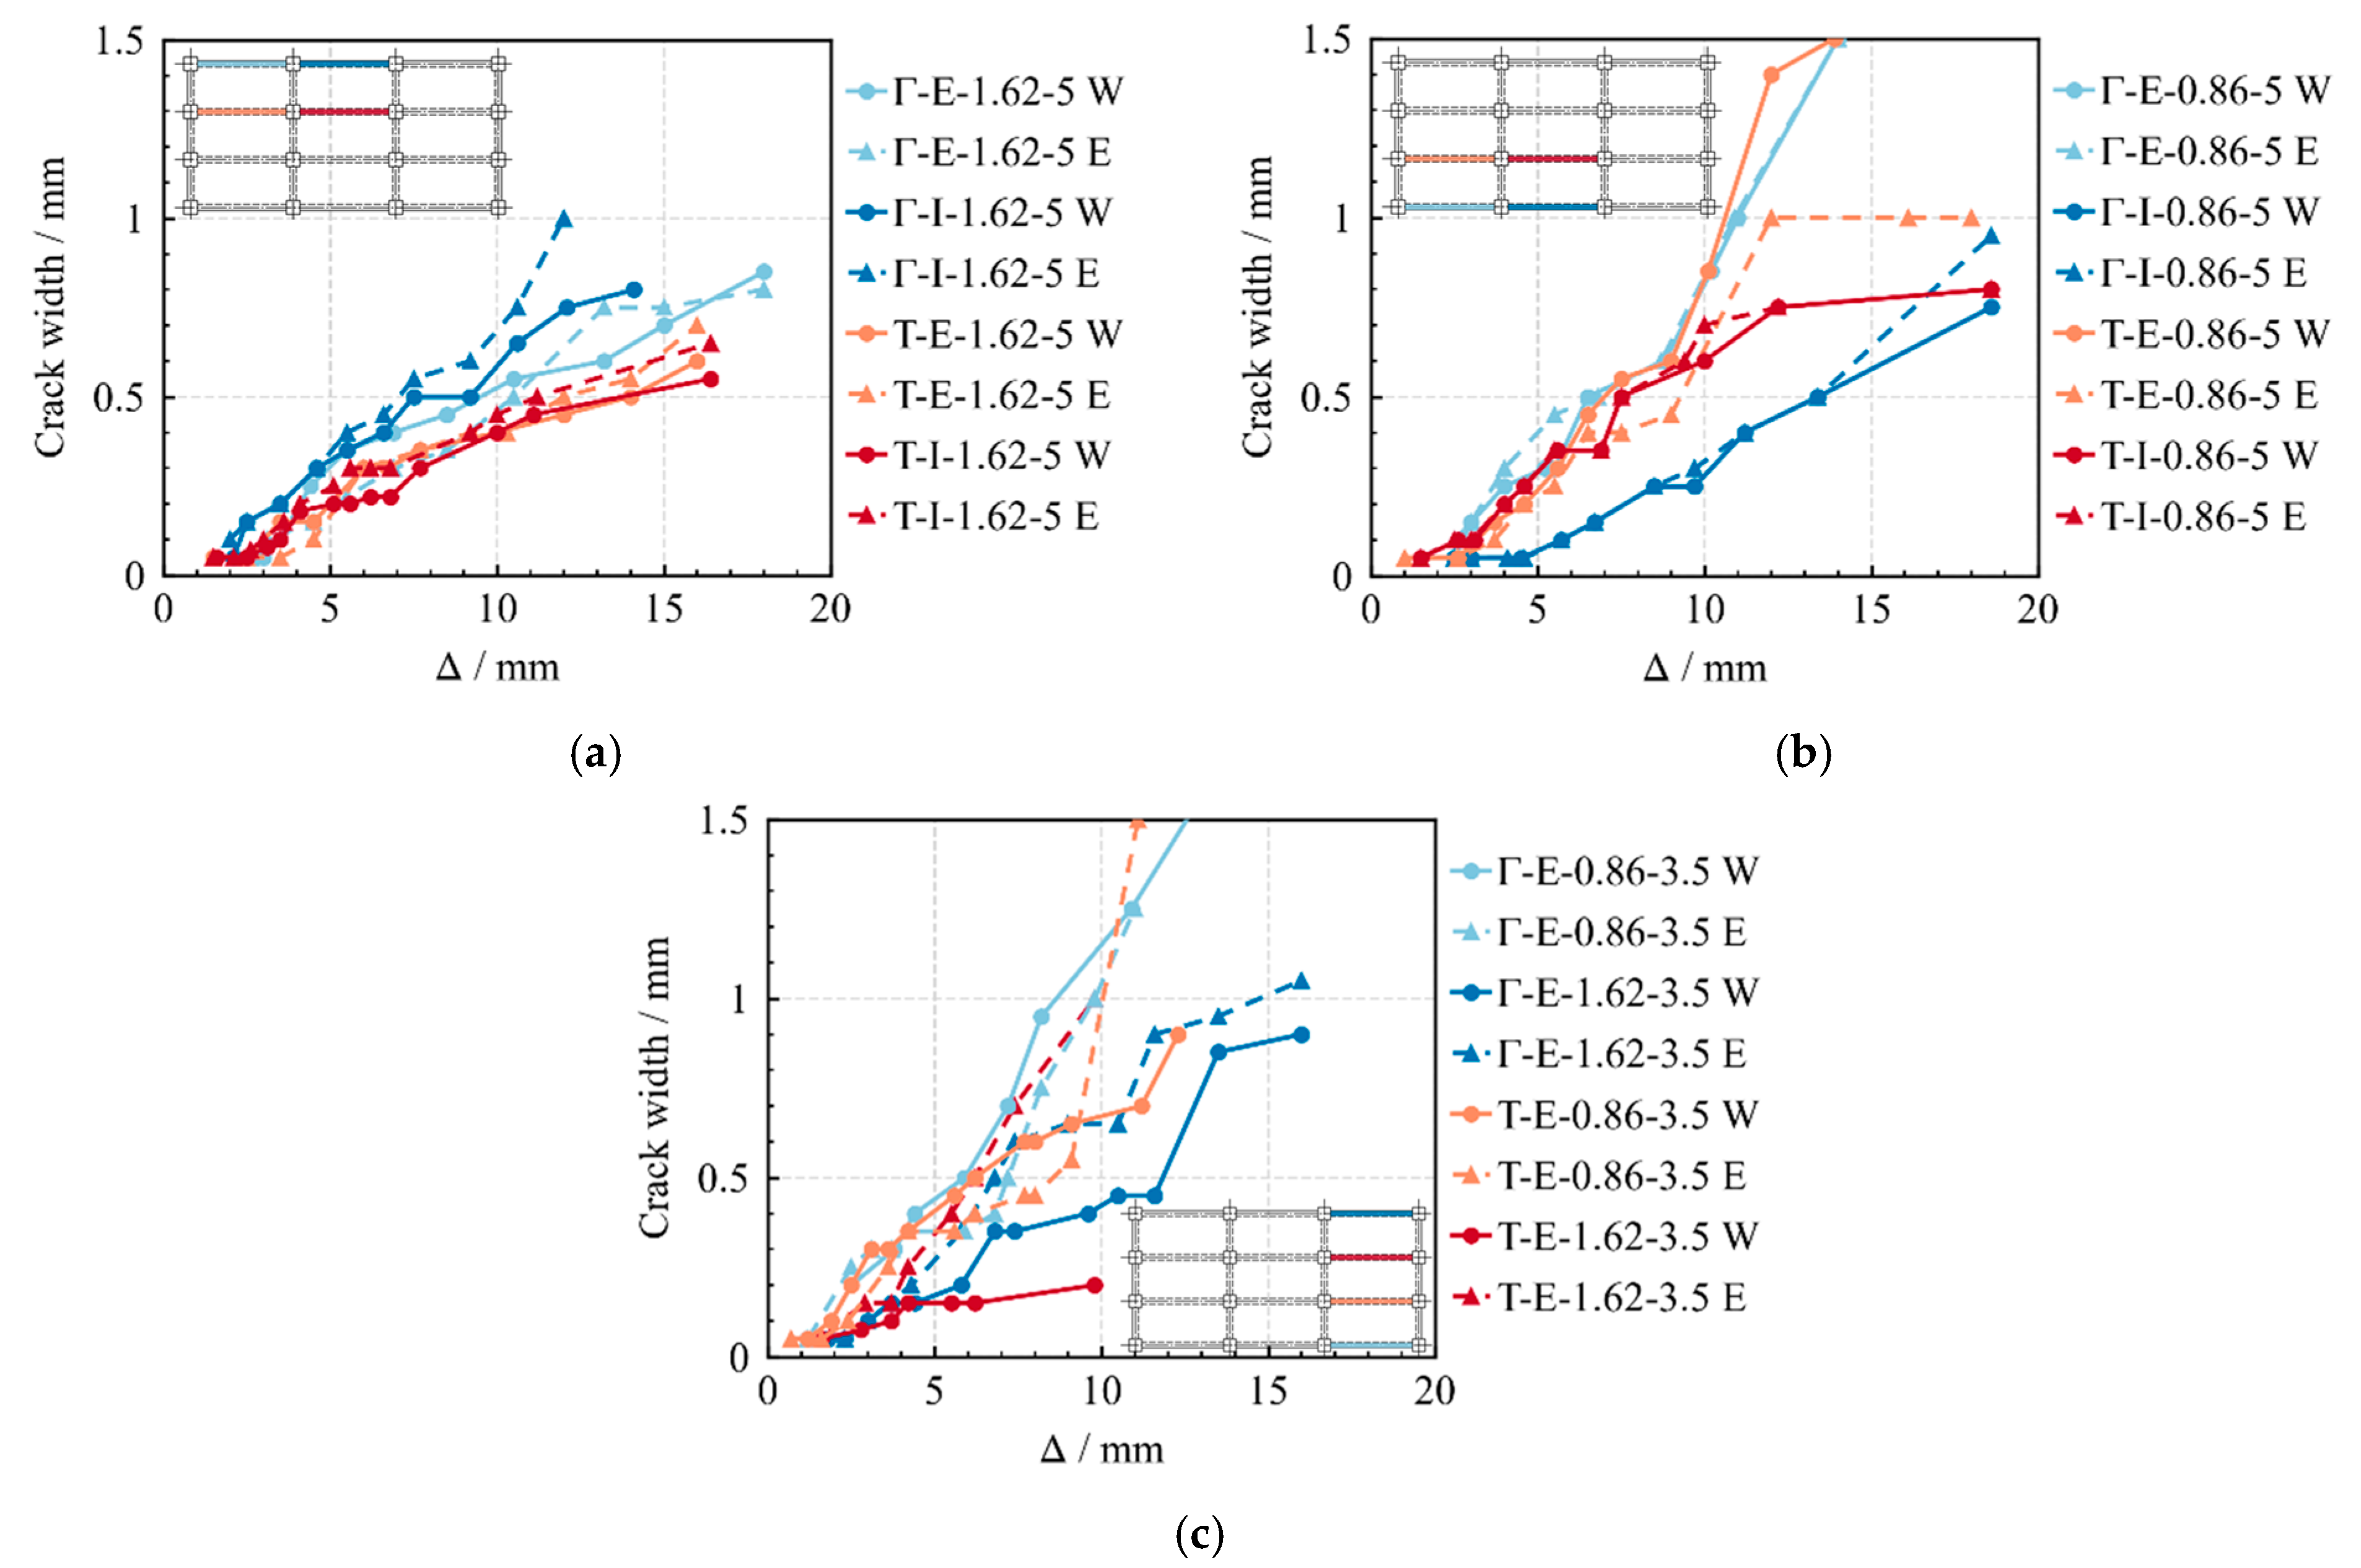
Figure 8 shows the evolution of the crack width of the restrained beam ends. In the legend, W and E denote the western and eastern beam ends, respectively. The crack width increased gradually with beam deflection. The crack width of the beams with λ = 3.5 was generally comparable to that of those with λ = 5. In contrast, beams with ρ = 1.62% exhibited smaller crack widths than those with ρ = 0.86%. In addition, the interior-frame beams showed narrower cracks than the exterior-frame beams, reflecting both the slab contribution on both sides and the higher level of spatial restraint associated with their locations closer to the central region of the frame, which jointly suppressed crack opening at the beam-end regions.

3.2. Crack Distribution of Slabs

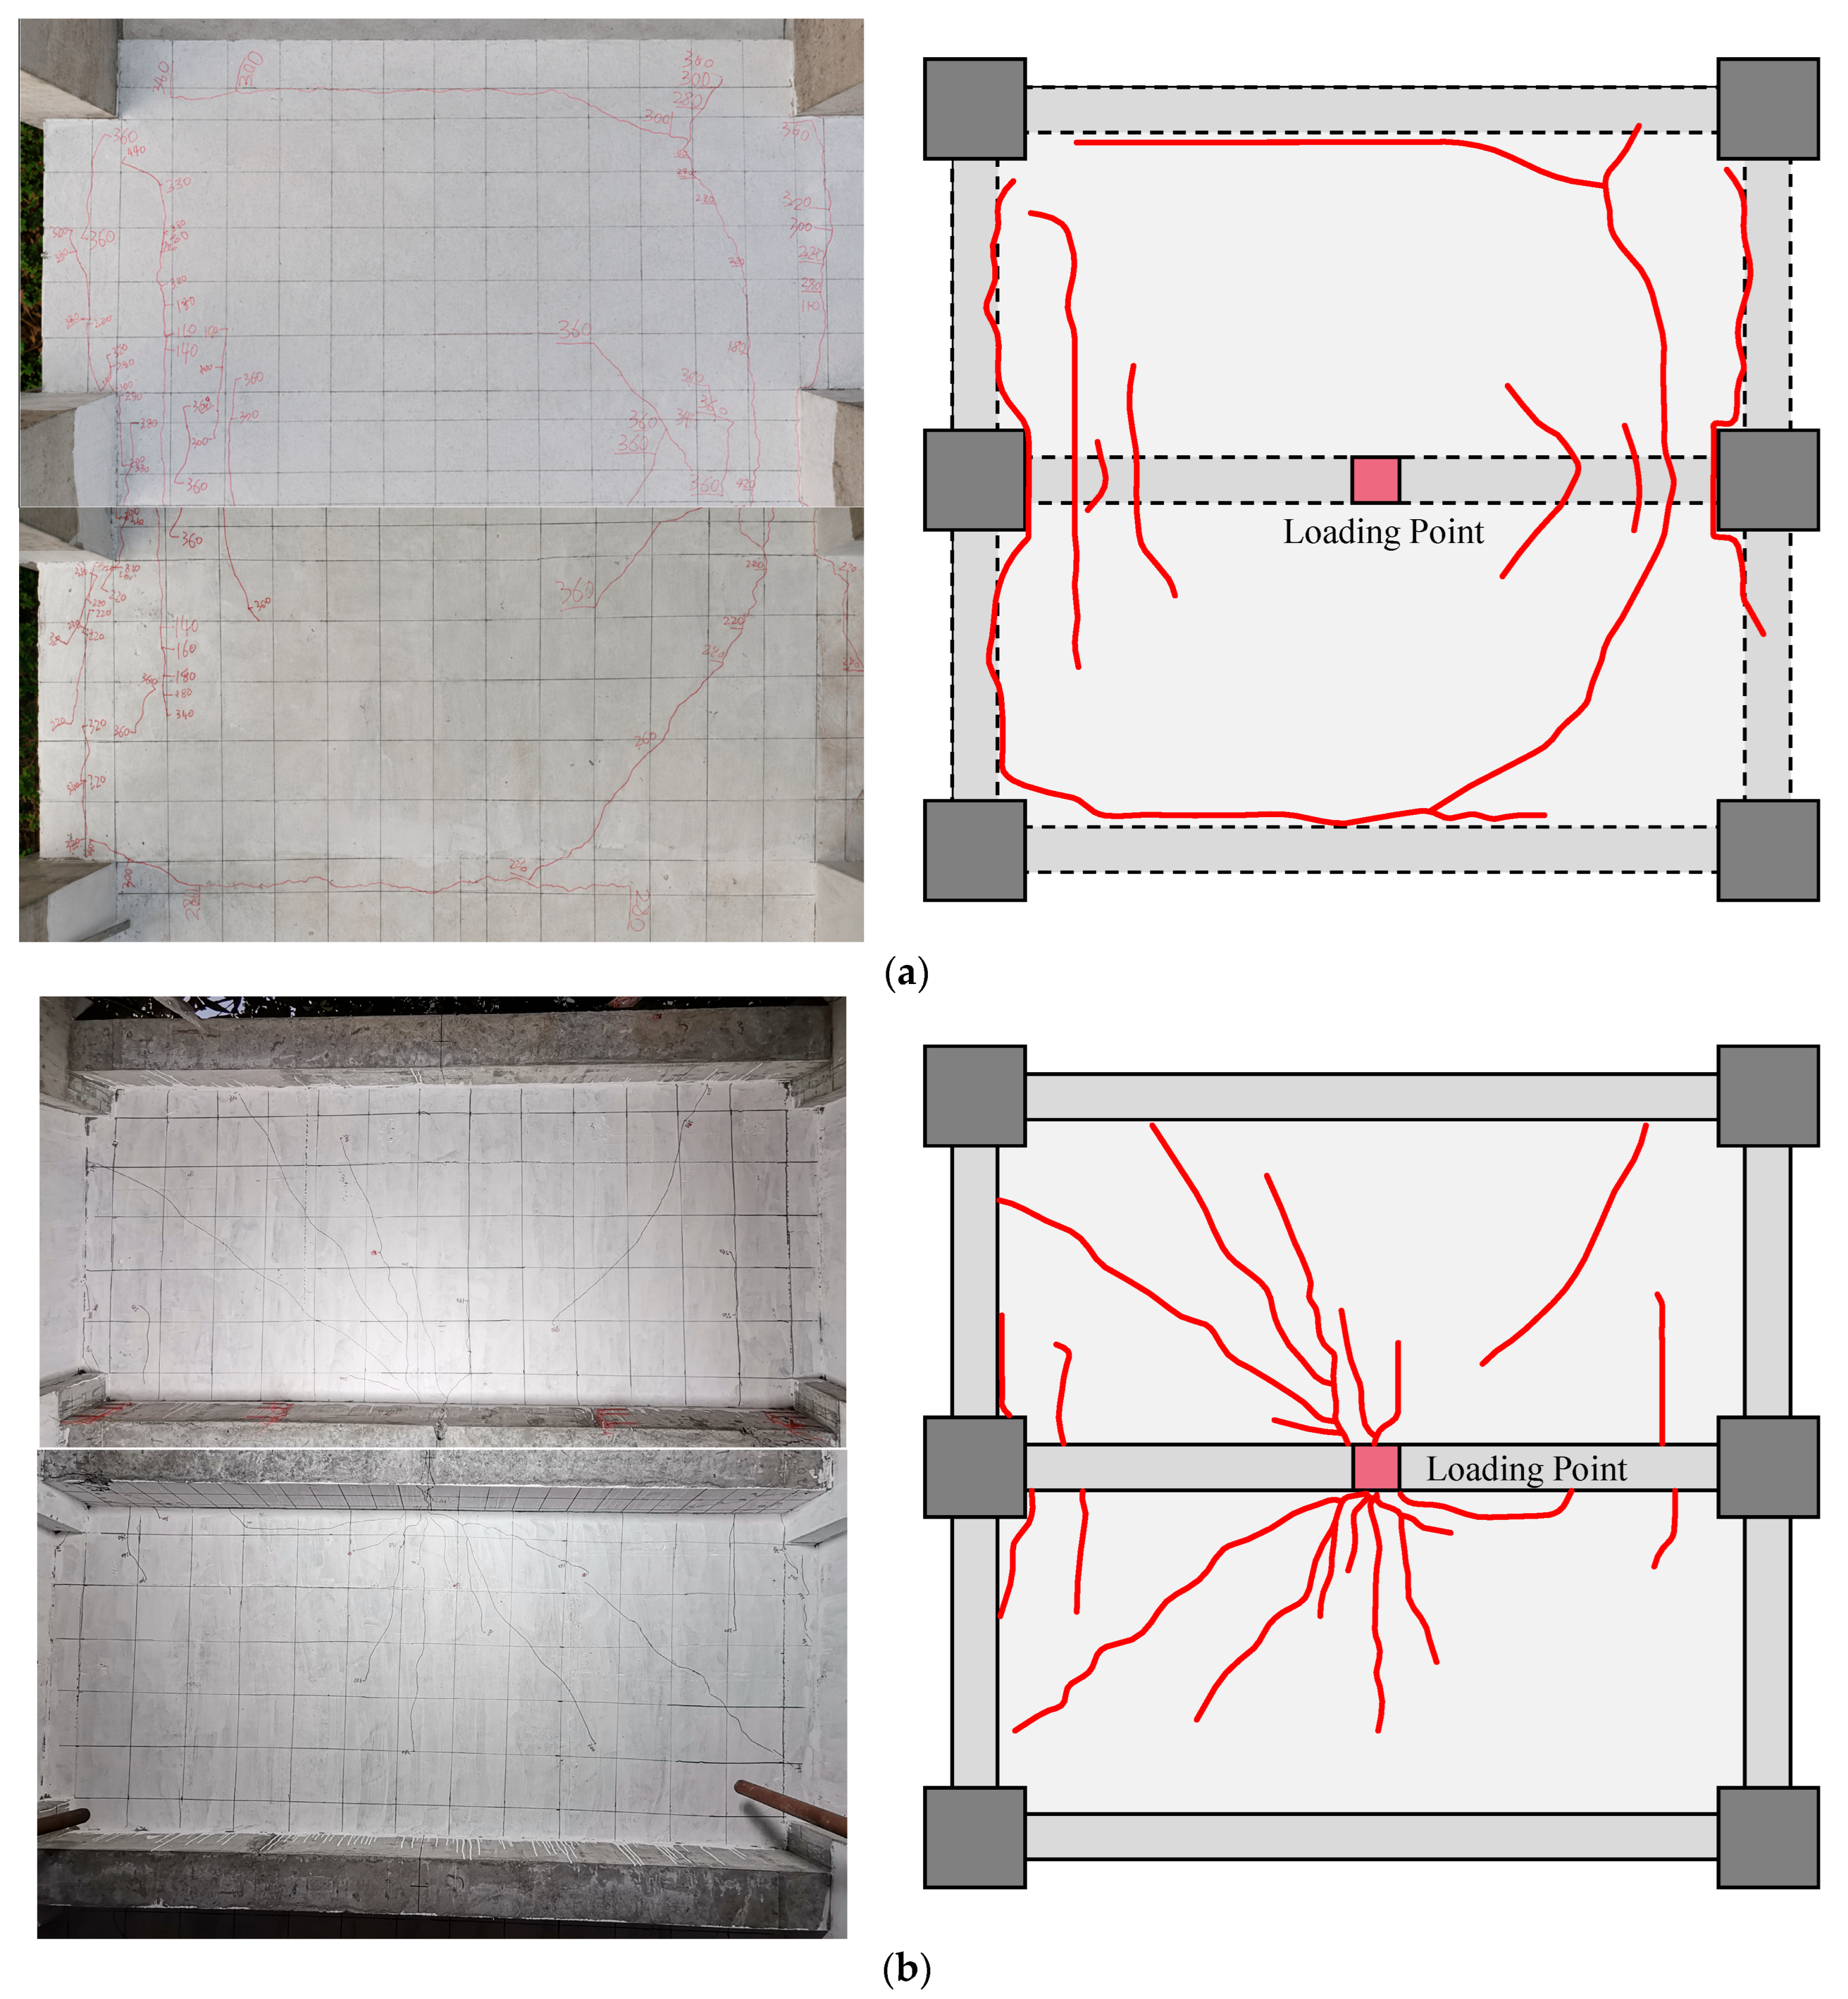
Taking T-E-1.62-5 as an example, Figure 9 presents the cracks developed in the adjacent slabs. The cracks on the top surfaces of the slabs are shown in Figure 9a. Initially, NS-direction flexural cracks formed at the beam-end regions of the loaded beam and gradually propagated into the adjacent slabs. During propagation, these cracks progressively deflected toward the EW direction, especially near the interior beam end, where stronger spatial restraint was provided. As a result, curved crack patterns developed in the slabs. Subsequently, owing to deformation compatibility, EW-direction cracks appeared along the edges of the adjacent beams parallel to the loaded beam and intersected with the slab cracks extending from the loaded beam.
The cracks on the bottom surfaces of the slabs are shown in Figure 9b. A dense cluster of cracks formed around mid-span and propagated radially into the slabs. In addition, NS-direction flexural cracks were observed on the slab bottom near the beam-end regions, indicating that the flexural cracks had penetrated through the slab thickness. This also suggests that the slab rebars participated in the flexural response of the beam-end regions.

3.3. Load–Deflection Curve

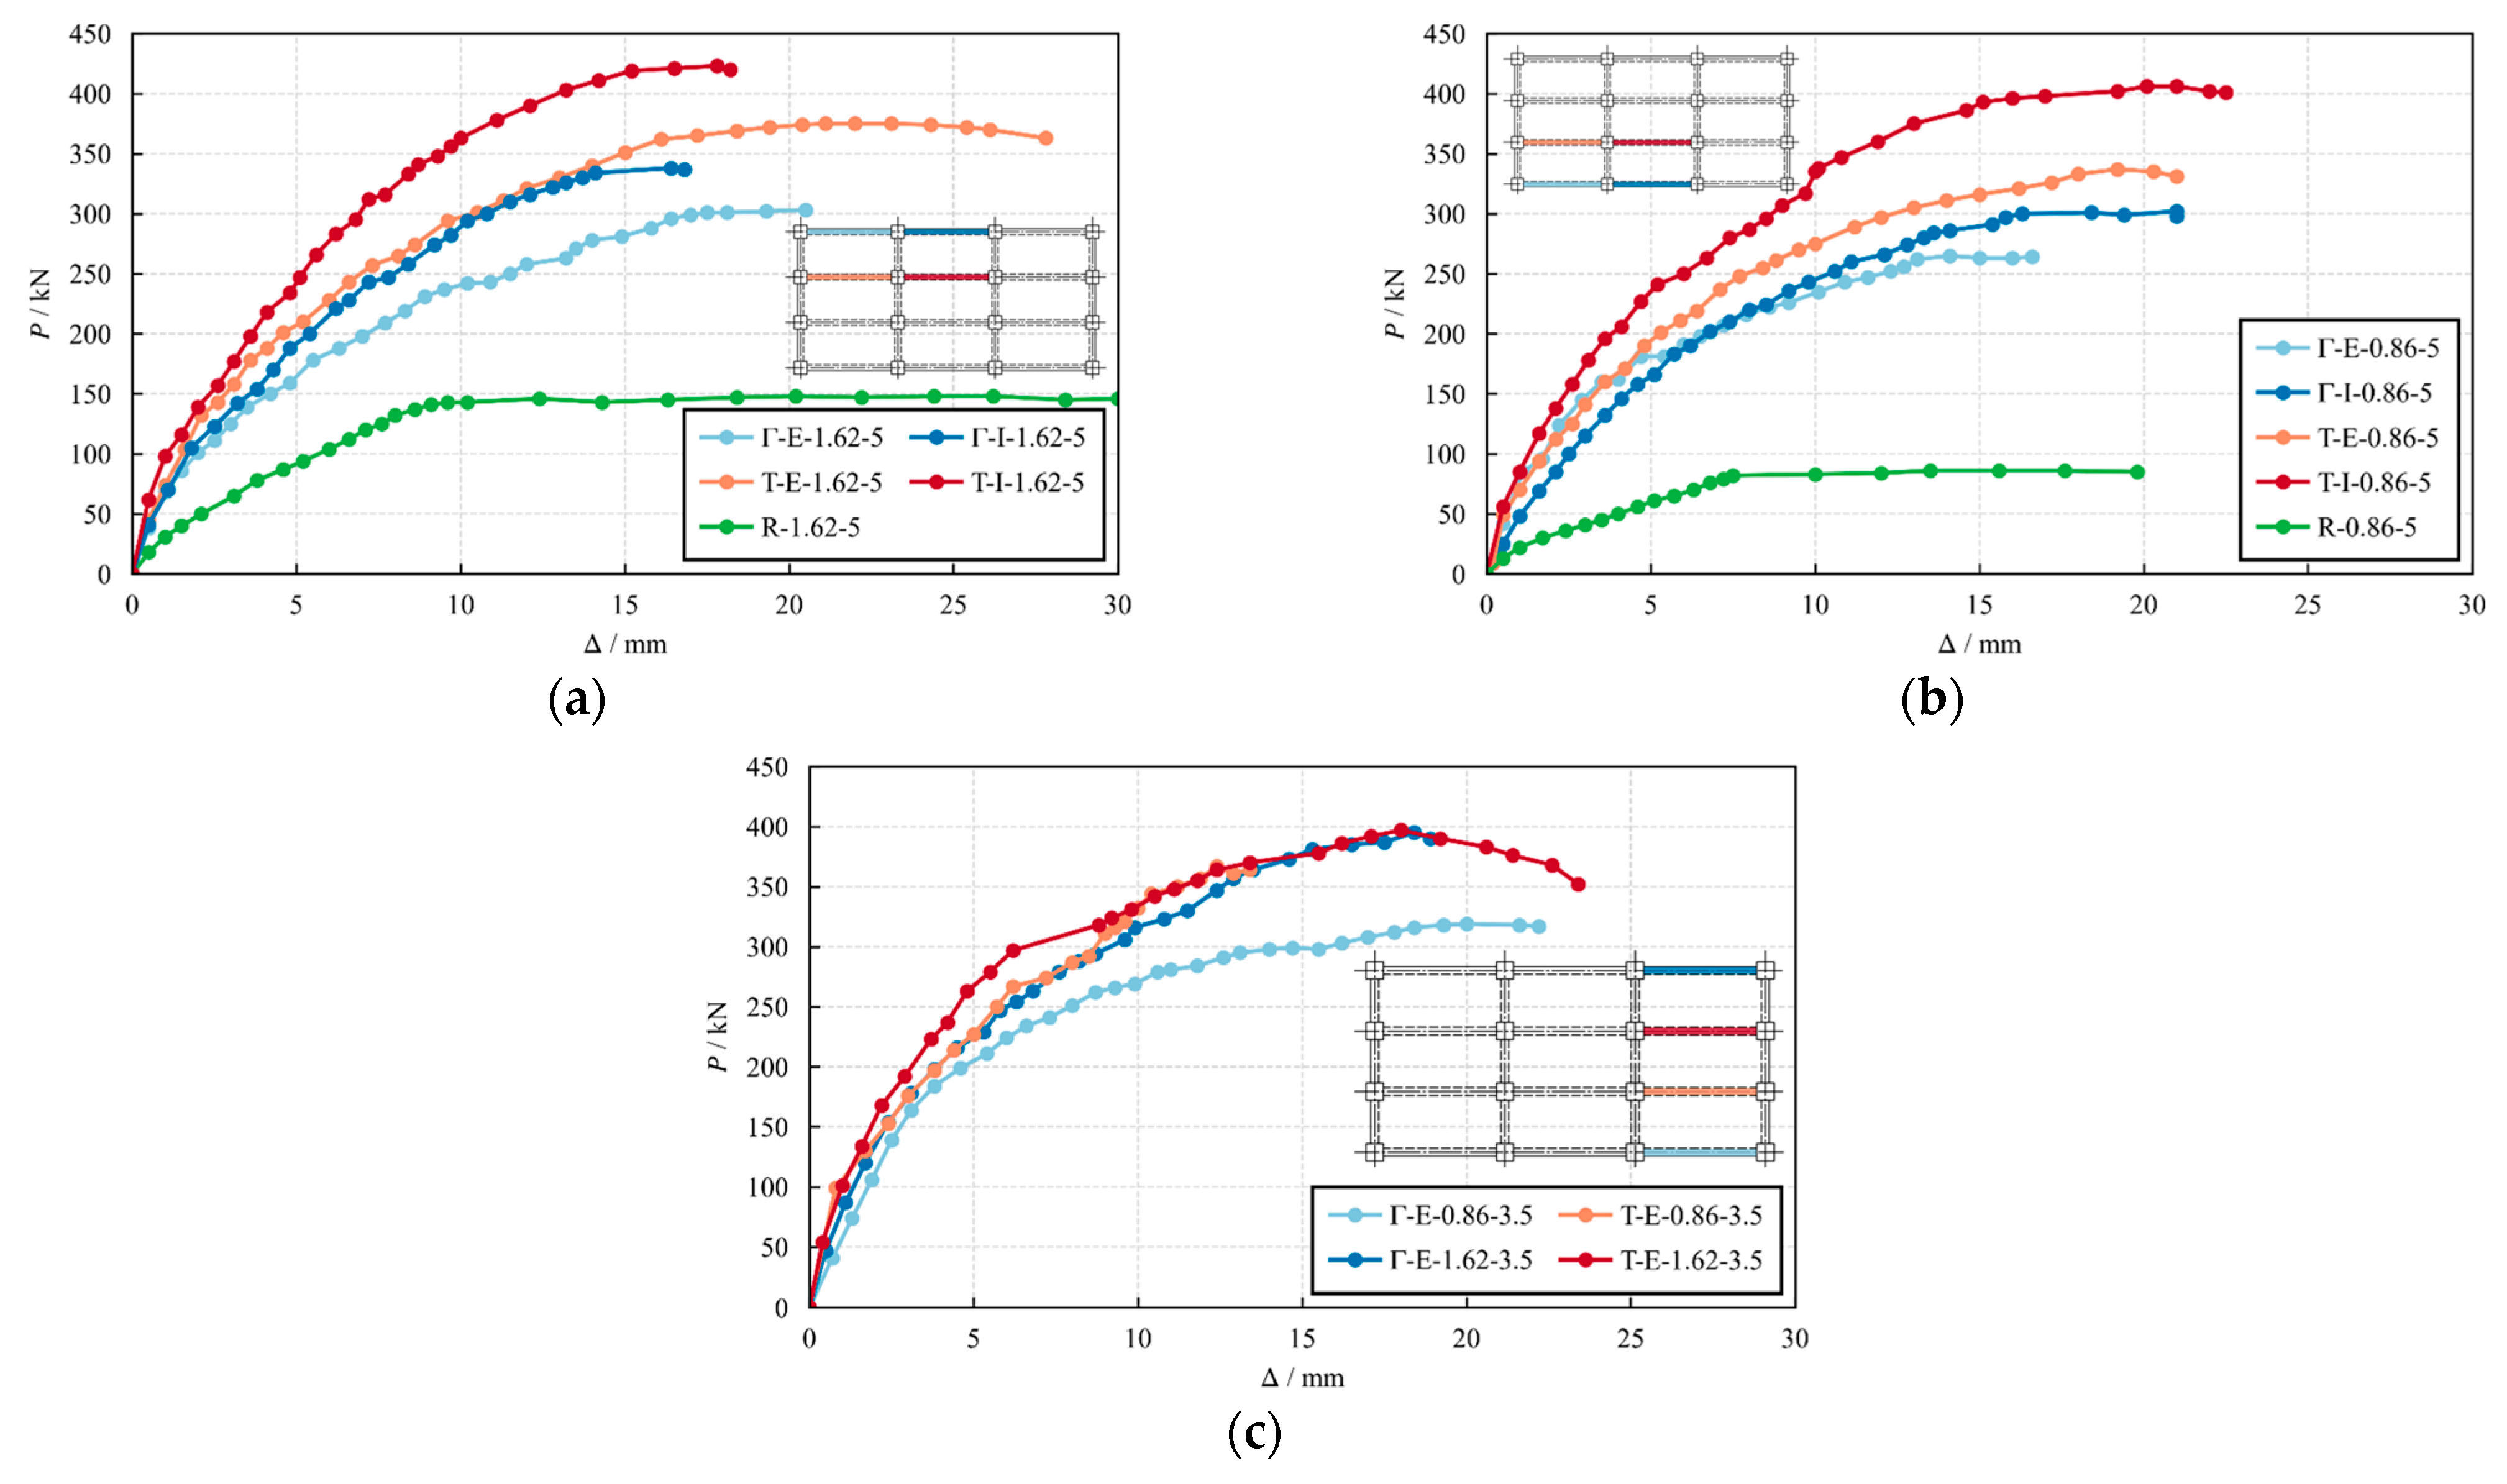
The load–deflection (P-Δ) curves of the tested beams are shown in Figure 10. The unrestrained beams exhibited a distinct yield plateau after yielding of the longitudinal rebars, followed by strength softening caused by concrete crushing. In contrast, the restrained beams in the frame system showed a continuous load-hardening response. This behavior was attributed to the increasing axial compression induced by spatial restraint, which enhanced the load-carrying capacity until concrete crushing occurred.
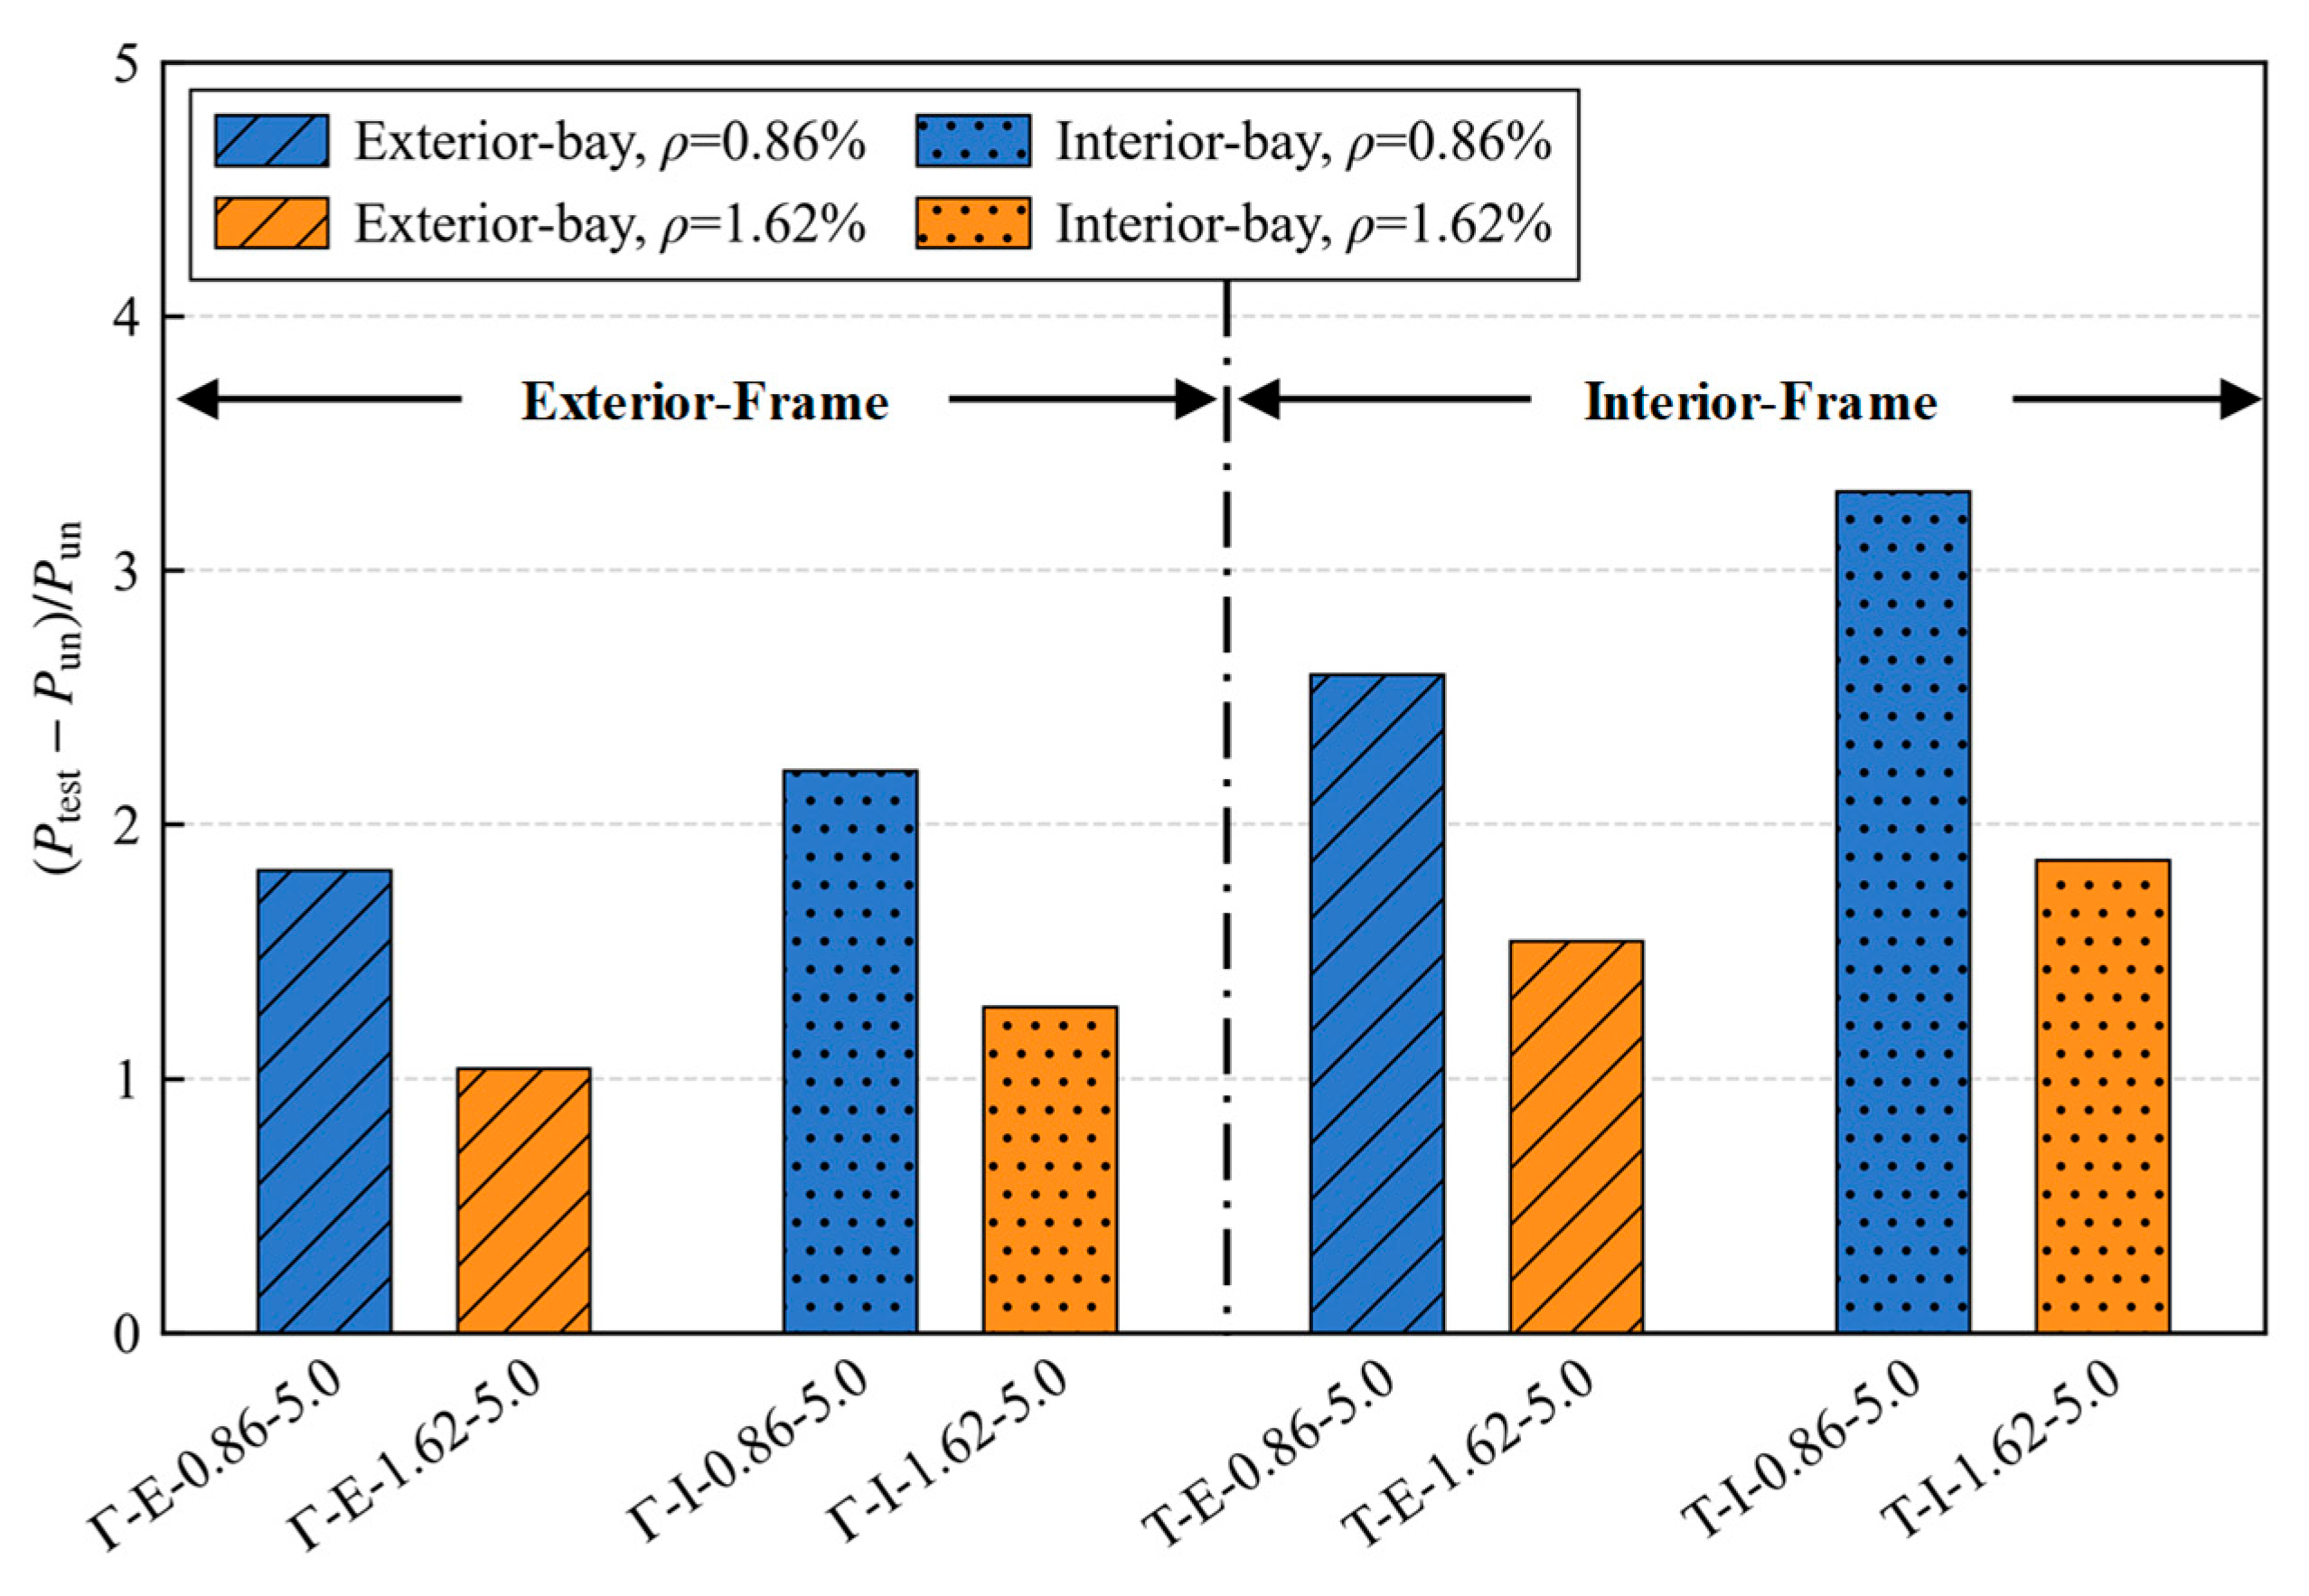
Table 5 compares the load capacities of the restrained frame beams and the unrestrained comparison beams, where Ptest and Pun denote the capacities of the restrained and unrestrained beams, respectively. Figure 11 presents the distribution of the overall capacity enhancement ratio, (PtestPun)/Pun, to examine the effects of spatial location and longitudinal rebar ratio on capacity enhancement. This enhancement of the restrained beams was attributed to the combined effects of the tensile contribution of slab rebars and spatial restraint. The interior-frame beams exhibited greater enhancement than the exterior-frame beams, reflecting both the contribution of slab rebars on both sides and the higher level of spatial restraint associated with their locations closer to the central region of the frame. In addition, beams with lower longitudinal rebar ratios showed more pronounced enhancement. This trend is associated with the smaller load capacity of the unrestrained beams and, thus, the larger relative contribution of spatial restraint and slab rebars.
To isolate the contribution of spatial restraint to capacity enhancement, a theoretical load capacity, P0, was introduced to represent the beam capacity considering slab action but excluding axial restraint. P0 was calculated by
P 0 = 2 M e 0 + M m 0 a
where Me0 is the flexural strength of the beam-end section obtained from sectional analysis using the measured material strengths and the tensile strains of slab rebars recorded in the tests; Mm0 is the flexural strength of the mid-span section without axial compression, which equaled zero because the bottom rebars were curtailed at mid-span. The tensile contribution of slab rebars was accounted for in P0, while the additional contribution from restraint-induced axial compression was separated.
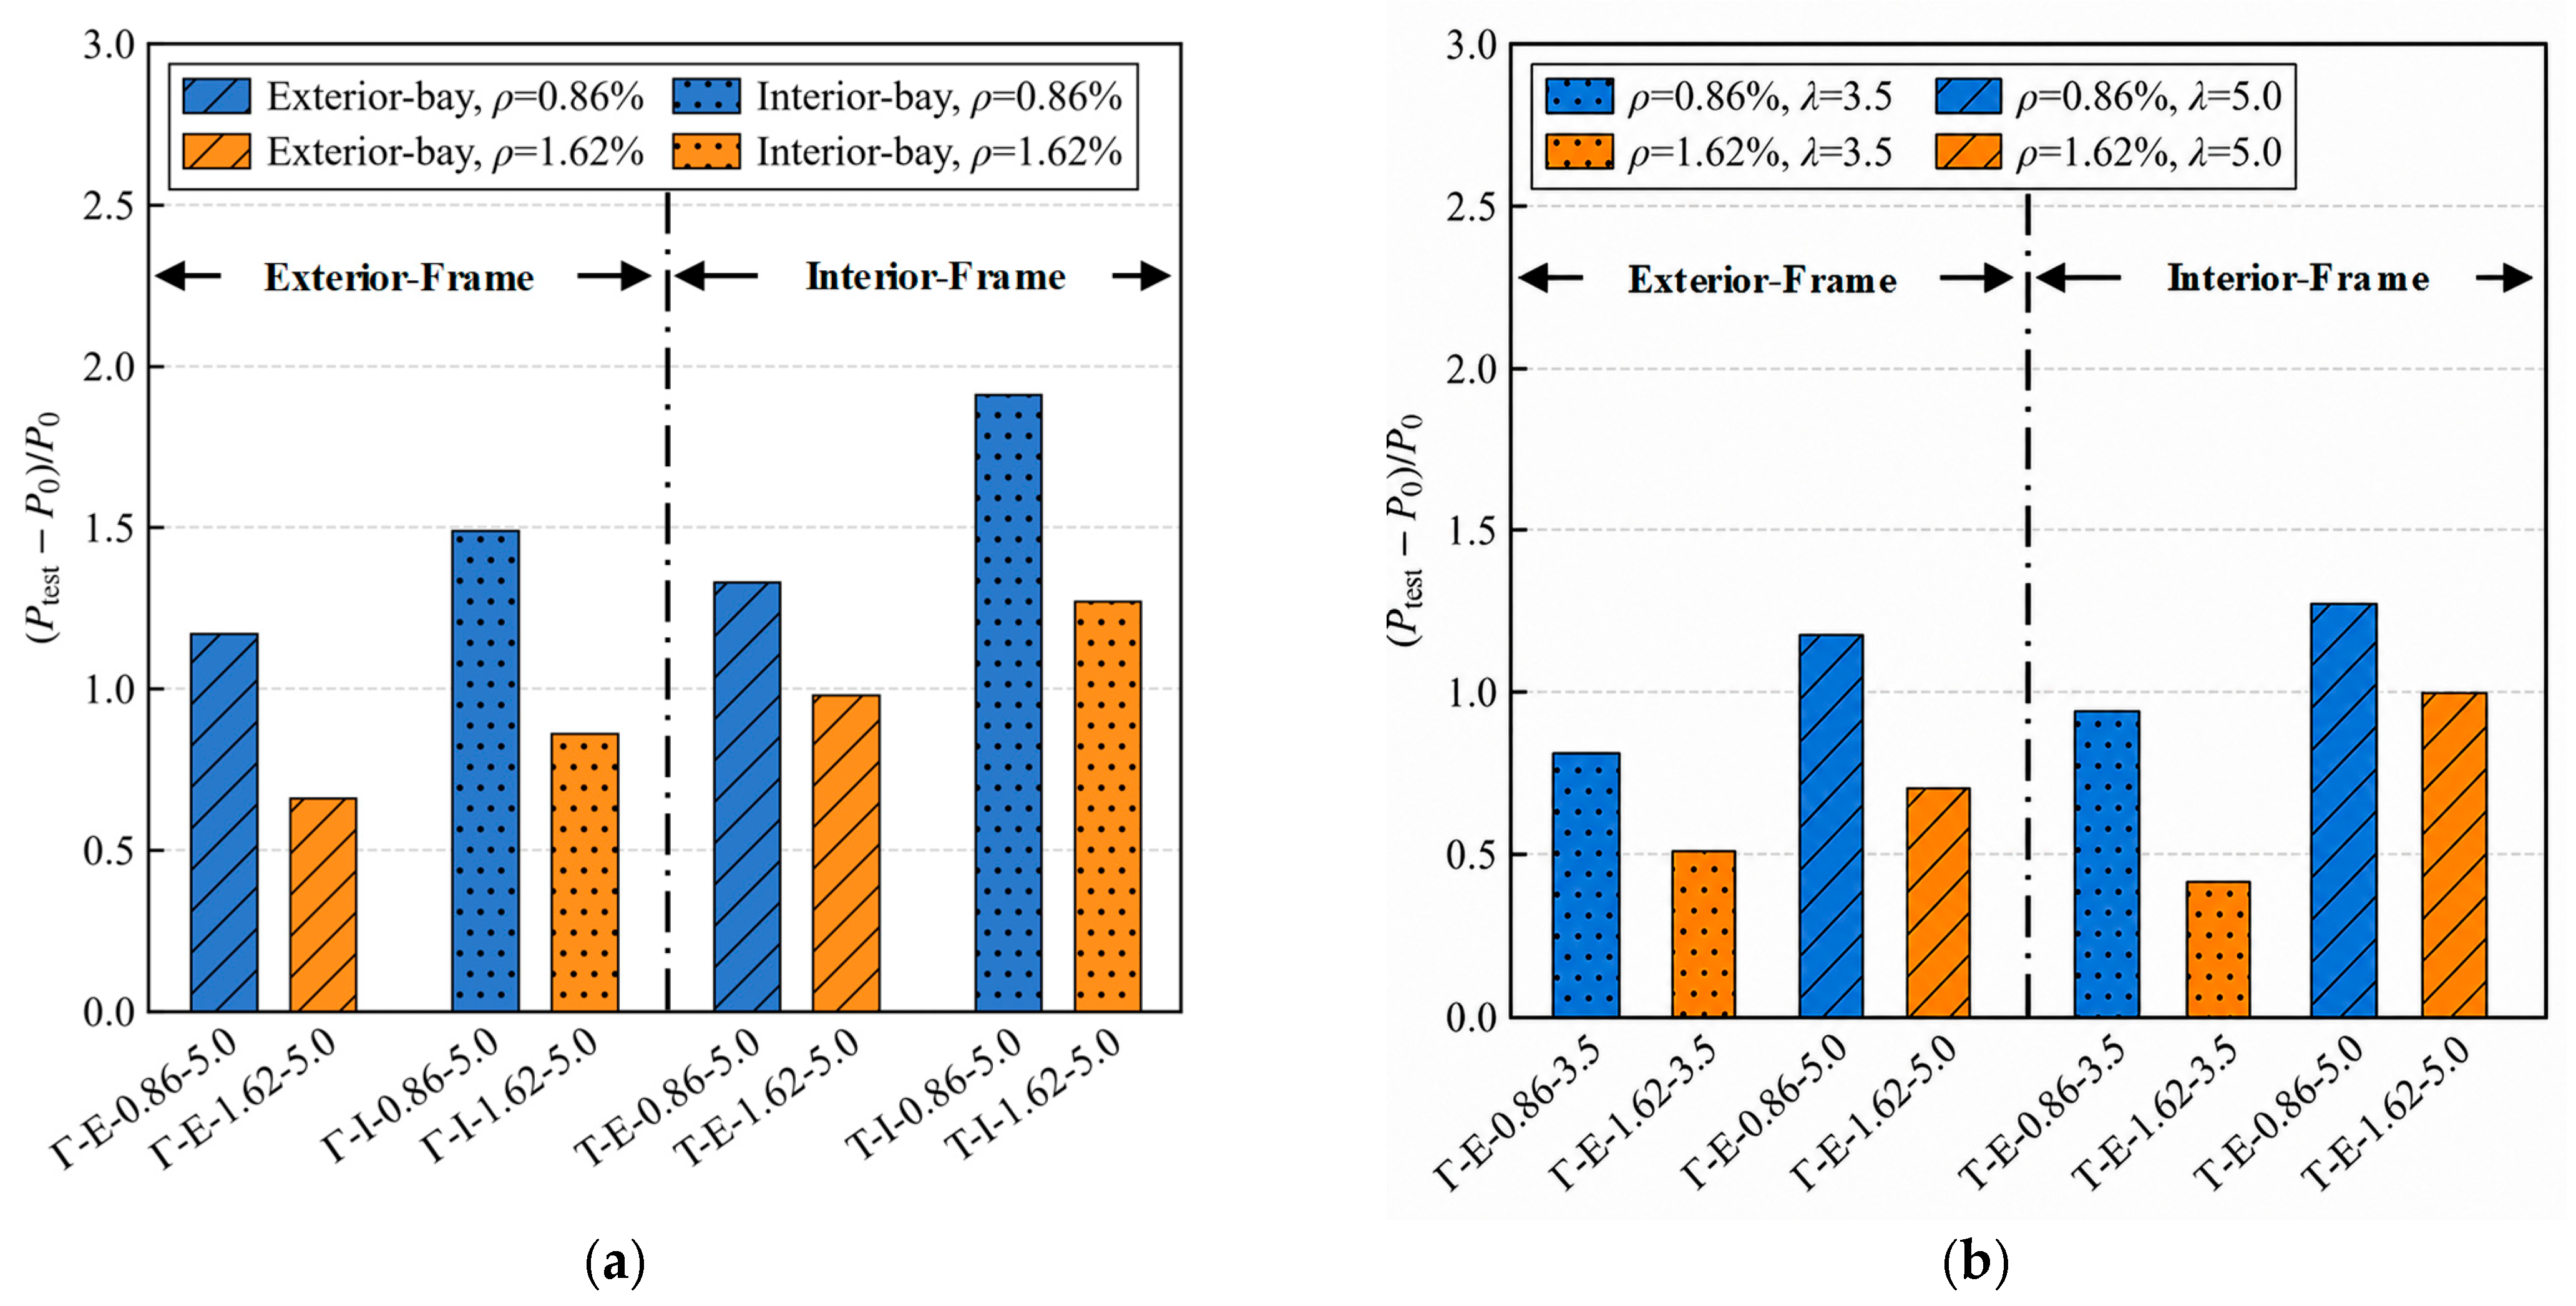
Table 6 compares the test capacity of the restrained frame beams Ptest with the theoretical capacity P0. Figure 12 presents the distribution of the restraint-induced capacity enhancement ratio, defined as (PtestP0)/P0. Figure 12a examines the effects of spatial location and longitudinal rebar ratio, whereas Figure 12b further evaluates the effect of shear span ratio. The interior-frame beams and interior-bay beams exhibited greater restraint-induced enhancement than the exterior-frame beams and exterior-bay beams, respectively. This trend indicates that the capacity increase became more pronounced as the spatial restraint level increased. The longitudinal rebar ratio had a pronounced influence, with beams having a lower ρ showing larger enhancement. In addition, restraint-induced enhancement increased with shear span ratio, which can be attributed to the greater elongation demand and, hence, higher restraint-induced axial compression in beams with a larger λ. Compared with spatial location and shear span ratio, the longitudinal rebar ratio had a stronger influence on restraint-induced enhancement, with the enhancement ratio ranging from 0.41 to 1.27 for beams with ρ = 1.62% and from 0.81 to 1.91 for beams with ρ = 0.86%.

3.4. Axial Elongation

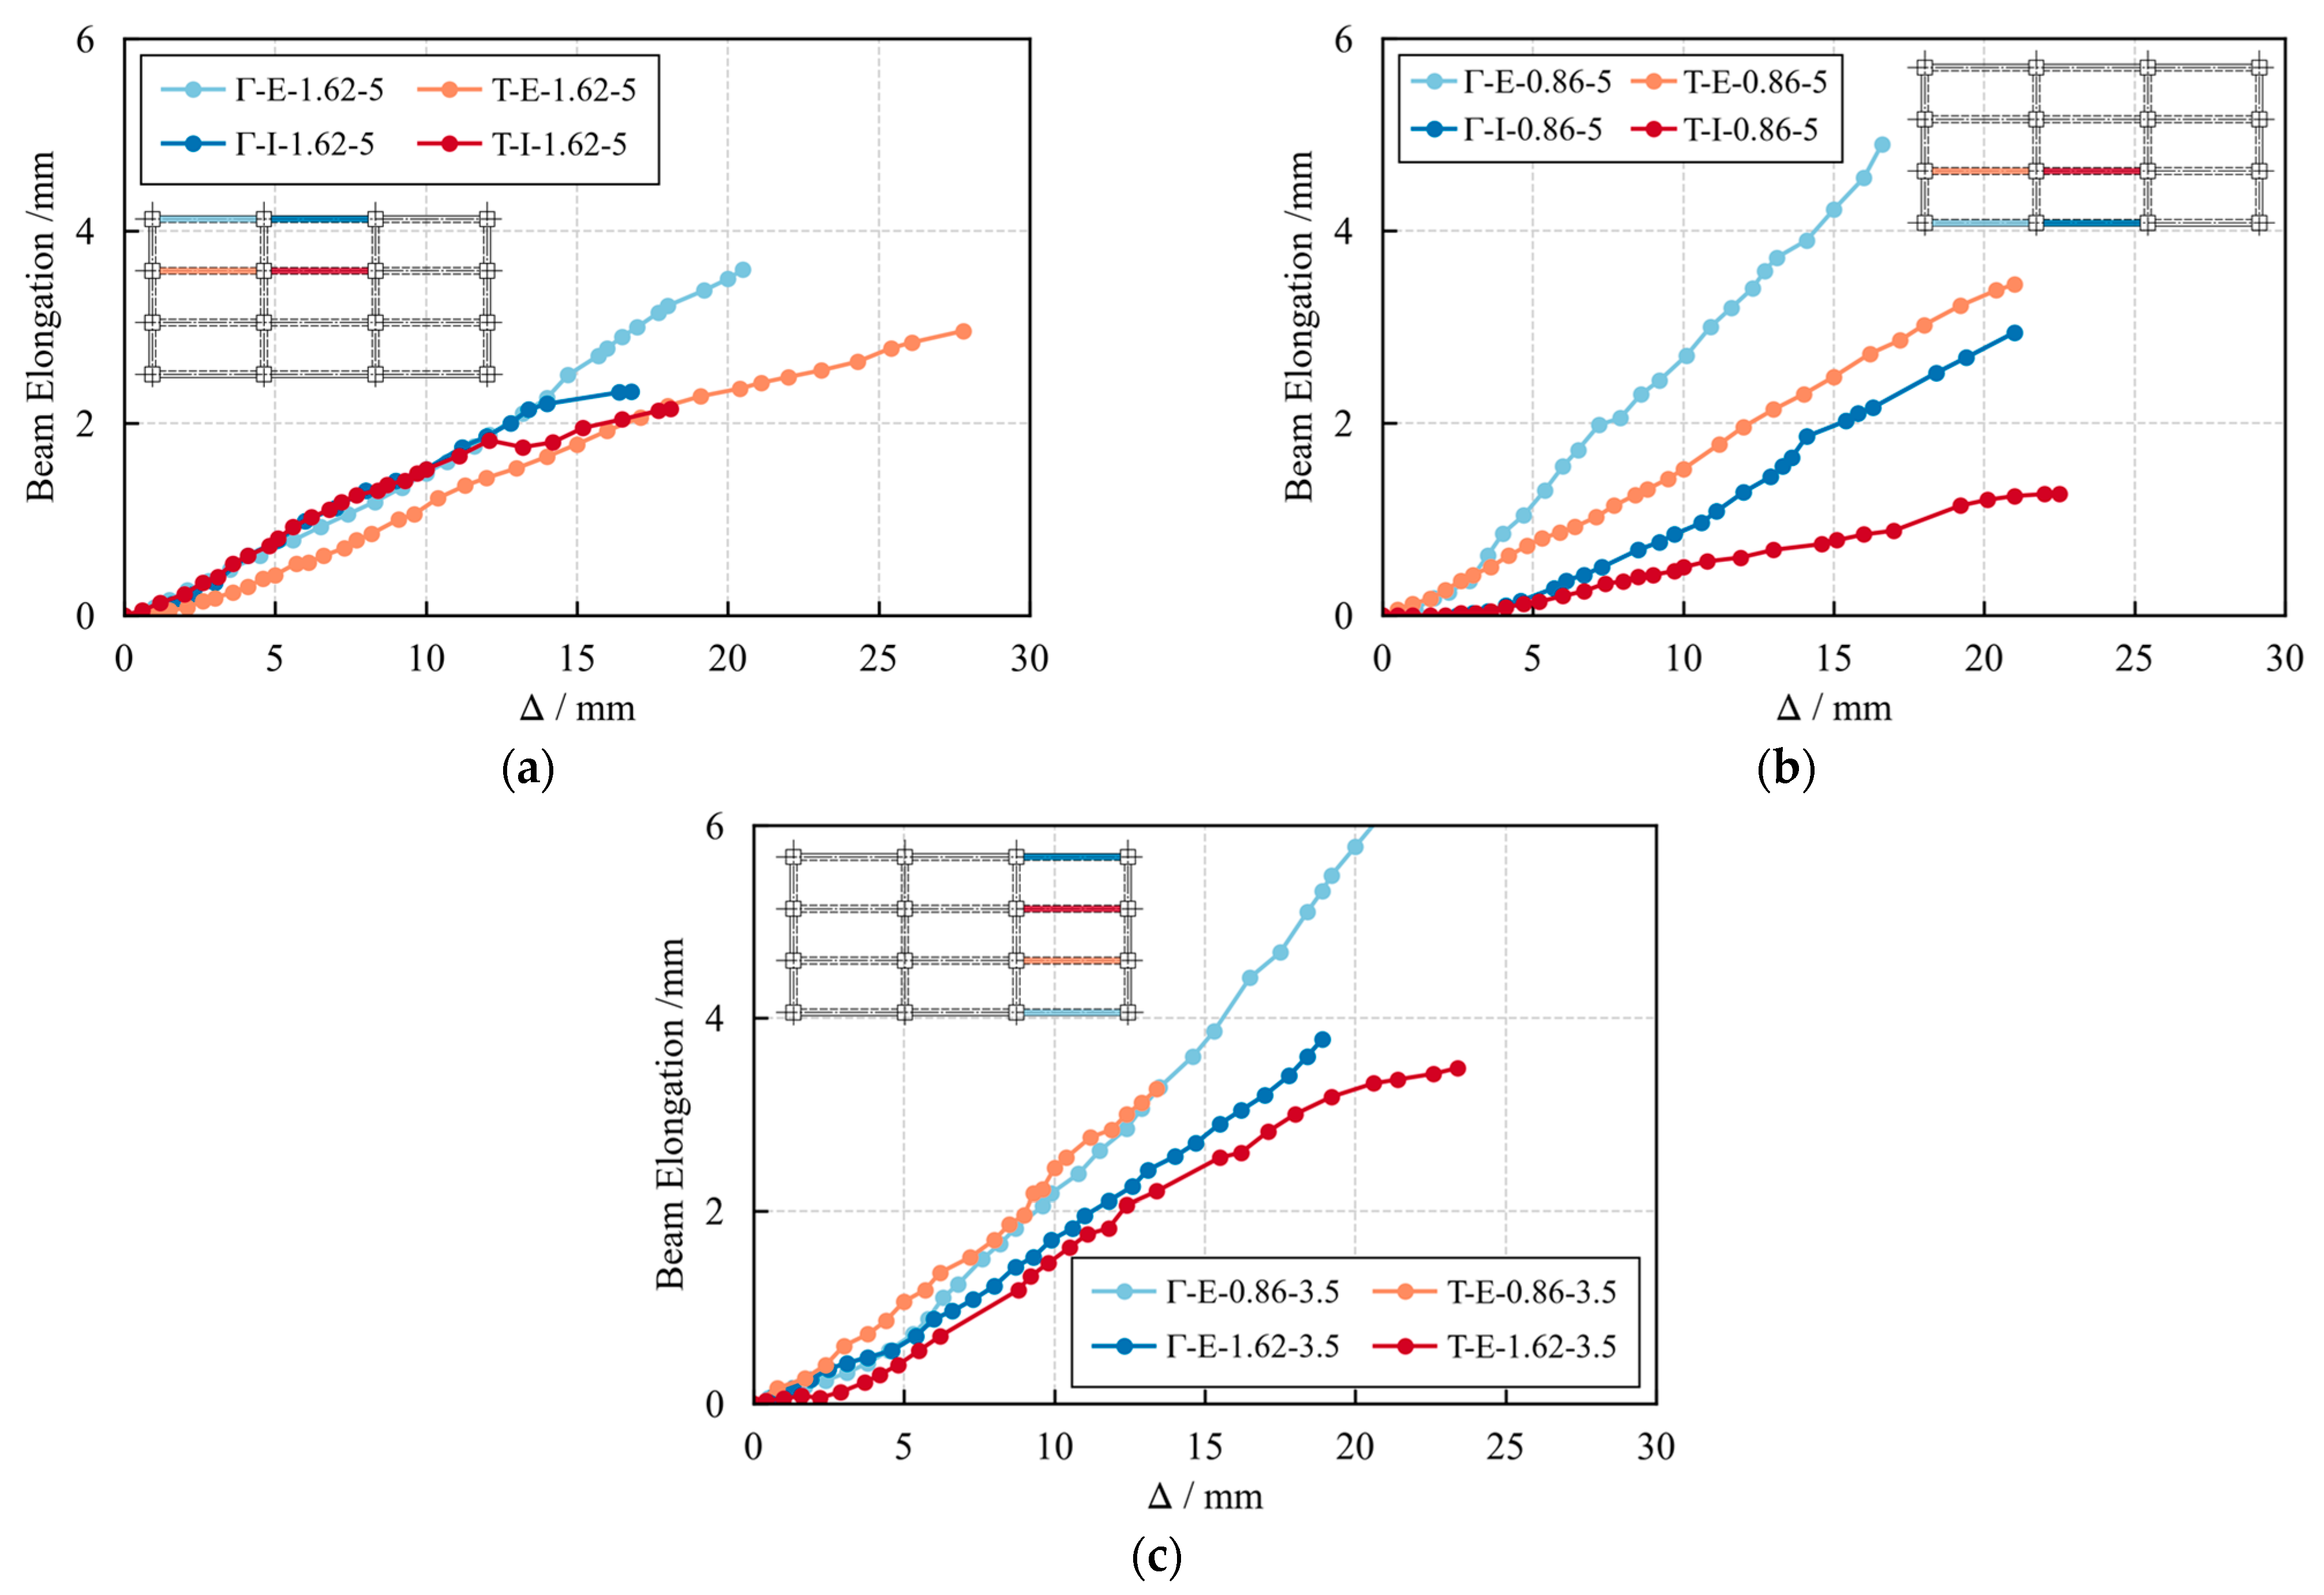
Beam elongation was obtained from the horizontal displacements measured at the beam ends using LVDTs. Figure 13 presents the elongation response with respect to beam deflection, showing that elongation increased approximately linearly with deflection. Moreover, elongation was negatively correlated with the level of spatial restraint, with beams located closer to the central region of the frame exhibiting smaller elongation. Specifically, exterior-frame beams developed larger elongation than interior-frame beams, and exterior-bay beams generally showed larger elongation than interior-bay beams. This trend indicates that stronger spatial restraint suppressed axial elongation by limiting crack opening and generating higher restraint-induced axial compression in the beams.

3.5. Strain of Rebars

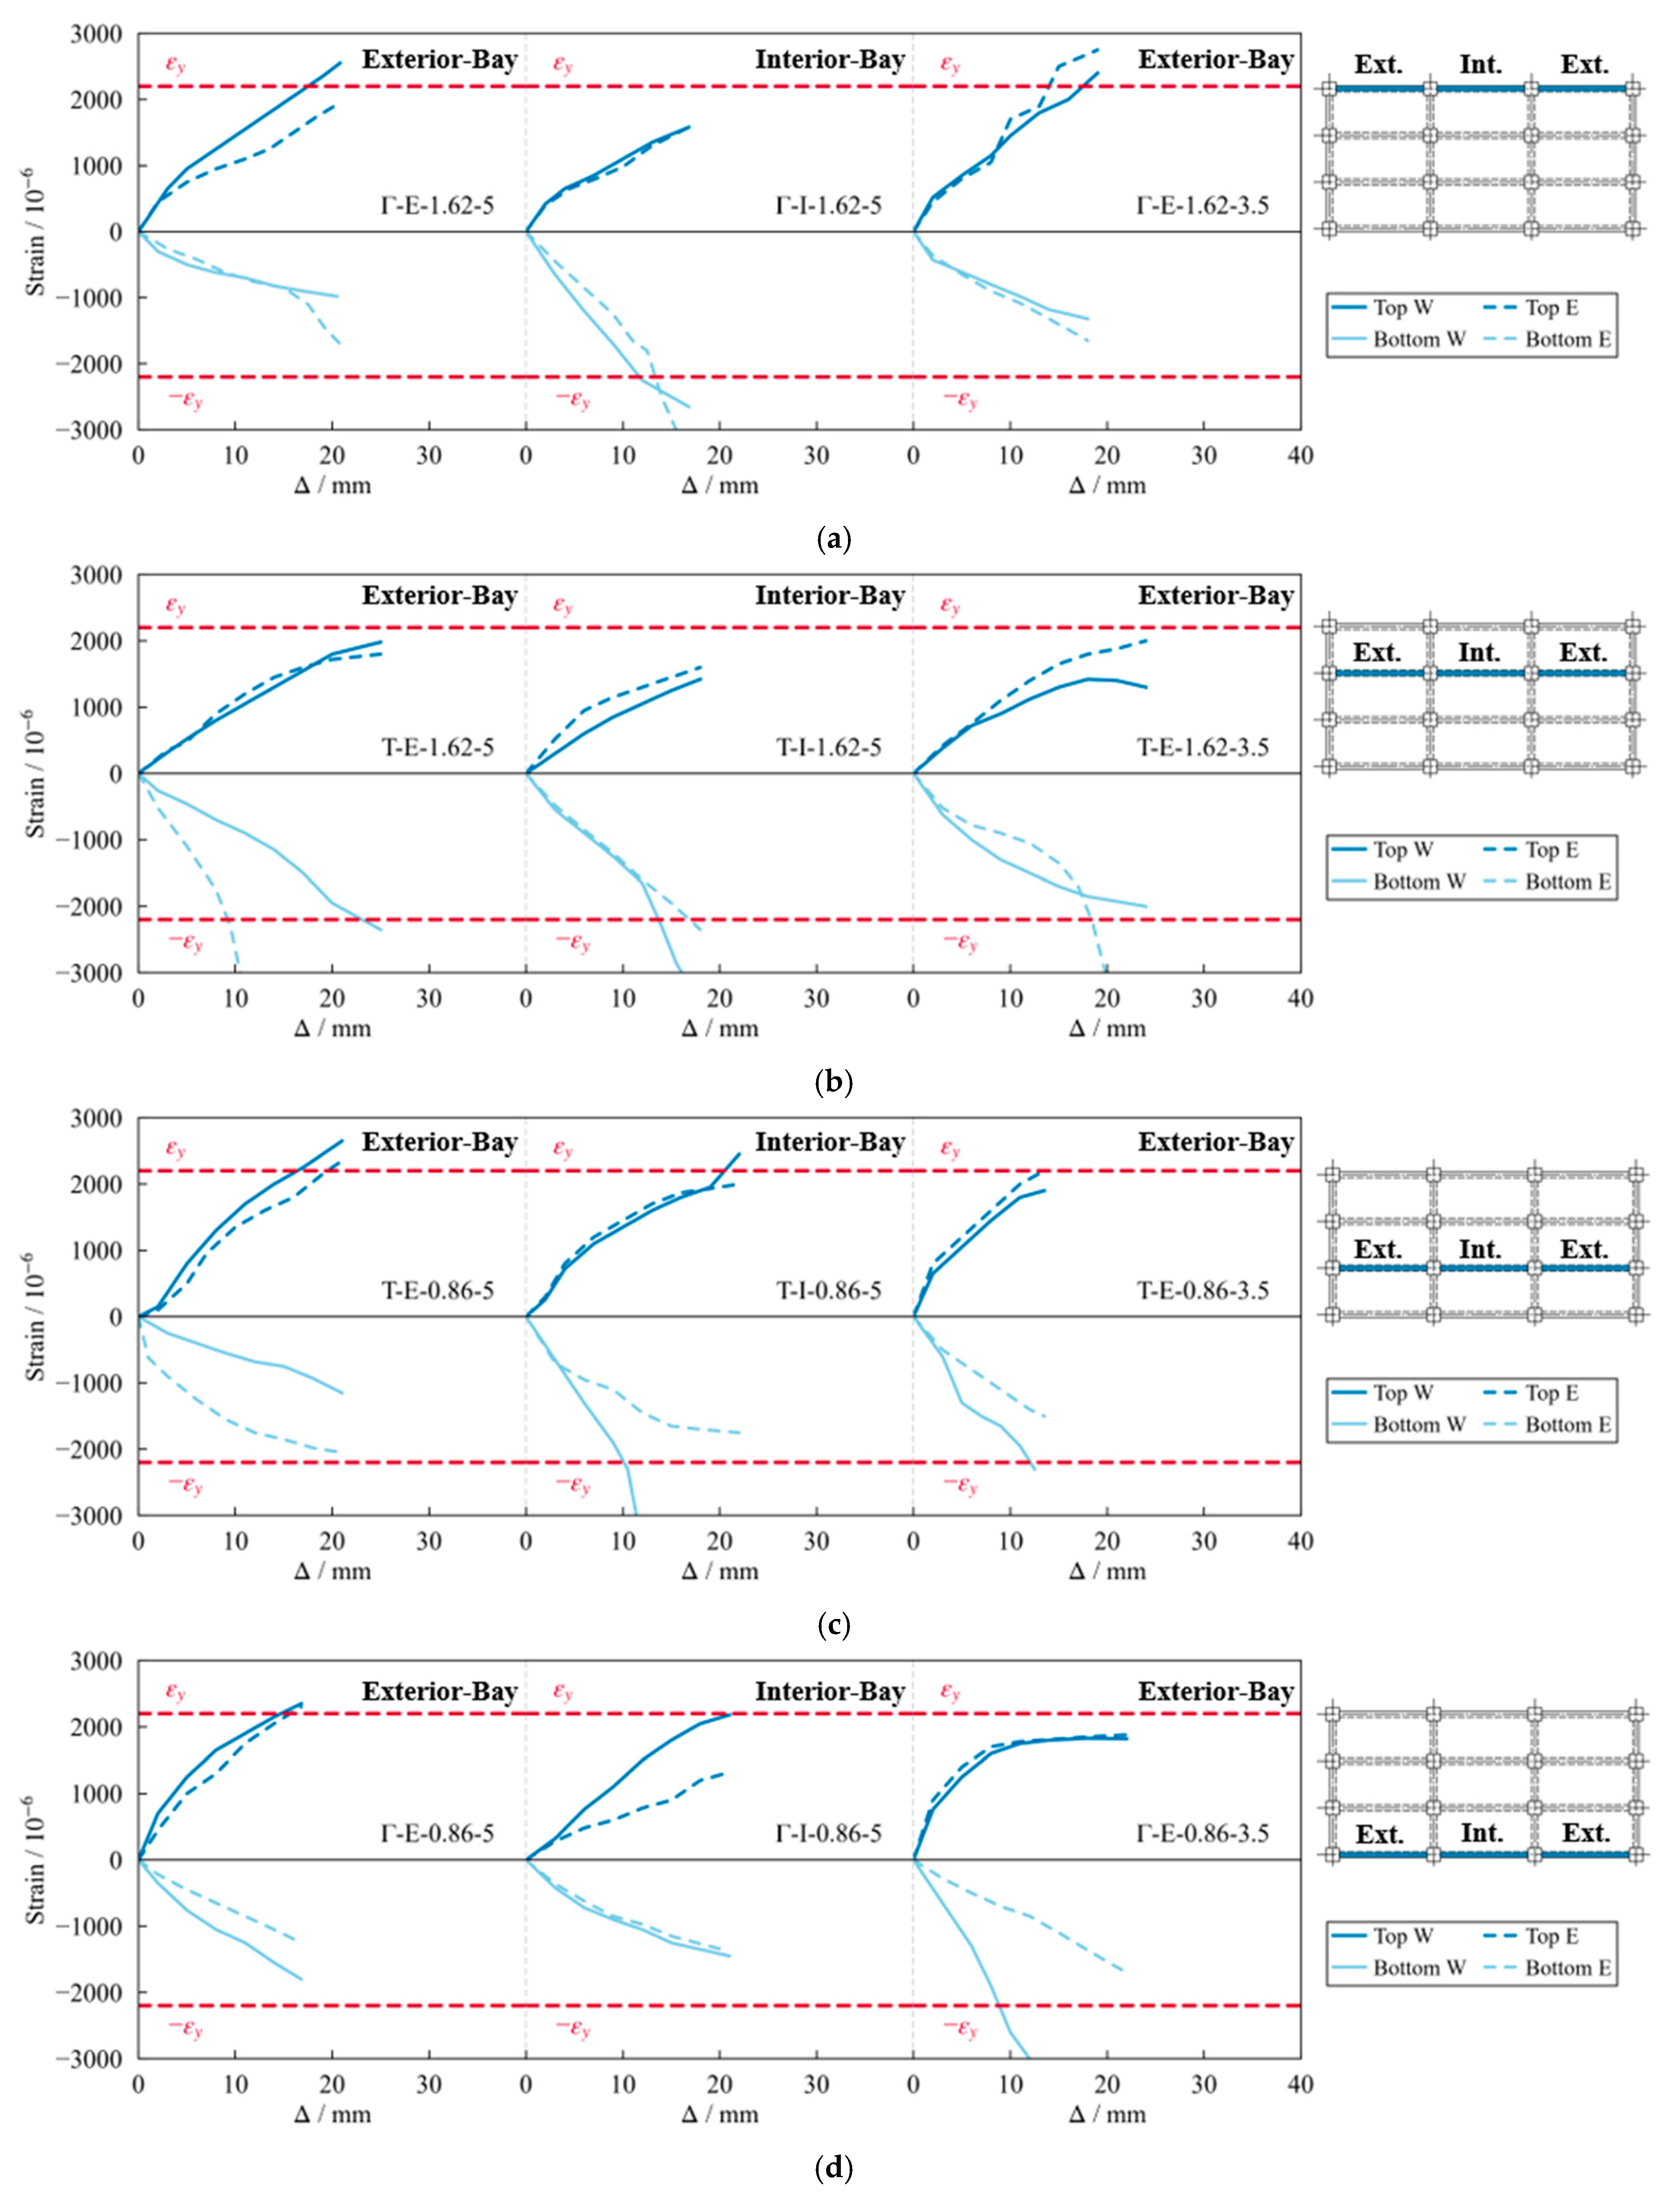
Figure 14 presents the measured strains of the top and bottom longitudinal rebars at the western and eastern beam ends with respect to beam deflection Δ. Both the strains of the top and bottom longitudinal rebars (εt and εb) increased in magnitude with increasing Δ. After concrete crushing occurred, εt tended to stabilize, whereas εb increased more rapidly in compression. Generally, the interior-frame beams exhibited smaller tensile strains in the top rebars and larger compressive strains in the bottom rebars. Accordingly, fewer interior-frame beams experienced tensile yielding of the top rebars, while more specimens reached compressive yielding of the bottom rebars. This behavior was mainly attributed to the tensile contribution of slab rebars on both sides of the beam, which reduced the tensile demand in the top rebars and increased the compressive demand in the bottom rebars. In addition, the interior-bay beams exhibited smaller εt values than the exterior-bay beams, owing to the higher spatial restraint level, which limited the development of tensile strain in the top rebars and, in some cases, prevented tensile yielding.
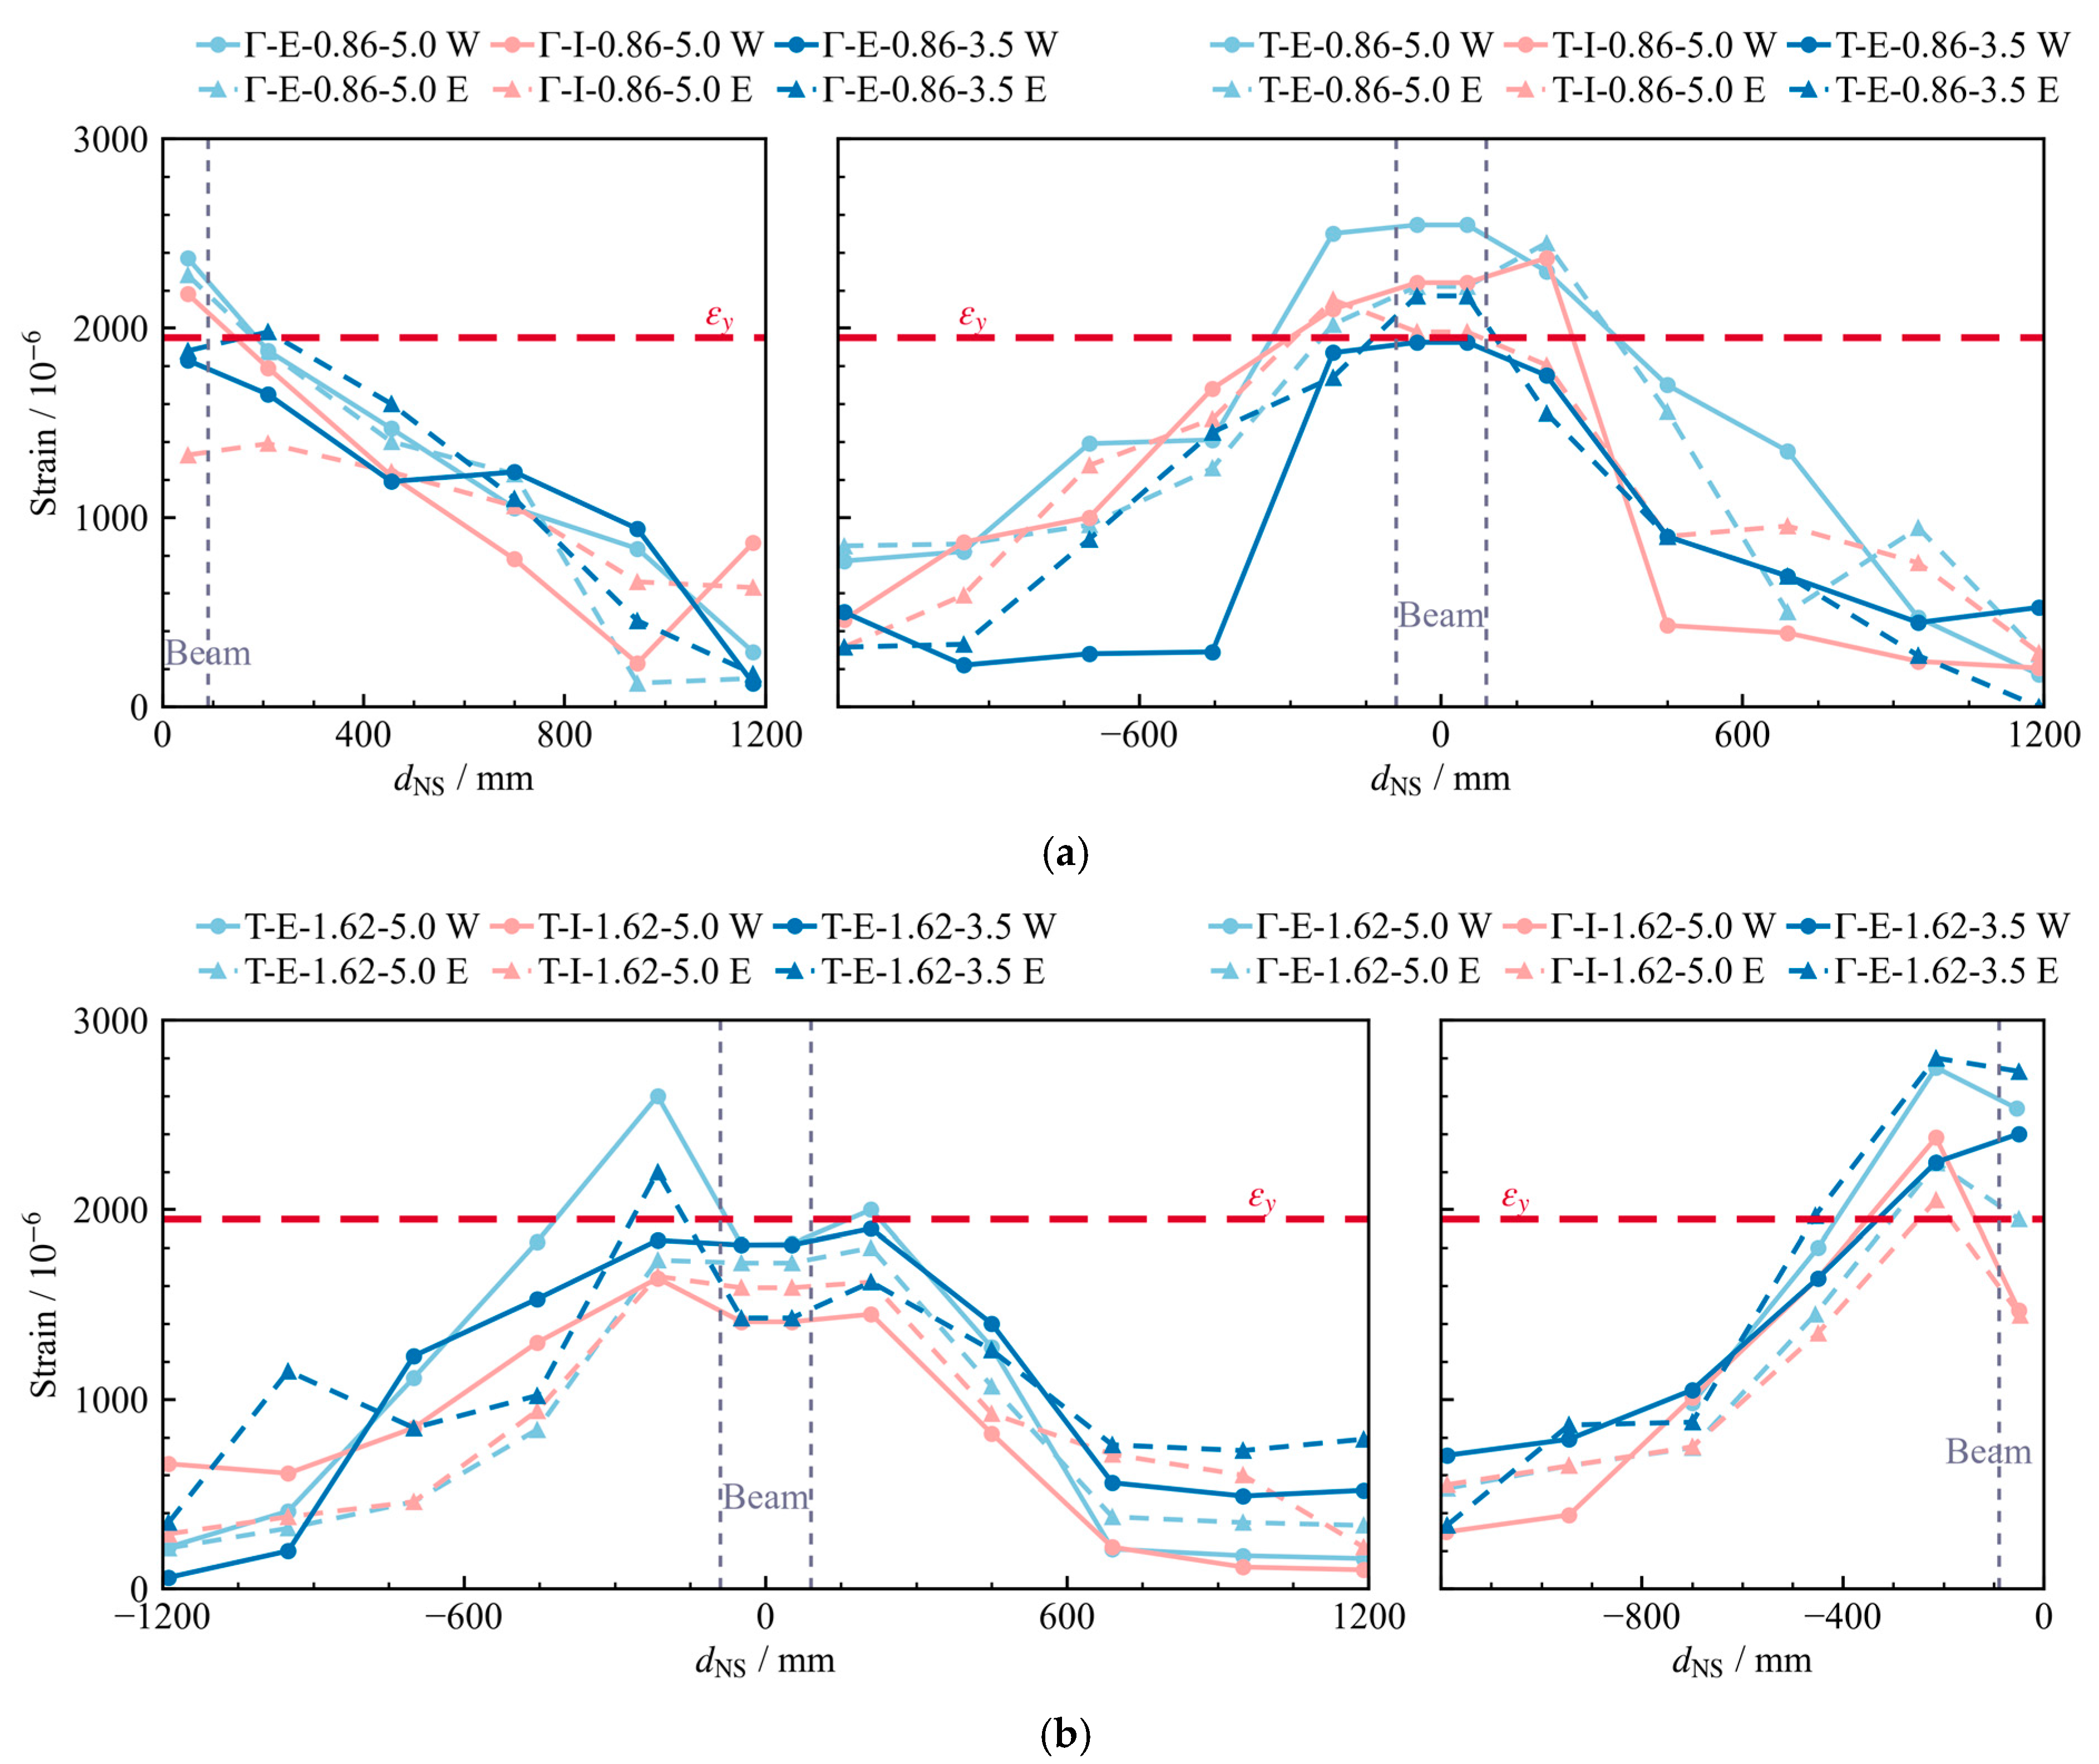
Figure 15 presents the measured strain distribution of the slab rebars at peak load. dNS is the NS-direction distance of the slab rebars from the beam centerline. The tensile strain of the slab rebars decreased with increasing distance from the loaded beam, and yielding was observed only in the rebars closest to the loaded beam.
Based on the measured slab-rebar strains, the corresponding tensile stresses were calculated and used to determine the effective overhanging flange width, as summarized in Table 7. The average effective overhanging flange width was normalized by the slab thickness ts. Beams located in exterior frames and exterior bays generally exhibited larger flange widths. This trend was attributed to the different levels of spatial restraint. Higher spatial restraint induced larger beam axial compression, which limited the development of tensile strain in the slab rebars and thereby reduced the slab contribution to beam-end flexural strength. Nevertheless, the measured effective flange widths were still significantly larger than the design-code value of 6ts, indicating that the slab contribution to beam flexural strength is underestimated in design. This underestimation may lead to excessive beam longitudinal rebars for the required flexural strength, thereby increasing the risk of suppressing tensile rebar yielding and compromising the intended ductile failure at beam-end regions.

4. Flexural Strength of Beam-End Section

Static loading tests on the restrained frame beams can reflect the spatial restraint provided by the adjacent columns and slabs, but the restraint-induced beam axial compression and beam-end moments cannot be directly measured. Therefore, a theoretical analysis was conducted to quantify the beam axial compression and the flexural overstrength of the beam-end sections.
Assuming that the beam-end section and the mid-span section reach their ultimate flexural strengths simultaneously, the relationship between the load capacity (P) and the equivalent axial compression (N) can be expressed as:
P N = 2 M e N + M m N a
where Me(N) and Mm(N) are the flexural strengths of the beam-end and mid-span sections under axial compression, respectively. These values were obtained through sectional analysis considering axial–flexural interaction, using the measured material strengths and the effective overhanging flange width reported in Table 7. Based on the measured load capacity Ptest, the restraint-induced beam axial compression Nt can be calculated using Equation (3). The corresponding flexural strength Me,Nt of the beam-end section and the flexural strength Mm,Nt at the mid-span section under axial compression can also be determined.
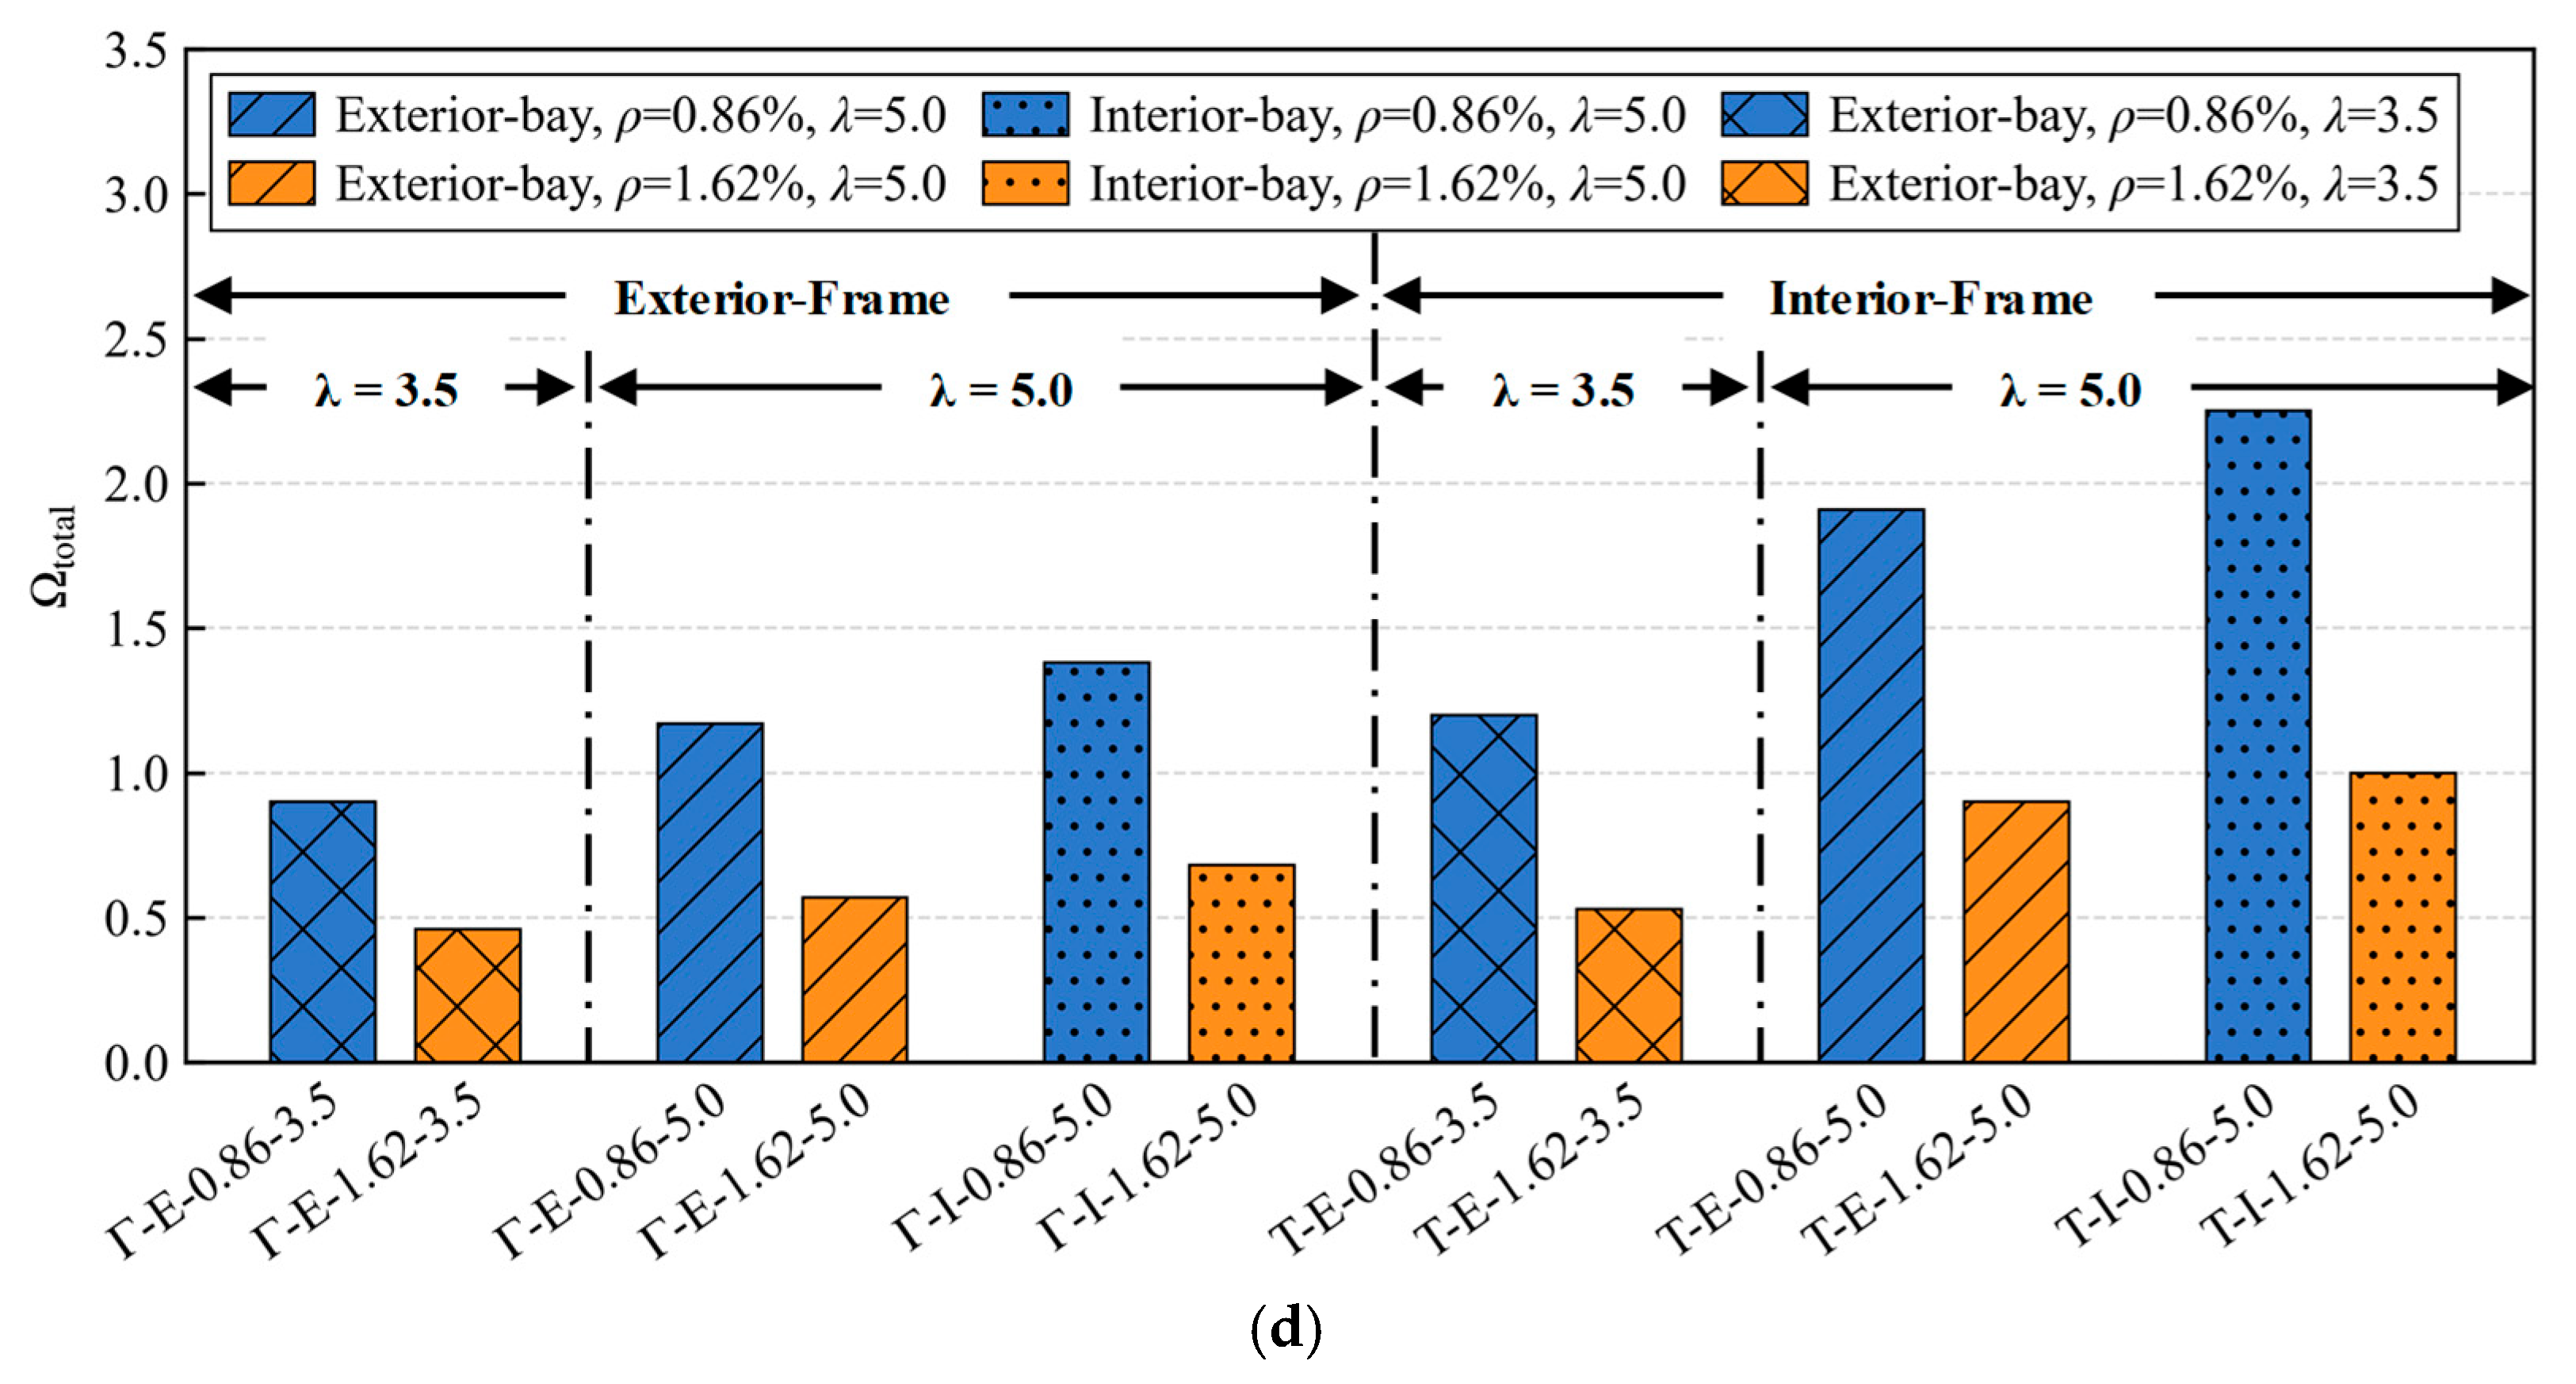
To evaluate the contributions of slab rebars and spatial restraint to the flexural strength of the beam-end sections, two reference strengths were introduced: the flexural strength without restraint-induced axial compression (Me0) and the flexural strength of the corresponding rectangular section without axial force ( M e , 0 rect ). The value of M e , 0 rect was used as the baseline strength, excluding both the slab and spatial-restraint contributions. These strengths were computed through sectional analysis using the measured material strengths. The strength enhancement ratios induced by spatial restraint and slab rebars, denoted by Ωrest and Ωslab, respectively, together with the total enhancement ratio Ωtotal, are calculated as:
Ω rest = M e , Nt M e , 0 M e , 0 rect
Ω slab = M e , 0 M e , 0 rect M e , 0 rect
Ω total = M e , Nt M e , 0 rect M e , 0 rect
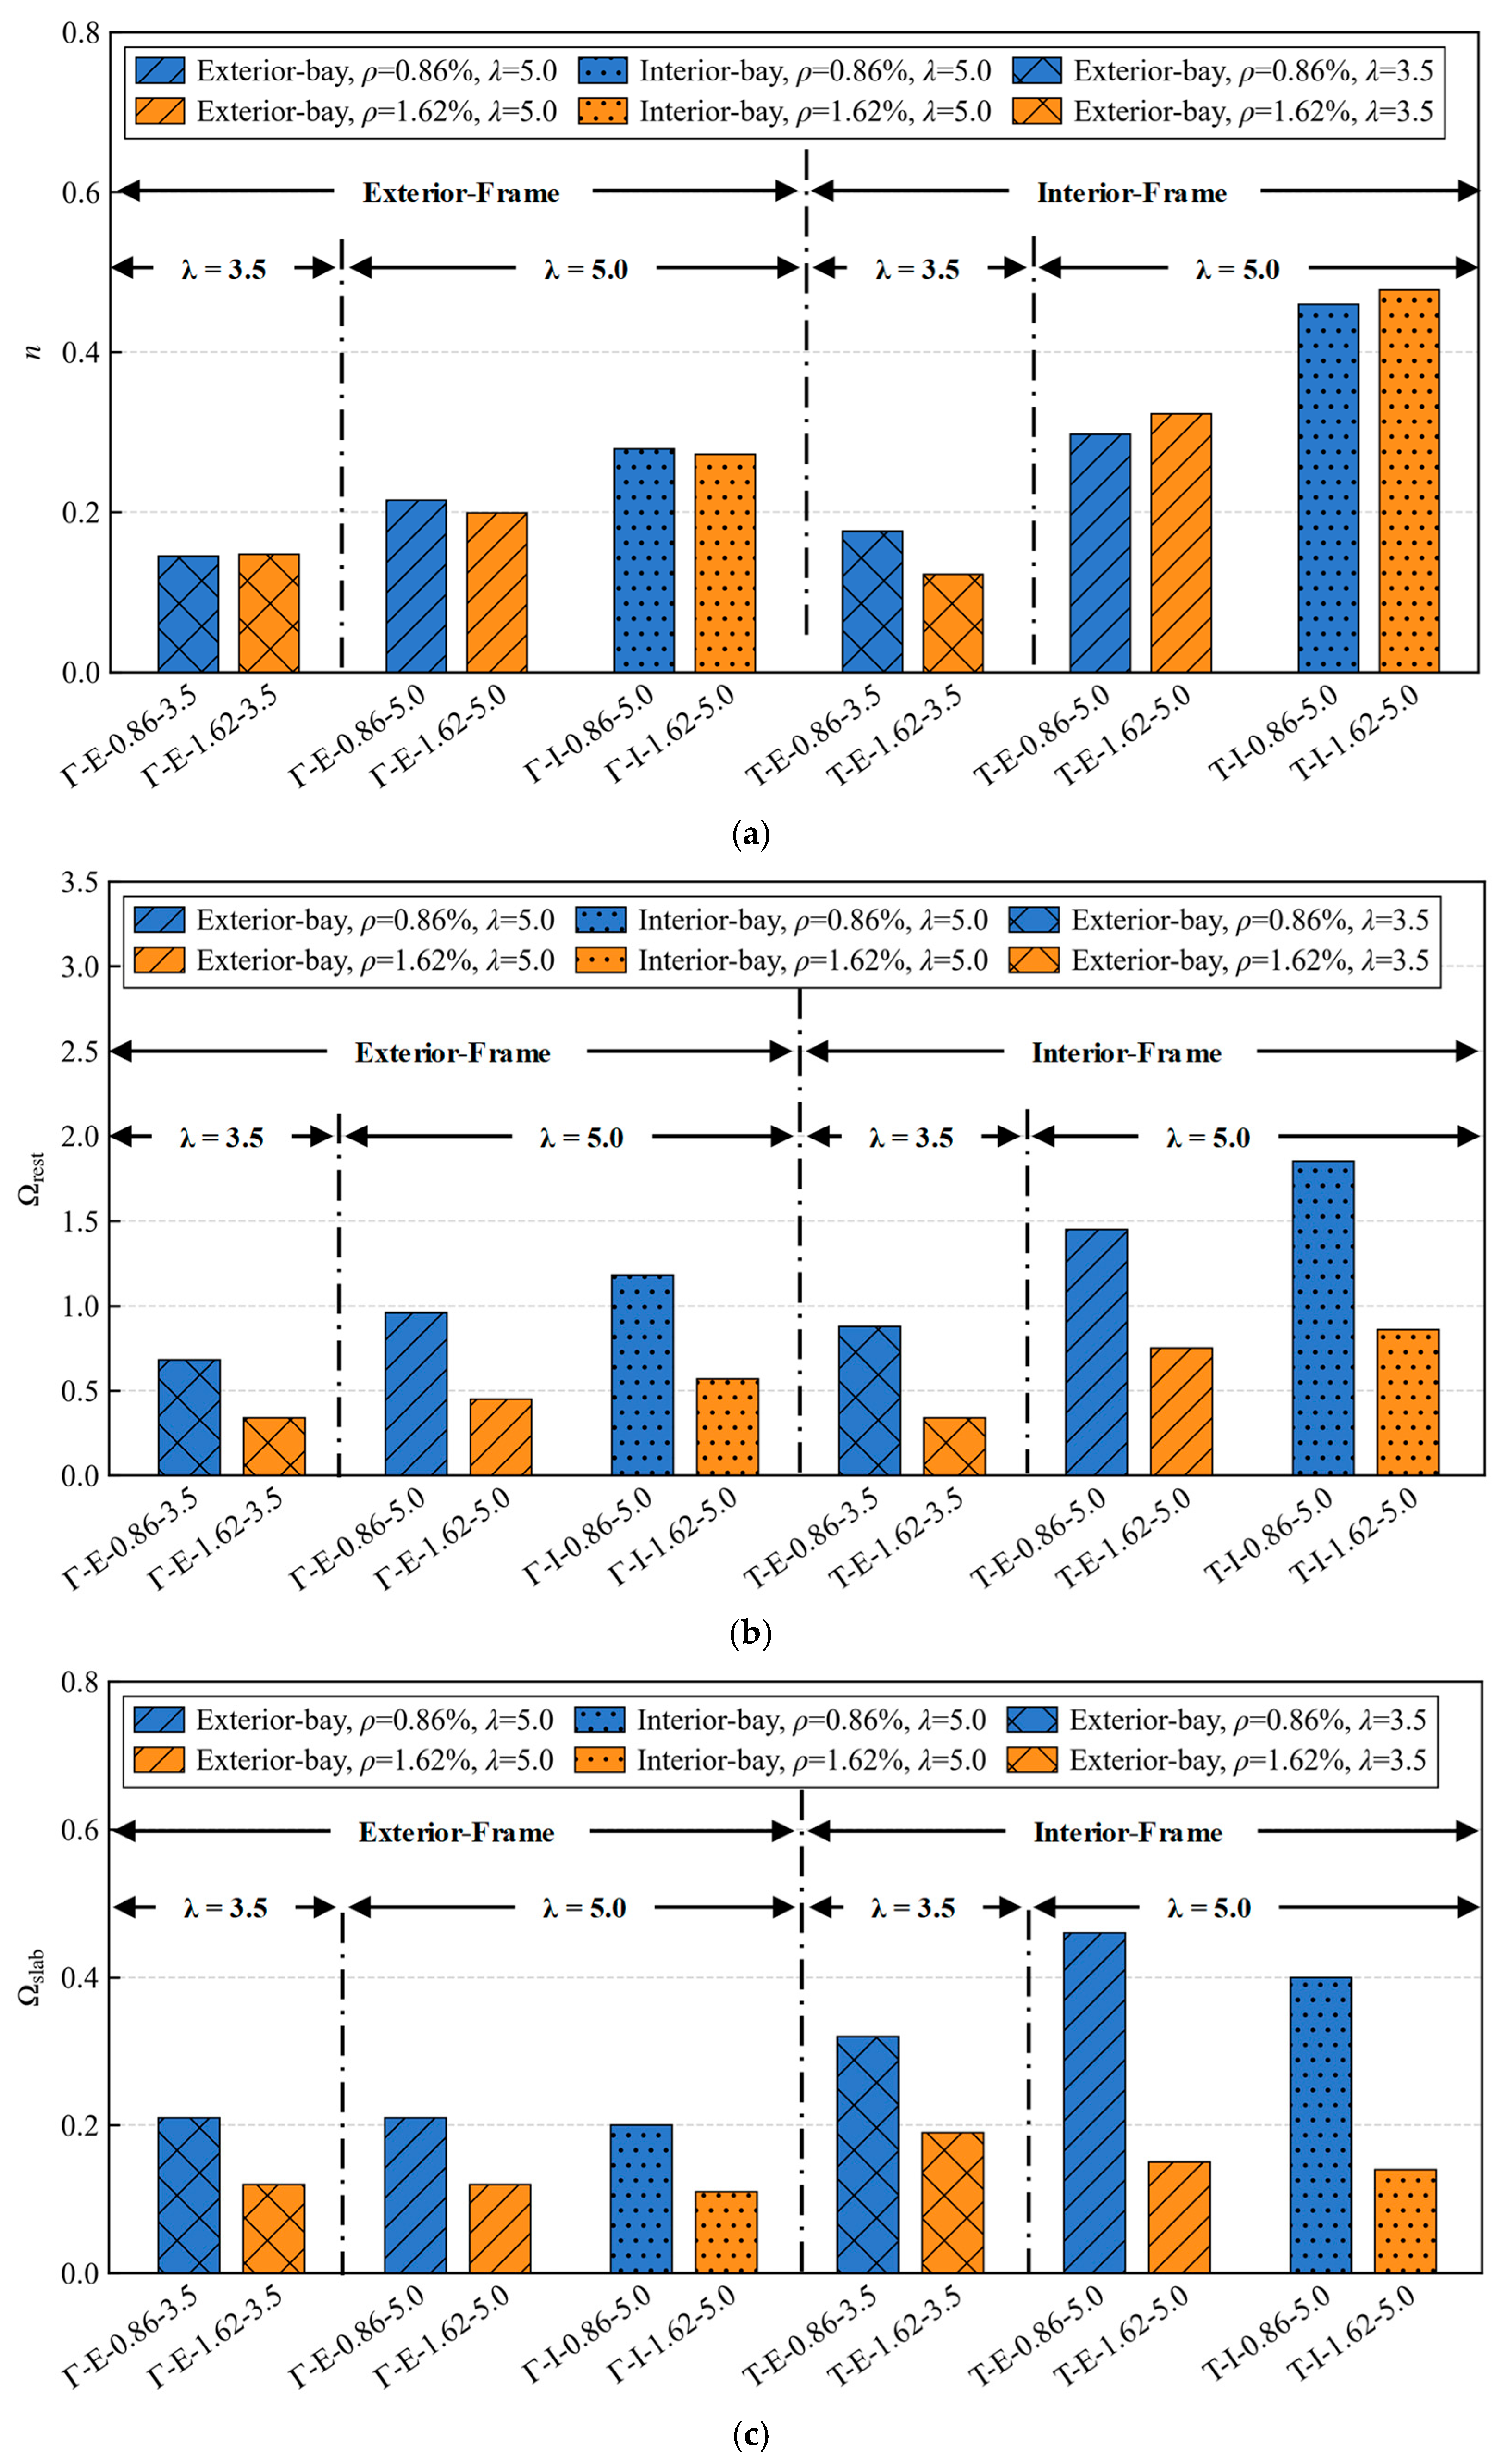
Table 8 summarizes the computed results of restraint-induced beam axial compression, beam-end flexural strength and strength enhancement ratios, and Figure 16 presents the distributions of the axial compression ratio n = Nt/(bhfc), Ωrest, Ωslab and Ωtotal. Owing to the higher level of spatial restraint, beams located in interior frames and interior bays generally exhibited larger n values, resulting in higher Ωrest. In addition, the influence of ρ was limited. However, beams with lower ρ were more sensitive to axial compression in terms of flexural strength enhancement. Accordingly, Ωrest ranged from 0.68 to 1.85 for ρ = 0.86% and from 0.34 to 0.86 for ρ = 1.62%. By contrast, λ had a pronounced influence on n, which increased with λ, ranging from 0.12 to 0.18 for λ = 3.5 and from 0.20 to 0.48 for λ = 5. The higher axial compression further enhanced the beam-end flexural strength, with Ωrest ranging from 0.34 to 0.88 for λ = 3.5 and from 0.45 to 1.85 for λ = 5.
Regarding Ωslab, the interior-frame beams exhibited larger values than the exterior-frame beams, reflecting the greater slab-rebar participation provided by slabs on both sides of the beam. Beams with lower ρ also showed larger Ωslab, as the slab-rebar contribution accounted for a larger proportion of the baseline beam flexural strength. The values of Ωslab ranged from 0.21 to 0.46 for ρ = 0.86% and from 0.11 to 0.19 for ρ = 1.62%. Compared with Ωslab, Ωrest was significantly larger, indicating that spatial restraint was the dominant source of strength enhancement. As a result, Ωtotal showed a variation pattern broadly consistent with that of Ωrest.
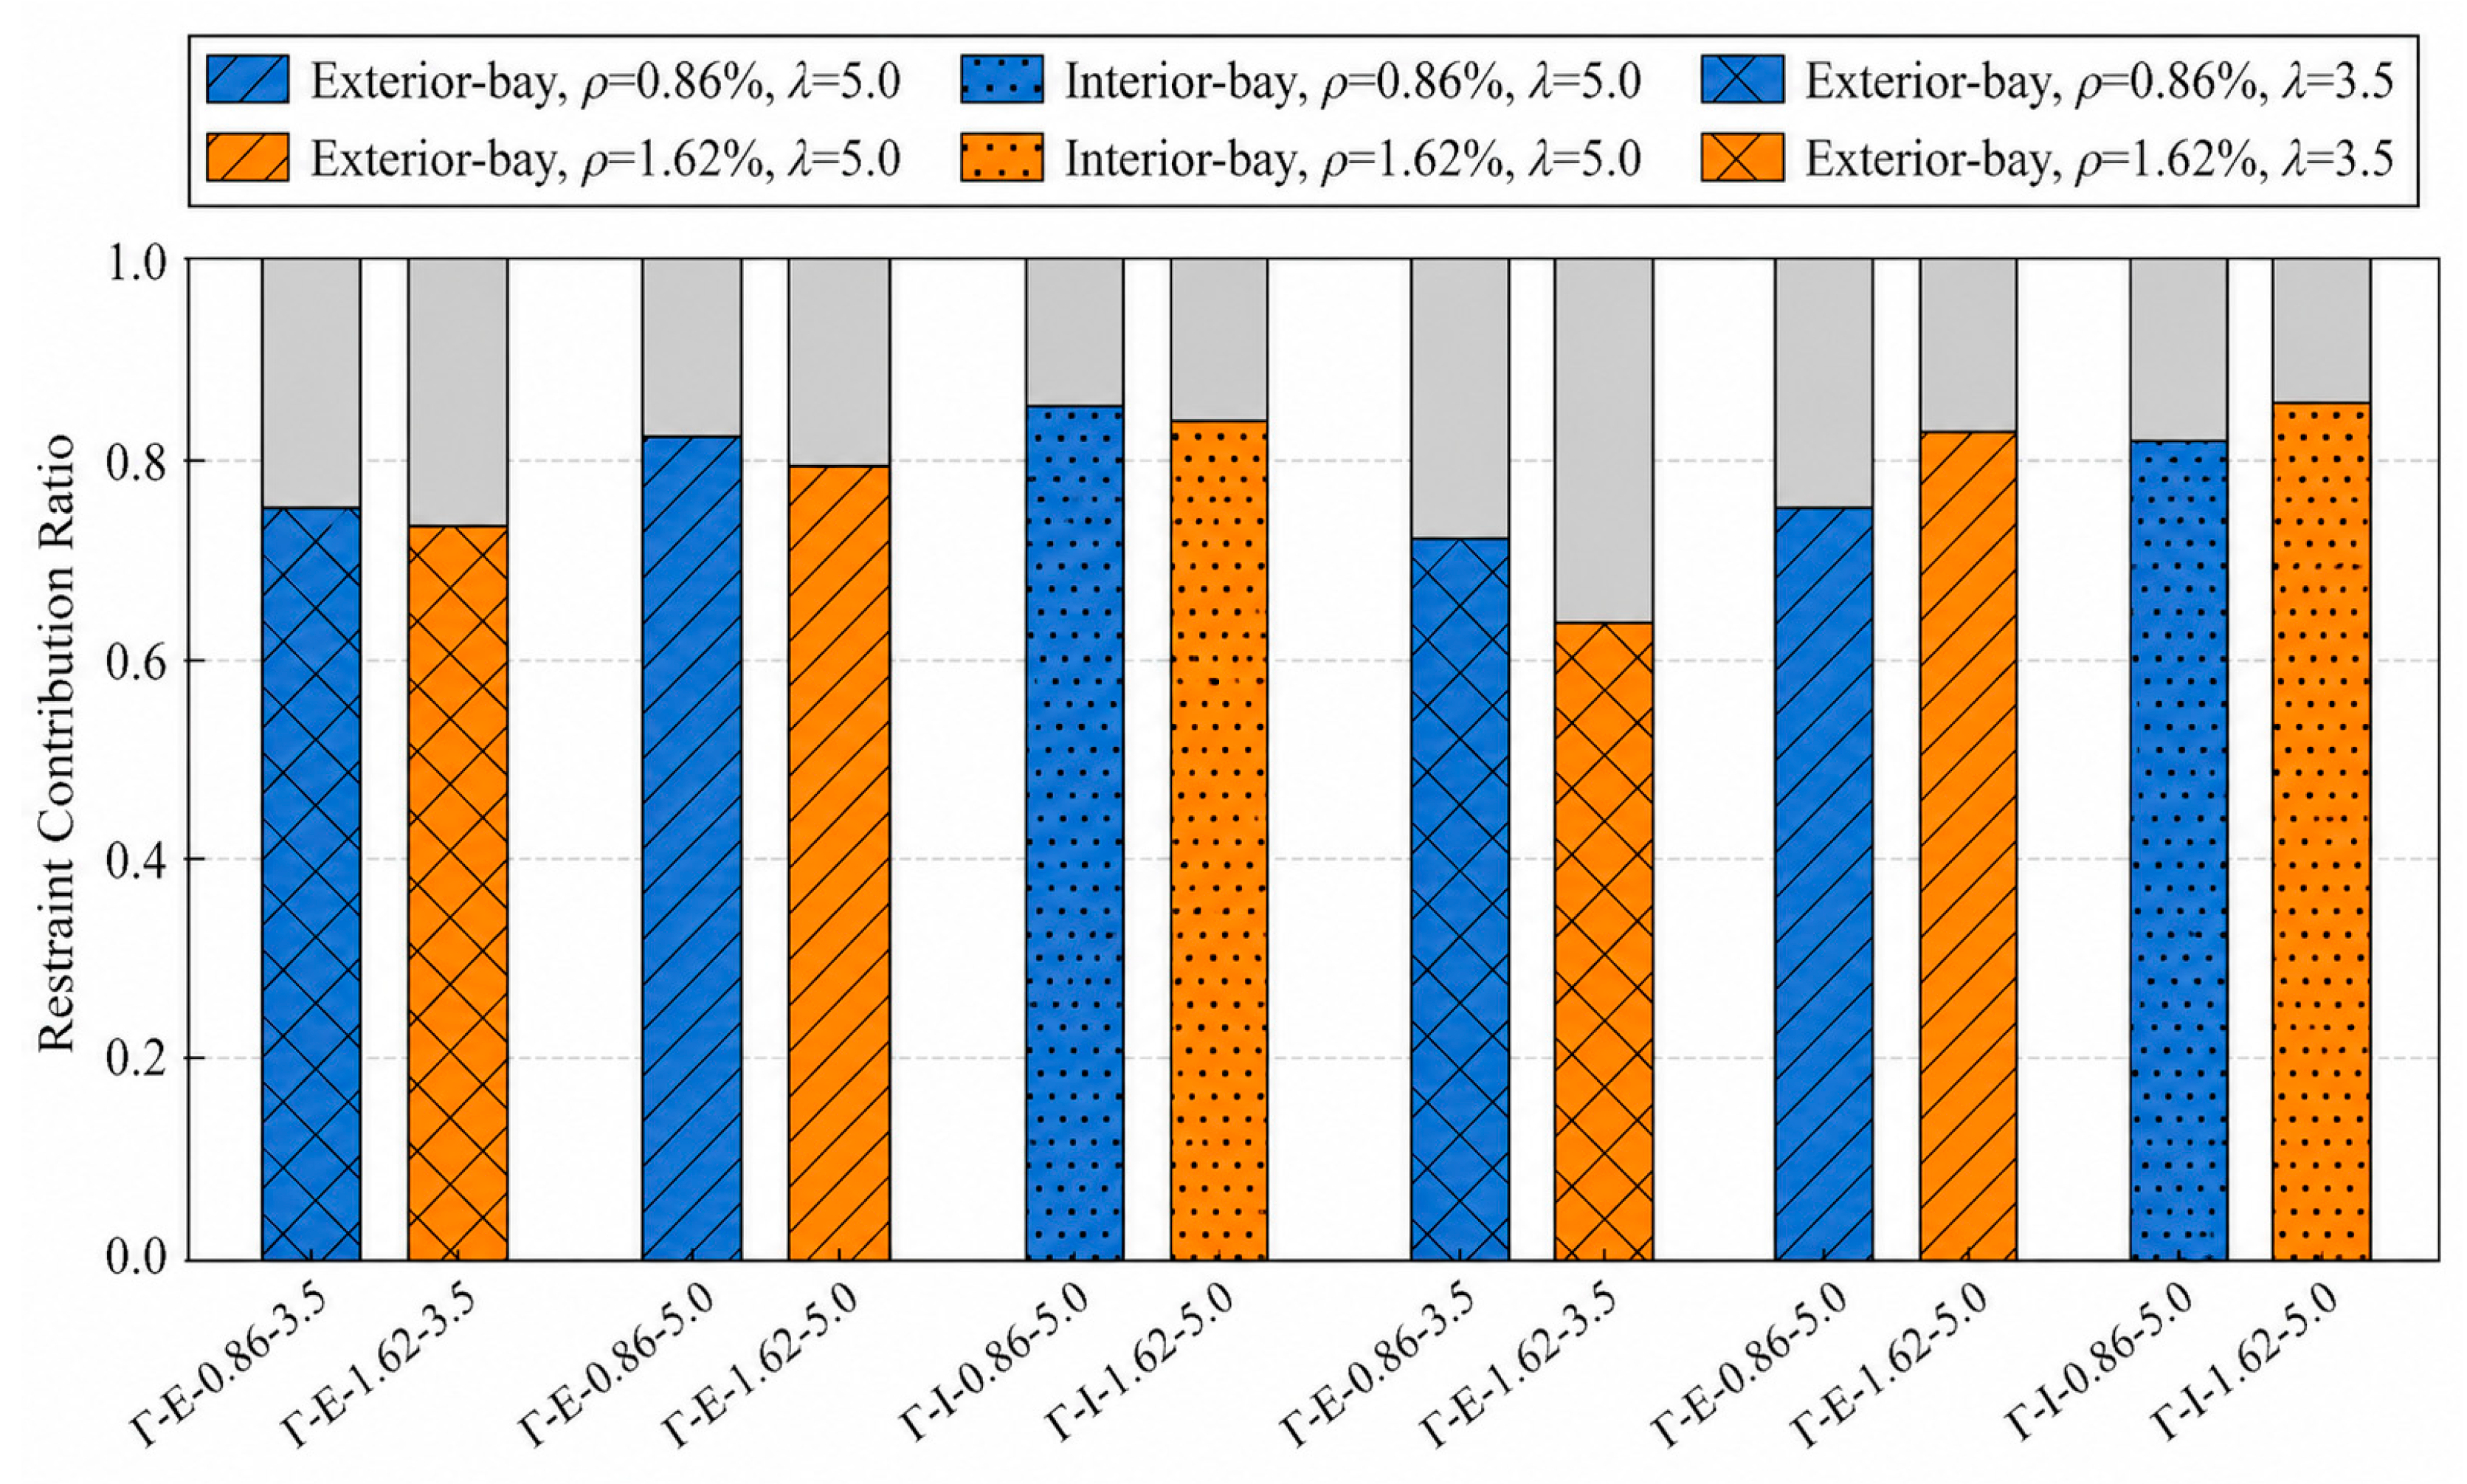
Figure 17 presents the contribution ratios of spatial restraint and slab rebars to the flexural strength enhancement, determined by Ωresttotal and Ωslabtotal, respectively. The contribution ratio of spatial restraint was slightly lower in the interior-frame beams, owing to the larger slab-rebar contribution from both sides of the beam. By contrast, the interior-bay beams exhibited larger spatial-restraint contribution ratios than the exterior-bay beams, owing to the larger restraint-induced axial compression. In addition, reducing the shear span ratio from λ = 5 to λ = 3.5 decreased the contribution ratio of spatial restraint, from 79–86% to 64–76%. Nevertheless, spatial restraint remained the dominant source of flexural strength enhancement. These results indicate that considering slab rebars through effective flange width alone is insufficient to capture the overstrength developed at restrained beam-end sections. Therefore, the strength enhancement caused by spatial restraint should be considered in design to promote the intended ductile failure mode at beam-end regions and to satisfy the strong-column–weak-beam strength hierarchy.

5. Conclusions

This study investigated the axial–flexural behavior of RC beam-end plastic hinges under spatial frame restraint. Twelve restrained beams within a three-dimensional frame system were tested under static vertical loading, and the failure modes, load capacity, axial elongation and rebar strain responses were examined. Through theoretical analysis, the restraint-induced axial compression and flexural overstrength of the beam-end sections were evaluated. The main conclusions are as follows.
(1) Compared with the unrestrained beams, the restrained frame beams exhibited more pronounced flexural–shear crack patterns at beam-end plastic hinges, indicating a larger shear-deformation component in their overall response. Beams located in interior frames and interior bays exhibited lower rebar tensile strain and were more prone to premature concrete crushing before tensile rebar yielding, as stronger spatial restraint limited tensile strain development.
(2) Beams located in interior frames and interior bays generally exhibited smaller effective overhanging flange widths than those in exterior frames and exterior bays, respectively. This was attributed to the higher spatial restraint level, which limited the tensile strain development of slab rebars and reduced their contribution to the beam-end flexural strength. Nevertheless, the measured effective overhanging flange widths, ranging from 7.8 to 12.8 times the slab thickness, were still significantly larger than the design-code value of six, indicating that the slab contribution to beam-end flexural strength is underestimated.
(3) Beam elongation was suppressed by spatial restraint, which induced axial compression in the beams and led to flexural strength enhancement. The beam axial compression ratio ranged from 0.13 to 0.46 and increased with the spatial restraint level and shear span ratio. The combined effect of restraint-induced axial compression and slab contribution increased the beam-end flexural strength by 57% to 225%.
(4) The restraint-induced flexural strength enhancement increased with the spatial restraint level and shear span ratio, but decreased with increasing longitudinal rebar ratio, resulting in a beam-end flexural strength enhancement of 34% to 185%. Compared with the tensile contribution of slab rebars, restraint-induced axial compression was the dominant source of flexural strength enhancement, accounting for 64% to 86% of the total enhancement.
The above conclusions were based on the twelve restrained beams with specific parameter combinations, and their generalizability requires verification in future work. Further studies are required to develop design formulations for calculating the restraint-induced axial compression and effective flange width under spatial frame effects. These two factors should be taken into account in the flexural strength calculation of beam-end sections to promote the intended ductile failure mode at beam-end regions and to satisfy the strong-column–weak-beam strength hierarchy.

Author Contributions

Conceptualization, Z.Z. and Z.W.; methodology, Z.Z. and Z.W.; formal analysis, Z.Z., X.L. and Z.W.; investigation, Z.Z. and Z.W.; data curation, Z.Z. and Z.W.; writing—original draft preparation, Z.Z. and Z.W.; writing—review and editing, Z.Z. and Z.W.; visualization, Z.Z., X.L. and Z.W.; funding acquisition, Z.W. All authors have read and agreed to the published version of the manuscript.

Funding

This research was funded by the Natural Science Foundation of Guangdong Province, grant number 2026A1515011108, and the China Postdoctoral Science Foundation, grant number 2024M760958.

Data Availability Statement

Data will be made available on request.

Conflicts of Interest

The authors declare no conflicts of interest.

References

  1. Zhao, Z.Z.; Kwan, A.K.H.; He, X.G. Nonlinear finite element analysis of deep reinforced concrete coupling beams. Eng. Struct. 2004, 26, 13–25. [Google Scholar] [CrossRef] [Scilit]
  2. Eom, T.S.; Park, H.G. Elongation of reinforced concrete members subjected to cyclic loading. J. Struct. Eng. 2010, 136, 1044–1054. [Google Scholar] [CrossRef] [Scilit]
  3. Valipour, H.; Farhangvesali, N.; Foster, S. A generic model for investigation of arching action in reinforced concrete members. Constr. Build. Mater. 2013, 38, 742–750. [Google Scholar] [CrossRef] [Scilit]
  4. Yang, E.I.; Yi, S.T.; Morita, S. Effect of axial restraint on flexural and shear behaviour of high-strength concrete members. Mag. Concr. Res. 2004, 56, 63–72. [Google Scholar] [CrossRef]
  5. Yi, S.T.; Yang, E.I. Effect of axial restraint on mechanical behavior and average crack spacing of reinforced concrete flexural members. Nucl. Eng. Des. 2004, 228, 107–117. [Google Scholar] [CrossRef] [Scilit]
  6. Wang, L.; Tian, Y.; Luo, W.; Li, G.; Zhang, W.; Liu, S.; Zhang, C. Seismic performance of axially restrained reinforced concrete frame beams. J. Struct. Eng. 2019, 145, 04019019. [Google Scholar] [CrossRef] [Scilit]
  7. Mehrabani, R.V.; Sigrist, V. Elongation of reinforced concrete plastic hinges subjected to reversed cyclic loading. J. Struct. Eng. 2015, 141, 04014188. [Google Scholar] [CrossRef] [Scilit]
  8. Wu, Z.-N.; Elghazouli, A.Y.; Han, X.-L.; Huang, C. Assessment and design of restrained reinforced concrete beams subjected to hysteresis elongation effects. Eng. Struct. 2026, 346, 121408. [Google Scholar] [CrossRef] [Scilit]
  9. Fenwick, R.C.; Megget, L.M. Elongation and load deflection characteristics of reinforced concrete members containing plastic hinges. Bull. N. Z. Natl. Soc. Earthq. Eng. 1993, 26, 28–41. [Google Scholar] [CrossRef] [Scilit]
  10. Lee, J.Y.; Watanabe, F. Predicting the longitudinal axial strain in the plastic hinge regions of reinforced concrete beams subjected to reversed cyclic loading. Eng. Struct. 2003, 25, 927–939. [Google Scholar] [CrossRef] [Scilit]
  11. Zerbe, H.E.; Durrani, A.J. Seismic response of connections in two-bay R/C frame subassemblies. J. Struct. Eng. 1989, 115, 2829–2844. [Google Scholar] [CrossRef] [Scilit]
  12. Zerbe, H.E.; Durrani, A.J. Seismic response of connections in two-bay reinforced concrete frame subassemblies with a floor slab. ACI Struct. J. 1990, 87, 406–415. [Google Scholar] [CrossRef] [Scilit] [PubMed]
  13. Park, J.; Strepelias, E.; Stathas, N.; Kwon, O.; Bousias, S. Application of hybrid simulation method for seismic performance evaluation of RC coupling beams subjected to realistic boundary condition. Earthq. Eng. Struct. Dyn. 2021, 50, 375–393. [Google Scholar] [CrossRef] [Scilit]
  14. Motter, C.J. Reinforced concrete coupling beams with axial restraint. ACI Struct. J. 2025, 122, 35–49. [Google Scholar] [CrossRef] [Scilit]
  15. Mihaylov, B.; Trandafir, A.; Palios, X.; Strepelias, E.; Bousias, S. Effect of axial restraint and loading history on the behavior of short reinforced concrete coupling beams. ACI Struct. J. 2021, 118, 71–82. [Google Scholar] [CrossRef] [Scilit]
  16. Chen, X.-J.; Han, X.-L.; Huang, C.-B.; Ji, J.; Wu, Z.-N.; Lin, G.-R.; Huang, D.-F. Elongation restraint effects of T-shaped RC beams under cyclic loading: Experimental investigations and flexural capacity prediction. J. Build. Eng. 2026, 129, 116910. [Google Scholar] [CrossRef] [Scilit]
  17. Kim, J.; Stanton, J.; MacRae, G. Effect of beam growth on reinforced concrete frames. J. Struct. Eng. 2004, 130, 1333–1342. [Google Scholar] [CrossRef] [Scilit]
  18. Kim, J.H.; Choi, S.-H.; Han, S.-J.; Hwang, J.-H.; Jeong, H.; Kim, K.S. Effect of beam elongation phenomenon on lateral load resistance of RC frame. J. Build. Eng. 2023, 65, 105764. [Google Scholar] [CrossRef] [Scilit]
  19. Wu, Z.-N.; Han, X.-L.; Elghazouli, A.Y.; Huang, C. Assessment and design of RC frames incorporating effects of restraint to beam hysteresis elongation. J. Build. Eng. 2026, 120, 115600. [Google Scholar] [CrossRef] [Scilit]
  20. Luo, W.; Jiang, L.; Lei, C.; Wang, L.; Tian, Y.; Yang, S.; Zhang, W. Effects of axial restraints on beam flexural and joint shear behaviors in reinforced concrete frames under seismic loading. J. Earthq. Eng. 2023, 27, 121–141. [Google Scholar] [CrossRef] [Scilit]
  21. Wu, Z.-N.; Dong, Y.; Han, X.-L.; Ji, J.; Lin, J.-C. Hysteresis elongation behavior of RC beams failing in different modes: Experimental investigation and numerical modelling using smeared crack approach. Eng. Struct. 2025, 329, 119807. [Google Scholar] [CrossRef] [Scilit]
  22. Ning, N.; Qu, W.; Ma, Z.J. Design recommendations for achieving strong column–weak beam in RC frames. Eng. Struct. 2016, 126, 343–352. [Google Scholar] [CrossRef] [Scilit]
  23. Santarsiero, G.; Masi, A. Analysis of slab action on the seismic behavior of external RC beam-column joints. J. Build. Eng. 2020, 32, 101608. [Google Scholar] [CrossRef] [Scilit]
  24. Sococol, I.; Mihai, P.; Petrescu, T.-C.; Nedeff, F.; Nedeff, V.; Agop, M.; Luca, B.-I. Numerical study regarding the seismic response of a moment-resisting reinforced concrete frame structure with reduced cross-sections of the RC slabs. Buildings 2022, 12, 1525. [Google Scholar] [CrossRef] [Scilit]
  25. Han, X.; Qu, Y.; Ji, J.; Huang, H.; Huang, D. A numerical study on the yielding mechanism of RC frame structure with cast-in-place slabs. Adv. Struct. Eng. 2025, 29, 1671–1693. [Google Scholar] [CrossRef] [Scilit]
  26. Durrani, A.J.; Zerbe, H.E. Seismic resistance of R/C exterior connections with floor slab. J. Struct. Eng. 1987, 113, 1850–1864. [Google Scholar] [CrossRef] [Scilit]
  27. French, C.W.; Boroojerdi, A. Contribution of R/C floor slabs in resisting lateral loads. J. Struct. Eng. 1989, 115, 1–18. [Google Scholar] [CrossRef] [Scilit]
  28. Men, J.; Xiong, L.; Wang, J.; Fan, G. Effect of different RC slab widths on the behavior of reinforced concrete column and steel beam-slab subassemblies. Eng. Struct. 2021, 229, 111639. [Google Scholar] [CrossRef] [Scilit]
  29. Marchisella, A.; Muciaccia, G.; Sharma, A.; Eligehausen, R. Experimental investigation of 3D RC exterior joint retrofitted with fully fastened haunch retrofit solution. Eng. Struct. 2021, 239, 112206. [Google Scholar] [CrossRef] [Scilit]
  30. Montuori, R.; Nastri, E.; Piluso, V.; Streppone, S. Experimental validation of a theoretical model accounting for floor joists contribution on the flexural resistance of beam-column joints in RC frames. Eng. Struct. 2021, 247, 113168. [Google Scholar] [CrossRef] [Scilit]
  31. Lu, T.; Guan, K.; Pan, J.; Liang, X. The effect of ECC materials on seismic performance of beam-column subassemblies with slabs. Buildings 2023, 13, 1942. [Google Scholar] [CrossRef] [Scilit]
  32. Yang, R.; Luo, K.H.; Huang, S.M.; Qiao, Y.M. Influence of column-to-beam flexural modulus ratio on the failure mode of RC frame exterior joints: Experimental study and numerical investigations. J. Build. Eng. 2025, 118, 115116. [Google Scholar] [CrossRef] [Scilit]
  33. GB 50010-2010; Code for Design of Concrete Structures. China Architecture & Building Press: Beijing, China, 2015.
  34. ACI 318-19; Building Code Requirements for Structural Concrete. American Concrete Institute: Farmington Hills, MI, USA, 2019.
  35. Zheng, Z.; Han, X.; Ji, J.; Wang, X.; Wu, Z.; Lin, J. Static mechanical properties of reinforced concrete beams considering structural spatial restraints: Experimental and numerical investigations. J. Build. Eng. 2025, 115, 114507. [Google Scholar] [CrossRef] [Scilit]
  36. Zheng, Z.; Li, W.; Han, X.; Ji, J.; Lin, J.; Wang, P. Effects of realistic boundary conditions on short beams in a slab-on-beam RC frame structure. J. Build. Eng. 2026, 128, 116697. [Google Scholar] [CrossRef] [Scilit]
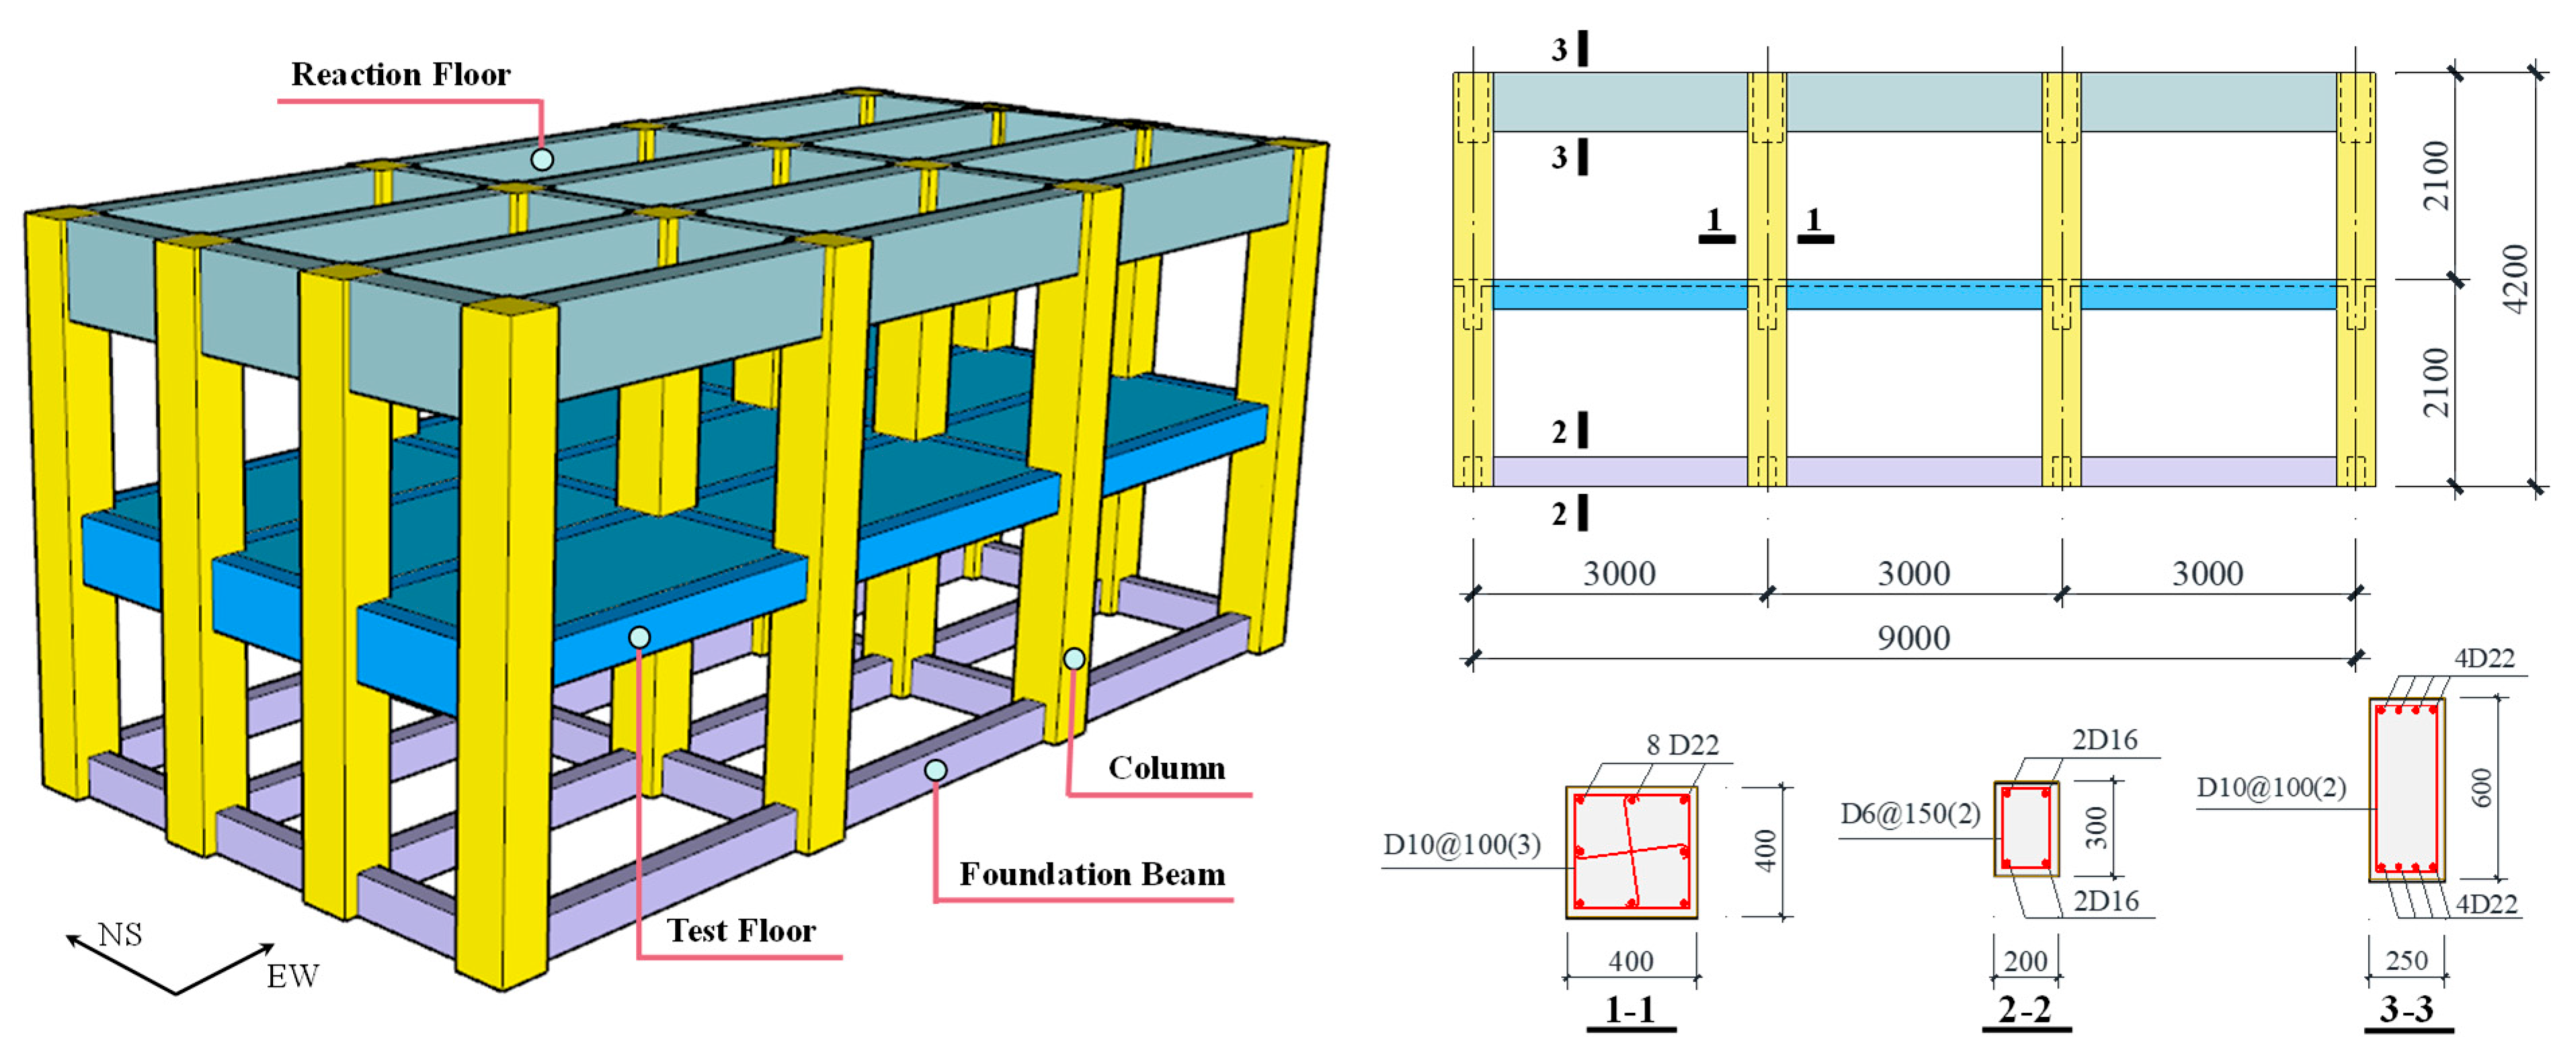
Figure 1. The details of the frame structure.
Buildings 16 03504 g001
Figure 2. Plan view of the test floor and the experimental variables of the tested frame beams.
Buildings 16 03504 g002
Figure 3. Rebar arrangement and strain gauge layout of Γ-E-1.62-5.
Buildings 16 03504 g003
Figure 4. Loading scheme: (a) loading setup; (b) loading sequence.
Buildings 16 03504 g004
Figure 5. Strain gauge layout of slab rebars.
Buildings 16 03504 g005
Figure 6. Component details and loading setup of simply supported beams: (a) loading and measurement setup; (b) moment diagram.
Buildings 16 03504 g006
Figure 7. Failure modes of tested beams: (a) typical damage pattern of restrained beams; (b) typical damage pattern of unrestrained beams; (c) Γ-I-1.62-5; (d) Γ-E-1.62-3.5; (e) Γ-E-0.86-3.5; (f) T-E-1.62-5; (g) T-I-1.62-5; (h) T-E-0.86-5; and (i) R-0.86-5.
Buildings 16 03504 g007aBuildings 16 03504 g007b
Figure 8. Crack width development of restrained beam-end plastic hinges: (a) λ = 5, ρ = 1.62%; (b) λ = 5, ρ = 0.86%; and (c) λ = 3.5.
Buildings 16 03504 g008
Figure 9. Crack distribution of the slabs adjacent to T-E-1.62-5: (a) top surface; (b) bottom surface.
Buildings 16 03504 g009
Figure 10. Load–deflection curves: (a) λ = 5, ρ = 1.62%; (b) λ = 5, ρ = 0.86%; and (c) λ = 3.5.
Buildings 16 03504 g010
Figure 11. Overall capacity enhancement ratio (PtestPun)/Pun.
Buildings 16 03504 g011
Figure 12. Distribution of the capacity enhancement ratio: (a) longitudinal rebar ratio ρ; (b) shear span ratio λ.
Buildings 16 03504 g012
Figure 13. Beam elongation-Δ curves: (a) λ = 5, ρ = 1.62%; (b) λ = 5, ρ = 0.86%; and (c) λ = 3.5.
Buildings 16 03504 g013
Figure 14. Strain of top and bottom rebars at beam-end sections: (a) exterior frame (Axis A); (b) interior frame (Axis B); (c) interior frame (Axis C); and (d) exterior frame (Axis D).
Buildings 16 03504 g014
Figure 15. Strain of slab rebars at the beam-end sections: (a) ρ = 0.86%; (b) ρ = 1.62%.
Buildings 16 03504 g015
Figure 16. Distribution of axial compression ratio and strength enhancement ratios: (a) n; (b) Ωrest; (c) Ωslab; and (d) Ωtotal.
Buildings 16 03504 g016aBuildings 16 03504 g016b
Figure 17. The contribution ratio of spatial restraint.
Buildings 16 03504 g017
Table 1. Information on the tested frame beams.
Spatial LocationNameTop Rebarsρ (%)a (mm)λ
FrameBay
Exterior
(Axis A)
ExteriorΓ-E-1.62-52D221.6213005.0
InteriorΓ-I-1.62-52D221.6213005.0
ExteriorΓ-E-1.62-3.52D221.629003.5
Exterior
(Axis D)
ExteriorΓ-E-0.86-52D160.8613005.0
InteriorΓ-I-0.86-52D160.8613005.0
ExteriorΓ-E-0.86-3.52D160.869003.5
Interior
(Axis B)
ExteriorT-E-1.62-52D221.6213005.0
InteriorT-I-1.62-52D221.6213005.0
ExteriorT-E-1.62-3.52D221.629003.5
Interior
(Axis C)
ExteriorT-E-0.86-52D160.8613005.0
InteriorT-I-0.86-52D160.8613005.0
ExteriorT-E-0.86-3.52D160.869003.5
Table 2. Mechanical properties of steel rebars.
Diameter (mm)TypeYield Strength (MPa)Ultimate Strength (MPa)Elastic Modulus (MPa)Yield Strain (×10−6)
6Plain rebar369512188,0001965
8Ribbed rebar464658207,0002245
10Ribbed rebar455633189,0002411
12Ribbed rebar456652190,0002402
16Ribbed rebar450635198,0002270
Table 3. Information on the simply supported beams.
Nameb × h (mm × mm)Bottom Rebarsρ (%)a (mm)λ
R-1.62-5180 × 3002D221.6213005
R-0.86-5180 × 3002D160.8613005
Table 4. Load–deflection corresponding to concrete cracking, concrete spalling and top rebar yielding.
NameWestern Beam EndEastern Beam EndPeak Load
Concrete CrackingConcrete SpallingTop Rebar YieldingConcrete CrackingConcrete SpallingTop Rebar Yielding
Δ (mm)P
(kN)
Δ (mm)P
(kN)
Δ (mm)P
(kN)
Δ (mm)P
(kN)
Δ (mm)P
(kN)
Δ (mm)P
(kN)
Δ (mm)P
(kN)
Γ-E-1.62-53.5 140 10.4 240 16.5 293 3.5 140 10.4 240 --20.5 303
Γ-I-1.62-52.0 120 10.5 300 --1.6 100 10.5 300 --14.0 338
Γ-E-1.62-3.51.2 80 8.0 260 20.7 387 2.0 120 6.8 240 17.3 371 21.8 395
Γ-E-0.86-51.1 80 --16.0 264 0.8 60 13.8 260 16.8 256 16.5 265
Γ-I-0.86-54.0 140 11.5 260 --4.0 140 11.5 260 --21.0 302
Γ-E-0.86-3.51.2 60 9.7 260 21.3 317 1.2 60 9.7 260 20.5 314 23.6 320
T-E-1.62-54.5 200 14.0 340 27.8 363 6.6 240 10.3 300 --21.1 375
T-I-1.62-54.1 220 11.0 380 --6.1 280 11.0 380 --17.7 423
T-E-1.62-3.55.0 240 11.0 330 --5.0 240 11.0 330 22.7 389 21.2 396
T-E-0.86-53.7 160 13.0 300 17.2 326 3.7 160 13.0 300 20.4 336 19.2 338
T-I-0.86-56.6 275 12.3 375 22.0 402 10.4 350 12.3 375 --21.2 405
T-E-0.86-3.53.0 160 10.0 300 --3.0 160 8.6 280 --15.1 366
Note: “-” indicates that the corresponding phenomenon did not occur during loading.
Table 5. Comparison of load capacities between restrained beams and unrestrained beams.
FrameNamePtest (kN)Pun (kN)(PtestPun)/Pun
Exterior FrameΓ-E-1.62-53031481.04
Γ-I-1.62-53381481.28
Γ-E-0.86-5265941.82
Γ-I-0.86-5302942.21
Interior FrameT-E-1.62-53751481.54
T-I-1.62-54231481.86
T-E-0.86-5338942.59
T-I-0.86-5405943.31
Table 6. Comparison of the test capacity of restrained beams Ptest with the theoretical capacity P0.
FrameNamePtest (kN)P0 (kN)(PtestP0)/P0
Exterior FrameΓ-E-1.62-53031830.66
Γ-I-1.62-53381810.86
Γ-E-1.62-3.53952650.49
Γ-E-0.86-52651221.17
Γ-I-0.86-53021211.49
Γ-E-0.86-3.53201770.81
Interior FrameT-E-1.62-53751890.98
T-I-1.62-54231871.27
T-E-1.62-3.53972810.41
T-E-0.86-53381451.33
T-I-0.86-54051391.91
T-E-0.86-3.53661910.92
Table 7. Effective overhanging flange width of beam-end sections.
NameWestern Beam EndEastern Beam End
South Side (mm)North Side (mm)Average (mm)Flange Width/Slab ThicknessSouth Side (mm)North Side (mm)Average (mm)Flange Width/Slab Thickness
Γ-E-1.62-5767 -767 12.8 663 -663 11.0
Γ-I-1.62-5661 -661 11.0 655 -655 10.9
Γ-E-1.62-3.5768 -768 12.8 747 -747 12.4
Γ-E-0.86-5-689 689 11.5 -594 594 9.9
Γ-I-0.86-5-607 607 10.1 -619 619 10.3
Γ-E-0.86-3.5-638 638 10.6 -657 657 11.0
T-E-1.62-5690 472 581 9.7 444 490 467 7.8
T-I-1.62-5630 336 483 8.1 459 506 483 8.0
T-E-1.62-3.5662 643 653 10.9 609 606 608 10.1
T-E-0.86-5790 703 746 12.4 733 653 693 11.5
T-I-0.86-5745 402 574 9.6 705 586 645 10.8
T-E-0.86-3.5394 536 465 7.8 585 423 504 8.4
Table 8. The computed results of the theoretical analysis.
NamePtest
(kN)
nMm,Nt
(kN·m)
Me,Nt
(kN·m)
Me,0
(kN·m)
M e , 0 r e c t
(kN·m)
ΩrestΩslabΩtotal
Γ-E-1.62-53030.20 48149106950.450.120.57
Γ-I-1.62-53380.27 60159105950.570.110.68
Γ-E-1.62-3.53950.32 39139106950.340.120.46
Γ-E-0.86-52650.48 4812469570.960.211.17
Γ-I-0.86-53020.15 6013669571.180.201.38
Γ-E-0.86-3.53200.12 3610869570.680.210.90
T-E-1.62-53750.21 64180109950.750.150.90
T-I-1.62-54230.28 86189108950.860.141.00
T-E-1.62-3.53970.30 34145112950.340.190.53
T-E-0.86-53380.46 5316683571.450.461.91
T-I-0.86-54050.14 7818680571.850.402.25
T-E-0.86-3.53660.18 3912675570.880.321.20
Disclaimer/Publisher’s Note: The statements, opinions and data contained in all publications are solely those of the individual author(s) and contributor(s) and not of MDPI and/or the editor(s). MDPI and/or the editor(s) disclaim responsibility for any injury to people or property resulting from any ideas, methods, instructions or products referred to in the content.