Article

A Regression-Based Machine Learning Approach for Rehabilitation of Corroded RC Culverts Strengthened with SMA

1
Department of Civil Engineering, Xi’an University of Technology, Jinhua South Road, Beilin District, Xi’an 710048, China
2
Department of Civil and Environmental Engineering, College of Engineering, King Faisal University, Al-Ahsa 31982, Saudi Arabia
3
Department of Civil and Environmental Engineering, University of Alberta, Edmonton, AB T6G 2R3, Canada
4
Department of Civil Engineering, Ghulam Ishaq Khan Institute of Engineering Sciences and Technology, Topi, Swabi 23640, KPK, Pakistan
*
Author to whom correspondence should be addressed.
Buildings 2026, 16(17), 3439; https://doi.org/10.3390/buildings16173439
Submission received: 4 June 2026 / Revised: 19 June 2026 / Accepted: 24 June 2026 / Published: 28 August 2026
(This article belongs to the Section Building Structures)

Abstract

Box culverts are critical components of transportation infrastructure, yet their load-carrying capacity is often compromised by reinforcement corrosion and geometric deterioration. This study proposes an integrated finite element (FEM) and machine learning (ML) framework to evaluate and predict the ultimate capacity of corroded reinforced concrete box culverts strengthened with shape memory alloy (SMA). Severe corrosion was simulated by reducing the slab thickness by 20 mm, and SMA was subsequently applied to the corroded culvert in different strengthening configurations to assess its rehabilitation effectiveness. Case-2 showed the best performance in increasing the capacity of the corroded culvert. A total of 314 FEM-based generated data points were used to train and test five regression models: GB, ANN, SVM, RF, and KNN. The performance of the model was evaluated in terms of R2, MAE, RMSE, and MAPE. The SHAP and Partial Dependence Plot (PDP) analysis was conducted for model interpretability and understanding the physical relevance. The analysis suggests that SMA helps in restoring and improving the carrying capacity and resistance to deformation of the corroded culvert. Among the predictive models, GB achieved the highest accuracy, followed by ANN and SVM. Interpretability analyses consistently identified culvert width as the dominant parameter, followed by depth and length, while concrete strength showed a moderate positive influence. The proposed FEM–ML–XAI framework offers a reliable and interpretable tool for assessing and rehabilitating corrosion-damaged culverts using SMA.

1. Introduction

Culverts serve as critical hydraulic structures that regulate the flow of water beneath transportation corridors, i.e., highways and railways. Commonly constructed from concrete or masonry, they resist bending, shear, and torsional stresses. They channel stormwater safely, hence, mitigate flooding risks while simultaneously preserving the stability of embankments [1]. Among the different types, box culverts are the most common; these closed rectangular or square conduits may be precast or cast in situ and are employed for water conveyance, pedestrian underpasses, utility enclosures, etc. This paper will look at culverts in relation to their structural details, mode of deterioration, and methods of strengthening, all of which remain within the original theme and findings. Culverts can either be single-cell designs in the case of small discharge rates or multi-cell designs in the case of larger discharge volumes. Other designs include three-sided, crown, and inverted culverts, all of which mainly respond to specialized hydraulic or environmental conditions. Box culverts have inherent structural advantages as a result of being monolithic, meaning there is no need to build separate foundations in most cases [2]. The top slab resists live loads, while the base resists hydrostatic pressures due to the surrounding soil on the sides, respectively [3].
The culverts deteriorate owing to several causes that adversely affect their safety and service capabilities, such as excessive loading, corrosion, and environmental conditions [4]. High axle loads, together with increased traffic, accentuate the problems associated with the serviceability of deteriorated culverts [5]. Specifically, reinforced concrete culverts found in the sewage drainage systems are vulnerable to attacks by acidic effluents, biological degradation, and erosive damage due to fluid flow associated with the decrease in cross-sectional areas due to cracking [6].
To overcome the issues of durability and performance, many research studies were carried out to study the performance, failure modes, and upgrade techniques of culverts. Gong et al. [7] investigated the performance of different prefabricated RC box culverts (BCs), namely integral, round hinged, flat seam, and mortise, through scale modeling and FEM simulation, and found the tension–failure mechanisms of the top slabs. According to the study, the highest load-carrying capacity is found in the integral BC, while the lowest is found in the round hinged BC due to the joint sliding and rotation of the hinges. Moradi et al. [8] developed a nonlinear analysis procedure to assess the effects of concrete strength, steel content, and geometrical parameters on the performance of RC box culverts. Maximos et al. [9] investigated the performance of RC box culverts under cyclic loading and concluded that the fatigue performance of the culverts occurs, suggesting the need for modification of the current AASHTO fatigue design methodology for box culverts. Xu et al. [10] carried out experimental and FEM simulation investigations of the performance of different prefabricated box culverts with different reinforcement schemes, and the study showed the effectiveness of the simulation by comparing the experimental and simulation results, which indicated the beneficial effects of higher tensile steel content, improving the culvert ductility, resistance to cracking, and ultimate load-carrying capacity. Quadri et al. [11] tested precast culverts with different shapes subjected to monotonic loading with NaCl corrosion simulation. Data indicated that precast culverts displayed maximum strength, with corner shear failure mechanisms likely with rectangular culverts. Prior research suggested a capacity loss of up to 76% due to corrosion. Zenagebriel et al. [12] used an experimental FEM method on prefabricated RC U-shaped culverts. Hurd et al. [13] performed large-scale inspections on a culvert population that included 133 precast culverts. Conditions showed top slab corrosion on precast culverts. Tang et al. [6] identified sewage-exposed culverts in Shanghai based on safety-critical failure levels.
Apart from research on assessment, efforts are made to enhance strategies and materials. Meegoda et al. [14] developed a Culvert Information Management System to provide information on inspection, maintenance, and replacements, specifically for corrugated steel culverts. Majid et al. [15] proved that engineering cementitious composites (ECC) leads to a significant improvement in the load-carrying capacity, up to a maximum of 41%, and gives the best prediction of the ultimate strength of the culverts. Glass fiber-reinforced polymer (GFRP) has emerged as a sustainable material in seawater and sea-sand concrete due to its durable performance in saltwater, chemical, and alkaline conditions [16]. Hassanli et al. [17] verified through experimental research that GFRP-reinforced precast culverts are effective under soil and traffic loads in preventing corrosion. Waqas et al. [18] experimented on corroded culverts with CFRP sheet repair and found up to 25% improvement in load-carrying capacity, specifically when using a full sheet. A spray-on liner using polyvinyl alcohol (PVA) fiber-reinforced mortar was researched by Davidson [19], which resulted in double-digit improvements in strength, ductility, and durability without compromising thin densities. Haghani et al. [20] researched FRP composite materials as a non-corrodible alternative to corrodible steel in soil–steel composite culvert bridges and found improvements in durability without increasing life cycle costs, and performed well under fatigue and corrosion loading conditions.
Despite this, fiber-based alternatives demonstrate promising properties; however, focus has shifted to shape memory alloys (SMAs) in recent years. These materials are novel in terms of being smart and have shown properties of recovering inelastic strain when stress is released (super elasticity) and reverting to the original configuration upon thermal activation (shape memory effect, SME) [21]. There are about 18 types of SMA; of these, NiTi (nickel–titanium alloys, trade name: Nitinol), copper alloy-based, and FEM-based alloys have been thoroughly analyzed. NiTi alloys are particularly preferred in commercial applications owing to qualities such as ample ductility, greater tensile strength, excellent resistance to corrosion, desirable strength-to-weight ratio, and non-toxic nature [22]. NiTi SMAs have found diverse applications in a structural manner in terms of energy dissipation, bracing [23], seismic-resistant structures [24], isolation bearings [25], damping devices [26], flexural strengthening [27,28], and post-tensioning in buildings and bridges [29,30]. Therefore, NiTi SMAs are appropriate in overcoming corrosion-related breakdown of RC box culverts.
Recent studies by Saiidi et al. [31] showed that NiTi SMA rebars can minimize the permanent deformation of concrete bridge columns by up to 83% compared to RC structures. The result was also confirmed by Varela et al. [32] and agreed by Tazarv et al. [33]. A series of studies has proven that SMAs can effectively improve concrete structures exposed to severe environmental conditions. SMA–ECC showed better strength, ductility, and self-healing properties than other materials by Chen et al. [34], which regained their original stiffness and strength after loading. Chen et al. [35] showed that self-healing SMA–ECC concrete has better resistance to chloride ion penetration than marine concrete, and the erosional depth was confined to beyond 10 mm. Pei et al. [36] analyzed SMA wire-strengthened concrete columns exposed to corrosive synthetic seawater and found that concrete columns underwent remarkable reduction in their original stiffness and bearing capacity; hence, SMA wiring greatly reduced these deteriorations. The above-mentioned studies firmly support that SMAs perform better than other materials when exposed to severe environmental conditions. They are potential alternative materials to be used for strengthening corroded RC box culverts.
Additionally, there has been an increased adoption of computational techniques in empirical modeling. The use of machine learning (ML) was identified as a paradigmatic innovation in the field of structural engineering. The utilization of ML, noted in [37], comprises support vector machine (SVM) and convolutional neural networks (CNN) for damage assessment and identification [38]; regression, decision tree (DT), and Random Forest (RF) were used for capacity prediction in [39]; boosting algorithms like Extreme Gradient Boosting (XGBoost) were used to improve accuracy in a large dataset associated with the properties and resistance to fire [40]. For example, Manikandan et al. [41] outlined a unified framework for estimating the susceptibility of thin masonry minarets to seismic activity utilizing vibration measurement, nonlinear dynamic analysis, and machine learning methods. Moreover, Amin et al. [42] used FEA and Gene Expression Programming (GEP) data modeling to examine the use of ECC and natural bamboo material to improve RC deep beams with apertures.
Recent breakthroughs in predictive modeling illustrate the application capabilities of ML for culvert optimization and deterioration analysis. Conventional statistical analysis, such as the application of logistic regression, was performed by Qi et al. [43] for settlement and deformation analysis of culverts in permafrost regions, which opened the way for the application of more complex ML techniques. In another study, Gong et al. [44] used acoustic emission tests to investigate the process of damage development in prefabricated box culverts, proposing the grid-density fuzzy C-means clustering algorithm, resulting in an approximate 69% increase in clustering accuracy for the identification of the damage level. In Majid et al. [15] study, ML models were accompanied by explainable AI (XAI) techniques for predicting the strength of ECC-improved culverts. The application of XGBoost yielded the highest values of accuracy, and SHAP values/PDP maps pointed out the importance of corrosion thickness and materials.
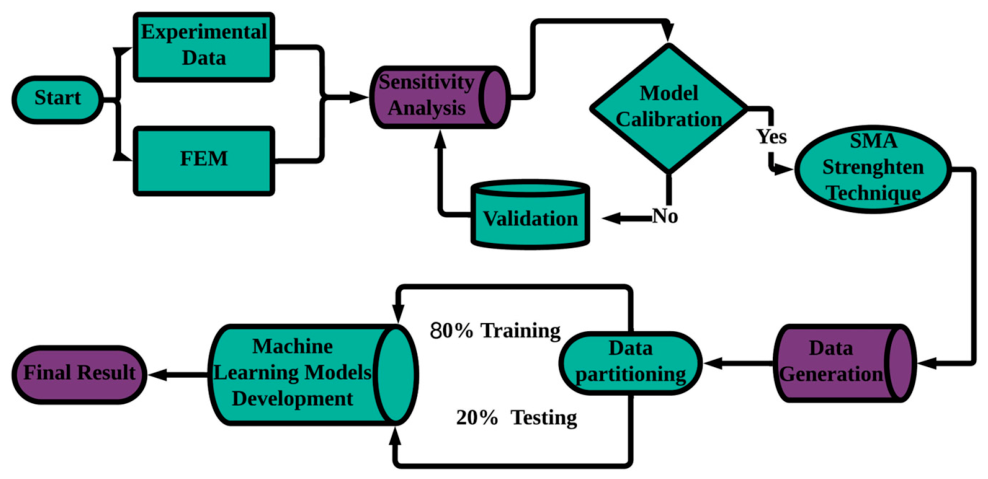
Despite encouraging progress in both experimental rehabilitation and data-driven modeling, three critical gaps remain unaddressed in the literature. First, existing research on culvert rehabilitation has mostly studied intact or mildly deteriorated structures, with repair strategies limited to conventional materials such as CFRP, GFRP, ECC, and spray-on liners. No study, up to the best of the author’s knowledge, has investigated the effectiveness of SMA as a rehabilitation material for severely corroded RC box culverts. Second, experimental evaluation, though reliable, is time-intensive, costly, and cannot feasibly explore the large geometric and material variations. Third, although FEM–ML–XAI frameworks have been demonstrated for other structural members, their application to corroded culverts rehabilitated with SMA has not been reported. The research questions are therefore as follows: (i) Can SMA effectively restore and enhance the load-carrying capacity of severely corroded RC box culverts, and which SMA layout configuration is most effective? (ii) Can regression-based ML models, trained on FEM-generated data, accurately predict the ultimate capacity of SMA-rehabilitated corroded culverts? (iii) Which geometric and material parameters most significantly govern rehabilitation performance, and can XAI tools provide physically interpretable insight into these relationships? The current study develops an FEM–ML–ML–XAI framework with the inclusion of a severely corroded RC box culvert with a particular reduced thickness of the top slab of 20 mm, followed by the imposition of four different SMA layouts. A dataset of outputs from the FEM was generated to establish the performance of multiple regression-based ML models, such as SVM, KNN, RF, GB, ANN, and XGBoost. Model performance was assessed using standard statistical indicators (MAE, MAPE, MSE, RMSE, and R2), whereas XAI, i.e., SHAP and PDP analyses, were employed to improve interpretability and quantify parameter influence. The step-by-step methodology shown in this study is outlined in Figure 1.
Novelties of the present study are as follows: (1) this is the first study to apply SMA as a structural rehabilitation material specifically to severely corroded RC box culverts, evaluated for four strengthening configurations. (2) An integrated FEM–ML–XAI framework is developed and applied to this unique problem. (3) Five regression algorithms are compared for culvert capacity prediction, with quantitative evaluation metrics and feature importance analysis, which provides predictive accuracy and physical insight into the governing parameters.

2. Materials and Methods

2.1. Geometric Description of Model

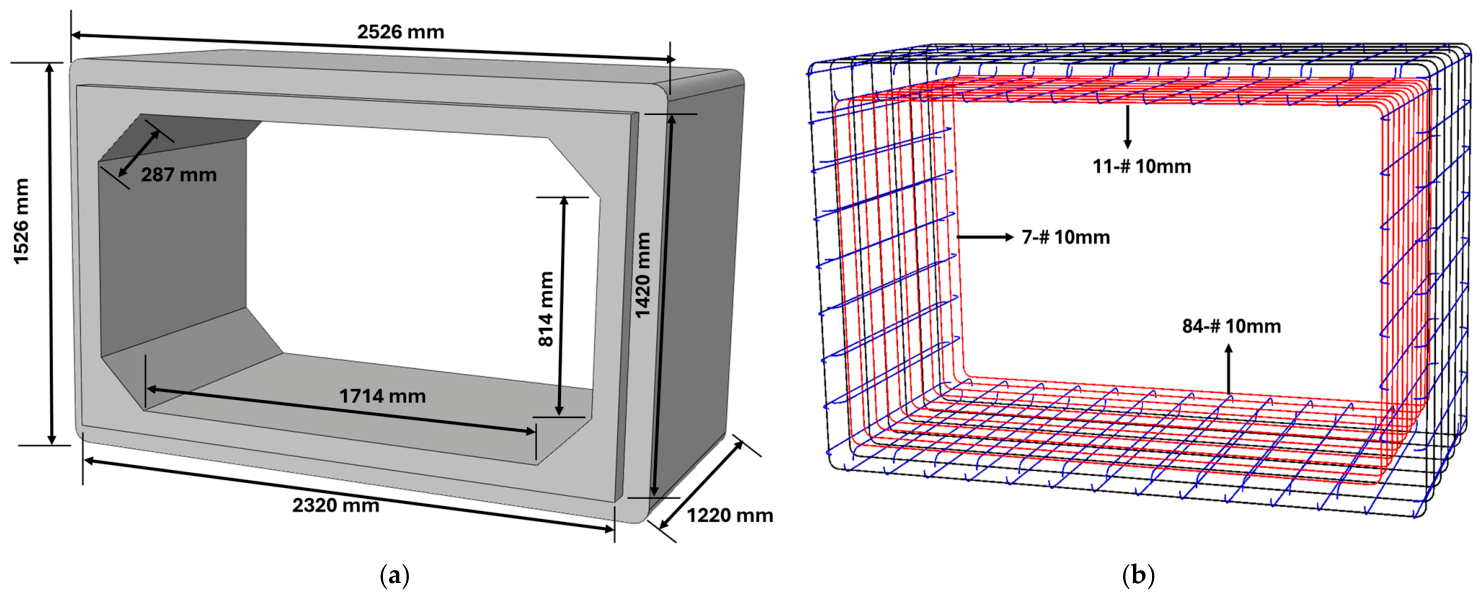
The FEM model in CAE Abaqus 2024 was created on the basis of experimental work by Maximos et al. [9]. The single-cell precast RC box culvert’s sections and their reinforcements were defined as per ASTM C1577-20E01 [45]. A reinforcement cage was designed using steel bars of 10 mm diameter, placed uniformly in both directions. Figure 2a represents the external geometry, while Figure 2b depicts the internal reinforcement layout.

2.2. Constitutive Modeling of Concrete and Steel Reinforcement

The Concrete Damaged Plasticity (CDP) model in ABAQUS was used to represent the nonlinear behavior of concrete under combined compressive crushing and tensile cracking. The model is formulated within a continuum plasticity framework with isotropic damaged elasticity and adopts a non-associated flow rule to realistically capture volumetric dilation under compressive loading [46].
The plastic flow potential is defined using a Drucker–Prager-type hyperbolic function:
G = ( ε t a n ψ ) 2 + q ¯ 2 − p ¯ t a n   ψ
where ψ is the dilation angle, ε is the flow eccentricity, q ¯ is the Mises equivalent stress, and p ¯ is the hydrostatic pressure.
Concrete yielding is governed by the modified Lubliner yield surface, expressed as
F = 1 1 − α ( q ¯ − 3 α p ¯ + β ⟨ σ ¯ m a x ⟩ − γ ⟨ − σ ¯ m a x ⟩ ) − σ ¯ c = 0
where the parameters α , β , and γ control the shape of the yield surface and depend on the biaxial-to-uniaxial compressive strength ratio σ b 0 σ c 0 and the meridian ratio K c .
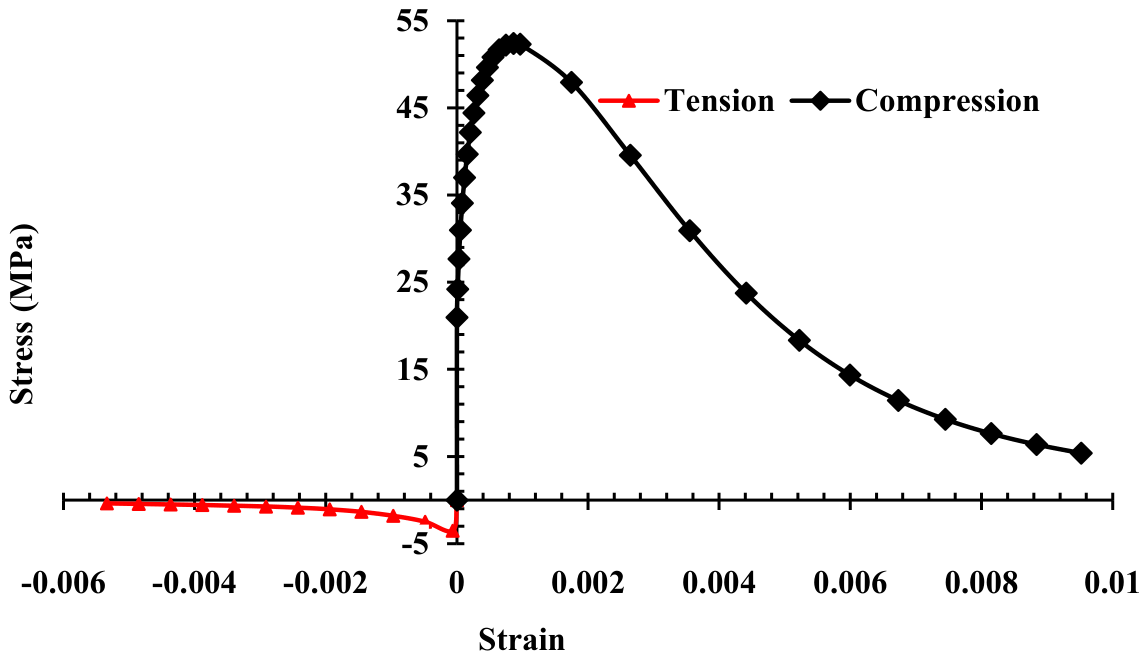
The CDP parameters were calibrated using separate uniaxial compression and uniaxial tension simulations. Compression calibration focused on matching the stress–strain response, peak strength, and post-peak softening, while tension calibration ensured accurate representation of cracking initiation and tensile softening behavior. A small viscosity parameter was incorporated to improve convergence properties. The calibrated CDP model was able to capture compressive crushing and tensile cracking damage successfully and was employed in the simulations of all the structural analyses [47].
Within the context of the CDP, tensile damage and compressive damage occur independently through the use of damage scalars, d t for tensile damage and d c for compressive damage, to account for the reductions in the elasticity stiffness because of cracking and crushing, respectively. While the tensile damage parameter d t characterizes the progression of damage following the initiation of cracking, the compressive damage parameter d c characterizes the reductions in the elasticity stiffness for the post-peak response for the crushed material under compressive load. Both d t and d c vary between 0 for undamaged material to 1 for fully damaged material, and they are defined by the respective equivalent plastic strains in the material. Corresponding damage variables ( d t , d c ) degrade the effective stiffness of the material as follows [48]:
σ = ( 1 − d ) D o ( ε − ε ~ p l )
d = 1 − σ σ c u   o r   σ t 0
where D 0 is the undamaged stiffness matrix of the material, ε is the total strain tensor, and ε ~ p l is the plastic strain part. Damage values vary between 0 (undamaged material) and 1 (completely degraded). Table 1 lists the material parameters used in the simulations, and Figure 3 displays the stress–strain curves under compressive and tensile loads.
Based on sensitivity analysis and preliminary numerical investigations, the primary CDP parameters governing concrete behavior were identified as the dilation angle ψ , flow eccentricity ε , and biaxial-to-uniaxial compressive strength ratio σ b 0 / σ c 0 . The viscosity parameter ( μ ) was assigned a small value to aid numerical convergence, while K c was kept constant due to its limited influence on the response under the investigated loading conditions. The values for these parameters in this study were taken from previously published research [49,50] and then adjusted to fit the behavior of the model. Table 2 provides an overview of the chosen CDP flow parameters.
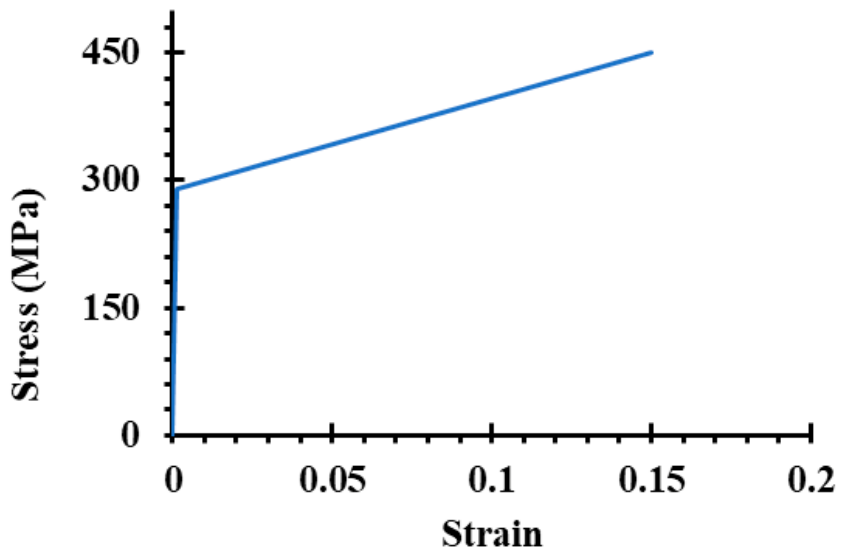
The reinforcement steel was represented using an elastic-plastic material model, which accounts for both the initial linear-elastic response and the plastic behavior beyond yielding. The model was described using the elastic modulus and a hardening slope to account for the post-yield stiffness. The constitutive law used was a bilinear stress–strain relation, as shown in Figure 4, which represents the behavior of the steel used in the concrete.

2.3. Constitutive Modeling of SMA

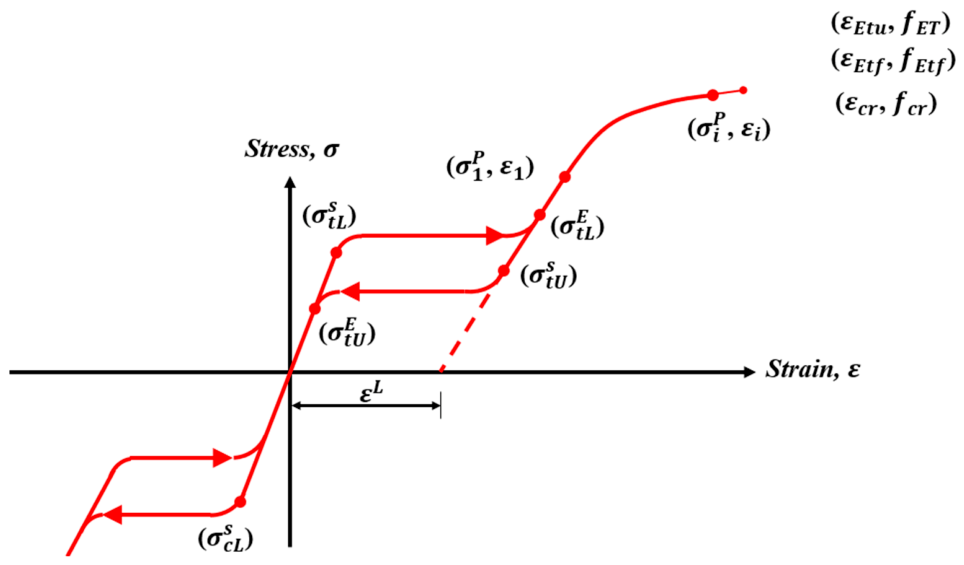
SMA was modeled in Abaqus using the built-in super-elasticity material model, capable of reproducing the distinctive phase-transformation behavior of such alloys, as represented in Figure 5. This constitutive model was initially developed based on the works of Auricchio and Taylor [51] and has been verified and widely implemented by researchers, such as Higazey et al. [52], Pavia et al. [53], and Shrestha et al. [54]. For the present study, the model parameters were taken from experimental cyclic loading data reported for NiTi SMAs in the literature [55].
Key input properties included the forward and reverse transformation stresses, the maximum recoverable transformation strain, and the elastic moduli of the austenitic and martensitic phases, along with Poisson’s ratios, as summarized in Table 3. To capture the post-elastic response, two points on the stress–strain curve were specified: ε 1 = 0.125 at σ 1 = 1100 MPa and ε 2 = 0.25 at σ 2 = 2707 MPa. Although these points do not influence the tensile martensitic transformation, they were incorporated to more accurately represent the compressive behavior, since Abaqus derives compressive response from the tensile response through the volumetric strain value ε V L .

2.4. Modeling of Corrosion and SMA-Based Rehabilitation

The RC culverts exposed to aggressive environments are vulnerable to progressive corrosion attacks, resulting in the degradation of material integrity and capacity with time [56]. Other studies have shown that the corrosion-induced degradation may result in negligible damage in the initial operational periods or extensive damage after extended periods. Corrosion in box culverts is most reactive to the tensile part of the top slab. Therefore, the current study solely focuses on the damage to the susceptible zone, ignoring the reinforcement in the compression regions due to the relatively low susceptibility to corrosion damage [57].
To model corrosion in an efficient and computationally effective way, it is assumed that the degradation of the structure is represented by a reduction in the thickness of the bottom part of the top slab. This model effectively represents the effect of the degradation of the concrete itself and the corrosion of steel reinforcements. This model is commonly used because of the inherent simplifications of the processes taking place, and can effectively model the effects of degradation on the structural properties of the structure. Also, it is assumed that the structure is able to continue to perform its function until there is substantial degradation, at which point a loss of stiffness and load-carrying capacity is experienced.
To conduct this research, a severe corrosion scenario was modeled by reducing the thickness of the top slab by 20 mm, signifying an advanced stage of deterioration, which is quite common in culverts nearing the end of their lifespan due to corrosion. It is acknowledged that real-world corrosion involves reinforcement bar cross-sectional loss, corrosion product expansion, concrete cover cracking, and bond degradation between steel and concrete. The present simplified model is a surrogate that captures the net effect of section loss on structural capacity without explicitly resolving each sub-mechanism. Moreover, it allows a numerically manageable parametric study over 314 data points needed for ML training and isolates the effect of the corroded zone on load-carrying capacity without introducing additional material uncertainty parameters that are difficult to quantify without experimental calibration.
SMA was used on the culvert structure with various levels of strengthening upon the initiation of damage due to corrosion to test their effectiveness as a means of rehabilitation. The SMA members were represented with the ability to offer active confinement, facilitating stress redistribution to enable recovery in stiffness, strength capacity, and post-peak behavior. The approach used in this study appropriately identifies the deterioration resulting from corrosion and the subsequent restoration accomplished by SMA rehabilitation. The approach is realistic, reflecting deterioration levels in actual structures, and facilitates a realistic numerical analysis platform to assess SMA rehabilitation strategies in corroded culverts.

2.5. Interactions, Boundary Conditions, and Mesh

The embedded region in FEM was used to model the interaction between concrete and reinforcing steel, where the reinforcement cage was embedded within the host concrete region. A perfect bond was assumed, i.e., the steel reinforcement deforms compatibly with the surrounding concrete. Additionally, this removes mesh incompatibility problems, which are common in discrete or smeared reinforcement models, and aids in the independent assessment of steel and concrete. The same perfect bond was also assumed for the concrete–SMA interface, as adopted in the literature [20]. The interface failure was represented by crack formation and cracking in the concrete near the interface.
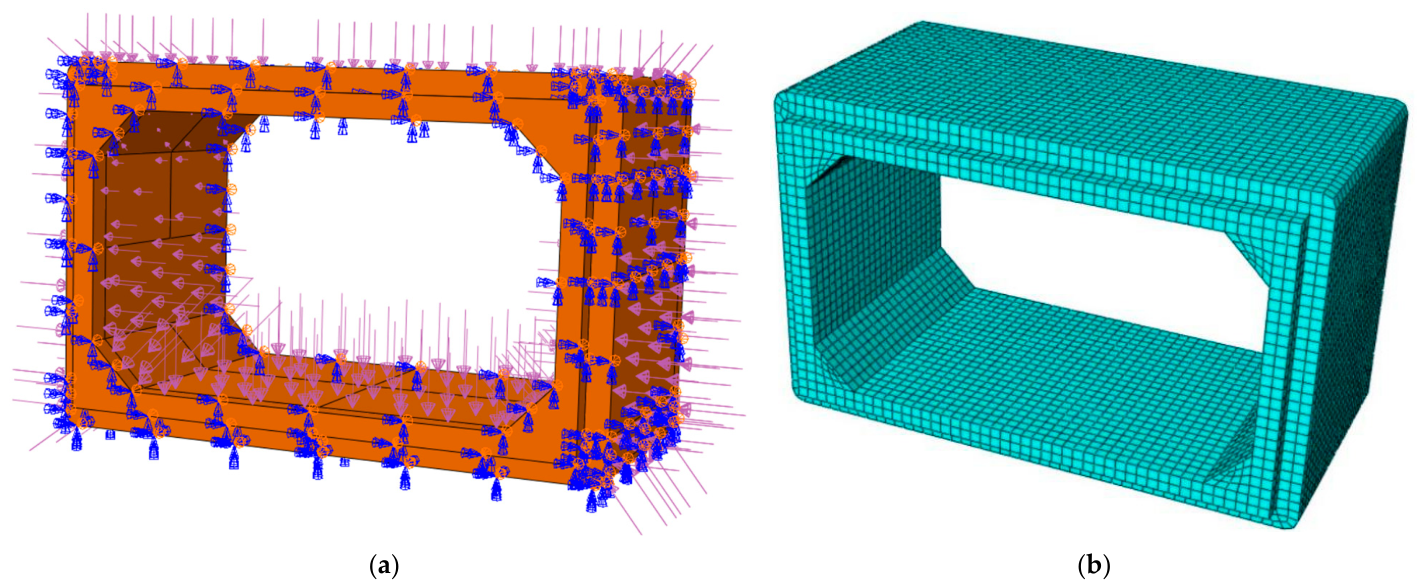
The base was completely constrained to mimic a hard foundation in order to reproduce field circumstances. Various load situations were applied, including a 15 mm displacement-controlled load applied to the top slab’s centroid. Lateral earth pressure, internal water pressure, and exterior pore water pressure are additional load scenarios. To include surcharge effects, a soil cover of 300 m and an asphalt layer of 75 mm were modeled on the top slab of the culvert. These load values were adopted from [58]. Figure 6a illustrates the FE model with the applied boundary conditions.
Distinct element types are utilized in an FEM to model the behavior of concrete and steel rebars. Steel reinforcement was assigned T3D2 (3D, 2-node) truss elements, which efficiently simulate axial load transfer in slender members. Concrete was discretized using C3D8R (3D 8-node brick element with reduced integration and hourglass control) elements. This reduces computational cost and accurately captures the stress distribution in stress analysis. Figure 6b shows the mesh geometry of the model.
To ensure the reproducibility of the numerical model, all boundary conditions, element types, interaction definitions, and loading sequences are documented as follows. The base nodes of the culvert were fully restrained in all translational and rotational degrees of freedom (U1 = U2 = U3 = UR1 = UR2 = UR3 = 0) to represent a rigid foundation. The displacement-controlled load was applied incrementally through a reference point at the top slab centroid using Abaqus’ static, general step with automatic stabilization. All additional load cases (lateral earth pressure, internal and external pore water pressure, surcharge from soil and asphalt layers) were applied as surface tractions or body forces in the same load step, with their magnitudes derived from [58]. The embedded region constraint between reinforcement and concrete does not require explicit contact surface definitions; it enforces kinematic compatibility by interpolating rebar node displacements from surrounding concrete element nodes, which remains valid across all applied load combinations. The 50 mm mesh size selected through convergence analysis corresponds to a total of approximately [X] elements for concrete and [Y] truss elements for reinforcement (exact counts available from the authors upon request). This mesh density was verified to produce load–displacement predictions within 1.3% of experimental benchmark values and is consistent with mesh sizes reported in analogous RC culvert FEM studies.

3. Results and Discussion

3.1. Mesh Sensitivity Analysis and Model Validation

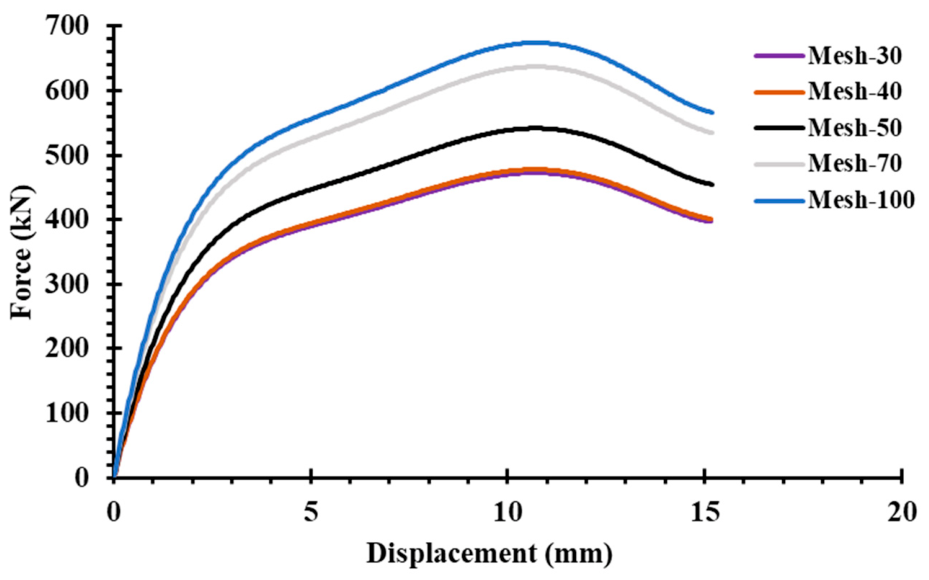
The FEM adopted in this study was validated using the experimental investigation reported by Maximos et al. [9], which investigated how reinforced concrete box culverts behaved structurally under monotonic loading. Cracking on the side walls’ negative-moment areas controlled failure in the experimental program, with the culvert reaching a yield load of 244.65 kN and an ultimate load of 515.37 kN. Although a complete force–displacement response was not reported in the experiment, these two key capacity points provide reliable benchmarks for numerical validation.
To ensure consistency with the experimental observations, the load–displacement response of the numerical model was monitored at the loading location for both concrete and reinforcement components. The same validated reference model was subsequently used as the baseline configuration for introducing corrosion damage and SMA strengthening in later stages of the study. This allows captured variance in structural responses to be exclusively ascribed to corrosion influence and SMA remediation actions, and not to discrepancies inherent in the models.
Mesh sensitivity analysis was performed with elements of 100 mm, 70 mm, 50 mm, 40 mm, and 30 mm for both steel and concrete parts. A mesh size of 50 mm offered a compromise that delivered accuracy close to the experimental capacity of yield and ultimate loads of 244.65 kN and 515.37 kN, respectively, as depicted in Figure 7. Mesh sizes smaller than 50 mm exhibited insignificant differences in results responses, thus confirming mesh convergence. The computational model was highly accurate with an approximate error of 1.3%, establishing the correctness and efficiency of the employed parameters.

3.2. Comparing the Reference Model with the SMA-Strengthened Model

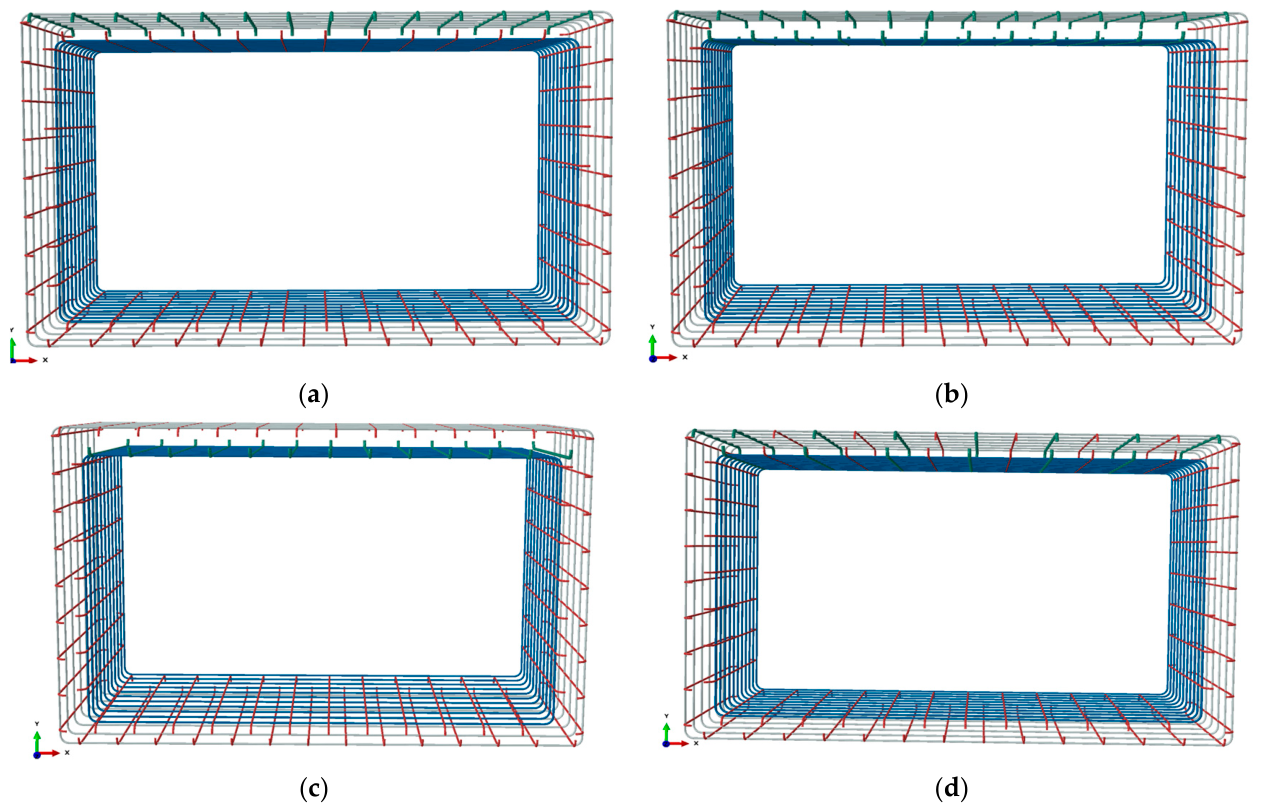
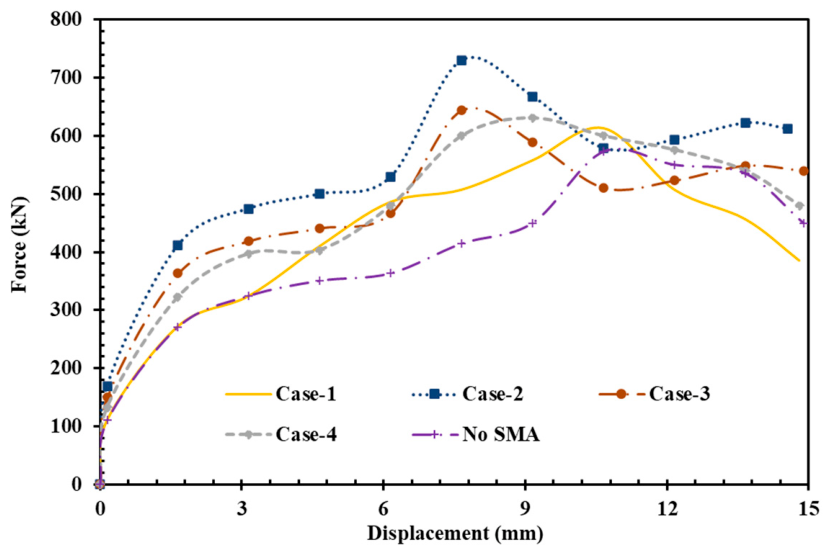
In this research, the damage was first initiated by reducing the thickness of the slab of the box culvert by 20 mm, simulating the serious damage condition. This corroded structure was then used as the baseline model for the performance comparison. SMA was later applied to the corroded culvert to study its performance as a repair material in various slab-strengthening cases. Figure 8 shows the different SMA-strengthened cases applied to the corroded culvert model. Figure 9 also provides the force-displacement curves for the corroded baseline model and the SMA-strengthened models. The reference model (No SMA) clearly provides a lower peak force value, accompanied by less stability in the post-peak region, indicating reduced stiffness and lack of ductility for the corroded structure. Premature failure is also accompanied by rapid loss of force, once the peak force is attained.
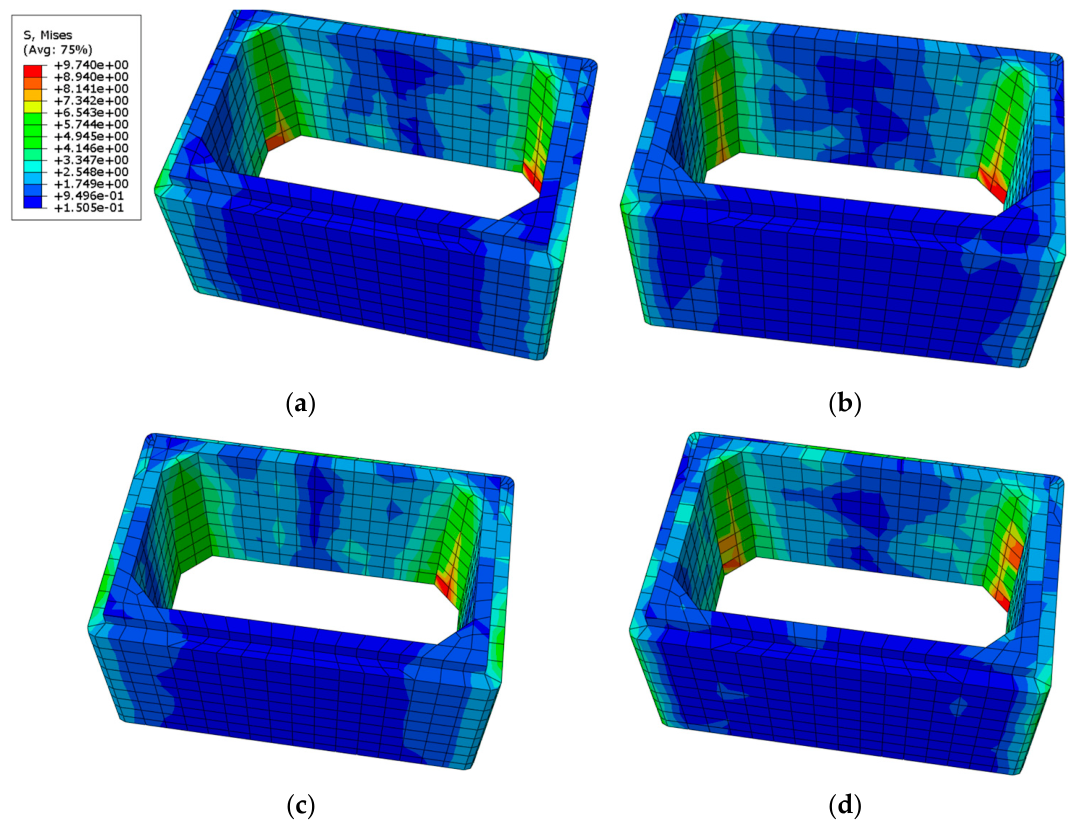
However, for all the SMA-strengthened models, larger force values and more stable post-peak responses have been noted. The culverts retrofitted with SMA resist larger displacements until failure, indicating improved energy-dissipation properties and slower development of damage. Among the various SMA models, Case-2 and Case-3 models provide larger force values, accompanied by stable post-peak softening responses. Patterns of failure, as shown in the figures that follow, are also evident in the stress contours shown in Figure 10. In the corroded model, high stress concentrations and failures occur at the junctions.
For SMA-strengthened models, the stress contours are more uniformly distributed, and the level of damage is less localized in nature. In Case-1, the effect is moderate, while in Case-2 and Case-3, stress distribution is apparent, and the stress concentration is reduced, thereby indicating stronger confinement and better structural integrity. In Case-4, the performance is also better than the reference model, although the stress is slightly higher than the optimal SMA model. Hence, SMA used on a severely corroded culvert is an effective means of restoring and upgrading the structural strength of the culvert. The addition of SMA to a culvert increases stiffness, supports a higher ultimate load, and prevents brittle failure. These findings clearly demonstrate that SMA is a feasible technique for repairing a corroded RC box culvert, especially when a considerable thickness of steel has been lost due to corrosion.
In order to normalize the effectiveness of SMA strengthening, a capacity index (CI) was adopted as the ratio of the ultimate capacity of the culvert strengthened with SMA to that of the corroded reference culvert, expressed as
C I = F u , SMA F u , Ref ; %   Increase = ( C I − 1 ) × 100
where F u , Ref = ultimate capacity of the corroded culvert (without SMA) and F u , SMA = ultimate capacity after SMA strengthening.
As can be seen in Table 4, all cases of SMA strengthening had a CI greater than one. The largest improvement was attained by Case-2 (CI = 1.28) among all cases of SMA strengthening. Cases 3 and 4 had a moderate improvement compared to the corroded culvert.

3.3. Statistical Analysis of Key Building Parameters

After selecting Case-2 as the best configuration, a total of 314 FEM-generated samples were developed to construct the machine learning dataset. The dataset was constructed by systematically varying the four input parameters, concrete compressive strength (Fc), culvert length (L), width (B), and depth (D), across their defined ranges, as listed in Table 5. The input variables were selected on the basis of their direct effects on the mechanisms of load transfer, stiffness distribution, and ultimate load-carrying capacity of the culvert structure. Each combination constituted one FEM run using the validated Abaqus model with the Case-2 SMA configuration applied to the corroded culvert. The output ultimate capacity (Fu) was recorded for each simulation. This process yielded 314 unique data points. The dataset was checked for outliers via the IQR criterion, and none were identified, which shows the deterministic nature of FEM outputs. No synthetic data augmentation or interpolation was applied; all data points correspond to explicit FEM simulations. The complete dataset was divided into 80% for training and 20% for testing to ensure an unbiased evaluation of model performance. The training subset was further utilized during model calibration and hyperparameter optimization to improve prediction stability and generalization. A full descriptive statistical analysis was carried out to evaluate the quality and statistical acceptability of the dataset. This is presented in Table 6.
The statistical values of the dataset include the mean, standard deviation, variance, skewness, and kurtosis. The statistical values were calculated for all input variables as well as the output variables. The results indicate a significant variability in the values of Fc and Fu. This is representative of the range of material strengths and structural capacities considered by finite element method (FEM) analyses. The geometric variables (L, B, and D) tend to have a relatively low variability. This is a confirmation that the values were maintained within controlled and reasonable limits. The statistical values confirm that the dataset is acceptably distributed, valid, and representative for a machine learning model. The reliability of the dataset is also confirmed by the observation that all values of skewness and kurtosis are within acceptable limits (±3 and ±10).

Correlation Matrix for Input Parameters

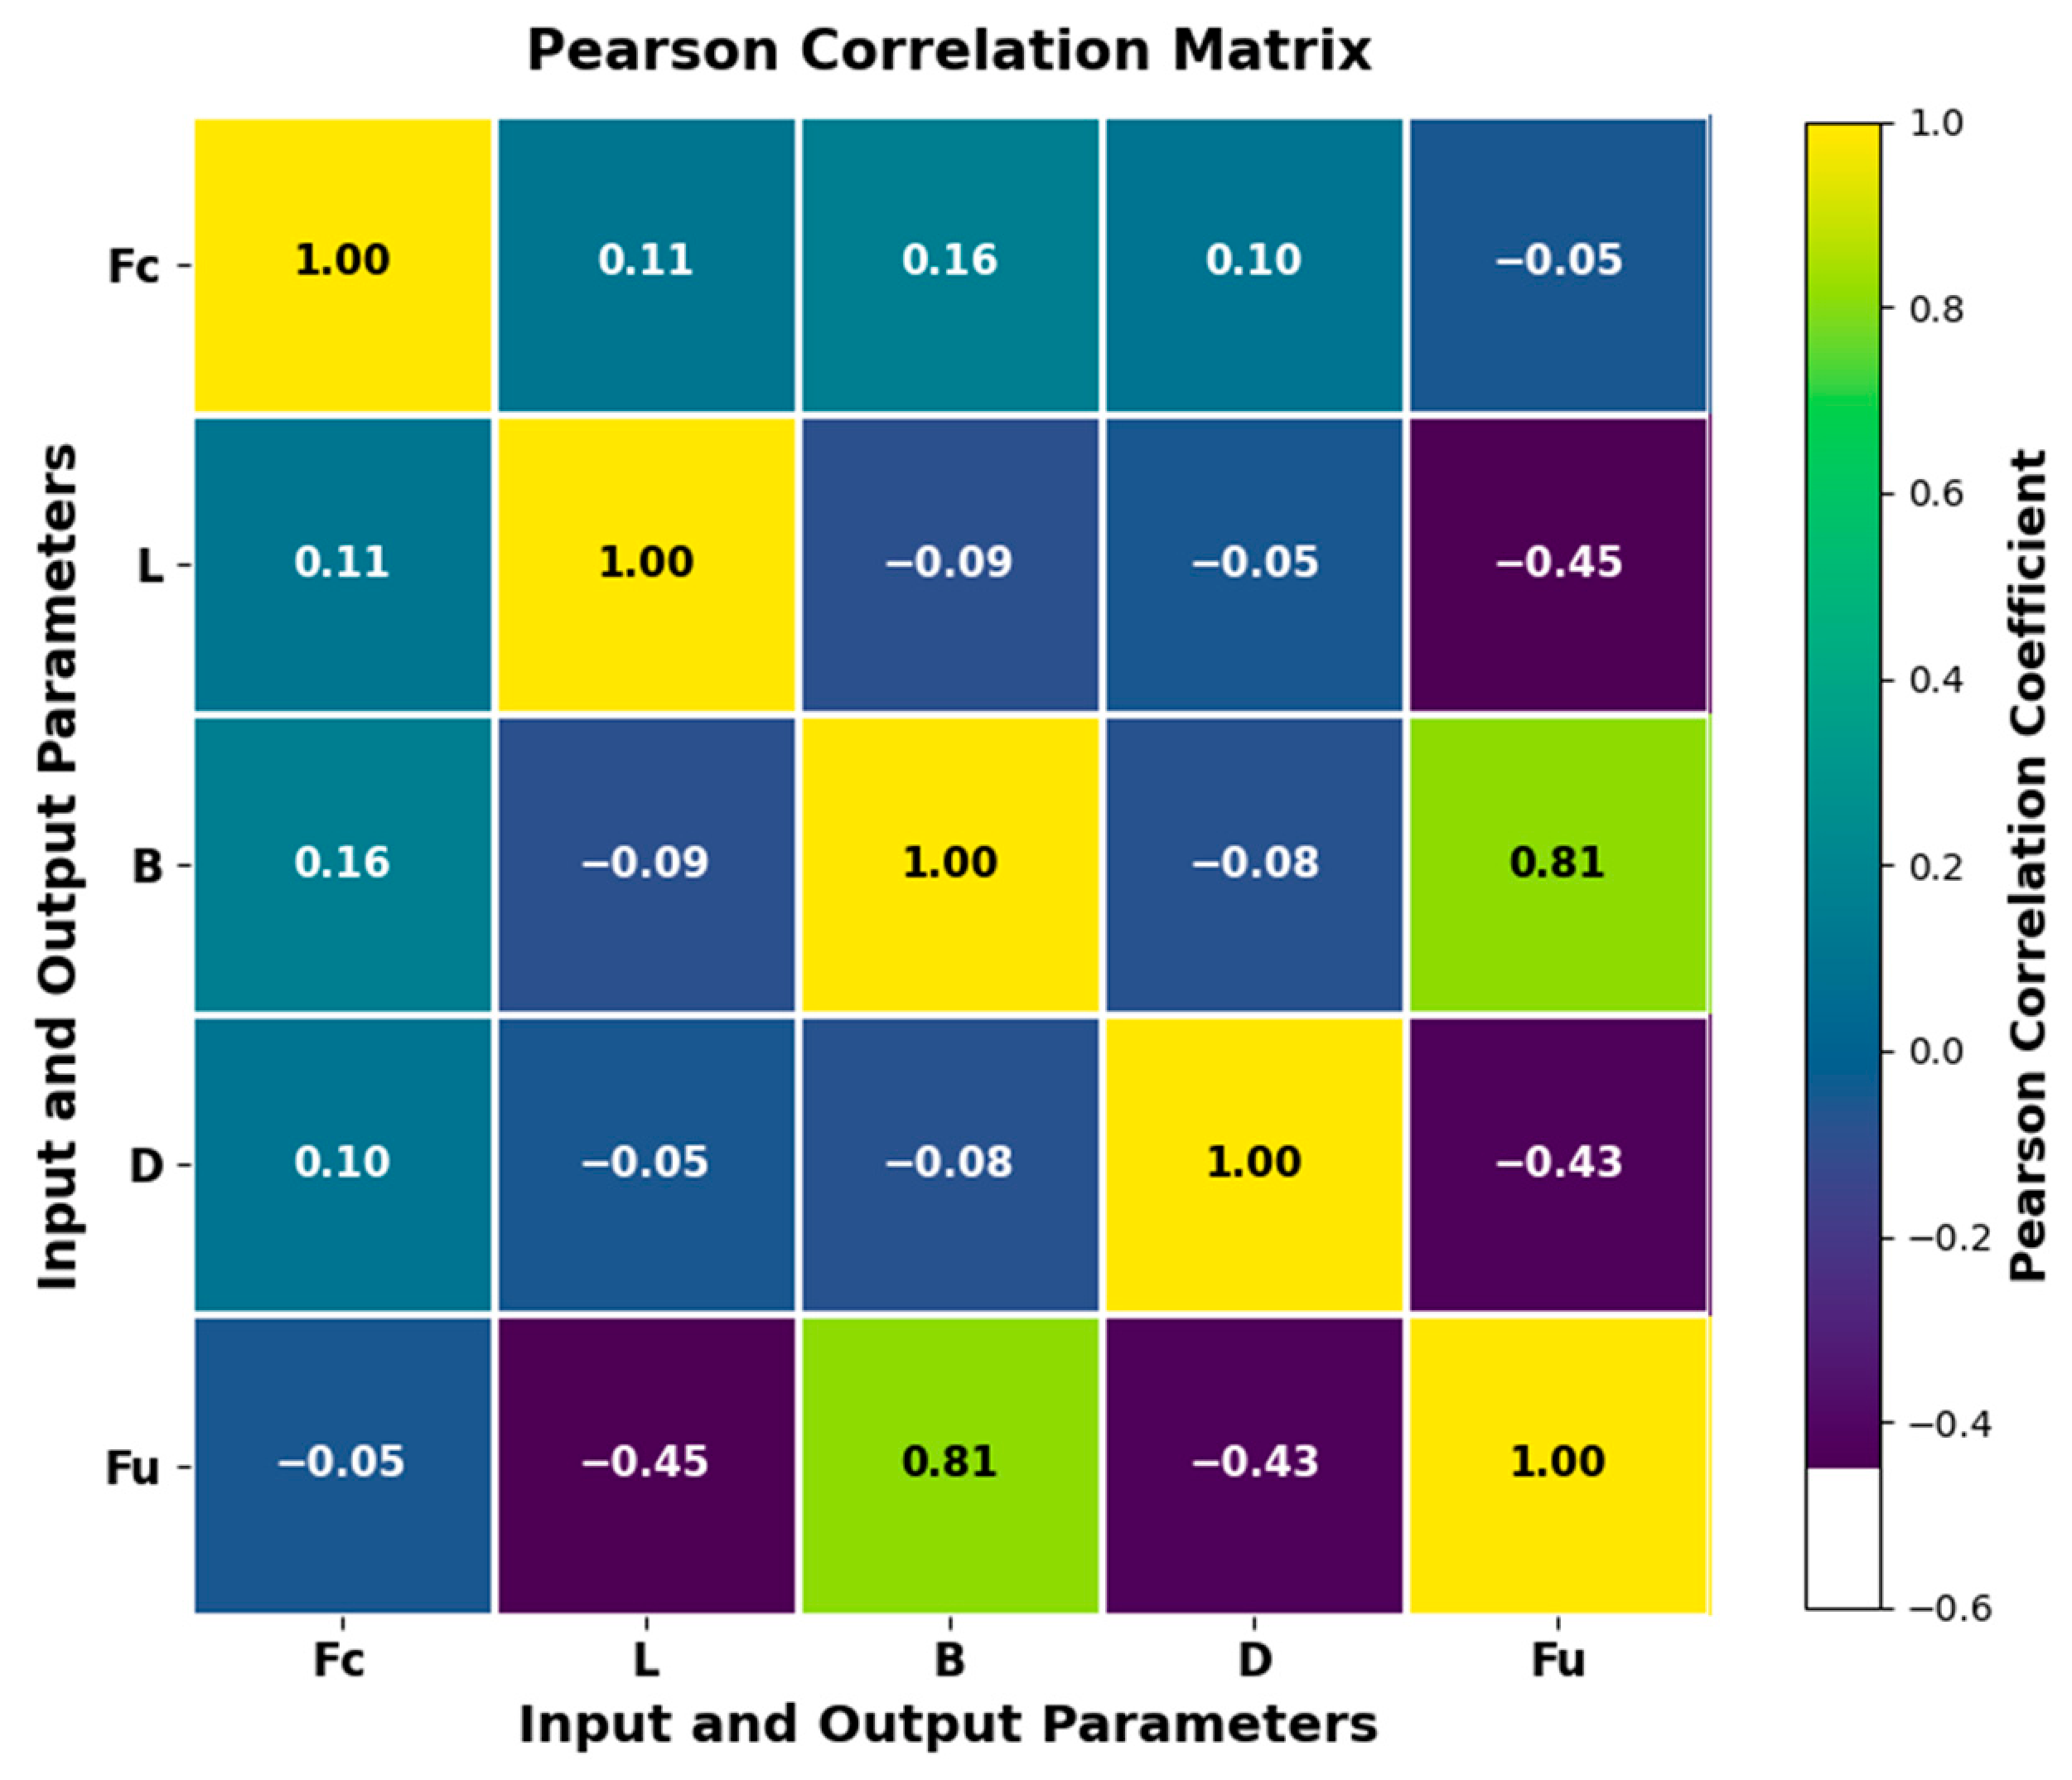
The linear correlation values of the identified input variables and the ultimate capacity of the box culvert (Fu) are presented through a Pearson correlation matrix in Figure 11. Most of the input variables have a moderate correlation value with the output, which implies that the response of the structure is influenced by a set of variables rather than a single one. The width of the culvert (B) displays a strong positive correlation with Fu (r = 0.81), indicating the importance of this parameter in improving the resistance to load. This is physically justified because the width of the culvert increases the load-bearing surface, leading to improved load distribution.
However, the length of the culvert (L) and the depth of the culvert (D) display moderate negative correlations with Fu (r = −0.45 and r = −0.43, respectively), indicating the potential deterioration of load-transfer efficiency or the increase in deformation under the same loading conditions. There is a weak negative correlation between Fu and the concrete strength of the culvert (Fc) (r = −0.05), indicating that, under the same conditions, the strength of the concrete does not directly influence the load-carrying capacity of the structure. The balanced correlation pattern between the variables supports the use of modern regression analysis techniques to model the complex relationship between the variables and the load-carrying capacity of the structure, as suggested in the literature [11,59].

3.4. Applied Machine Learning Techniques

This research uses significant material and physical attributes to predict the ultimate load-carrying capacity for box culverts based on multiple regression machine learning algorithms. These models have the ability to learn nonlinear and multi-variable patterns, which are known to occur in culverts under complicated loading situations. These models can be efficiently used for culvert capacity predictions because they can handle uncertainties in input variables, account for interaction between geometric and material attributes, and make robust predictions for a wide range of input situations. Also, the proposed approach combines both learning models for regression and ensemble models for robust predictions.

3.4.1. ANN

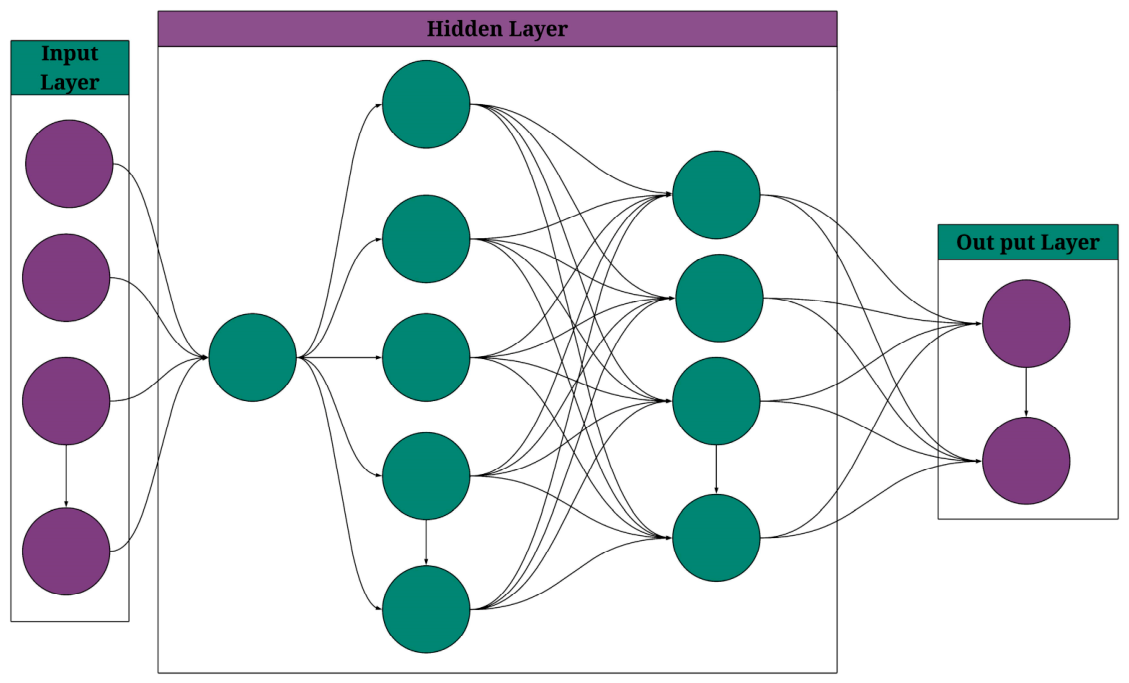
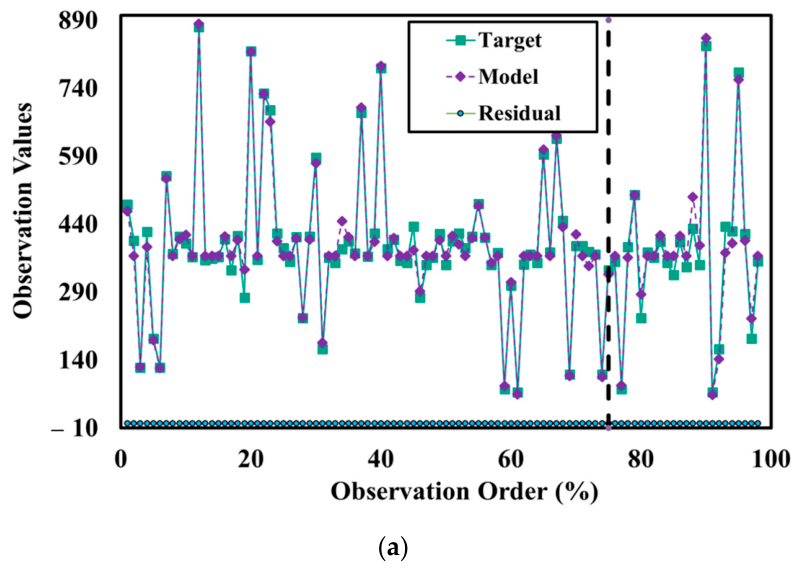
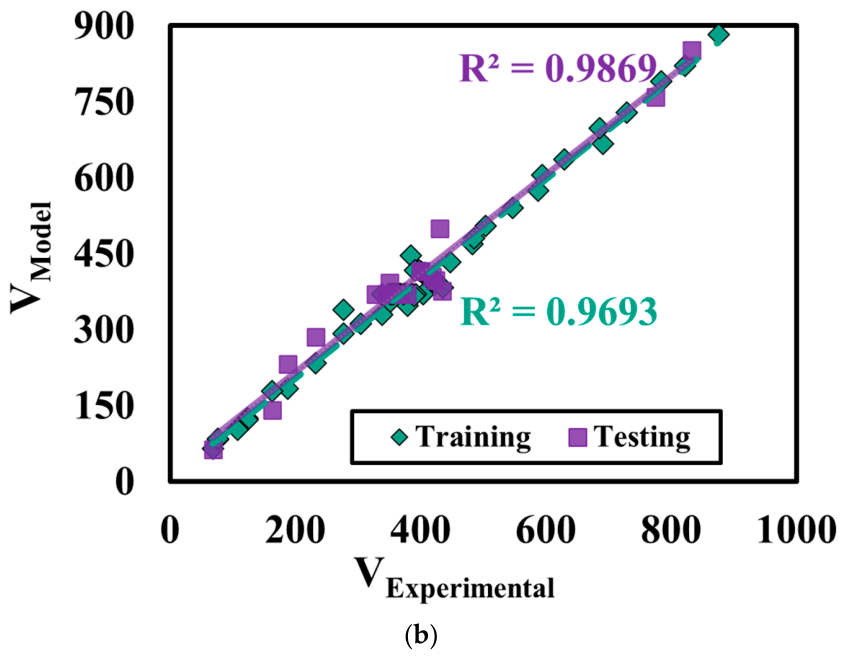
An ANN was employed to describe the nonlinear relationship between culvert variables and ultimate load-carrying capacity. This approach is particularly appropriate for regression analysis of structures because it is able to describe the complicated relationship between material properties and geometric variables without assuming any function forms. By learning from samples with interconnected nodes and weighted connections, this approach is able to describe the response behavior of the culvert system with great flexibility and accuracy. The flowchart of the ANN algorithm is shown in Figure 12. Figure 13 depicts the result of the ANN model performance.

3.4.2. Gradient Boosting Algorithm (GB)

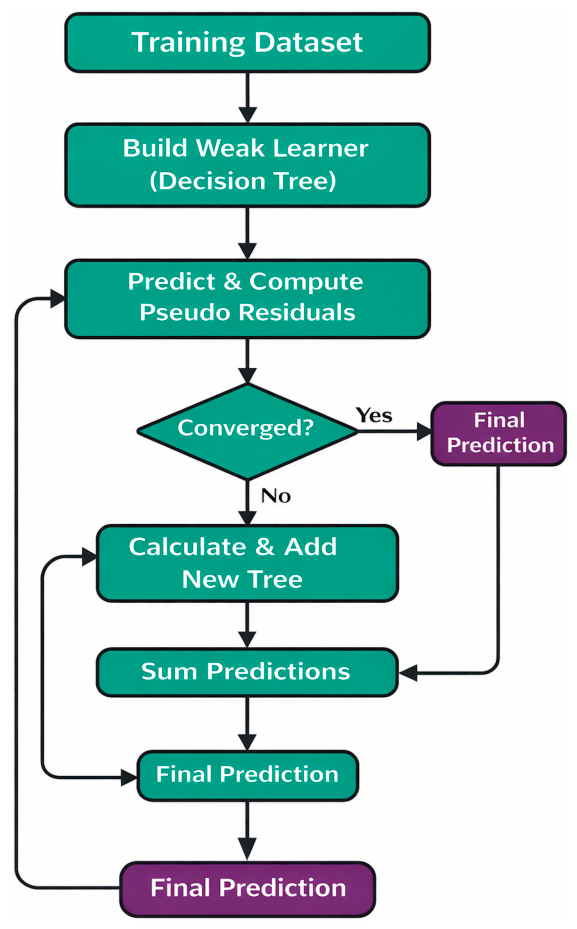
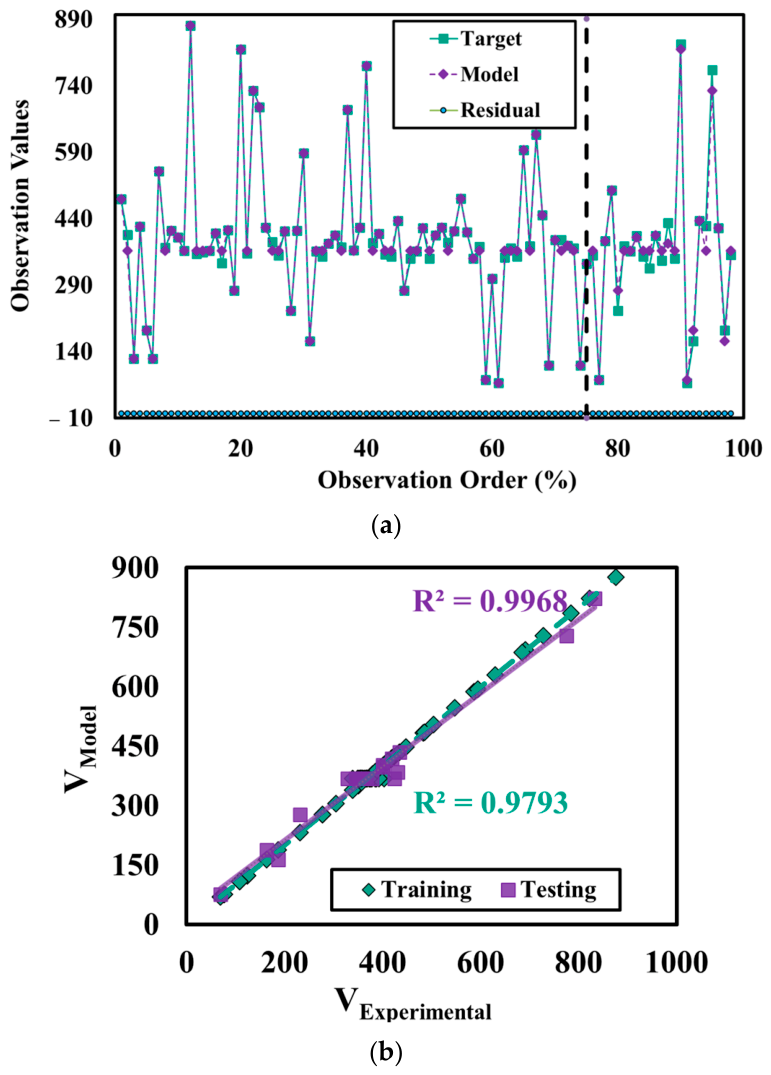
The GB regression method was used as a sequential ensemble method that continually improves the accuracy of predictions by correcting mistakes made by preceding models. This method is appropriate for structural regression problems because it is able to detect subtle nonlinear patterns and interactions between culvert geometry and material. The GB algorithm’s general procedure is depicted in Figure 14, and Figure 15 displays the fitting curve and matching scatter plot of the expected versus actual values.

3.4.3. K-Nearest Neighbor (KNN)

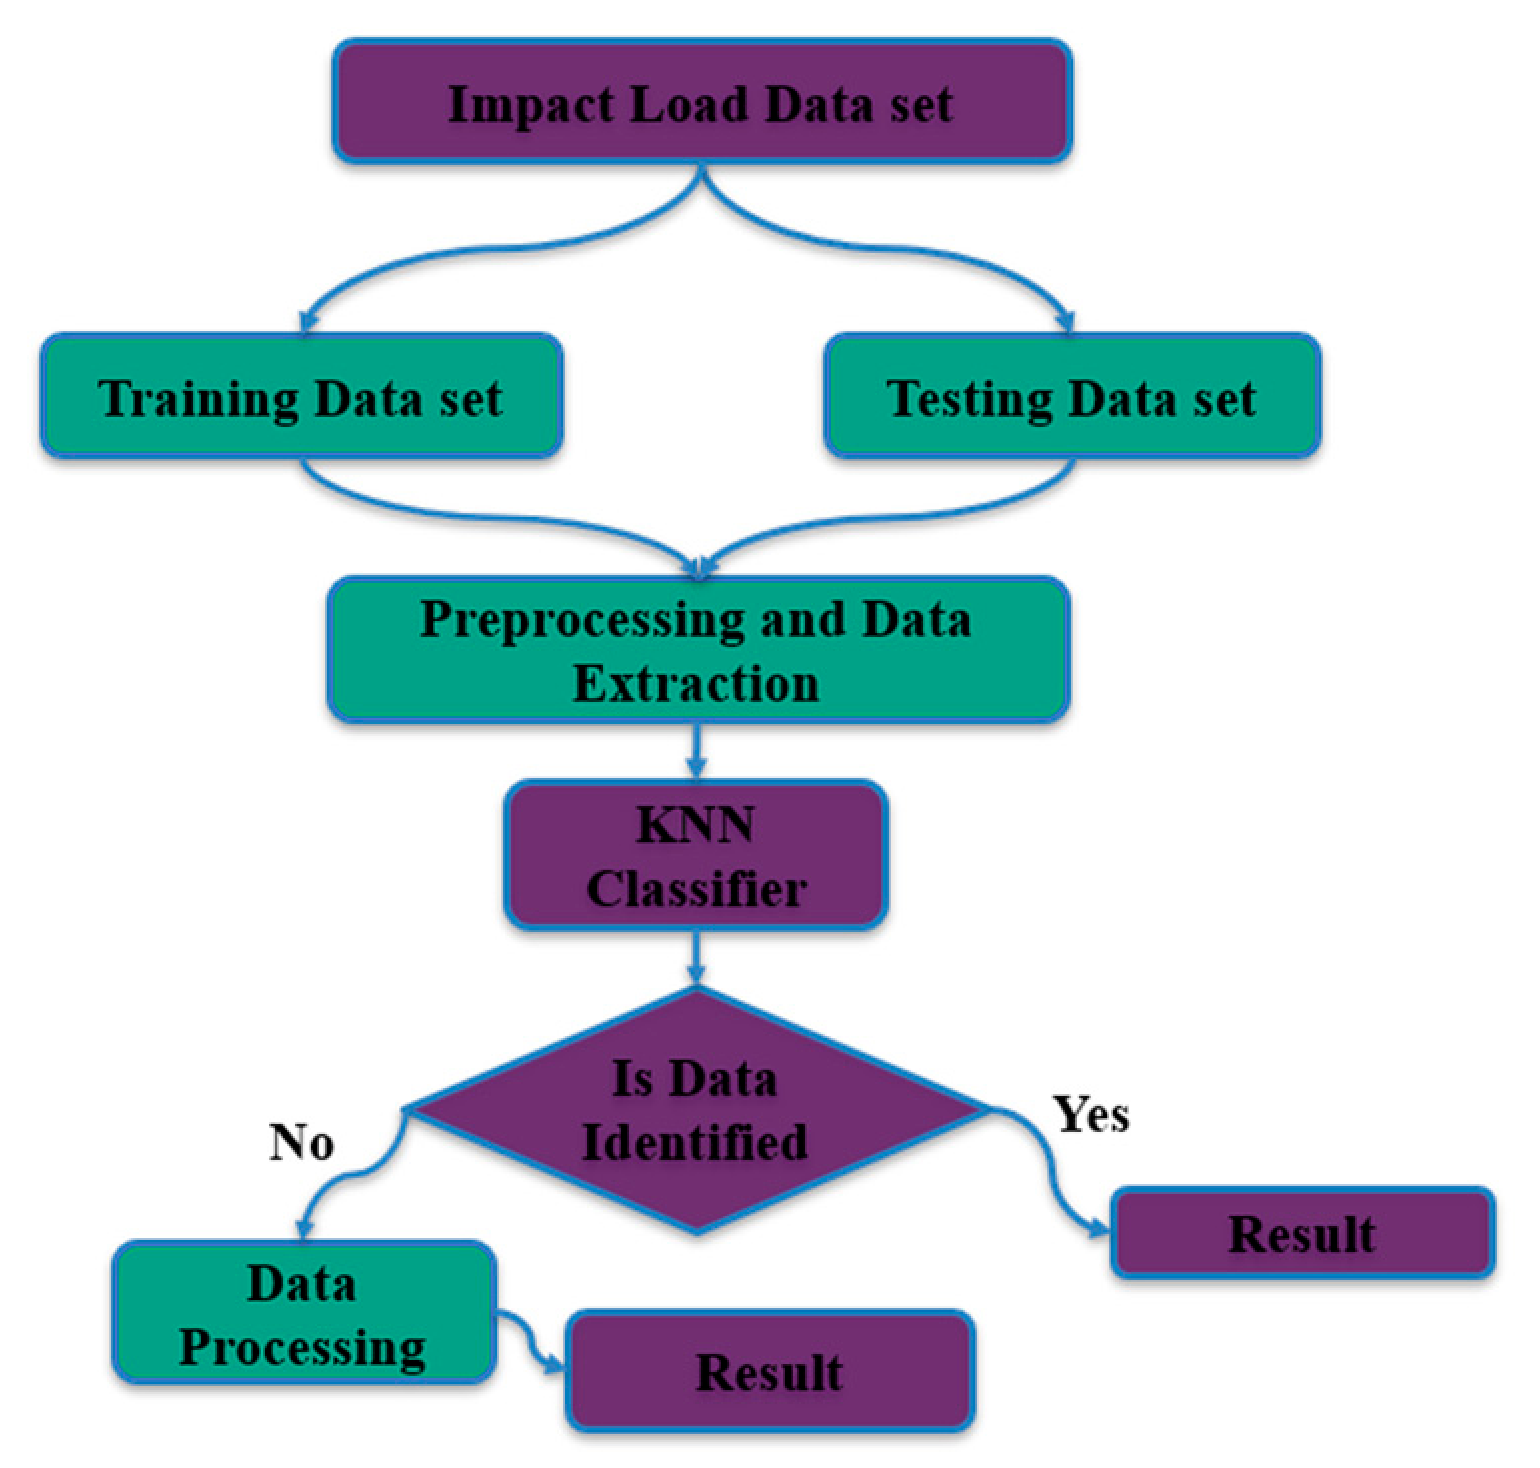
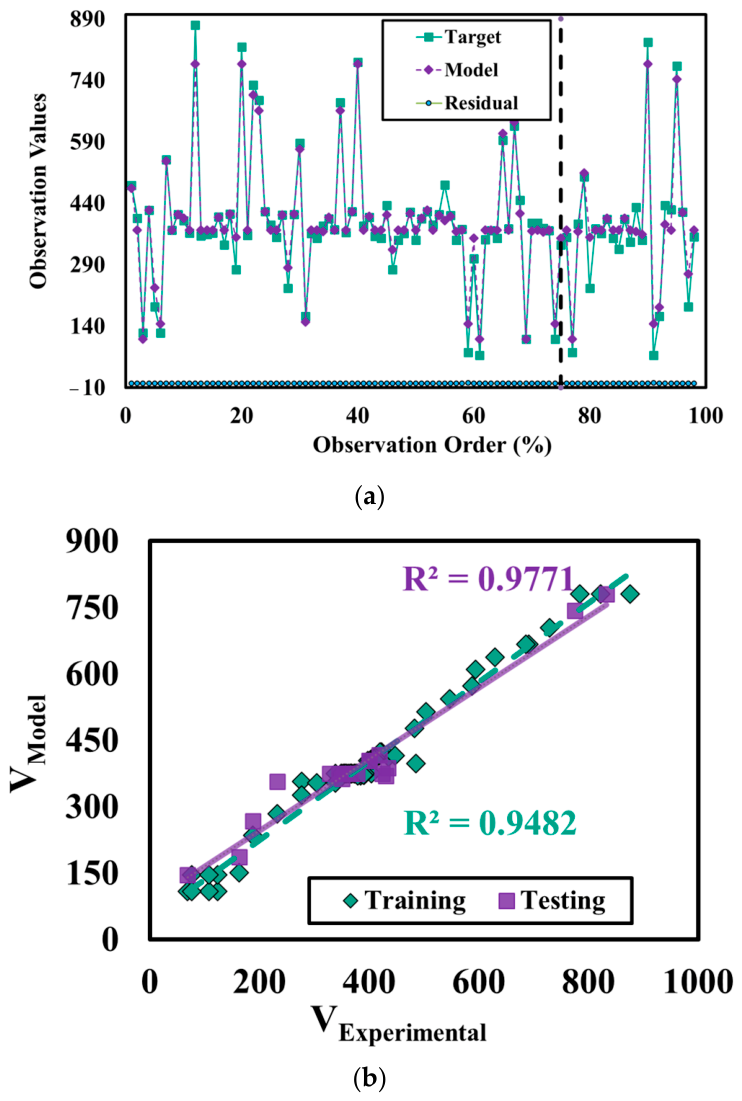
The KNN regression approach was adopted as a distance-based learning technique that predicts the output response by averaging the behavior of the most similar data points. This method is conceptually simple yet effective for capturing local patterns within the dataset, making it suitable for modeling culvert behavior where similar geometric configurations often exhibit comparable structural responses. Figure 16 depicts the KNN workflow, whereas Figure 17 shows scatter plots and model fitting.

3.4.4. Support Vector Based Regression (SVM)

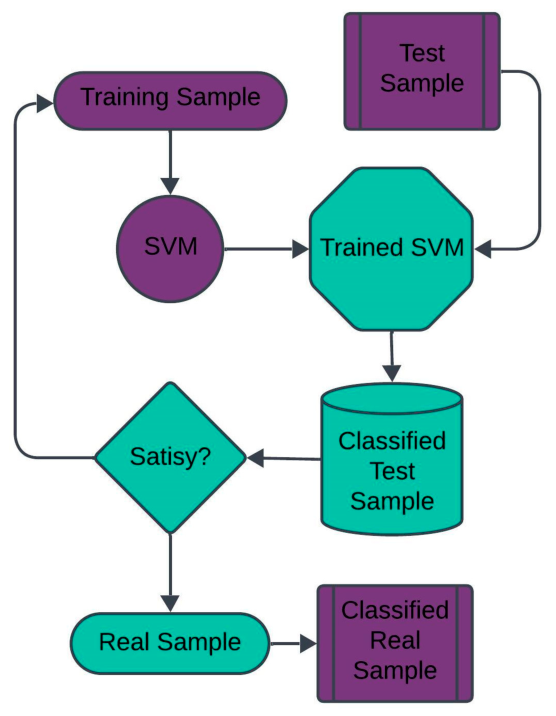
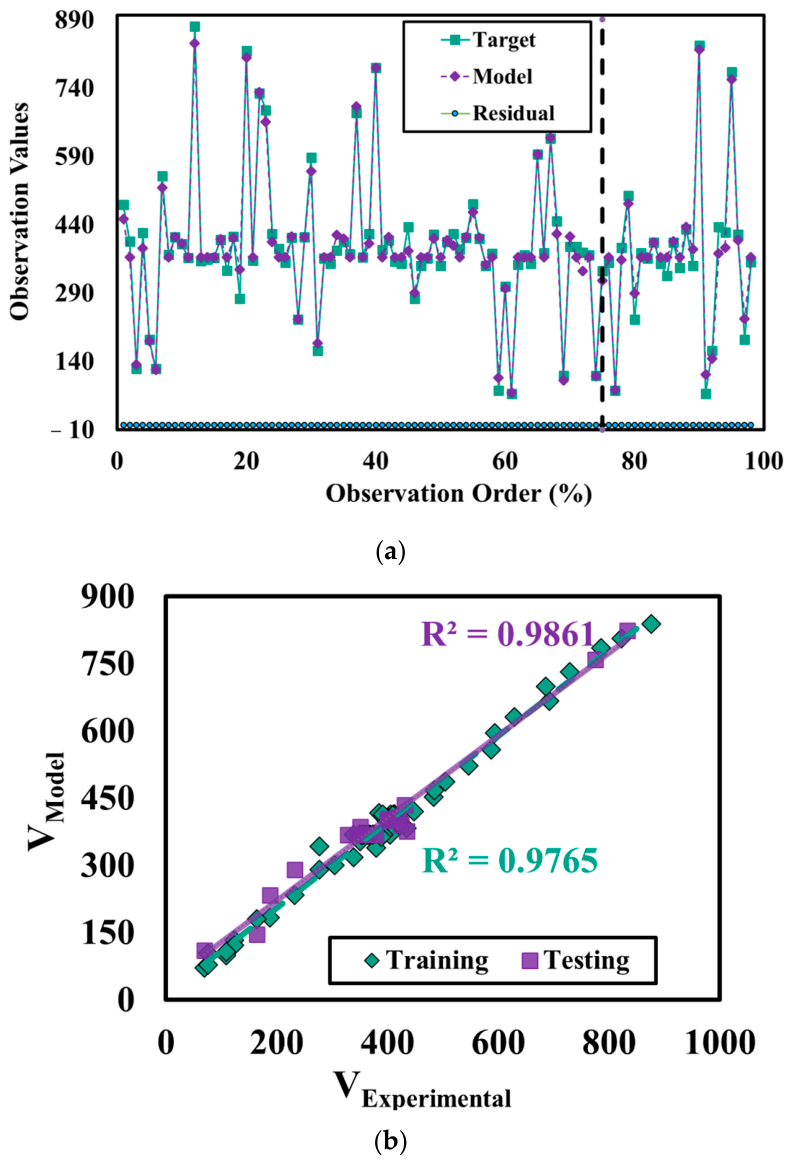
SVM regression was applied because it has a strong ability to tackle nonlinear relationships between input variables and structured response variables. This method builds an optimal boundary to minimize errors within a specified margin, making it very useful in engineering data where there are few data samples and complex variable relationships. Its ability to resist overfitting also makes it suitable for estimating culvert capacity, where variables interact to affect culvert performance. Figure 18 shows the SVM process, and Figure 19 shows the data plot and fitted curve.

3.4.5. Random Forests (RF)

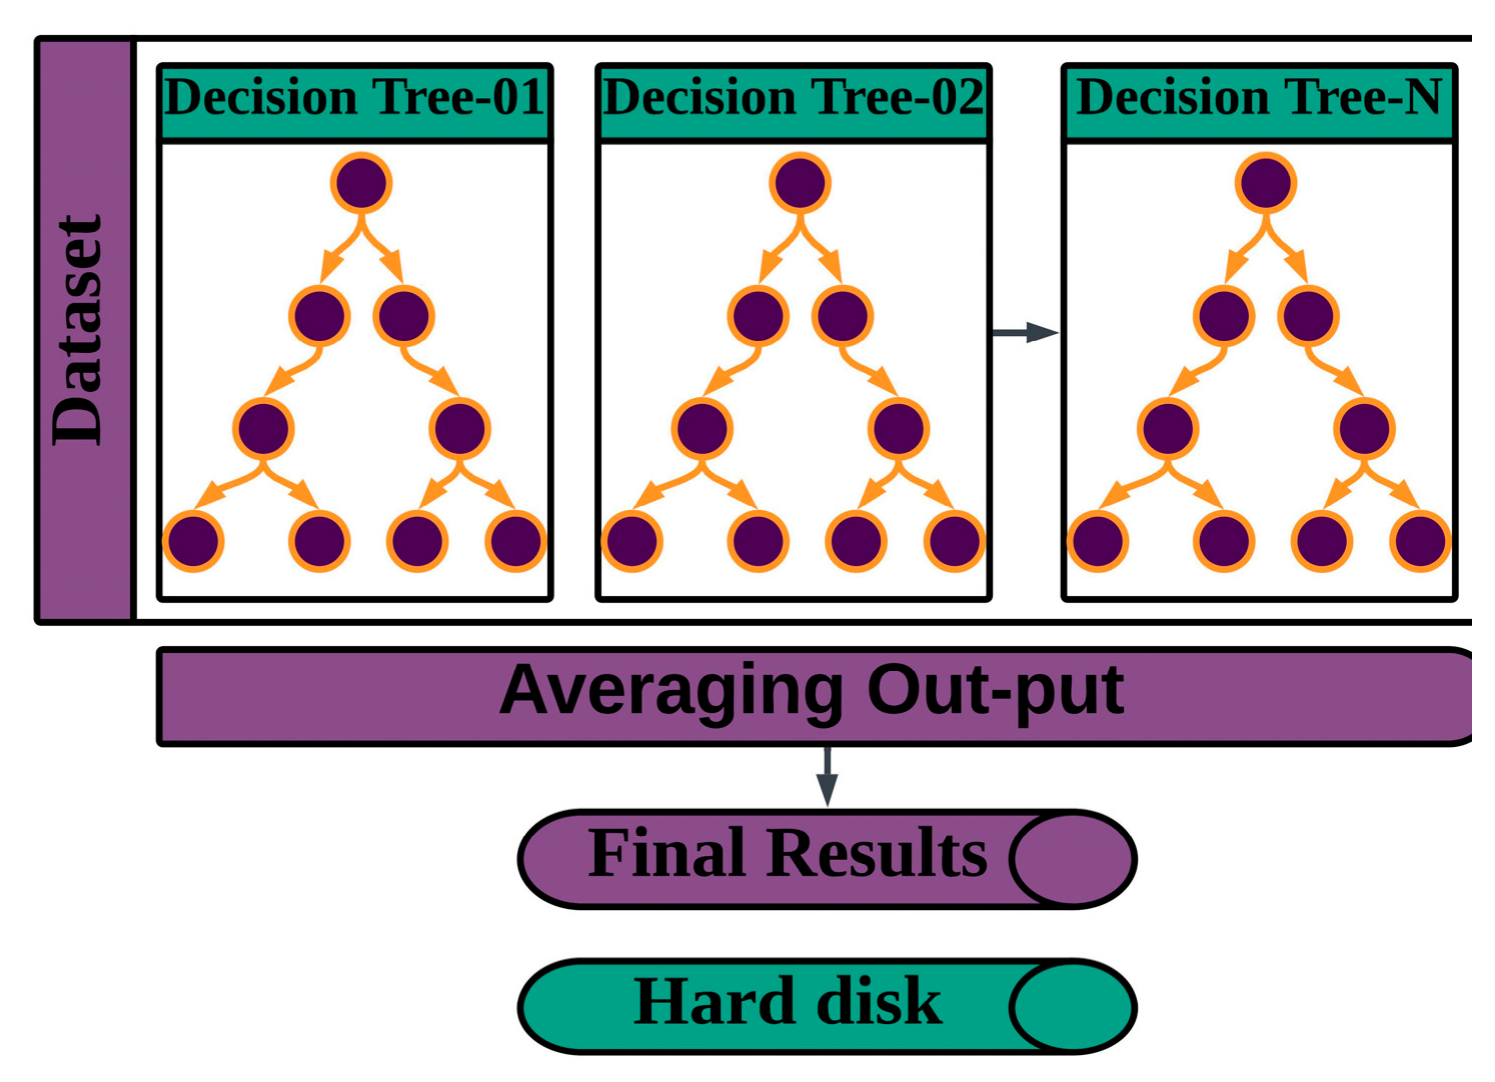
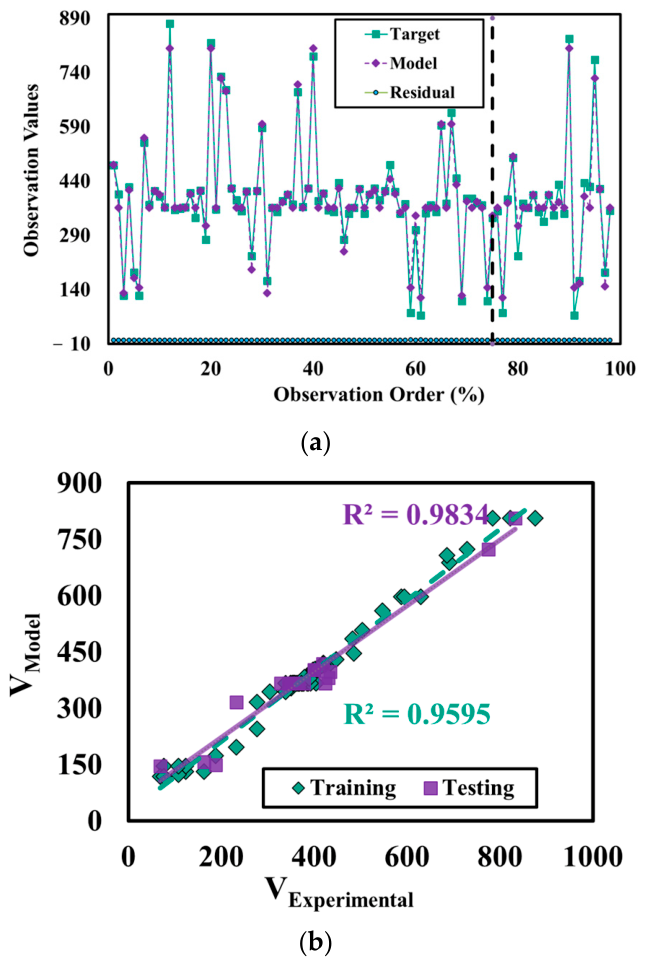
To improve the accuracy and stability of predictions, a number of decision trees were combined using a technique called RF Regression. This is a form of ensemble learning. The idea is that by combining the predictions of a number of models that were developed separately, the problem of variance can be reduced. This is particularly important in the case of culvert capacity predictions, where there are nonlinear relationships between the variables. The process followed by the RF is illustrated in Figure 20. The graphs are shown in Figure 21.

3.5. Statistical Evaluation of the Proposed Models

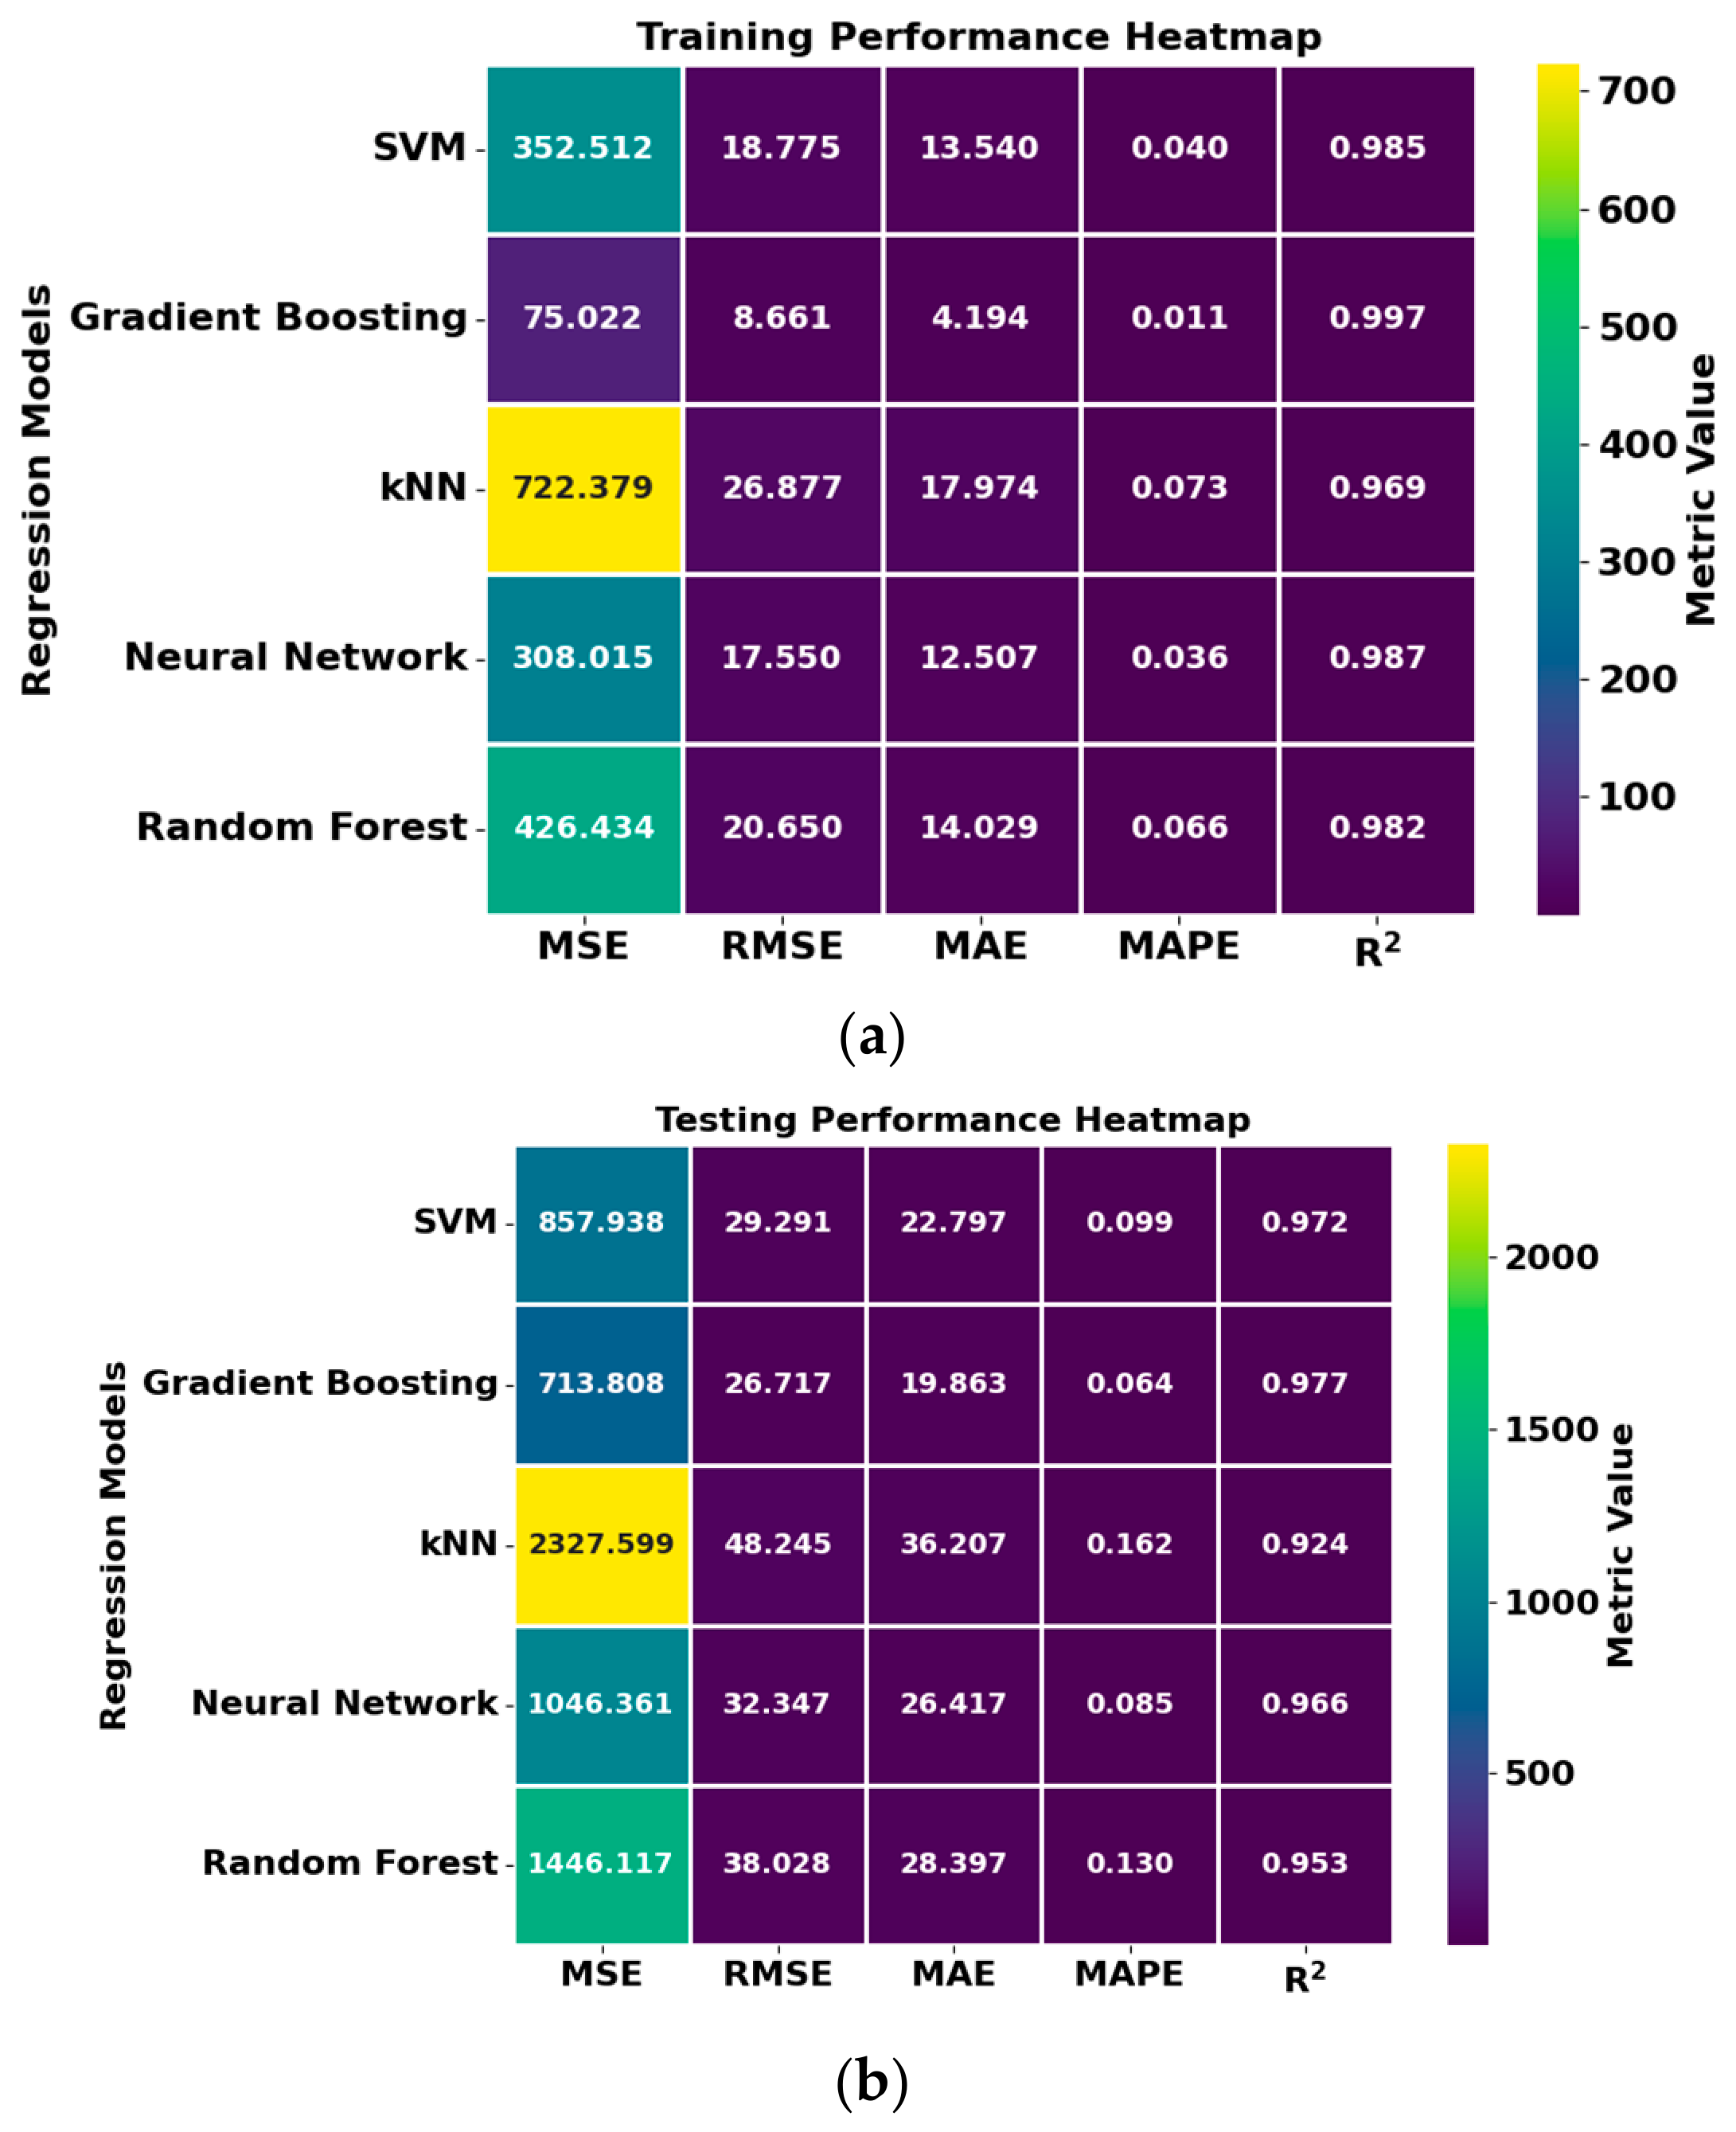
The predictive capability of these models has been measured using conventional statistical measures such as R2, MAE, RMSE, MSE, and MAPE on both training and testing datasets to analyze efficiency and generalization abilities. A model with high R2 and low error measures is more accurate and robust. The performance heatmap in Figure 22a highlights that each model performed well and learned efficiently with R2 measures above 0.96. Among these models, gradient boosting performed best regarding training accuracy, which is evident from low measures of MAE, RMSE, and MAPE. The other models performed well regarding efficiency, but with increased errors for KNN models, which are more susceptible to local variability in data. The performance heatmap in Figure 22b highlights the generalization abilities of models, where gradient boosting performed best regarding overall efficiency and robustness, with low measures of R2 and errors on testing datasets. ANN and SVM followed closely, showing stable and reliable predictions. In contrast, RF and KNN experienced noticeable increases in error magnitudes during testing, suggesting reduced robustness under varying geometric and material conditions.
Moreover, the ML models are trained on FEM-generated data, which are deterministic outputs of a calibrated numerical model rather than stochastic experimental measurements. This has two implications. First, the FEM model has approximation errors due to the simplified corrosion representation (uniform thickness reduction), the perfect bond assumption at the SMA–concrete interface, and the quasi-static loading. Hence, the models accurately predict the output of the FEM model within the trained parameter space, but their accuracy relative to real physical structures depends on how closely the FEM captures actual structural behavior. Second, because FEM outputs carry no measurement noise, ML models trained on such data tend to exhibit higher R2 and lower error metrics than would be observed if real experimental scatter were present in the training data. Deployment of these models to real structures would require recalibration or transfer learning with physical test data.

3.6. Explainable Artificial Intelligence

3.6.1. Shapely Additive Explanation

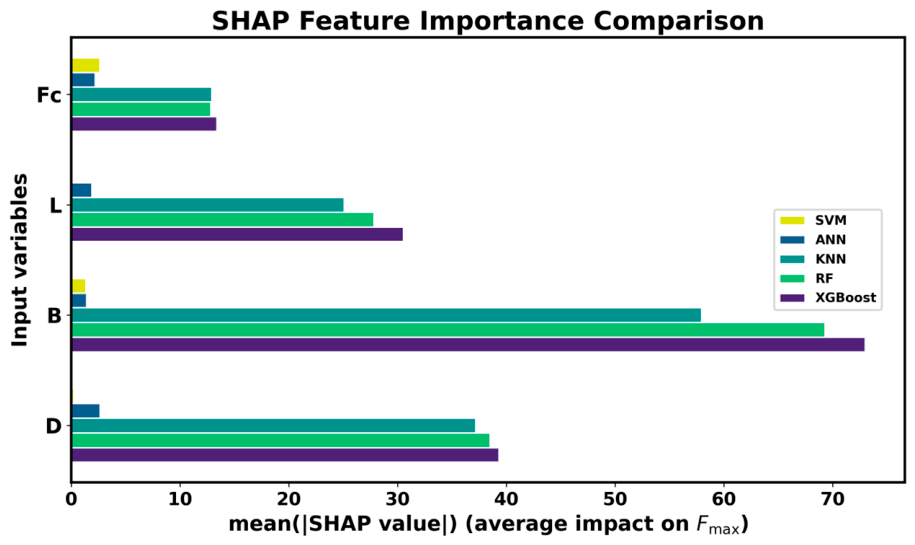
SHAP was used to determine the contribution of each input variable to the predictions of the model. SHAP analysis was carried out for all the identified regression models, allowing for a comparative evaluation of the contribution of the features. The use of SHAP analysis helps to improve the clarity of decision-making in the model and further strengthens the validity of the proposed models for the evaluation of culvert performance. Figure 23 above compares the mean SHAP values for all the models, representing the contribution of the input variables to the predictions of the ultimate capacity. In the various models, it was observed that culvert width (B) contributes the most to the determination of capacity, thus its significance in influencing the capacity of the structure. Additionally, depth (D) and length (L) of the structure offer a significant contribution, owing to the effects of deformation properties and structural performance.
Compressive strength of the concrete (Fc) is relatively less important but not of inconsequential significance, indicating that strength is a less important attribute compared to the geometric configuration in the capacities determined within the range of interest. Though the absolute values of attribute importance are different for different models, the relative ranking of the parameters is similar for different learning algorithms and is reliable and consistent. Ensemble methods and RF and GB models have placed greater emphasis on geometric parameters and are able to capture the nonlinear relationships between the parameters.
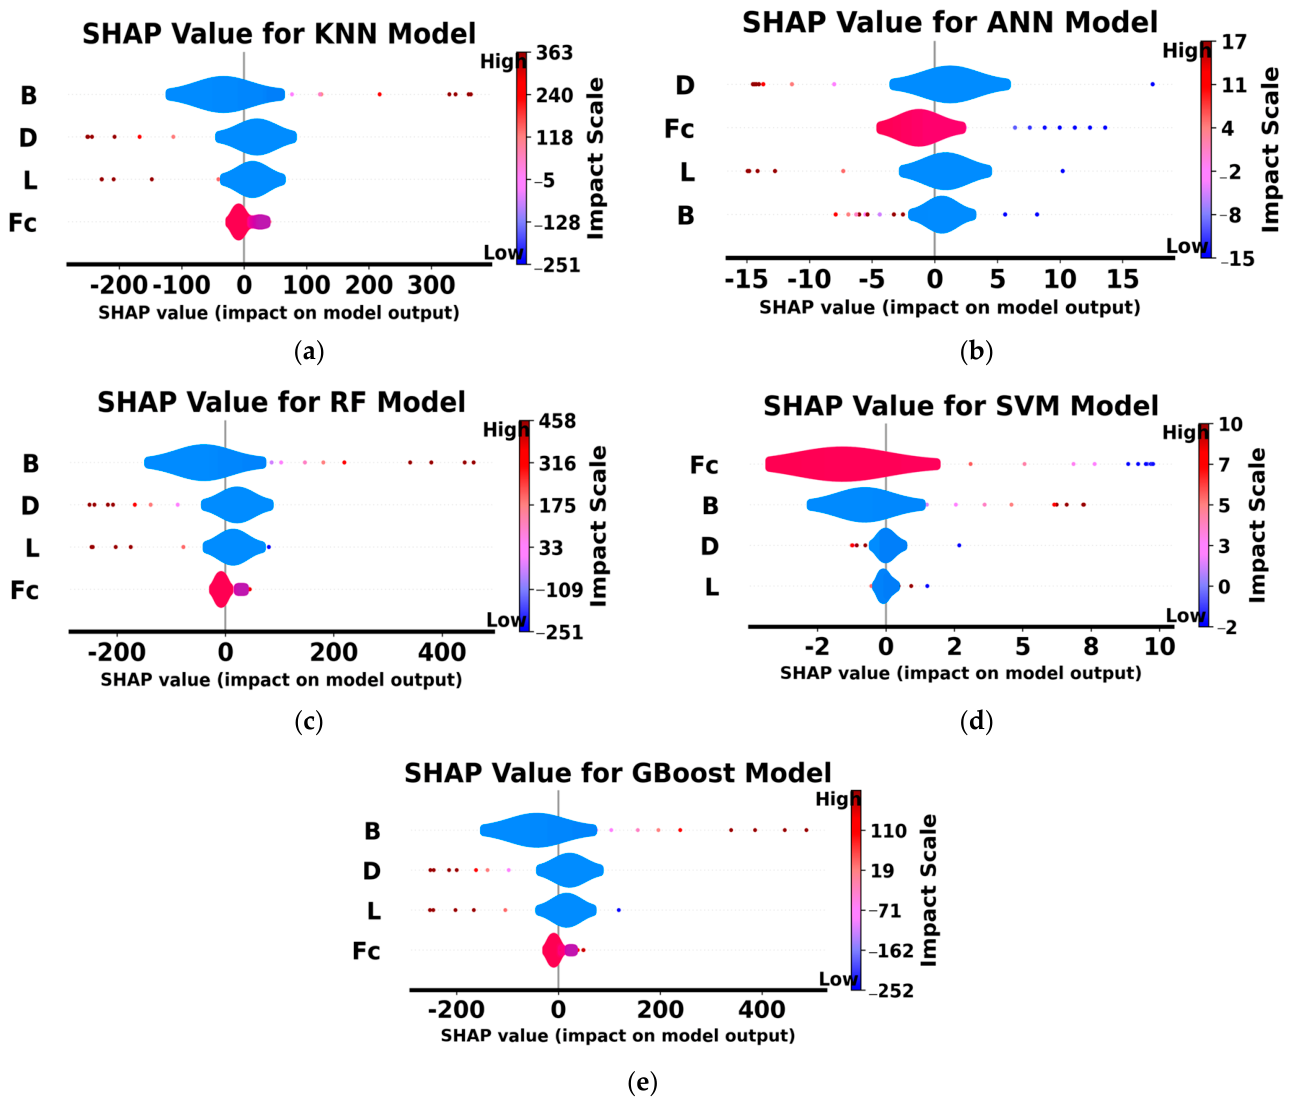
Figure 24 shows the SHAP summary plots for all the models, which describe the effect of the features on the expected ultimate capacity. An increase in the capacity is represented by positive SHAP values, while a reduction in the capacity is represented by negative SHAP values. Furthermore, the color bar in the plot gives an understanding of the scale of the input variables, such that higher values contribute positively to capacity. For all models, the largest SHAP value and strongest positive effect are always exhibited by B, thus supporting its dominant nonlinear effect. Also, the effect of the other variables, such as D, L, and Fc, in influencing capacity, although not as dominant as B, is substantial. The SHAP plot supports the reliability of the proposed framework because physically meaningful trends have been captured.

3.6.2. Partial Dependence Plots (PDPs) Interpretation

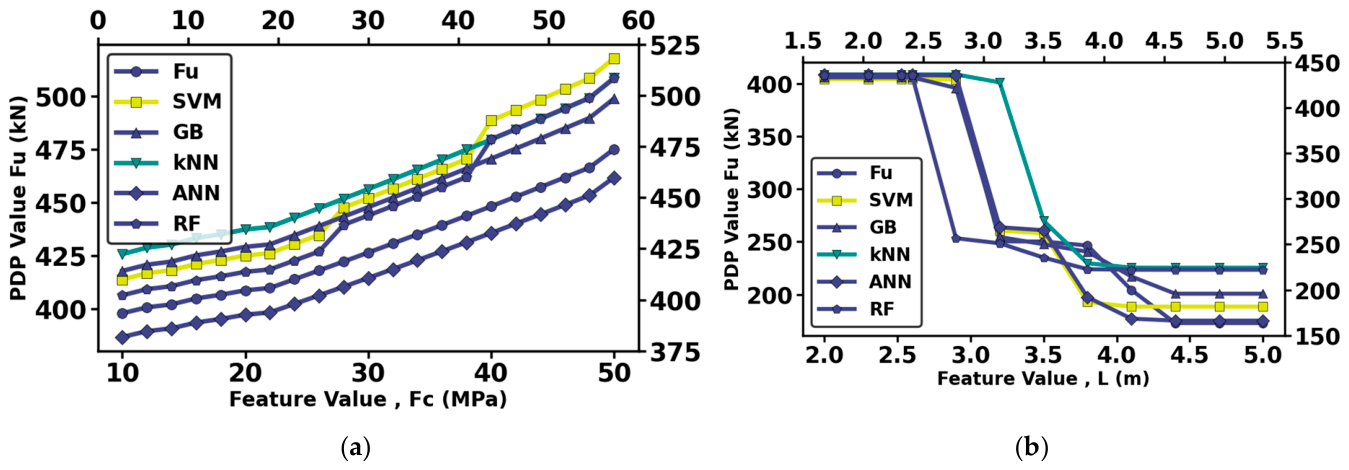
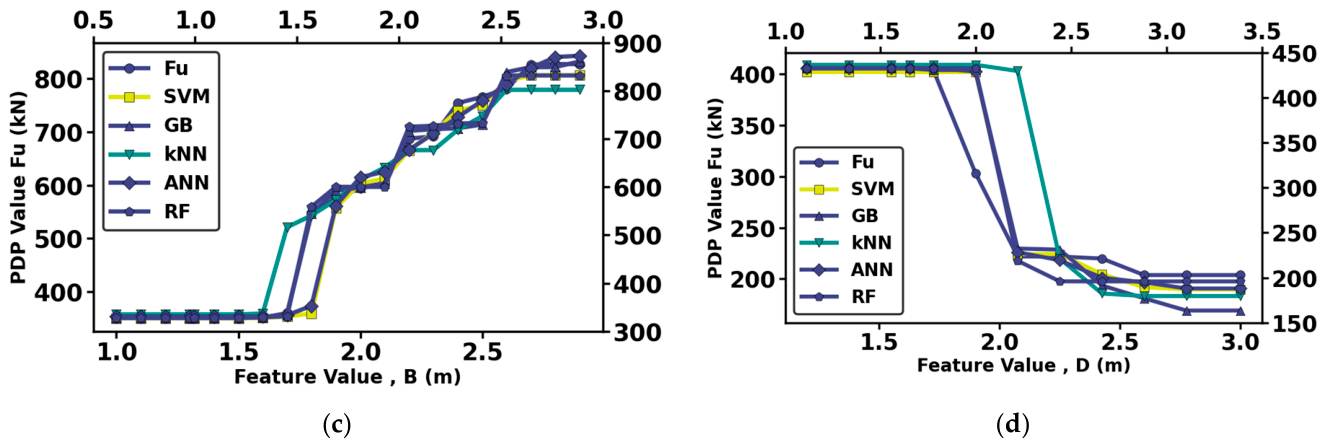
PDPs help to analyze how individual input variables influence the ultimate capacity output, taking into account the average effect of other variables. In Figure 25, it can be observed how different individual input variables influence the ultimate capacity for different models.
As observed in Figure 25a, increasing the strength of concrete (Fc) has a prominent effect of increasing ultimate capacity for all models, confirming the effectiveness of strength in improving ultimate capacity. However, the trend seems nonlinear, with a higher rate of enhancement at higher strength values, especially in ensemble-based models. Conversely, Figure 25b,d establishes that an increase in culvert lengths (L) and depth (D) causes a decrease in capacity. This could be associated with an increase in slenderness and the effect of bending forces. In Figure 25c, the impact of culvert width (B) is emphasized. This has made an enormous positive contribution to the capacity for all models. There is a marked improvement in load distribution and stiffness with increased width. Width has the sharpest impact amongst all variables. This is supported by the feature importance assessment by SHAP. Though there might be minor differences among models, the models depict similar trends. This lends further credibility to PDP and supports that models portray trends similar to existing theories related to culvert structural performance [11,59].

3.7. Comparison with Previous Studies

Prior studies on reinforced concrete culverts, most of which were based on experimental tests, visual condition evaluation, or traditional strengthening methods utilizing CFRP, GFRP, steel plates, ECC, or cement overlays [6,7,8,9,10,11,12,13,14,15,16,17,18,19,20,21,22,23,24,25,26,27,28,29,30,31,32,33,34,35,36,37,38,39,40,41,42,43,44]. Although these works were beneficial in improving structural capabilities effectively, most research works proceeded on assumptions of intact or slightly deteriorated culvert conditions before carrying out the strengthening process. Moreover, most previous research works were based on deterministic evaluation approaches that did not comprise data-driven tools for support purposes. A number of studies reported capacity increases between 20% and 30% using externally bonded systems with CFRP or fiber-based schemes. Though valuable in enhancing stiffness and strength properties, such materials tend to possess poor ductility, as related to sudden failure upon loading, as well as inadequate stability when exposed to repeated loading or environments. Added to this, the sensitivity to bonding is a potential concern when dealing with highly corroded surfaces.
On the other hand, the current work takes a completely different strengthening strategy based on the corroded culvert structure, with a significant thickness reduction of 20 mm for the top slab to indicate an extreme level of deterioration. Subsequently, the SMA material has been employed on this deteriorated structure, and the analysis becomes more realistic for culverts approaching the end of their design life. The findings reveal a steady and stable improvement in the structural capacity, and the largest improvement has been observed for the Case-2 configuration among the six combinations, i.e., 28.1% capacity enhancement of the corroded culvert. The promotion of SMA provides a useful benchmark to measure the applicability of the technology in the long-term restoration of culverts.
In terms of cost, NiTi SMA materials currently carry a higher unit cost than conventional CFRP or steel plates/bars. Reported unit prices for NiTi SMA strips range from approximately USD 80–200/kg, compared with USD 20–50/kg for CFRP laminates. However, this higher material cost is compensated for in the context of life-cycle cost. SMA’s inherent corrosion resistance eliminates the need for anti-corrosion coatings or protective barrier systems required by steel-based solutions; its superelastic recovery reduces residual deformation after loading events, potentially deferring the need for re-intervention; and its active confinement mechanism helps in functioning under repeated loading without the bond-sensitivity limitations of adhesive-based FRP systems. Moreover, in terms of durability, SMA’s resistance to chloride-induced corrosion has been demonstrated experimentally in marine concrete applications [35], and SMA-reinforced columns exposed to synthetic seawater have shown significantly reduced stiffness and capacity degradation compared to conventionally reinforced counterparts [36]. Also, SMA-based rehabilitation is mostly applied externally, hence making inspection easier.

4. Conclusions

This research work presents an in-depth investigation of the prediction and rehabilitation of corroded box culverts using FEM, ML, and XAI techniques. The modeling of severe corrosion was done by reducing the thickness of the culvert slab by 20 mm. SMA material strengthening was considered for understanding its efficacy. High-fidelity simulations were conducted using FEM, and a dataset was generated to validate various regression models. The primary results are highlighted below:
  • The application of SMA to the corroded culvert had resulted in a remarkable improvement in strength, stiffness, and post-peak behavior. All SMA-strengthened designs demonstrated improved performance over the corroded reference design. Within these designs, SMA Case-2 and Case-3 demonstrated the maximum strength recovery potential with stable force displacement curves, an increase in capacity of 28.1% and 12.3%, which highlighted effective stress redistributions and confining actions.
  • Out of the ML models tested, the predictive results showed that GB produced higher values of R2 and lower values of error measures than the other models during the training and testing processes, followed by ANN and SVM models, which had excellent generalization performances, and were followed by RF and KNN models that produced relatively higher prediction errors.
  • Ranking of the performances of different models based on accuracy of predictions was summarized by GB > ANN > SVM > RF > KNN, which emphasizes the effectiveness of boosting algorithms in understanding nonlinear phenomena associated with culvert capacity.
  • SHAP interpretability results showed that the most dominant factor always remained the width of the culvert (B), followed by the depth (D) and length (L) of the culvert. The concrete compressive strength (Fc) had a positive effect on the capacity; however, its relative influence remained moderate.
  • PDPs also verified the physical validity of the relationships, which revealed that while B and Fc increase result in increased culvert capacity, L and D increases result in reduced culvert capacity, mainly on account of increased demands on the structure. These observations were also valid for all ML models.
Limitations and recommendations for future include (1) the corrosion model adopted in this study is a simplification of the complex corrosion process and may affect the accuracy of the model. Future work may incorporate reinforcement bar area reduction and bond-slip modeling to further validate and extend the present findings. (2) Only a single corrosion severity level (20 mm thickness reduction) is examined, whereas the response of culverts under varying corrosion degrees varies from mild to catastrophic and hence needs to be characterized. (3) Although four SMA strengthening configurations are evaluated, the design of possible SMA placements, layer thicknesses, and pre-strain conditions is larger. So, the optimal configuration identified here (Case-2) is for the considered set only. (4) The perfect SMA-concrete bond assumption may overestimate the efficiency of SMA strengthening in cases where interface debonding occurs. So, a sensitivity analysis comparing perfect-bond and partial-bond interface models is recommended. (5) All ML models were trained and evaluated exclusively on FEM-generated data. While the basic FEM model was validated against experimental work of Maximos et al. [9], direct validation of the ML predictions against independent experiments on SMA-strengthened corroded culverts was not possible due to the absence of such datasets in the available literature. (6) The study addresses quasi-static loading only and can be extended to dynamic, cyclic, fatigue, or seismic loading scenarios by future research.
Overall, this research has validated the effectiveness of the combination of FEM-generated datasets, SMA rehabilitation techniques, and ML methods to ensure proper evaluation and rehabilitation of the capacity of the corroded box culvert structures.

Author Contributions

Conceptualization, K.A.M.; Methodology, K.A.M., F.D. and F.A.; Software, K.A.M. and F.A.; Validation, K.A.M., A.A.I. and I.A.; Formal analysis, K.A.M., A.A.I., F.A. and I.A.; Investigation, K.A.M., F.A. and I.A.; Resources, F.D.; Data curation, K.A.M. and F.A.; Writing—original draft, K.A.M. and F.A.; Writing—review & editing, F.D., A.A.I., F.A. and I.A.; Visualization, K.A.M., A.A.I. and F.A.; Supervision, F.D.; Project administration, F.D.; Funding acquisition, F.D. All authors have read and agreed to the published version of the manuscript.

Funding

This research received no external funding.

Data Availability Statement

The data supporting the findings of this study are available from the corresponding author upon reasonable request.

Conflicts of Interest

The authors declare that they have no known competing financial interests or personal relationships that could have appeared to influence the work reported in this paper.

References

  1. Smart, P.; Herbertson, J.G. Drainage Design; Springer Nature: Berlin/Heidelberg, Germany, 1992; p. 299. [Google Scholar]
  2. American Association of State Highway and Transportation Officials. LRFD Bridge Design Specifications, 9th ed.; American Association of State Highway and Transportation Officials: Washington, DC, USA, 2020; pp. 3–33. [Google Scholar]
  3. Mackie, K.; Stojadinovic, B. Seismic Demands for Performance-Based Design of Bridges, PEER Report 2003-16; Pacific Earthquake Engineering Research Center, University of California: Berkeley, CA, USA, 2003. [Google Scholar]
  4. Miyazaki, Y. Fundamental Study on Seismic Behavior of Hinge Types of Precast Arch Culverts in Culvert Longitudinal Direction. Ph.D. Thesis, Kyoto University, Kyoto, Japan, 2019. [Google Scholar]
  5. Bian, X.; Tang, X.; Shen, W.; Ling, D.; Chen, Y. An Experimental Study on a Culvert Buried in Granular Soil Subjected to Vehicle Loads. Adv. Struct. Eng. 2012, 15, 1031–1040. [Google Scholar] [CrossRef] [Scilit]
  6. Tang, Y.; Bao, Y.; Zheng, Z.; Zhang, J.; Cai, Y. Performance Assessment of Deteriorating Reinforced Concrete Drainage Culverts: A Case Study. Eng. Fail. Anal. 2022, 131, 105845. [Google Scholar] [CrossRef] [Scilit]
  7. Gong, Y.; Ma, Y.; Tan, G.; Bi, H.; Pang, Y.; Ma, C. Experimental Study and Numerical Simulation on Failure Process of Reinforced Concrete Box Culvert. Adv. Civ. Eng. 2020, 2020, 5423706. [Google Scholar] [CrossRef] [Scilit]
  8. Moradi, M.; Valipour, H.; Foster, S. Reserve of Strength in Inverted U-Shaped RC Culverts: Effect of Backfill on Ultimate Load Capacity and Fatigue Life. J. Bridge Eng. 2016, 21, 04015051. [Google Scholar] [CrossRef] [Scilit]
  9. Maximos, H.; Erdogmus, E.; Tadros, M.K. Fatigue Evaluation for Reinforced Concrete Box Culverts. ACI Struct. J. 2010, 107, 13–20. [Google Scholar] [CrossRef] [Scilit]
  10. Xu, P.; Wang, L.; Chen, J.; Li, M.; Guo, R.; Xie, Y.; Zong, D. Effect of Reinforcement Forms on the Load Bearing Capacity of Prefabricated Box Culvert. Adv. Civ. Eng. 2023, 2023, 1–15. [Google Scholar] [CrossRef] [Scilit]
  11. Quadri, A.I.; Lateef Oyedeji, A.; Kehinde Kupolati, W.; Ackerman, C.; Snyman, J.; Musyoka Ndambuki, J. Performance Evaluation of Reinforced Concrete Culvert under Monotonic Loading. Ain Shams Eng. J. 2024, 15, 103001. [Google Scholar] [CrossRef] [Scilit]
  12. Gebremedhn, Z.; Qiao, G.; Li, J. Finite Element Modeling and Analysis of Precast Reinforced Concrete U-Shaped Box Culvert Using ABAQUS. Am. J. Civ. Eng. 2018, 6, 162. [Google Scholar] [CrossRef] [Scilit][Green Version]
  13. Hurd, J.O. Field Performance of Precast Reinforced Concrete Box Culverts. Transp. Res. Rec. 1991, 1315, 53–57. [Google Scholar]
  14. Meegoda, J.N.; Juliano, T.M.; Ratnaweera, P.; Abdel-Malek, L.; Meegoda, J.N.; Ratnaweera, P. Framework for Inspection, Maintenance, and Replacement of Corrugated Steel Culvert Pipes. Transp. Res. Rec. 2005, 1911, 22–30. [Google Scholar] [CrossRef]
  15. Majid, K.A.; Amin, F.; Al Ismaeel, A.; Faning, D.; Shah, J. Sustainable Rehabilitation of Corroded RC Culverts Using ECC and Interpretable Machine Learning. Structures 2025, 80, 109896. [Google Scholar] [CrossRef] [Scilit]
  16. Wang, Z.; Zhao, X.-L.; Xian, G.; Wu, G.; Singh Raman, R.K.; Al-Saadi, S.; Haque, A. Long-Term Durability of Basalt- and Glass-Fibre Reinforced Polymer (BFRP/GFRP) Bars in Seawater and Sea Sand Concrete Environment. Constr. Build. Mater. 2017, 139, 467–489. [Google Scholar] [CrossRef] [Scilit]
  17. Hassanli, R.; Youssf, O.; Manalo, A.; Najafgholipour, M.A.; Elchalakani, M.; del Rey Castillo, E.; Lutze, D. An Experimental Study of the Behavior of GFRP-Reinforced Precast Concrete Culverts. J. Compos. Constr. 2022, 26, 04022043. [Google Scholar] [CrossRef] [Scilit]
  18. Waqas, H.A.; Bahrami, A.; Amin, F.; Sahil, M.; Saud Khan, M. Numerical Modeling and Performance Evaluation of Carbon Fiber-Reinforced Polymer-Strengthened Concrete Culverts against Water-Induced Corrosion. Infrastructures 2024, 9, 82. [Google Scholar] [CrossRef] [Scilit]
  19. Davidson, J.S.; Kang, J.; Grimes, T.C.; Farrell, J.; Vaidya, U.K.; Pillay, B.; Thattaiparthasarat, B. PVA Fiber Reinforced Shotcrete for Rehabilitation and Preventative Maintenance of Aging Culverts; Alabama Department of Transportation: Montgomery, AL, USA, 2009.
  20. Haghani, R.; Yang, J.; Gutierrez, M.; Eamon, C.D.; Volz, J. Fiber Reinforced Polymer Culvert Bridges—A Feasibility Study from Structural and LCC Points of View. Infrastructures 2021, 6, 128. [Google Scholar] [CrossRef] [Scilit]
  21. Qian, H.; Umar, M.; Nasir Ayaz Khan, M.; Shi, Y.; Manan, A.; Raza, A.; Li, F.; Li, Z.; Chen, G. A State-of-the-Art Review on Shape Memory Alloys (SMA) in Concrete: Mechanical Properties, Self-Healing Capabilities, and Hybrid Composite Fabrication. Mater. Today Commun. 2024, 40, 109738. [Google Scholar] [CrossRef] [Scilit]
  22. Huang, W.M.; Ding, Z.; Wang, C.C.; Wei, J.; Zhao, Y.; Purnawali, H. Shape Memory Materials. Mater. Today 2010, 13, 54–61. [Google Scholar] [CrossRef] [Scilit]
  23. Huang, B.; Lao, Y.; Chen, J.; Song, Y. Dynamic Response Analysis of a Frame Structure with Superelastic Nitinol SMA Helical Spring Braces for Vibration Reduction. J. Aerosp. Eng. 2018, 31, 04018096. [Google Scholar] [CrossRef] [Scilit]
  24. Fang, C.; Liang, D.; Zheng, Y.; Lu, S. Seismic Performance of Bridges with Novel SMA Cable-restrained High Damping Rubber Bearings against Near-fault Ground Motions. Earthq. Eng. Struct. Dyn. 2022, 51, 44–65. [Google Scholar] [CrossRef] [Scilit]
  25. Khodaverdian, A.; Ghorbani-Tanha, A.K.; Rahimian, M. An Innovative Base Isolation System with Ni–Ti Alloy and Its Application in Seismic Vibration Control of Izadkhast Bridge. J. Intell. Mater. Syst. Struct. 2012, 23, 897–908. [Google Scholar] [CrossRef] [Scilit]
  26. Radhamani, R.; Balakrishnan, M. NiTi Shape Memory Alloy: Unraveling the Role of Internal Friction in Passive Damping—A Review. Mater. Today Commun. 2023, 37, 107276. [Google Scholar] [CrossRef] [Scilit]
  27. Ge, J.; Saiidi, M.S.; Varela, S. Computational Studies on the Seismic Response of the State Route 99 Bridge in Seattle with SMA/ECC Plastic Hinges. Front. Struct. Civ. Eng. 2019, 13, 149–164. [Google Scholar] [CrossRef] [Scilit]
  28. Hosseini, F.; Gencturk, B.; Lahpour, S.; Gil, D.I. An Experimental Investigation of Innovative Bridge Columns with Engineered Cementitious Composites and Cu–Al–Mn Super-Elastic Alloys. Smart Mater. Struct. 2015, 24, 085029. [Google Scholar] [CrossRef] [Scilit]
  29. Shahverdi, M.; Czaderski, C.; Motavalli, M. Iron-Based Shape Memory Alloys for Prestressed near-Surface Mounted Strengthening of Reinforced Concrete Beams. Constr. Build. Mater. 2016, 112, 28–38. [Google Scholar] [CrossRef] [Scilit]
  30. Shahverdi, M.; Czaderski, C.; Annen, P.; Motavalli, M. Strengthening of RC Beams by Iron-Based Shape Memory Alloy Bars Embedded in a Shotcrete Layer. Eng. Struct. 2016, 117, 263–273. [Google Scholar] [CrossRef] [Scilit]
  31. Saiidi, M.S.; O’Brien, M.; Sadrossadat-Zadeh, M. Cyclic Response of Concrete Bridge Columns Using Superelastic Nitinol and Bendable Concrete. ACI Struct. J. 2009, 106, 69–77. [Google Scholar] [CrossRef] [Scilit] [PubMed]
  32. Varela, S.; Saiidi, M. Resilient Deconstructible Columns for Accelerated Bridge Construction in Seismically Active Areas. J. Intell. Mater. Syst. Struct. 2017, 28, 1751–1774. [Google Scholar] [CrossRef] [Scilit]
  33. Tazarv, M.; Saiid Saiidi, M. Low-Damage Precast Columns for Accelerated Bridge Construction in High Seismic Zones. J. Bridge Eng. 2016, 21, 04015056. [Google Scholar] [CrossRef] [Scilit]
  34. Chen, W.; Feng, K.; Wang, Y.; Lin, Y.; Qian, H. Evaluation of Self-Healing Performance of a Smart Composite Material (SMA-ECC). Constr. Build. Mater. 2021, 290, 123216. [Google Scholar] [CrossRef] [Scilit]
  35. Chen, W.; Liu, Y.; Qian, H.; Wu, P.; Wu, Y.; Liu, F. Chloride Ion Corrosion Resistance of Innovative Self-Healing SMA Fiber-Reinforced Engineering Cementitious Composites under Dry-Wet Cycles for Ocean Structures. Buildings 2023, 13, 518. [Google Scholar] [CrossRef] [Scilit]
  36. Pei, Q.; Cai, B.; Xue, Z.; Ding, Y.; Cui, D.; Guo, Y. Study on Mechanical Properties of Corroded Concrete Columns Strengthened with SMA Wires. PLoS ONE 2023, 18, e0276280. [Google Scholar] [CrossRef] [Scilit] [PubMed]
  37. Thai, H.-T. Machine Learning for Structural Engineering: A State-of-the-Art Review. Structures 2022, 38, 448–491. [Google Scholar] [CrossRef] [Scilit]
  38. Ghiasi, R.; Ghasemi, M.R.; Noori, M. Comparative Studies of Metamodeling and AI-Based Techniques in Damage Detection of Structures. Adv. Eng. Softw. 2018, 125, 101–112. [Google Scholar] [CrossRef] [Scilit]
  39. Bai, C.; Nguyen, H.; Asteris, P.G.; Nguyen-Thoi, T.; Zhou, J. A Refreshing View of Soft Computing Models for Predicting the Deflection of Reinforced Concrete Beams. Appl. Soft Comput. 2020, 97, 106831. [Google Scholar] [CrossRef] [Scilit]
  40. Chen, T.; Guestrin, C. XGBoost. In Proceedings of the 22nd ACM SIGKDD International Conference on Knowledge Discovery and Data Mining; ACM: New York, NY, USA, 2016; pp. 785–794. [Google Scholar]
  41. Manikandan, K.; Nidhi, M.; Micelli, F.; Cascardi, A.; Sivasubramanian, M.V.R. Seismic Vulnerability Assessment of Slender Masonry Structures: A Machine Learning Approach with Vibration-Based Assessment and Nonlinear Dynamic Analysis. Structures 2025, 79, 109272. [Google Scholar] [CrossRef] [Scilit]
  42. Amin, F.; Ali, I.; Husnain, A.; Javed, M.F.; Alabduljabbar, H.; Junaid, A. Sustainable Strengthening of Concrete Deep Beams with Openings Using ECC and Bamboo: An Equation and Data-Driven Approach through Abaqus Modeling and GEP. Results Eng. 2025, 26, 104813. [Google Scholar] [CrossRef] [Scilit]
  43. Qi, S.; Li, G.; Chen, D.; Du, Q.; Su, A.; Wang, X.; Tang, L.; Zhang, Y.; Wang, M. Culvert Damage Assessment and Probability Modeling in Permafrost Regions: A Case Study of the Qinghai-Tibet Highway. Cold Reg. Sci. Technol. 2025, 240, 104622. [Google Scholar] [CrossRef] [Scilit]
  44. Gong, Y.; Lin, S.; He, F.; He, Y.; Song, J. Damage Identification of Prefabricated Reinforced Concrete Box Culvert Based on Improved Fuzzy Clustering Algorithm and Acoustic Emission Parameters. Adv. Mater. Sci. Eng. 2021, 2021, 6660915. [Google Scholar] [CrossRef] [Scilit]
  45. ASTM-C1577; Standard Specification for Precast Reinforced Concrete Monolithic Box Sections for Culverts, Storm Drains, and Sewers Designed According to AASHTO LRFD. Document Center, Inc.: Oakland, CA, USA, 2024. Available online: https://www.document-center.com/standards/show/ASTM-C1577 (accessed on 19 April 2024).
  46. Smith, M. ABAQUS/Standard UProvidence. In User’s Manual, Version 6.9; Dassault Systèmes Simulia Corp: Johnston, RI, USA, 2009. [Google Scholar]
  47. Lee, J.; Fenves, G.L. Plastic-Damage Model for Cyclic Loading of Concrete Structures. J. Eng. Mech. 1998, 124, 892–900. [Google Scholar] [CrossRef] [Scilit]
  48. Jankowiak, T.; Łodygowski, T. Identification of Parameters of Concrete Damage Plasticity Constitutive Model. Found. Civ. Environ. Eng. 2013, 6, 53–69. [Google Scholar]
  49. Amin, F.; Bahrami, A.; Waqas, H.A.; Naveed, M.; Ali, I.; Hanif, M.U.; Ejaz, A. Influence of Arch Action on Load-Carrying Capacity of Double-Sized Industrial Precast Slabs: A Combined Numerical and Experimental Study. Results Mater. 2024, 23, 100575. [Google Scholar] [CrossRef] [Scilit]
  50. Amin, F.; Waqas, H.A.; Ali, I.; Waseem, M.; Asif, M.; Majid, K.A.; Leta, M.K. Impact of Carbon Fiber-Reinforced Polymer Sheets and Bolt Diameter on the Seismic Performance Enhancement of Steel Beam-Column Joints. Eng. Rep. 2025, 7, e13022. [Google Scholar] [CrossRef] [Scilit]
  51. Auricchio, F.; Taylor, R.L. Shape-Memory Alloys: Modelling and Numerical Simulations of the Finite-Strain Superelastic Behavior. Comput. Methods Appl. Mech. Eng. 1997, 143, 175–194. [Google Scholar] [CrossRef] [Scilit]
  52. Higazey, M.M.; Alshannag, M.J.; Alqarni, A.S. Numerical Investigation on the Performance of Exterior Beam–Column Joints Reinforced with Shape Memory Alloys. Buildings 2023, 13, 1801. [Google Scholar] [CrossRef] [Scilit]
  53. Fugazza, D. Shape-Memory Alloy Devices in Earthquake Engineering: Mechanical Properties, Constitutive Modelling and Numerical Simulations. Earthquake Engineering. Master’s Thesis, University of Pavia, Pavia, Italy, 2003. [Google Scholar]
  54. Shrestha, B.; Hao, H. Parametric Study of Seismic Performance of Super-Elastic Shape Memory Alloy-Reinforced Bridge Piers. Struct. Infrastruct. Eng. 2016, 12, 1076–1089. [Google Scholar] [CrossRef] [Scilit]
  55. Ghassemieh, M.; Mostafazadeh, M.; Sadeh, M.S. Seismic Control of Concrete Shear Wall Using Shape Memory Alloys. J. Intell. Mater. Syst. Struct. 2012, 23, 535–543. [Google Scholar] [CrossRef] [Scilit]
  56. Zhao, K.; Wei, Y.; Yan, S.; Chen, S.; Dong, F. Experimental and Analytical Investigations on Flexural Behavior of Bamboo Beams Strengthened with Steel Bars. Adv. Struct. Eng. 2021, 24, 3338–3356. [Google Scholar] [CrossRef] [Scilit]
  57. Wen, Q.Q.; Chen, M.C. Study on the Nonlinear Performance Degradation of Reinforced Concrete Beam under Chloride Ion Corrosion. Eng. Fail. Anal. 2021, 124, 105310. [Google Scholar] [CrossRef] [Scilit]
  58. Maxamed Ali, A. Manual RC Box Culvert Analysis and Designing. Appl. Sci. 2020, 5, 91–115. [Google Scholar] [CrossRef] [Scilit]
  59. Kuş, M.; Akgönen, A.I.; Tercan, S.H. Theoretical Effects of Geometrical Parameters on Reinforced Concrete Box Culverts. Bridge Struct. 2018, 14, 3–20. [Google Scholar] [CrossRef] [Scilit]
Figure 1. Flowchart of adopted methodology.
Buildings 16 03439 g001
Figure 2. FE model of the culvert: (a) three-dimensional geometry; (b) reinforcement layout.
Buildings 16 03439 g002
Figure 3. Tensile and compressive stress–strain curve of concrete.
Buildings 16 03439 g003
Figure 4. Bilinear stress–strain response of reinforcing steel.
Buildings 16 03439 g004
Figure 5. The Abaqus SMA material model proposed by Auricchio et al. [51].
Buildings 16 03439 g005
Figure 6. Applied boundary conditions: (a) applied loads; (b) mesh of the model. (Purple arrows: applied loading; blue arrows: boundary constraints).
Buildings 16 03439 g006
Figure 7. Mesh sensitivity results of the model.
Buildings 16 03439 g007
Figure 8. Different strengthening configurations of SMA: (a) Case-1; (b) Case-2; (c) Case-3; (d) Case-4. (Red bars: Steel; Green bars: SMA).
Buildings 16 03439 g008
Figure 9. Force vs. deflection response of reference model with SMA-strengthened models.
Buildings 16 03439 g009
Figure 10. Failure comparison of SMA versus reference models: (a) Case-1; (b) Case-2; (c) Case-3; (d) Case-4.
Buildings 16 03439 g010
Figure 11. Pearson correlation heat plot of the variables.
Buildings 16 03439 g011
Figure 12. ANN algorithm flowchart.
Buildings 16 03439 g012
Figure 13. ANN model: (a) data curve fitting for training and testing; (b) data scatter plot for training and testing.
Buildings 16 03439 g013aBuildings 16 03439 g013b
Figure 14. GB algorithm flowchart.
Buildings 16 03439 g014
Figure 15. GB model: (a) data curve fitting for training and testing; (b) data scatter plot for training and testing.
Buildings 16 03439 g015
Figure 16. KNN algorithm flowchart.
Buildings 16 03439 g016
Figure 17. KNN model: (a) data curve fitting for training and testing; (b) data scatter plot for training and testing.
Buildings 16 03439 g017
Figure 18. SVM algorithm flowchart.
Buildings 16 03439 g018
Figure 19. SVM model: (a) data curve fitting for training and testing; (b) data scatter plot for training and testing.
Buildings 16 03439 g019
Figure 20. RF algorithm flowchart (Purple circles: tree nodes; orange arrows: decision branches).
Buildings 16 03439 g020
Figure 21. RF model: (a) training and testing data curve fitting; (b) training and testing data scatter plot.
Buildings 16 03439 g021
Figure 22. Heatmaps of performance metrics for every algorithm: training data (a) and testing data (b).
Buildings 16 03439 g022
Figure 23. Mean SHAP value plot.
Buildings 16 03439 g023
Figure 24. Summary plots for SHAP: (a) KNN; (b) ANN; (c) RF; (d) SVM; (e) GB.
Buildings 16 03439 g024
Figure 25. PDPs for every input parameter: (a) Fc; (b) L; (c) B; (d) D.
Buildings 16 03439 g025aBuildings 16 03439 g025b
Table 1. Material properties—concrete and steel reinforcement.
MaterialYoung’s
Modulus
(MPa)
Tensile
Strength (MPa)
Density (kg/m3)Compressive Strength (MPa)Poisson’s
Ratio
Steel200,00045078504500.3
Concrete32,5004.5240052.20.2
Table 2. CDP model’s plasticity flow parameters.
ParameterValue
μ 0.001
σ b 0 σ c 0 1.16
K c 0.66
ψ 40°
Table 3. SMA properties.
ParameterValue
Austenitic tangent modulus, Ea64,647 MPa
At austenite state Poisson’s ratio, va0.33
Martensitic tangent modulus, EM28,125 MPa
At the martensite state, Poisson’s ratio, vm0.33
Maximum strain during transformation, εL0.09
Start stress at the start of the transformation in tension, σ t L s [Lower plateau]450 MPa
Stress at the end of the transformation in tension, σ t L r [L]700 MPa
Reference temperature, To18.2 °C
Stress at start of transformation in tension, σ t U s [Upper plateau]200 MPa
Stress at the end of the transformation in tension, σ t L E [U]30 MPa
Stress at the start of the transformation in compression, σ c L s [L]450 MPa
Volumetric strain parameter, ε V L 0.102
Table 4. Capacity index and percentage improvement for SMA-strengthened culverts.
CaseUltimate Capacity Without SMA (kN)Ultimate Capacity with SMA (kN)Capacity Index (CI)Capacity Increase (%)
Case-15706101.077.0
Case-25707301.2828.1
Case-35706401.1212.3
Case-45706301.1110.5
Table 5. The dataset’s influencing parameters.
S. No.ParameterNotationUnitRange
1Ultimate capacity (Output)FukN-
2Concrete’s compressive strengthFcMPa10–50
3Depth of CulvertDmm1000–3000
4Width of CulvertBMm1000–3000
5Length of CulvertLmm2000–5000
Table 6. Statistical description of the dataset.
Statistical MeasuresFcLBDFu (Output)
Mean47.602.641.451.68389.18
Std. Dev.10.770.440.360.24157.61
Variance115.910.200.130.0624,841.74
Kurtosis3.5214.735.9115.871.73
Skewness−2.203.862.623.840.71
Maximum52.405.002.903.00875.50
Minimum10.002.001.001.2069.13
Range42.403.001.901.80806.37
Disclaimer/Publisher’s Note: The statements, opinions and data contained in all publications are solely those of the individual author(s) and contributor(s) and not of MDPI and/or the editor(s). MDPI and/or the editor(s) disclaim responsibility for any injury to people or property resulting from any ideas, methods, instructions or products referred to in the content.