Article

Vulnerability of Low-Rise Buildings Based on Deck Type

by
Lucia Oravcová
1,†,
Milan Sokol
1,† and
Saúl Enrique Crespo Sánchez
2,*,†
1
Department of Structural Mechanics, Slovak University of Technology, Radlinského 11, 811 07 Bratislava, Slovakia
2
Tecnológico de Monterrey, School of Engineering and Sciences, Av. Eugenio Garza Sada 2501 Sur, Monterrey 64700, Nuevo León, Mexico
*
Author to whom correspondence should be addressed.
These authors contributed equally to this work.
Buildings 2026, 16(17), 3400; https://doi.org/10.3390/buildings16173400
Submission received: 15 June 2026 / Revised: 10 July 2026 / Accepted: 28 July 2026 / Published: 25 August 2026
(This article belongs to the Section Building Structures)

Abstract

This study investigates the influence of diaphragm stiffness on the seismic vulnerability of low-rise masonry buildings using nonlinear static pushover analysis. Two limiting structural idealisations are considered: a rigid-diaphragm model and a conservative model with no effective in-plane diaphragm action. The models are applied to buildings with quasi-rectangular and U-shaped floor plans, and their responses are compared using capacity curves, vulnerability functions, and EMS-98 damage grades. The results show that rigid diaphragms improve the redistribution of seismic forces among load-bearing walls, increase global lateral capacity, reduce displacement demand, and produce a more uniform structural response. In contrast, the absence of effective diaphragm action leads to non-uniform force transfer, increased differential displacements, amplified torsional effects, and substantial reductions in lateral capacity, particularly in the U-shaped building. These effects become more pronounced under higher seismic demand. The results demonstrate that both diaphragm action and floor-plan regularity should be considered explicitly in the seismic assessment of low-rise masonry buildings.

1. Introduction

Masonry structures are highly vulnerable to seismic activity because of their low tensile strength, brittle behaviour, and limited energy dissipation capacity. Numerous studies [1,2,3,4] have documented the experimental and analytical behaviour of masonry walls subjected to lateral loading. However, the influence of diaphragm (floor-deck) stiffness on the global seismic response of masonry buildings has not been investigated to the same extent. The diaphragm provides the structural connection between load-bearing walls and enables the transfer and redistribution of inertia forces during earthquakes, thereby ensuring the global interaction of the structural system [5,6,7].
Previous research has demonstrated that rigid diaphragms substantially enhance in-plane wall performance by more uniformly dispersing seismic forces [6,8,9], which introduces a displacement-based perspective for understanding such load redistribution. On the other hand, the special case without diaphragm action often amplifies torsional effects, create uneven load paths, and concentrate damage in weaker wall segments, especially in nonrectangular or asymmetric floor layouts [6,9,10,11].
Despite the extensive body of research on the seismic behaviour of masonry buildings, the combined influence of diaphragm stiffness and floor-plan irregularity on global structural performance remains insufficiently addressed, particularly for low-rise residential typologies. Most existing studies either focus on regular building layouts or assume rigid diaphragm behaviour, limiting their applicability to common construction practices where flexible floor systems are frequently employed [3,6,12,13,14,15,16,17].
The influence of floor (diaphragm) deformability on the seismic response is not specific to masonry structures and has been extensively documented for reinforced concrete (RC) buildings as well. Ruggieri et al. [17] demonstrated that the common practitioners’ assumption of a rigid floor diaphragm in existing RC buildings can lead to non-conservative results in seismic vulnerability estimation, and proposed a practical numerical procedure to assess the a priori effective floor deformability of three-dimensional finite element models. Related studies on RC structures have further shown that special cases with restricted diaphragm action can significantly amplify floor accelerations [18] and that neglecting floor deformability introduces errors in both local and global seismic response predictions, particularly in buildings with plan irregularities [19]. For masonry buildings specifically, similar concerns have been raised regarding the influence of diaphragm stiffness on force redistribution among load-bearing walls [6,17], with mechanical and displacement-based vulnerability models [3,12,14] providing the analytical basis for linking diaphragm behaviour to global capacity curves and damage-grade predictions. However, while the RC literature has systematically investigated the combined effect of diaphragm flexibility and plan irregularity on seismic fragility [17,18,19], comparable studies for masonry buildings remain comparatively limited, motivating the present investigation.
Unlike previous studies, the proposed methodology integrates diaphragm stiffness, floor-plan irregularity, regional seismic demand, and automated nonlinear assessment within a single computational framework requiring only a limited number of input parameters. Using push-over-based assessment, the research provides a comparative evaluation of capacity curves, damage grades, and vulnerability functions, and extends the analysis across different seismic environments. The results offer practical insights for seismic design and retrofitting of masonry buildings, with particular emphasis on the role of diaphragm stiffness in controlling torsional response and damage progression.

2. Seismic Behaviour of Masonry Structures

2.1. Computational Program

The nonlinear seismic assessment of masonry structures is generally associated with considerable modelling effort, extensive material calibration and the use of specialised finite element software [4,14,15,20]. The experimental campaign was conducted by the manufacturer. Although such approaches provide highly detailed results, their complexity often limits their applicability for practical engineering assessment of large inventories of existing buildings [14,15,16,21]. For this reason, an automated computational tool was developed within the framework of this research with the objective of simplifying the seismic evaluation process while preserving the ability to capture the dominant nonlinear mechanisms governing the behaviour of low-rise masonry buildings subjected to seismic loading.
The developed software was implemented in the Microsoft Excel environment using Visual Basic for Applications (VBA), providing an accessible and transparent platform suitable for both research purposes and practical engineering applications. The principal objective of the program was to minimise user interaction and reduce the possibility of human errors during model preparation by limiting the number of required input parameters to only the essential geometric, material and loading characteristics of the building.
The computational procedure begins with the generation of a simplified geometrical model of the structure [13,14,20]. The user specifies the floor-plan geometry, wall positions, wall thicknesses, storey heights and material properties of masonry units, while the software automatically determines the corresponding geometric characteristics, including wall areas, moments of inertia and centres of stiffness. The graphical interface simultaneously provides visual verification of the input data, allowing rapid identification of modelling inconsistencies before the numerical analysis is initiated.
The influence of floor (diaphragm) deformability on the seismic response is not specific to masonry structures and has been extensively documented for reinforced concrete (RC) buildings as well. Ruggieri et al. [17] demonstrated that the common practitioners’ assumption of a rigid floor diaphragm in existing RC buildings can lead to non-conservative results in seismic vulnerability estimation, and proposed a practical numerical procedure to assess the a priori effective floor deformability of three-dimensional finite element models. Related studies on RC structures have further shown that special cases with restricted diaphragm actions can significantly amplify floor accelerations [18] and that neglecting floor deformability introduces errors in both local and global seismic response predictions, particularly in buildings with plan irregularities [19]. For masonry buildings specifically, similar concerns have been raised regarding the influence of diaphragm stiffness on force redistribution among load-bearing walls [6,7], with mechanical and displacement-based vulnerability models [12,19] providing the analytical basis for linking diaphragm behaviour to global capacity curves and damage-grade predictions. However, while the RC literature has systematically investigated the combined effect of diaphragm flexibility and plan irregularity on seismic fragility [17], comparable studies for masonry buildings remain comparatively limited, motivating the present investigation.
Following the geometrical definition of the structure, the program automatically evaluates the gravity loads originating from floors, roofs, partitions and masonry walls and transforms them into equivalent normal forces acting on individual load-bearing walls. These normal forces subsequently serve as the basis for the determination of the shear resistance and deformation capacity of each wall element. The implemented analytical formulations account for wall geometry, masonry strength parameters, friction characteristics and vertical loading conditions, allowing realistic representation of the nonlinear behaviour of masonry subjected to seismic actions.
For each wall element, the software generates an individual capacity curve characterised by several key performance points corresponding to crack initiation, yielding, ultimate deformation and structural collapse. The local response of individual walls is subsequently combined to construct the global capacity curve of the building, describing the relationship between total base shear force and roof displacement. This global representation forms the foundation for evaluating the seismic loading of the entire structure.
Particular attention is devoted to modelling the influence of diaphragm stiffness on force redistribution within the building. In the rigid diaphragm configuration, seismic forces are distributed among load-bearing walls according to their relative stiffness while satisfying the global equilibrium of the structure, resulting in efficient load redistribution and reduced torsional response. In contrast, the special case without diaphragm action permits only limited interaction between individual wall groups, leading to localised force transfer mechanisms, increased displacement demands and amplification of torsional effects, particularly in buildings with irregular floor-plans.
It should be clarified that the rigid- and flexible-diaphragm cases are analysed using two separate structural models rather than a single numerical model with a switchable stiffness parameter, consistent with common code-based recommendations that rigid- and flexible-diaphragm assumptions should not be combined within a single idealisation when the diaphragm’s in-plane stiffness is not clearly dominant relative to that of the walls [5,17]. The flexible-diaphragm model adopted in this study represents a conservative limiting case in which the floor is assumed to provide no effective diaphragm action. The objective is to evaluate the maximum influence of the absence of floor–wall interaction rather than to represent the behaviour of all ceramic floor systems. For the rigid-diaphragm model, seismic forces are distributed among all walls in proportion to their relative in-plane stiffness, consistent with the assumption of a single common horizontal displacement enforced at each floor level. For the flexible-diaphragm model, the diaphragm is instead represented as a series of locally spanning elements connecting discrete wall groups, so that each group is analysed with its own local equilibrium and displacement compatibility, without enforcing a single global floor displacement across the entire plan. Both models are generated independently for each case study (Section 6), and their results are compared directly to isolate the effect of diaphragm stiffness on seismic loading.
The developed algorithm further transforms the multi-degree-of-freedom structural system into an equivalent single-degree-of-freedom model and determines the performance point by intersecting the capacity spectrum with the seismic demand spectrum corresponding to the selected seismic scenario. Based on displacement thresholds defined by the European Macroseismic Scale EMS-98, the program automatically identifies the expected damage grade ranging from slight damage (DG1) to complete collapse (DG5) and subsequently constructs the corresponding vulnerability function.
The graphical output generated by the software includes capacity curves, vulnerability functions, displacement patterns and schematic representations of damage mechanisms, allowing rapid interpretation of structural behaviour under different seismic intensities and structural configurations. Compared to conventional nonlinear finite element procedures, the proposed methodology significantly reduces modelling effort and computational demands while maintaining sufficient accuracy for engineering applications.
The principal scientific contribution of the developed computational framework lies in establishing a direct connection between structural mechanics, nonlinear seismic analysis and probabilistic vulnerability assessment within a single integrated environment. The ability to evaluate seismic loading using only a limited number of easily obtainable input parameters makes the methodology particularly suitable for rapid seismic screening of extensive building inventories, regional risk assessment studies, retrofit prioritisation and civil protection planning. Considering the large proportion of masonry residential buildings located in the seismically most active regions of southern Slovakia, the developed software represents a practical tool for future seismic resilience strategies and loss estimation methodologies.

2.2. Material Properties

The material parameters adopted in this study correspond to the published characteristic values reported in the technical literature for Wienerberger Porotherm 30T Profi masonry units (Wienerberger AG, Vienna, Austria) [3,22,23,24]. No physical masonry units were purchased or experimentally tested as part of the present study.
Masonry is a composite construction material made by binding individual units, such as bricks or blocks, with mortar or masonry foam [3,4,22,23]. Masonry has a low tensile strength, which is an important property affecting its behaviour under various loading conditions, particularly during earthquakes. The principal material parameters governing the mechanical behaviour of masonry include the compressive strength perpendicular to the mortar bed f m z , the compressive strength parallel to the mortar bed f m y , the angle of internal friction φ , and cohesion c [3,22,23].
Previous experimental studies have shown that these masonry walls exhibit only limited strength degradation prior to reaching the peak horizontal resistance, demonstrating relatively stable cyclic behaviour under lateral loading [22,23].
The assumed mechanical properties were compared with unpublished manufacturer test results. Since the original experimental records are proprietary and publication permission was not granted, only the numerical comparison reported in Table 1 is presented. These factors collectively affect how effectively the material can handle compression and shear, as well as its overall stability. It should be noted that the material parameters adopted in this study correspond to standard characteristic values reported in the technical literature for Wienerberger Porotherm 30T Profi masonry [3,22,23,24], rather than values obtained from dedicated independent laboratory testing on the specific brick batch used in the analysed case studies.
Previous experimental studies have shown that these masonry walls exhibit only limited strength degradation prior to reaching the peak horizontal resistance, demonstrating relatively stable cyclic behaviour under lateral loading [22,23].
The assumed mechanical properties were compared with unpublished manufacturer test results. Since the original experimental records are proprietary and publication permission was not granted, only the numerical comparison reported in Table 1 is presented.

Comparison with Manufacturer Testing Data

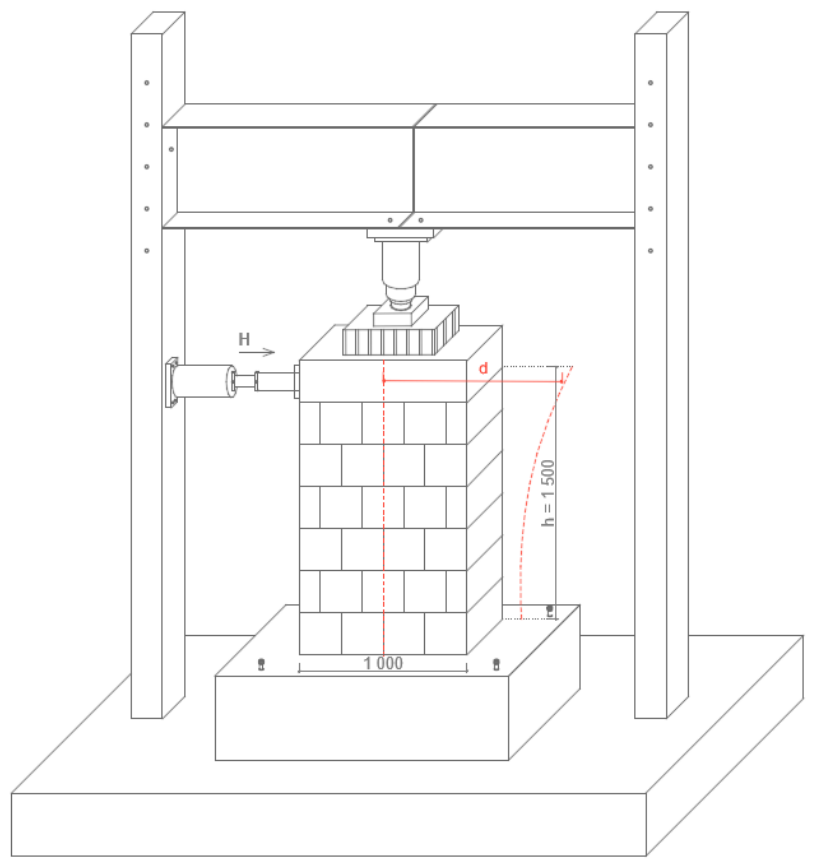
To provide additional empirical context, the assumed material parameters are compared here with results from an unpublished manufacturer testing campaign on comparable hollow clay block masonry walls, made available to the authors for this comparison. Fifteen wall specimens were tested under vertical compression, and eighteen additional specimens were tested under combined constant vertical load and cyclic lateral (in-plane) displacement, following the test set-up schematically illustrated in (Figure 1). Failure of all laterally loaded specimens occurred in shear, characterised by four limit states: flexural cracking, diagonal shear cracking, maximum resistance, and ultimate collapse.
The assumed mechanical properties were compared with unpublished manufacturer test results. Since the original experimental records are proprietary and publication permission was not granted, only the numerical comparison reported in Table 1 is presented.
Table 1 compares the experimentally obtained average compressive strength (f), modulus of elasticity (E), tensile (shear) strength ( f t ), and shear modulus (G) from the most comparable tested series with the values assumed in the present numerical model [22,23]. The experimentally obtained modulus of elasticity and shear modulus are in reasonable agreement with the values assumed in the numerical model. The experimentally determined compressive and tensile (shear) strengths also show good agreement with the adopted material parameters. As these data originate from an internal manufacturer report, they are presented as supporting evidence for the adopted material properties rather than as a formal independent validation in Section 6.

2.3. Seismic Analysis Method

2.3.1. Push-Over Analysis

The analytical framework adopted in this study is based on nonlinear static analysis, commonly referred to as push-over analysis [20,25,26]. Unlike nonlinear time-history analysis, the push-over method does not explicitly reproduce the complete time-dependent response of a structure. Instead, it provides a computationally efficient and sufficiently accurate means of estimating global structural capacity, stiffness degradation, deformation demand, progressive damage, and the development of collapse mechanisms under seismic loading [20,25].
In a push-over analysis, monotonically increasing lateral loads are applied incrementally to the structural model until a prescribed target displacement is reached or a collapse mechanism develops. The resulting capacity curve describes the relationship between the applied lateral force and the corresponding structural displacement, thereby providing insight into the transition from elastic behaviour to yielding, damage accumulation, and ultimate failure [3,13,24,27].
Owing to its balance between computational efficiency and predictive capability, the push-over method has become an established tool in performance-based seismic design and structural vulnerability assessment [3,13,24,26]. In the present study, the adopted lateral load distribution is proportional to the fundamental vibration-mode shape of the structure [25,26].

2.3.2. Damage Grades According to European Macroseismic Scale 98

Each collapse mechanism is connected to a corresponding damage grade based on the European Macroseismic Scale 98 (EMS 98) [27,28], which formally defines the categorization of earthquake-induced building damage. Therefore, calculating the equivalent shear force of a building, which is the result of critical acceleration that initiates a collapse mechanism, directly determines the expected damage grade. The global capacity curve involves summing the capacity curve of individual wall. Damage grades are set through careful visual inspection and set displacement thresholds [3,12,13]:
  • Slight Damage—DG1: This is when fine hairline cracks appear, plaster starts to come off, and masonry starts to loosen at the top levels. The first fractures that show up at a displacement threshold called Δ c r characterize this grade.
  • Moderate Damage—DG2: This level of damage is characterized by bigger cracks on many walls, missing plaster, and the possibility of chimney structures partially failing. This grade marks the point at which the behaviour changes from linear to nonlinear at a certain displacement level, identified as Δ y min .
  • Substantial Damage—DG3: This means that most of the walls have large cracks in them, and non-structural parts like partitions and gable walls have broken down. Roof tiles have also come off. This grade is based on going beyond the maximum displacement limit Δ y max .
  • Severe Damage—DG4: This means that walls have failed structurally in a big way and that parts of the roof and floor systems have fallen. This circumstance happens when the displacement is greater than Δ u max .
  • Collapse—DG5: This is a state of total or almost total structural failure, and it is marked by a big drop in base shear to two-thirds of its maximum value [3,13,24,27,29].

2.3.3. Shear Response of the Individual Wall

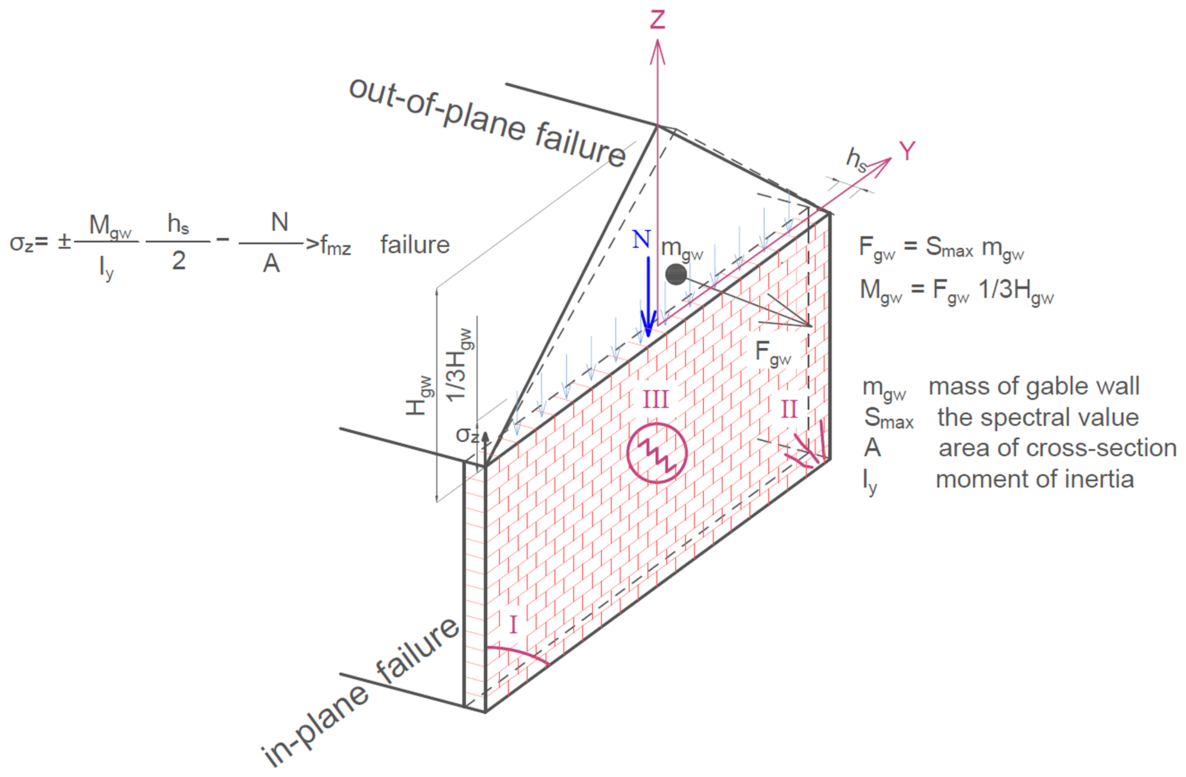
Masonry structures subjected to seismic actions may experience two fundamentally different failure modes: in-plane failure and out-of-plane failure. In-plane failure (Figure 2) occurs when seismic forces act parallel to the plane of the wall, inducing shear stresses, diagonal cracking, or flexural mechanisms within the wall. This behaviour is strongly influenced by wall geometry, vertical load distribution, and mortar quality, and is typically represented through capacity curves that describe stiffness degradation and shear resistance [3,22,30].
Different types of failure are possible (Figure 2):
  • Tensile Failure: This type of failure is characterized by horizontal cracking along bed joints, because of tensile normal stresses. It typically occurs when there is minimal vertical load acting, or in the absence of horizontal forces.
  • Flexural Failure at the Base: This failure happens when the walls fracture at the base, when shear forces move through compressed masonry. This commonly causes the corners to crush. This happens a lot in walls that are very tall and thin.
  • Shear Failure: Shear failure is distinguished by diagonal cracks, usually observed in walls with a low aspect ratio. These fractures may either propagate through the masonry units (failure modes I and II in Figure 2) or along the mortar joints because of sliding (failure mode III in Figure 2). This depends on the vertical load and the quality of the mortar. The stress distribution within masonry walls is complex, affected by changes in materials, geometry, forces, and boundary conditions [3,13,22,23]. Each of these failure modes can be associated with a quantitative displacement threshold consistent with the capacity-curve formulation introduced in Section 2.3.5. Tensile (bed-joint cracking) failure corresponds to the onset of the cracking displacement Δ c r ; flexural failure at the base corresponds to the yield displacement Δ y , governed by the normal stress limit σ z = ± M g w h s / 2 / I y N / A > f m z (Figure 1); and shear failure corresponds to the ultimate displacement Δ u , governed by Equation (1). Out-of-plane failure is quantified directly through the design force F g w (Figure 2), rather than through an in-plane displacement threshold, reflecting its distinct kinematic mechanism.
    These factors together give detailed analytical and experimental accounts of shear mechanism and the parameters that control them.
By contrast, out-of-plane failure (Figure 2) happens when walls (e.g., gable walls) are hit by seismic forces that are not in their plane. The walls may bend or fall because they are not properly connected to the diaphragms or other walls. This could cause a catastrophic collapse. Out-of-plane mechanisms are very important for thin walls, parapets that are not anchored, and façades with big openings. In-plane mechanisms may evolve gradually and progressively, whereas out-of-plane failure frequently manifests quickly and without much notice, which is a big hazard to life safety. Out-of-plane failure has a big impact on damage grade 3. To deal with both modes, a whole design approach is needed that looks at reinforcement, anchorage, and diaphragm interaction [3,22,30]. This highlights the importance of considering both in-plane and out-of-plane failures during seismic assessment. Addressing the out-of-plane mechanism is comparatively straightforward, as it is governed by the design force F g w (Figure 2).

2.3.4. Stiffness of Wall Elements and Moment Distribution

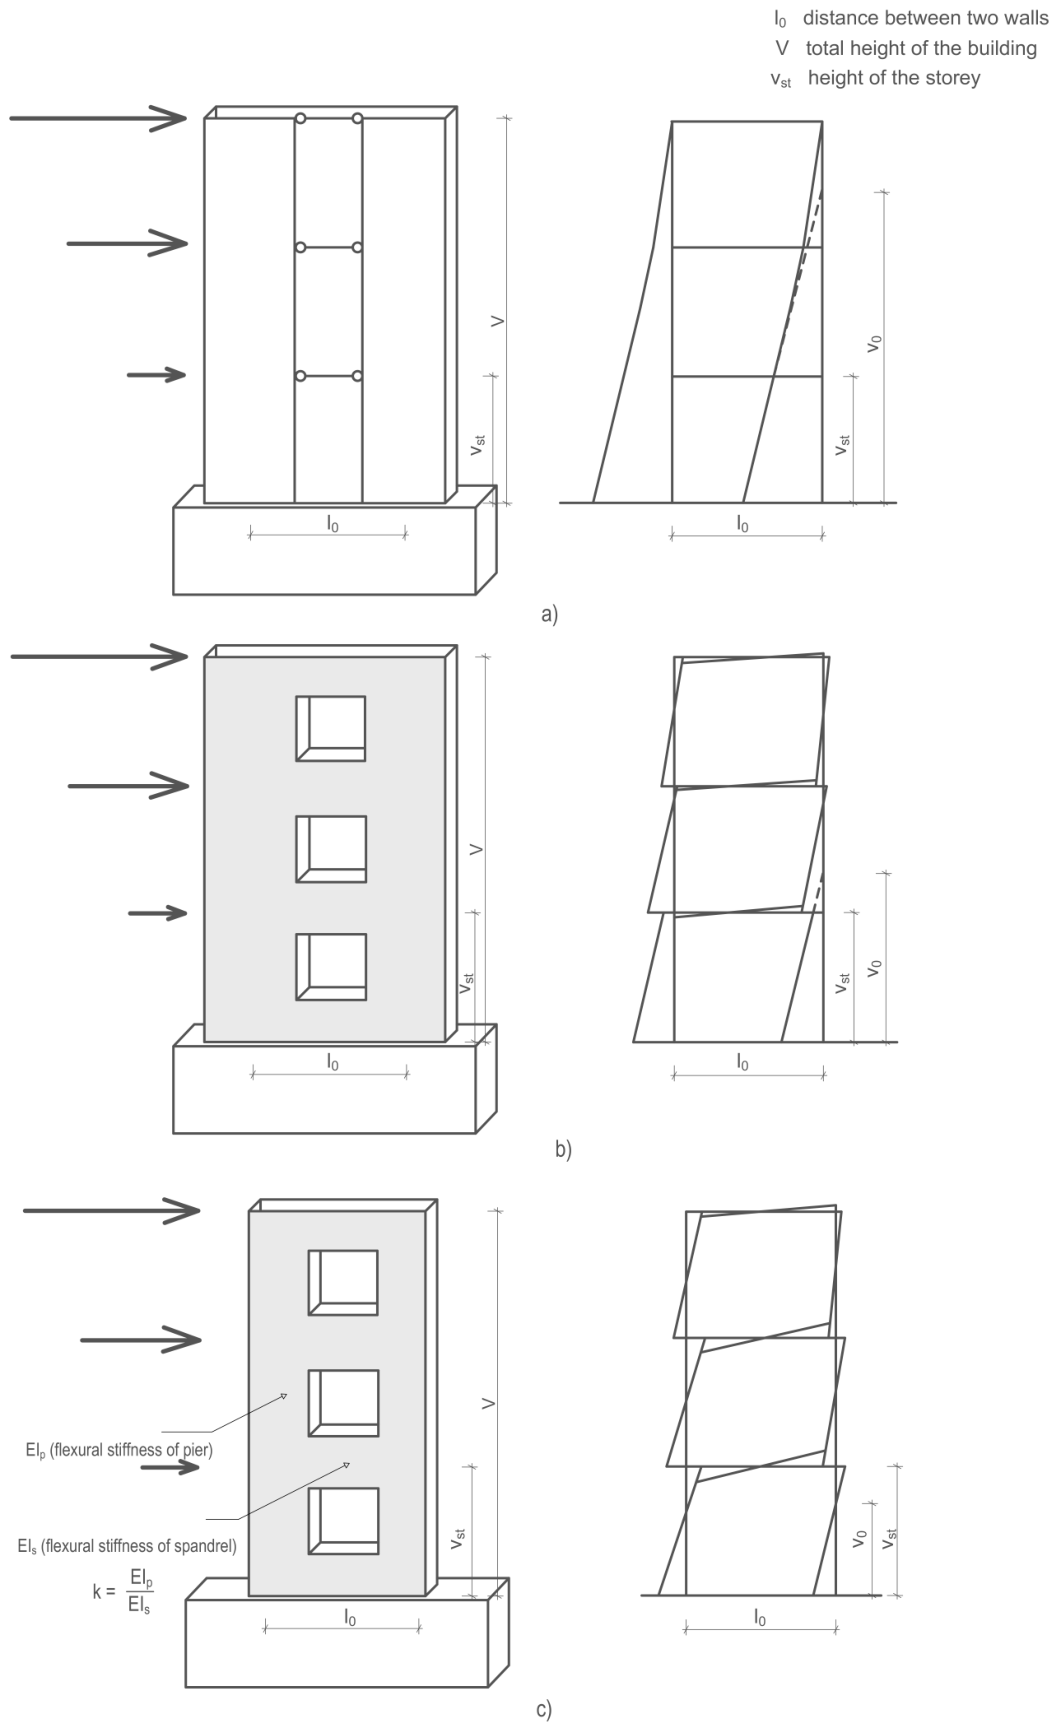
During seismic analysis, the structural response of a masonry building can be represented by modelling its interconnected walls, piers, and spandrels [3,6,22]. A key parameter governing this interaction is the zero-moment height, v 0 (Figure 3), which defines the location along the wall height where the bending moments vanish; minimising v 0 increases the bending moments at the base, producing behaviour comparable to a frame system [3,22]. Three limiting cases can be distinguished (Figure 3). For a single cantilever wall (Figure 3a), each wall must independently resist the full overturning moment caused by the applied horizontal forces, resulting in very high bending moments concentrated at the base. For substantially linked walls (Figure 3c), the overturning moment is instead resisted mainly through the shear resistance of the outer walls and the normal forces transferred by the spandrels, so that the lateral loads are distributed more effectively and the resulting bending moments are comparatively minor. The intermediate case (Figure 3b) represents a compromise between frame and cantilever behaviour, in which a larger share of the overturning moment is resisted by the walls themselves at the expense of lower normal forces within the structure. These three configurations illustrate how wall coupling, vertical shear transfer, and geometric configuration jointly govern the distribution of bending moments during seismic loading [3,12,22].

2.3.5. Capacity Curve—General Consideration

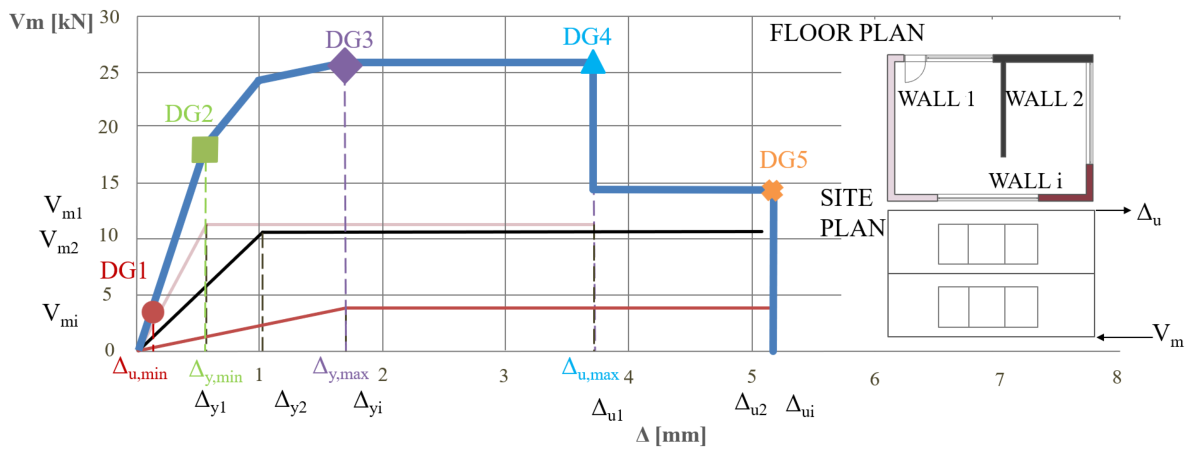
In seismic engineering, the capacity curve is a fundamental tool for evaluating the performance of a structure subjected to increasing lateral loads [3,12,13,26]. It demonstrates how the base shear force V m i affects the roof displacement Δ u (described in Figure 4) [3,12,26]. This gives a general idea of the material’s stiffness, strength, and ductility, both in case of the whole structure of individual wall i. The curve starts as a straight line, which shows the elastic range of how the structure will respond. The curve becomes non-linear as the displacement rises. This is what causes the system to crack, lose stiffness, and eventually become plastic. The latter part of the curve is post-peak behaviour, when the strength may drop and the structure is close to falling apart [3,13,24,26,29,31]. Capacity curves are quite important. They contain at least three parts:
  • First, they let engineers choose three key points that yield displacement, ultimate displacement, and collapse threshold.
  • Second, they are the most important part of performance-based seismic design, which uses structural reaction to determine what kinds of damage has happened.
  • Third, in defining seismic demand, capacity curves are used to build vulnerability functions that show the chance of damage based on how strong the hazard is. Consequently, the capacity curve serves as an essential connetion between structural analysis and seismic risk assessment [3,13,30].
The capacity curve (illustrated in Figure 4) of a whole masonry structure is derived principally from the summation of the capacity curves of the individual walls i [3,13,24], which describe methodologies for assembling wall responses into global system behaviour.
Figure 4. Capacity curve of fictitious example masonry building.
Buildings 16 03400 g004
These parameters represent the strength of the wall, elastic limit and the maximum deformation capacity before failure [3,13]. The shear force V m i [13], which is influenced by the masonry strength parallel to the mortar bed f m y , the wall length l w i , the wall thickness t i , the vertical load N i , the angle of internal friction θ , and the height of the zero moment v 0 , can be determined using the following equation [13]:
V m i = f m y l w t N tan θ N + N ( tan θ ) 2 + 2 f m y t v o tan θ
where:
  • V m i shear force capacity of an individual wall
  • Δ y i the yield displacement;
  • Δ u i the ultimate displacement;

3. Vulnerability Function

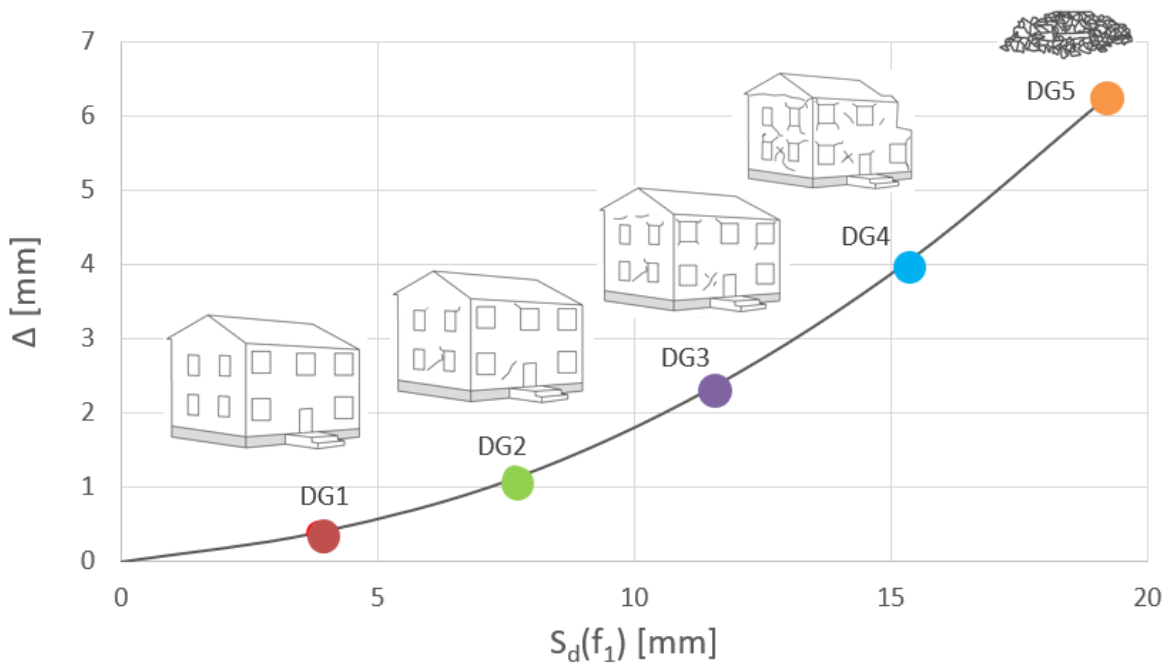
The vulnerability function (Figure 5) is the most significant component of seismic risk analysis, as it links structural response to probabilistic predictions of expected damage. The vulnerability function quantifies the likelihood that a structure may reach or exceed designated damage states, depending on seismic demand factors, including spectrum displacement and maximum ground acceleration. They are usually based on analytical models, real-world data, or expert opinion, and allow us to understand how different types of buildings behave when they are hit by an earthquake [3,12,14,31]. Together, these three elements provide the analytical foundations, performance assessment methods, and numerical simulations required to construct these functions. Vulnerability functions are usually made in three steps:
  • Determination of representative capacity curves for the structure type under consideration,
  • Definition of damage states in terms of standardised criteria (e.g., EMS-98) [27],
  • Convolution of these data with seismic demand spectra [12,26,31].
Figure 5. Damage threshold curve.
Buildings 16 03400 g005
The resulting functions provide a probabilistic link between the intensity of the danger and the distribution of the anticipated damage. In real life, vulnerability functions help estimate losses, urban risk scenarios, insurance models, and disaster plans. They turn structural analysis into decision-making measures, connecting technical knowledge with planning for social resilience [3,12,13,14,26,28,31]. They stress how important these measurements are to turn structural performance into regional risk assessments.
The parameter S d (Figure 5) represents the spectral displacement, it is derived from the seismic response spectrum and serves as a key demand parameter in vulnerability assessment, directly linking ground motion characteristics with structural deformation capacity [3,12,26,31]. It should be noted that Figure 5 illustrates a deterministic capacity–demand relationship, in which the displacement thresholds corresponding to each EMS-98 damage grade (DG1–DG5) are plotted against the spectral displacement demand S d ( f 1 ) for a single, fixed building configuration. This representation is better described as a damage-threshold curve, rather than a probabilistic vulnerability (fragility) function in the strict sense, since it does not yet incorporate the uncertainty typically associated with material properties, geometry, and damage-state definitions across a population of buildings. A full probabilistic vulnerability function would additionally require treating the displacement capacity thresholds as lognormally distributed random variables with an associated dispersion β D G i [12,13], expressing the probability of reaching or exceeding each damage grade, P ( D G i S d ) , as a continuous lognormal cumulative distribution function rather than a single deterministic path. In the present study, reported damage grades correspond to the deterministic performance point for each analysed configuration; the derivation of fully probabilistic fragility functions incorporating parameter dispersion is identified as an important direction for future work (see Section 6) [12,14,31].

4. Case Studies: Seismic Loading of Typical Family Houses

To show how the seismic assessment programme may be used in real life, two typical low-rise family residences with distinct floor-plans were chosen for an in-depth investigation. In [24], only rectangular-shaped buildings were analysed, but now we will analyse more typical floor-plans. In this study, we analyse two typical low-rise family houses, a quasi-rectangular (see Section 4.2) and a U-shaped floor-plan (see Section 4.3).

4.1. Failure Mechanism

The main difference between the rigid diaphragm model and the analysed special case without effective diaphragm action lies in the mechanism by which horizontal seismic forces are transferred to the vertical load-bearing walls, significantly influencing the overall structural response during an earthquake [5,6,7,9,11].
Rigid diaphragms, represented in this study by reinforced concrete slabs (Section 4.2 and Section 4.3), possess high in-plane stiffness and therefore act as efficient horizontal load-distributing elements [5,6,9]. During seismic loading, the diaphragm enforces nearly uniform horizontal displacements at the floor level and redistributes inertia forces among the load-bearing walls according to their relative stiffness. Consequently, all walls participate in resisting the seismic action as a single integrated structural system, resulting in improved force redistribution, reduced torsional response and lower structural displacements, particularly in buildings with nearly symmetric wall layouts [6,7,8,9].
In contrast, the analysed ceramic floor system represents a special modelling case in which no effective diaphragm action is assumed. The floor is considered incapable of transferring horizontal seismic forces between the masonry walls, and therefore no global floor–wall interaction develops during seismic loading. As a result, each load-bearing wall, or a small group of walls connected by a bond beam, behaves as an individual vertical resisting element. Seismic forces are resisted locally rather than being redistributed throughout the entire building. Consequently, the structural response becomes highly non-uniform, producing increased differential displacements between wall groups, more pronounced torsional effects, particularly in irregular floor plans such as the U-shaped configuration, and earlier concentration of damage in the most heavily loaded walls.
The mechanical origin of this performance difference lies in the presence or absence of effective diaphragm action. In the rigid diaphragm model, sufficient in-plane stiffness enables the floor to enforce displacement compatibility and redistribute seismic forces throughout the structural system [5,6,9]. In the analysed special case, however, no effective diaphragm action is considered. Consequently, no redistribution of horizontal forces occurs through the floor, and the structural response is governed solely by the individual resistance of each wall or locally connected wall group. This modelling assumption was intentionally adopted to evaluate the structural response in the absence of floor–wall interaction and should not be interpreted as representing the general behaviour of ceramic floor systems.
Three principal consequences follow:
  • the global lateral load-bearing capacity becomes governed by the weakest wall or wall group rather than by the combined stiffness of the entire structural system, explaining the 32–90% reduction in base shear capacity as demonstrated in Section 4.2 and Section 4.3;
  • differential displacements between individual walls or wall groups amplify torsional response, particularly in asymmetric floor plans such as the U-shaped building;
  • damage initiates earlier in the most heavily loaded walls or wall groups, producing concentrated and non-uniform damage patterns rather than the more evenly distributed cracking observed in buildings with rigid diaphragms.
Overall, the comparison demonstrates the critical role of effective diaphragm action in the seismic behaviour of masonry buildings. While rigid diaphragms promote global structural cooperation and efficient redistribution of seismic forces, the analysed special case without diaphragm action illustrates the structural response when the floor does not contribute to horizontal force transfer and the masonry walls act predominantly as independent vertical resisting elements.

4.2. Quasi-Rectangular-Shaped Floor-Plan House

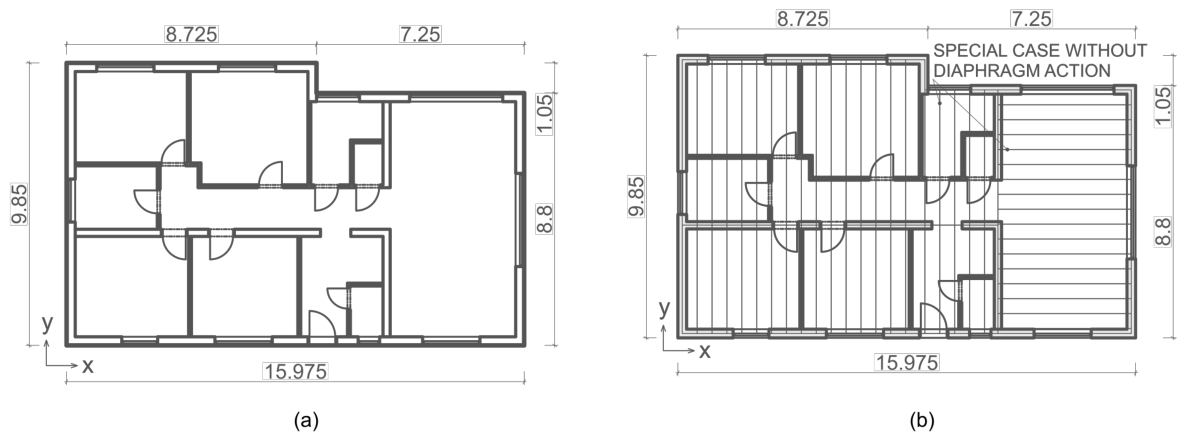
Diaphragm flexibility is examined first in a regular quasi-rectangular plan in order to isolate its effect from plan-irregularity effects, which are subsequently introduced in Section 4.3 through the U-shaped configuration [6,7,11]. A quasi-rectangular floor-plan (illustrated in Figure 6) refers to a nearly square or rectangular layout that is regular and almost symmetric [6,10]. It features orthogonal (perpendicular) load-bearing walls arranged in a grid pattern, providing good lateral stability and uniform support for vertical loads. The design minimises torsional effects during earthquakes, resulting in a more balanced seismic response and lower vulnerability than irregular shapes [6,10,11].
On the other hand, a U-shaped floor-plan (illustrated in Section 4.3) has a central open courtyard or recess creating an asymmetric configuration. It often has torsional irregularities due to uneven wall distribution, especially in re-entrant corners [6,10,11].
These structures were modelled using Wienerberger Porotherm 30T Profi brick masonry, with specific material properties defined as follows: compressive strength perpendicular to mortar bed f m z of 5.1 MPa, parallel to mortar bed f m y of 1.53 MPa, an angle of internal friction tan θ = 0.8 , an elastic modulus E m of 3000 MPa, and a shear modulus G m of 1000 MPa [3,13,24].
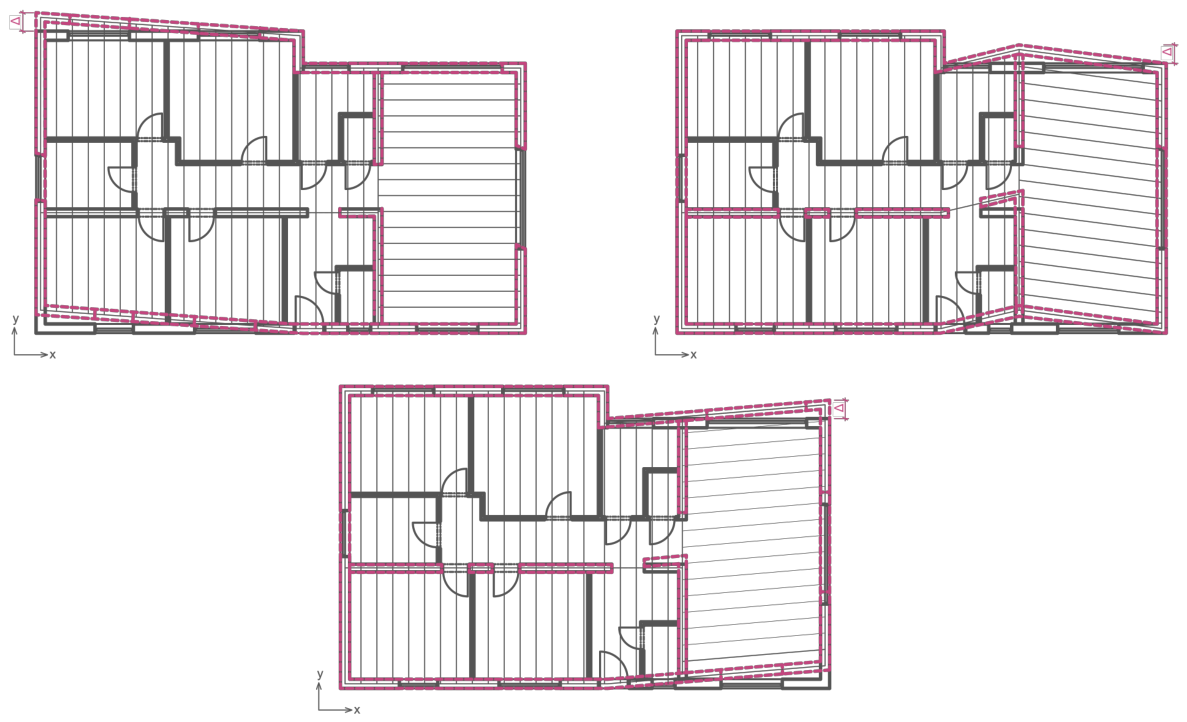
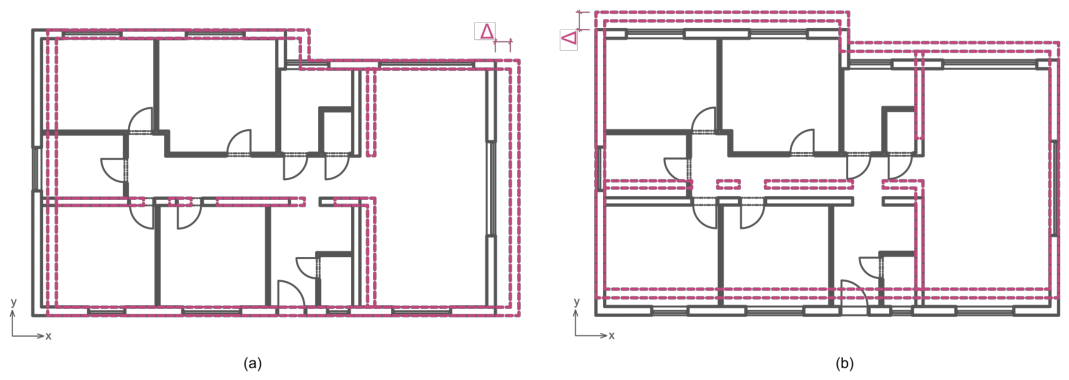
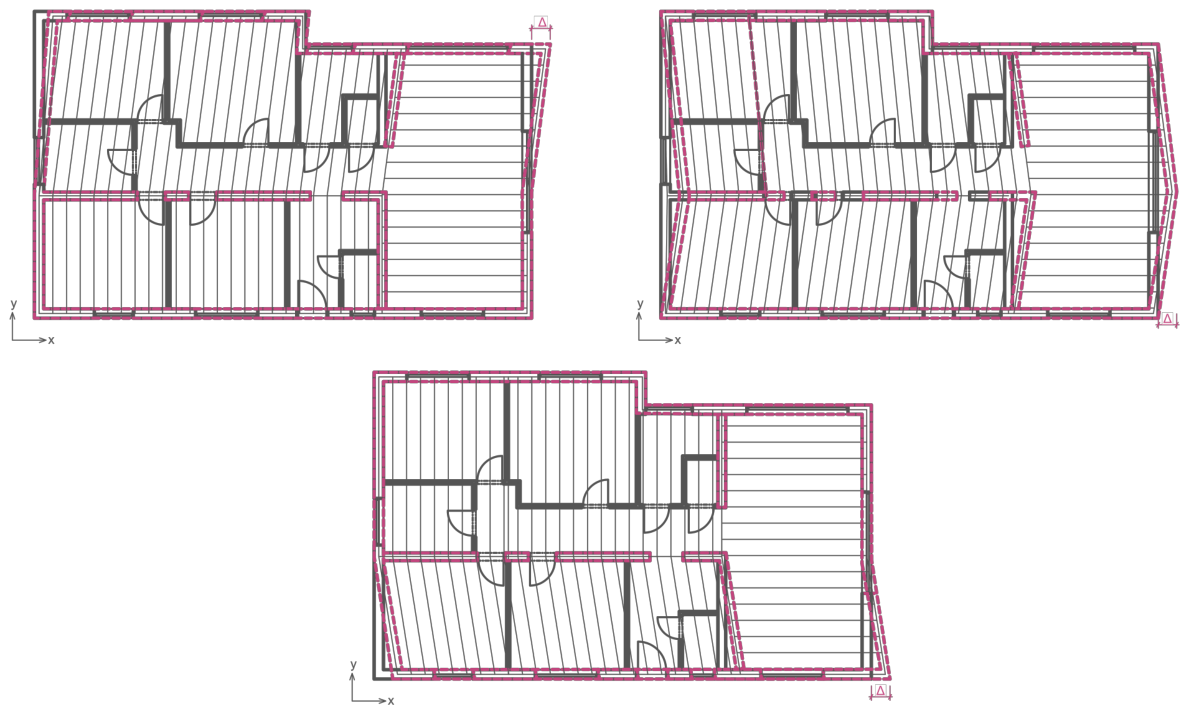
The failure mechanisms obtained for the quasi-rectangular masonry buildingare presented in Figure 7, Figure 8 and Figure 9. Figure 7 shows the response of the building with a rigid reinforced-concrete diaphragm, whereas Figure 8 and Figure 9 show the special case withrestricted diaphragm action under loading in the X and Y directions, respectively.

Rigid Diaphragm vs. Special Case with Restricted Diaphragm Action

X-direction
The structure with a rigid diaphragm showed robust seismic resistance. The capacity curve indicated only minor damage (Damage Grade 1, DG1), characterised by hairline cracks and minor plaster fall.
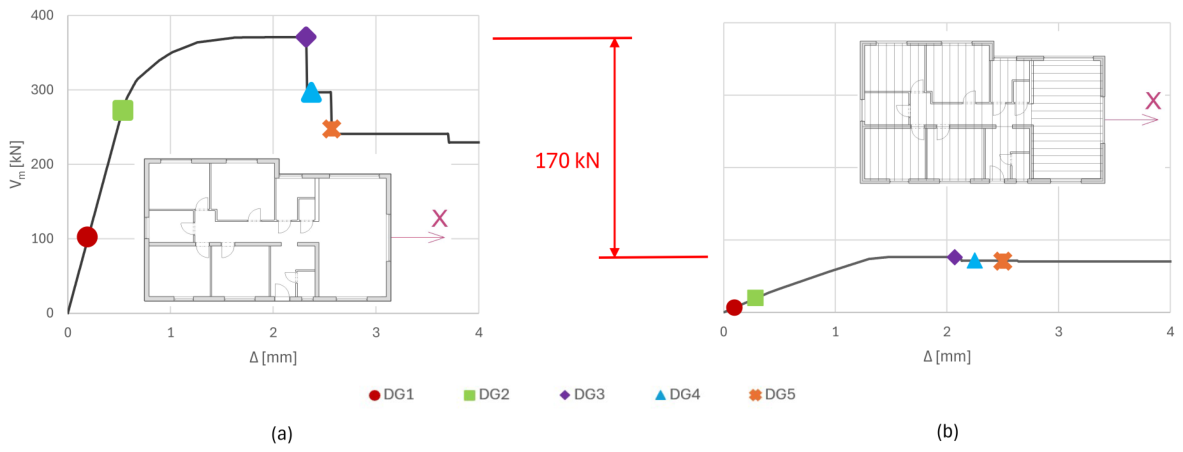
In the analysed special case without diaphragm action, the absence of structural cooperation between the floor and the masonry walls significantly altered the seismic load transfer. The walls acted individually rather than as a globally connected system, resulting in a reduction of the global lateral capacity by approximately 170 kN (55.4% reduction) (illustrated in Figure 10) compared to the rigid diaphragm. The building reached Damage Grade 2 (DG2), with more pronounced cracks, larger plaster fall, and partial chimney collapse.
Y-direction
Similar performance was observed, with capacity curves closely matching the X-direction. The building again exhibited DG1 damage, which confirmed the effectiveness of the rigid diaphragm in providing a uniform distribution of lateral forces regardless of direction Figure 11.

4.3. U-Shaped Floor-Plan House

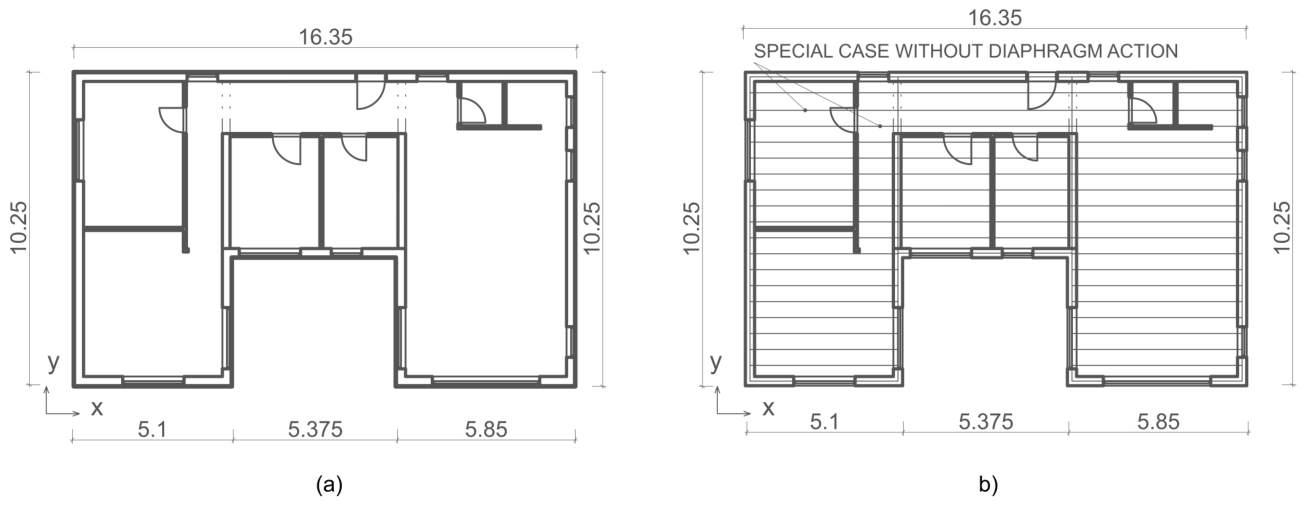
This U-shaped house covers approximately 145 m2, has a total height of 4 m, and a story height of 3 m, consistent with the rectangular house model. Its floor-plan and front view are shown in (Figure 12). The U-shaped design creates torsional irregularities that can notably affect the seismic response, especially with varying diaphragm types.
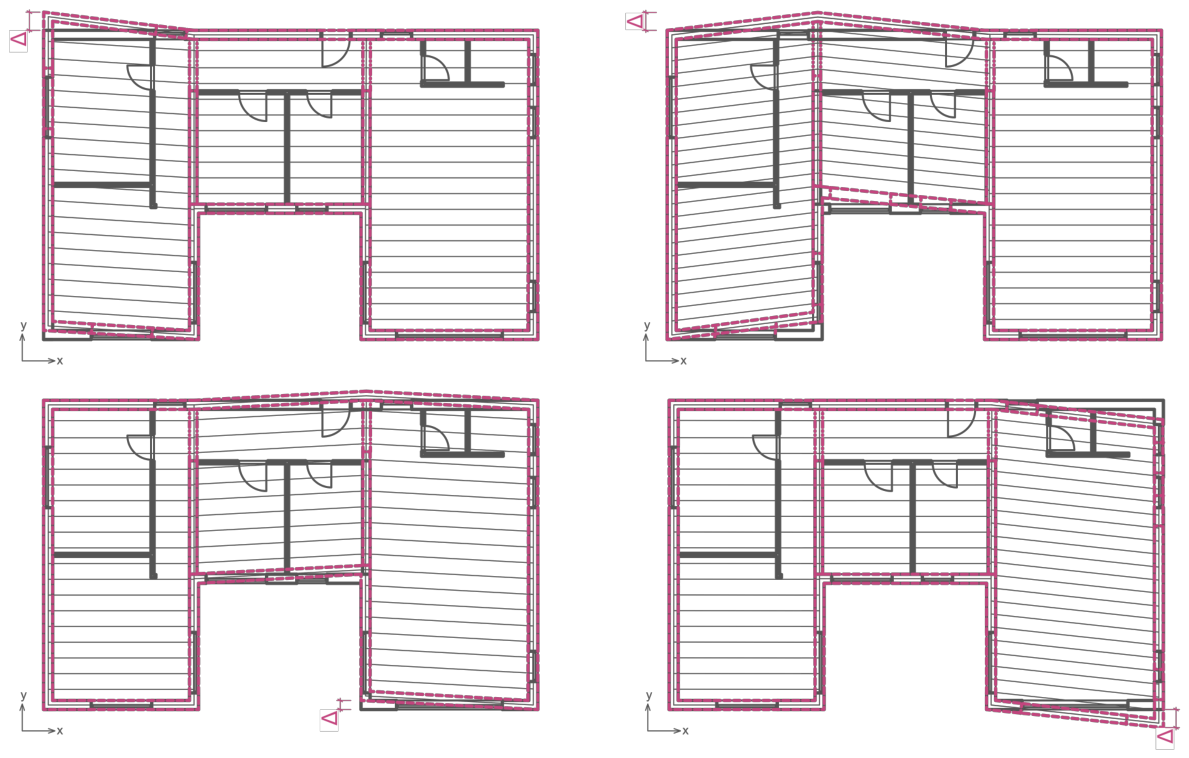
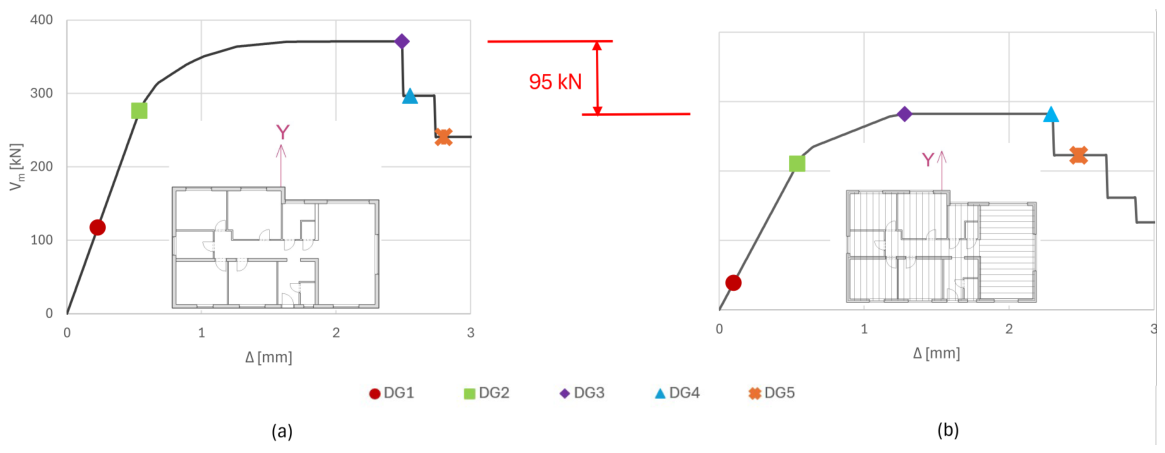
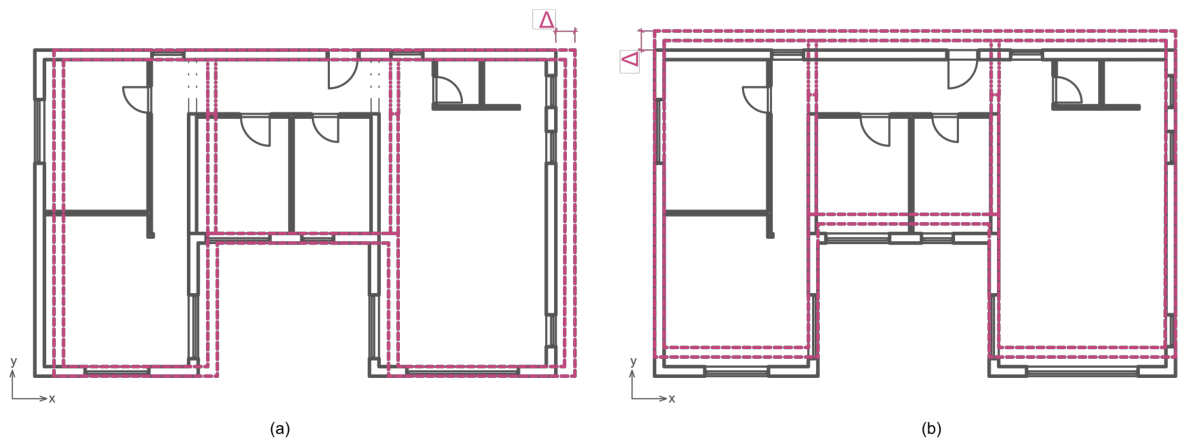
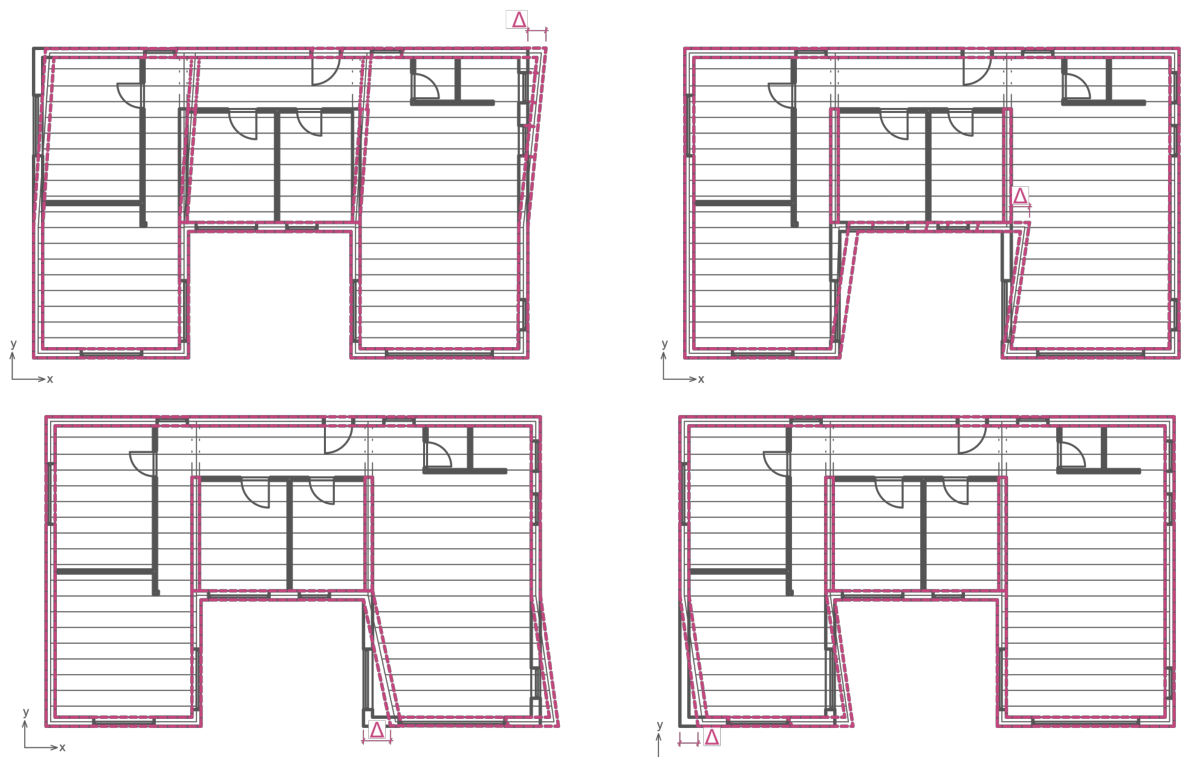
The failure mechanisms of the U-shaped masonry building with restricted diaphragm action under seismic loading in the X and Y directions are shown in Figure 13, Figure 14 and Figure 15, respectively. These deformation patterns indicate limited force redistribution between the individual wall groups and a concentration of seismic demand in the most heavily loaded structural elements. The corresponding global response in the X direction is presented in Figure 16, where the base-shear–displacement curves of the rigid reinforced-concrete diaphragm and the model with restricted diaphragm action are compared.

Rigid Diaphragm vs. Special Case with Restricted Diaphragm Action

X-direction
Under seismic loading in the X-direction, the U-shaped house with a rigid reinforced concrete slab demonstrated strong seismic resistance, with only minor damage (Damage Grade 1, DG1) in the form of hairline cracks and slight plaster fall.
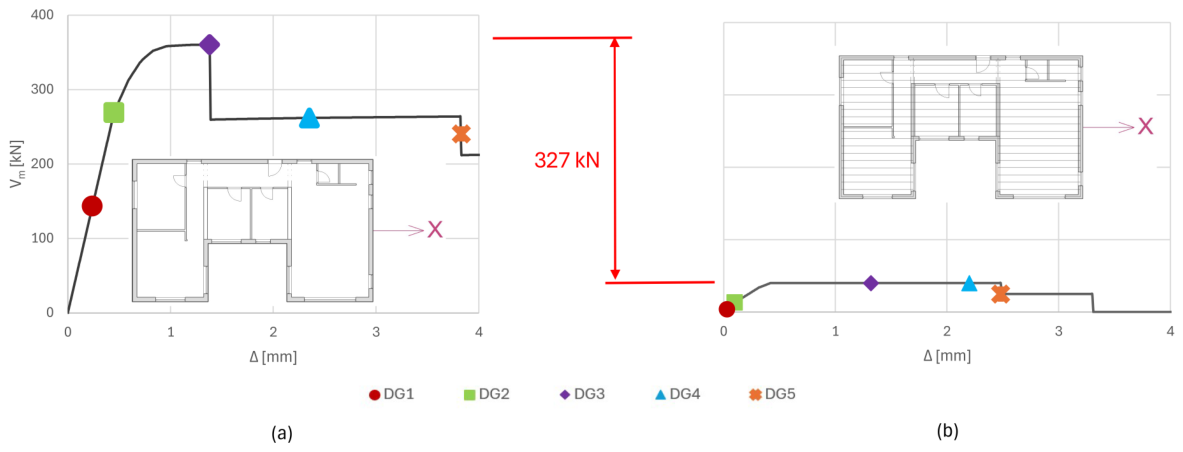
In the analysed special case without diaphragm action, the walls responded independently because no effective in-plane cooperation between the ceramic floor and the masonry walls was assumed. This resulted in a significant reduction in maximum capacity of about 327 kN (90% reduction) (illustrated in Figure 16), reaching Damage Grade 2 (DG2) under the same seismic conditions, characterised by extensive cracking and plaster fall, indicating greater vulnerability.
Y-direction
The load in the Y-direction showed similar performance to that in the X-direction. The building displayed DG1 damage, highlighting the effectiveness of the rigid diaphragm in uniformly distributing the lateral forces.
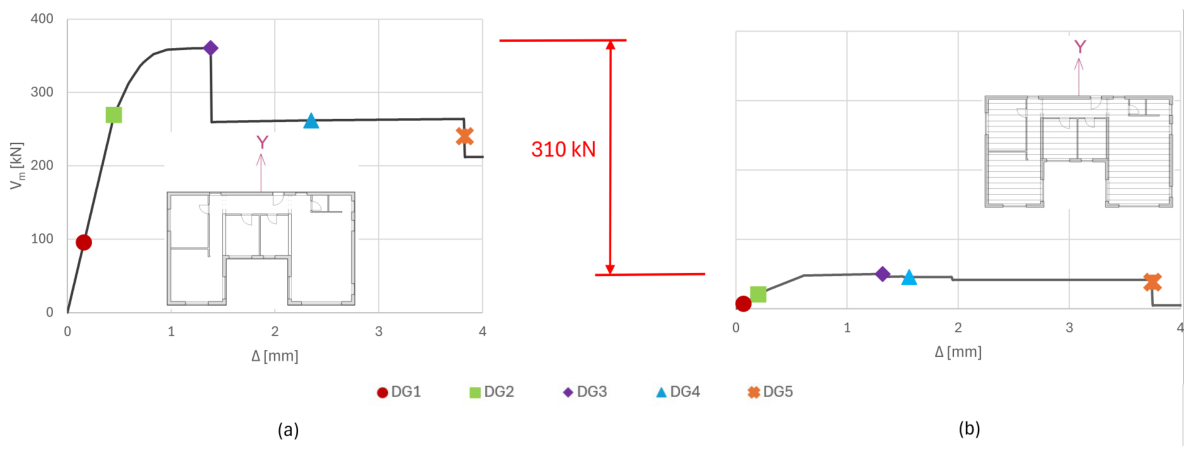
However, compared to the rigid diaphragm, there was a significant reduction in the maximum capacity of approximately 310 kN (85% reduction) (illustrated in Figure 17), with the building reaching DG2 and indicating a high susceptibility to damage. The U-shaped house consistently showed higher damage levels than the rectangular house with a special case with restricted diaphragm action, emphasising that geometric irregularities intensify the negative effects of diaphragm flexibility during seismic events. Table 2 summarises the key quantitative capacity indicators extracted from the capacity curves presented above (Figure 9, Figure 10, Figure 15 and Figure 16): yield displacement ( Δ y ), ultimate displacement ( Δ u ), maximum base shear capacity ( V m ), and the displacement ductility ratio ( μ = Δ u / Δ y ), for both diaphragm types, both building configurations, and both principal directions [12,13,26].

5. Discussion

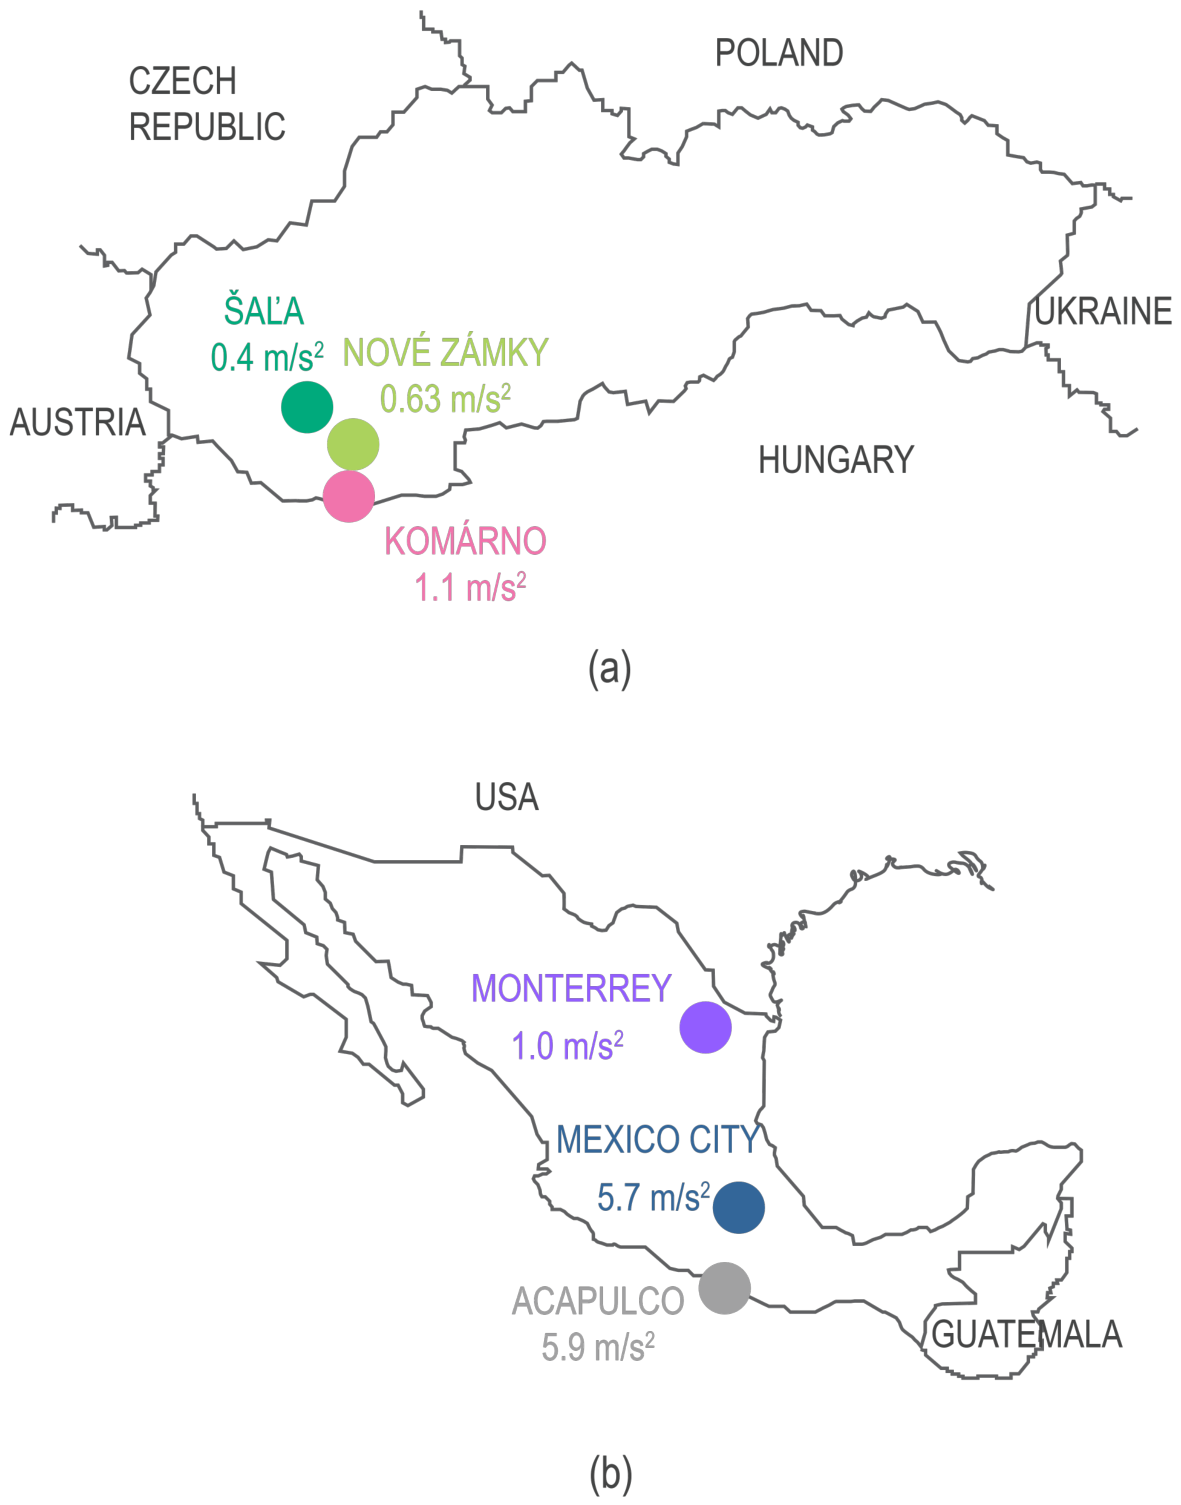
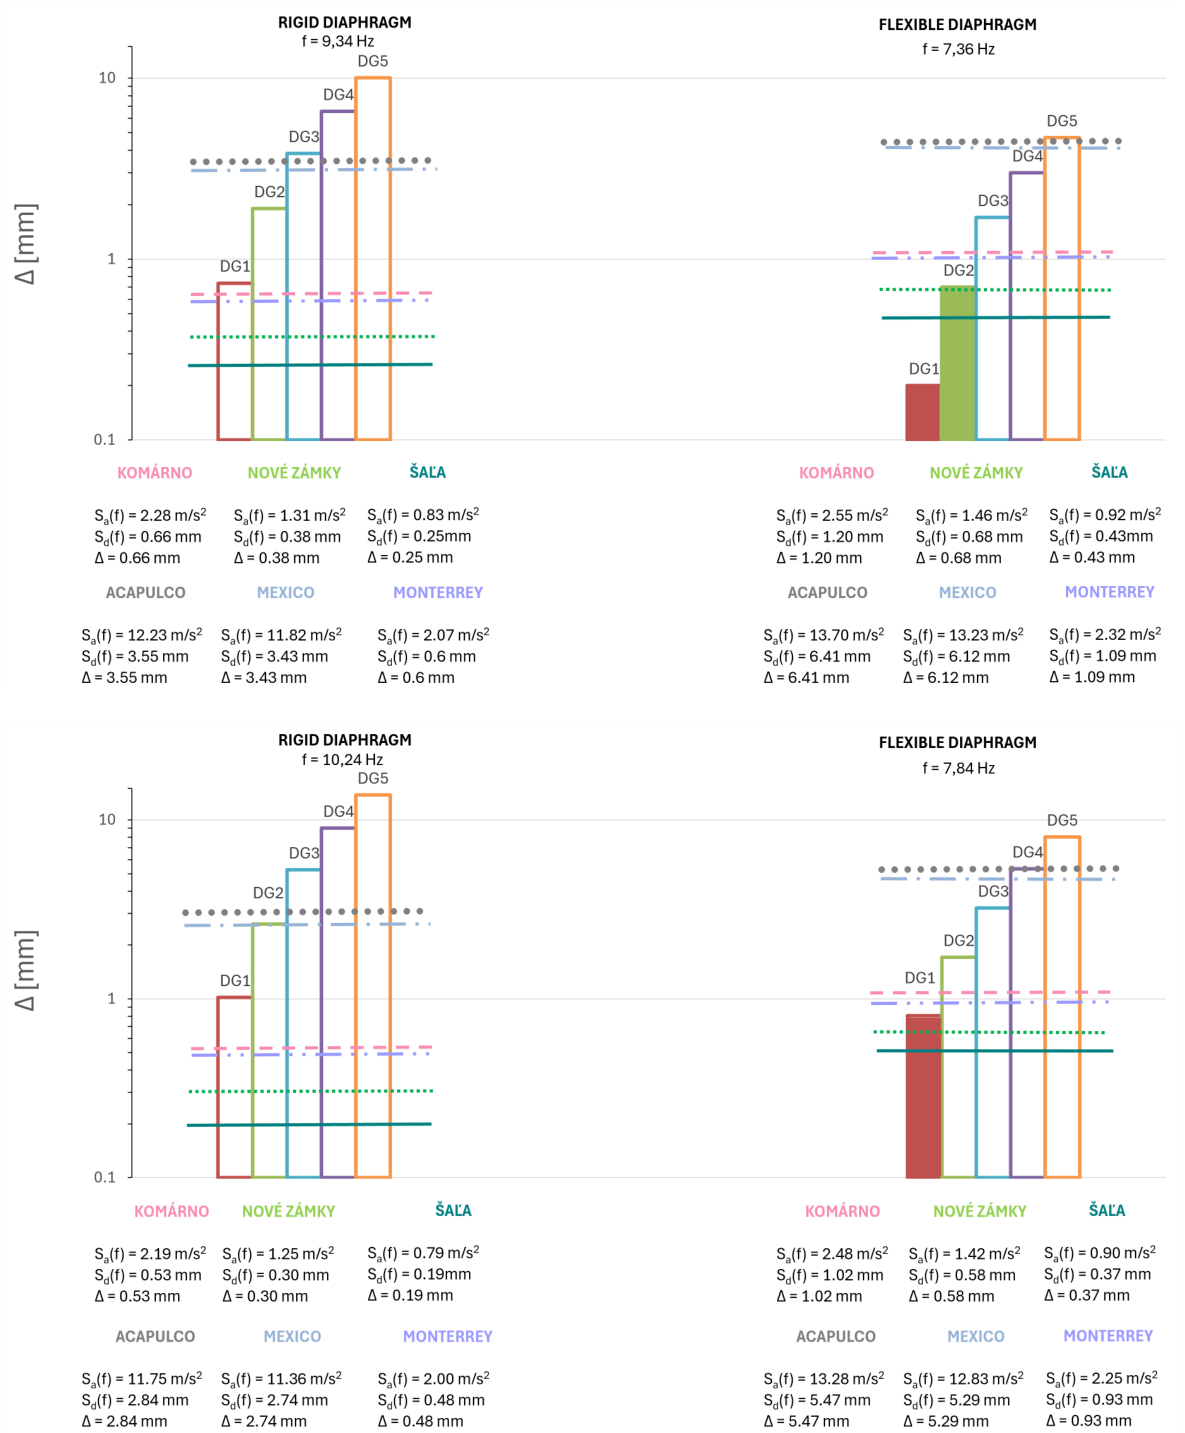
The comparative evaluation of the analysed masonry buildings clearly demonstrates that both structural regularity and diaphragm stiffness fundamentally influence their seismic loading. This discussion integrates the numerical findings with regional seismicity, broadening the interpretative framework beyond Central Europe through comparison with representative seismic environments in Mexico, one of the world’s most tectonically active regions. Peak ground accelerations in the Slovak localities—Komárno (1.1 m/s2), Nové Zámky (0.63 m/s2), and Šal’a (0.4 m/s2)—correspond to low-to-moderate hazard conditions that rarely cause severe structural distress in low-rise masonry buildings [28]. In contrast, the Mexican regions—Acapulco (5.9 m/s2), Mexico City (5.7 m/s2), and Monterrey (1.0 m/s2)—as illustrated in Figure 18, exhibit substantially higher hazard levels, particularly in Acapulco and Mexico City, which are strongly influenced by subduction-zone dynamics and amplification within the soft-soil basin [13,32]. This difference in seismic conditions provides a basis for evaluating the performance of masonry buildings with different diaphragm arrangements.
The assessment compares two diaphragm systems—rigid reinforced-concrete slabs and flexible ceramic prefabricated slabs—implemented in two representative architectural configurations: a quasi-rectangular layout and a U-shaped configuration that inherently introduces torsional irregularities. For each configuration, the top-floor displacements corresponding to the EMS-98 damage levels DG1–DG5 were determined under seismic excitation in both principal directions (X and Y). This analytical approach captures the interplay among diaphragm stiffness, structural regularity, and seismic intensity, enabling an integrated interpretation of load redistribution mechanisms, capacity degradation, and vulnerability patterns in the analysed buildings.
In all investigated regions, the results consistently show that rigid diaphragms provide superior seismic resistance by enforcing uniform in-plane force transfer and substantially limiting deformation. In Central Europe, buildings with rigid slabs remained within DG1, even in Komárno, experiencing only minor cracking indicative of early elastic-range behaviour.
In the special case in which the ceramic floor provides no effective diaphragm action, the absence of floor–wall interaction increased structural drift and reduced the global load-bearing capacity [6,9,11]. The effect was particularly pronounced in the U-shaped configuration, where torsional response amplified local shear demands and promoted the earlier initiation of diagonal cracking. This indicates that plan irregularity is a major contributor to seismic vulnerability when diaphragm stiffness is insufficient [6,10].
Under the substantially higher PGA values characteristic of southern and central Mexico, diaphragm stiffness became even more important in limiting severe damage. In Acapulco and Mexico City, rigid diaphragms maintained structural performance mainly within DG2, although displacement demands approached the upper limit of this damage grade. In particular, Mexico City, with its soft lacustrine deposits, exhibited pronounced site-amplification effects that increased drift compared with Acapulco under comparable PGA values, underscoring the sensitivity of masonry structures to local soil conditions [13,28,32]. Under these higher seismic demands, the special case without diaphragm action reached DG3, with the U-shaped building showing the greatest vulnerability because of the combined effects of the absence of effective diaphragm action and torsional irregularity. These results indicate that configurations without effective diaphragm action may be unsuitable for high-hazard environments, particularly in regions affected by strong subduction-zone or basin-amplification ground motions [6,7,9,11].
Monterrey, with a PGA of 1.0 m/s2, comparable to that of Komárno, exhibited behaviour broadly consistent with the Central European results. Rigid slabs maintained DG1 performance in both principal directions, while the special case without diaphragm action led to DG2 without progressing to DG3. This indicates that the analysed configuration without effective diaphragm action produced less severe damage under moderate seismic demand than under the high-demand Mexican scenarios. However, this result should not be interpreted as demonstrating general structural acceptability or code compliance. Even in Monterrey, the U-shaped configuration exhibited significant torsional rotation, demonstrating that geometric irregularity remains a source of vulnerability independent of regional seismicity [6,7,10].
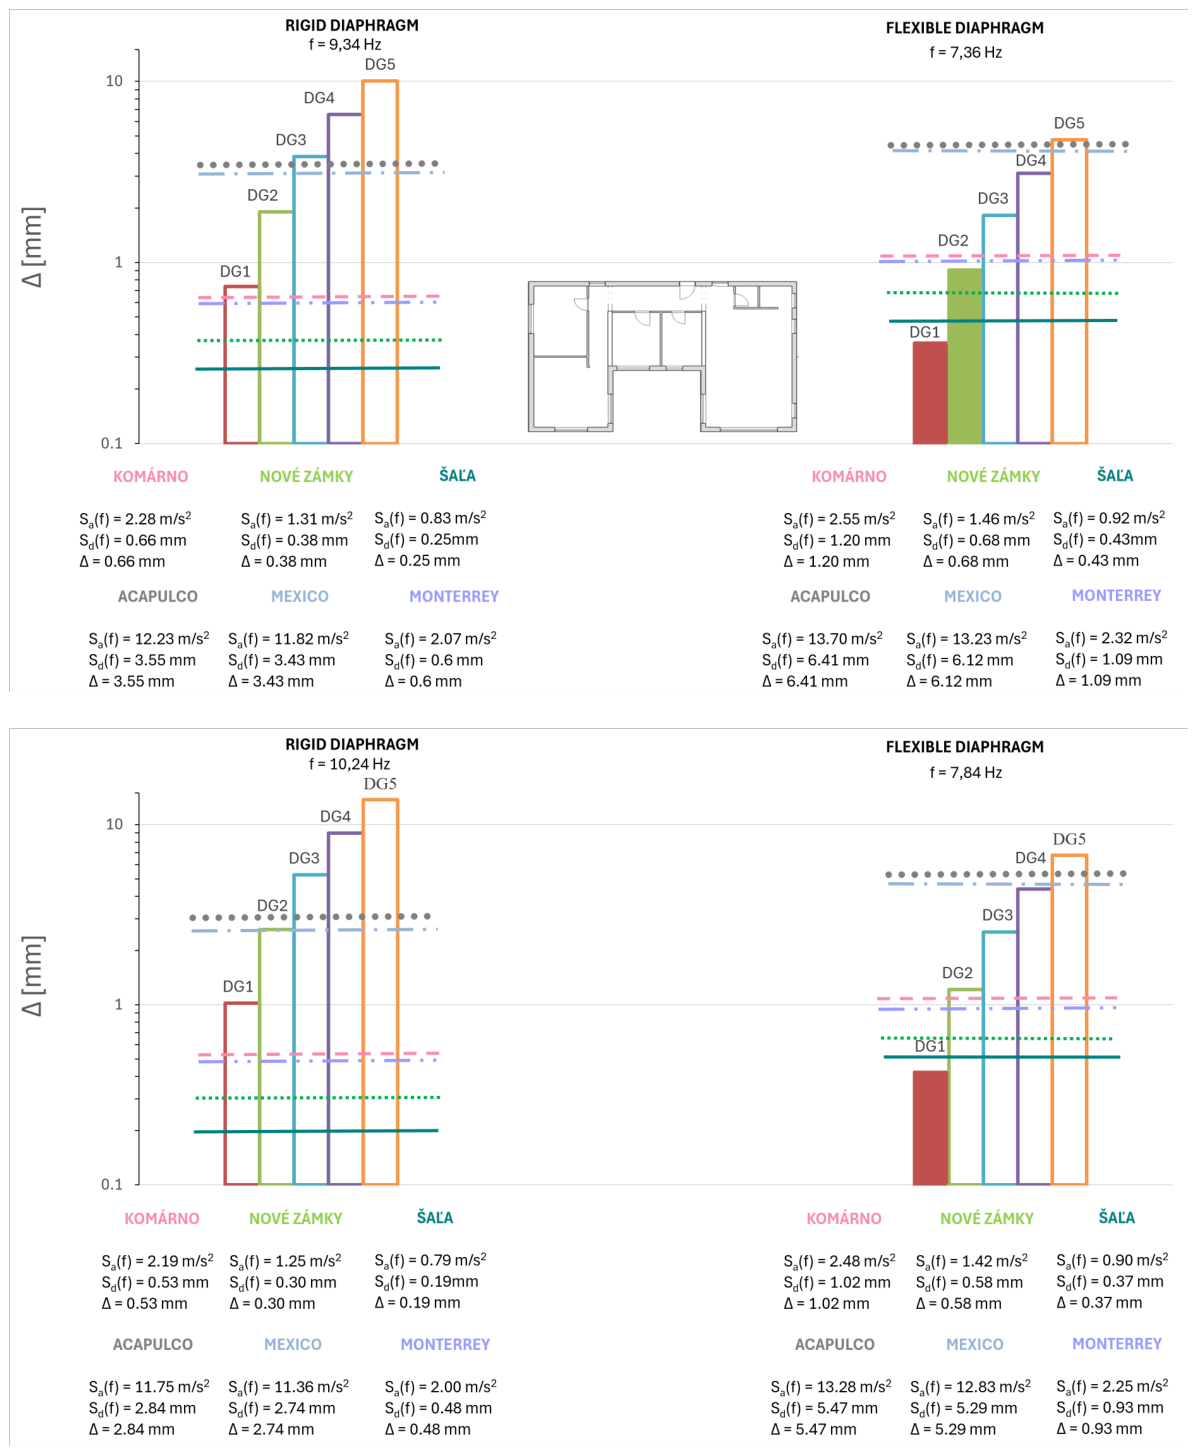
The seismic response in the X direction, shown in Figure 19, revealed pronounced sensitivity to diaphragm stiffness in both countries. Buildings with rigid diaphragms displayed stable in-plane behaviour, remaining within DG1 even under the elevated PGA levels considered for Komárno and Monterrey. In Acapulco and Mexico City, rigid diaphragms preserved structural integrity, with displacement demands approaching, but not exceeding, DG2 thresholds. However, the absence of effective diaphragm action caused substantial increases in drift and pronounced reductions in load-bearing capacity, shifting quasi-rectangular buildings to DG2 and U-shaped buildings towards DG3 [6,9,11]. This degradation resulted primarily from non-uniform force redistribution and increased torsional coupling, particularly in irregular layouts, confirming that diaphragm stiffness strongly governs X-direction performance [6,7,9,10].
The seismic behaviour in the Y direction, shown in Figure 20, was broadly consistent with the X-direction response shown in Figure 19, while benefiting slightly from more favourable wall alignment and marginally higher lateral stiffness. The rigid-diaphragm models retained DG1 in the Central European regions and Monterrey. Although displacement demands in Acapulco and Mexico City increased substantially, the damage remained within DG2. The special case without diaphragm action exhibited a more pronounced dependence on plan regularity: quasi-rectangular buildings remained within DG1–DG2, while U-shaped buildings experienced amplified torsion, leading to DG2 in Slovakia and tendencies towards DG3 in the high-PGA Mexican regions [6,10,11]. These observations indicate that although the Y direction provides modestly higher lateral stiffness, this benefit cannot compensate for the detrimental effects of insufficient diaphragm action in geometrically irregular structures subjected to strong ground motion.
In general, the analysis demonstrates that diaphragm stiffness is a major factor influencing structural performance under seismic loading, and its importance increases with seismic demand [6,7,9,11]. The analysed configurations without effective diaphragm action exhibited lower damage levels in the low-to-moderate hazard scenarios considered for Šal’a, Nové Zámky, Komárno, and Monterrey. However, they presented substantially greater vulnerability in the high-seismicity scenarios considered for Acapulco and Mexico City. Structural regularity further influenced this response, as U-shaped buildings consistently exhibited higher seismic demands, particularly when combined with limited diaphragm action. These findings highlight the importance of considering both diaphragm configuration and floor-plan geometry when assessing or designing masonry buildings in regions exposed to elevated ground motions.
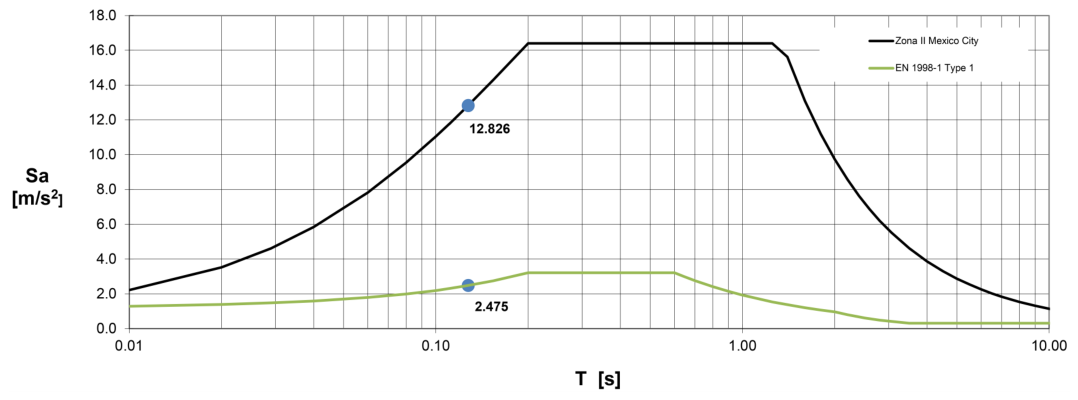
It should be noted that this regional comparison is based on the spectral displacement demand S d ( f 1 ) evaluated at each building’s fundamental frequency, as shown in Figure 19 and Figure 20, rather than on PGA alone. Therefore, site- and structure-specific spectral characteristics are incorporated into the determination of the performance point. This is illustrated in Figure 21, which compares the elastic response spectrum for Mexico City Zone II, representing soft-soil lacustrine conditions, with the EN 1998-1 Type 1 spectrum [12,26,28]. Within the period range corresponding to the fundamental frequencies of the analysed buildings ( T 0.10 0.14 s), the spectral acceleration in Mexico City Zone II reaches S a = 12.826 m/s2, compared with S a = 2.475 m/s2 for the EN 1998-1 spectrum at the same period, representing a factor of approximately 5.2. This demonstrates that the higher seismic demand observed for the Mexican sites arises not only from higher PGA values, but also from the amplified and broadened spectral plateau associated with soft-soil site response, consistent with the documented resonance behaviour of the Mexico City lacustrine basin [13,28,32]. A full microzonation-based site-response analysis explicitly modelling this soil amplification was not performed and remains an important direction for future work.

6. Conclusions

The comparison between the analysed building typologies revealed that floor-plan irregularity and diaphragm stiffness cannot be treated as independent parameters in seismic assessment. While the quasi-rectangular building maintained relatively stable behaviour under the analysed diaphragm configurations, the U-shaped configuration experienced substantially greater deterioration because of torsional amplification and uneven force distribution. Consequently, irregular masonry structures are considerably more sensitive to the absence of effective diaphragm action than regular layouts.
Beyond confirming the superior performance of rigid diaphragms, the results provide practical engineering guidance according to seismic hazard level and plan regularity. In the low-to-moderate hazard scenarios considered for Šal’a, Nové Zámky, Komárno, and Monterrey, the analysed regular buildings remained within DG1–DG2 under both diaphragm assumptions. This result should not, however, be interpreted as demonstrating general structural acceptability or compliance with design standards. In the high-hazard scenarios considered for Acapulco and Mexico City, the reinforced-concrete diaphragm substantially improved structural performance. For U-shaped and other irregular floor plans, the results indicate that an effective in-plane force-transfer mechanism should be explicitly verified during design or assessment.
The detrimental influence of the special case without diaphragm action was reflected not only in reductions in global capacity of 32–90%, but also in larger roof displacements, higher EMS-98 damage grades, and more localised damage, particularly in irregular buildings. It should be emphasised that the analysed case without diaphragm action represents a conservative limiting modelling assumption adopted to quantify the upper-bound influence of the absence of floor–wall interaction. Therefore, the reported reductions in capacity should not be interpreted as representative of the behaviour of all ceramic floor systems, but rather as the structural response under the most unfavourable diaphragm condition. For such configurations, retrofit measures, including reinforced-concrete ring beams, seismic separation joints, or local diaphragm stiffening near re-entrant corners, may significantly reduce torsional effects.
An important contribution of this research is the development of an automated computational tool for the nonlinear seismic assessment of masonry buildings using only a limited number of input parameters. The algorithm automatically generates wall capacity curves, evaluates global structural capacity, assigns EMS-98 damage grades, and constructs vulnerability functions, substantially reducing modelling effort while preserving the dominant mechanisms governing structural response.
The proposed methodology provides an efficient framework for the rapid seismic screening of large masonry-building inventories and can support seismic risk assessment, retrofit prioritisation, and civil protection planning, particularly in southern Slovakia, where masonry buildings constitute a significant proportion of the residential building stock.
It should be emphasised that the results obtained for the ceramic floor do not represent the general behaviour of all ceramic floor systems. They correspond to a special modelling assumption in which no effective in-plane diaphragm action exists and the masonry walls act individually without structural cooperation through the floor.
Future work should focus on calibration using experimental and post-earthquake observations and should include additional independent laboratory testing of masonry material properties, validation against nonlinear time-history analyses or shake-table experiments, extension to additional plan configurations, incorporation of soil–structure interaction, and application to multi-storey and reinforced masonry buildings with more complex dynamic behaviour.

Author Contributions

Conceptualization, M.S. and S.E.C.S.; Validation, L.O.; Formal analysis, L.O., M.S. and S.E.C.S.; Investigation, L.O., M.S. and S.E.C.S.; Writing—original draft, L.O.; Writing—review & editing, M.S. and S.E.C.S.; Supervision, M.S. and S.E.C.S.; Project administration, M.S. All authors have read and agreed to the published version of the manuscript.

Funding

This paper has been supported by the Grant APVV-22-0431 provided by APVV, Slovak Research and Development Agency.

Data Availability Statement

The original contributions presented in the study are included in the article, and further inquiries can be directed to the corresponding author.

Conflicts of Interest

On behalf of all authors, the corresponding author states that there are no conflicts of interest.

References

  1. Beyer, K.; Tondelli, M.; Vanin, F.; Petry, S.; Paparo, A. Seismic Behaviour of Unreinforced Masonry Buildings with Reinforced Concrete Slabs: Assessment of In-Plane and Out-of-Plane Response. Ph.D. Thesis, École Polytechnique Fédérale de Lausanne, Lausanne, Switzerland, 2015. [Google Scholar]
  2. Çitiloğlu, C. Seismic loading Assessment of Confined Masonry Buildings. Ph.D. Thesis, Middle East Technical University, Ankara, Türkiye, 2016. [Google Scholar]
  3. Lang, K.; Bachmann, H. On the Seismic Vulnerability of Existing Buildings: A Case of the City of Basel. Earthq. Spectra 2004, 20, 43–66. [Google Scholar] [CrossRef] [Scilit]
  4. Marques, R.; Lourenço, P.B. Possibilities and comparison of structural component models for the seismic assessment of modern unreinforced masonry buildings. Eng. Struct. 2011, 33, 3118–3130. [Google Scholar]
  5. FEMA. Seismic Design of Rigid Wall–Flexible Diaphragm Buildings: An Alternate Procedure; FEMA P-1026; Building Seismic Safety Council: Washington, DC, USA, 2015.
  6. Kollerathu, J.A.; Menon, A. Role of Diaphragm Flexibility Modelling in Seismic Analysis of Existing Masonry Structures. Structures 2017, 11, 22–39. [Google Scholar] [CrossRef] [Scilit]
  7. Huang, Y.; Zhang, X.; Wang, L.; Hu, X. A Simplified Method for Evaluating the Diaphragm Flexibility for Frame-Shear Wall Structure under Earthquake Load. Buildings 2023, 13, 376. [Google Scholar] [CrossRef] [Scilit]
  8. Calvi, G.M. A displacement-based approach for vulnerability analysis of buildings. J. Earthq. Eng. 1999, 3, 411–439. [Google Scholar] [CrossRef] [Scilit]
  9. Drysdale, R.G.; Hamid, A.A. The Effects of Diaphragm Flexibility on Masonry Structures. ACI Struct. J. 1989, 86, 250–260. [Google Scholar]
  10. Hussein, G.; Eid, N.; Khaled, H. Torsional Behaviour of Irregular Structures during Earthquakes. IOSR J. Mech. Civ. Eng. 2019, 16, 40–55. [Google Scholar]
  11. Solarino, F.; Oliveira, D.V.; Giresini, L. Modelling of the seismic behaviour of wall-to-horizontal diaphragm connections in historical constructions: Application to a case study. Eng. Struct. 2023, 283, 115791. [Google Scholar] [CrossRef] [Scilit]
  12. Lagomarsino, S.; Giovinazzi, S. Macroseismic and mechanical models for the vulnerability and damage assessment of masonry buildings. Bull. Earthq. Eng. 2006, 4, 415–443. [Google Scholar] [CrossRef] [Scilit]
  13. Sokol, M.; Crespo-Sanchez, S.; Rodríguez Paz, M.X.; Mazáčková, K.; Gogová, Z. Damage identification of small houses in different seismic regions. In Proceedings of the 30th International Conference Engineering Mechanics, Milovy, Czech Republic, 14–16 May 2024; pp. 121–125. [Google Scholar]
  14. Ferreira, T.M.; Mendes, N.; Silva, R. Multiscale Seismic Vulnerability Assessment and Retrofit of Existing Masonry Buildings. Buildings 2019, 9, 91. [Google Scholar] [CrossRef] [Scilit]
  15. Cosgun, T.; Uzdil, O.; Sayin, B.; Zengin, K.K. Seismic Vulnerability Assessment of a Masonry Structure and an FRP-Strengthening Proposal. Case Stud. Constr. Mater. 2022, 17, e01680. [Google Scholar] [CrossRef] [Scilit]
  16. Yekrangnia, M. Seismic Vulnerability Assessment of Masonry Residential Buildings in the Older Parts of Tehran through Fragility Curves and Basic RVS Scores. Buildings 2023, 13, 302. [Google Scholar] [CrossRef] [Scilit]
  17. Ruggieri, S.; Porco, F.; Uva, G. A practical approach for estimating the floor deformability in existing RC buildings: Evaluation of the effects in the structural response and seismic fragility. Bull. Earthq. Eng. 2020, 18, 2083–2113. [Google Scholar] [CrossRef] [Scilit]
  18. Ruggieri, S.; Vukobratović, V. Acceleration demands in single-storey RC buildings with flexible diaphragms. Eng. Struct. 2023, 275, 115276. [Google Scholar] [CrossRef] [Scilit]
  19. Ruggieri, S.; Porco, F.; Uva, G. A numerical procedure for modeling the floor deformability in seismic analysis of existing RC buildings. J. Build. Eng. 2018, 19, 273–284. [Google Scholar] [CrossRef] [Scilit]
  20. Calio, I.; Marletta, M.; Panto, B. A simplified model for the evaluation of the seismic behaviour of masonry buildings. In Proceedings of the 10th International Conference on Civil, Structural and Environmental Engineering Computing; Civil-Comp Press: Stirlingshire, UK, 2005; p. 195. [Google Scholar]
  21. Chieffo, N. Seismic Vulnerability Assessment of Historical Masonry Buildings. Ph.D. Thesis, University of Naples Federico II, Naples, Italy, 2021. [Google Scholar]
  22. Lourenço, P.B.; Avila, L.; Vasconcelos, G.; Alves, J.P.; Mendes, N.; Costa, A.C. Experimental investigation on the seismic loading of masonry buildings using shaking table testing. Bull. Earthq. Eng. 2013, 11, 1157–1190. [Google Scholar] [CrossRef] [Scilit]
  23. Mendes, N.; Lourenço, P.B. Sensitivity analysis of the seismic loading of existing masonry buildings. Eng. Struct. 2014, 80, 137–146. [Google Scholar] [CrossRef] [Scilit]
  24. Sokol, M.; Oravcová, L. The Impact of the Diaphragm on Pushover Analysis of Small Masonry Buildings. In International Conference on Structural and Physical Aspects of Construction Engineering; Springer Nature: Cham, Switzerland, 2025. [Google Scholar]
  25. Chopra, A.K.; Goel, R.K. A modal pushover analysis procedure for estimating seismic demands for buildings. Earthq. Eng. Struct. Dyn. 2002, 31, 561–582. [Google Scholar] [CrossRef] [Scilit]
  26. Fajfar, P. A nonlinear analysis method for performance-based seismic design. Earthq. Spectra 2000, 16, 573–592. [Google Scholar] [CrossRef] [Scilit]
  27. Grünthal, G. (Ed.) European Macroseismic Scale 1998 (EMS-98): Guidelines and Background Material; Centre Européen de Géodynamique et de Sismologie/Conseil de l’Europe: Luxembourg, 1998. [Google Scholar]
  28. STN EN 1998-1; Design of Structures for Earthquake Resistance—Part 1: General Rules, Seismic Actions and Rules for Buildings. European Committee for Standardization (CEN) Technical Committee 250: Brussels, Belgium, 2004; (Slovak National Annex).
  29. Canditone, C.; Parisi, F.; D’Ayala, D.; Guardiola-Villora, A. Seismic Collapse Analysis of Unreinforced Masonry Buildings through Applied Element Micro-Modelling and Crack Width-Based Damage Measures. Bull. Earthq. Eng. 2025, 23, 4719–4753. [Google Scholar] [CrossRef] [Scilit]
  30. Sokol, M.; Tvrdá, K. Dynamics of Structures; STU: Bratislava, Slovakia, 2016. (In Slovak) [Google Scholar]
  31. Shen, J.; Zhang, Y.; Chen, J. Vulnerability assessment and collapse simulation of unreinforced masonry structures subjected to sequential ground motions. Bull. Earthq. Eng. 2022, 20, 8151–8177. [Google Scholar] [CrossRef] [Scilit]
  32. Gobierno de la Ciudad de México. Normas Técnicas Complementarias para Diseño por Sismo; Reglamento de Construcciones para la Ciudad de México: Mexico City, Mexico, 2017.
Figure 1. Schematic of the lateral resistance test set-up used in the manufacturer testing campaign, showing the vertical actuator applying constant precompression through a load cell, roller bearing, and cardan shaft, and the steel testing frame supported on the strong floor.
Buildings 16 03400 g001
Figure 2. Local failure modes in masonry constructions. Labels I–III correspond to the failure mechanisms described in the text.
Buildings 16 03400 g002
Figure 3. Bending moment distribution for three cases of coupled walls: (a) negligible coupling effect (interacting cantilever walls), (b) intermediate coupling effect, and (c) strong coupling effect due to horizontally acting earthquake forces and corresponding reactions. The arrows indicate the direction of the applied horizontal seismic forces.
Buildings 16 03400 g003
Figure 6. Plan and elevation of the quasi-rectangular low-rise masonry building with two different floor-diaphragm configurations; dimensions are given in metres: (a) rigid reinforced-concrete diaphragm and (b) special case with restricted diaphragm action.
Buildings 16 03400 g006
Figure 7. Failure mechanisms of the quasi-rectangular masonry building with a rigid reinforced-concrete diaphragm: (a) X direction and (b) Y direction. The pink dashed outline indicates the deformed structural configuration at the analysed displacement state, whereas the solid black outline represents the initial undeformed geometry.
Buildings 16 03400 g007
Figure 8. Failure mechanisms of the quasi-rectangular masonry building in the special case with restricted diaphragm action under loading in the X direction. The pink dashed outline indicates the deformed structural configuration at the analysed displacement state, whereas the solid black outline represents the initial undeformed geometry.
Buildings 16 03400 g008
Figure 9. Failure mechanisms of the quasi-rectangular masonry building in the special case with restricted diaphragm action under loading in the Y direction. The pink dashed outline indicates the deformed structural configuration at the analysed displacement state, whereas the solid black outline represents the initial undeformed geometry.
Buildings 16 03400 g009
Figure 10. Capacity curves of the quasi-rectangular masonry building in the X direction: (a) rigid reinforced-concrete diaphragm and (b) special case with restricted diaphragm action.
Buildings 16 03400 g010
Figure 11. Capacity curve of masonry building in Y direction: (a) rigid reinforced-concrete diaphragm and (b) special case with restricted diaphragm action.
Buildings 16 03400 g011
Figure 12. Plan and elevation of U-shaped low-rise masonry building with two different types of floor diaphragm (dimensions in m): (a) rigid concrete slabs, (b) special case with restricted diapragm action.
Buildings 16 03400 g012
Figure 13. Failure mechanisms of the U-shaped masonry building with a rigid reinforced-concrete diaphragm: (a) X direction and (b) Y direction. The pink dashed outline indicates the deformed structural configuration at the analysed displacement state, whereas the solid black outline represents the initial undeformed geometry.
Buildings 16 03400 g013
Figure 14. Failure mechanisms of the U-shaped masonry building in the special case with restricted diaphragm action under loading in the X direction. The pink dashed outline indicates the deformed structural configuration at the analysed displacement state, whereas the solid black outline represents the initial undeformed geometry.
Buildings 16 03400 g014
Figure 15. Failure mechanisms of the U-shaped masonry building in the special case with restricted diaphragm action under loading in the Y direction. The pink dashed outline indicates the deformed structural configuration at the analysed displacement state, whereas the solid black outline represents the initial undeformed geometry.
Buildings 16 03400 g015
Figure 16. Capacity curve of masonry building in X direction: (a) rigid concrete slabs, (b) special case with restricted diapragm action.
Buildings 16 03400 g016
Figure 17. Capacity curve of masonry building in Y direction: (a) rigid concrete slabs, (b) special case with restricted diapragm action
Buildings 16 03400 g017
Figure 18. Seismic hazard maps used for the regional comparison: (a) Slovak Republic and (b) Mexico.
Buildings 16 03400 g018
Figure 19. X-direction comparison of damage grades: (a) quasi-rectangular floor plan and (b) U-shaped floor plan.
Buildings 16 03400 g019
Figure 20. Y-direction comparison of damage grades: (a) quasi-rectangular floor plan and (b) U-shaped floor plan.
Buildings 16 03400 g020
Figure 21. Comparison of elastic response spectra for Mexico City Zone II (soft-soil conditions) and EN 1998-1 Type 1, showing the spectral acceleration at the fundamental period of the analysed buildings.
Buildings 16 03400 g021
Table 1. Comparison between assumed and manufacturer-tested masonry material properties (unpublished internal data).
ParameterModelExperiment
Compressive strength f (MPa)4.104.13
Modulus of elasticity E (MPa)30003088
Tensile/shear strength f t (MPa)0.170.17
Shear modulus G (MPa)300330
Table 2. Summary of capacity indicators for all analysed configurations.
Floor-Plan TypeDiaphragm/Direction Δ y (mm) Δ u (mm) V m (kN) μ = Δ u / Δ y
RectangularRigid, X1.804.70375.752.61
RectangularFlexible, X1.704.59167.622.70
RectangularRigid, Y1.834.70297.322.57
RectangularFlexible, Y1.644.59202.832.80
U-shapedRigid, X1.684.70363.592.80
U-shapedFlexible, X1.644.5936.442.80
U-shapedRigid, Y1.684.70363.592.80
U-shapedFlexible, Y1.644.5953.142.80
Disclaimer/Publisher’s Note: The statements, opinions and data contained in all publications are solely those of the individual author(s) and contributor(s) and not of MDPI and/or the editor(s). MDPI and/or the editor(s) disclaim responsibility for any injury to people or property resulting from any ideas, methods, instructions or products referred to in the content.