Article

Seismic Performance of Composite Beams Using Uplift-Restricted and Slip-Permitted Perfobond Rib Shear Connectors

College of Civil Aviation, Nanjing University of Aeronautics and Astronautics, Nanjing 211106, China
*
Author to whom correspondence should be addressed.
Buildings 2026, 16(17), 3344; https://doi.org/10.3390/buildings16173344
Submission received: 5 July 2026 / Revised: 17 August 2026 / Accepted: 21 August 2026 / Published: 22 August 2026
(This article belongs to the Section Building Structures)

Abstract

Steel–concrete composite beams offer significant advantages in long-span, heavy-load, and prefabricated construction; however, the concrete slabs are prone to tensile cracking under negative bending moments. To enhance cracking resistance, uplift-restricted and slip-permitted (URSP) perfobond rib (PBL) connectors were adopted with a cast-in-place high-performance concrete (HPC) topping. Five composite beam-steel column joint specimens were tested under quasi-static cyclic loading. The test variables included connector type, cast-in-place concrete type, and reinforcement grade. In addition, refined numerical simulations were conducted on the test specimens. Both test and numerical results show that: (1) The combined application of URSP-PBL connectors and HPC enhanced the cracking resistance of the composite beam, with the initial cracking load and corresponding cracking displacement increased by approximately 50% compared with the control specimen. (2) The ultimate flexural capacity of the composite beams under negative moments showed limited sensitivity to the type of cast-in-place concrete topping and the reinforcement grade within the tested range. (3) The use of URSP-PBL connectors improved the flexural stiffness of the composite beams. (4) The URSP-PBL specimens showed good energy dissipation capacity under cyclic loading, which was further improved with the addition of HPC in the topping. Within the tested range, the reinforcement grade showed limited influence on this performance. This study provides a scientific basis for the crack control design and engineering application of long-span composite beams.

1. Introduction

For long-span steel–concrete composite beams, the negative moment regions are subjected to tensile stresses in the concrete slab and compressive stresses in the steel beam [1,2]. As a result, the structural response in these regions is typically governed by cracking of the concrete slab and buckling of the steel beam [3,4]. Moreover, once cracking occurs, aggressive agents from the environment can penetrate through the cracks, compromising the long-term durability of the composite beam [5,6,7,8,9]. Therefore, effective crack control in the negative moment region is a critical design consideration for continuous composite beams. Currently, prestressing is the primary method adopted to improve the cracking resistance in the negative moment regions of composite beams [10,11]. Experimental studies on prestressed steel–concrete composite beams have shown that external prestressing applied in the negative moment region can effectively enhance the cracking resistance [12,13]. However, for steel–concrete composite beams, a portion of the prestressing force is absorbed by the steel section due to composite action, which significantly reduces the efficiency of prestress transfer [14,15,16]. Furthermore, the detailing of the tensioning and anchorage systems is complicated, and prestress losses caused by creep and shrinkage of concrete are difficult to predict accurately [17,18].
To address this issue, the research group led by Academician Nie Jianguo developed uplift-restricted and slip-permitted (URSP) connectors, in which a low-elastic-modulus material is wrapped around conventional shear studs to partially release the composite action between the steel beam and the concrete slab in the negative moment region. Jiang et al. [19] conducted tests on a 5 m span continuous composite beam with URSP screw-type(URSP-S) connectors using 5 mm thick foam. Their results showed that the URSP-S connectors can partially release the composite action and effectively control cracking in the negative moment region. Nie et al. [20] investigated a composite frame with a 3 m span beam using URSP-S connectors with 2.5 mm thick foam in the negative moment region. Compared with full-span stud connectors, the URSP-S connectors significantly reduced the number and width of cracks in the concrete slab, as well as the tensile strains in both the concrete and reinforcing bars. Meanwhile, the interface slip between the steel beam and the concrete slab was notably increased, while the stiffness of the composite frame under vertical and lateral loading decreased only slightly. Duan et al. [21] also tested a 3 m span composite frame with URSP-S connectors (2.5 mm foam thickness). The experimental results showed that the combined use of ECC and URSP-S connectors improved crack resistance by 55% in terms of crack width, with negligible influence on the overall structural performance of the composite frames. Specifically, ECC played a dominant role in controlling crack width, whereas URSP-S connectors primarily governed the reduction in crack number. On the other hand, the arrangement length of URSP connectors at the beam ends is another key parameter affecting the structural performance of composite beams. Duan et al. [22] conducted a parametric study on URSP-S connectors in frame structures, investigating the influence of URSP-S arrangement length on the mechanical behavior of composite beams, and provided recommendations for the optimal arrangement length.
The slip capacity of the above-mentioned stud-type uplift-restricted and slip-permitted (URSP) connectors is directly governed by the thickness of the foam wrapped around the studs. The typical slip capacity is approximately 2 mm, as shown in Figure 1a. However, previous studies have shown that for a 2 m span composite beam, the slip demand in the negative moment region can already exceed 2 mm [23,24]. For a 40 m span composite beam, the slip demand may reach up to 10 mm or even greater. Moreover, a lower degree of shear connection further amplifies the slip demand [25]. To address this issue, Gao et al. [26] proposed a novel URSP perfobond rib (PBL) connector. In this new connector, the perforated rebars are wrapped with a low-elastic-modulus material, which significantly increases the available slip capacity and thereby releases the unfavorable tensile stresses in the concrete slab. However, since the perforated rebars are wrapped with rubber around the entire perimeter, this configuration inevitably leads to a reduction in uplift resistance. To meet both the substantial slip demand and the uplift-restraint requirement in the negative moment regions of long-span composite beams, this study proposes a novel perforated steel plate-type URSP connector. The proposed URSP connector consists of a steel plate placed along the longitudinal direction of the steel beam and welded to the top flange. In the negative moment region, slotted holes are introduced in the steel plate, through which reinforcing bars are passed. The height of the slotted hole matches the diameter of the transverse reinforcing bar. The spaces surrounding the reinforcing bars within the slots are filled with a low-elastic-modulus material to accommodate relative slip. Notably, the uplift resistance of the connector is not compromised by the slotted holes, as they are designed primarily to facilitate slip rather than to impair the uplift-restraining capacity of the steel plate. This configuration permits relative longitudinal slip between the bars and the steel beam, thereby achieving the desired slip-permitted behavior while maintaining uplift resistance. In the positive moment region, circular holes are adopted. These holes are filled with cast-in-place concrete, and transverse reinforcing bars pass through them. This enables the connector to provide both uplift resistance and shear transfer capacity, as shown in Figure 1b.
Compared with the URSP-S connector, the URSP-PBL connector proposed in this study exhibits a design configuration intended to provide increased slip capacity and uplift restraint. In terms of slip capacity, the proposed URSP-PBL connector provides a geometric free-slip allowance of up to approximately 10 mm through a slotted-hole zone filled with foam material, which is determined by the slot length. Moreover, the slip capacity can be flexibly adjusted by varying the length of the elliptical holes to accommodate different longitudinal slip demands. The pull-out resistance of the proposed connector is governed primarily by the transverse reinforcing bars passing through the holes, providing a configuration intended to maintain uplift resistance. Regarding the shear transfer mechanism, the URSP connector accommodates and initiates the relative slip between the steel beam and the concrete slab through the crushing of the foam filler inside the holes under compression in the negative moment region. This mechanism effectively decouples the slab from the steel beam and releases the tensile stresses in the concrete slab. In addition, the proposed connector offers several design advantages. It requires only elliptical holes on a conventional steel plate without special machining, which simplifies fabrication. The elliptical holes facilitate the placement of transverse reinforcing bars, greatly improving constructability. The perforated steel plate, oriented longitudinally along the flange, can also serve as a stiffener providing substantial shear stiffness and strength, and this effect is further enhanced by the incorporation of transverse reinforcing bars. In summary, the URSP connector achieves a flexibly controllable slip capacity and excellent constructability while maintaining an uplift-restraining configuration.
To investigate the effectiveness of the proposed measures on crack control in the negative moment region of long-span composite beams, quasi-static tests were conducted on composite beam-steel column joints with laminated slabs. The experimental program incorporates comprehensive anti-cracking measures, including the proposed URSP connectors and the use of high-performance concrete (HPC) in the cast-in-place topping, considering the beneficial effect of HPC on crack resistance. The key parameters include connector type, concrete material in the cast-in-place concrete topping, and reinforcement grade. The structural responses are evaluated in terms of failure mode, load-carrying capacity, flexural stiffness, ductility, and energy dissipation capacity. The test results are intended to reveal the cracking mechanism of composite beams with laminated slabs under negative bending moments and to provide a scientific basis for the design and application of such systems in long-span structures.

2. Experimental Program

2.1. Specimen Design

In this study, a substructure testing approach was used. A critical part of a composite beam under negative bending was selected for local and careful experimental tests. Quasi-static cyclic tests were conducted on a 2 m span substructure specimen. The aim was to study the slip and uplift behavior of URSP connectors in the negative moment region, as well as the seismic performance of the composite beam. This testing method was not meant to accurately predict the overall response of a long-span composite beam. The slip need of a 40 m span composite beam was taken as the research background. Based on that, the connector was designed with a slip capacity of 10 mm, and a large-displacement loading method was used. The applied displacement was much larger than the deflection limit of L/30 given in the Code for Design of Steel–Concrete Composite Bridges [27]. This test was designed to check the connector behavior under large slip demands. Therefore, the results obtained in this study are mainly valid for the geometric dimensions and parameter ranges examined. Nevertheless, they may serve as a reference for the design of connectors in long-span composite beams.
All specimens shared the same dimensions and materials for beams, columns, and precast slabs. The test variables included connector type, cast-in-place concrete material, and cast-in-place reinforcement grade. The specimens were designated according to the naming convention “connector type-concrete material-reinforcement grade”. Here, URSP-S and URSP-PBL denote the screw-type and PBL-type URSP connectors, respectively; NC and HPC denote normal concrete and high-performance concrete, respectively; and 400 and 500 denote HRB400 and HRB500 reinforcement grades, respectively. For example, specimen URSP-S-NC-400 indicates the use of URSP screw-type connectors, normal concrete in the cast-in-place concrete topping, and HRB400 reinforcement. The specimen parameters are summarized in Table 1.
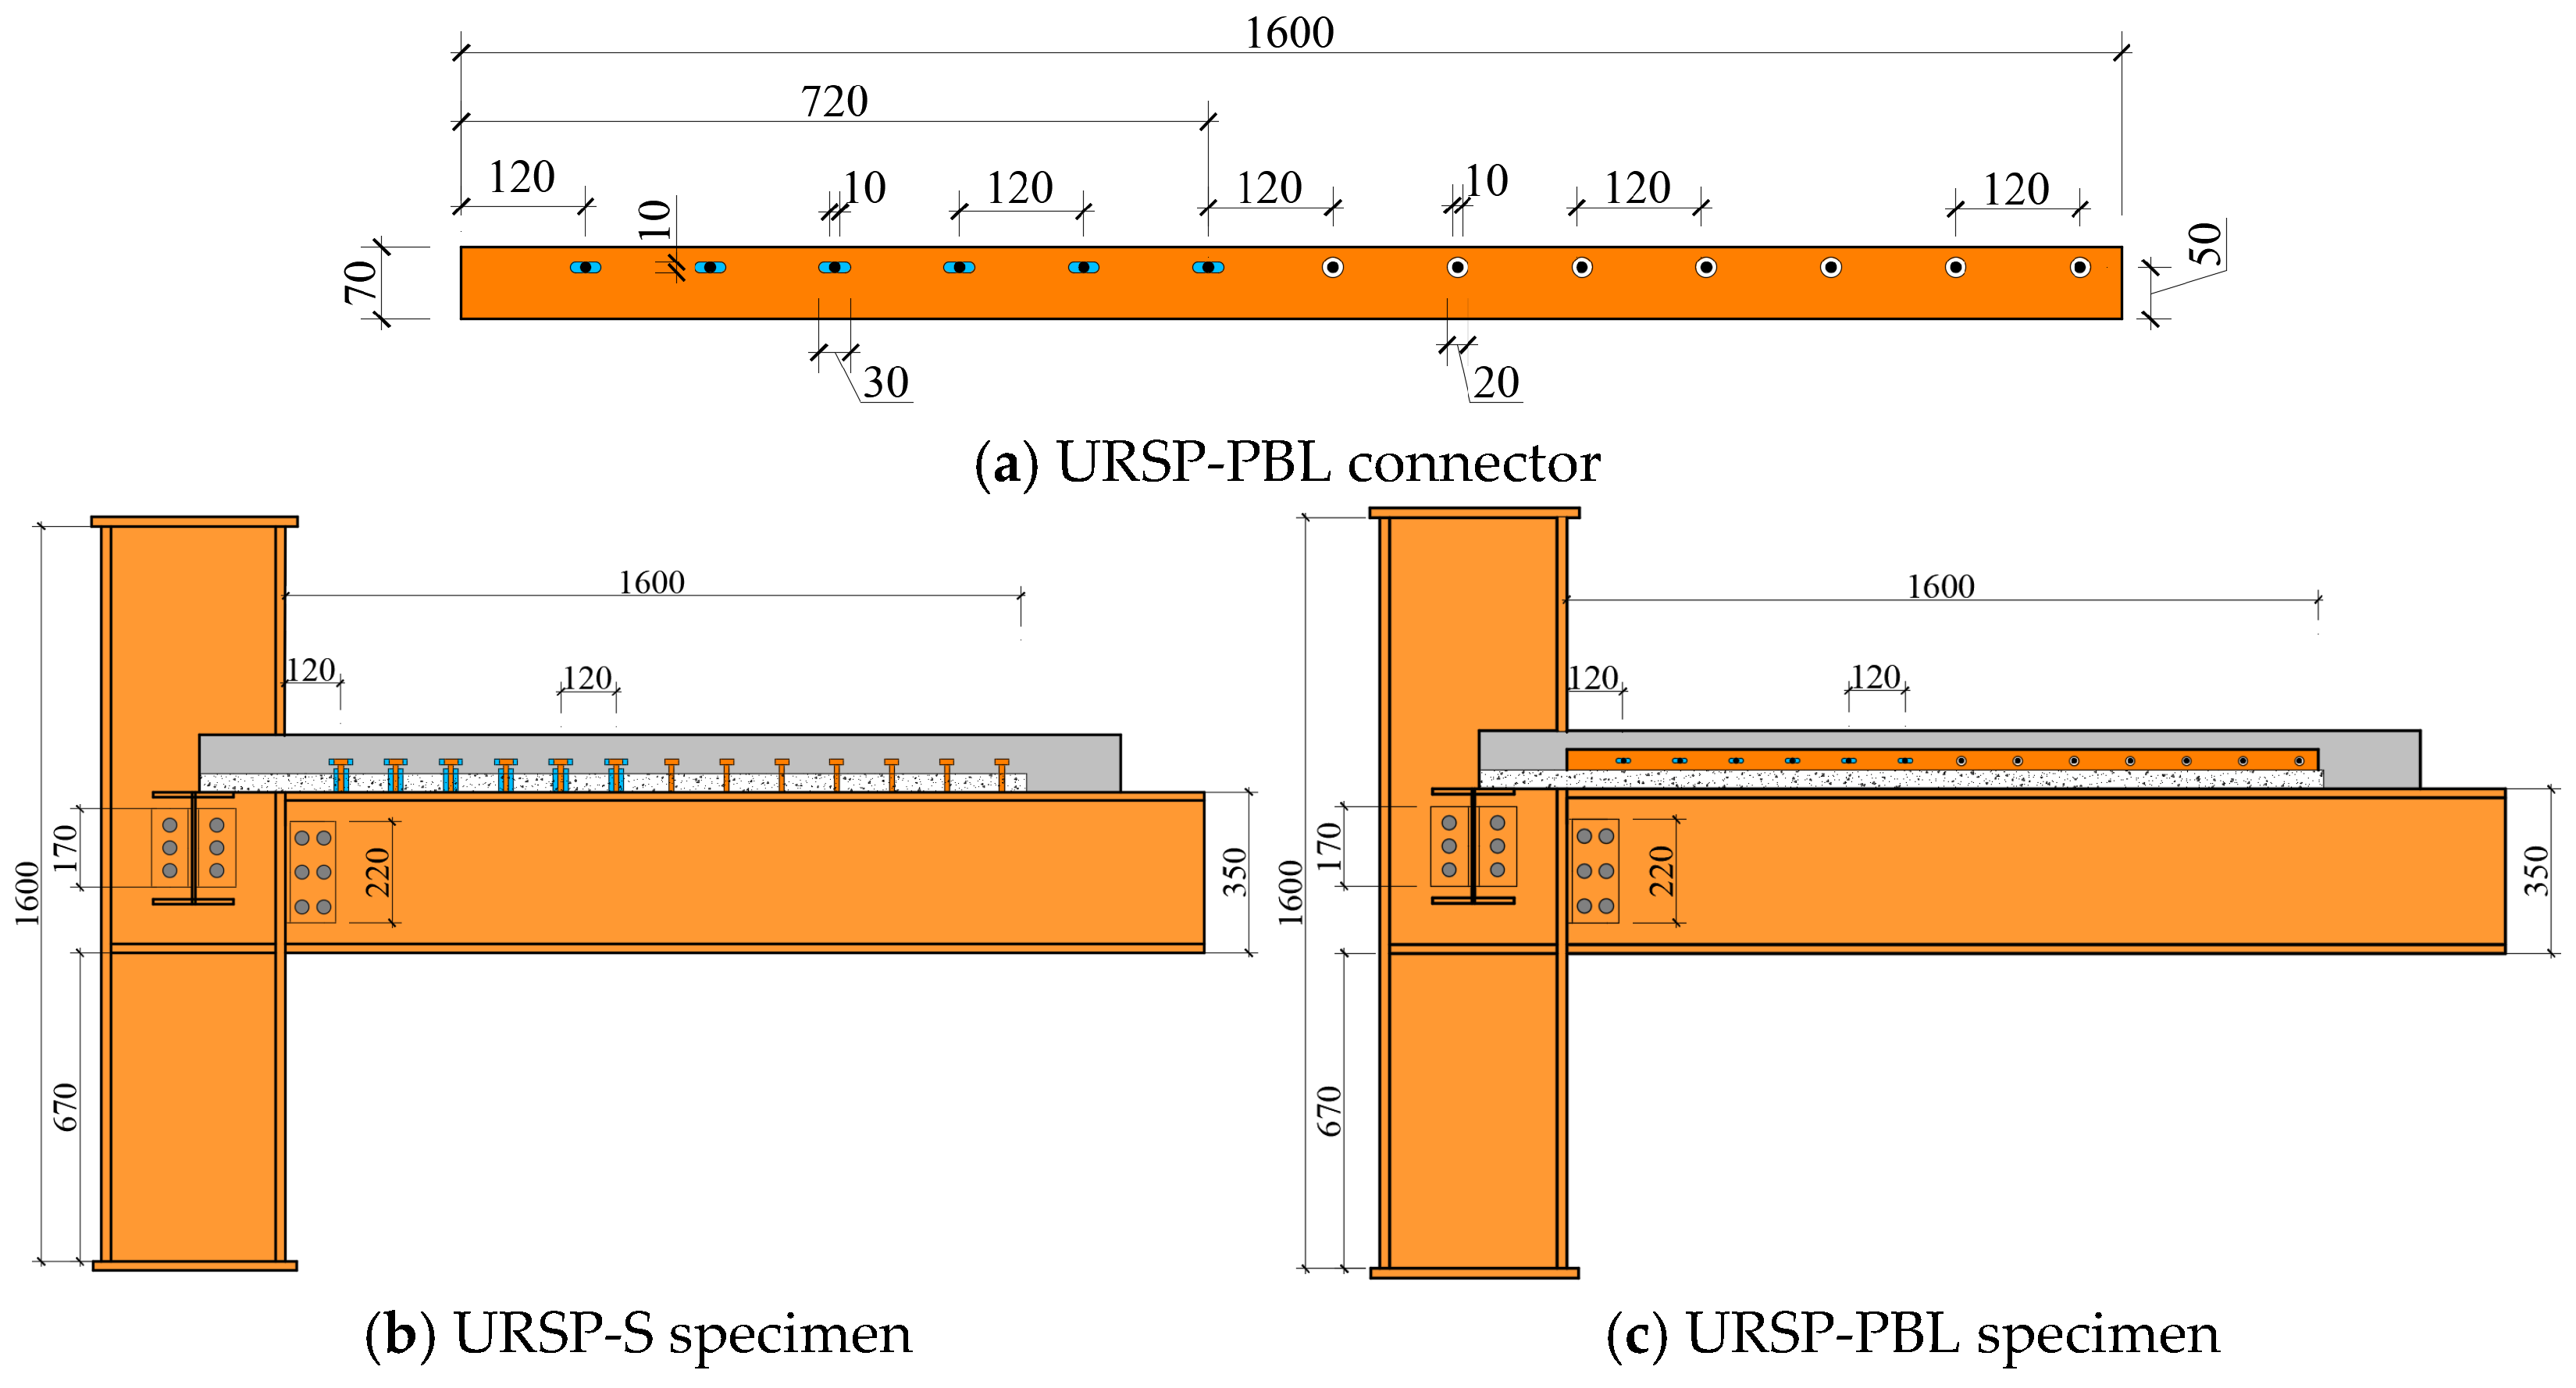
The connectors in the negative moment region were designed as URSP connectors, while the remaining regions employed conventional shear connectors of the same type. Specifically, the URSP-S connector consists of a stud shear connector wrapped with a layer of low-elastic-modulus material, whereas the URSP-PBL connector consists of a perforated steel plate connector similarly wrapped with a low-elastic-modulus material. The perforated steel plate was 1600 mm long, 80 mm high, and 10 mm thick. It was made of Q345 steel and was attached to the steel beam by fillet welds. The transverse perforated reinforcing bars passing through the holes were 10 mm in diameter. In the negative moment region, the reinforcing bars within the holes were wrapped with expanded polyethylene (EPE) foam to enable separation and relative slip between the reinforcing bars and the steel plate. In the positive moment region, the holes were filled with cast-in-place concrete to ensure both uplift and shear transfer among the reinforcing bars, the steel plate, and the concrete slab. The maximum allowable slip of the proposed connector was governed by the length of the slotted hole (30 mm), which provided a slip capacity of close to 10 mm. Based on preliminary finite element analyses, this design value was considered sufficient to meet the longitudinal slip demand in the negative moment region. Detailed dimensions are shown in Figure 2a. Based on finite element analysis and the Code for Design of Steel–Concrete Composite Bridges [27], the length of the negative moment region was determined as 0.36 times the beam span L (L = 2 m).
All specimens were made of laminated slabs, with a precast slab and a cast-in-place topping. The precast slabs were identical in dimensions, concrete material, reinforcement ratio, and reinforcement grade across all specimens. Each precast slab measured 1800 × 600 × 40 mm. The longitudinal reinforcement in the slab consisted of 12 mm diameter bars spaced at 150 mm, arranged in a single layer, yielding a reinforcement ratio of 1.88%. The transverse reinforcement consisted of 10 mm diameter bars spaced at 100 mm, also arranged in a single layer, with a reinforcement ratio of 1.96%. The precast panels were provided with 80 mm long beard bars on the sides, and the top surface was manually roughened to a depth of 4 mm.
The cast-in-place concrete topping had a uniform thickness of 70 mm and the same reinforcement configuration across all specimens. The longitudinal reinforcement matched that of the precast slabs, with 12 mm diameter bars at 150 mm spacing. In addition, two additional longitudinal bars were placed above the beam in a single layer, resulting in a longitudinal reinforcement ratio of 1.17%. The transverse reinforcement consisted of 10 mm diameter bars spaced at 120 mm, arranged in two layers, with the perforated bars of the steel plate connectors serving as one layer. The perforated bars also had a diameter of 10 mm, and the transverse reinforcement ratio was 1.17%. The variable parameters for the cast-in-place layer were concrete material (normal concrete vs. high-performance concrete) and reinforcement grade (HRB400 vs. HRB500).
All specimens had identical beam and column dimensions and materials, as well as the same beam–column joint details. Both beams and columns were fabricated from welded I-shaped steel sections. The main beam section measured 340 × 250 × 9 × 14 mm, the secondary beam Section 244 × 175 × 7 × 11 mm, and the column Section 400 × 400 × 13 × 21 mm. The beam–column joints were connected using a combination of bolting and welding: the upper and lower flanges were welded to the column, while the webs were connected through angles and high-strength bolts. Transverse stiffeners with a thickness of 14 mm were placed in the column at the upper and lower flanges of the main beam to prevent local buckling at the joints. All welds in the specimens were full-penetration welds, with a weld size of 1.5 times the base metal thickness. The specimen dimensions are illustrated in Figure 2. The construction tolerances shall comply with the requirements of the Chinese national standard GB 50205-2020 Standard for Acceptance of Construction Quality of Steel Structures [28].

2.2. Fabrication and Material Properties

All steel beams, columns, and beam–column joints were made of Q345 steel. The connections were secured with 10.9 s M20 high-strength bolts. The longitudinal and transverse reinforcements in the precast slabs were HRB335, while the cast-in-place reinforcement included two grades: HRB400 and HRB500. The material properties of the steel plates and reinforcing bars, as summarized in Table 2, were nominal values specified in the Design of Steel Structures Standard (GB 50017-2017) [29].
The concrete materials comprised normal C50 concrete and fiber-reinforced high-performance concrete (HPC). The mixture proportions for the HPC are listed in Table 3. Three 150 × 150 × 150 mm standard cube specimens of C50 concrete and three 100 × 100 × 100 mm non-standard cube specimens of high-performance crack-resistant concrete were prepared. The fibers used in HPC had a length of 12 mm, a diameter of 25 μm, and a density of approximately 1.4 g/cm3. The fiber volume fraction was approximately 0.57%. All HPC specimens were cured under standard conditions at 20 ± 2 °C and ≥95% relative humidity for 28 days, in accordance with GB/T 50081-2019 [30]. The measured cube compressive strengths of the two concrete types are presented in Table 4, and the elastic modulus of concrete was taken from the Code for Design of Concrete Structures (GB 50010-2010) [31]. Due to experimental constraints, the measured tensile strength and fracture-related performance parameters were not obtained in this study. According to existing research, the characteristic value of axial tensile strength of concrete can be estimated at approximately 5–6 MPa [32], which is also confirmed by existing experimental evidence [33].
The foam used in the URSP connectors was EPE foam, which was flexible, lightweight, and highly elastic. The material properties, summarized in Table 5, were taken from references [34,35].

2.3. Test Setup and Loading Procedure

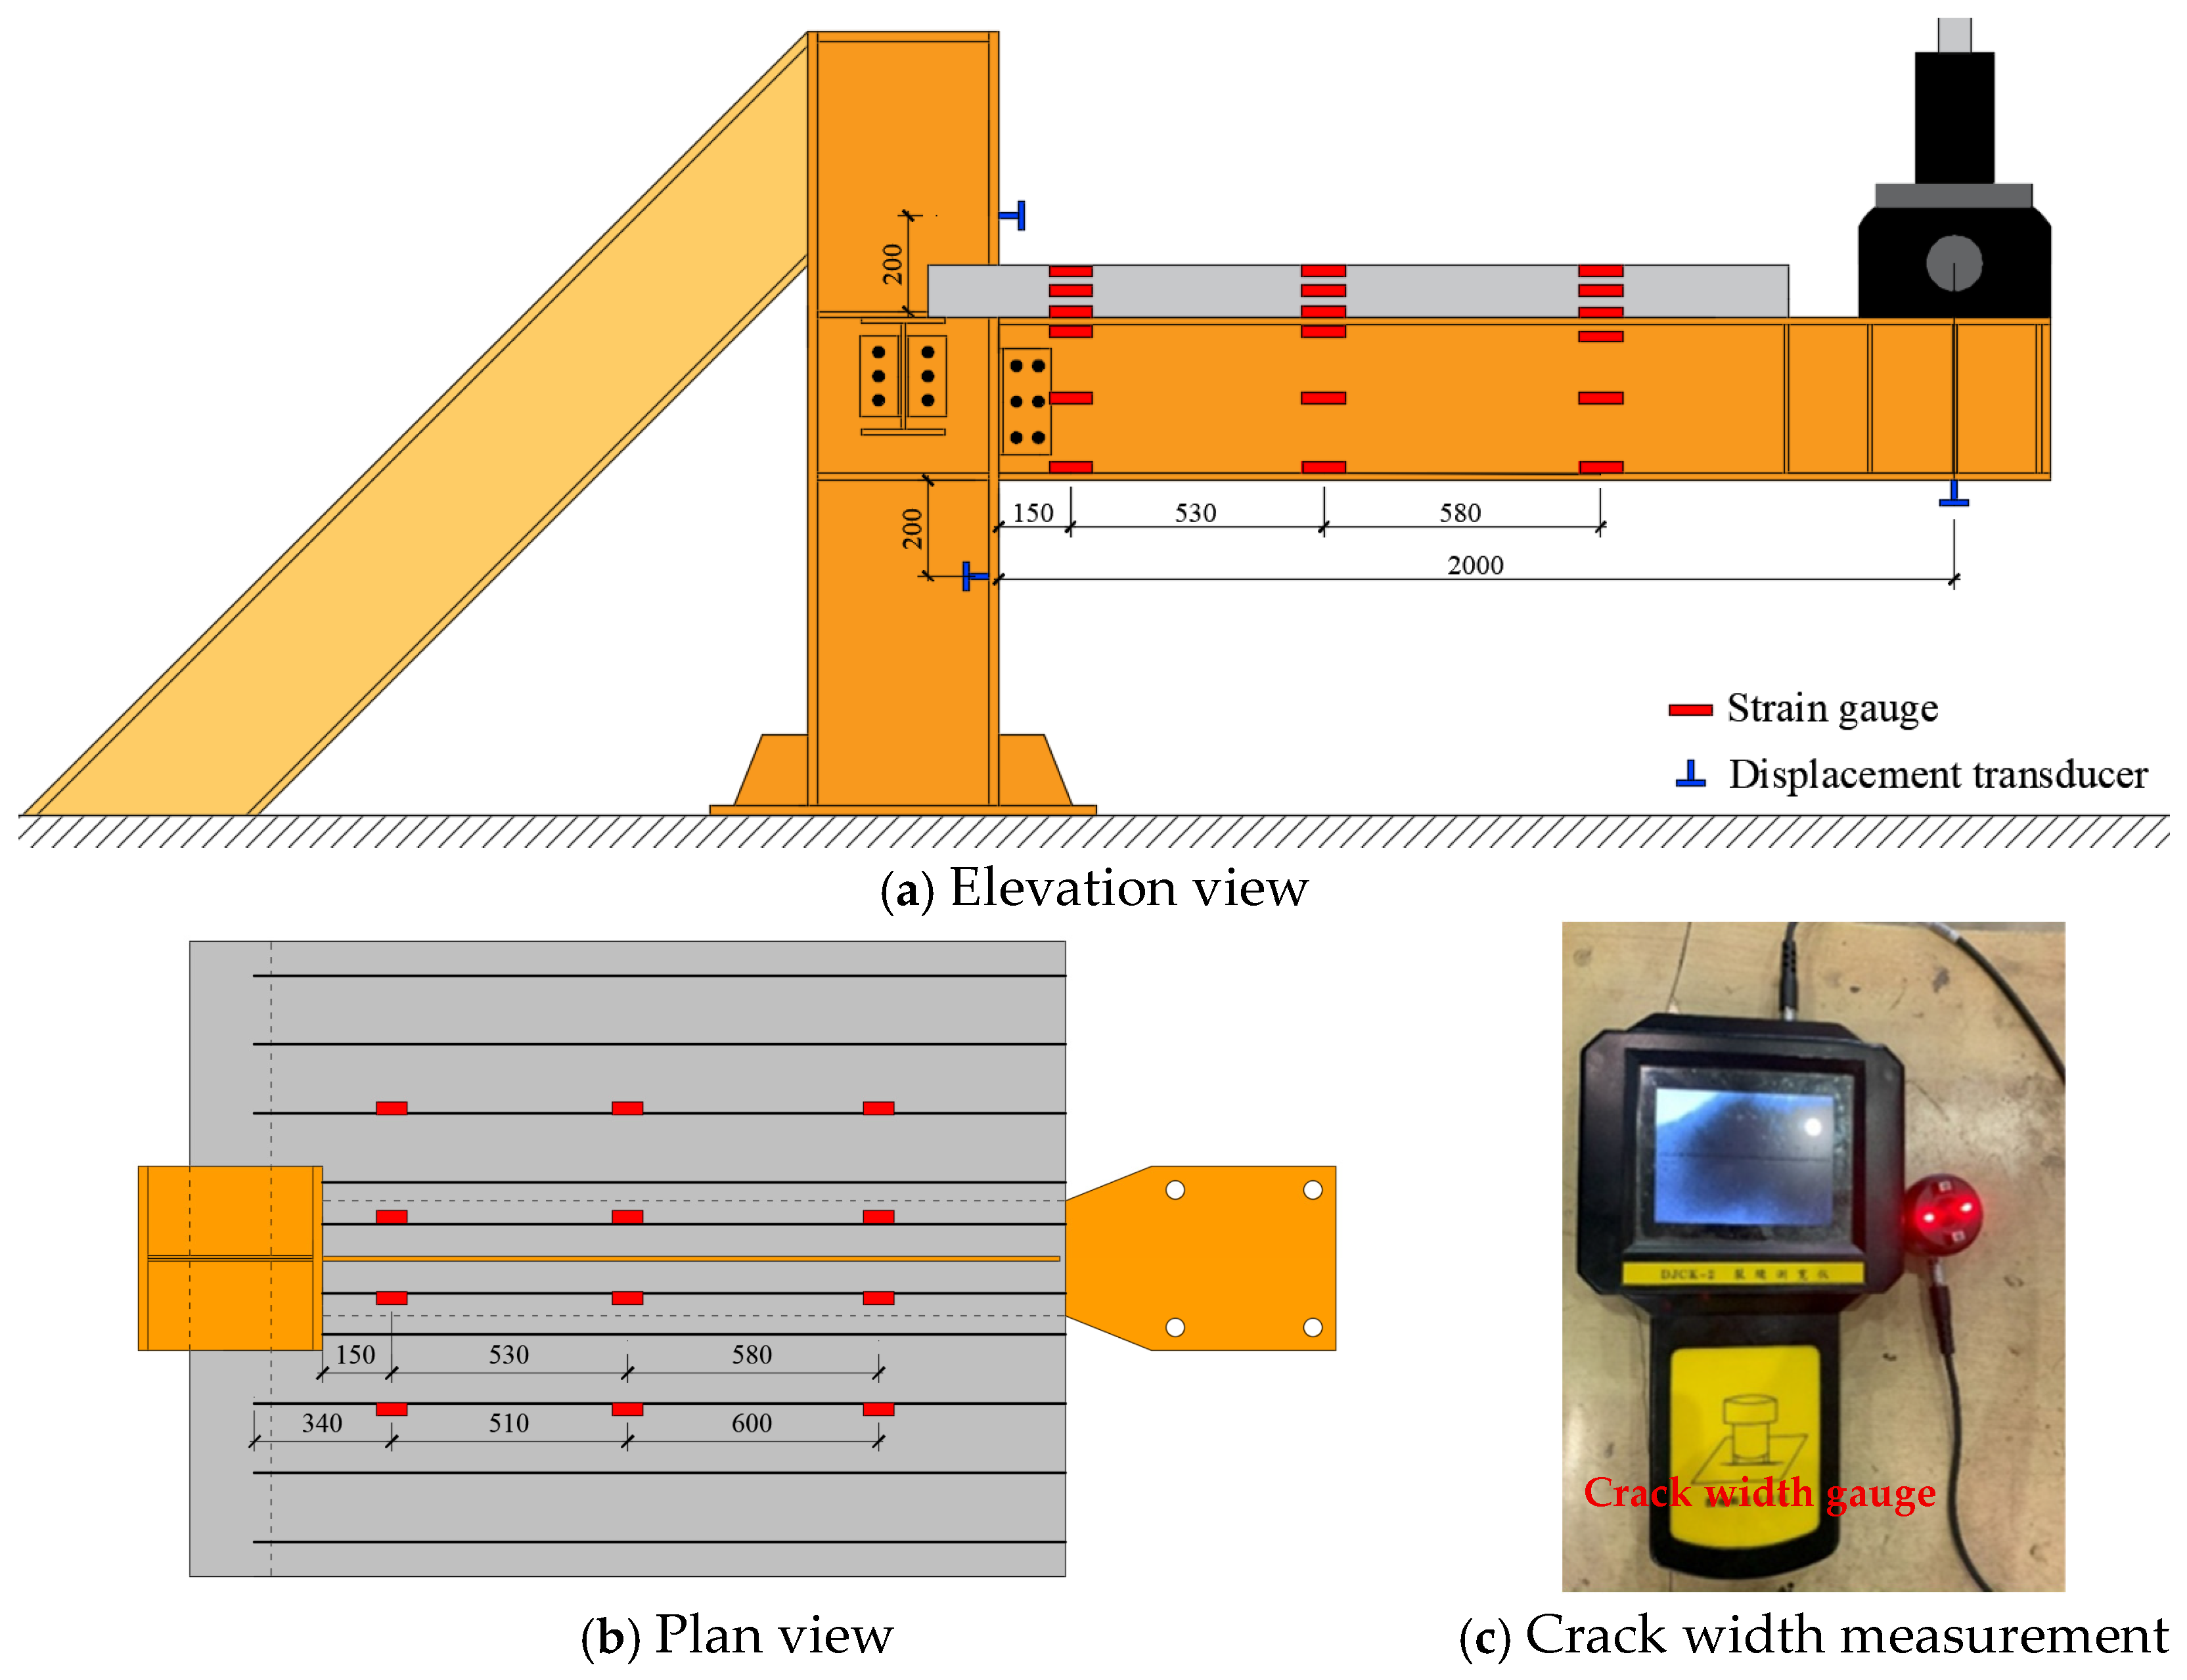
The loading system consisted of an MTS actuator and a reaction support at the column end, as shown in Figure 3. The actuator was attached to the beam end using bolts. The lower end of the steel column was fixed to the base support with bolts, while lateral supports were placed on the sides of the upper end of the column. These supports had an I-shaped cross-section and were bolted to fixed bases. The MTS actuator had a maximum dynamic test force of 500 kN and a maximum stroke of ±250 mm. No axial load was applied to the column during the test. The column served only as a boundary constraint.
The loading protocol comprised two stages. In the force-controlled stage, the initial load was 20 kN, and each subsequent loading step increased by 20 kN, with one cycle per step. The loading rate in the force-controlled stage was 100 kN/min. The switch from force control to displacement control was determined quantitatively by the strain measured from strain gauges attached to the steel beam. The yield point was identified when the measured strain reached the yield strain of the material (e.g., 1670 με for Q345 steel). Once the measured strain reached the yield strain of the material, the loading regime was changed to displacement control. The fullness of the hysteresis loop was also observed as an auxiliary phenomenon, though it was not used as the switching criterion. The initial displacement in this stage was set to the yield displacement of the specimen, and each subsequent step increased by 10 mm, with three cycles per step, until specimen failure. In the displacement-controlled stage, the loading rate was 25 mm/min with a triangular wave cyclic loading pattern. Failure was defined as either the load falling below 85% of the peak measured value, or observable damage to the specimen.
To measure the strains in the concrete slab and the steel beam, strain gauges were attached to the side faces of the concrete slab and at upper, middle, and lower positions along the steel beam web. Strain gauges were also affixed to the reinforcing bars embedded in the cast-in-place concrete topping. A pair of displacement transducers were symmetrically arranged on the steel column at 200 mm above and below the top and bottom flanges of the main beam, respectively, to monitor the deformation of the column panel zone during loading. Additional displacement transducers were placed at the bottom of the loading beam end to measure the displacement of the beam under cyclic loading. The arrangement of all measurement points is shown in Figure 3. The displacement and strain were automatically recorded by a Donghua DH-3820 strain testing system at a sampling frequency of 1 Hz. Crack widths were measured using a handheld crack width measurement DJCK-2 with a rated accuracy of 0.01 mm. After each displacement-controlled loading step, all cracks appearing on the specimen surface were marked and numbered, and the maximum width of each crack was recorded. The observation interval corresponded to the loading step increment (10 mm per displacement amplitude).

3. Test Results

3.1. Test Observations

3.1.1. URSP-S Specimen

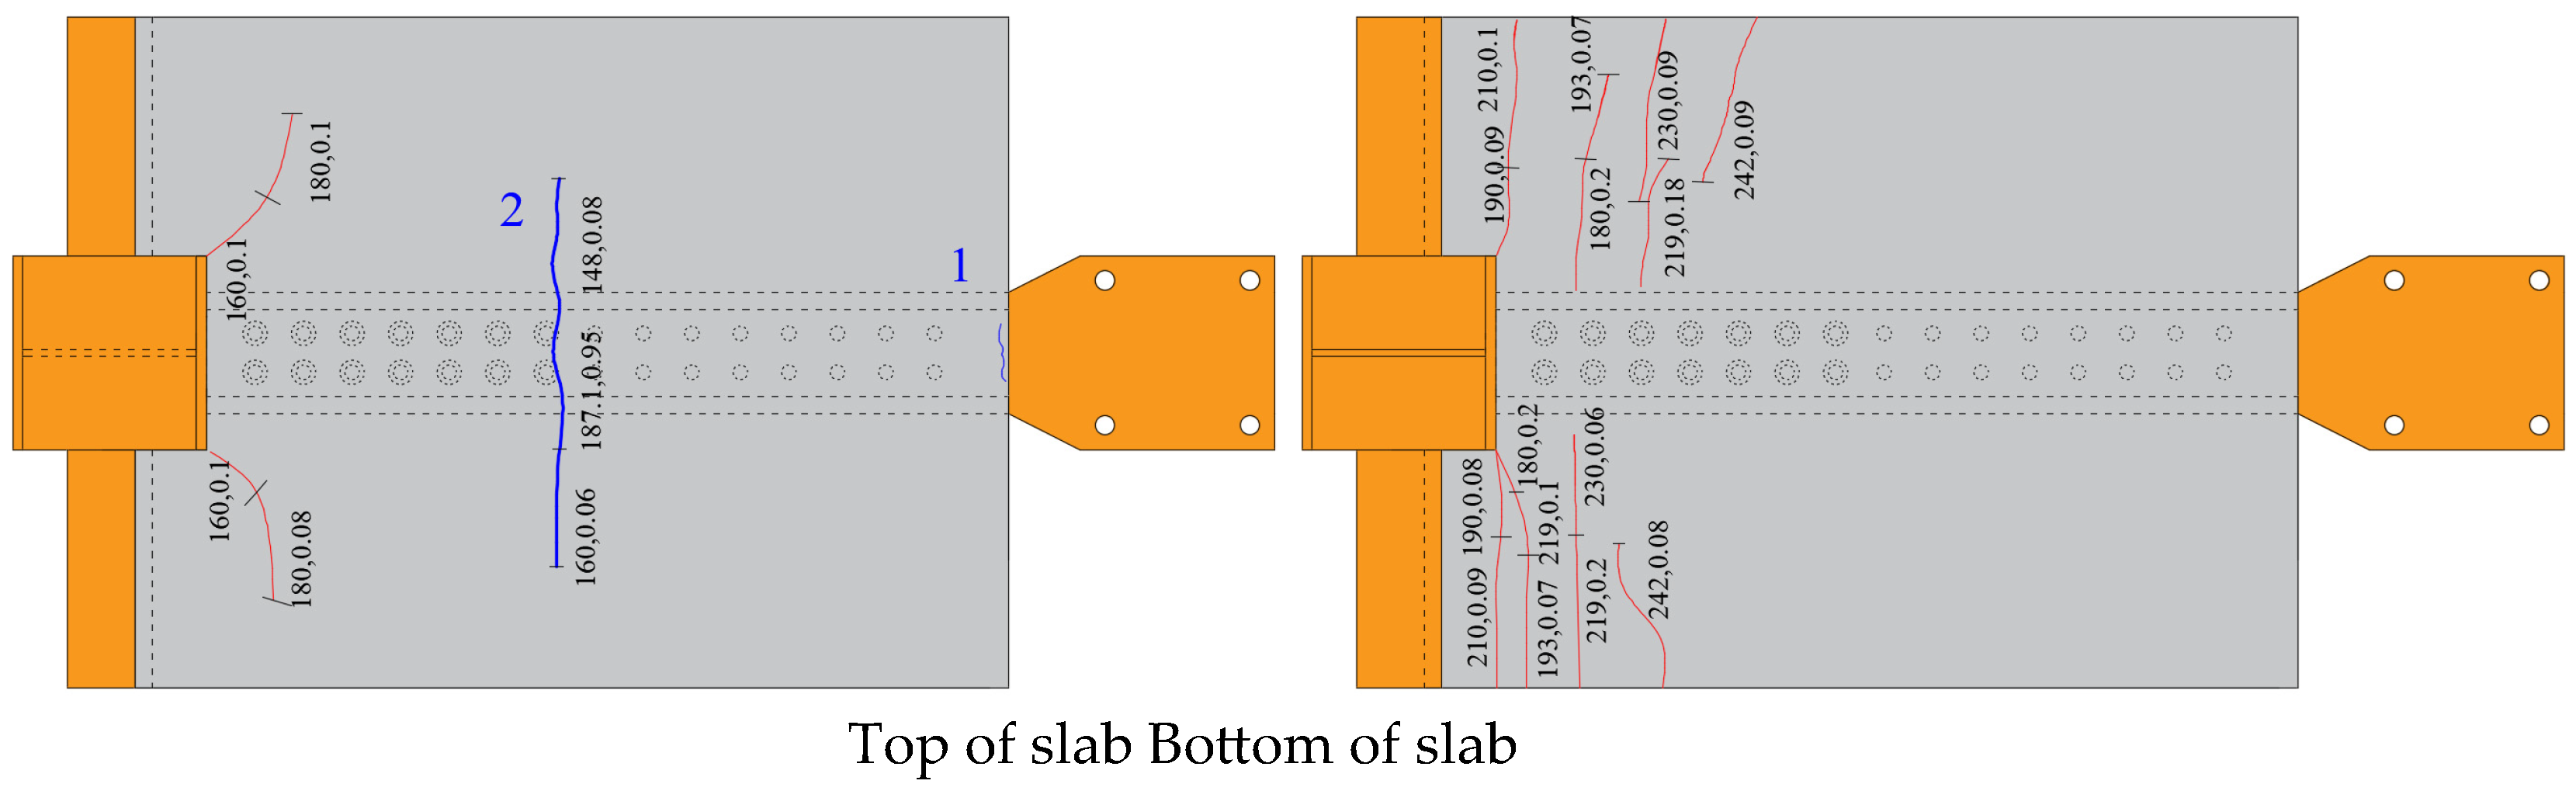
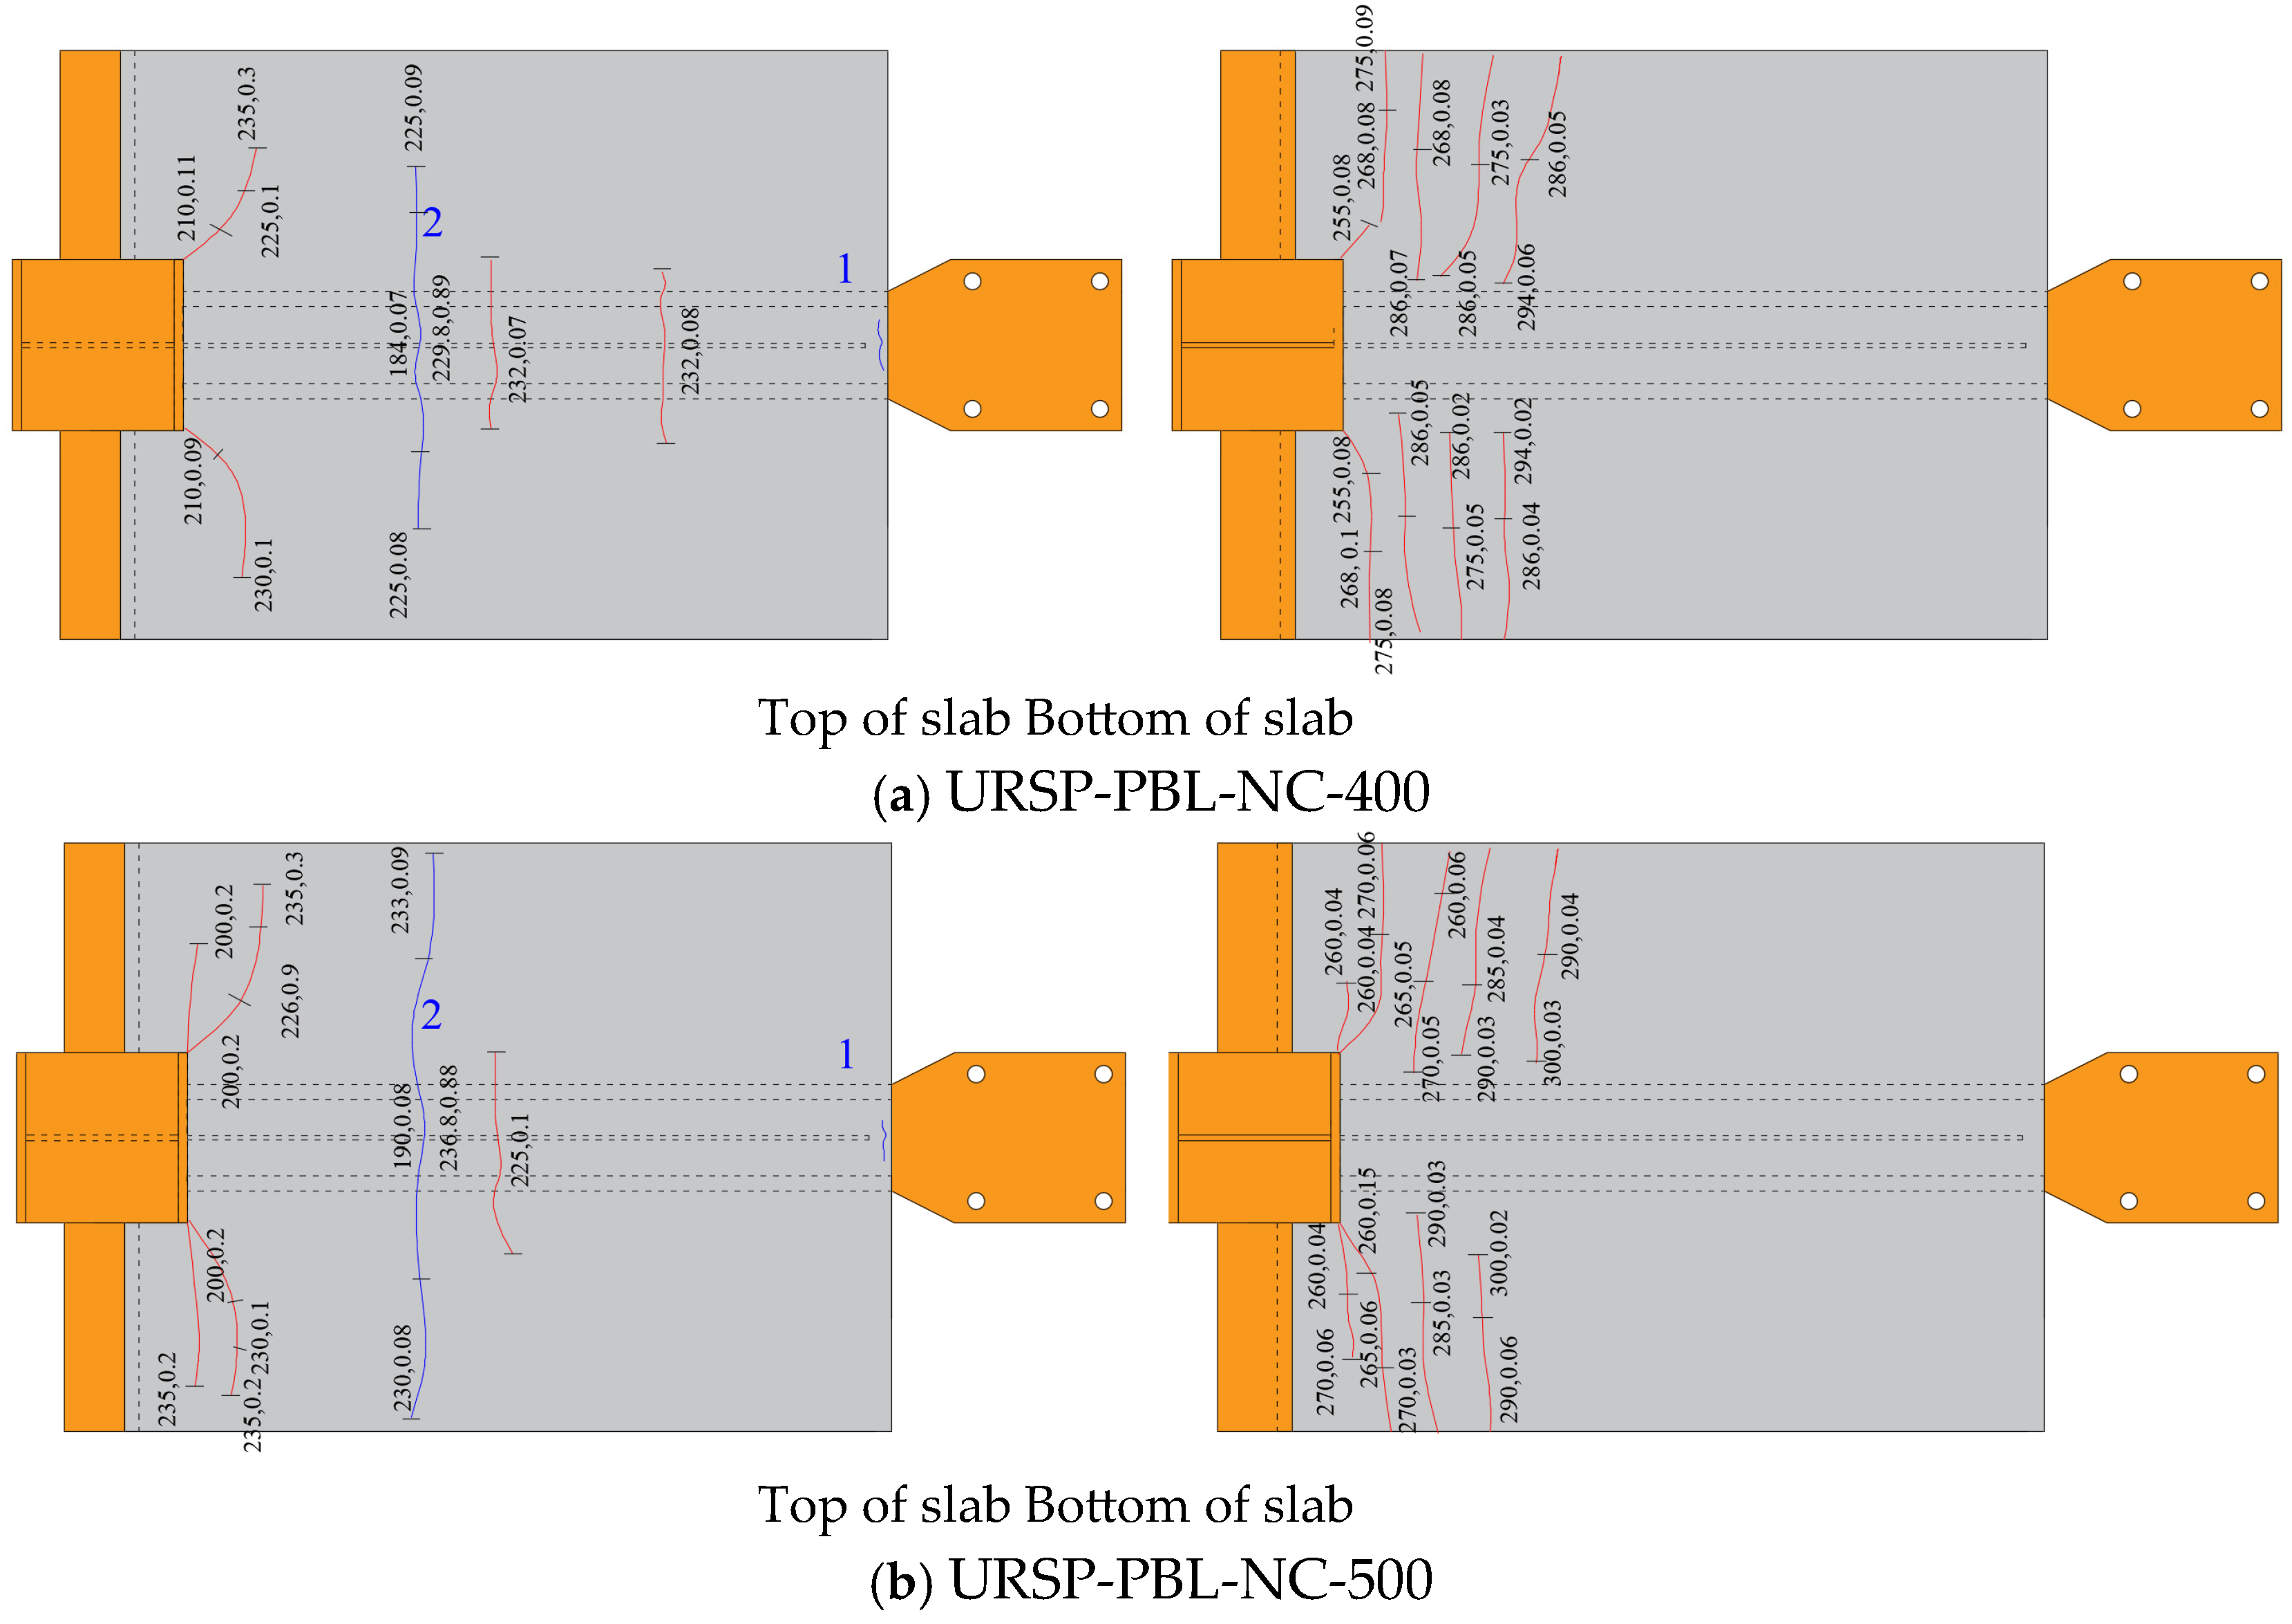
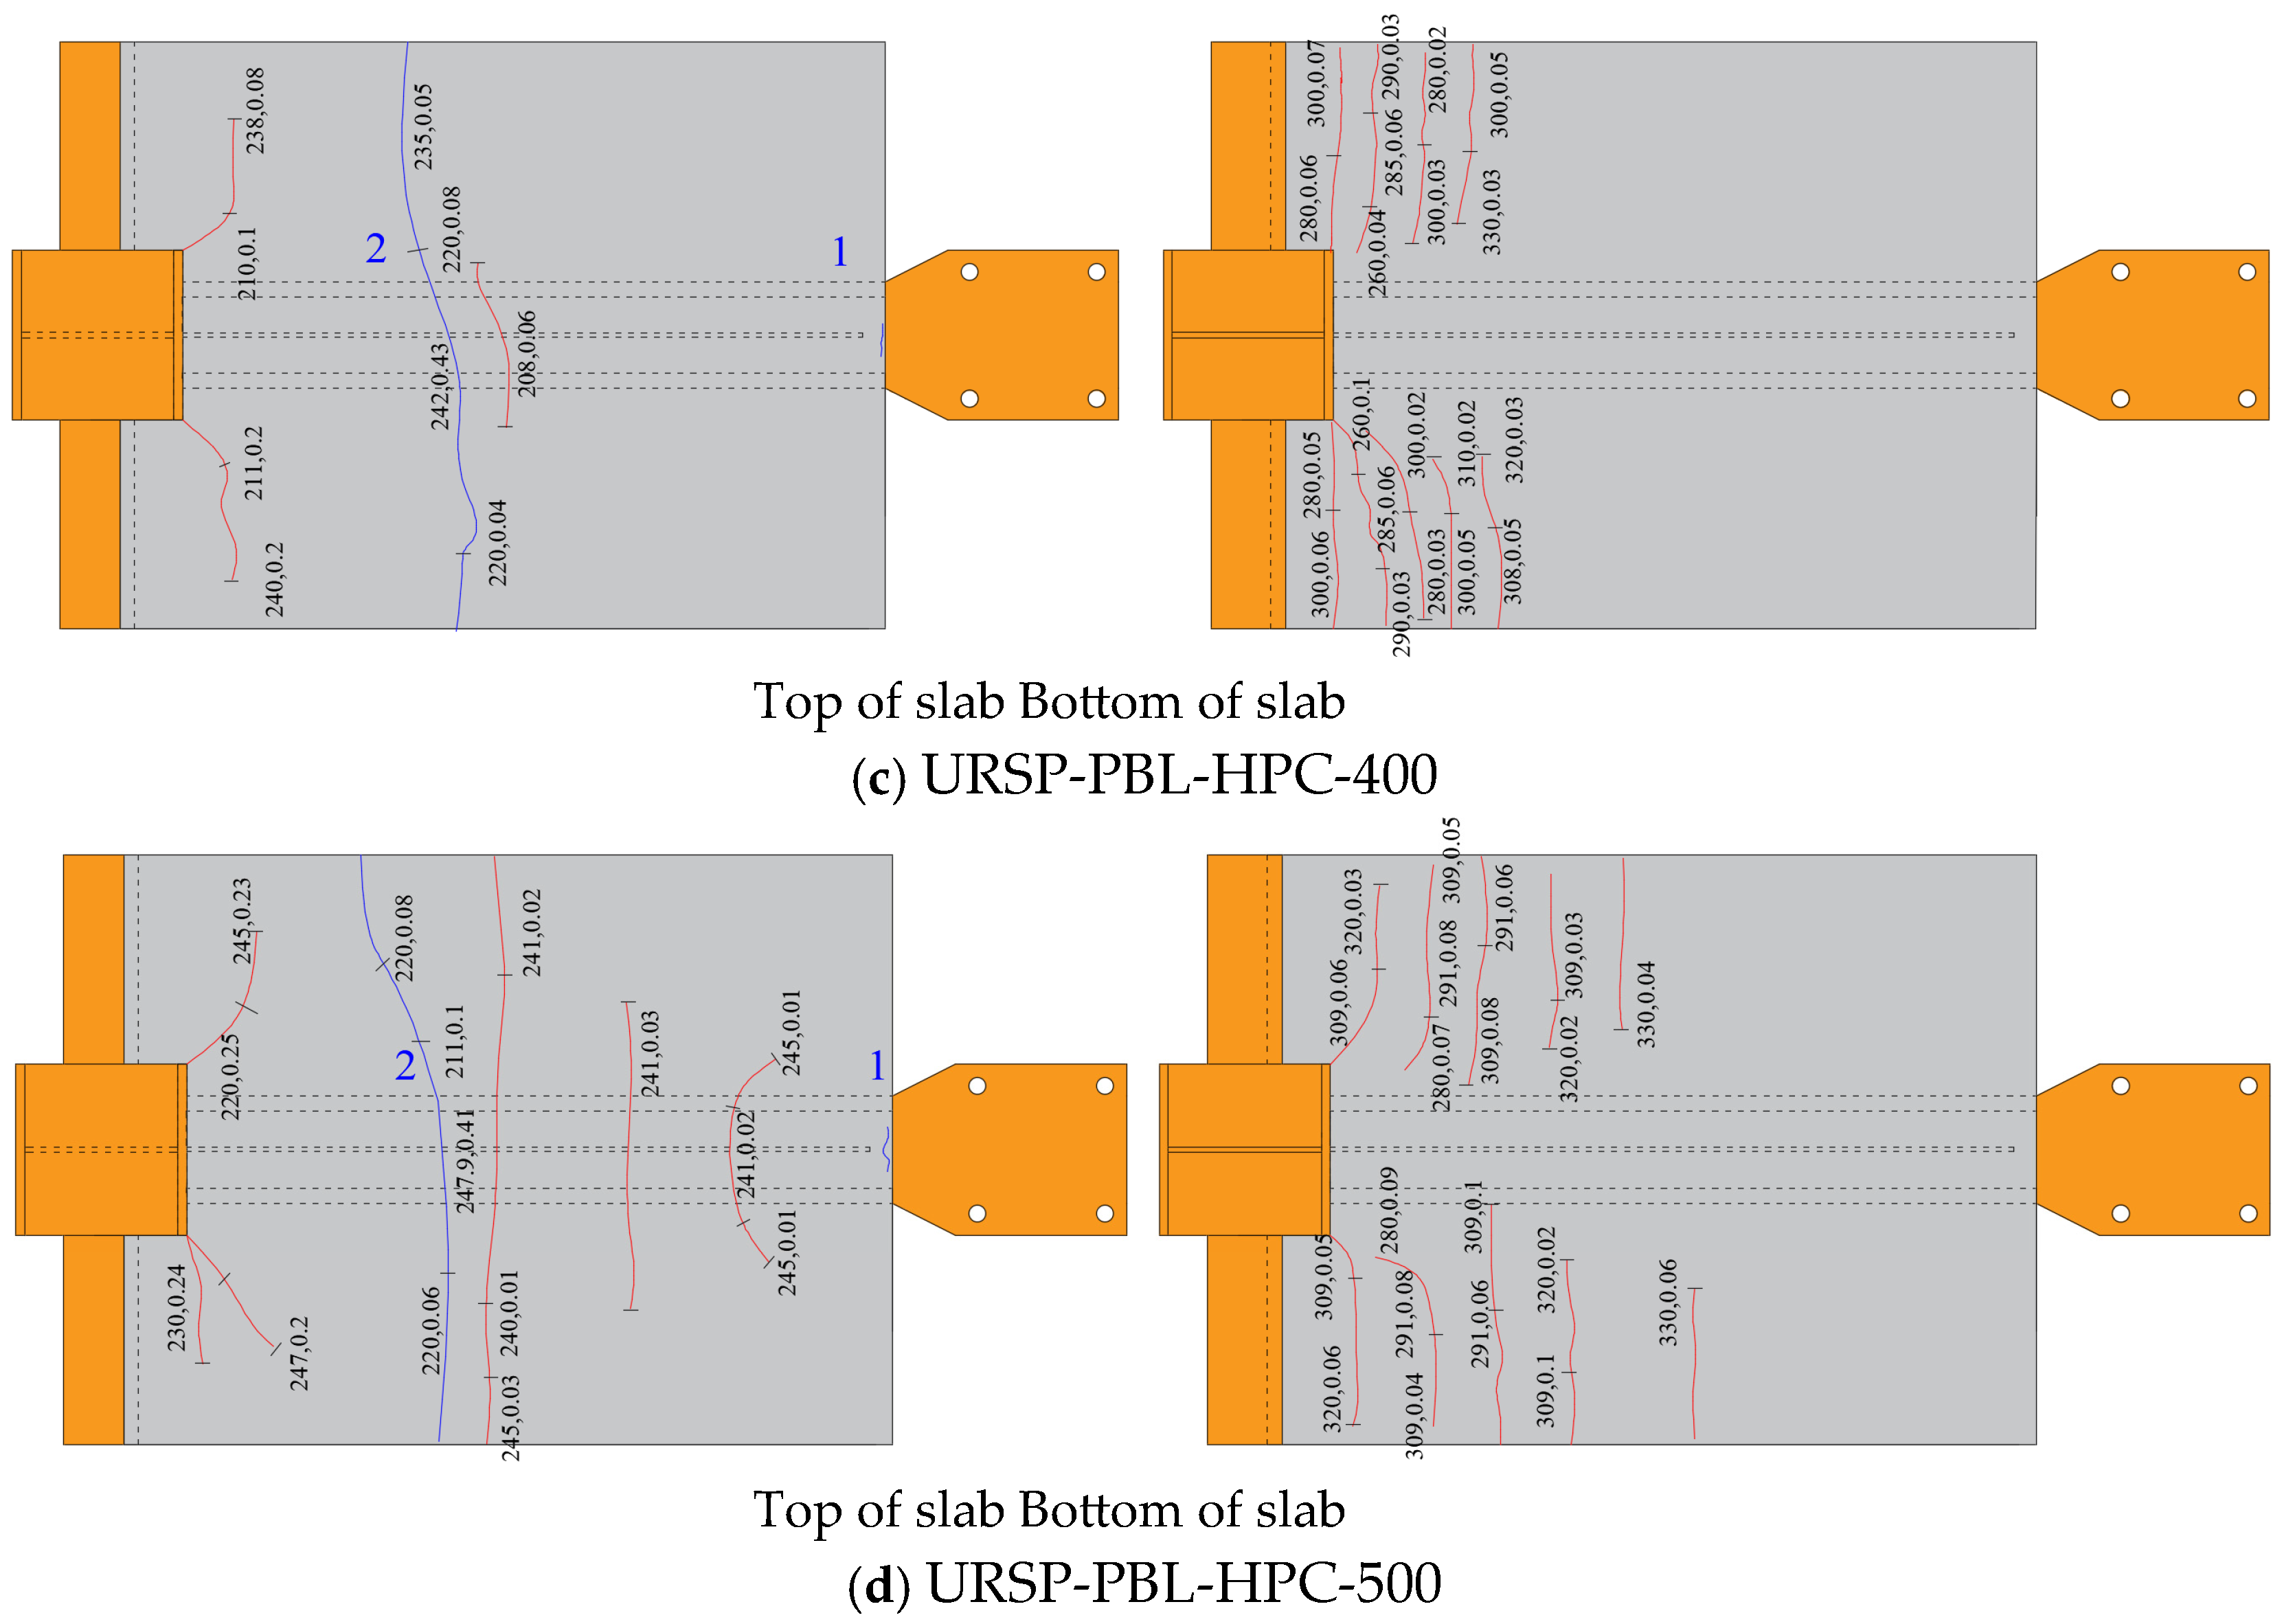
The specimen URSP-S-NC-400 served as the control specimen. At the initial loading stage of force control, no obvious damage was observed when the load was below 120 kN. The hysteresis loop area was very small, indicating that the specimen remained essentially elastic. When the load reached 140 kN, the hysteresis loop became slightly fuller, and localized cracking appeared at the outer end of the slab top surface (Figure 4, location ① on the slab top). This cracking was attributed to stress concentration at the connection between the composite slab and the steel plate connector, and the cracked region remained relatively limited. At this point, the loading was switched from force control to displacement control.
After entering the displacement-controlled loading stage, the first transverse crack appeared on the top surface of the composite slab at approximately 700 mm from the column edge (Figure 4, location ② on the slab top) when the displacement was below 40 mm. The crack width was small, and it was located near the beam mid-span. At the edge of the URSP connector region, the crack propagated from the mid-width toward the slab edges, exhibiting a pattern characterized by wider opening at the center and narrower openings at the sides. During reverse loading, 45° diagonal cracks appeared on the top surface of the composite slab at the column corner and gradually extended toward the slab edges. At approximately 110 mm from the column edge, these cracks turned perpendicular to the longitudinal direction of the beam.
When the displacement reached 40 mm, the hysteresis loop became fuller. During forward loading to a displacement of 50 mm, 45° diagonal cracks also appeared on the bottom surface of the composite slab at the column corner and gradually propagated outward. At approximately 110 mm from the column edge, these cracks turned perpendicular to the beam axis and gradually developed toward the slab edges.
At a displacement of 60 mm under negative loading, a new transverse crack appeared on the bottom surface of the slab at approximately 200 mm from the column edge, initiating from the slab edge and gradually extending toward the mid-width. During forward loading to a displacement of 60 mm, the weld at the upper flange of the steel beam fractured, and the load decreased rapidly. At a displacement of 70 mm under negative loading, a third transverse crack appeared on the bottom surface of the slab at approximately 400 mm from the column edge, also initiating from the slab edge and extending toward the mid-width. When the displacement reached 70 mm under positive loading, the weld failed rapidly, the load-carrying capacity dropped sharply, and the test was terminated.
Throughout the test, no delamination was observed at the interface between the precast slab and the cast-in-place concrete topping, indicating good composite action between the two components. The final crack distribution at failure is shown in Figure 4.
Due to the weld quality issue, this URSP-S specimen failed without obvious yielding of the steel members, and its load-carrying capacity was lower than the expected value.

3.1.2. URSP-PBL Specimen

The behavior of the four URSP-PBL specimens was essentially similar to that of the URSP-S specimen before the premature failure of the latter. No obvious failure occurred during the force-controlled loading stage. After entering the displacement-controlled loading stage, transverse cracks appeared on the top and bottom surfaces of the composite slab and gradually propagated. No obvious damage was observed in the steel members until the peak load was approached, at which point the steel beams buckled or yielded, accompanied by weld cracking. The weld quality of the PBL specimens was satisfactory, and no premature weld failure occurred before specimen failure. Within the PBL series, the specimens exhibited satisfactory load-carrying capacity and plastic deformation.
Throughout the tests, no cracking was observed at the interface between the precast slab and the cast-in-place concrete topping in any of the specimens, indicating good composite action between the two components. Longitudinal separation was observed at the steel beam–concrete slab interface, while no vertical separation was detected, indicating that relative longitudinal slip occurred between the two components. It was also observed that the composite slab remained in close contact with the steel beam at the mid-span, whereas the inclination became more pronounced toward the beam ends, particularly at the upper part of the secondary beam. In general, the cracks in the composite slab were not readily visible and required careful observation.
Under negative bending moments, the location and development pattern of cracks were essentially the same for all specimens. Initially, localized cracking appeared at the top of the slab (Figure 5, location ① on the slab top), caused by stress concentration at the connection between the steel plate connector and the composite slab. Subsequently, the first transverse crack developed, located at the edge of the URSP connector region near the beam mid-span (Figure 5, location ② on the slab top), at a certain distance from the column. During loading, 45° diagonal cracks formed at the corners of the composite slab and column. In general, the cracks in the negative moment region were few and narrow. Among the four specimens, the second cracks in URSP-PBL-HPC-400 and URSP-PBL-HPC-500, which were made of high-performance concrete, appeared later than those in the normal concrete specimens, and the crack widths were noticeably smaller. The maximum crack width during loading was approximately 0.4 mm.
The cracks on the bottom surface of the slab under positive bending moments were similar across all specimens, all being transverse cracks. During loading, 45° diagonal cracks also appeared at the corners of the composite slab and column.
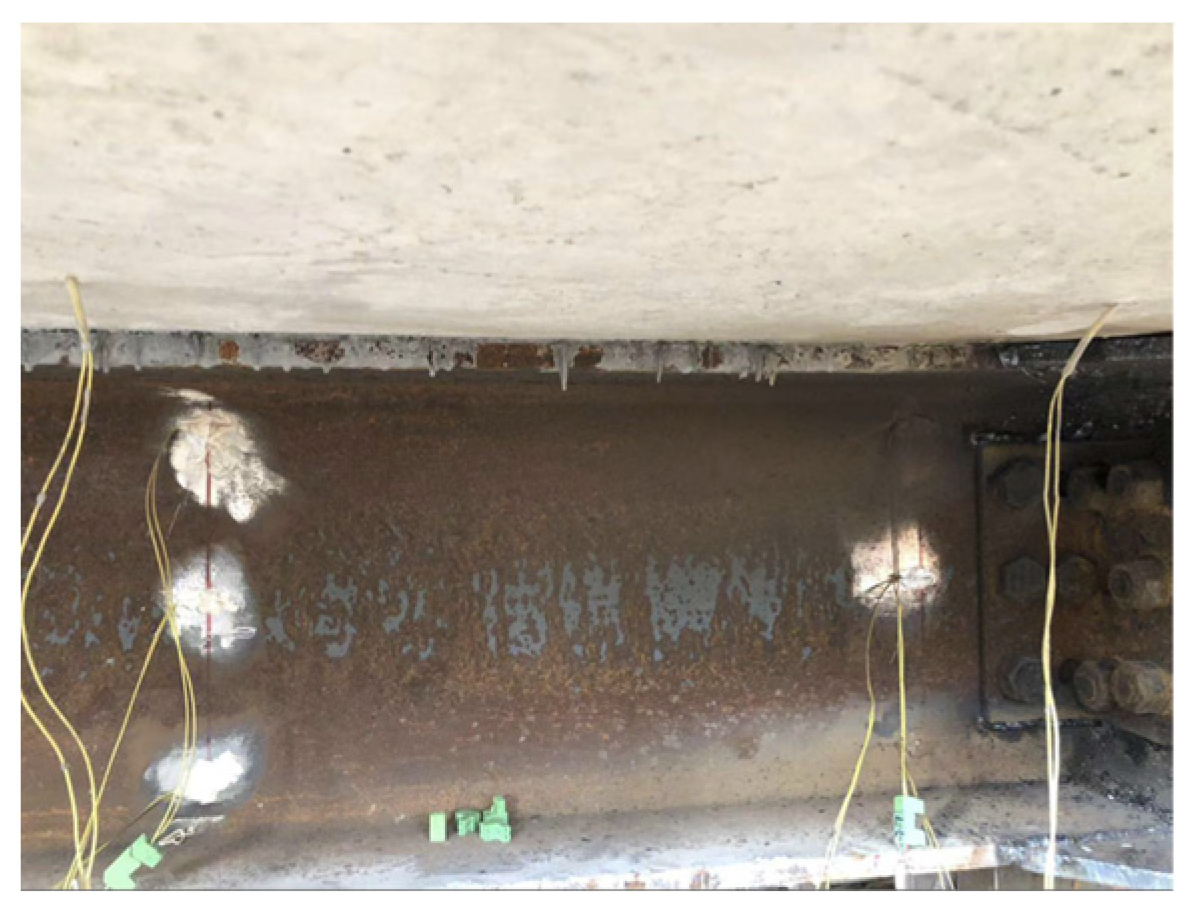
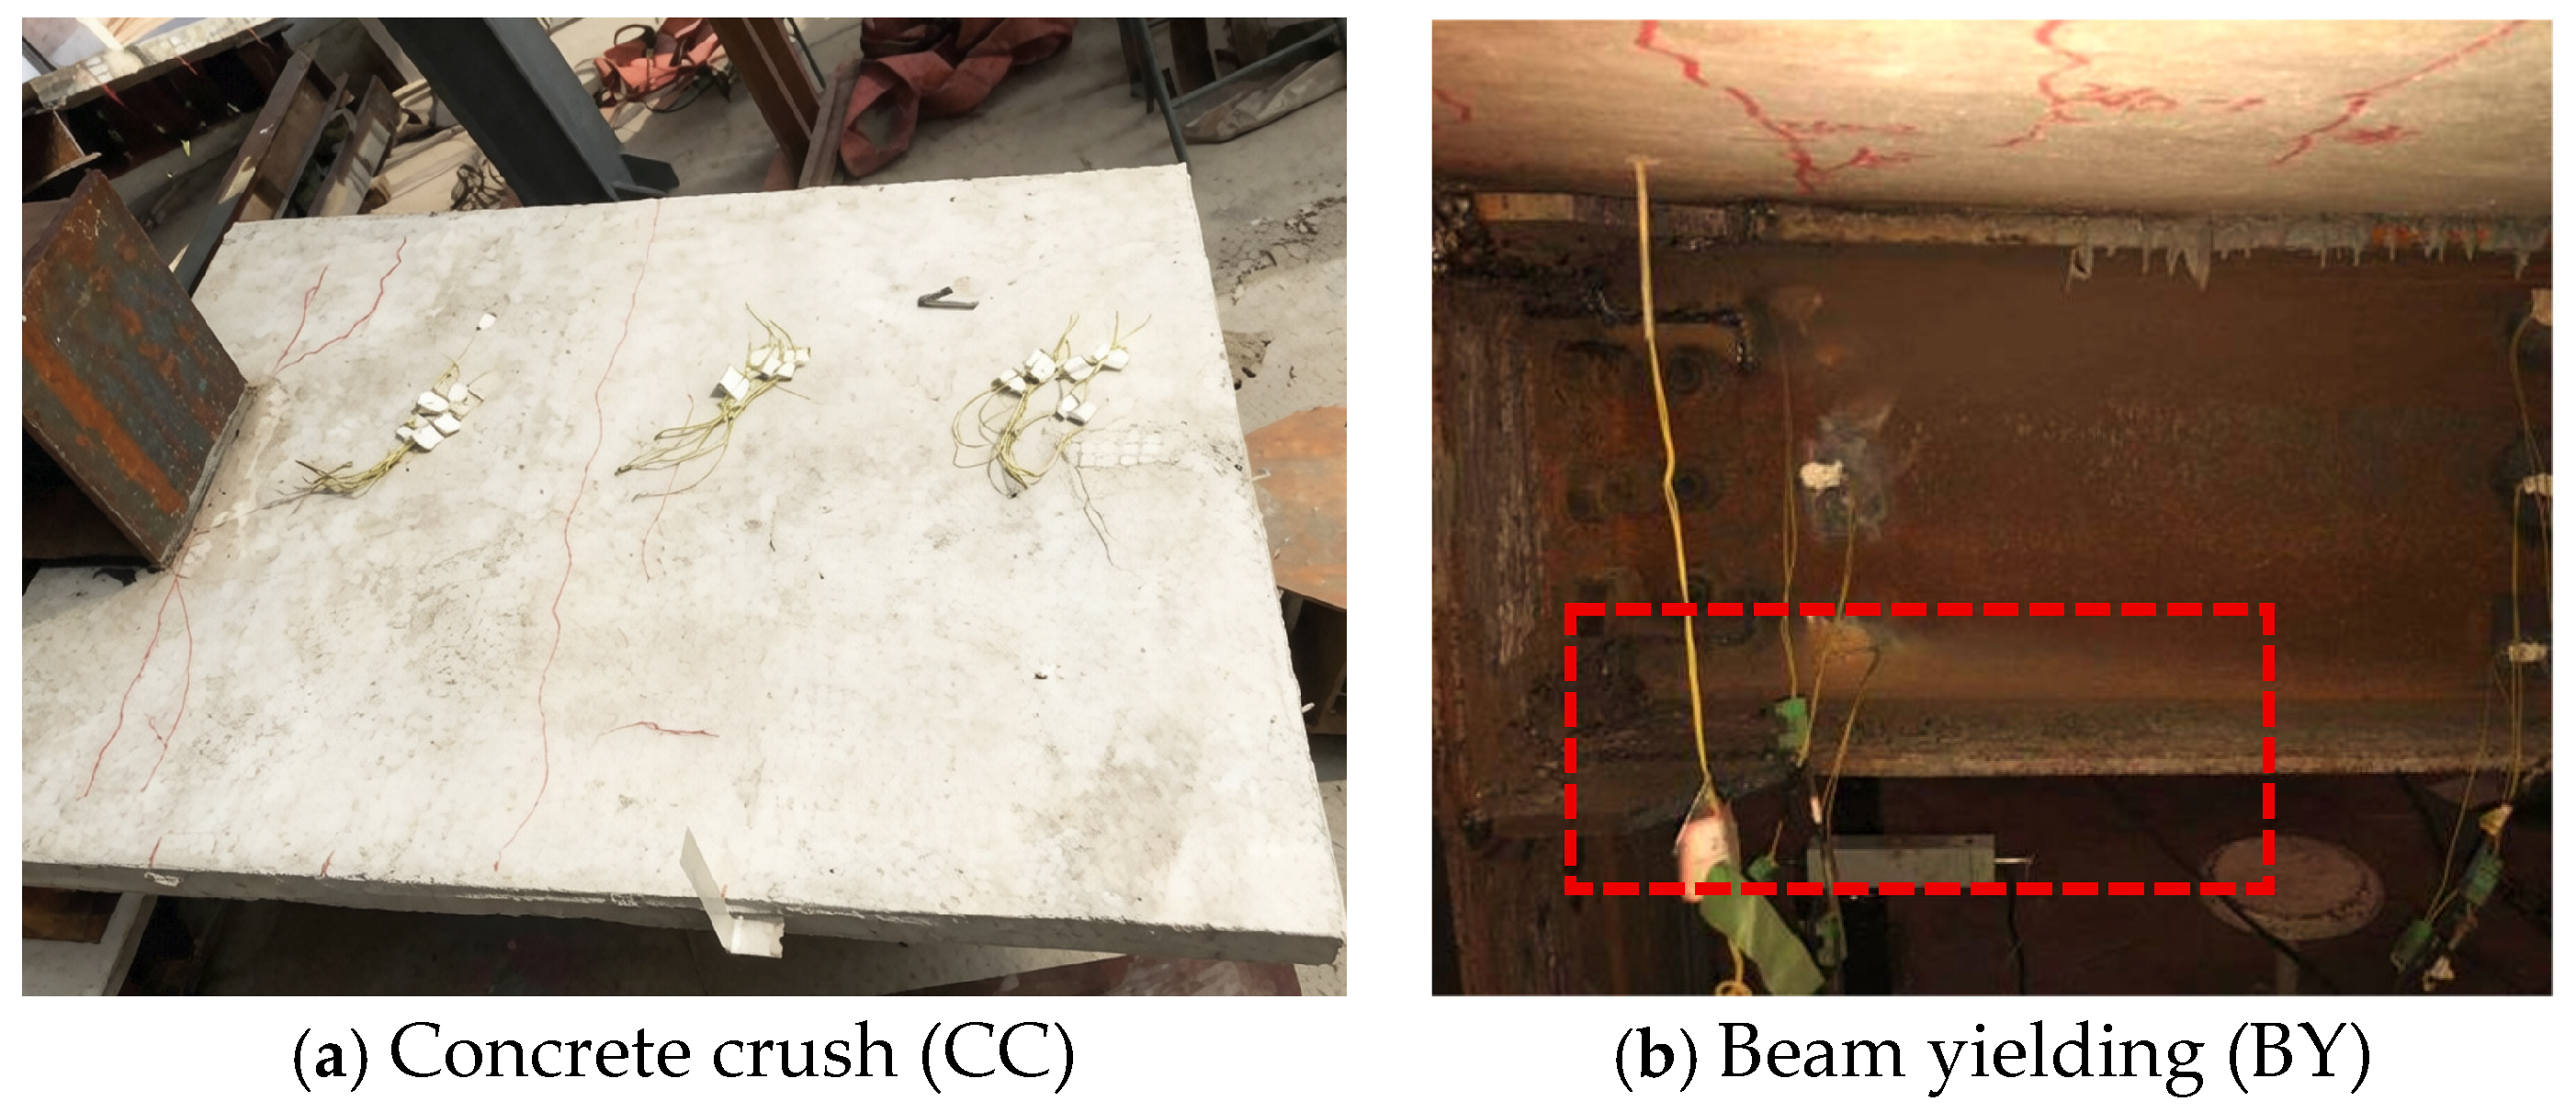
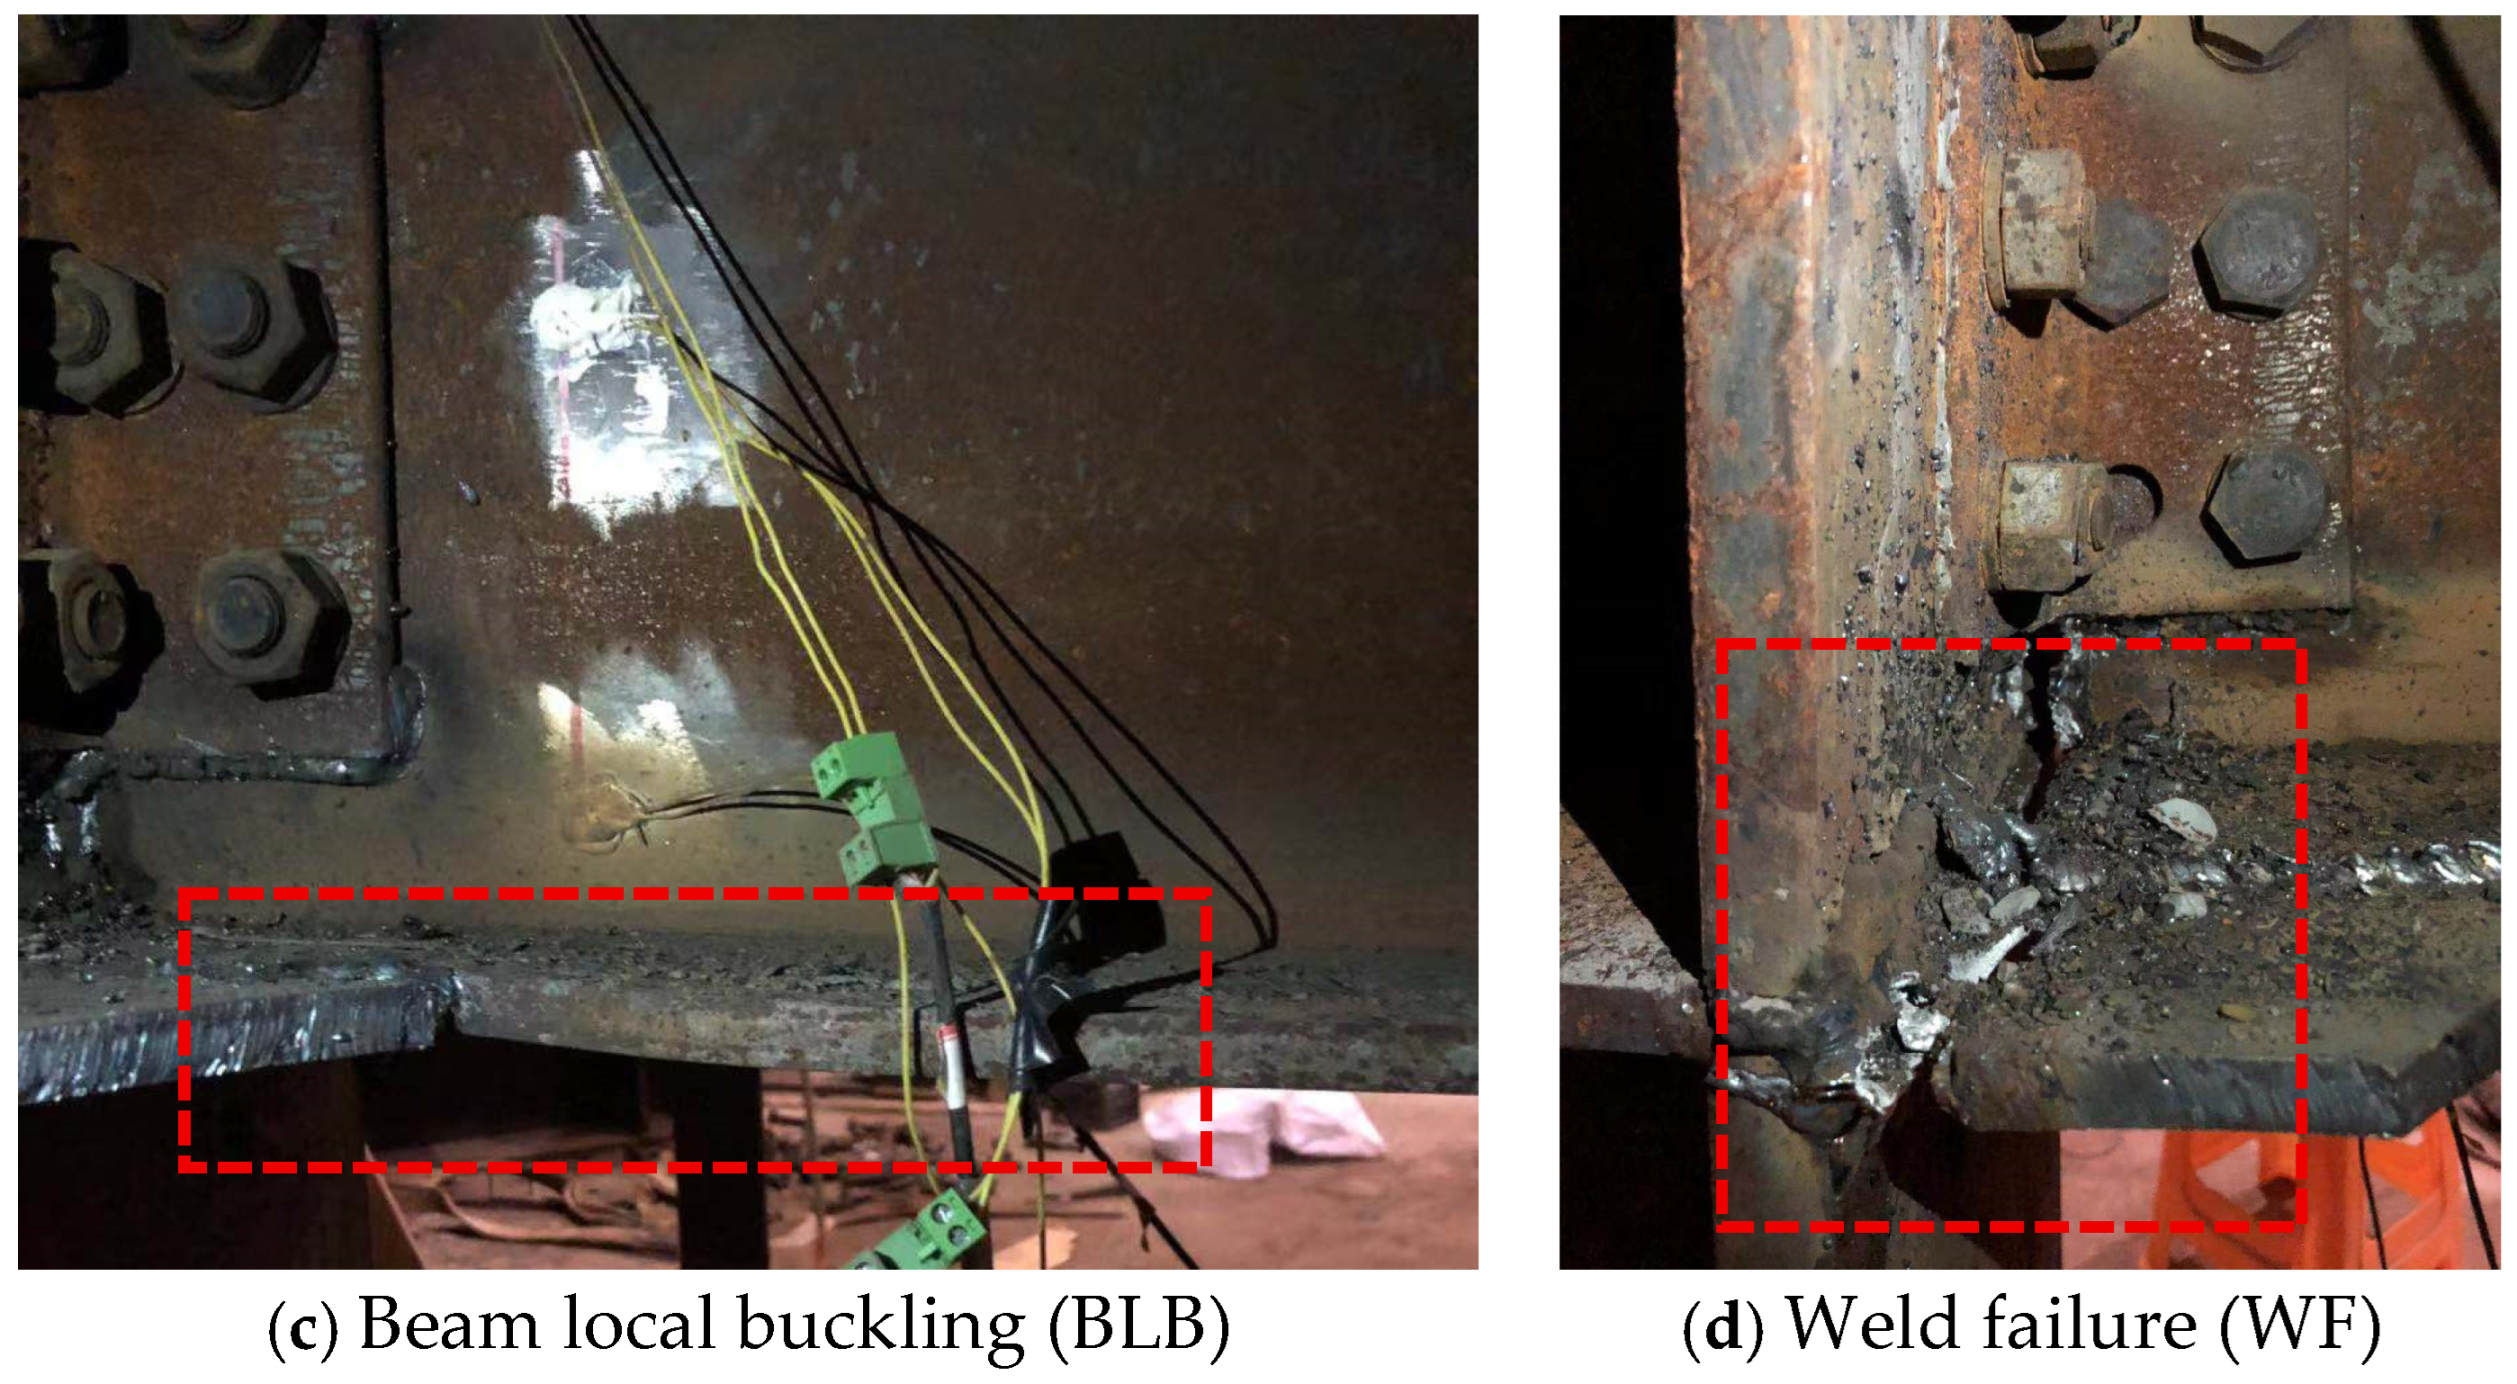
Four failure modes were observed in the URSP-PBL specimens. In all specimens, beam yielding and local buckling of the lower flange occurred, accompanied by cracking of the upper flange weld. The failure mode and failure load of all specimens were governed by negative bending. No separation was observed between the steel beam and the concrete slab at the end of testing, as shown in Figure 6, confirming the effectiveness of the uplift-restraining design.

3.2. Failure Mode

Since all specimens cracked and failed first under negative bending, the failure mode was governed by negative bending moment. Multiple failure modes were observed in each specimen, as shown in Figure 7 and Table 6. Due to poor weld quality, specimen URSP-S-NC-400 experienced premature weld cracking.

3.3. Strain Measurement

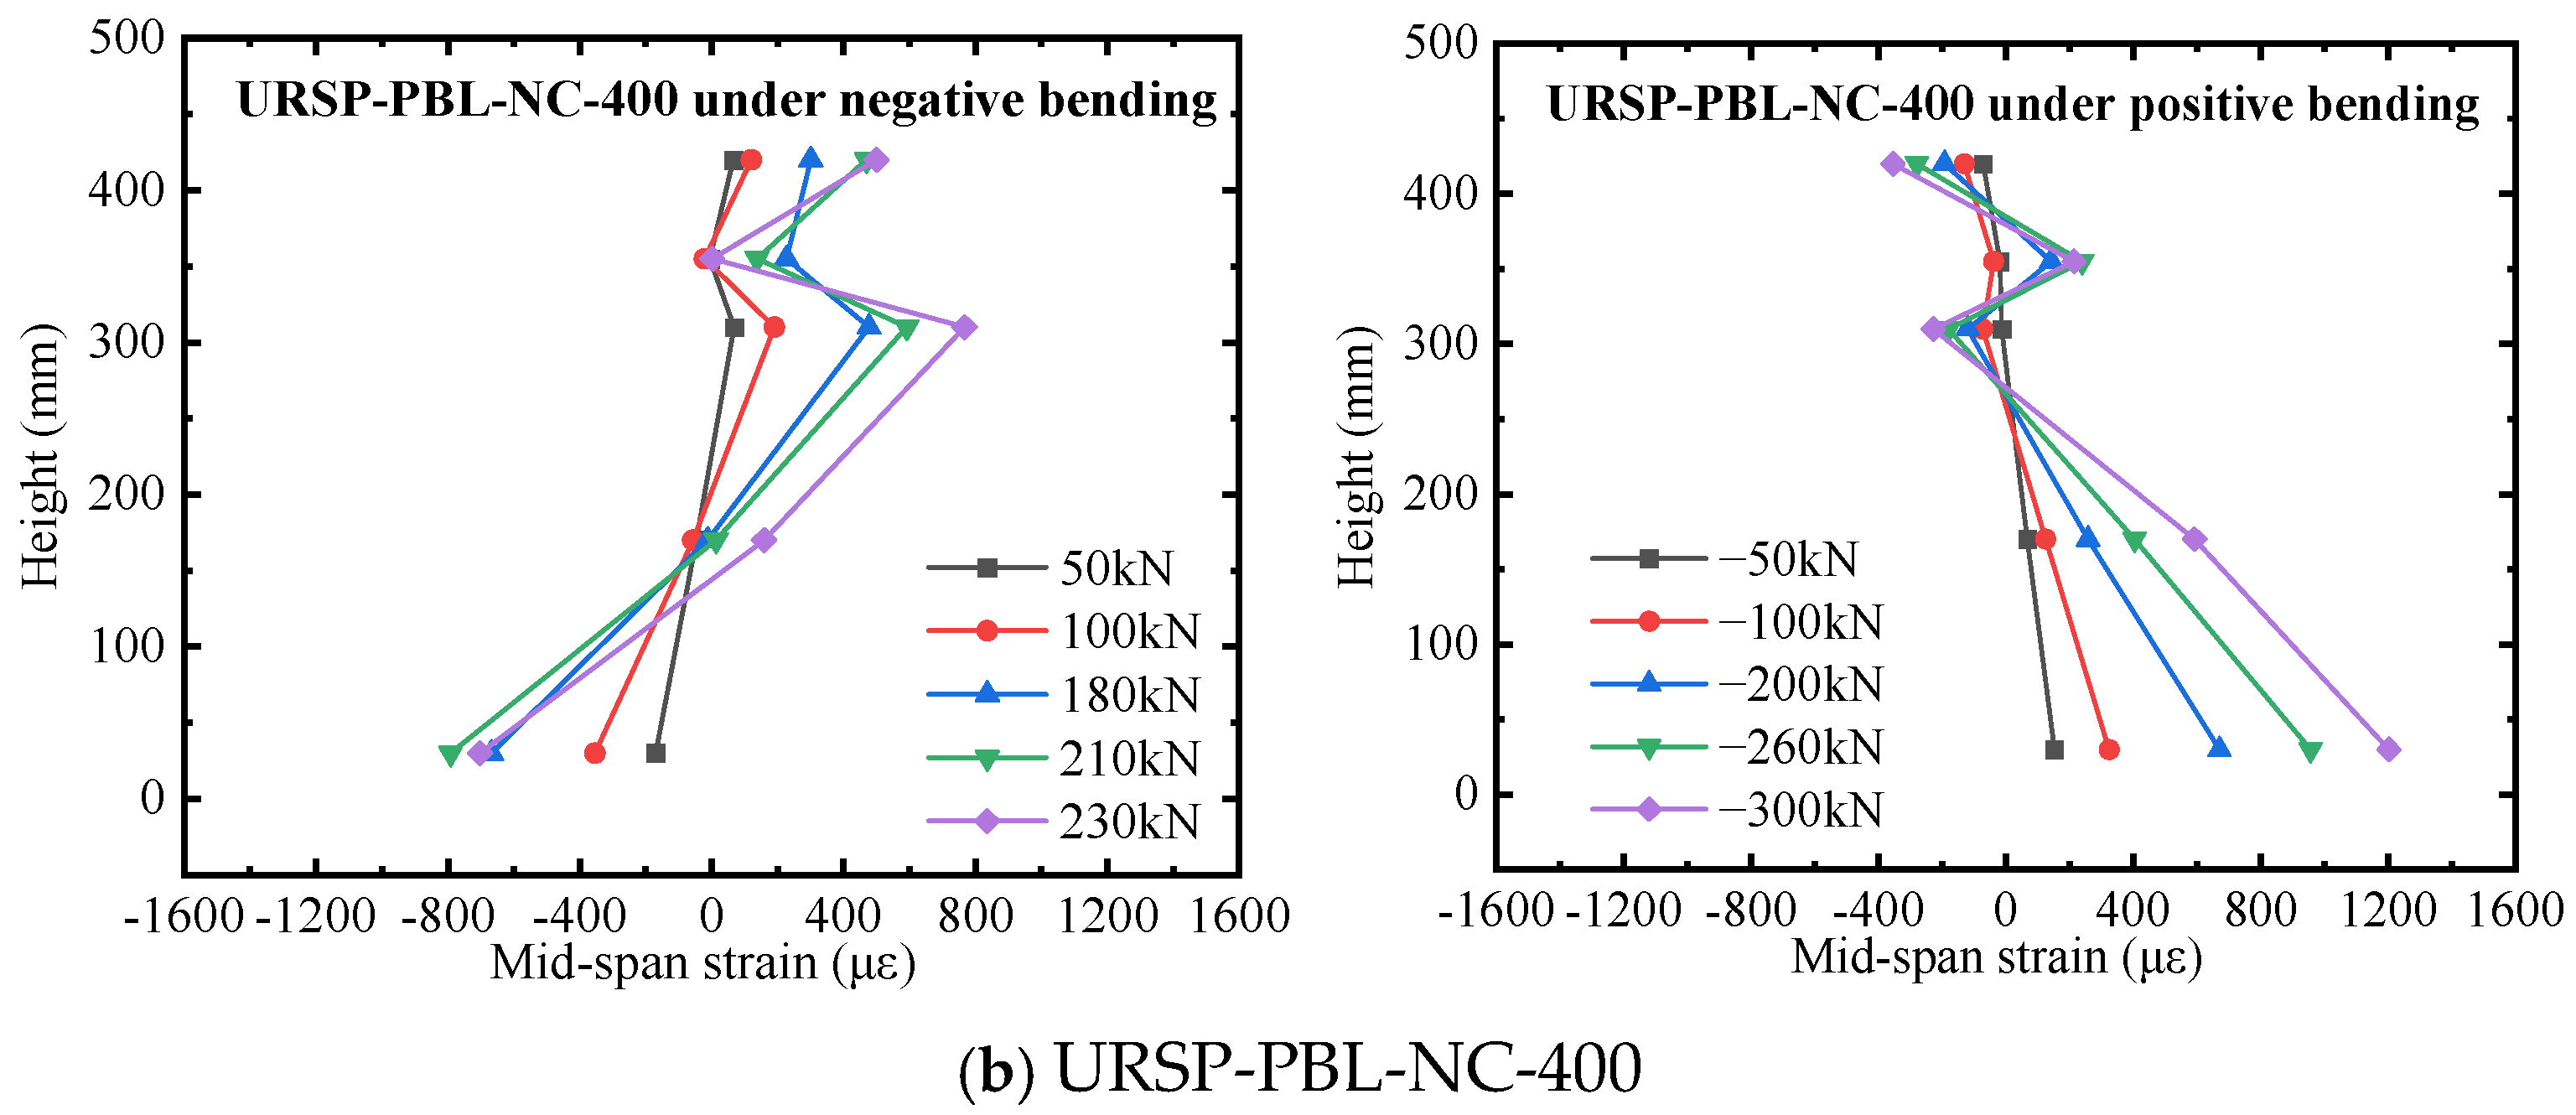
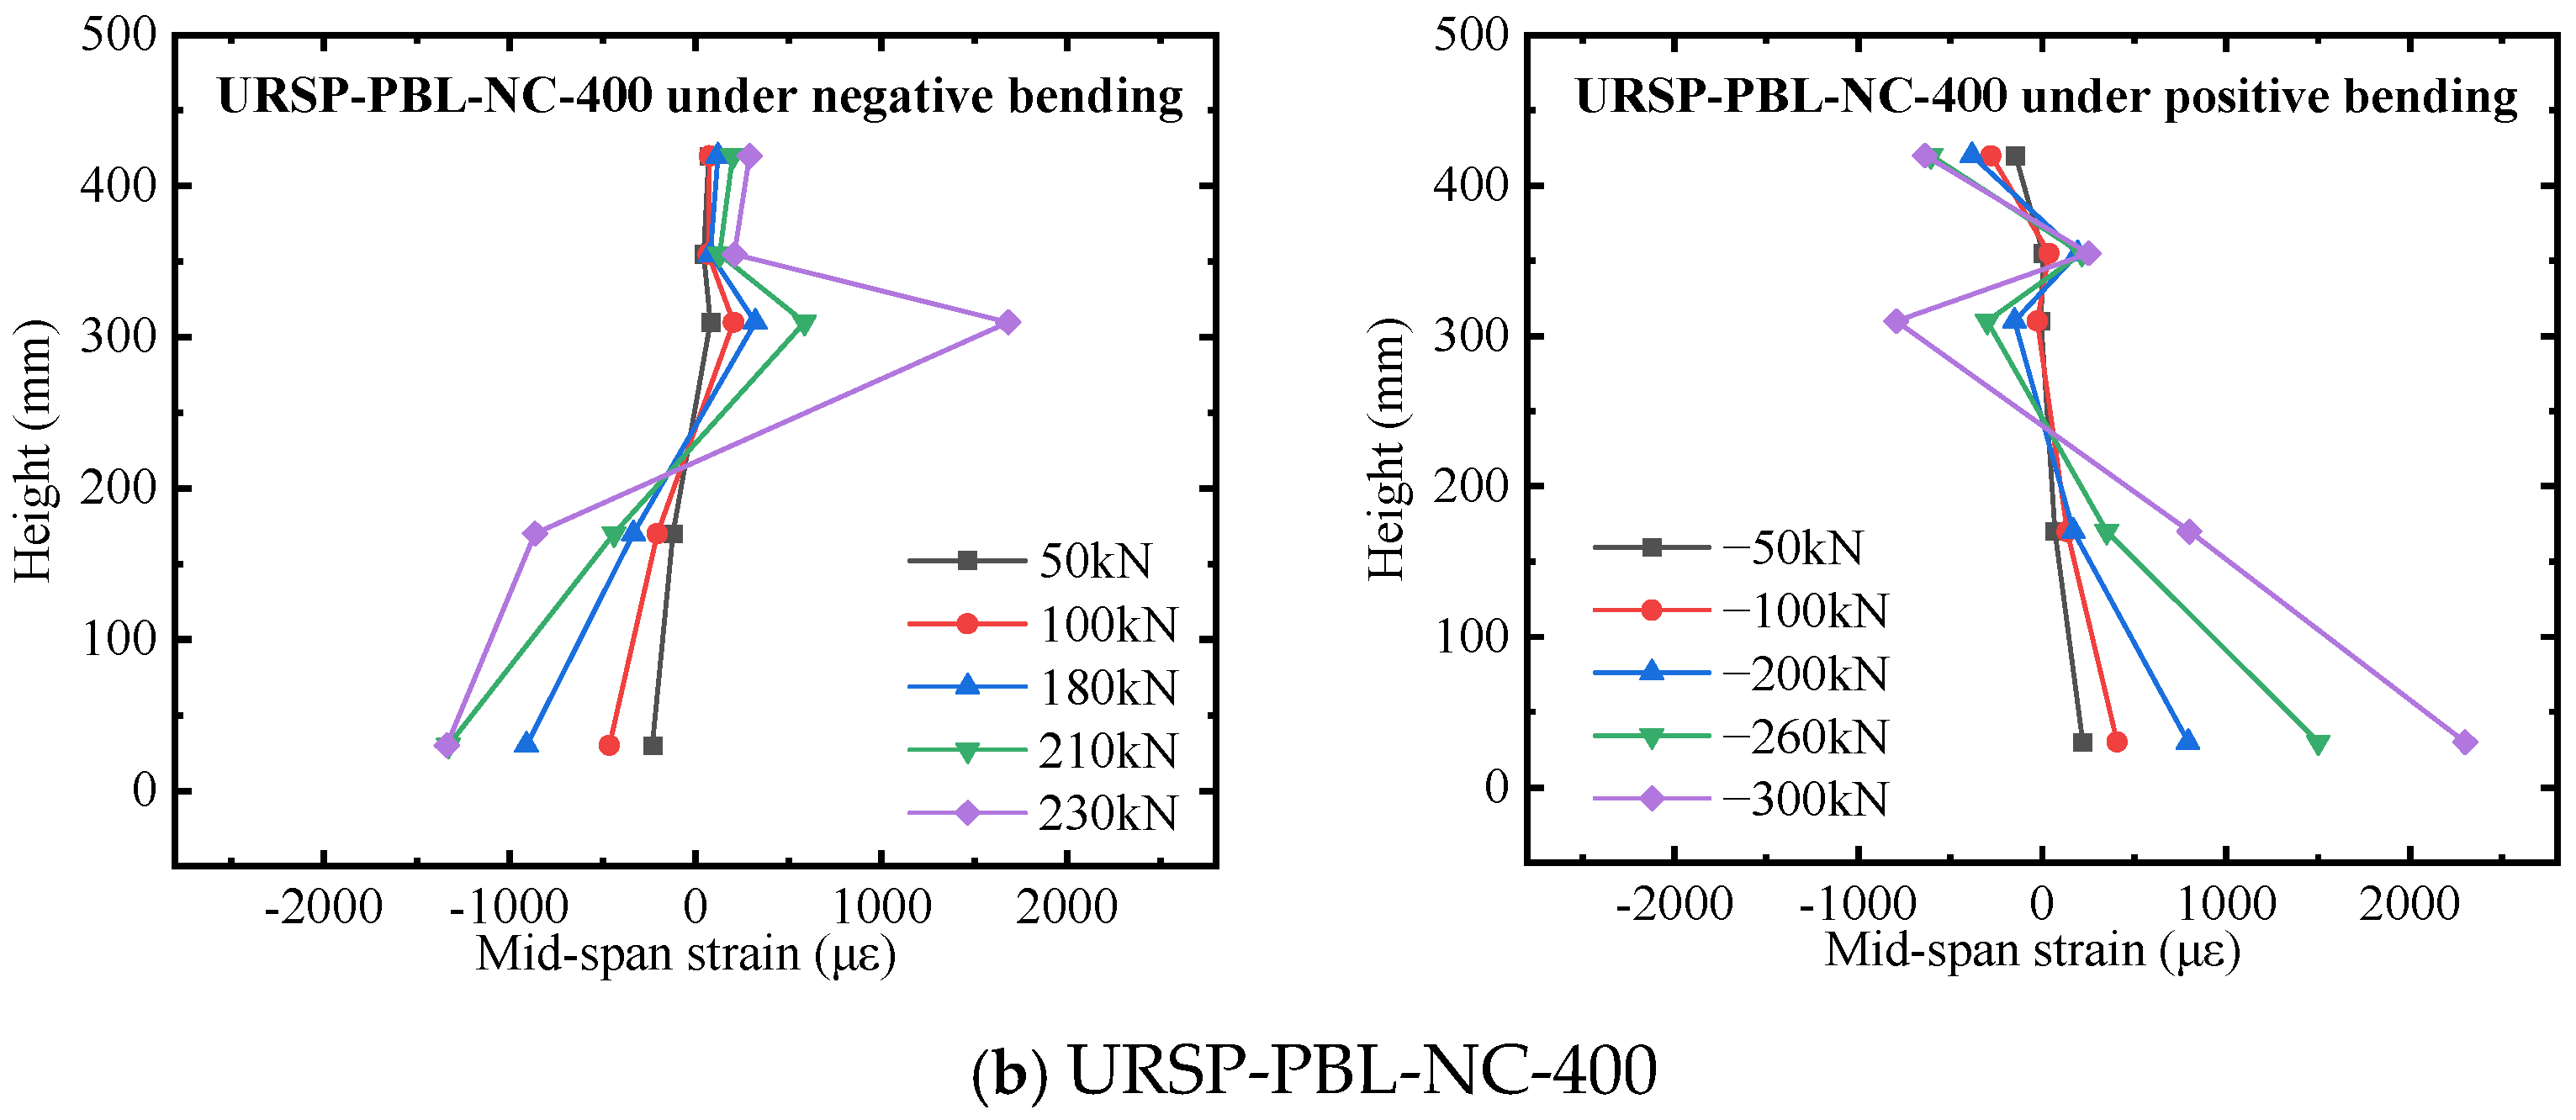
Since the measured strains of the PBL specimens followed similar trends, only specimen URSP-PBL-NC-400 was selected as the representative for analysis.
(1)
Strain distribution in the steel beam and reinforcement at mid-span
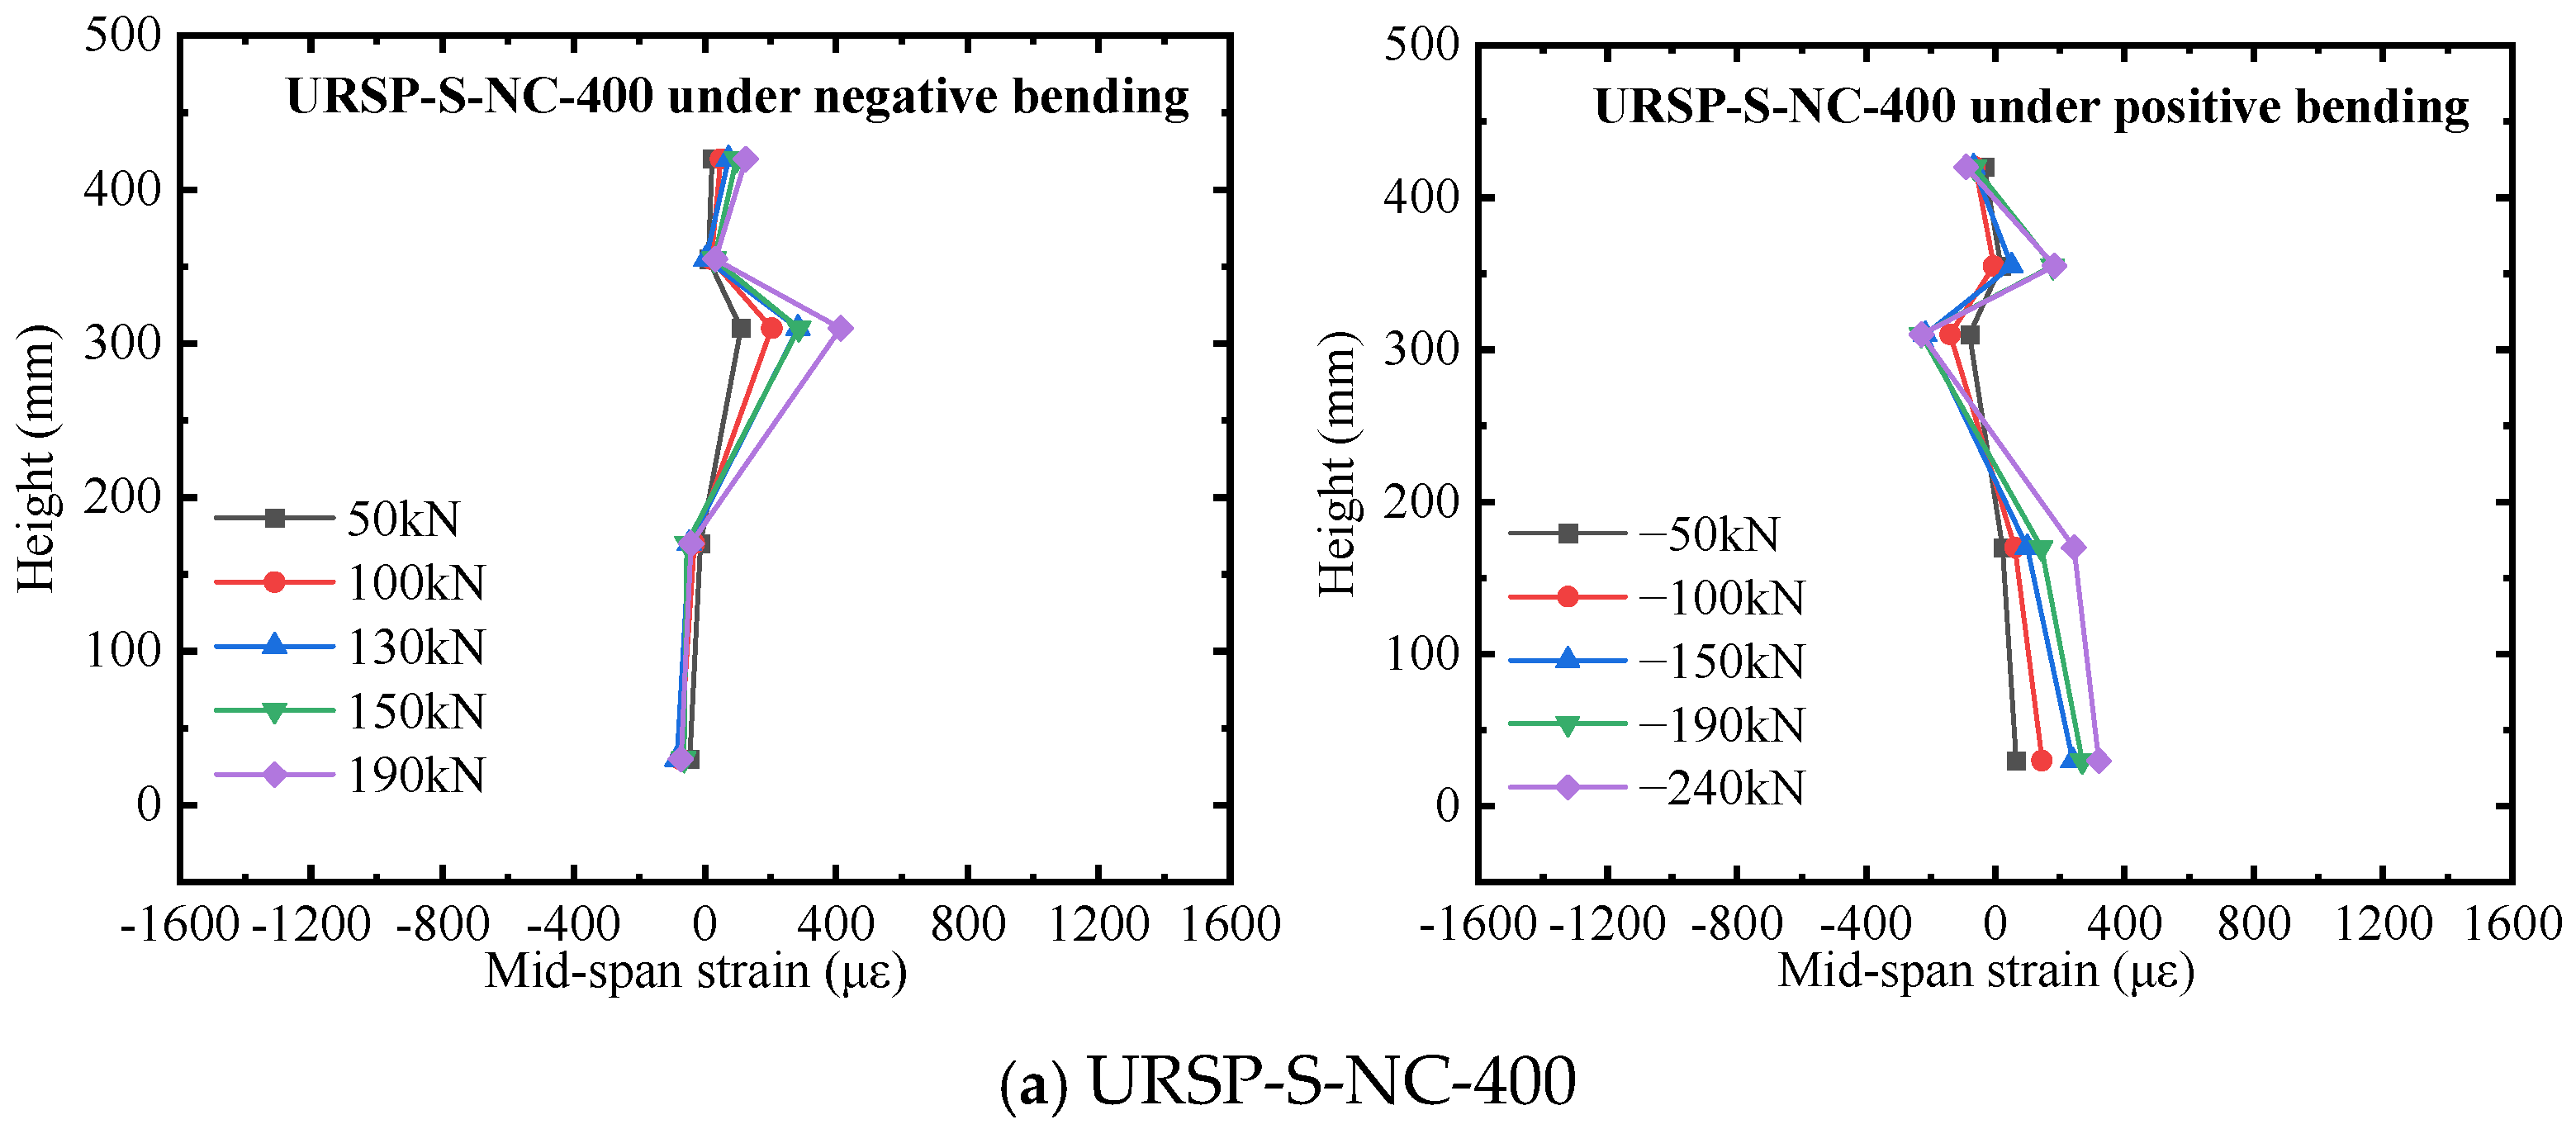
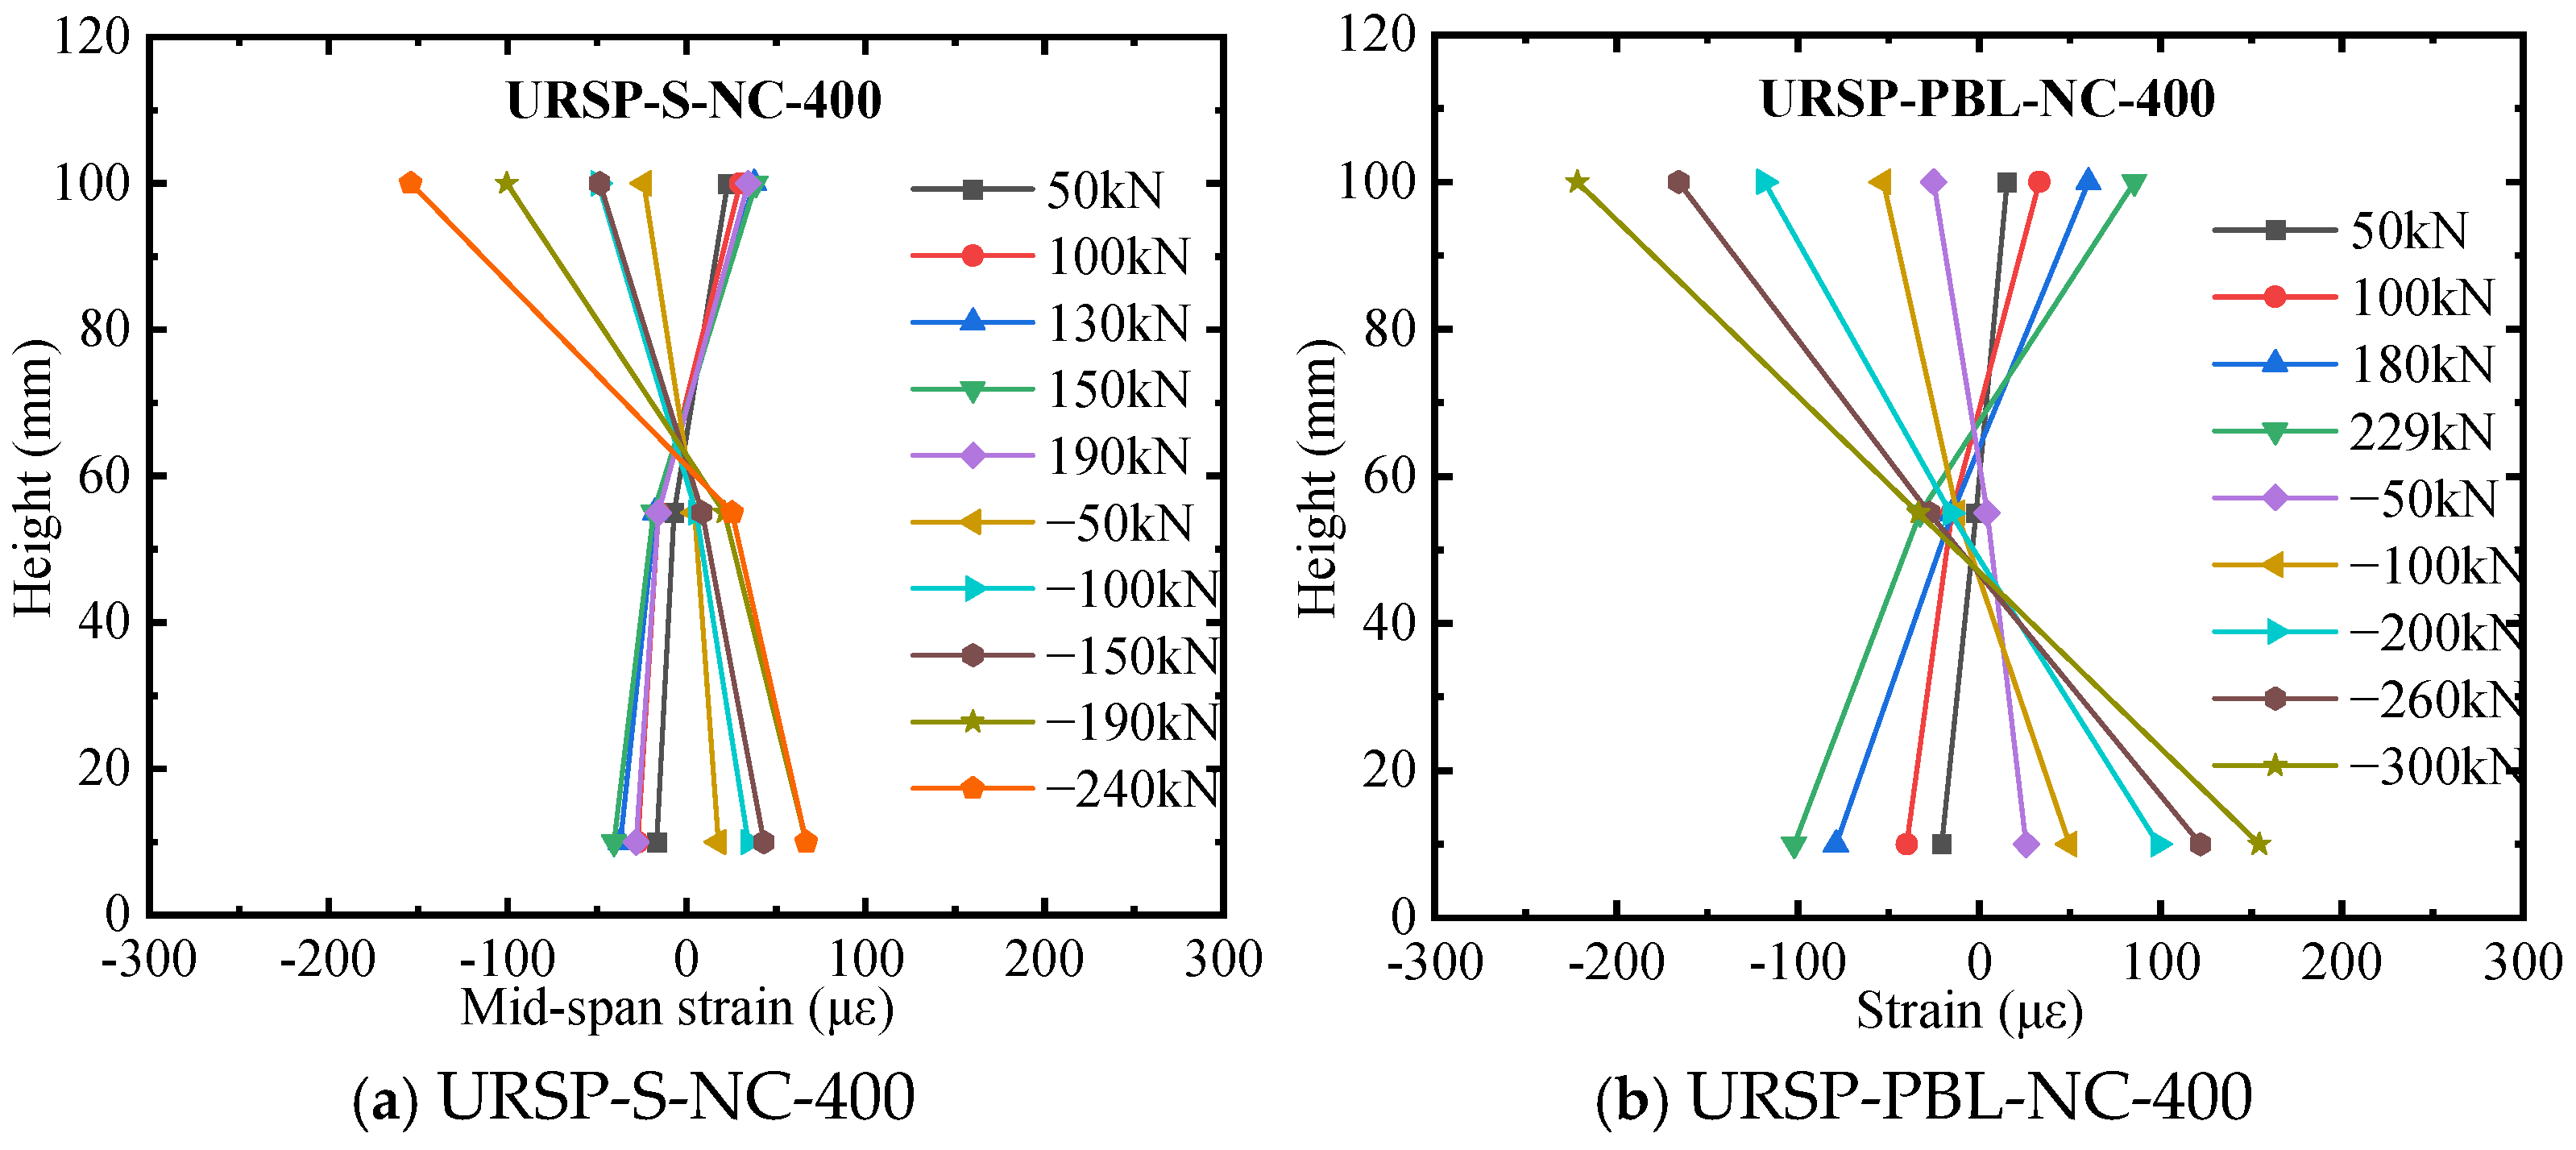
Taking the bottom of the steel beam as the zero point and the upward direction as positive, the strain distribution along the section height under different load levels is presented in Figure 8. It can be observed that the strains in the steel beam varied approximately linearly with section height. However, at a height of 355 mm (i.e., the location of the longitudinal reinforcement at the slab bottom), notable strain discontinuities were observed under both positive and negative bending, with the discontinuity being more pronounced under negative bending. This indicates that the strain level of the slab reinforcement was considerably lower than that of the steel beam. Furthermore, under negative bending, the neutral axis position was generally lower than that under positive bending, which is attributed to the different contributions of the concrete slab to the composite section stiffness under positive and negative bending moments.
(2)
Strains in the steel beam and rebar at the root section
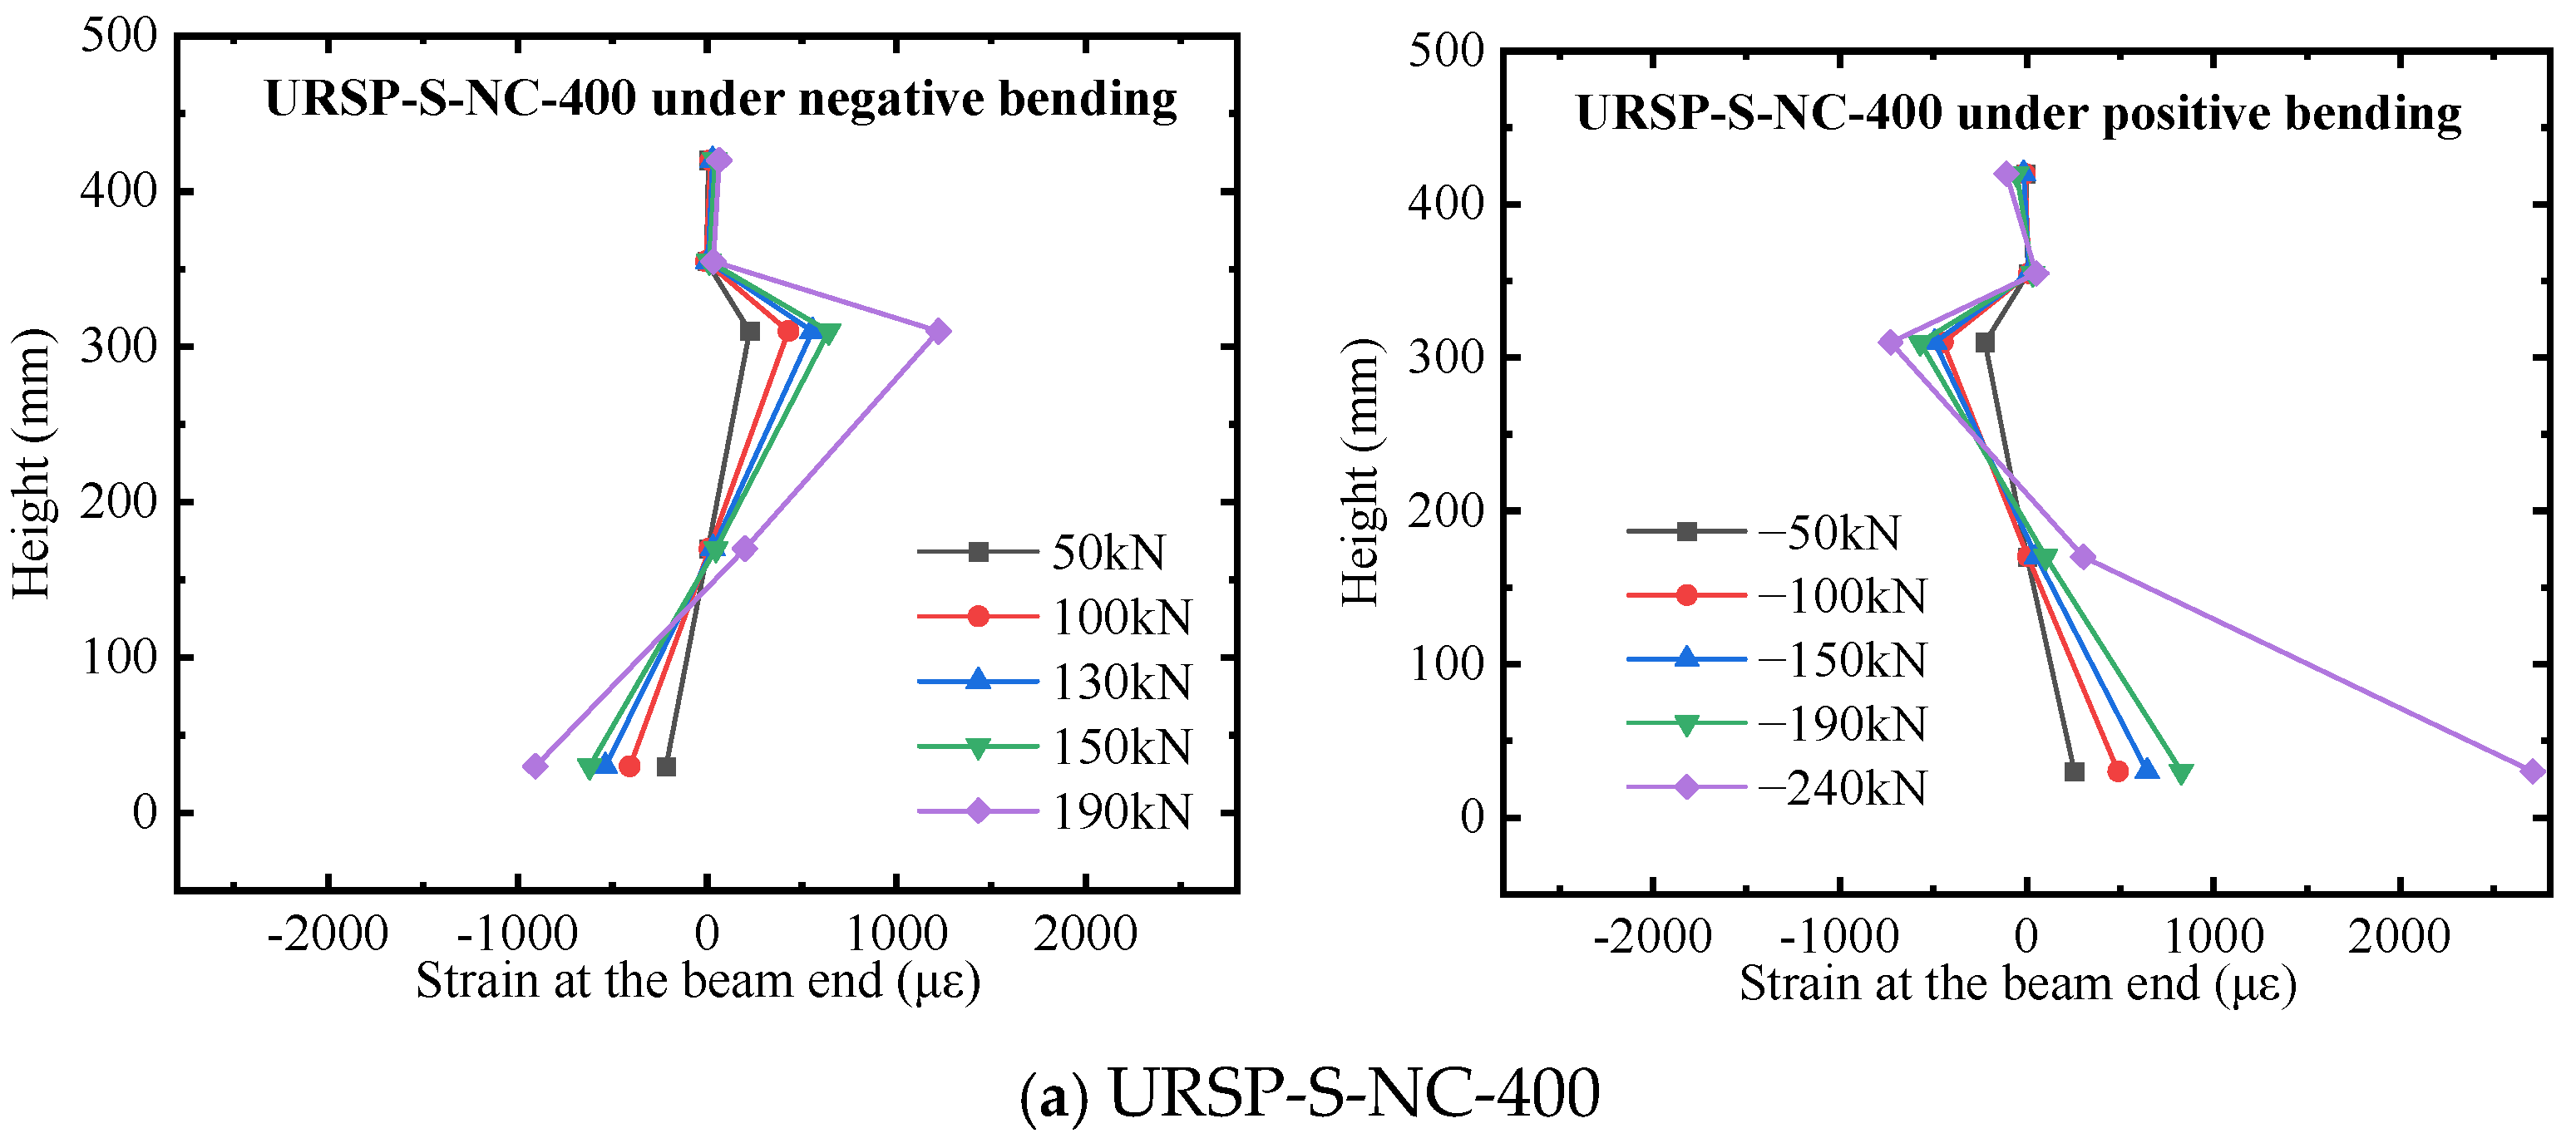
The strain distribution along the section height at the root is shown in Figure 9. Similar to the mid-span section, strain discontinuities also appear at the height of 355 mm (the location of the bottom longitudinal rebar in the slab), with larger discontinuities under negative bending than under positive bending. The strain distribution across the whole section does not satisfy the plane section assumption. As the load increases, the strain discontinuity at the slab bottom rebar becomes more pronounced. It can be seen from the figure that under negative bending, the strain increase in the steel beam is roughly synchronized with the load increase, while the strain increase in the longitudinal rebar is very limited, and the rebar stress remains low at the end of loading. This is mainly due to the stress release effect of the URSP connectors.
Comparing the strain distributions at the root and mid-span, the strain discontinuity at mid-span is smaller than that at the root, especially under negative bending. The reason is that URSP connectors are arranged at the beam end, where the rebar stress is largely released, whereas the mid-span location is at the transition between URSP connectors and conventional connectors, where the stress release of rebars begins to be restricted.
(3)
Strains on the side face of the concrete slab at mid-span
Observations showed that cracks on the top surface of the concrete slab were mostly concentrated near the mid-span region, indicating that the slab in this region was subjected to relatively high tensile stresses. Therefore, the strains at different heights on the side face of the mid-span concrete slab were statistically analyzed. Taking the bottom of the concrete slab as the zero point and the upward direction as positive, the strain distributions on the side face of the mid-span concrete slab for each specimen are shown in Figure 10.
As shown in the figure, the strains across the slab section were generally linearly distributed under different load levels, indicating good composite action between the precast slab and the cast-in-place concrete topping. The absolute values of strain under negative bending were generally smaller than those under positive bending. This is mainly because the concrete slab in the negative moment region is more significantly affected by the URSP connectors, which release part of the tensile stress within the slab.
(4)
Side face of concrete slab at the root section
The strain distribution on the side face of the concrete slab at the root section is generally consistent with that at mid-span, i.e., it varies linearly along the section height, and thus is not presented separately in a figure. The main difference between the two locations is that under negative bending, the strain values at the root section are smaller than those at mid-span. This indicates that the URSP connectors at the beam end effectively release the tensile stress in the concrete, thereby preventing through-cracks at the root.
The above strain analysis shows that during loading, the steel beam flange and web reached the yield strain first, while the slab longitudinal reinforcement remained at a relatively low strain level and did not yield. This is attributed to the longitudinal slip permitted by the URSP connectors at the slab–beam interface under negative bending, which releases part of the tensile stress in the concrete slab and thus reduces the force demand on the reinforcement. As a result, the reinforcement did not reach its full strength throughout the loading process, which explains why the two reinforcement grades (HRB400 and HRB500) had only a limited effect on the seismic performance.

3.4. Load-Carrying Capacity

Since all specimens cracked and failed first under negative bending, the load-carrying capacity was governed by negative bending moment. The yield load, cracking load, and ultimate load of the specimens are summarized in Table 7. It should be noted that although the URSP-S specimen failed prematurely due to poor weld quality, the measured values of yield load, yield displacement, cracking load, and cracking displacement were all recorded before the weld failure occurred. Therefore, the comparison between the URSP-PBL specimens and the URSP-S specimen remains valid.
The yield point of each specimen was determined from the strain gauge readings on the steel beam, and the corresponding load and displacement were taken as the yield load Fy and yield displacement Δy, respectively; the visual observation of the hysteresis loop becoming fuller was used only as a supplementary reference.
The cracking load Fcr was defined as the load at which the first transverse crack appeared on the top surface of the concrete slab, rather than the initial localized cracks at the slab end. In the tests, the first cracks occurred near the loading point, corresponding to the end of the connector region. These localized cracks resulted from stress concentration caused by the abrupt change in section stiffness and local disturbance at the connector end. They were not considered as the initial flexural cracks for determining the cracking load, as they did not reflect the flexural tensile cracking behavior of the concrete slab in the negative moment region.
The maximum crack width wmax was taken as the largest value measured on the slab top surface at the end of testing. It should also be noted that the crack widths measured in this test correspond to the crack development at the ultimate failure state and thus do not represent the crack widths under service conditions. In practical design, the crack width should be verified for the serviceability limit state in accordance with the relevant design codes.
Based on the results in Table 7, the following observations can be made:
(1)
Compared with URSP-S-NC-400, URSP-PBL-NC-400 exhibited a 29% increase in cracking load and a reduction in the maximum crack width on the slab top. It is worth noting that although the URSP-S specimen failed prematurely due to poor weld quality, the measured crack width in the URSP-S specimen was still larger than that observed in the URSP-PBL specimens. This observation indicates that the URSP connectors can effectively enhance the cracking resistance of composite beams in the negative moment region. This improvement can be attributed to the larger relative slip between the concrete slab and the steel beam, which more effectively releases the tensile stresses in the concrete slab.
(2)
The URSP-S-NC-400 specimen exhibited the lowest ultimate load and displacement, which can be attributed to premature cracking caused by poor weld quality. Therefore, the ultimate load and displacement of this specimen are not suitable for direct comparison with other specimens.
(3)
Compared with URSP-PBL-NC-400, URSP-PBL-HPC-400 exhibited a 13% increase in cracking load and a 52% reduction in the maximum crack width on the slab top. A similar trend was observed in the comparison between URSP-PBL-HPC-500 and URSP-PBL-NC-500. In these comparative tests, where all parameters except the concrete type were kept constant, the crack widths of specimens with HPC were noticeably smaller than those with normal concrete, confirming the beneficial effect of HPC in enhancing cracking resistance.
(4)
Within the tested parameter range, the ultimate loads of the URSP-PBL specimens showed only minor differences. Variations in concrete material and reinforcement grade resulted in improvements of less than 5%. This limited influence is attributed to the occurrence of concrete cracking in the negative moment region, which contributes little to the ultimate load-carrying capacity.

3.5. Hysteretic Curve

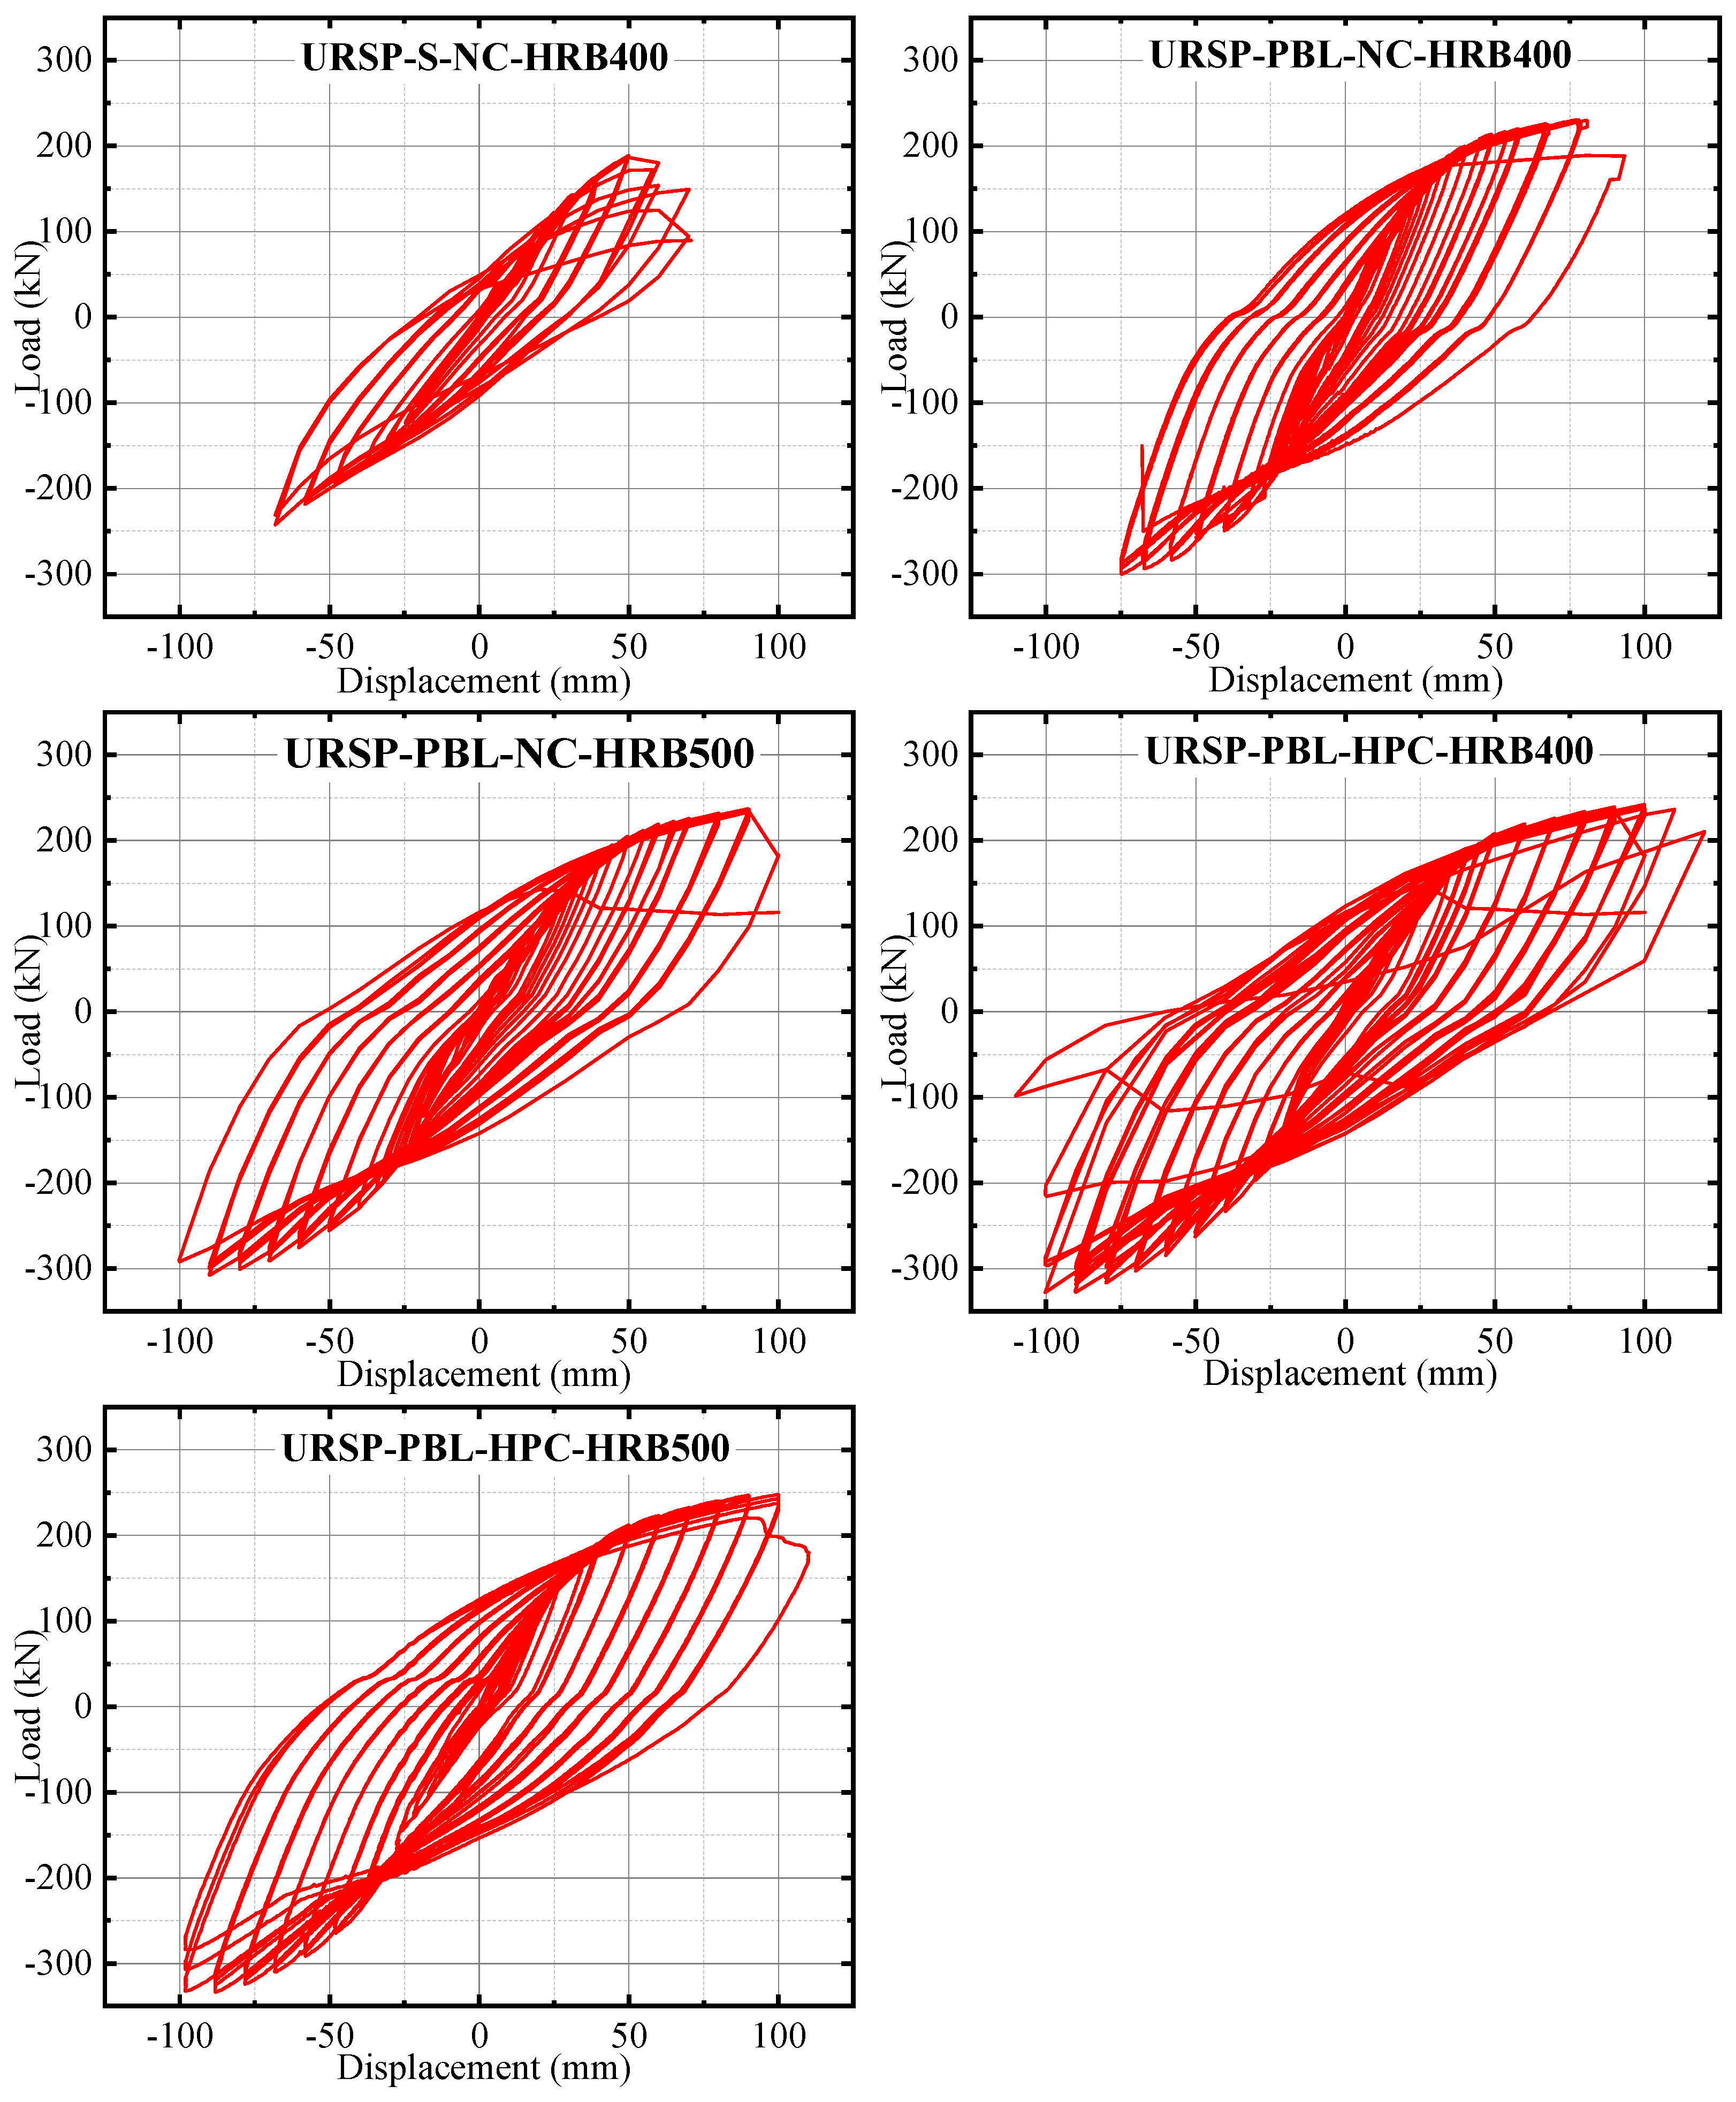
The shape of the hysteresis loop obtained from quasi-static testing directly reflects the deformation capacity, stiffness degradation, and energy dissipation of the structure. The hysteresis loops of the specimens are shown in Figure 11.
Specimen URSP-S-NC-400 exhibited fewer hysteresis loops and the least full hysteresis curve, primarily due to premature brittle weld cracking and early failure. Its load-carrying capacity under negative bending was notably lower than that under positive bending, and strength degradation was more pronounced during the negative-bending half-cycle, indicating that the ultimate failure of specimen URSP-S-NC-400 was governed by negative bending.
The hysteresis loops of the URSP-PBL specimens exhibited essentially similar shapes. The loops were full, with slight pinching at the center, suggesting a small amount of slip in the specimens. The load-carrying capacity of the URSP-PBL specimens under negative bending was also notably lower than that under positive bending, and strength degradation was more pronounced during the negative-bending half-cycle, confirming that the ultimate failure of these specimens was also governed by negative bending.
Among the URSP-PBL specimens, those made with high-performance concrete (URSP-PBL-HPC-400 and URSP-PBL-HPC-500) exhibited fuller hysteresis loops than those made with normal concrete (URSP-PBL-NC-400 and URSP-PBL-NC-500).

3.6. Skeleton Curve

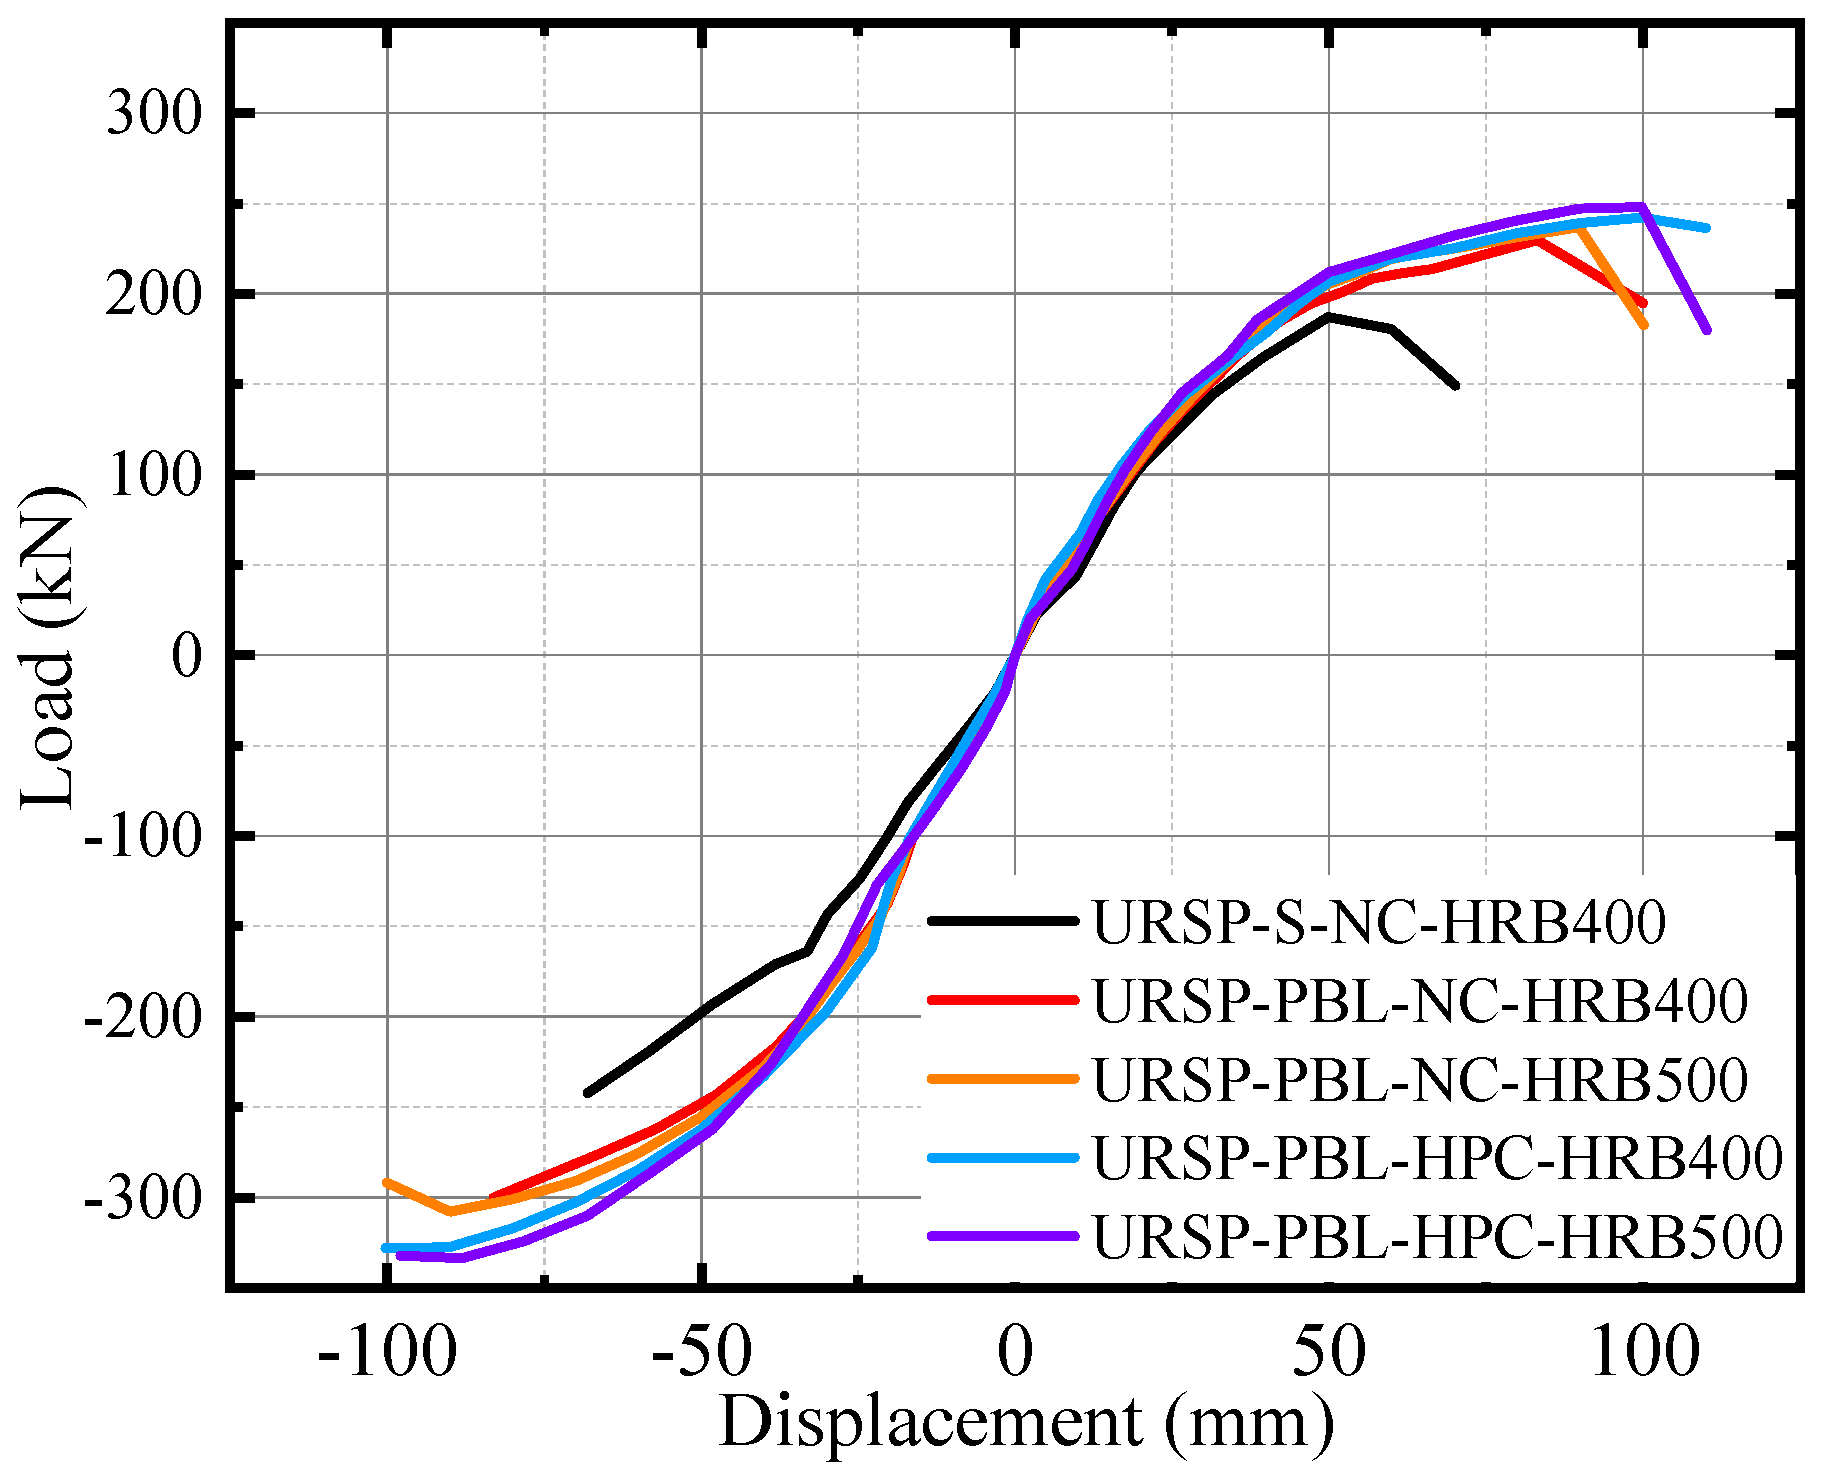
The skeleton curves were obtained by connecting the peak points of each loading cycle, as shown in Figure 12. It can be observed that the peak loads in tension were consistently higher than those in compression for all specimens. This is attributed to the contribution of the concrete slab, which is placed in compression and thus fully mobilizes its compressive strength during the tension-loading phase. Although the URSP-S specimen failed prematurely due to poor weld quality, its response prior to failure remains informative. It is evident that the URSP-S specimen exhibited earlier yielding and lower initial stiffness compared with the other specimens. In contrast, the URSP-PBL specimens showed higher stiffness, as evidenced by a later appearance of the turning point on the skeleton curves.
The initial stiffness of each specimen was derived from the corresponding skeleton curve, and the results are summarized in Table 8. It can be observed that the initial stiffness of URSP-S-NC-400 with stud connectors was the lowest among all specimens. The URSP-PBL specimens exhibited higher initial stiffness, with URSP-PBL-NC-400 showing a value 1.27 times that of URSP-S-NC-400. This is attributed to the presence of perforated steel plates, which enhance the flexural stiffness of the composite beams. Among the four specimens with perforated steel plate connectors, the initial stiffness values showed no significant difference. This is mainly because the steel components of the four specimens were identical, with the only differences being the concrete material and the reinforcement grade in the cast-in-place concrete topping. This indicates that these two parameters have a limited contribution to the flexural stiffness of the composite beams.

3.7. Displacement Ductility Coefficient

The displacement ductility coefficient is an important indicator for evaluating the ductility of specimens [36]. The displacement ductility coefficient of specimen URSP-S-NC-400 is not valid because the specimen failed prematurely due to poor weld quality before developing its full plastic deformation capacity. Therefore, this value should not be used for comparison or as a reference for seismic performance. The following discussion focuses on the ductility of the URSP-PBL specimens, which were fabricated with consistent weld quality.
It should be noted that the URSP-PBL-HPC specimen was terminated at a displacement amplitude of 110 mm due to observable specimen failure. At this point, the load had not yet dropped to 85% of the peak value. Therefore, the ultimate displacement was taken as 110 mm. Table 9 summarizes the displacement ductility coefficients of the specimens. The following observations can be made:
(1)
The displacement ductility coefficients of the URSP-PBL specimens exceeded 3, indicating satisfactory ductility.
(2)
Within the tested range, the reinforcement grade in the cast-in-place topping showed limited influence on the ductility.
(3)
The HPC specimens did not exhibit higher ductility coefficients, mainly because the ultimate displacement was governed by the deformation of the steel components rather than the concrete material. Test results showed that HPC provided a certain increase in cracking load, cracking displacement, yield load, and yield displacement, but the improvement in ultimate displacement was not significant. Therefore, the main contribution of HPC lies in improving the cracking and yielding performance, rather than enhancing ductility.

3.8. Stiffness and Strength Degradation

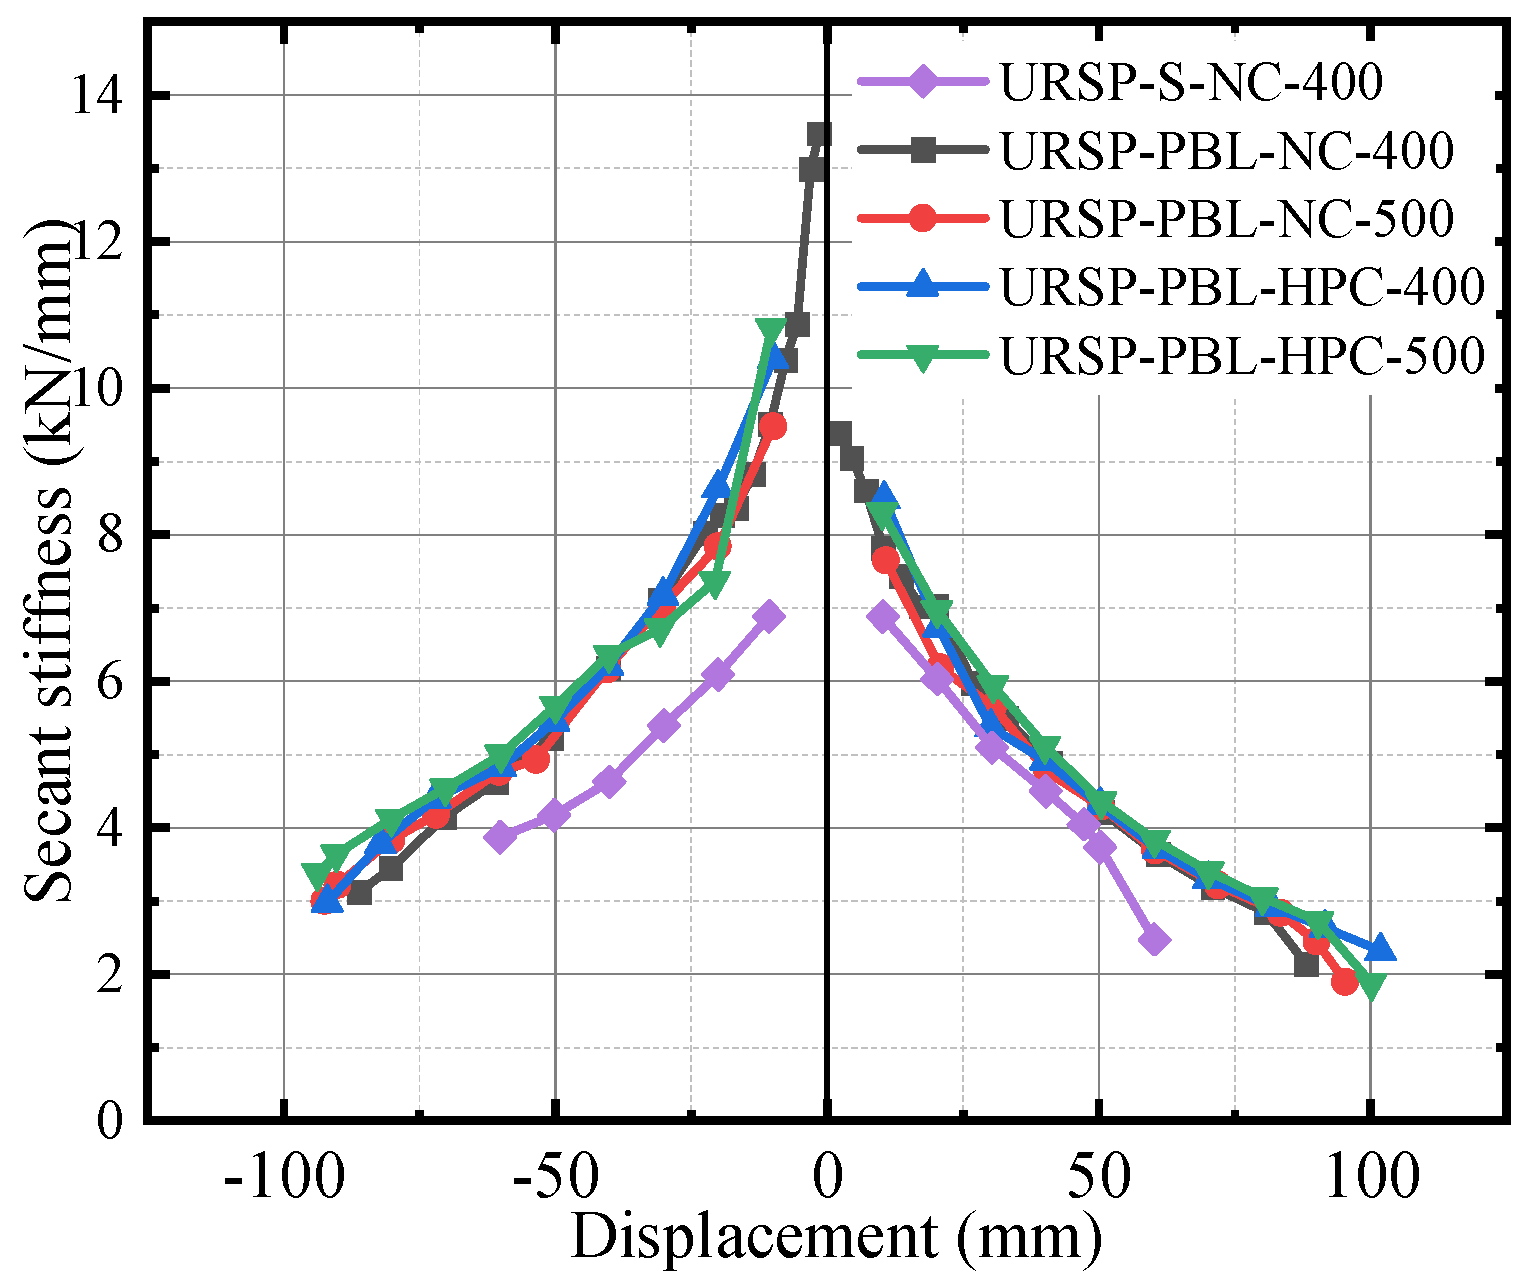
Under cyclic loading, the structural stiffness gradually decreases with increasing displacement amplitude. The degradation of secant stiffness is presented in Figure 13. It can be observed that the stiffness degradation curves of the URSP-PBL series exhibit good consistency, whereas the curve of the URSP-S specimen deviates significantly from the others. From the comparison of test results in the elastic stage, it can be seen that the elastic-stage stiffness is primarily governed by the steel members. The adoption of perforated steel plates increases the structural stiffness in the elastic stage, while the use of high-strength reinforcement and high-performance concrete shows no significant influence within the range of parameters tested in this study.
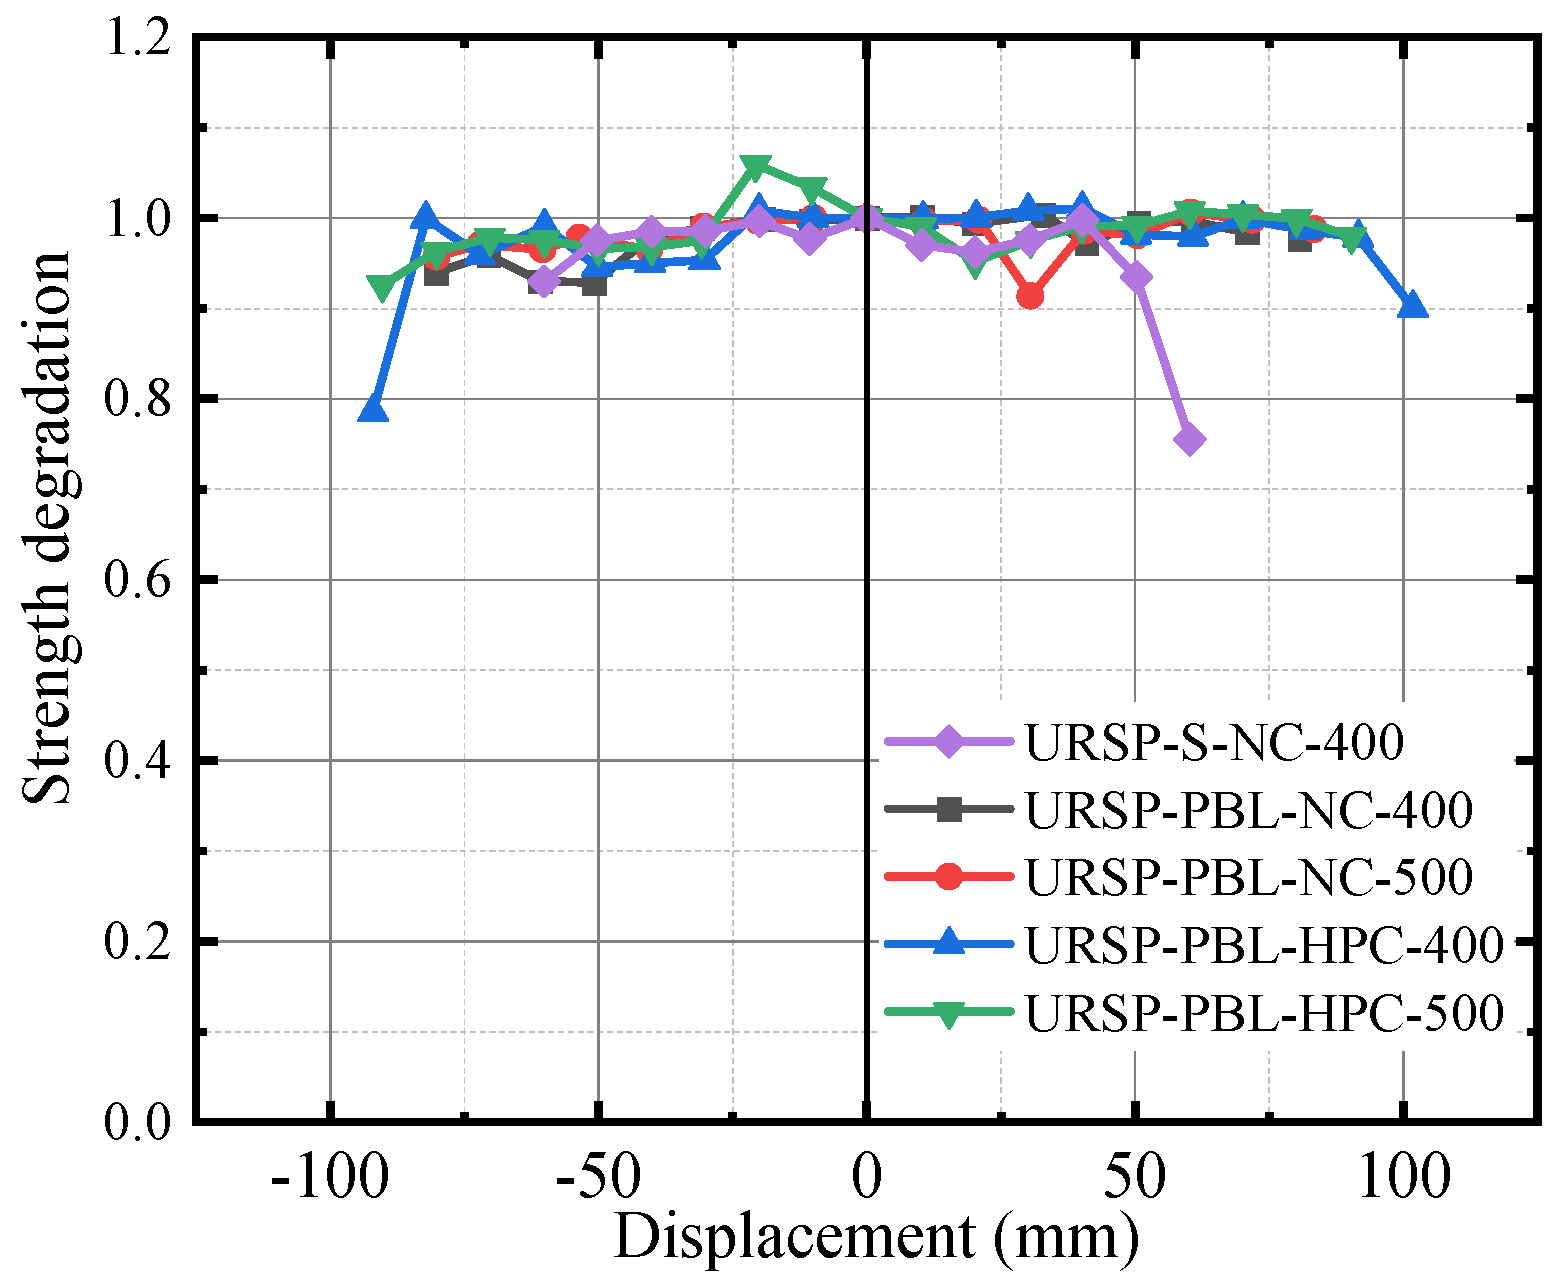
Strength degradation reflects the reduction in load-carrying capacity with increasing number of cycles at the same displacement level. It is quantified by the strength degradation coefficient, defined as the ratio of the peak load of a given cycle to that of the first cycle at the same displacement amplitude. The strength degradation coefficients are plotted in Figure 14. It can be seen that the coefficients remain close to 1 throughout most of the loading process, indicating negligible strength degradation. A notable decrease in the strength degradation coefficient occurs only when the specimen approaches failure, suggesting that significant strength degradation is associated with structural failure.

3.9. Energy Dissipation Capacity

The energy dissipation capacity of a structure is an important indicator for evaluating its seismic performance, and various quantitative indices have been proposed [37,38,39]. In this study, the maximum cyclic energy dissipation Umax, cumulative energy dissipation Usum, and cumulative energy dissipation coefficient ηa were used to evaluate the energy dissipation capacity of the tested joints. To eliminate the influence of different loading histories, the cumulative energy dissipation up to a common displacement amplitude of 100 mm was also compared among the URSP-PBL specimens. This level was selected because it was the maximum displacement amplitude completed by all specimens.
Umax is defined as the area of the fullest hysteresis loop before specimen failure; Usum is the total area of all hysteresis loops prior to failure, reflecting the overall energy dissipation capacity of the structure; and ηa is a normalized index based on cumulative energy dissipation, calculated as follows [40]:
η a = i = 1 n U i + + U i U y
where U i + + and U i are the area of the i-th hysteresis loop before failure, Uy is the nominal elastic strain energy, Uy = PyΔy/2, and Py and Δy are the yield load and yield displacement, respectively.
The maximum cyclic energy dissipation Umax does not fully reflect the overall energy dissipation capacity of the specimens, whereas the cumulative energy dissipation Usum and the coefficient ηa can effectively reflect the overall energy dissipation capacity, and both show consistent trends. Therefore, Usum and ηa were adopted as the primary indices for evaluating energy dissipation capacity in this study.
Since the URSP-S-NC-400 control specimen failed prematurely due to poor weld quality, a direct comparison of energy dissipation between the URSP-S and URSP-PBL specimens is not valid. Therefore, the analysis of energy dissipation capacity was limited to the URSP-PBL series specimens.
The energy dissipation evaluations of the specimens are summarized in Table 10, from which the following observations can be made:
(1)
The Usum and ηa values of URSP-PBL-HPC-500 were 1.24 and 1.18 times those of URSP-PBL-NC-500, respectively. In addition, when compared at the common displacement level of 100 mm, the HPC specimens still showed higher cumulative energy dissipation than the NC specimens. These results consistently demonstrate the beneficial effect of HPC on energy dissipation.
(2)
Little difference was observed in Usum and ηa between URSP-PBL-HPC-400 and URSP-PBL-HPC-500, suggesting that the reinforcement grade showed limited influence on the energy dissipation capacity within the tested range of HRB400 and HRB500.

4. Finite Element Analysis

4.1. Finite Element Model

To investigate the behavior of composite beam incorporating URSP-PBL connectors in the negative moment region, a finite element analysis was carried out. The beam–column connection was treated only as a boundary condition, with the primary focus placed on the response of the composite beam in the negative moment region.
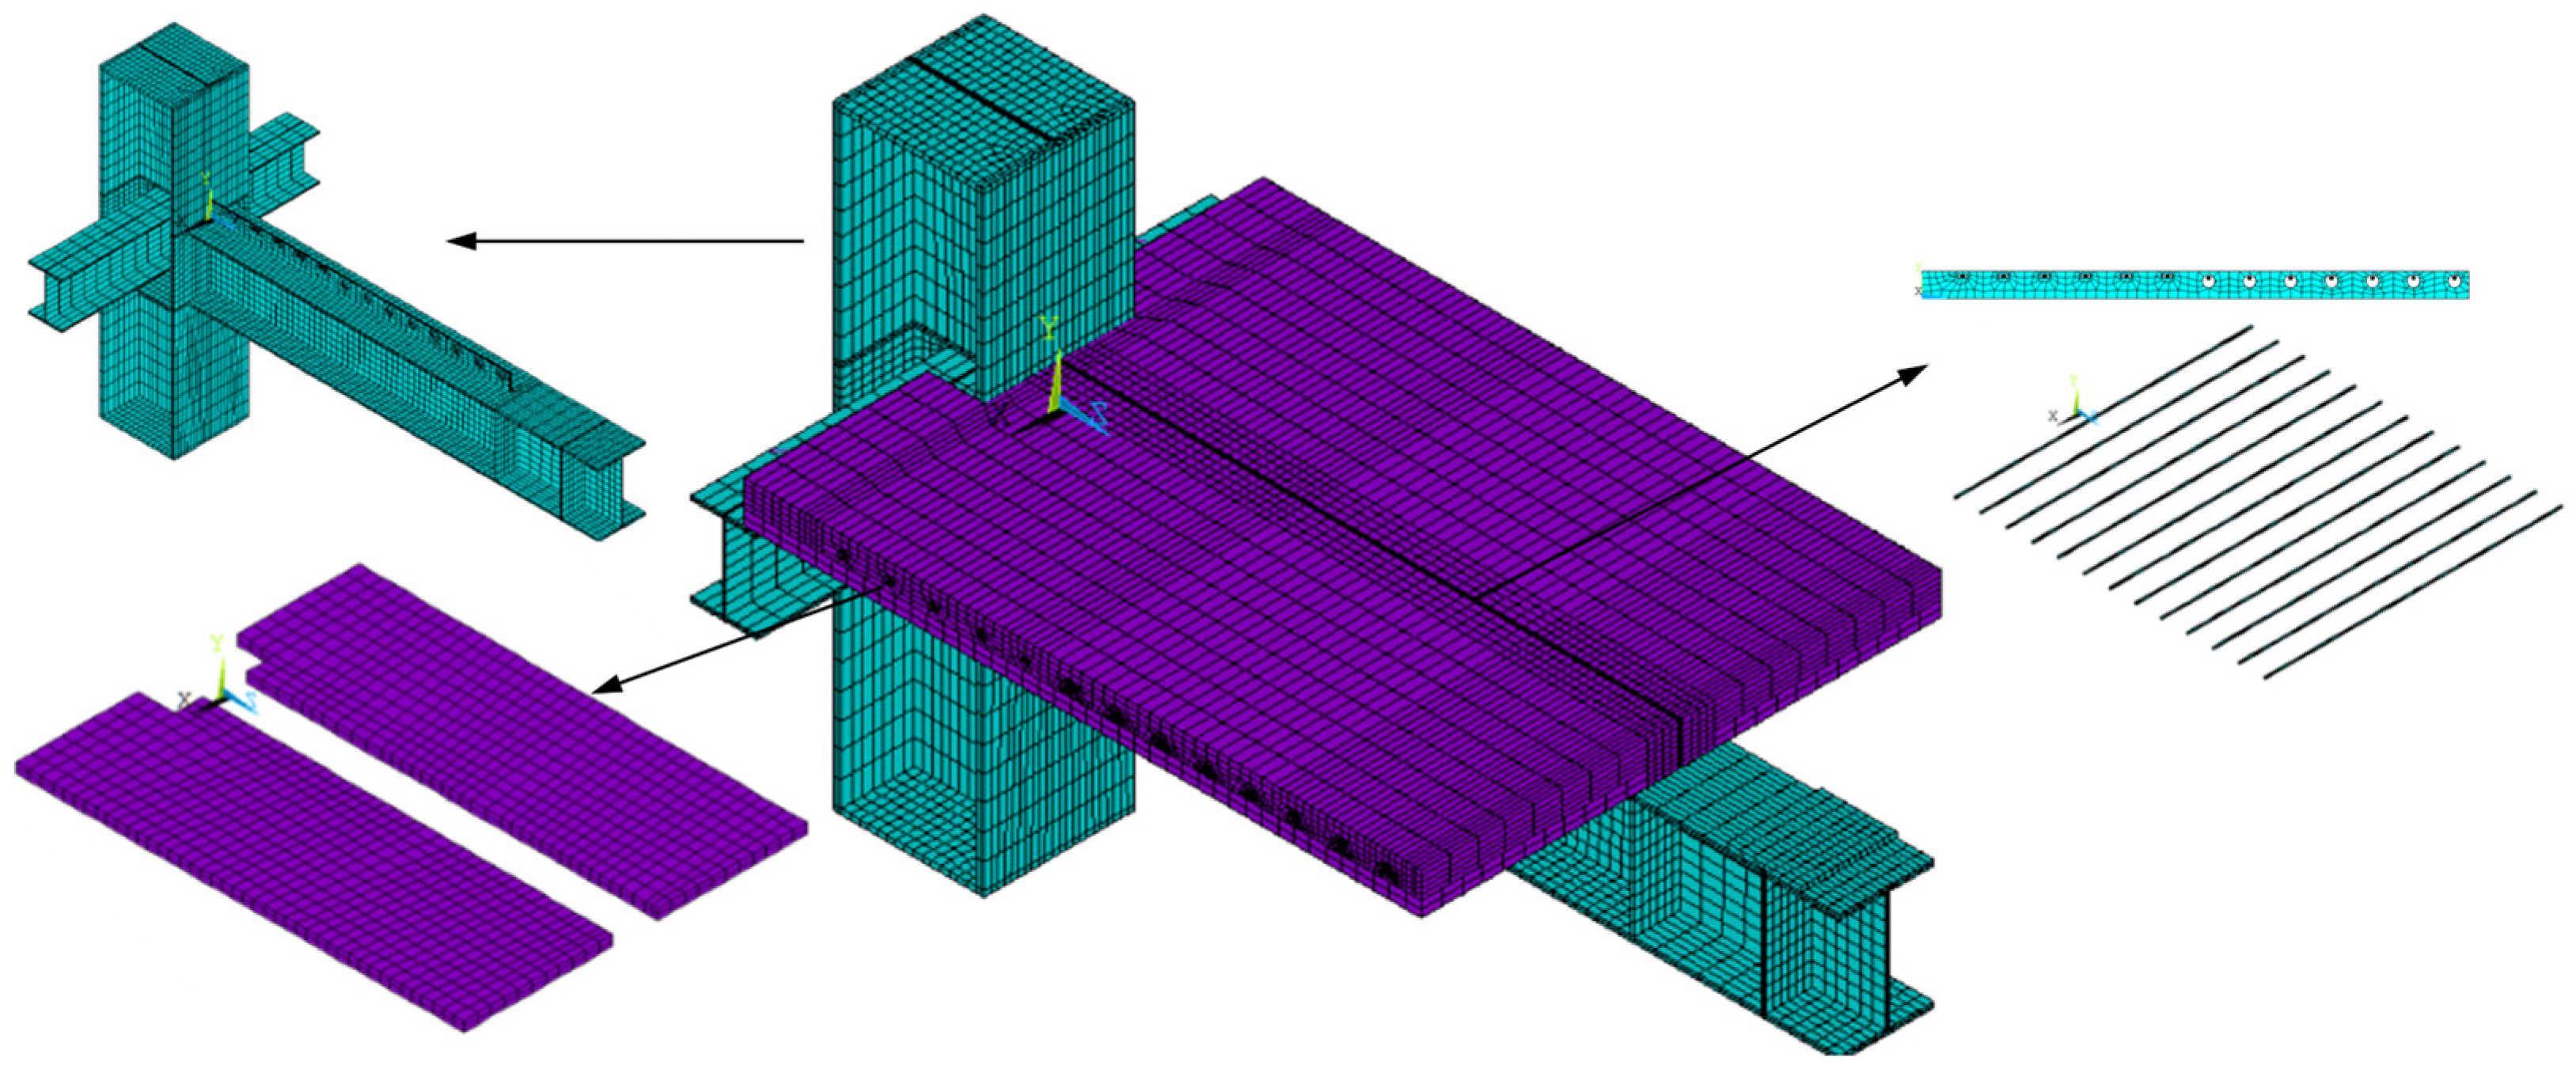
A refined finite element model was developed using ANSYS 12.0, as shown in Figure 15. The model accounted for material nonlinearity of steel and concrete, geometric nonlinearity associated with large deformations, contact nonlinearity at the interfaces between different materials, and the cracking characteristics of concrete. This allowed an accurate simulation of both the overall structural response and the cracking behavior in the negative moment region.
The detailed modeling procedure is as follows.
(1)
Steel components
All steel components were modeled using SOLID45 solid elements. In the present ANSYS implementation, a multilinear isotropic hardening (MISO) model was used to define the stress–strain behavior of steel. The difference in material response between cyclic and monotonic loading was addressed by calibrating the MISO curve parameters according to the model proposed by Varma et al. [41], which accounts for kinematic hardening and local buckling of steel tubes under cyclic loading. The following parameter values were adopted: strain-hardening modulus Eh = 0.01 Es = 2060 MPa, and equivalent elastic modulus for local buckling and cracking Esh = 0.01 Es = 2060 MPa. These values are widely used in cyclic material modeling for steel structures.
Since the measured strains in the reinforcing bars were relatively small, an elastic–plastic constitutive model was adopted for the reinforcement to simplify the analysis. A Poisson’s ratio of 0.28 was assigned to all steel materials.
(2)
Concrete
The concrete was modeled using SOLID65 solid elements. The MISO model was used to describe the stress–strain relationship of concrete. However, the MISO model assumes identical tensile and compressive stress–strain responses, whereas concrete exhibits significantly different behavior in tension and compression, with a very short tensile branch. To account for this, the CONCRETE material model was incorporated to simulate tensile cracking [42]. The CONCRETE model adopts the Willam-Warnke failure criterion, rather than a yield criterion. The combination of MISO and CONCRETE essentially means that the defined constitutive curve governs the response prior to failure, while the failure criterion is activated once crushing or cracking occurs.
Thus, the SOLID65 element combined with the CONCRETE material model was used to capture the tensile cracking behavior of concrete. The smeared crack approach was adopted, based on the fixed crack model and the Rankine maximum tensile stress criterion, in which cracking is assumed to occur when the maximum principal tensile stress exceeds the tensile strength. Consequently, the cracks are represented as smeared crack bands rather than discrete individual cracks. Nevertheless, the crack initiation time and the overall crack distribution pattern can still be evaluated from the numerical results.
The compressive stress–strain relationship of concrete was adopted from the Chinese Code for Design of Concrete Structures [31].
(3)
The EPE foam
In the FE model, the EPE foam was not explicitly modeled as a deformable solid. Its presence was represented by an initial clearance in the contact definition between the perforated reinforcing bar and the inner wall of the slotted hole. The clearance was set to 10 mm, corresponding to the foam thickness. Within this clearance, the reinforcing bar could move freely relative to the steel plate, simulating the free-slip state. Contact was activated only after the slip exceeded the clearance, at which point the bar bore against the slot wall, marking the end of the slip phase. This approach was justified by the fact that the elastic modulus of EPE foam was negligibly small compared with that of steel and concrete, and the study focused on the slip mechanism rather than the foam’s energy dissipation or deformation. This modeling technique effectively captured the intended slip-permitted behavior of the URSP connector.
(4)
Contact modeling
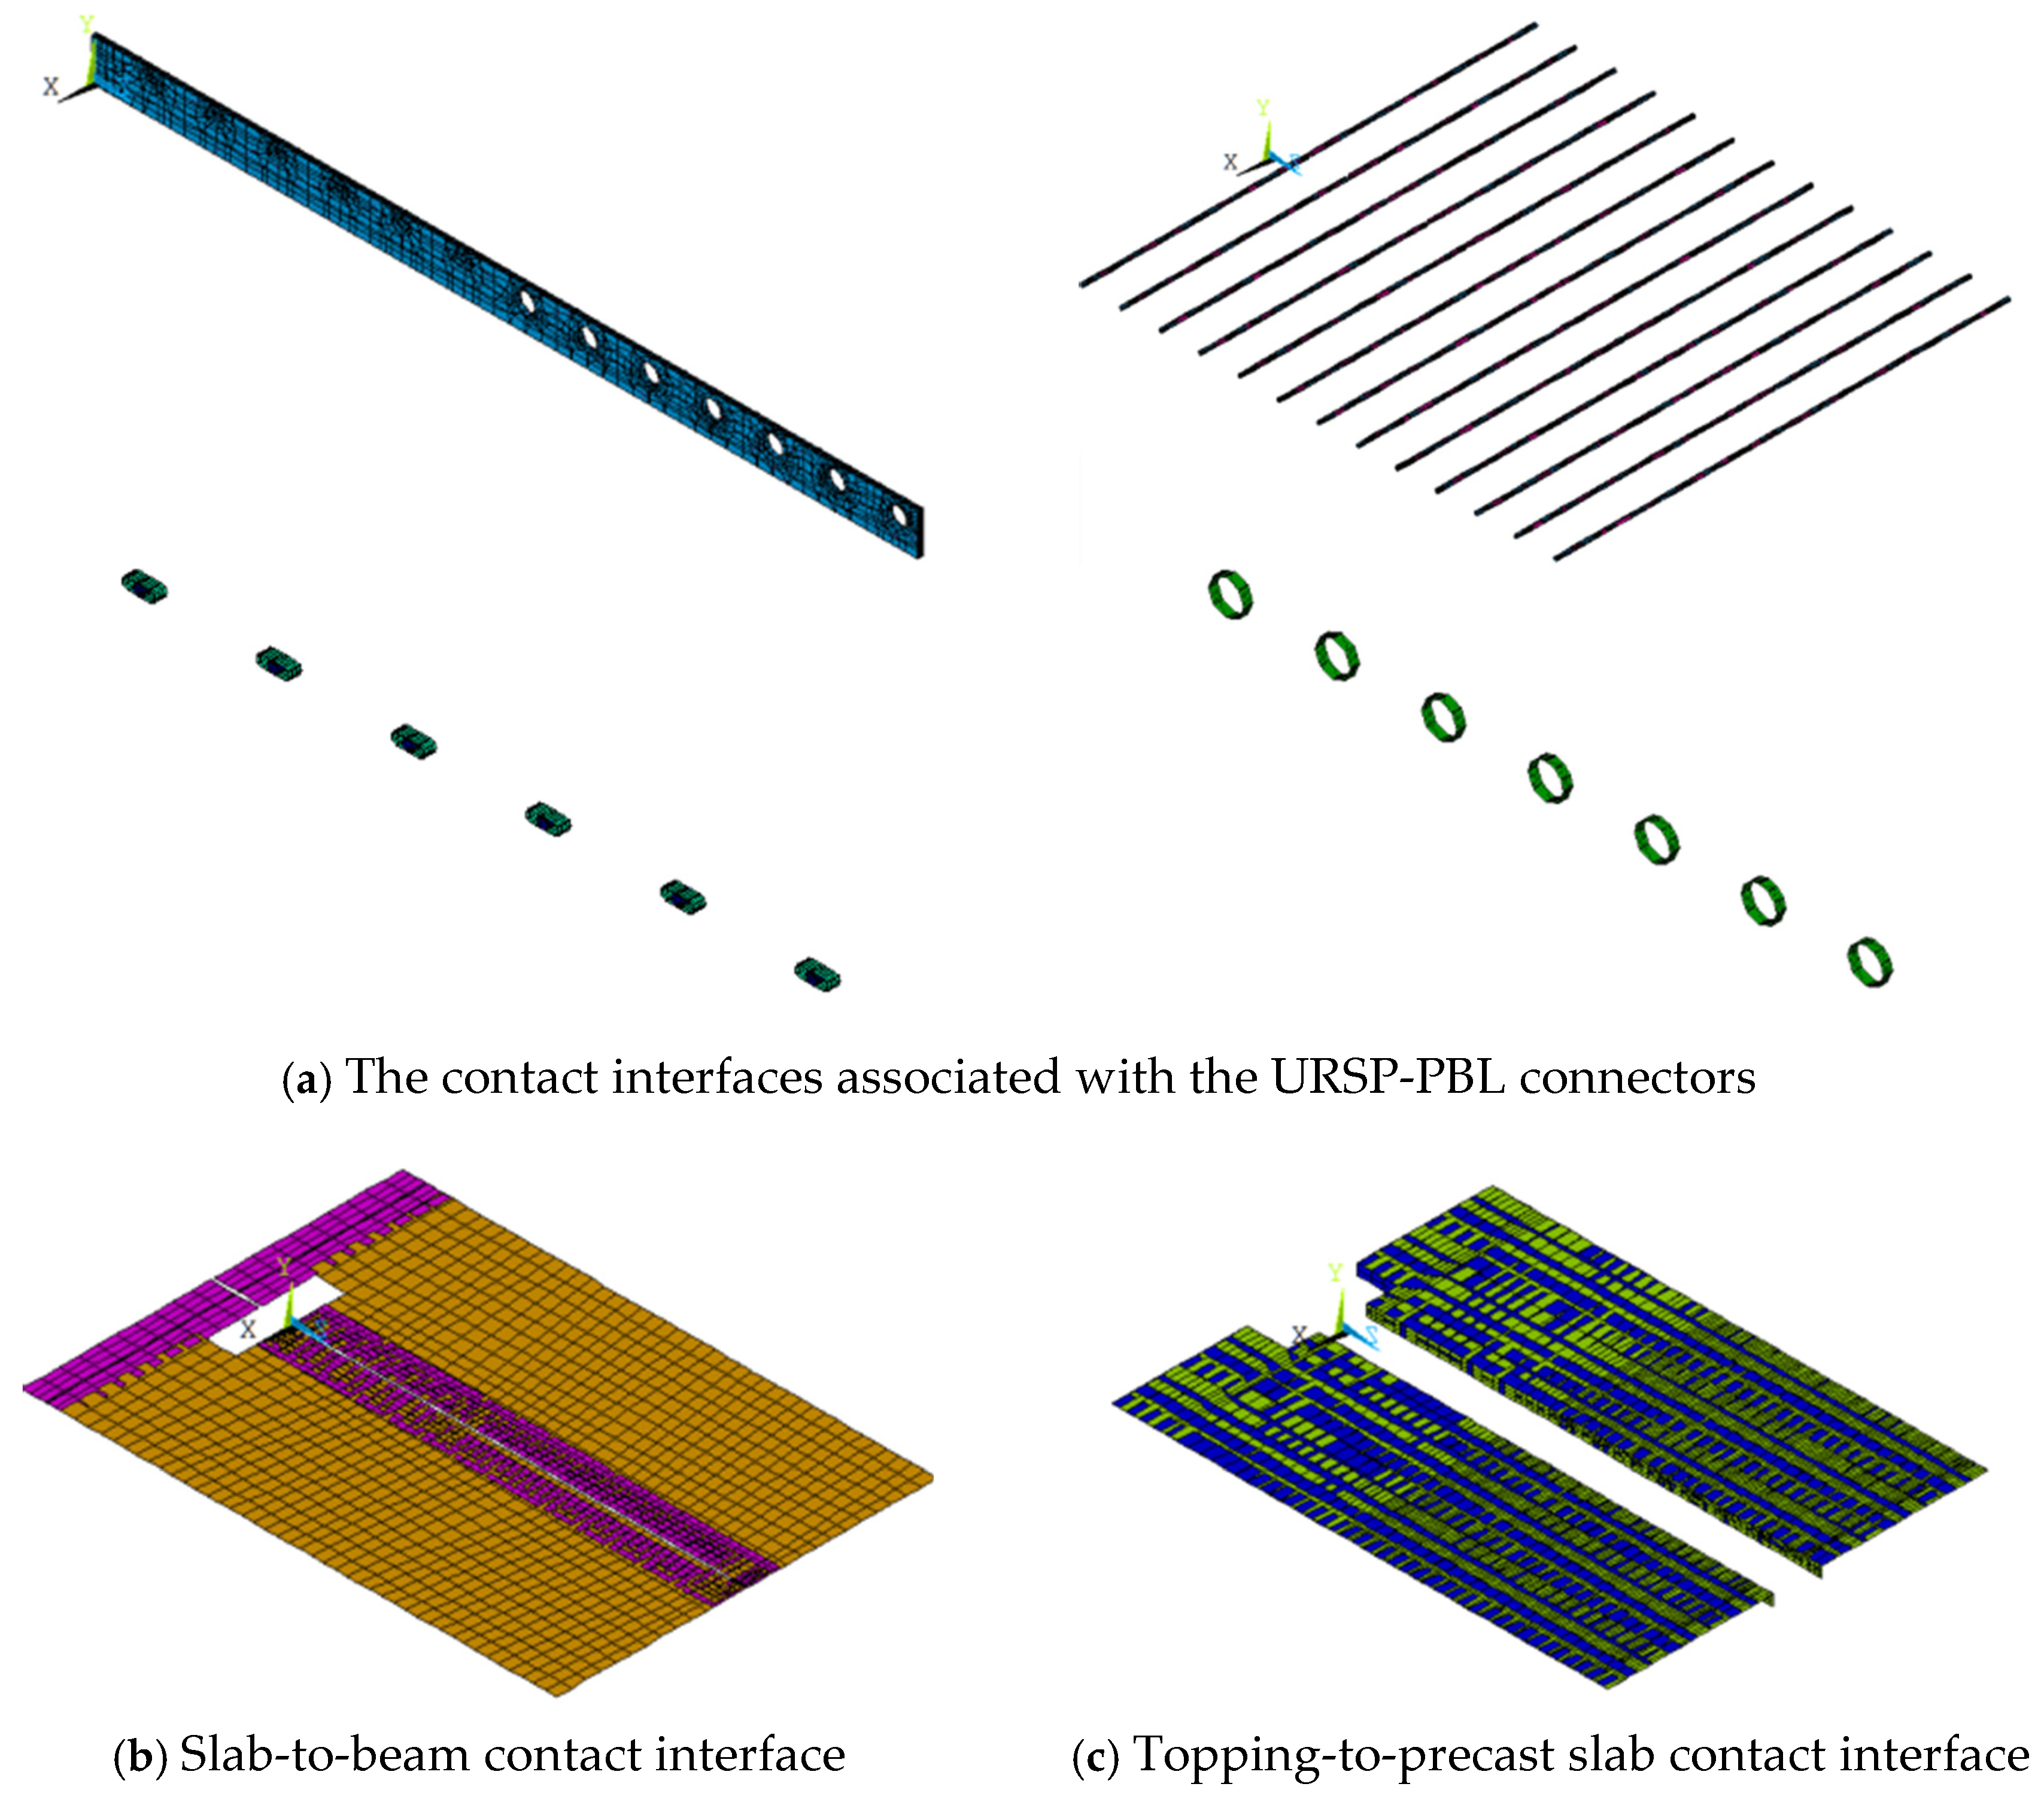
A significant number of contact interfaces exist in the specimens, including those between the precast slab and the cast-in-place concrete topping, between the composite slab and the steel beam, between the composite slab and the steel plate connectors, between the perforated reinforcing bars and the inner walls of the slotted holes, between the inner walls of the slotted holes and the infilled concrete, between the composite slab and the perforated reinforcing bars, and between the composite slab and the steel column, as shown in Figure 16.
To accurately simulate the interface slip behavior in the specimens, all contact pairs were simulated using the TARGE170 and CONTA174 elements for surface-to-surface contact. For each contact pair, the surface with higher stiffness and finer mesh was designated as the target surface, and the other as the contact surface.
The Coulomb friction model was adopted to account for bond and slip behavior at the contact interfaces. Shear stress can be transmitted across the interface until it exceeds the initial bond strength, after which relative slip occurs, and the shear stress remains constant during sliding. The friction coefficient between steel and concrete typically ranges from 0.5 to 0.74, depending on the surface roughness. Based on previous studies [43], a friction coefficient of 0.6 and a bond strength of 0.6 MPa were adopted for the slab–beam interface in this study.
Contact analysis is often difficult to converge, especially when combined with material nonlinearity, geometric nonlinearity, and concrete cracking, which further increases the difficulty. To improve both convergence and accuracy, the normal penalty stiffness factor (FKN) and penetration tolerance (FTOLN) were carefully calibrated. In theory, a larger FKN gives a smaller FTOLN and higher accuracy, but also makes convergence more difficult. On the other hand, a smaller FKN helps convergence but may cause excessive penetration and inaccurate results. Based on a parametric study, FKN was set to 5 and FTOLN to 0.05 in this study.
The column base was fixed by restraining all translational and rotational degrees of freedom, while the beam end remained free and was subjected to reversed cyclic loading. The nonlinear equilibrium equations were solved iteratively using the Newton–Raphson method with large-deformation effects considered (NLGEOM, ON). To improve convergence, line search and adaptive descent factors were also enabled.
A systematic mesh convergence study was first conducted to determine the appropriate element size, as shown in Table 11. Three mesh densities were examined, and convergence was considered achieved when the variation in the calculated peak load between successive mesh refinements fell below 5%. Based on this criterion, a uniform mesh size of 20 mm was adopted for both concrete and steel components, with local refinement applied in critical regions such as the slotted holes, welded zones, and the beam-to-column connection panel to accurately capture stress concentrations.

4.2. Validation of the Finite Element Model

(1)
Load–displacement curve
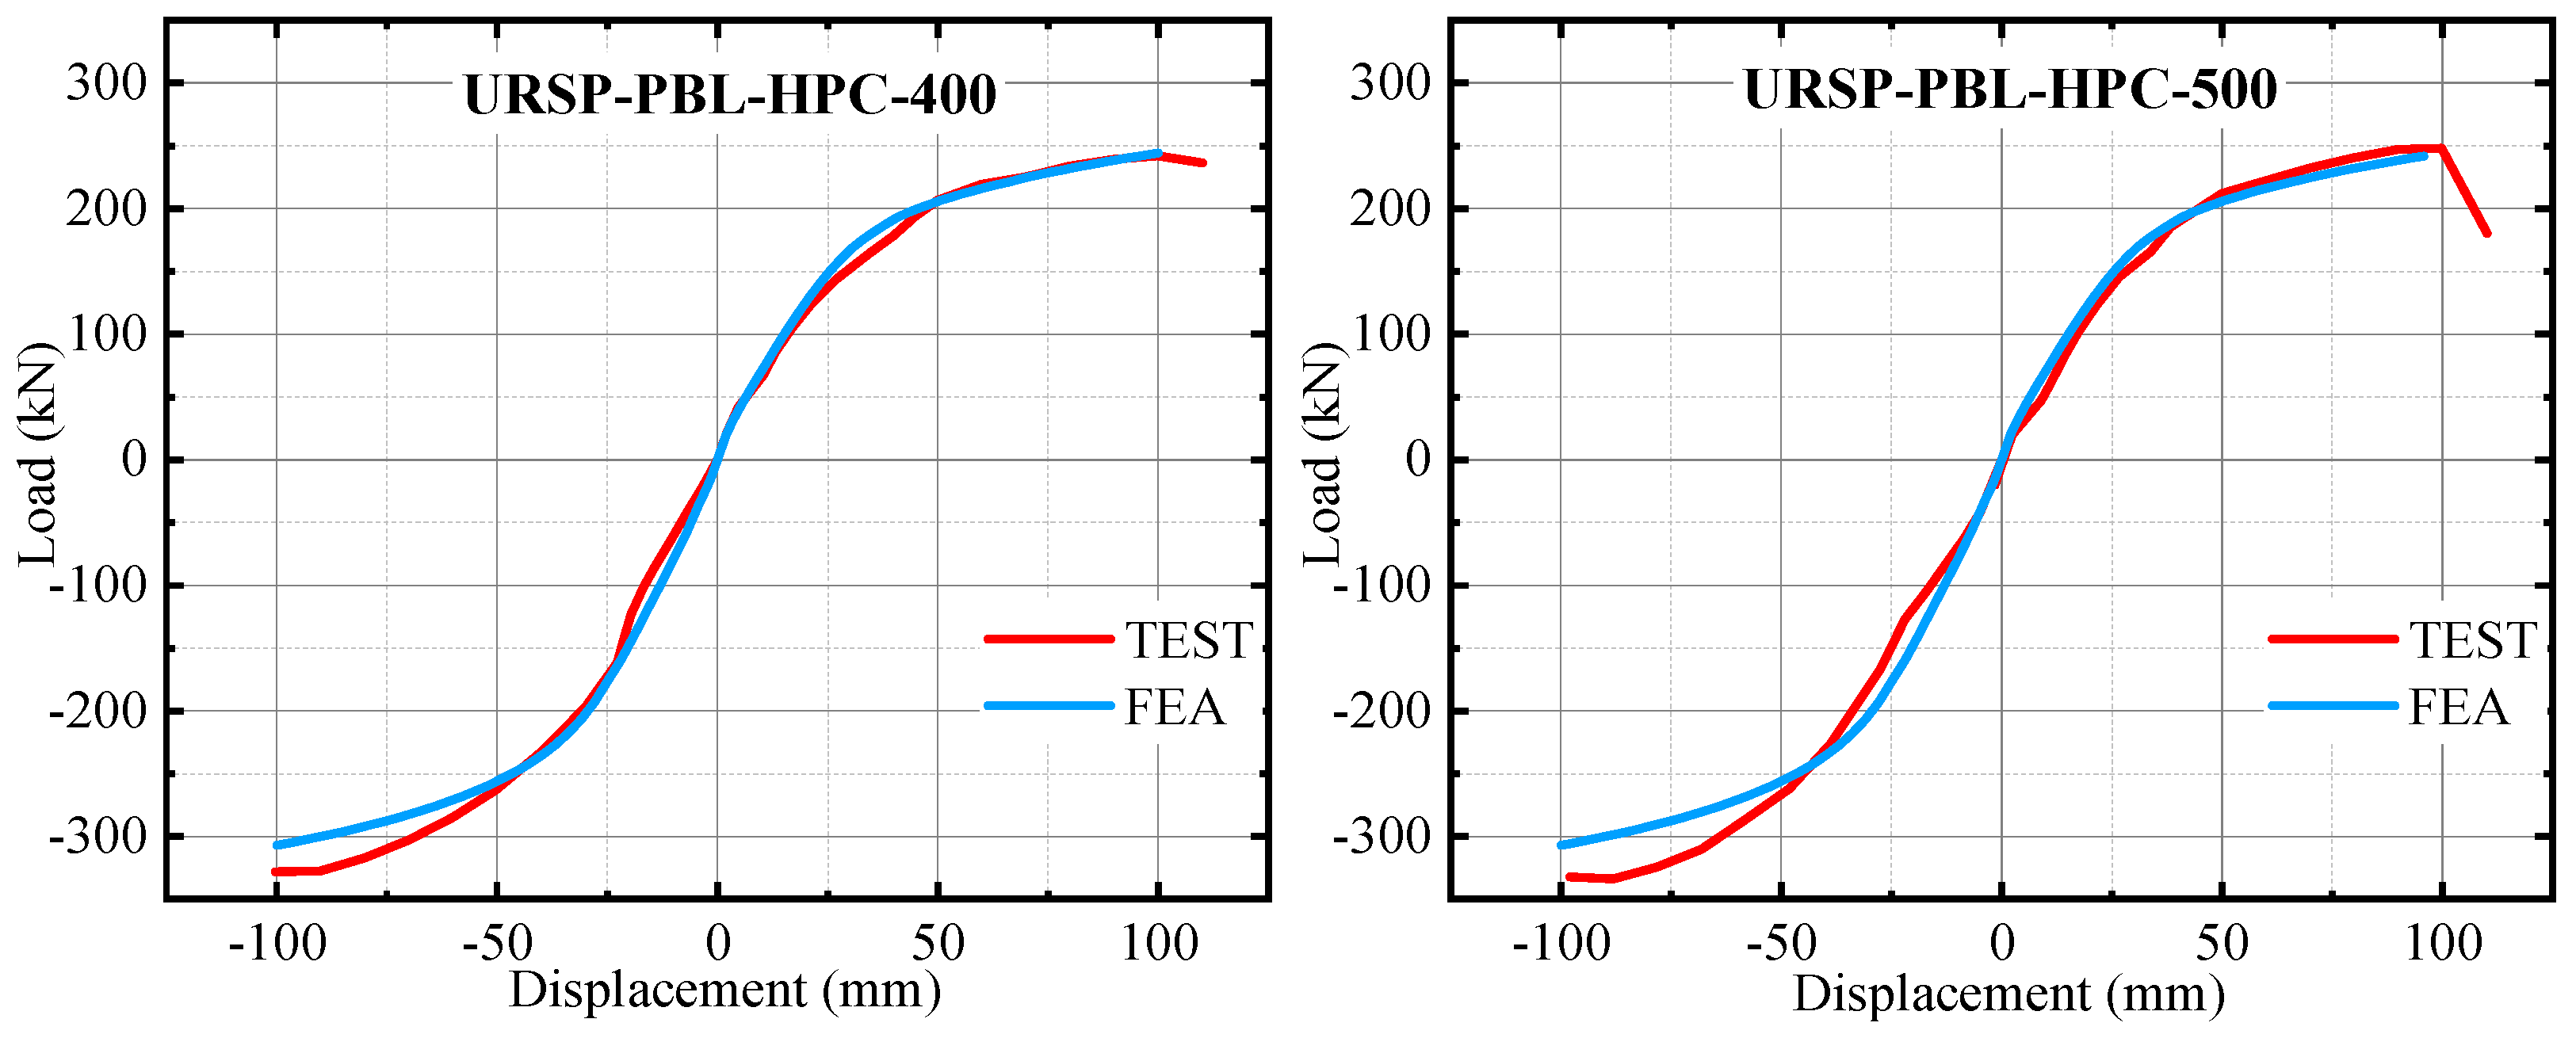
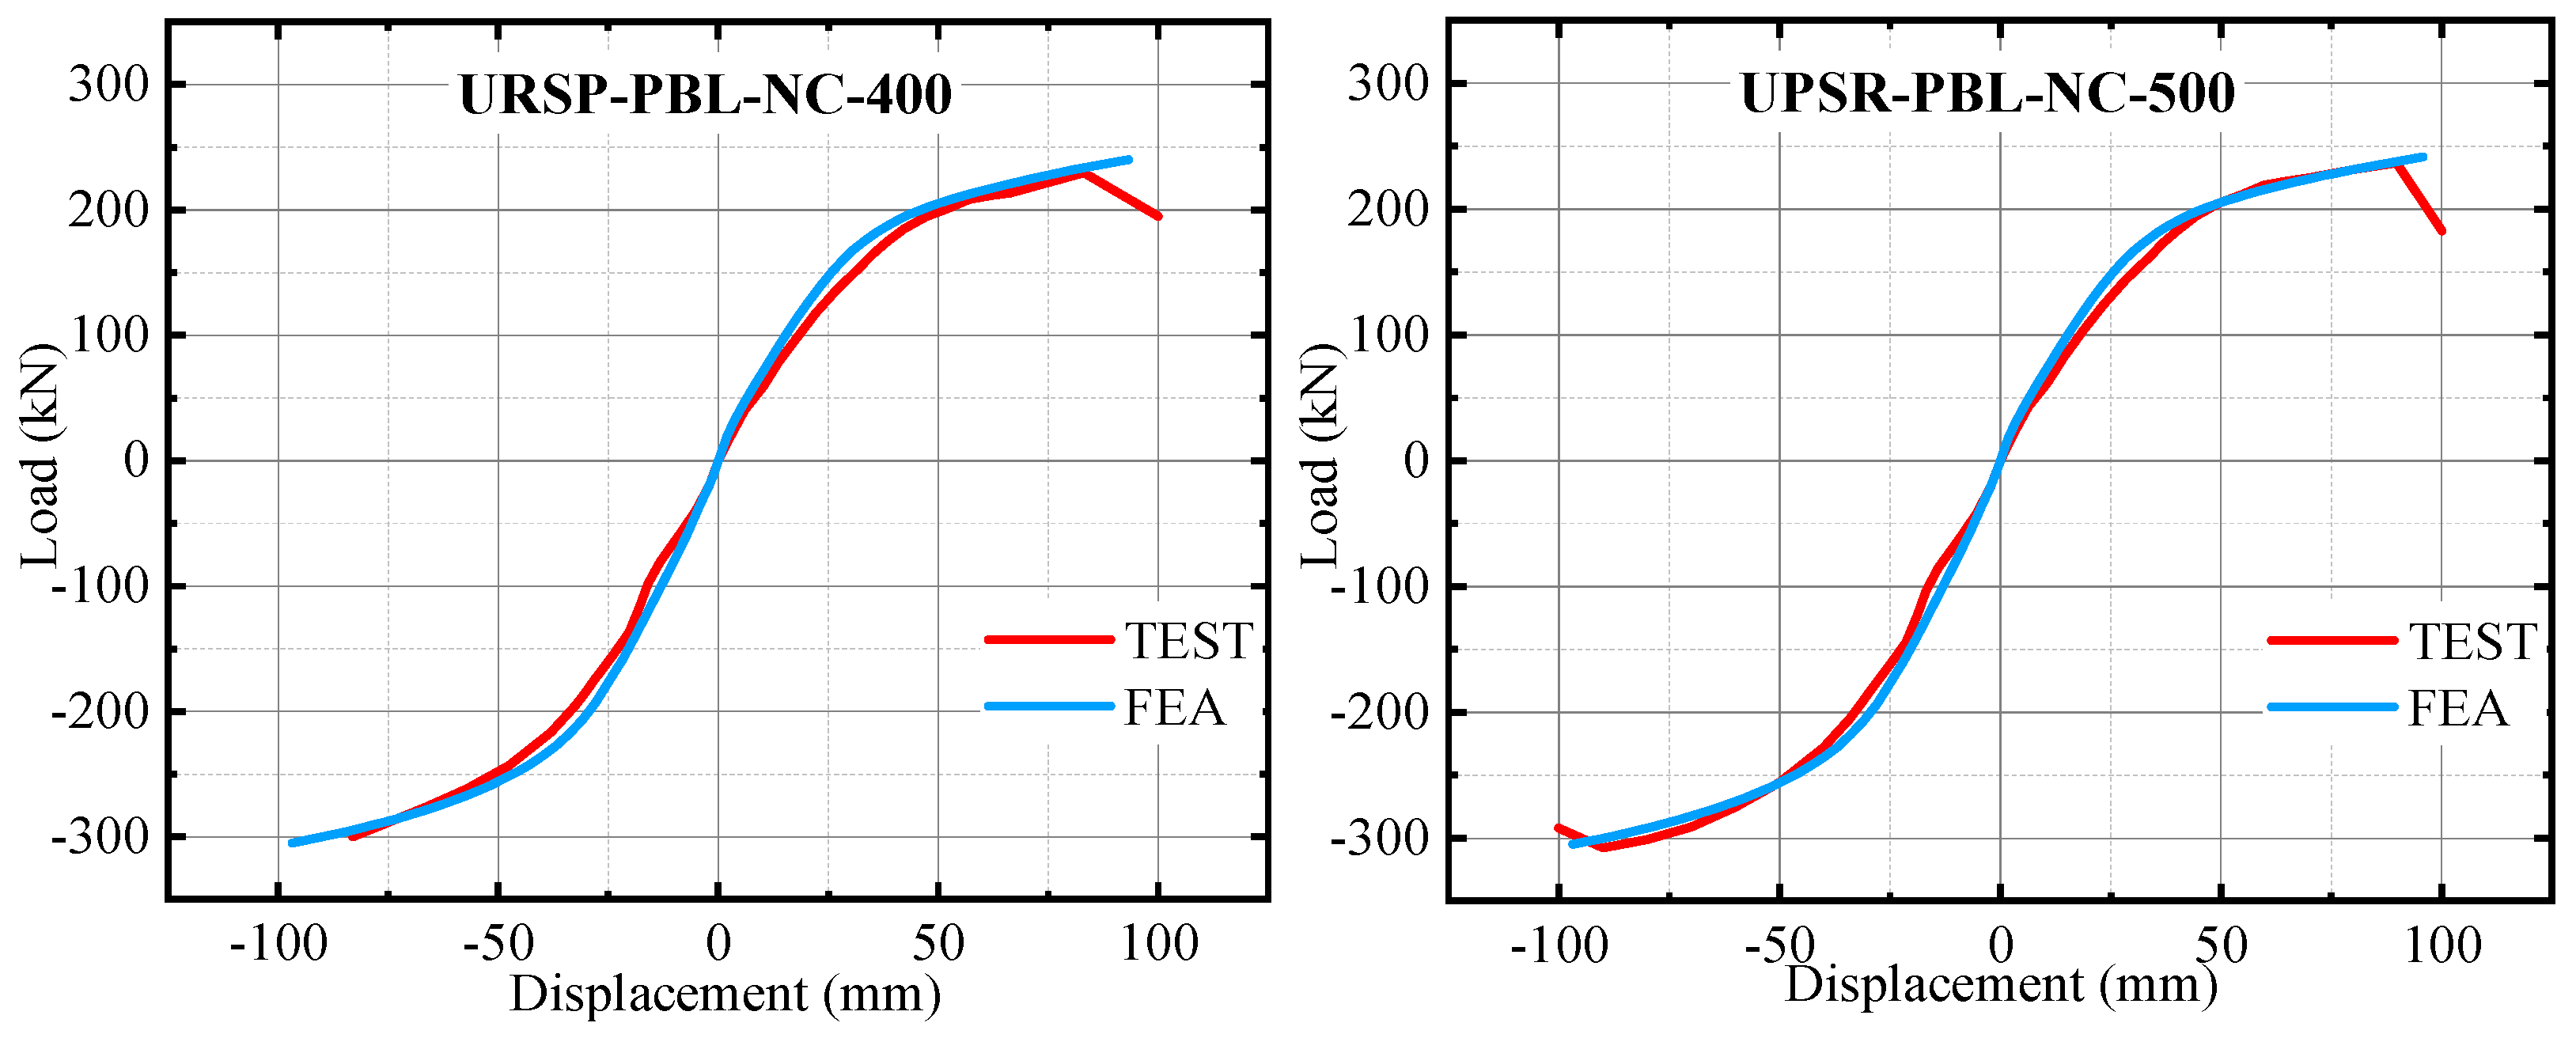
The model was validated by simulating the entire loading process of the test specimens. Detailed analyses were then conducted to examine the interface slip, stress distribution, and crack development within the concrete slab. A comparison between the finite element predictions and the experimental skeleton curves is presented in Figure 17 in terms of load versus displacement at the beam end. In the numerical simulation, the ultimate load was reached under negative bending, whereas under positive bending the specimen had not yet reached its ultimate capacity at the same displacement, indicating that failure was governed by negative bending. The load–displacement curves from the refined FE model agree well with the experimental results.
(2)
Initial stiffness and load-carrying capacity
The finite element model, using SOLID65 elements with the CONCRETE material model, successfully simulated cracking of the composite concrete slab. It should be noted that local cracking appeared early at the outer end of the slab due to stress concentration in both the test and the simulation. This cracking resulted from the boundary conditions; therefore, it was not taken as the cracking load. The cracking load is defined as the load at which the first transverse flexural crack appeared on the slab top.
This study focuses on the cracking behavior of the slab under negative bending, with attention limited to the pre-cracking stage rather than the ultimate capacity. The initial stiffness, yield load and displacement, and cracking load and displacement obtained from the FE model are compared with test results in Table 12, showing good agreement, which indicates that the proposed model is sufficiently accurate.
(3)
Failure mode
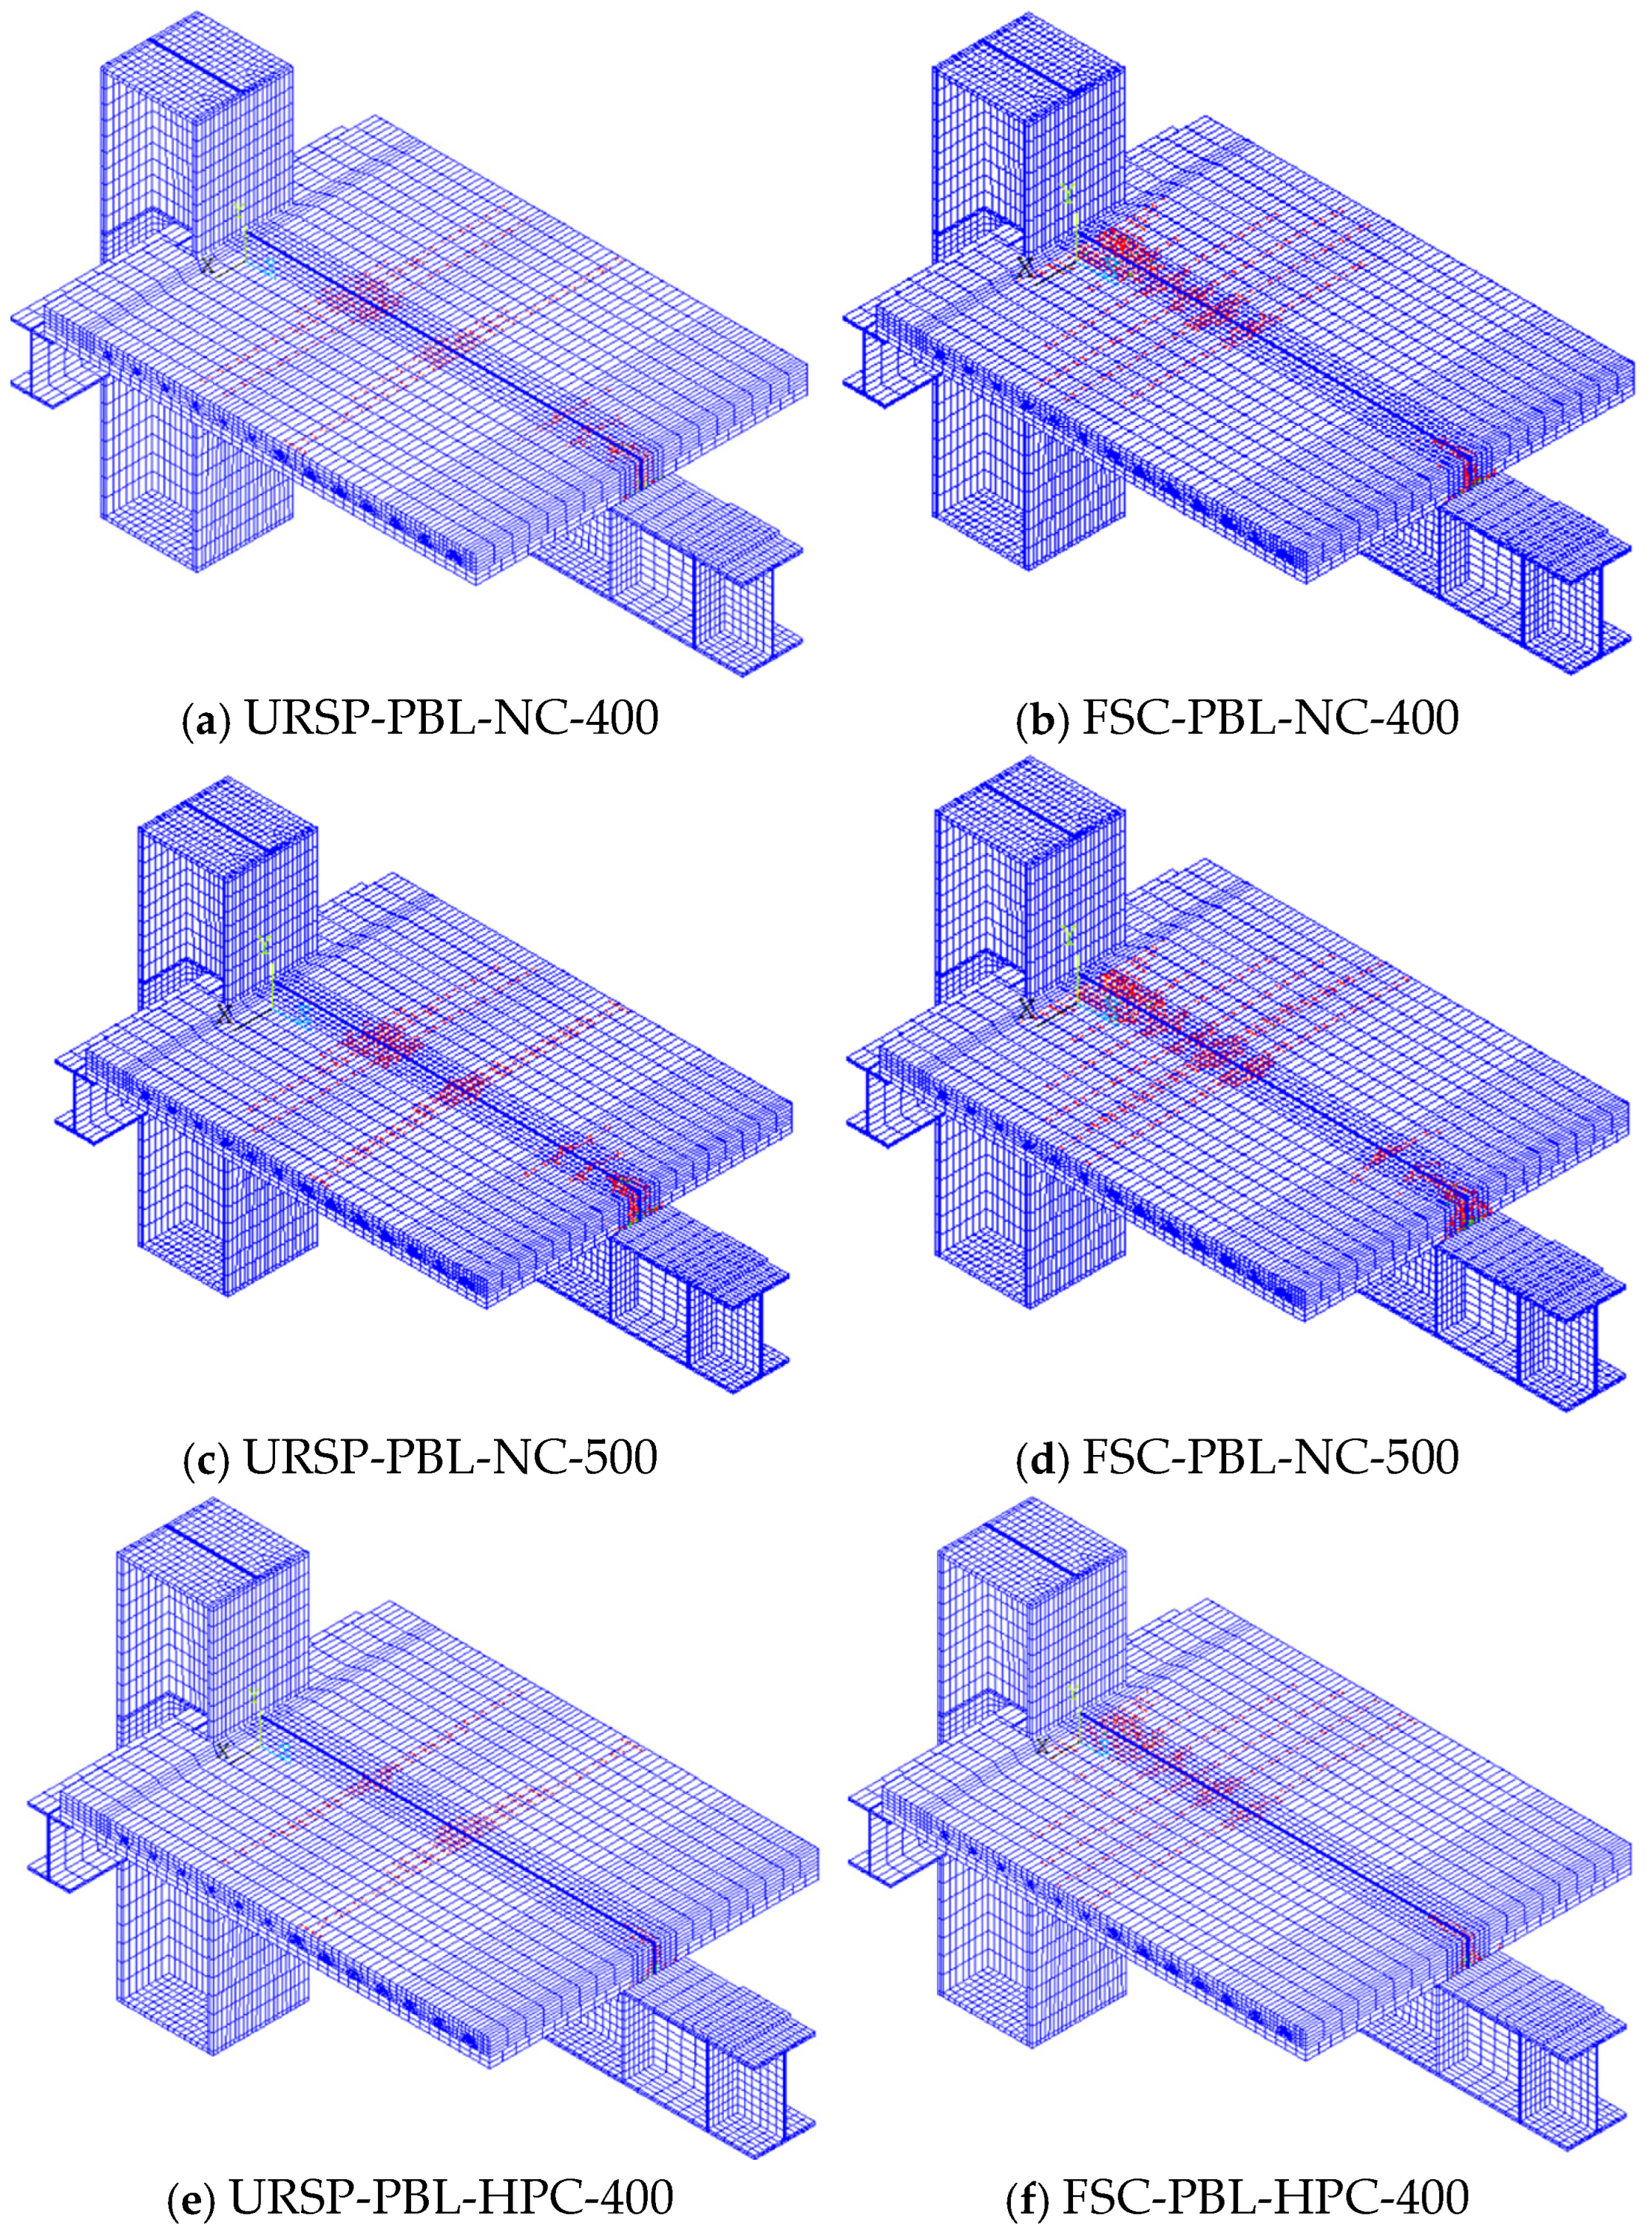
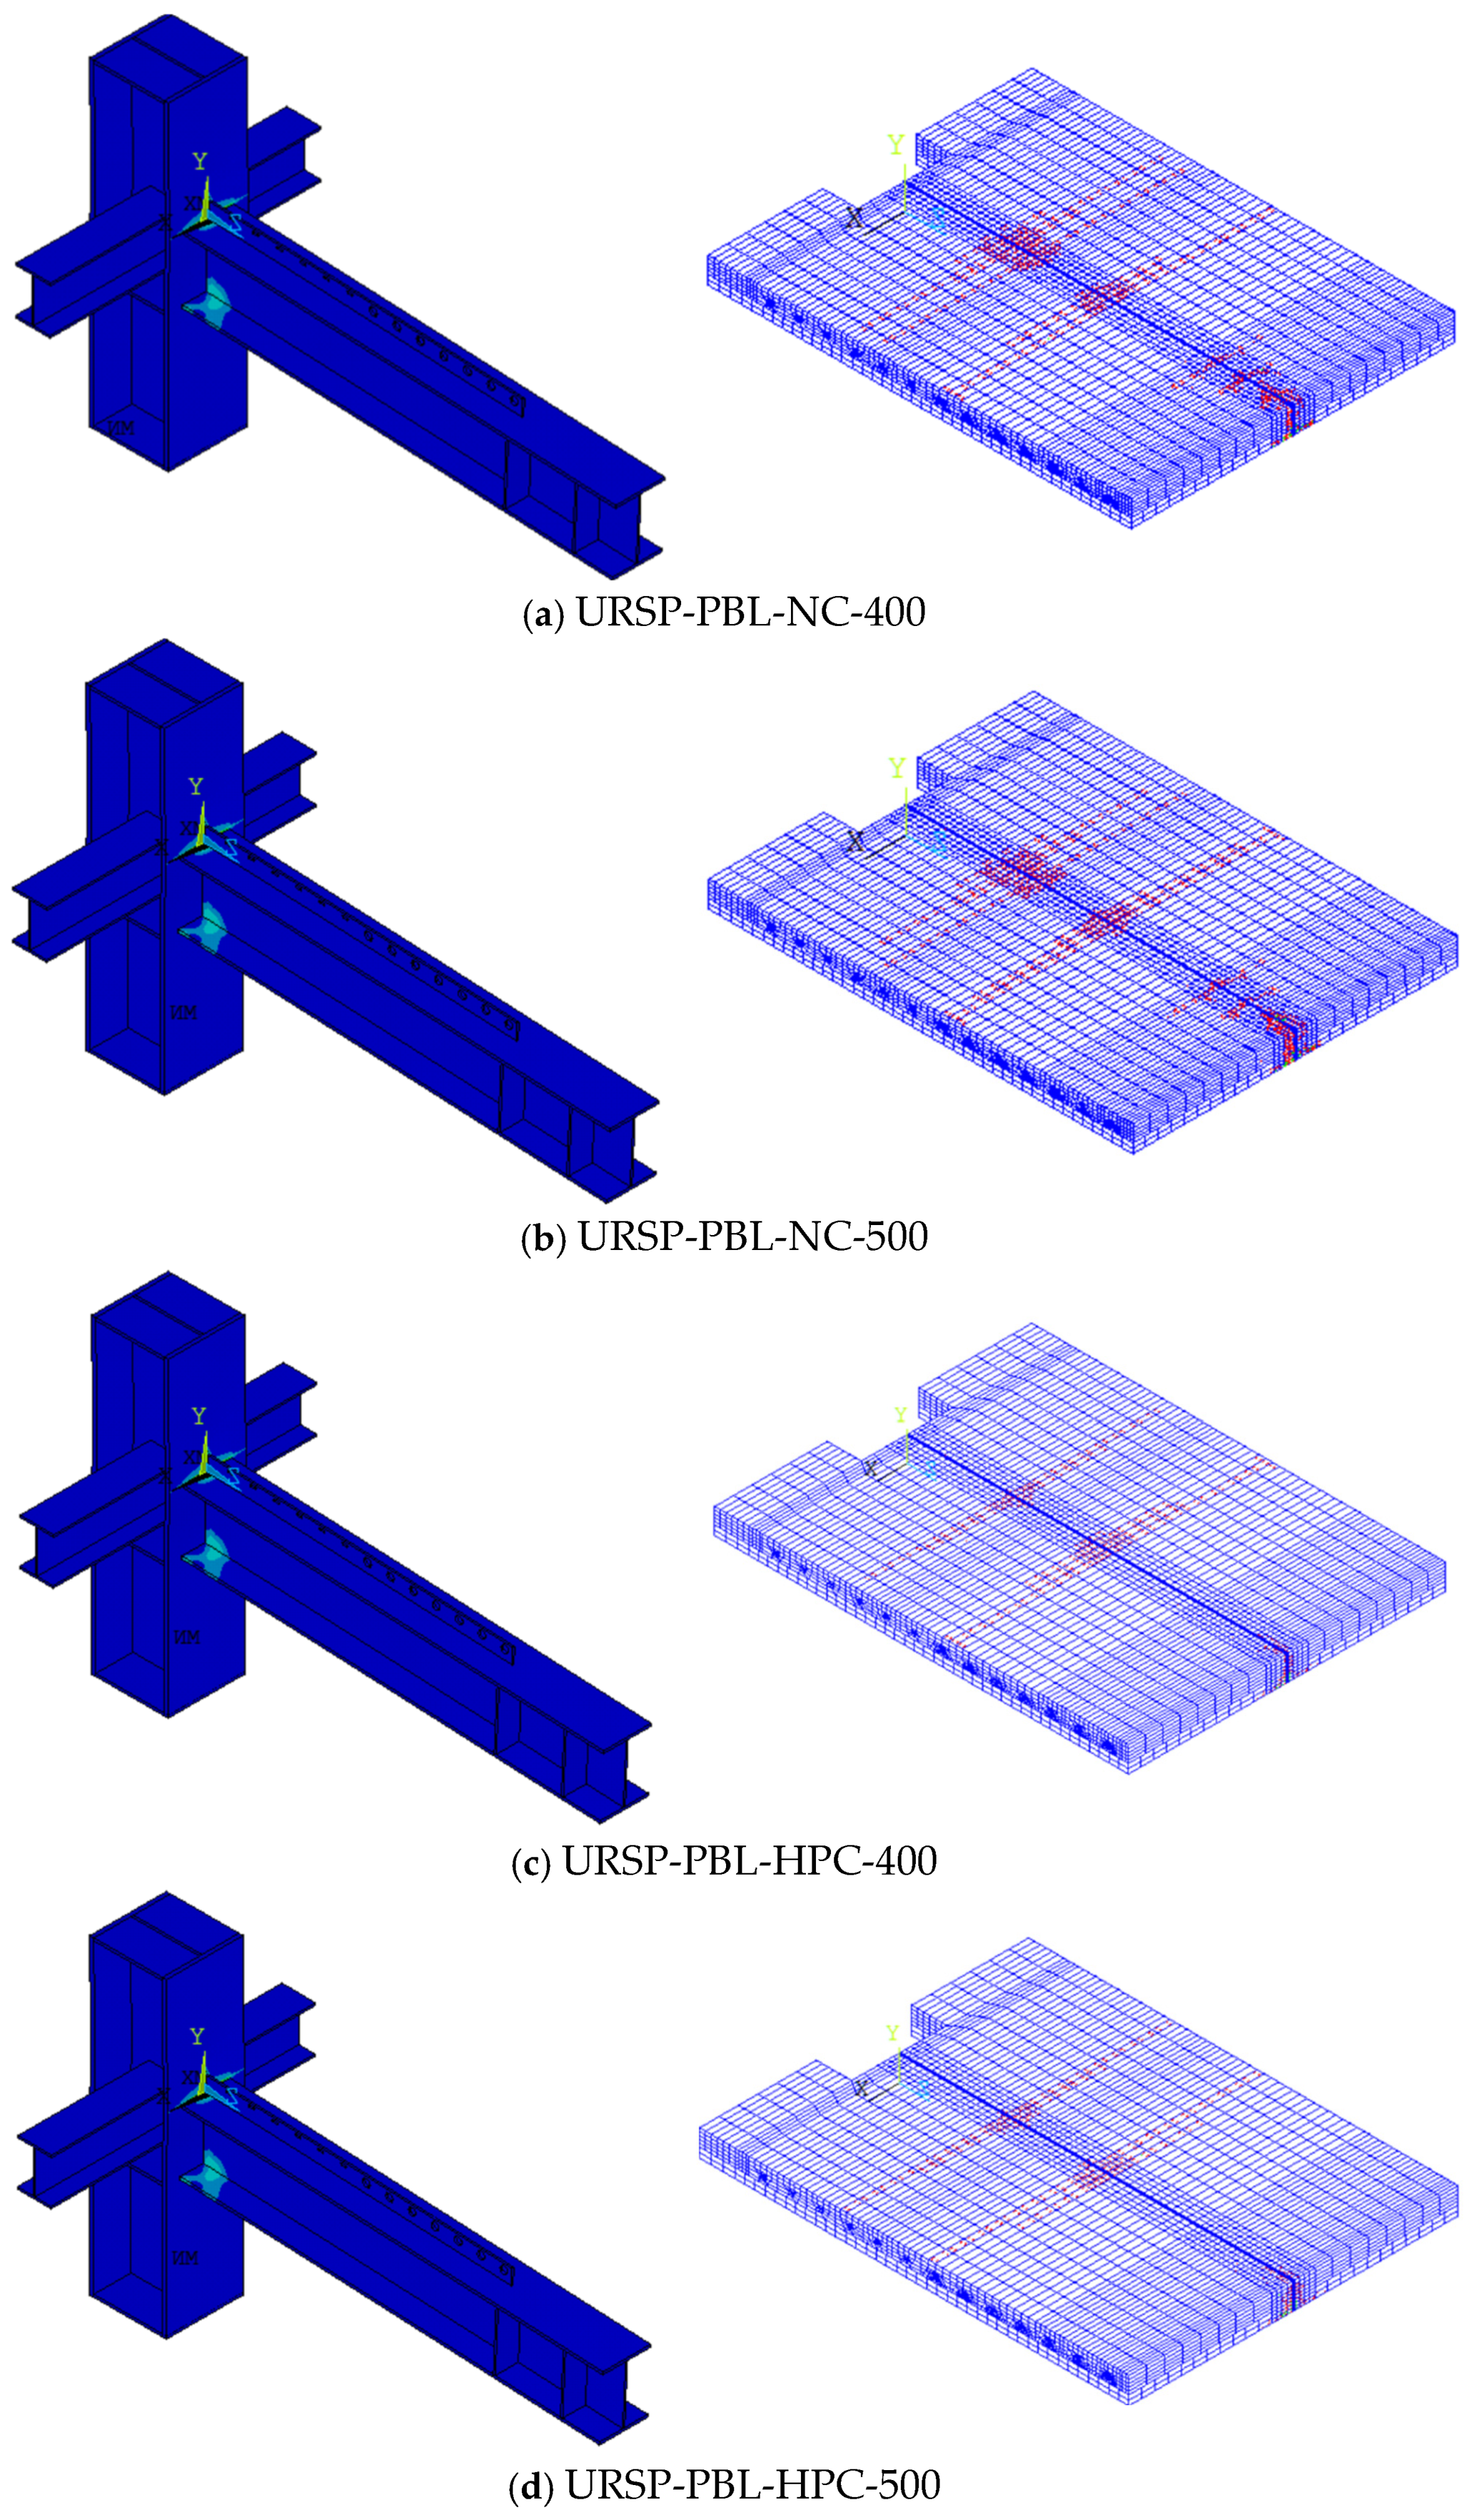
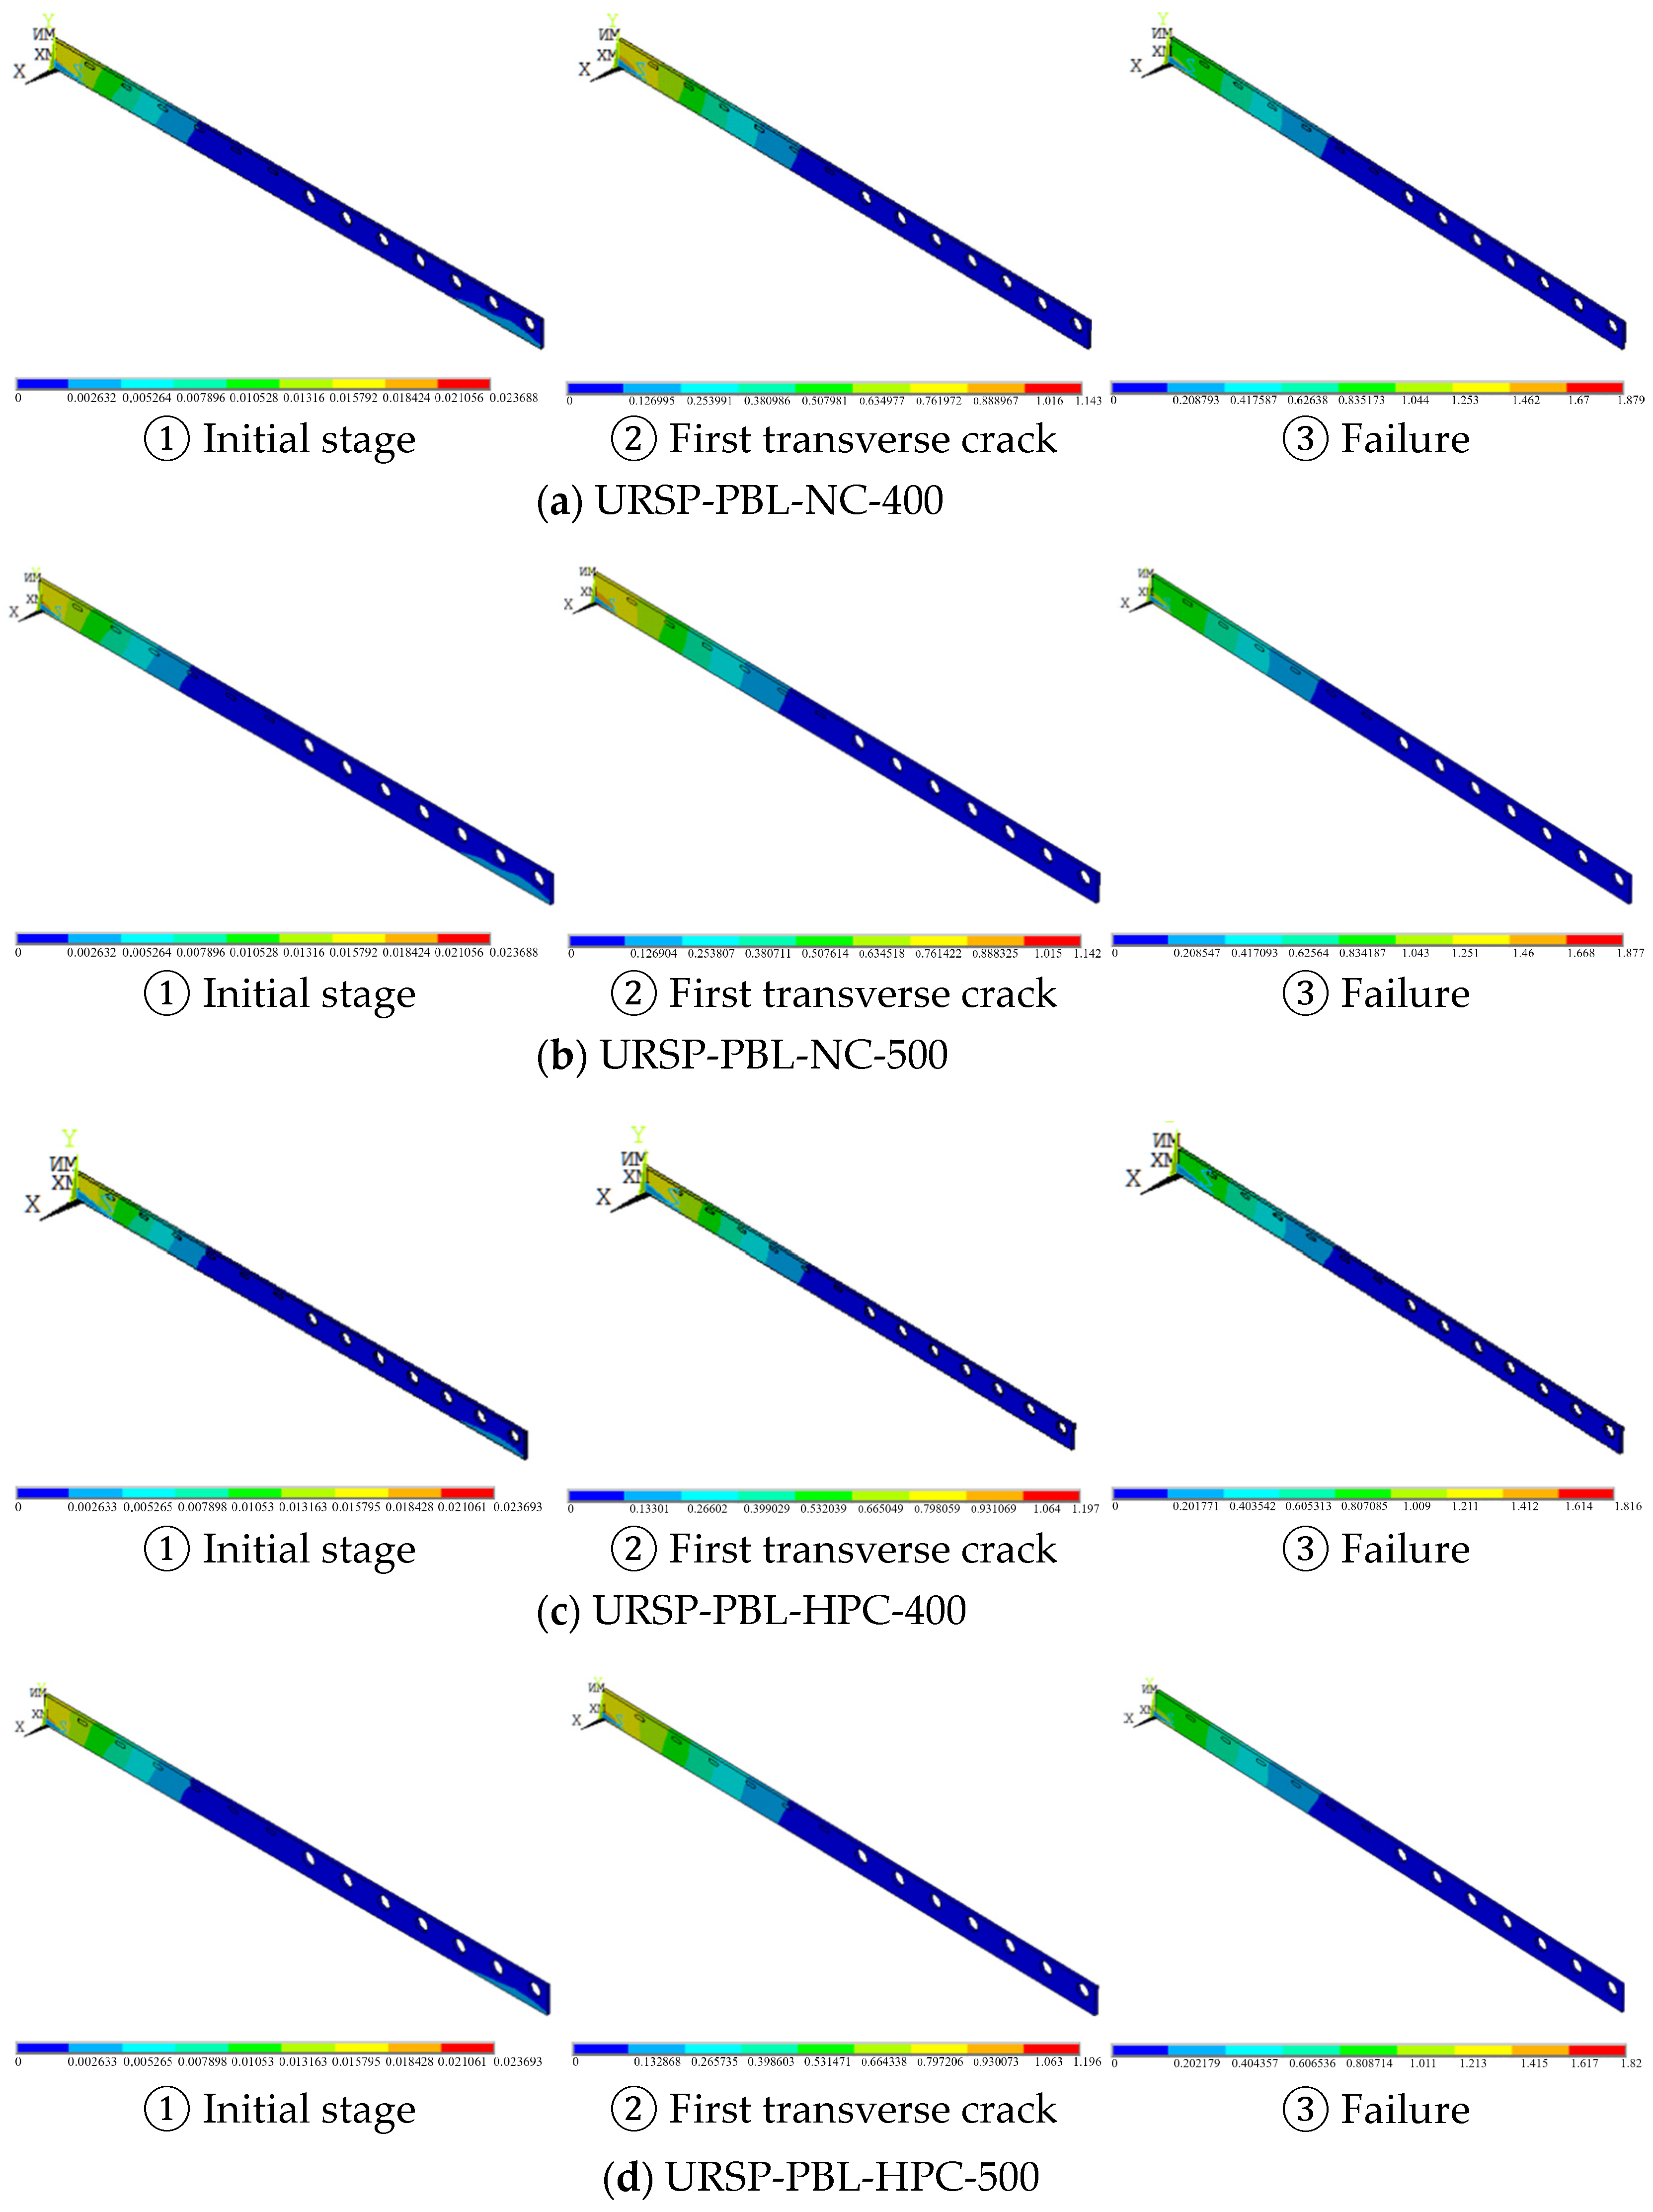
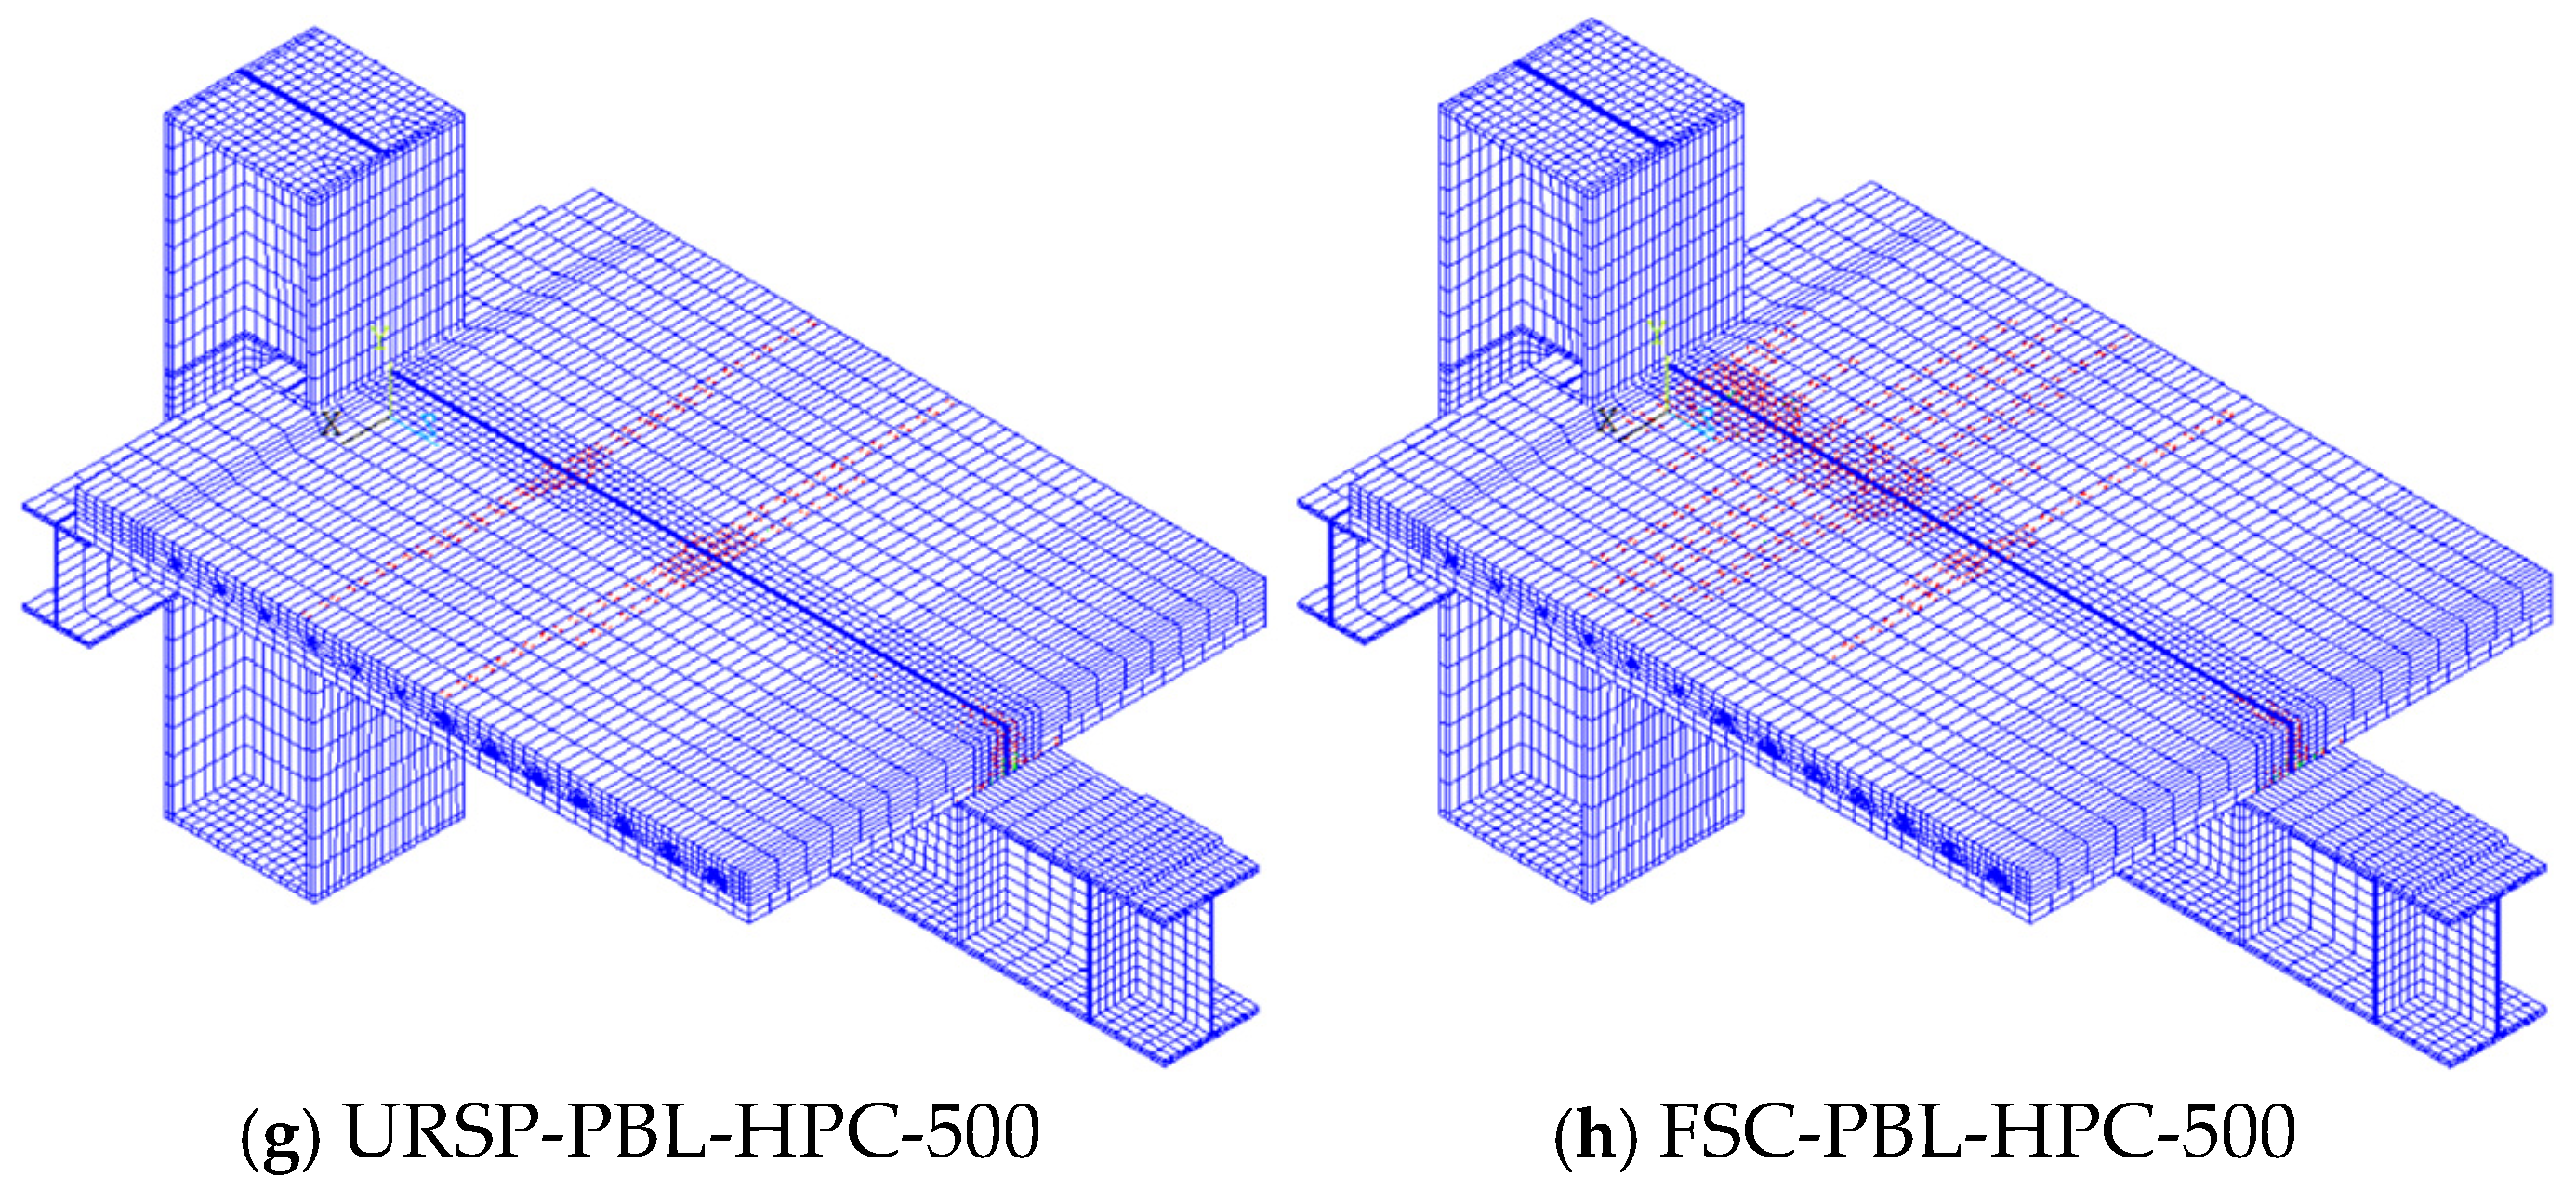
The failure modes of the specimens obtained from the finite element simulation are shown in Figure 18. For the steel parts, the equivalent strain contours are shown, which point out the damage locations better than the stress contours. For the composite slab, the crack patterns are shown, with red areas indicating cracks. All specimens failed yielding of the steel beam flange and cracking of the concrete slab under negative bending, which basically matches the test results.

4.3. Slip Analysis

(1)
Slip between the composite slab and the steel beam
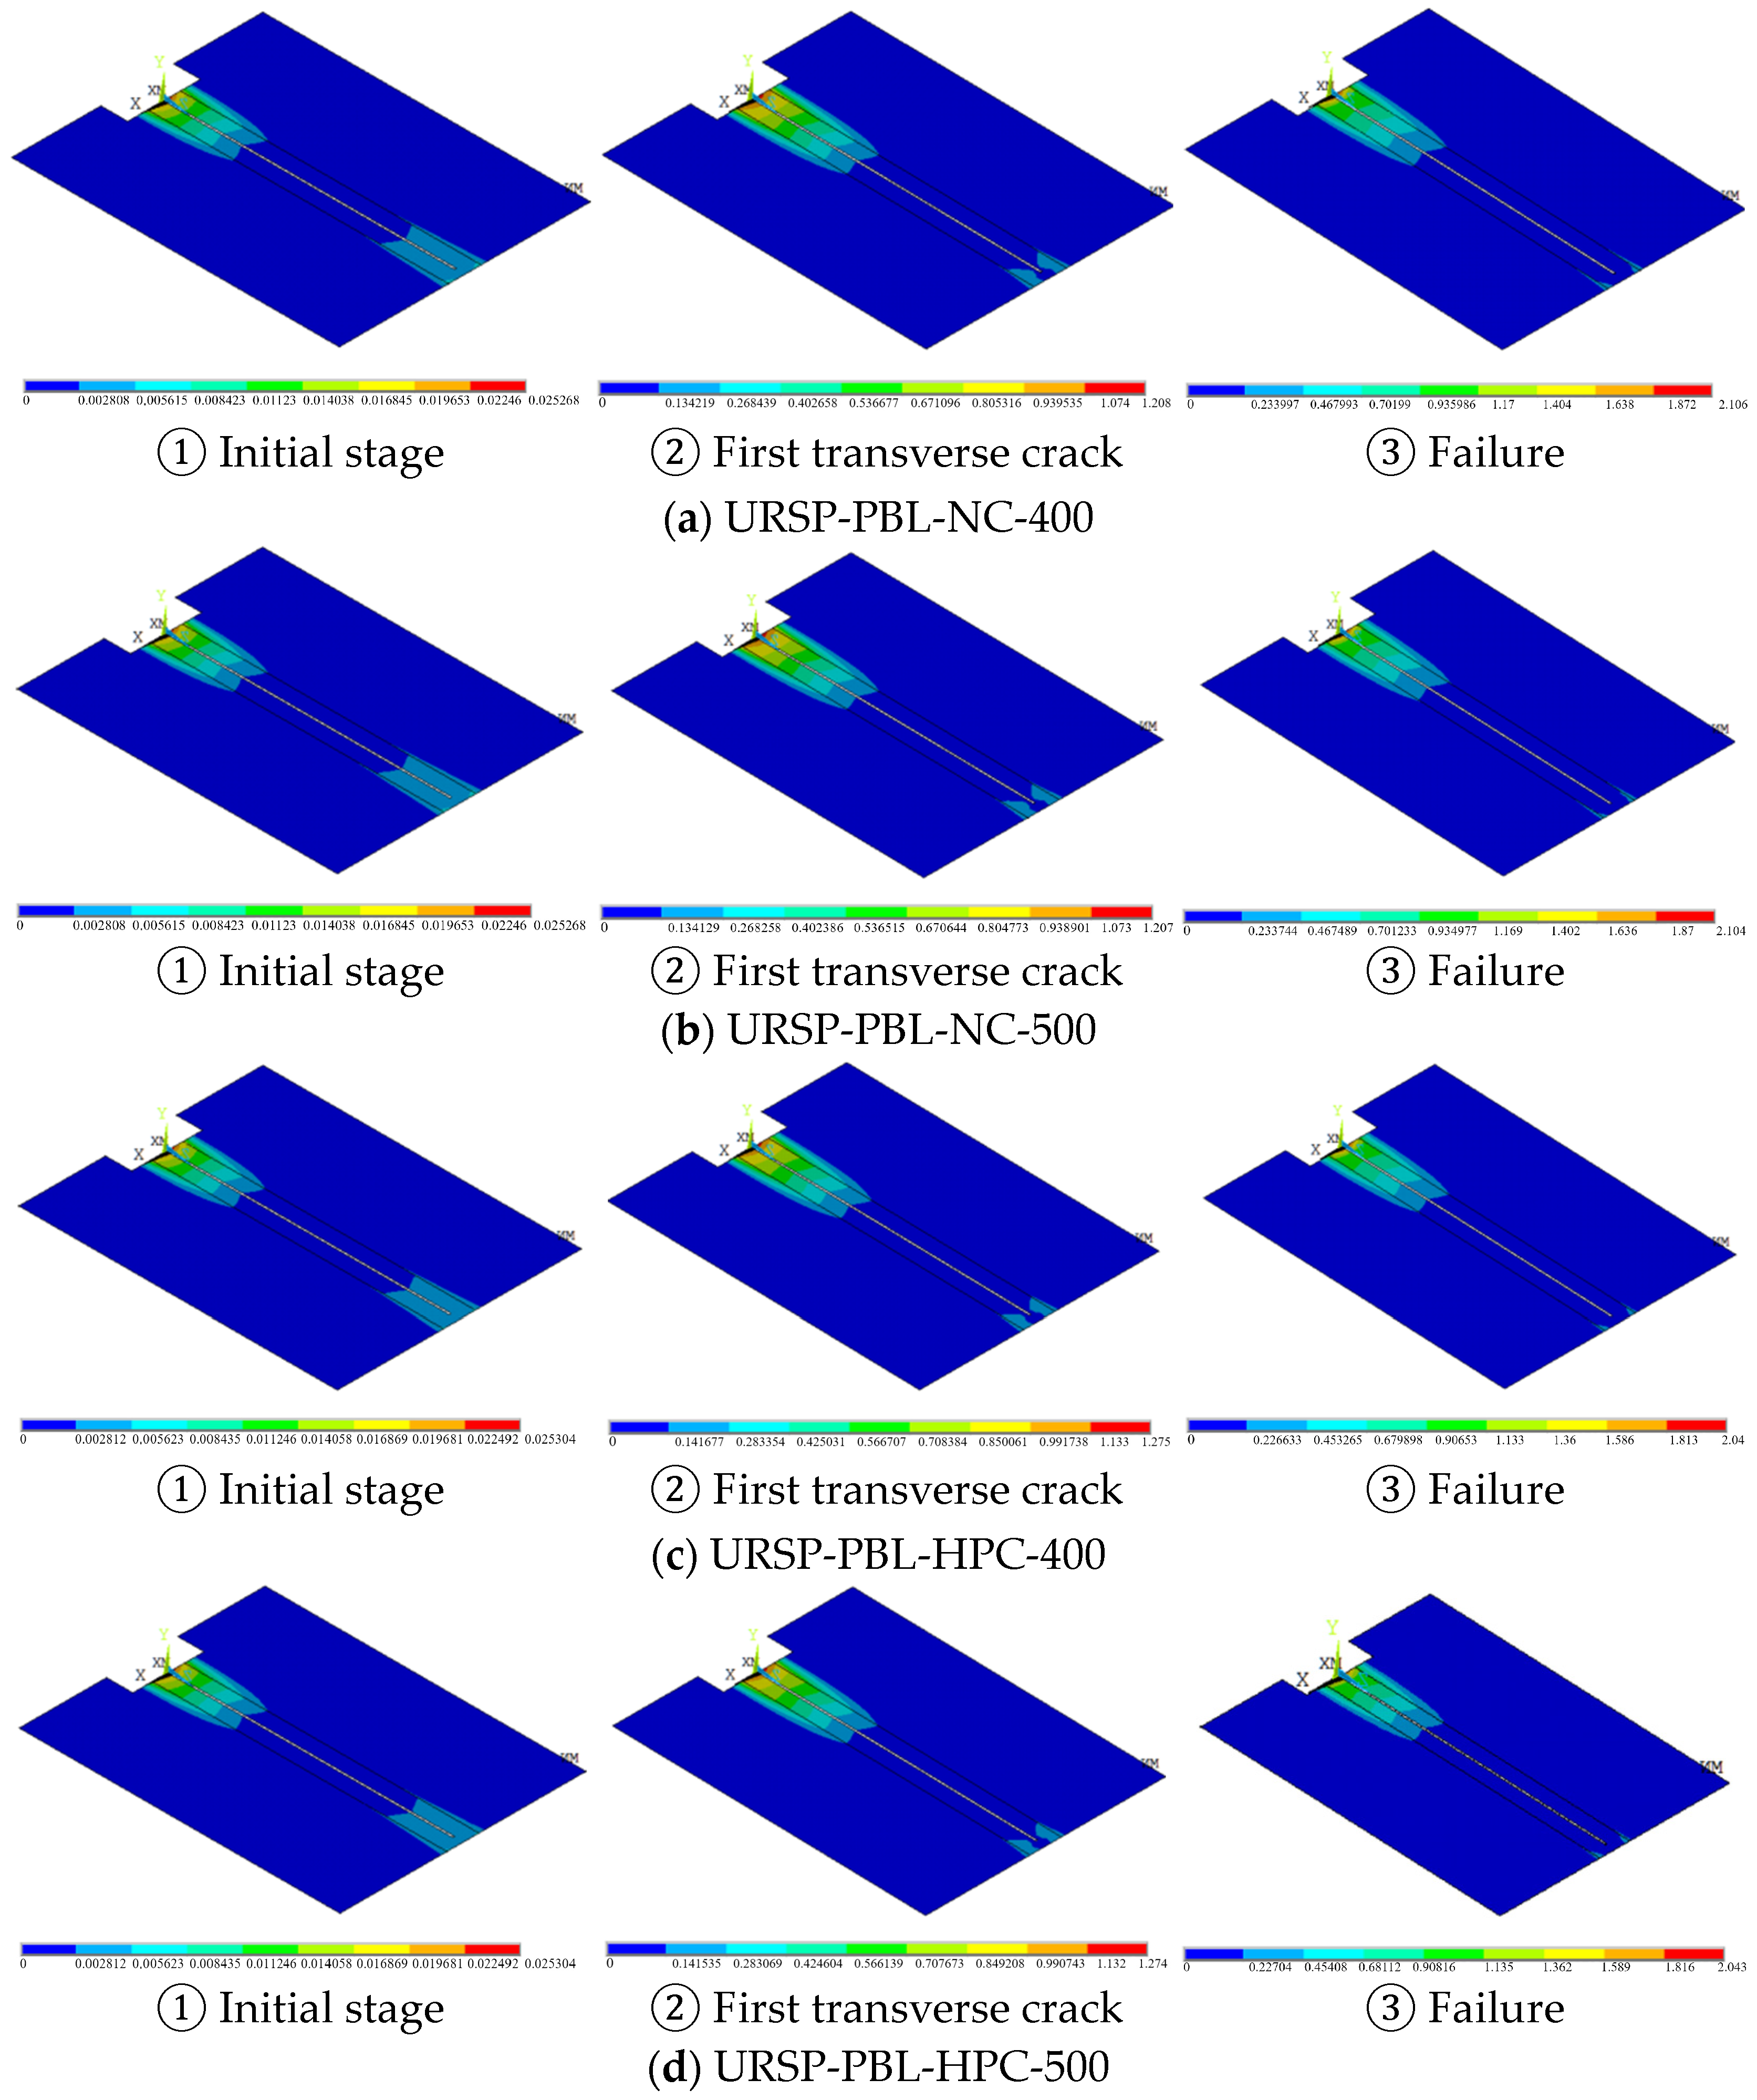
As shown in Figure 19, the slip behavior of the four specimens followed similar patterns. The proposed URSP connectors in the negative moment region allowed relative slip between the composite slab and the steel beam. The slip was greatest at the beam end near the negative moment region, with a maximum value exceeding 2 mm. Moving toward the mid-span, the slip gradually decreased to zero at about 0.36 times the beam span, which corresponds to the length of the slotted-hole region. The slip increased with increasing load. Slight slip was also observed at the outer edges of the composite slab, mainly due to boundary stress concentration.
(2)
Interface slip between the composite slab and the URSP connectors
Since the test was designed to allow slip between the slab and the steel beam in the negative moment region, while the steel plate connectors were fixed, relative slip also occurred between the slab and the URSP connectors. The slip was greatest at the beam end, with a maximum value of approximately 2 mm, which is close to the slip at the slab–steel beam interface. The slip decreased to zero at the edge of the slotted-hole region, as shown in Figure 20.

4.4. Comparison with Full Shear Connector

To evaluate the effect of the URSP connector, full shear connector (FSC) cases corresponding to the test specimens were developed by setting a fully bonded interface between the slab and the steel beam to achieve complete composite action. This assumption is widely used in finite element analysis of composite beams [44,45]. However, full interaction cannot be achieved in practice under serviceability or ultimate conditions, and more refined models are needed to describe the actual interface behavior. In this study, the fully bonded assumption was adopted to provide an upper-bound estimate of the shear connection, so that the influence of partially releasing the composite action on the structural performance could be assessed.
These full shear connector specimens were denoted by adding the prefix “FSC” (Full Shear Connection) to the names of their partial shear connection counterparts. Table 13 compares the cracking load and displacement of them under negative bending. The cracking load of the FSC specimens was only approximately 70% of that of the URSP specimens, and the cracking displacement was only about 50%.
The crack distribution at failure was also compared between the partial and full shear connection specimens, as shown in Figure 21, where red regions denote cracked zones.
The following observations can be made from Figure 21.
(1)
Cracking initiated earlier in the FSC specimens. At the same displacement, no transverse cracks appeared in the URSP specimens, whereas multiple transverse cracks had already developed in the full shear connection ones.
(2)
In the FSC specimens, cracks first occurred at the beam–column joint, where the negative moment is the largest, and then propagated outward. These cracks were distributed from the beam–column joint toward the mid-span, and were numerous and wide. In contrast, the first crack in the URSP specimens appeared about 500 mm from the beam–column joint, near the edge of the URSP connector region, and the second crack appeared about 800 mm from the beam–column joint. These cracks were fewer and narrower.
It can thus be concluded that full composite action between the slab and the steel beam in the negative moment region is unfavorable to the concrete slab. The URSP connectors proposed in this study improve the cracking load and displacement of the slab in this region.

4.5. Effect of URSP Arrangement Length

In the present tests, the URSP arrangement length (i.e., the slotted-hole zone) in the four URSP-PBL specimens was fixed at 720 mm, corresponding to 0.36 times the beam span. Thus, all specimens had the same URSP arrangement length, and the effect of the URSP arrangement length was not addressed experimentally.
The URSP arrangement length directly governs the degree of shear connection and consequently influences the composite action along the beam. The study by Duan et al. investigated the influence of URSP-S arrangement length on the structural performance of composite beams in frame structures [22]. Given the large slip capacity of URSP-PBL connectors, they are more advantageous for application in long-span composite beams. However, the optimal arrangement length of PBL connectors combined with the URSP configuration in the negative moment region remains unclear.
It should be noted that, according to elementary elastic theory for a continuous beam under uniform loading, the theoretical length of the negative moment region on each side of the intermediate support is determined by the location of the inflection point, that is, the zero-moment point. Importantly, this inflection point location is governed solely by the boundary conditions and loading pattern, and showed limited sensitivity to the absolute flexural stiffness EI, cross-sectional geometry, or reinforcement ratio, since these parameters affect only the magnitude of the bending moments, not the position of the zero-moment points. Therefore, this length ratio carries general theoretical validity and is fundamentally insensitive to variations in span, geometry, or material properties.
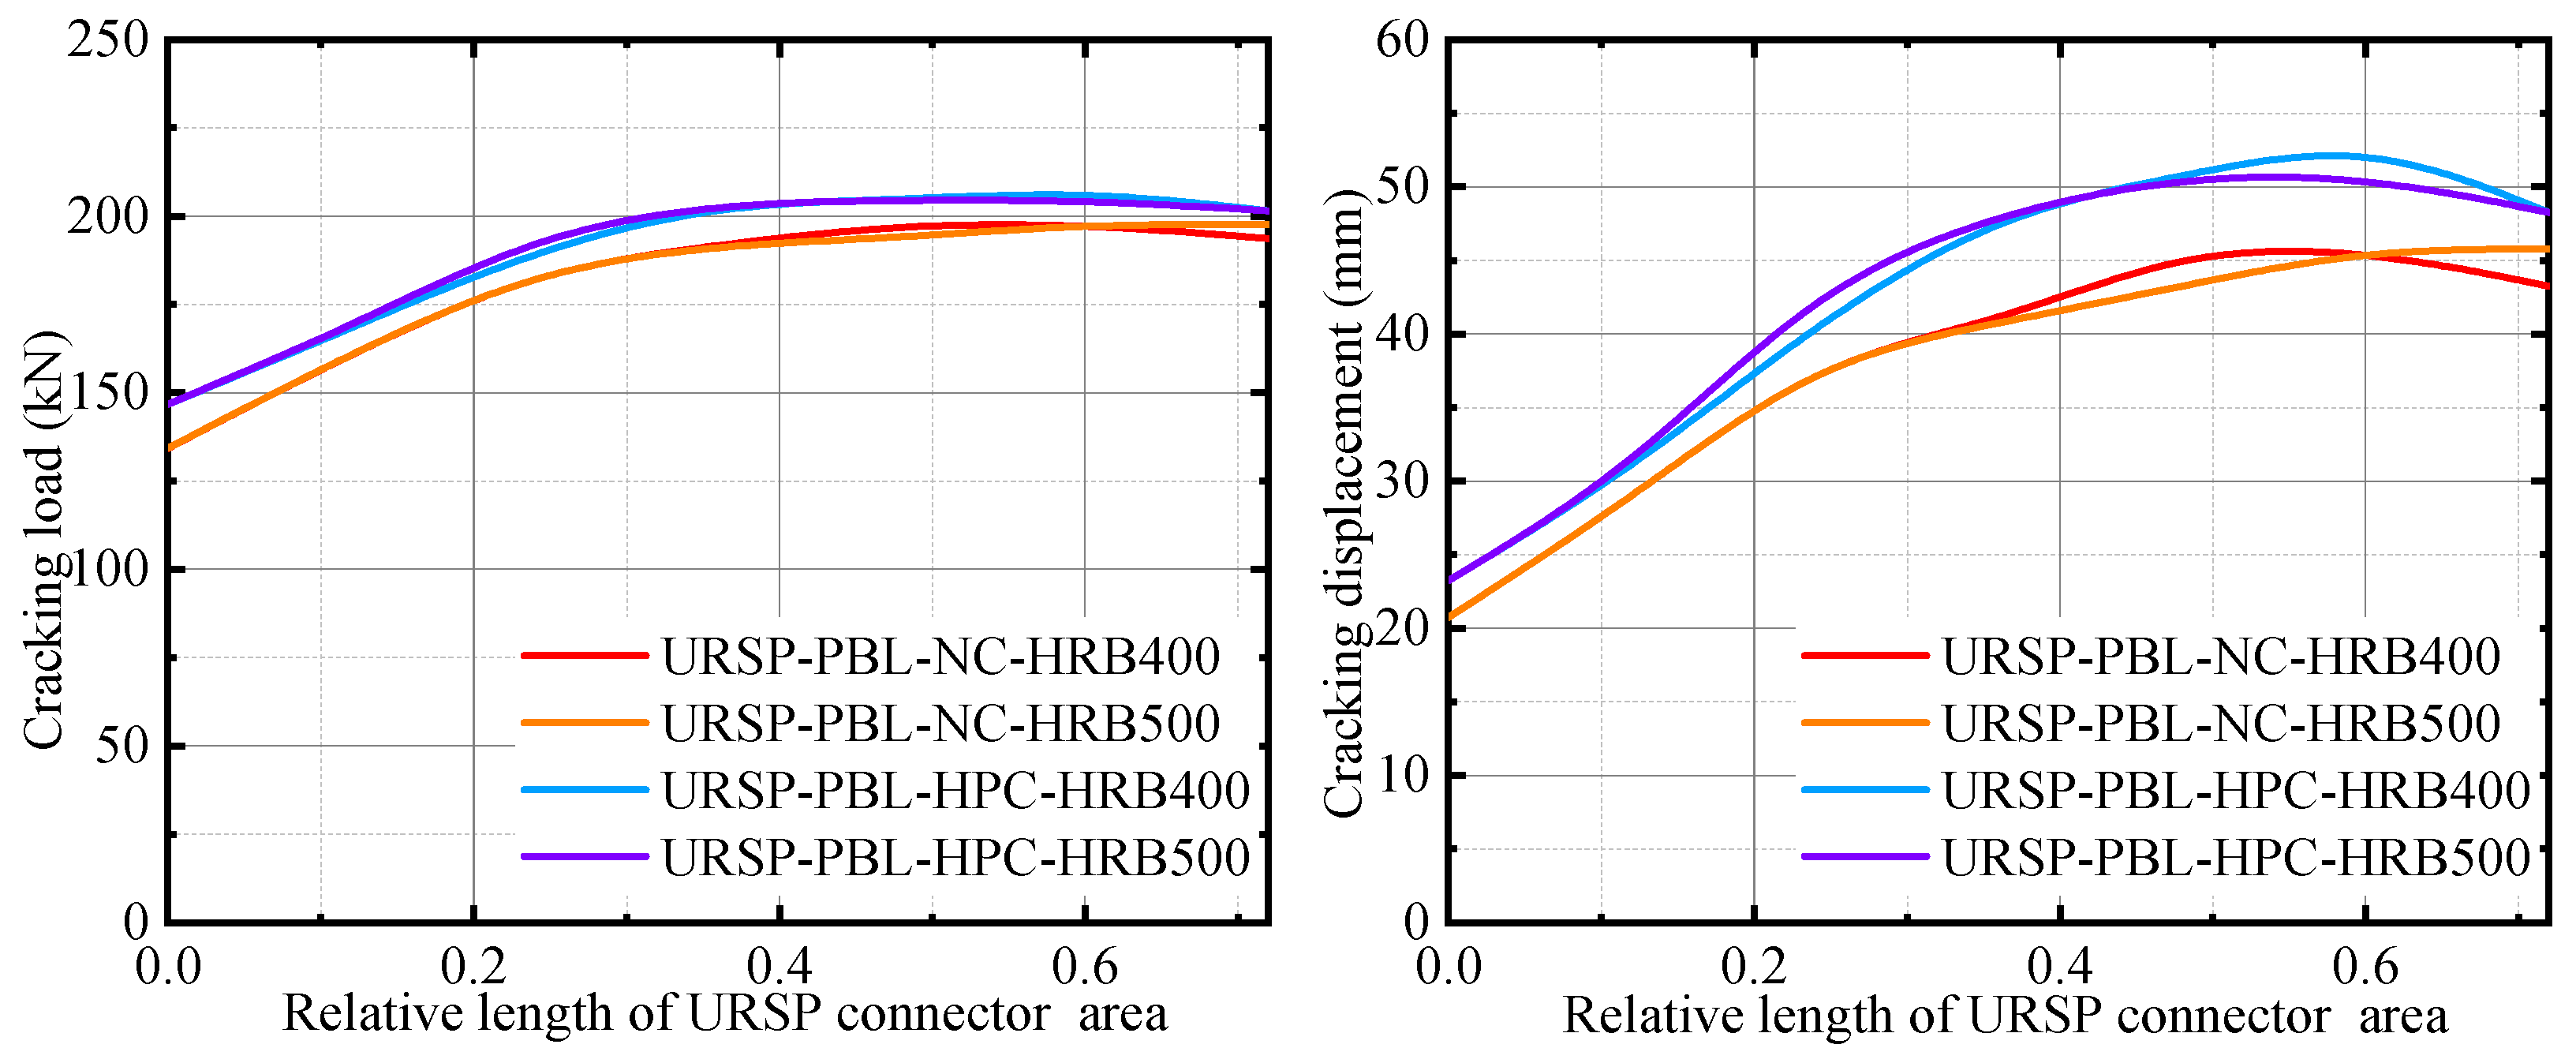
Parametric analyses were performed on the four specimens by varying the URSP arrangement length to investigate its relationship with the extent of the negative moment region. Seven cases were considered, with the URSP arrangement length set to 0 (full shear connection), 0.12 L, 0.24 L, 0.36 L (as tested), 0.48 L, 0.60 L, and 0.72 L, where L denotes the beam span (2 m). This was achieved by adjusting the number of slotted holes in the steel plate connector. The simulation results are shown in Table 14 and Figure 22.
As shown in Table 13 and Figure 22, the fully shear-connected specimen exhibited the lowest cracking load and displacement. This is because full composite action generates tensile stresses in the concrete slab, with the maximum at the top surface, making it prone to cracking once the tensile strength is exceeded. Consequently, full composite action in the negative moment region is unfavorable for crack resistance of the concrete slab.
As the URSP arrangement length increased, both the cracking load and displacement improved, reaching their maximum values within the range of approximately 0.36 L to 0.6 L. Beyond this range, further increasing the URSP arrangement length from 0.6 L to 0.72 L resulted in no additional improvement or even a slight reduction in both quantities.
This trend indicates that when the URSP arrangement length reaches approximately 0.36–0.60 L, the beneficial effect of reducing composite action is fully realized. Further increasing the slotted-hole zone beyond this range yields no additional benefit, as the concrete slab beyond 0.6 L is subjected to only minor tensile stresses. This result is generally consistent with the range of 0.4–0.5 L recommended by Duan et al. (2019) [22]. The principle of both recommendations is essentially the same; that is, the connector arrangement length should adequately cover the critical regions where tensile stresses are relatively high in the negative moment zone.
The proposed optimal range of 0.36–0.60 L ensures that the connectors cover the regions where tensile stresses are relatively high, thereby allowing sufficient slip to release the critical tensile stresses in the concrete slab. The underlying mechanism of this optimal range can be attributed to the balance between “slip release” and “retention of composite action”: an overly short URSP zone fails to adequately release the tensile stresses in the concrete slab, whereas an excessively long zone over-weakens the composite action, leading to a reduction in both cracking load and cracking displacement.

5. Conclusions

To address the cracking issue in the negative moment region of long-span steel–concrete composite structures, this study proposes a URSP-PBL connector with large slip capacity. Quasi-static tests were conducted on composite beams with the proposed connector, and the main findings are as follows:
  • Based on the test results, the cracking resistance of steel–concrete composite beams could be enhanced by employing URSP connectors in the negative moment region. The use of high-performance concrete in the cast-in-place topping also enhanced the cracking resistance, with the combined use proving the most effective.
  • The ultimate flexural capacity of composite beams under negative bending showed limited sensitivity to the cast-in-place concrete material and the reinforcement grade in the cast-in-place topping within the tested range. It should be noted that this conclusion is based on the test range covering HRB400 and HRB500 reinforcement grades, along with the corresponding reinforcement ratios and the flexure-shear dominated failure mode observed in this study. Therefore, extrapolation beyond this range requires further verification.
  • Experimental results in the elastic range showed that the URSP-PBL connectors enhanced the initial stiffness of composite beams compared with the URSP-S connector. This comparison is limited to the elastic range, as the URSP-S specimen failed prematurely after yielding due to poor weld quality.
  • The test results showed that specimens with URSP-PBL connectors exhibited favorable ductility and seismic performance. HPC improved crack control and the reported energy-dissipation indices, while no improvement in ductility was demonstrated and the influence on ultimate strength was small. The reinforcement grade showed limited sensitivity within the tested range.
  • The numerical results indicated that the cracking load and displacement increased with the URSP arrangement length up to an optimal range of approximately 0.36 L to 0.6 L, beyond which further increase yields no additional improvement. It should be emphasized that this optimal range is derived from parametric finite element analysis and is therefore a numerical finding. Moreover, all numerical results presented in this study are strictly limited to the tested geometry (2 m beam span) and parameter range and should not be extrapolated to other spans without further experimental validation. Additional experimental validation for spans other than the 2 m span used in this study is therefore recommended in future work.
Despite these findings, several limitations remain. Direct measurement of interface slip was not achieved in the present tests, and further refinement of the contact modeling is still needed. Future work may benefit from methodological advances in interface analysis [46], efficient numerical methods for dynamic analysis [47], fatigue life prediction techniques [48], structural dynamic response control strategies [49], and high-resolution measurement techniques [50,51] developed in other engineering fields, with the aim of achieving a more comprehensive evaluation of the long-term performance of the proposed connector system.

Author Contributions

Conceptualization, writing—original draft preparation, funding acquisition, project administration, J.C.; methodology, software, H.H.; validation, writing—review and editing, X.W.; investigation, data curation, Y.Z. All authors have read and agreed to the published version of the manuscript.

Funding

This research was funded by the National Natural Science Foundation of China (52578209), NUAA Teaching Reform Project (2026YJXGG18, 2026YJXGG-D05), and Postgraduate Research & Practice Innovation Program of NUAA (xcxjh20250713, xcxjh20250710).

Data Availability Statement

The original contributions presented in the study are included in the article; further inquiries can be directed to the corresponding authors.

Acknowledgments

The authors acknowledge Nanjing University of Aeronautics and Astronautics and Zhejiang University for providing the experimental and computational resources that have contributed to the research results reported within this paper; the authors are grateful for the experimental and computing support.

Conflicts of Interest

The authors declare no conflict of interest.

References

  1. Wu, F.; Fan, Z.; He, L.; Liu, S.; Zuo, J.; Yang, F. Comparative study of the negative bending behaviour of corrugated web steel-concrete composite beams using NC, ECC and UHPC. Eng. Struct. 2023, 283, 115925. [Google Scholar] [CrossRef] [Scilit]
  2. Lu, Y.; Zhang, Y.; Zhang, Q.; Kong, D.; Wang, L.; Fu, R. Negative bending performance of SRC composite open-web beams. J. Constr. Steel Res. 2026, 236, 109947. [Google Scholar] [CrossRef] [Scilit]
  3. Vasdravellis, G.; Uy, B.; Tan, E.L.; Kirkland, B. Behaviour and design of composite beams subjected to negative bending and compression. J. Constr. Steel Res. 2012, 79, 34–47. [Google Scholar] [CrossRef] [Scilit]
  4. Gattesco, N.; Macorini, L.; Fragiacomo, M. Moment redistribution in continuous steel-concrete composite beams with compact cross section. J. Struct. Eng. 2010, 136, 193–202. [Google Scholar] [CrossRef] [Scilit]
  5. Zha, S.; Liu, D.; Song, Q.; Zhang, J.; Deng, W.; Gu, J. Cracking behavior and crack width prediction in steel-concrete composite beams under negative bending moment: A comparative study of web and deck configurations. Eng. Struct. 2025, 345, 121554. [Google Scholar] [CrossRef] [Scilit]
  6. Hou, H.; Liu, X.; Qu, B.; Ma, T.; Liu, H.; Feng, M.; Zhang, B. Experimental evaluation of flexural behavior of composite beams with cast-in-place concrete slabs on precast prestressed concrete decks. Eng. Struct. 2016, 126, 405–416. [Google Scholar] [CrossRef] [Scilit]
  7. Guan, M.; Xu, Y.; Wen, Q.; Zhang, F.; Peng, Y. Experiment and numerical simulation on bearing capacity of partial steel-ultra-high-performance concrete continuous composite beams. Structures 2024, 69, 107393. [Google Scholar] [CrossRef] [Scilit]
  8. Zhan, Y.; Zhang, C.; Xu, J.; Huang, W.; Shao, J. Experimental study on crack performance of steel and early-age BFRC composite beams in negative moment region. Eng. Struct. 2024, 300, 117222. [Google Scholar] [CrossRef] [Scilit]
  9. Xiong, M.; Shao, X.; Cao, J.; Wu, S.; Qiu, M.; Feng, J. Investigation on the mechanical behavior of pre-cracked steel-UHPC composite bridge decks under negative bending moment. Structures 2026, 85, 111168. [Google Scholar] [CrossRef] [Scilit]
  10. Zheng, Y.; Zhu, J.; Yang, H.; Liang, Z.; Li, W. Flexural behavior of externally prestressed steel-UHPC-NC composite beams in negative moment regions. J. Constr. Steel Res. 2025, 234, 109727. [Google Scholar] [CrossRef] [Scilit]
  11. Peng, F.; Xue, W.; Bai, L. Flexural behavior and stiffness calculation of steel-prestressed concrete composite girders under negative moment. Structures 2025, 79, 109429. [Google Scholar] [CrossRef] [Scilit]
  12. Chen, S. Experimental study of prestressed steel-concrete composite beams with external tendons for negative moments. J. Constr. Steel Res. 2005, 61, 1613–1630. [Google Scholar] [CrossRef] [Scilit]
  13. Chen, S.; Wang, X.; Jia, Y. A comparative study of continuous steel-concrete composite beams prestressed with external tendons: Experimental investigation. J. Constr. Steel Res. 2009, 65, 1480–1489. [Google Scholar] [CrossRef] [Scilit]
  14. Su, Q.; Zhao, R.; Shi, Z.; Zou, D.; Huang, L.; Li, F.; Luo, H. Post-combined prestressed continuous composite bridge deck for mitigating concrete cracking: Experiment, numerical simulation, and theoretical analysis. Eng. Struct. 2026, 361, 122906. [Google Scholar] [CrossRef] [Scilit]
  15. Chen, D.; Tang, J.; Su, Q.; Shen, C.; Xie, W. Mechanisms of prestress transfer and load-bearing performance in post-connected prestressed steel-concrete composite girders. Structures 2026, 87, 111672. [Google Scholar] [CrossRef] [Scilit]
  16. Lee, D.H.; Oh, J.Y.; Kang, H.; Kim, K.S.; Kim, H.J.; Kim, H.Y. Structural performance of prestressed composite girders with corrugated steel plate webs. J. Constr. Steel Res. 2015, 104, 9–21. [Google Scholar] [CrossRef] [Scilit]
  17. Williams, P.M.; Menon, D.; Prasad, A.M. Experimental study on long-term behavior of PSC beams. Structures 2023, 51, 560–572. [Google Scholar] [CrossRef] [Scilit]
  18. Ranzi, G.; Leoni, G.; Zandonini, R. State of the art on the time-dependent behaviour of composite steel-concrete structures. J. Constr. Steel Res. 2013, 80, 252–263. [Google Scholar] [CrossRef] [Scilit]
  19. Jiang, Y.; Nie, X.; Yan, A.; Zeng, J.; Nong, X.; Fan, J. Experimental research on the structural performance of continuous composite beams with uplift-restricted and slip-permitted connectors. Eng. Struct. 2023, 289, 116291. [Google Scholar] [CrossRef] [Scilit]
  20. Nie, X.; Duan, L.; Tao, M.; Guo, Y. Experimental investigation on the behavior of the steel-concrete composite frames with uplift-restricted and slip-permitted screw-type (URSP-S) connectors. Eng. Struct. 2022, 254, 113868. [Google Scholar] [CrossRef] [Scilit]
  21. Duan, L.; Nie, X.; Wang, J.; Wu, G. Experimental and analytical study on steel-concrete-ECC composite frames with URSP-S connectors. J. Build. Eng. 2023, 76, 107072. [Google Scholar] [CrossRef] [Scilit]
  22. Duan, L.; Nie, X.; Ding, R.; Zhuang, L. Research on application of uplift-restricted slip-permitted (URSP) connectors in steel-concrete composite frames. Appl. Sci. 2019, 9, 2235. [Google Scholar] [CrossRef] [Scilit]
  23. Nie, J.G.; Li, Y.X.; Tao, M.-X. Slip performance and hysteresis model of a new type of uplift restricted-slip free connectors. Eng. Mech. 2014, 31, 46–52. [Google Scholar] [CrossRef]
  24. Chen, Y.; Yan, Q.; Yu, X.; Jia, B.; Wu, Y.; Luo, Y. Experimental and numerical research on uplift-restricted and slip-permitted screw-shaped connectors. Int. J. Steel Struct. 2022, 22, 225–239. [Google Scholar] [CrossRef] [Scilit]
  25. Chan, C.K. Structural Performance of Long Span Composite Beams with High Performance Materials and Practical Constructional Features. Ph.D. Thesis, The Hong Kong Polytechnic University, Hong Kong, China, 2012. [Google Scholar]
  26. Gao, X.; Shen, S.; Guo, Y.; Guo, J. Experimental study on the shear and slip behaviors of perfobond strip connectors with low elastic modulus material wrapped perforated rebars. Eng. Struct. 2024, 316, 118521. [Google Scholar] [CrossRef] [Scilit]
  27. GB 50917-2013; Code for Design of Steel-Concrete Composite Bridges. China Planning Press: Beijing, China, 2013.
  28. GB 50205-2020; Standard for Acceptance of Construction Quality of Steel Structures. China Planning Press: Beijing, China, 2020.
  29. GB 50017-2017; Steel Structure Design Standard. China Architecture & Building Press: Beijing, China, 2017.
  30. GB/T 50081-2019; Standard for Test Methods of Concrete Physical and Mechanical Properties. China Architecture & Building Press: Beijing, China, 2019.
  31. GB/T 50010-2010; Code for Design of Concrete Structures. China Architecture & Building Press: Beijing, China, 2024.
  32. Li, X.; Huang, X.; Xu, F.; Li, C.; Wang, L. Correlations between basic mechanical indexes of C20-C120 concrete. China Civ. Eng. J. 2026, 59, 84–98. [Google Scholar] [CrossRef]
  33. Guo, Y.; Chen, G.; Sun, R.; Li, Z. Quasi-static and dynamic splitting of high-strength concretes-tensile stress-strain response and effects of strain rate. Int. J. Impact Eng. 2019, 125, 188–211. [Google Scholar] [CrossRef] [Scilit]
  34. Neofoam EPE Technical Specifications. (n.d.). PJ Bowers. Available online: https://www.pjbowers.com.au/products/epe-foam (accessed on 19 July 2026).
  35. Mills, N.J.; Gilchrist, A. The Effects of Heat Transfer and Poisson’s Ratio on the Compressive Response of Closed-Cell Polymer Foams. Cell. Polym. 1997, 16, 87–109. [Google Scholar] [CrossRef] [Scilit]
  36. Xue, W.; Hu, X. Seismic performance of a four-story two-bay high-performance concrete frame under low reversed cyclic loading. KSCE J. Civ. Eng. 2017, 21, 2707–2716. [Google Scholar] [CrossRef] [Scilit]
  37. Sha, H.; Chong, X.; Wang, D.; Jiang, Q.; Wang, Y.; Huang, J. A direct energy-based design method for damping control reinforced concrete structure: Methodology and application. Eng. Struct. 2025, 324, 119323. [Google Scholar] [CrossRef] [Scilit]
  38. Tropea, G.A.; Angelucci, G.; Bernardini, D.; Quaranta, G.; Mollaioli, F. An energy based method to evaluate reinforced concrete column seismic capacity. Structures 2025, 78, 109276. [Google Scholar] [CrossRef] [Scilit]
  39. Tropea, G.A.; Angelucci, G.; Bernardini, D.; Quaranta, G.; Mollaioli, F. New energy-based methodology to characterize nonlinear seismic response. Eng. Struct. 2025, 325, 119488. [Google Scholar] [CrossRef] [Scilit]
  40. Soh, C.K.; Fung, T.C.; Qin, F.; Gho, W.M. Behavior of completely overlap joints under cyclic loadings. J. Struct. Eng. 2001, 127, 122–128. [Google Scholar] [CrossRef] [Scilit]
  41. Varma, A.H.; Ricles, J.M.; Sause, R.; Lu, L.W. Seismic behavior and modeling of high-strength composite concrete-filled steel tube (CFT) beam-columns. J. Constr. Steel Res. 2002, 58, 725–758. [Google Scholar] [CrossRef] [Scilit]
  42. Jiang, J.J.; Lu, X.Z.; Ye, L.P. Finite Element Analysis of Concrete Structures; Tsinghua University Press: Beijing, China, 2005. [Google Scholar]
  43. Su, Q.T.; Du, X.; Li, C.X.; Jiang, X. Tests of basic physical parameters of steel-concrete interface. J. Tongji Univ. (Nat. Sci.) 2016, 44, 499–506. [Google Scholar]
  44. Queiroz, F.D.; Vellasco, P.C.G.S.; Nethercot, D.A. Finite element modelling of composite beams with full and partial shear connection. J. Constr. Steel Res. 2007, 63, 505–521. [Google Scholar] [CrossRef] [Scilit]
  45. Bursi, O.S.; Sun, F.F.; Postal, S. Non-linear analysis of steel-concrete composite frames with full and partial shear connection subjected to seismic loads. J. Constr. Steel Res. 2005, 61, 67–92. [Google Scholar] [CrossRef] [Scilit]
  46. Hu, M.; Luo, J.; Zhu, S.; Zhai, W. Friction matching and competition at interfaces of railway fastening systems. Int. J. Mech. Sci. 2026, 323, 111715. [Google Scholar] [CrossRef] [Scilit]
  47. Hu, H.X.; Wang, X.Z.; Bao, Y.C.; Zuo, Y.Y.; Zhang, P.C.; Qi, Q.F.; Deng, H.H. Transient analysis of cylindrical shells via a numerically stable discrete time state space technique. Thin-Walled Struct. 2026, 231, 115357. [Google Scholar] [CrossRef] [Scilit]
  48. Luo, J.; Tang, P.; Xu, P.; Zhu, S.; Zhai, W. Efficient predictive model for high-frequency fatigue life of high-speed railway fastening clips using particle swarm optimization algorithm. Mech. Syst. Signal Process. 2025, 235, 112884. [Google Scholar] [CrossRef] [Scilit]
  49. Zuo, Y.; Wang, X.; Gao, S. Ultra-low-frequency noise control in cruise modular cabin with thickness-graded star-shaped metamaterials. Ocean Eng. 2026, 363, 126490. [Google Scholar] [CrossRef] [Scilit]
  50. Liu, J.; Guo, Z.; Wu, X.; Ren, Y.; Hu, M.; Zeng, H. Real-Time Observation of Breathing Vortex Solitons in a Yb:CALGO Laser. Laser Photonics Rev. 2025, 20, e01758. [Google Scholar] [CrossRef] [Scilit]
  51. Liu, J.; Guo, Z.; Hu, M.; Zeng, H. Sub-100 Fs Vortex Beams Generated from a Yb:CALGO Laser. Laser Photonics Rev. 2025, 19, e00819. [Google Scholar] [CrossRef] [Scilit]
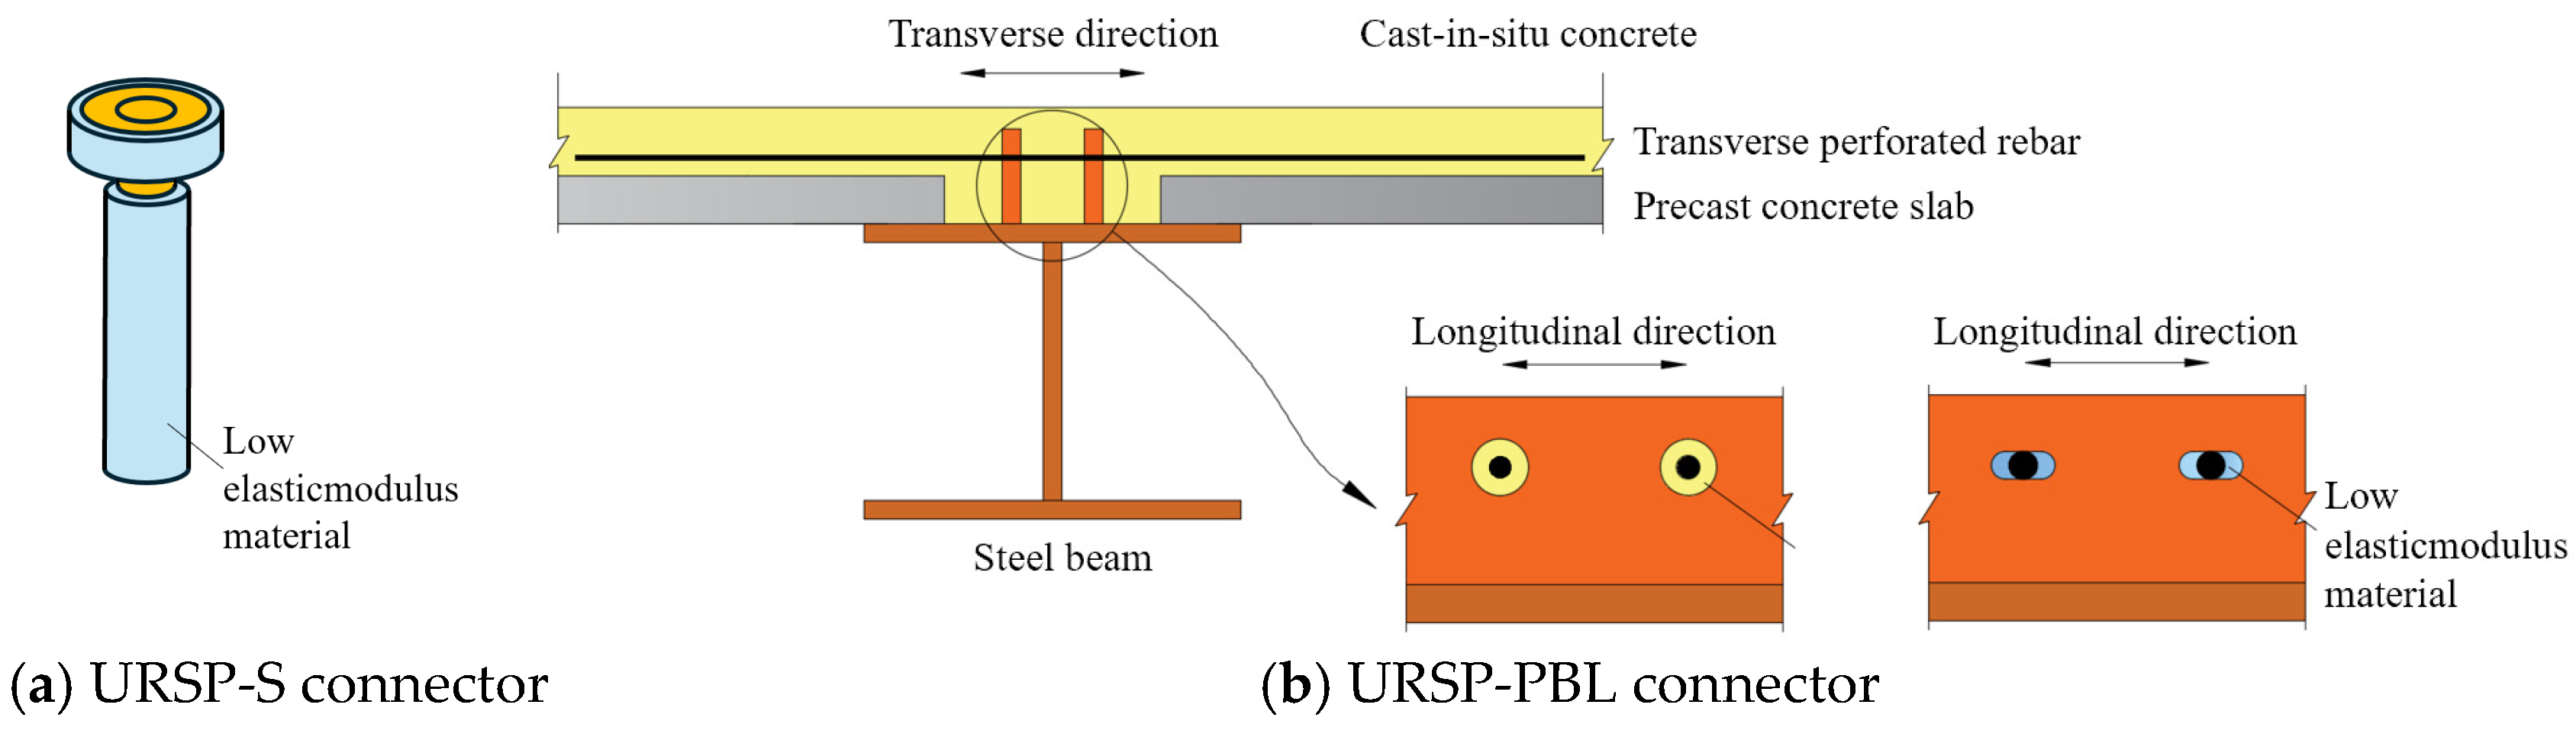
Figure 1. URSP-PBL connector.
Buildings 16 03344 g001
Figure 2. Specimen dimensions (unit: mm).
Buildings 16 03344 g002
Figure 3. Test setup and measurement point layout (unit: mm).
Buildings 16 03344 g003
Figure 4. Crack distribution of specimen URSP-S-NC-400. (The numbers indicate the cracking load (in kN) and the corresponding crack width (in mm)).
Buildings 16 03344 g004
Figure 5. Crack distribution of URSP-PBL specimens. (The numbers indicate the cracking load (in kN) and the corresponding crack width (in mm)).
Buildings 16 03344 g005aBuildings 16 03344 g005b
Figure 6. Slab-to-beam interface condition at the end of testing.
Buildings 16 03344 g006
Figure 7. Failure modes.
Buildings 16 03344 g007aBuildings 16 03344 g007b
Figure 8. Strain distribution of steel beam and reinforcing bars at mid-span section.
Buildings 16 03344 g008aBuildings 16 03344 g008b
Figure 9. Strain distribution of steel beam and reinforcing bars at the root section.
Buildings 16 03344 g009aBuildings 16 03344 g009b
Figure 10. Strain distribution on the side face of the concrete slab at mid-span.
Buildings 16 03344 g010
Figure 11. Hysteretic curve of specimens.
Buildings 16 03344 g011
Figure 12. Skeleton curve.
Buildings 16 03344 g012
Figure 13. Secant stiffness degradation.
Buildings 16 03344 g013
Figure 14. Strength degradation.
Buildings 16 03344 g014
Figure 15. Finite element model.
Buildings 16 03344 g015
Figure 16. Contact interfaces in the finite element model.
Buildings 16 03344 g016
Figure 17. Comparison of load–displacement curves between finite element and test results.
Buildings 16 03344 g017aBuildings 16 03344 g017b
Figure 18. Failure modes of the specimens.
Buildings 16 03344 g018
Figure 19. Development of interface slip between the composite slab and the steel beam (unit: mm).
Buildings 16 03344 g019
Figure 20. Development of interface slip between the slab and the URSP connectors (unit: mm).
Buildings 16 03344 g020
Figure 21. Comparison of crack distributions between URSP-PBL and FSC-PBL specimens.
Buildings 16 03344 g021aBuildings 16 03344 g021b
Figure 22. Effect of URSP arrangement length on cracking load and displacement.
Buildings 16 03344 g022
Table 1. Design of the specimens.
SpecimenShear ConnectorToppingPrecast Slab
ConcreteSteel RebarConcreteSteel Rebar
URSP-S-NC-400URSP-S connectorC50HRB400C50HRB335
URSP-PBL-NC-400URSP-PBL connectorC50HRB400
URSP-PBL-NC-500URSP-PBL connectorC50HRB500
URSP-PBL-HPC-400URSP-PBL connectorHigh-performance concreteHRB400
URSP-PBL-HPC-500URSP-PBL connectorHigh-performance concreteHRB500
Table 2. Mechanical properties of steel.
MaterialStrength GradeYield Strength
fy (MPa)
Ultimate Strength
fu (MPa)
Elastic Modulus Es (GPa)
StudM20 10.95001040206
Steel plateQ345 (t ≤ 16 mm)345470206
Steel plateQ345 (t > 16 mm)325470206
RebarHRB335335455206
RebarHRB400400540206
RebarHRB500500630206
Table 3. Mix proportion of high-performance concrete (kg/m3).
CementFly AshSilica FumeGround SlagQuartz SandPVC FiberWaterSuperplasticizerWater Repellent
620140180110106081758.56
Table 4. Mechanical properties of concrete.
Strength Grade Numberfcu (MPa) f cu ¯ (MPa) Ec (MPa)
C50151.3252.813.50 × 104
254.78
352.33
Fiber-resistant crack-resistant high-performance concrete1123.8121.074.35 × 104
2117.6
3121.8
Table 5. Mechanical properties of Expanded Polyethylene Foam.
Tensile Strength
(Mpa)
Compression Strength (Mpa)Elastic Modulus (Mpa)Density
(kg/m3)
Poisson’s Ratio
>3.20.05–0.160.1815.20.17
Table 6. Failure mode of specimens.
SpecimenFailure Mode
URSP-S-NC-400CC, BY, WF
URSP-PBL-NC-400CC, BY, BLB, WF
URSP-PBL-NC-500CC, BY, BLB, WF
URSP-PBL-HPC-400CC, BY, BLB, WF
URSP-PBL-HPC-500CC, BY, BLB, WF
Table 7. Load-carrying capacity and crack width of test specimens.
SpecimenYield Load
Fy (kN)
Yield
Displacement
Δy (mm)
Cracking Load
Fcr (kN)
Cracking Displacement Δcr (mm)Ultimate Load
Fu (kN)
Ultimate
Displacement Δu (mm)
Maximum Crack Width
wmax (mm)
URSP-S-NC-400123.025.2143.631.2187.170.10.95
URSP-PBL-NC-400145.229.5185.042.2229.8100.00.89
URSP-PBL-NC-500152.831.0194.744.4236.8100.10.88
URSP-PBL-HPC-400164.834.6206.750.0242.0110.00.43
URSP-PBL-HPC-500165.733.8212.150.0247.9110.10.41
Table 8. Initial stiffness of specimen.
SpecimenK0 (kN/mm)
URSP-S-NC-4004.55
URSP-PBL-NC-4005.77
URSP-PBL-NC-5005.77
URSP-PBL-HPC-4005.84
URSP-PBL-HPC-5005.83
Table 9. Displacement ductility coefficient of specimen.
SpecimenYield Displacement
Δy (mm)
Ultimate Displacement Δu (mm)Displacement Ductility Coefficient μΔ
URSP-S-NC-40025.270.1-
URSP-PBL-NC-40029.5100.03.39
URSP-PBL-NC-50031.0100.13.23
URSP-PBL-HPC-40034.6110.03.18
URSP-PBL-HPC-50033.8110.13.26
Table 10. Energy dissipation evaluation of the specimens.
SpecimenMaximum Cyclic Energy Dissipation Umax (kN·m)Cumulative Energy Dissipation
Usum (kN·m)
Cumulative Energy Dissipation at 100 mm
Usum,100 (kN·m)
Cumulative Energy Dissipation Coefficient ηa
URSP-PBL-NC-40045.08 305.89 305.8993.43
URSP-PBL-NC-50039.93 391.94 391.94102.46
URSP-PBL-HPC-40042.88 480.70 437.83117.77
URSP-PBL-HPC-50039.75 485.05 463.06120.86
Table 11. Mesh convergence study results (exemplified by specimen URSP-PBL-NC-500).
Mesh Size (mm)Peak Load (kN)Error Relative to Experimental Value (%)
302526.4%
202422.2%
102401.4%
Table 12. Comparison of FE and test results for specimens.
Specimen FEM Result(FEM-Test)/Test
K0 (kN/mm)Fy
(kN)
Δy (mm)Fcr (kN)Δcr (mm)Fu
(kN)
Δu (mm)K0FyΔyFcrΔcrFuΔu
URSP-PBL-NC-4005.85150.5325.75191.9340.75241.4995.751.39%3.67%−12.71%3.75%−3.44%5.09%1.39%
URSP-PBL-NC-5005.85150.5425.75191.9540.75241.5095.751.39%−1.48%−16.94%−1.41%−8.22%1.99%1.39%
URSP-PBL-HPC-4006.04169.0630.75203.6248.25244.46100.003.42%2.59%−11.13%−1.49%−3.50%1.01%3.42%
URSP-PBL-HPC-5006.04169.0930.75203.6348.25241.8895.753.60%2.04%−9.02%−3.99%−3.50%−2.43%3.60%
Table 13. Comparison of cracking load and displacement between URSP and FSC specimens.
Specimen Fcr (kN)Δcr (mm)SpecimenFcr (kN)Δcr (mm)
URSP-PBL-NC-400191.9340.75FSC-PBL-NC-400134.2720.75
URSP-PBL-NC-500191.9540.75FSC-PBL-NC-500134.3520.75
URSP-PBL-HPC-400203.6248.25FSC-PBL-HPC-400146.7323.25
URSP-PBL-HPC-500203.6348.25FSC-PBL-HPC-500146.8123.25
Table 14. Effect of URSP arrangement length on cracking load and displacement.
URSP LengthSpecimenFcr (kN)Δcr (mm)SpecimenFcr (kN)Δcr (mm)
0 LURSP-PBL-NC-400134.2720.75URSP-PBL-HPC-400146.7323.25
0.12 L161.3228.81168.3730.75
0.24 L184.6838.25190.5640.75
0.36 L191.9340.75203.6248.25
0.48 L197.7845.75204.5950.75
0.60 L197.7945.75207.3553.25
0.72 L193.7143.25201.4548.25
0 LURSP-PBL-NC-500
134.3520.75URSP-PBL-HPC-500146.8123.25
0.12 L161.3528.81168.6930.78
0.24 L184.6938.25194.8743.25
0.36 L191.9540.75203.6348.25
0.48 L193.8543.25204.5950.75
0.60 L197.8145.75204.6050.75
0.72 L197.6445.75201.5448.25
Disclaimer/Publisher’s Note: The statements, opinions and data contained in all publications are solely those of the individual author(s) and contributor(s) and not of MDPI and/or the editor(s). MDPI and/or the editor(s) disclaim responsibility for any injury to people or property resulting from any ideas, methods, instructions or products referred to in the content.