1. Introduction
Indoor environmental design plays an important role in shaping spatial function, visual experience, user behavior, and environmental quality. Traditional interior design analysis often relies on manual observation, expert evaluation, questionnaires, or case-based interpretation. Although these approaches can provide rich qualitative insights, they are usually limited in scalability, objectivity, and reproducibility when applied to large numbers of indoor scenes. With the rapid development of artificial intelligence and deep learning, data-driven methods have increasingly been introduced into architectural and interior design research, including AI-assisted design workflows, residential space analysis, generative architectural design, and visual-perception-based spatial optimization [
1,
2,
3,
4]. These studies indicate that computational methods have the potential to support more systematic and quantitative analysis of built environments.
Image-based analysis has become an important direction in built environment research because images can capture visual information from a human-scale perspective. In particular, street view imagery has been widely used for spatial quality evaluation, human perception analysis, historical block assessment, streetscape measurement, perceived restorativeness prediction, and outdoor space quality optimization [
5,
6,
7,
8,
9,
10,
11,
12]. Many of these studies use deep learning or semantic segmentation to extract visual elements and then convert them into quantitative indicators, such as greenery, sky visibility, enclosure, building interface, or other streetscape components. These works demonstrate that visual elements extracted from images can serve as measurable evidence for environmental design and spatial quality analysis.
In building-related computer vision research, semantic segmentation has also been applied to indoor point clouds, Scan-to-BIM workflows, building facade parsing, and three-dimensional scene understanding [
13,
14,
15,
16,
17], as well as indoor segmentation and scene understanding [
18,
19,
20]. These studies show the value of semantic segmentation for extracting building-related information and supporting downstream tasks such as geometric reconstruction, BIM generation, heritage documentation, facade parsing, and building change detection. However, most of these studies focus on structural components, geometric objects, outdoor streetscapes, facades, or point-cloud-based building modeling. In contrast, the use of ordinary indoor scene images for pixel-level interior environmental design element analysis remains relatively underexplored.
A key challenge is that general semantic segmentation labels are not directly organized according to interior environmental design logic. Public scene parsing datasets such as ADE20K provide dense pixel-level annotations for a wide range of scenes and object categories [
21], and representative segmentation models such as U-Net, DeepLabv3+, PSPNet, and SegFormer have provided strong technical foundations for pixel-level image understanding [
22,
23,
24,
25]. However, segmentation results are often evaluated mainly by recognition accuracy, such as mIoU or pixel accuracy. For interior environmental design research, the more important question is whether semantic masks can be further transformed into interpretable design indicators, such as furniture density, functional facility ratio, soft decoration ratio, decorative object ratio, greenery ratio, visual complexity, and spatial distribution. Therefore, a gap remains between pixel-level semantic segmentation and quantitative interior design interpretation.
To address this gap, this study proposes an Interior Design Element Segmentation and Spatial Quantification Framework, namely the IDESQ Framework, for data-driven indoor space analysis. Based on ADEChallengeData2016, eight typical indoor scene categories were selected to construct an indoor subset, and the original ADE categories were re-mapped into twelve interior environmental design element categories. Four representative segmentation models were compared under the same annotation system, and DeepLabv3+ was adopted as the final segmentation model. The generated design element masks were then transformed into quantitative indicators describing element composition, visual complexity, and spatial distribution. Finally, a GT–Pred consistency analysis was conducted to evaluate whether prediction-mask-derived design features can approximate GT-mask-derived features at both the image level and the scene level. The main novelty of this study lies in the design-oriented label re-mapping and the subsequent spatial feature quantification framework, rather than in the development of a new semantic segmentation architecture.
The main contributions of this study are summarized as follows:
A design-oriented twelve-class interior environmental design element label system is constructed by reorganizing the original ADE semantic categories. This re-mapping transforms general-purpose scene parsing annotations into interpretable design element categories and provides a semantic basis for quantitative indoor environmental design analysis.
An Interior Design Element Segmentation and Spatial Quantification Framework, namely the IDESQ Framework, is proposed to connect indoor scene images, pixel-level semantic segmentation, and spatial design feature quantification. In this framework, segmentation masks are further converted into interpretable indicators, including element area proportions, furniture density, functional facility ratio, soft decoration ratio, decorative object ratio, greenery ratio, visual complexity, and spatial distribution features.
A segmentation-based design feature evaluation procedure is introduced by comparing representative segmentation models and conducting GT–Pred consistency analysis. The results show that DeepLabv3+ provides the highest segmentation performance among the evaluated models, and that prediction-derived indicators achieve stronger agreement with GT-derived indicators after scene-level aggregation, supporting automatic comparison of indoor design patterns across scene types.
By integrating design-oriented label re-mapping, semantic segmentation, quantitative feature extraction, and GT–Pred consistency evaluation, this study provides an automated and interpretable framework for data-driven analysis of interior environmental design patterns.
2. Materials and Methods
2.1. Overall Workflow of the Proposed IDESQ Framework
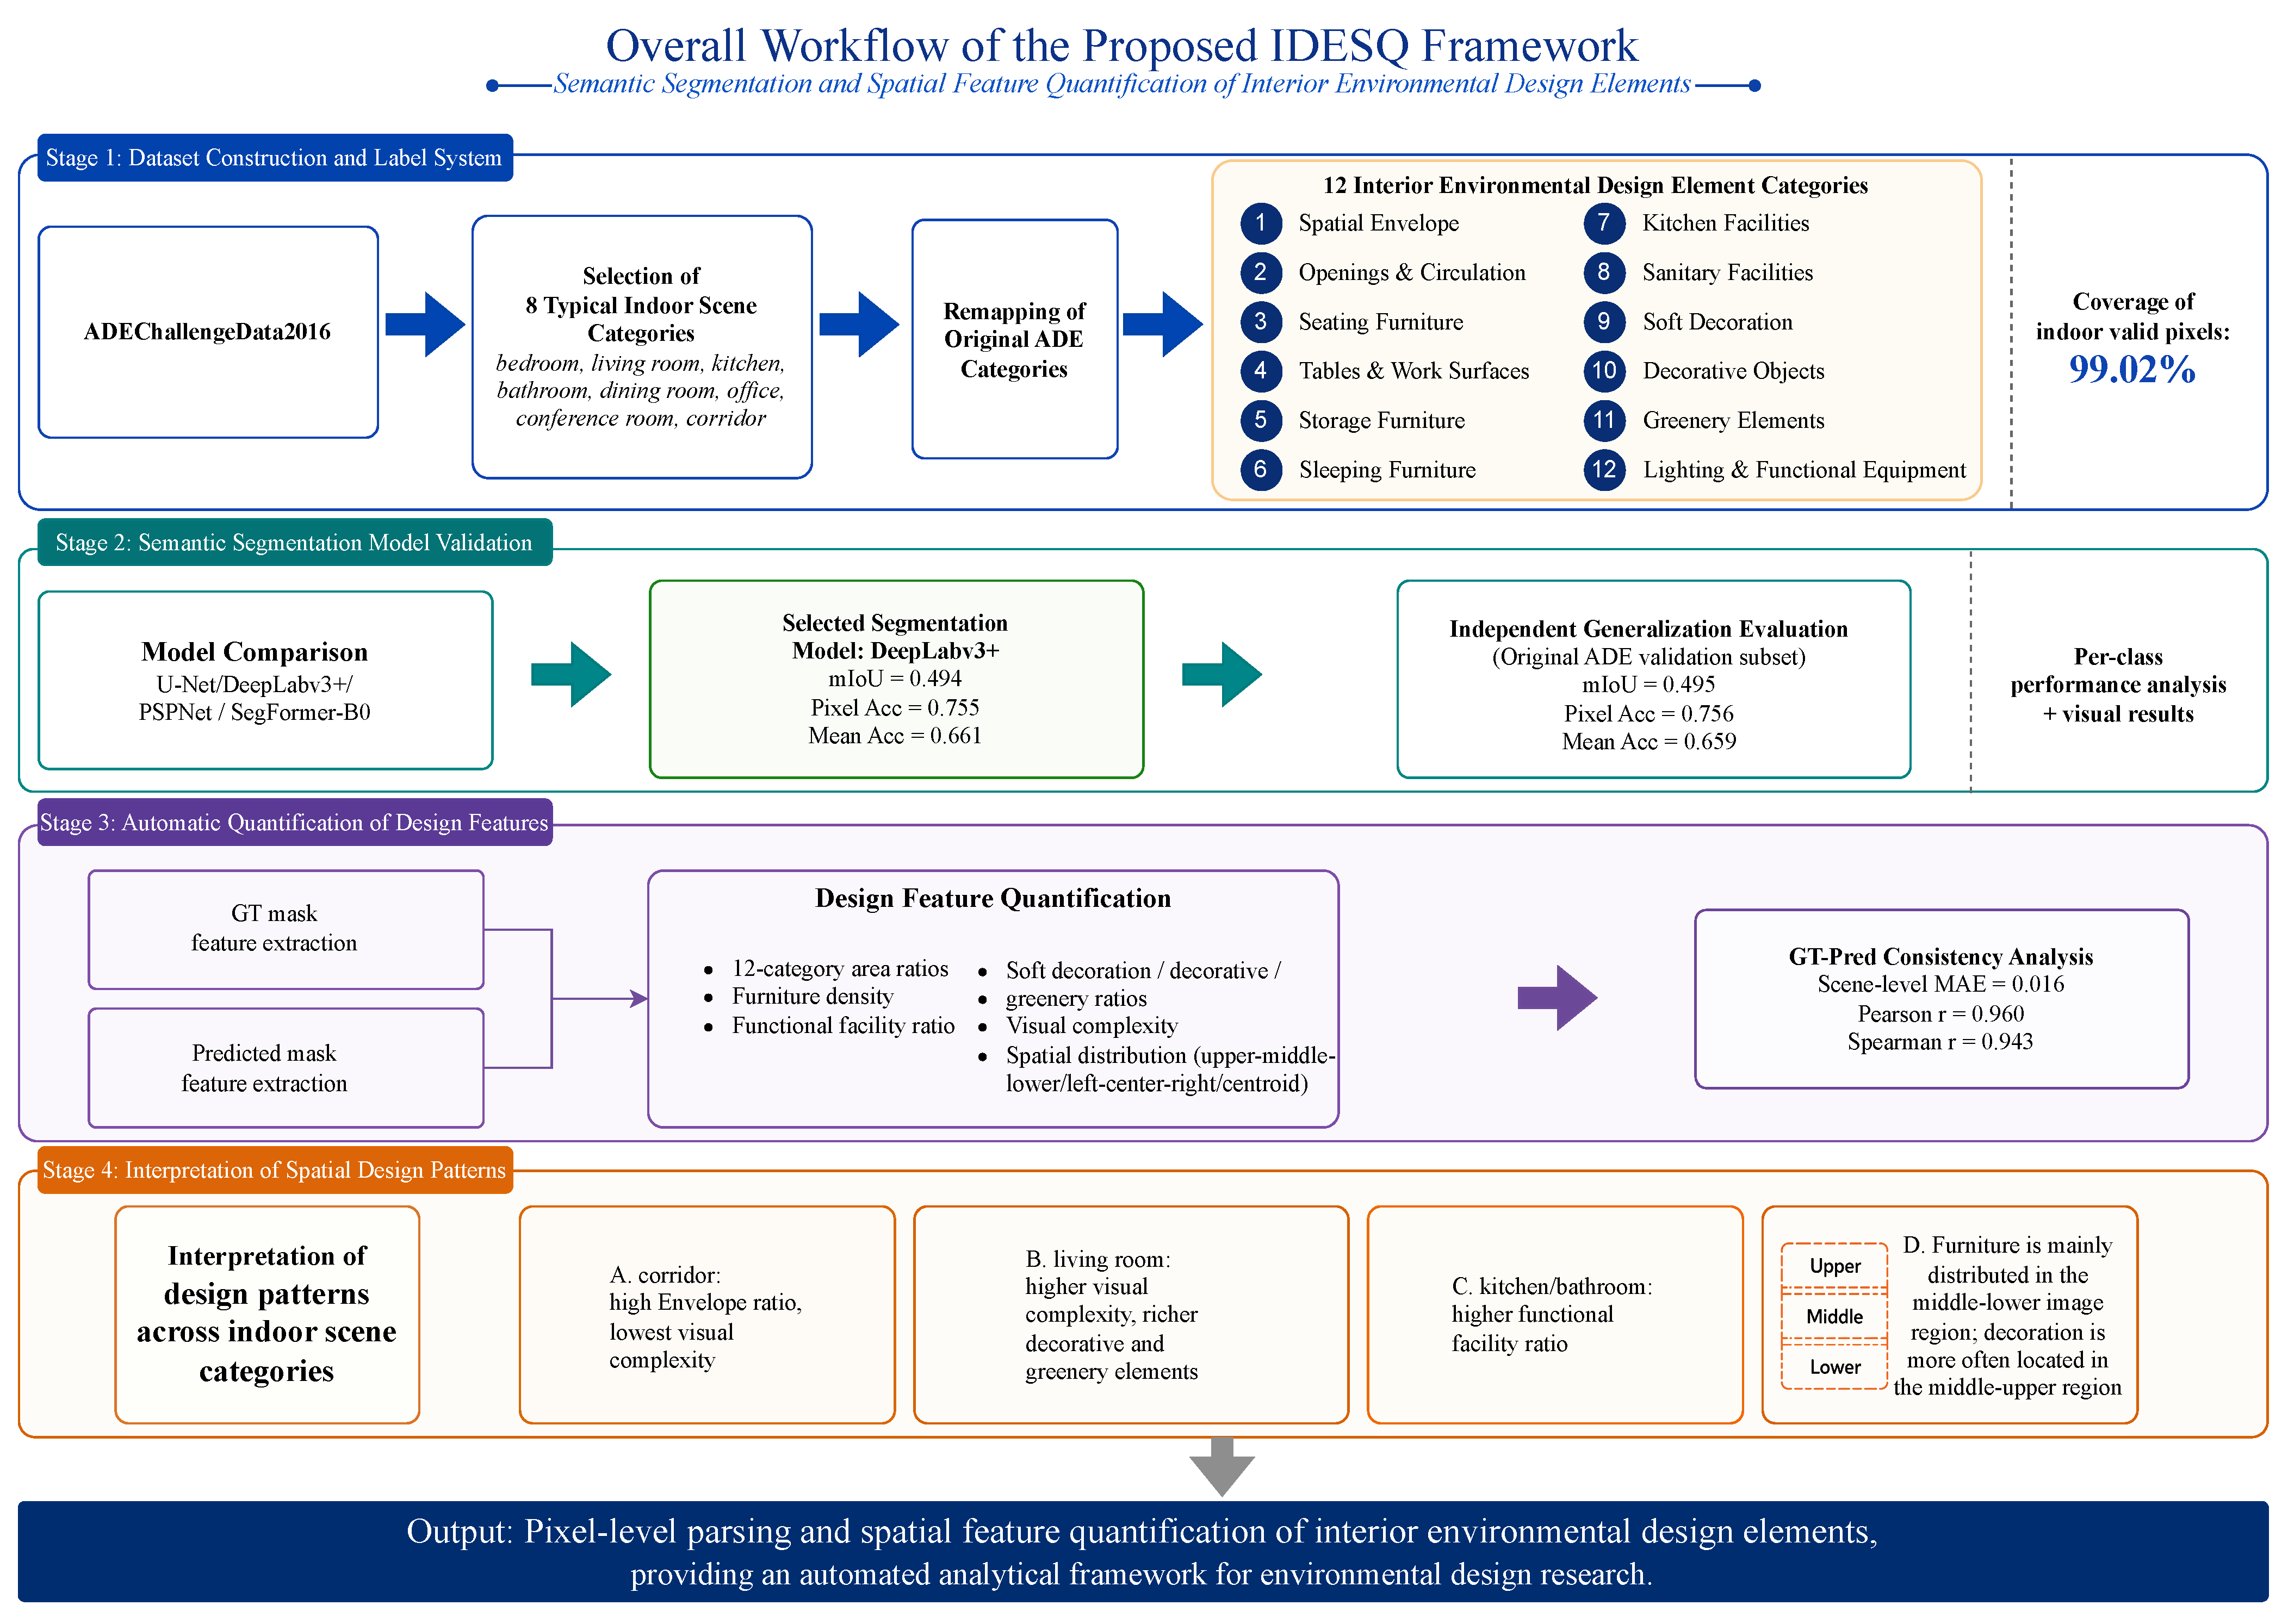
This study proposes an Interior Design Element Segmentation and Spatial Quantification Framework, namely the IDESQ Framework, to support data-driven analysis of indoor environmental design elements from ordinary indoor scene images. As shown in
Figure 1, the framework integrates dataset construction, design-oriented label re-mapping, semantic segmentation model validation, design feature quantification, and spatial design pattern interpretation into a unified workflow.
The first stage focuses on the construction of an indoor scene dataset and the development of a design-oriented semantic label system. Based on ADEChallengeData2016, eight representative indoor scene categories, including bedroom, living room, kitchen, bathroom, dining room, office, conference room, and corridor, were selected to construct the ADEIndoorDesignSubset. The original ADE semantic categories were then reorganized into twelve interior environmental design element categories, enabling the original general-purpose semantic annotations to be transformed into design-oriented pixel-level labels.
The second stage validates the feasibility of automatic interior design element segmentation. Four representative semantic segmentation models, including U-Net, DeepLabv3+, PSPNet, and SegFormer-B0, were trained and evaluated under the same twelve-class design element annotation system. Based on the comparative segmentation performance, DeepLabv3+ was adopted as the final segmentation model for generating prediction masks used in the subsequent design feature quantification stage.
The third stage converts pixel-level segmentation results into quantitative interior design features. Both ground-truth masks and predicted masks were used to calculate interpretable design indicators, including the area proportions of the twelve design element categories, furniture density, functional facility ratio, soft decoration ratio, decorative object ratio, greenery ratio, visual complexity, and spatial distribution features. In this way, semantic segmentation results can be further transformed into measurable descriptors of indoor spatial composition.
The fourth stage evaluates whether prediction-derived design features can reliably support indoor design analysis. A GT–Pred consistency analysis was conducted by comparing design features extracted from ground-truth masks and predicted masks at both the image level and the scene level. This step provides evidence for the practical applicability of the proposed framework in automatic spatial design pattern interpretation across different indoor scene categories.
2.2. Dataset Construction and Twelve-Class Design Element Annotation
ADEChallengeData2016 was used as the original data source in this study. To focus on indoor environmental design analysis, an indoor subset named ADEIndoorDesignSubset was constructed by retaining eight representative indoor scene categories, namely bedroom, living room, bathroom, kitchen, dining room, conference room, office, and corridor. As summarized in
Table 1, the original ADE training split was further divided into model training, validation, and test sets using a stratified 70%/15%/15% division according to scene categories. The original ADE validation split was kept separate and used only as an independent generalization set.
The purpose of constructing this subset was to provide a consistent experimental basis for evaluating whether indoor environmental design elements can be automatically segmented and further quantified from common indoor scene images. The internal model test set was used to compare different segmentation models under the same data setting, whereas the independent generalization set was used to evaluate the stability of the selected model on unseen ADE validation images.
Although ADEChallengeData2016 provides pixel-level semantic annotations, its original 150 categories are designed for general scene parsing rather than interior environmental design analysis. Therefore, the original ADE categories were reorganized into twelve interior environmental design element categories, as listed in
Table 2. This design-oriented re-mapping converts general semantic objects into interpretable design element groups, such as spatial envelope, openings and circulation, furniture, facilities, soft decoration, decorative objects, greenery, and lighting or functional equipment.
In the generated twelve-class annotations, the design element categories were encoded using continuous training labels from 0 to 11. Pixels corresponding to unmapped categories, background regions, or ignored labels were assigned to 255 and excluded from loss computation and evaluation. This annotation strategy ensures compatibility with semantic segmentation training while preserving the interpretability required for subsequent design feature quantification.
It should be noted that
Table 2 defines the semantic correspondence used for annotation generation, while the quantitative justification of this re-mapping strategy is presented in the Results section. Specifically, the pixel-level coverage of the twelve design element categories and their distribution across different indoor scene types are evaluated later to demonstrate the adequacy of the proposed label system for indoor environmental design analysis.
2.3. Semantic Segmentation Models and Training Settings
To evaluate the feasibility of automatically segmenting interior environmental design elements, four representative semantic segmentation models were compared under the same twelve-class annotation system: U-Net, DeepLabv3+, PSPNet, and SegFormer-B0. These models represent different segmentation paradigms, including encoder–decoder segmentation, atrous-convolution-based multi-scale contextual modeling, pyramid pooling-based scene parsing, and lightweight transformer-based segmentation. U-Net used a standard convolutional encoder–decoder with a base channel width of 32; DeepLabv3+ and PSPNet used lightweight ResNet-style backbones; and SegFormer-B0 used a MiT-B0-style encoder with a lightweight MLP decoder. All models were randomly initialized and trained from scratch without pretrained weights.
All models were trained using the same ADEIndoorDesignSubset and the same pixel-level twelve-class design element masks. The original ADE training split was divided into training, validation, and test sets using a stratified 70%/15%/15% division according to indoor scene categories. This setting ensured that the segmentation models were compared under consistent data conditions and that the internal test set could be used for fair model performance evaluation.
For semantic segmentation training, the twelve interior environmental design element categories were encoded as continuous labels from 0 to 11, while unmapped, background, and ignored pixels were assigned to 255 and excluded from loss computation and metric calculation. Input images and corresponding masks were resized to pixels. During training, paired images and masks were randomly flipped horizontally with a probability of 0.5, and the images were normalized using mean values of and standard deviations of . The batch size was set to 8, and each model was trained for 80 epochs. AdamW was used with an initial learning rate of , a weight decay of , and a cosine annealing learning-rate schedule. A random seed of 42 was used for the data split and for the Python, NumPy, PyTorch, and CUDA random number generators.
To alleviate category imbalance, weighted cross-entropy loss was used. For each category c, its pixel frequency was calculated from the training masks, and the initial class weight was defined as . The resulting weights were normalized to have a mean value of one. Pixels labeled as 255 were ignored during loss computation. Mixed precision training was enabled to improve computational efficiency. During validation, the model with the best mean Intersection over Union (mIoU) on the validation set was saved and subsequently evaluated on the internal test set.
The segmentation performance was evaluated using mIoU, Pixel Accuracy, Mean Accuracy, and per-class IoU. These metrics were used to compare the ability of different models to identify the twelve design element categories. Based on the comparative results, DeepLabv3+ achieved the best overall segmentation performance and was therefore adopted as the final segmentation model for generating predicted masks in the subsequent design feature quantification stage.
In this study, DeepLabv3+ was selected as the segmentation component of the IDESQ Framework because it achieved the best overall performance among the evaluated models. The term IDESeg-Net is used only as a functional name for this segmentation component within the overall workflow and does not denote a newly proposed network architecture. The methodological contribution of the IDESQ Framework lies in integrating design-oriented label re-mapping, semantic segmentation, and quantitative spatial feature extraction into a unified analytical workflow.
2.4. Interior Design Feature Quantification
After obtaining twelve-class design element masks, the next step of the IDESQ Framework was to transform pixel-level semantic information into quantitative interior design features. This step was designed to bridge semantic segmentation and indoor environmental design analysis. Instead of using segmentation masks only as visual outputs, the proposed framework further converts them into interpretable indicators that describe the composition, complexity, and spatial distribution of interior design elements.
Let
M denote a twelve-class design element mask, where each valid pixel belongs to one of the twelve design element categories
, and pixels labeled as 255 are excluded from feature calculation. For each image, the valid pixel set is defined as
, and the number of valid pixels is denoted as
. The area proportion of each design element category was calculated as:
Based on the twelve category-level proportions, several higher-level design indicators were further defined to describe the functional and perceptual characteristics of indoor spaces. Furniture density was calculated by summing the proportions of seating furniture, tables and work surfaces, storage furniture, and sleeping furniture. The functional facility ratio was calculated from kitchen facilities, sanitary facilities, and lighting and functional equipment. In addition, soft decoration ratio, decorative object ratio, and greenery ratio were calculated from their corresponding design element categories.
The main design indicators were defined as follows:
To characterize the visual complexity of indoor spaces, Shannon entropy was calculated based on the distribution of the twelve design element categories [
26,
27,
28]. The entropy value was normalized by the maximum possible entropy under twelve categories, making the complexity indicator comparable across different images and scene categories:
where
H denotes the Shannon entropy,
denotes the normalized visual complexity entropy,
is a small positive constant used to avoid numerical instability when
, and log denotes the natural logarithm. In the subsequent analysis, eight main design indicators were reported, including spatial envelope ratio, opening ratio, furniture density, functional facility ratio, soft decoration ratio, decorative object ratio, greenery ratio, and normalized visual complexity entropy. These indicators correspond to
,
,
,
,
,
,
, and
, respectively.
In addition to area-based composition features, spatial distribution features were extracted to describe the location patterns of design elements within each image. For each design element category, the normalized centroid coordinates were calculated when the corresponding pixels were present. Let
denote the pixel coordinate of
p, and let
denote the pixel set of category
c. The normalized centroid was calculated as:
where
W and
H denote the image width and height, respectively.
To further describe vertical and horizontal layout tendencies, each image was divided into three vertical regions, namely upper, middle, and lower regions, and three horizontal regions, namely left, center, and right regions. For each design element category or element group, the pixel proportions located in these regions were calculated. This allowed the proposed framework to quantify not only how much of each design element existed in a scene, but also where these elements were spatially distributed.
For scene-level analysis, image-level design features were aggregated according to indoor scene categories. The mean and standard deviation of each feature were calculated for each scene category, enabling quantitative comparison of interior design characteristics across bedrooms, living rooms, bathrooms, kitchens, dining rooms, conference rooms, offices, and corridors. These scene-level descriptors provide the basis for interpreting spatial design patterns in
Section 3.
The same feature extraction procedure was applied to both ground-truth masks and predicted masks. Ground-truth-mask-derived features were used to characterize the design composition of different indoor scenes, whereas predicted-mask-derived features were used to evaluate whether the trained segmentation model could support automatic design feature extraction in practical image-based analysis.
2.5. Evaluation Metrics and GT–Pred Consistency Analysis
The evaluation of the proposed IDESQ Framework consisted of two parts. First, the pixel-level semantic segmentation performance was evaluated to determine whether interior environmental design elements could be accurately identified from indoor scene images. Second, the consistency between design features extracted from ground-truth masks and predicted masks was analyzed to determine whether segmentation outputs could reliably support subsequent spatial design feature quantification.
For semantic segmentation evaluation, pixels labeled as 255 were treated as ignored pixels and were excluded from all metric calculations. The segmentation performance was evaluated using Intersection over Union (IoU), mean Intersection over Union (mIoU), Pixel Accuracy (PA), Mean Accuracy (MeanAcc), and per-class IoU. For each design element category
c, IoU was calculated as:
where
,
, and
denote the true-positive, false-positive, and false-negative pixels of category
c, respectively.
The mIoU was calculated as the average IoU across the twelve interior environmental design element categories:
where
denotes the number of design element categories.
Pixel Accuracy was used to measure the proportion of correctly classified valid pixels among all valid pixels:
Mean Accuracy was calculated by averaging the class-wise pixel accuracy:
In addition to segmentation metrics, a GT–Pred consistency analysis was conducted to evaluate whether predicted masks could support reliable design feature quantification. For each image, the same feature extraction procedure was applied to the ground-truth mask and the predicted mask. Let denote a design feature extracted from the ground-truth mask of the i-th image, and let denote the corresponding feature extracted from the predicted mask. The discrepancy between and was evaluated using mean absolute error (MAE), root mean square error (RMSE), Pearson correlation coefficient, Spearman correlation coefficient, and coefficient of determination ().
The MAE and RMSE were calculated as:
where
N denotes the number of evaluated images.
Pearson correlation was used to measure the linear consistency between ground-truth-derived and prediction-derived features:
where
and
denote the mean values of
and
, respectively.
Spearman correlation was used to evaluate the rank-order consistency between the two sets of features:
The coefficient of determination was calculated as:
The GT–Pred consistency analysis was performed at two levels. At the image level, design features extracted from each predicted mask were directly compared with those extracted from the corresponding ground-truth mask. This evaluation reflects the feature estimation error for individual images. At the scene level, image-level features were first averaged within each indoor scene category, and the resulting scene-level mean features were then compared between ground-truth masks and predicted masks. This evaluation was used to assess whether prediction-derived features could preserve the overall design patterns of different indoor scene categories.
This two-level consistency evaluation is important because the objective of the proposed framework is not limited to pixel-level segmentation accuracy. More importantly, the framework aims to determine whether automatically predicted masks can be used to extract meaningful and stable design indicators for indoor spatial analysis. Therefore, the GT–Pred consistency analysis provides methodological support for using segmentation-derived features in subsequent interpretation of interior environmental design patterns.
3. Results
3.1. Design Element Re-Mapping Results and Scene-Wise Composition
Based on the twelve-class design element system defined in
Table 2, the original ADE semantic annotations were re-mapped into design-oriented pixel-level masks.
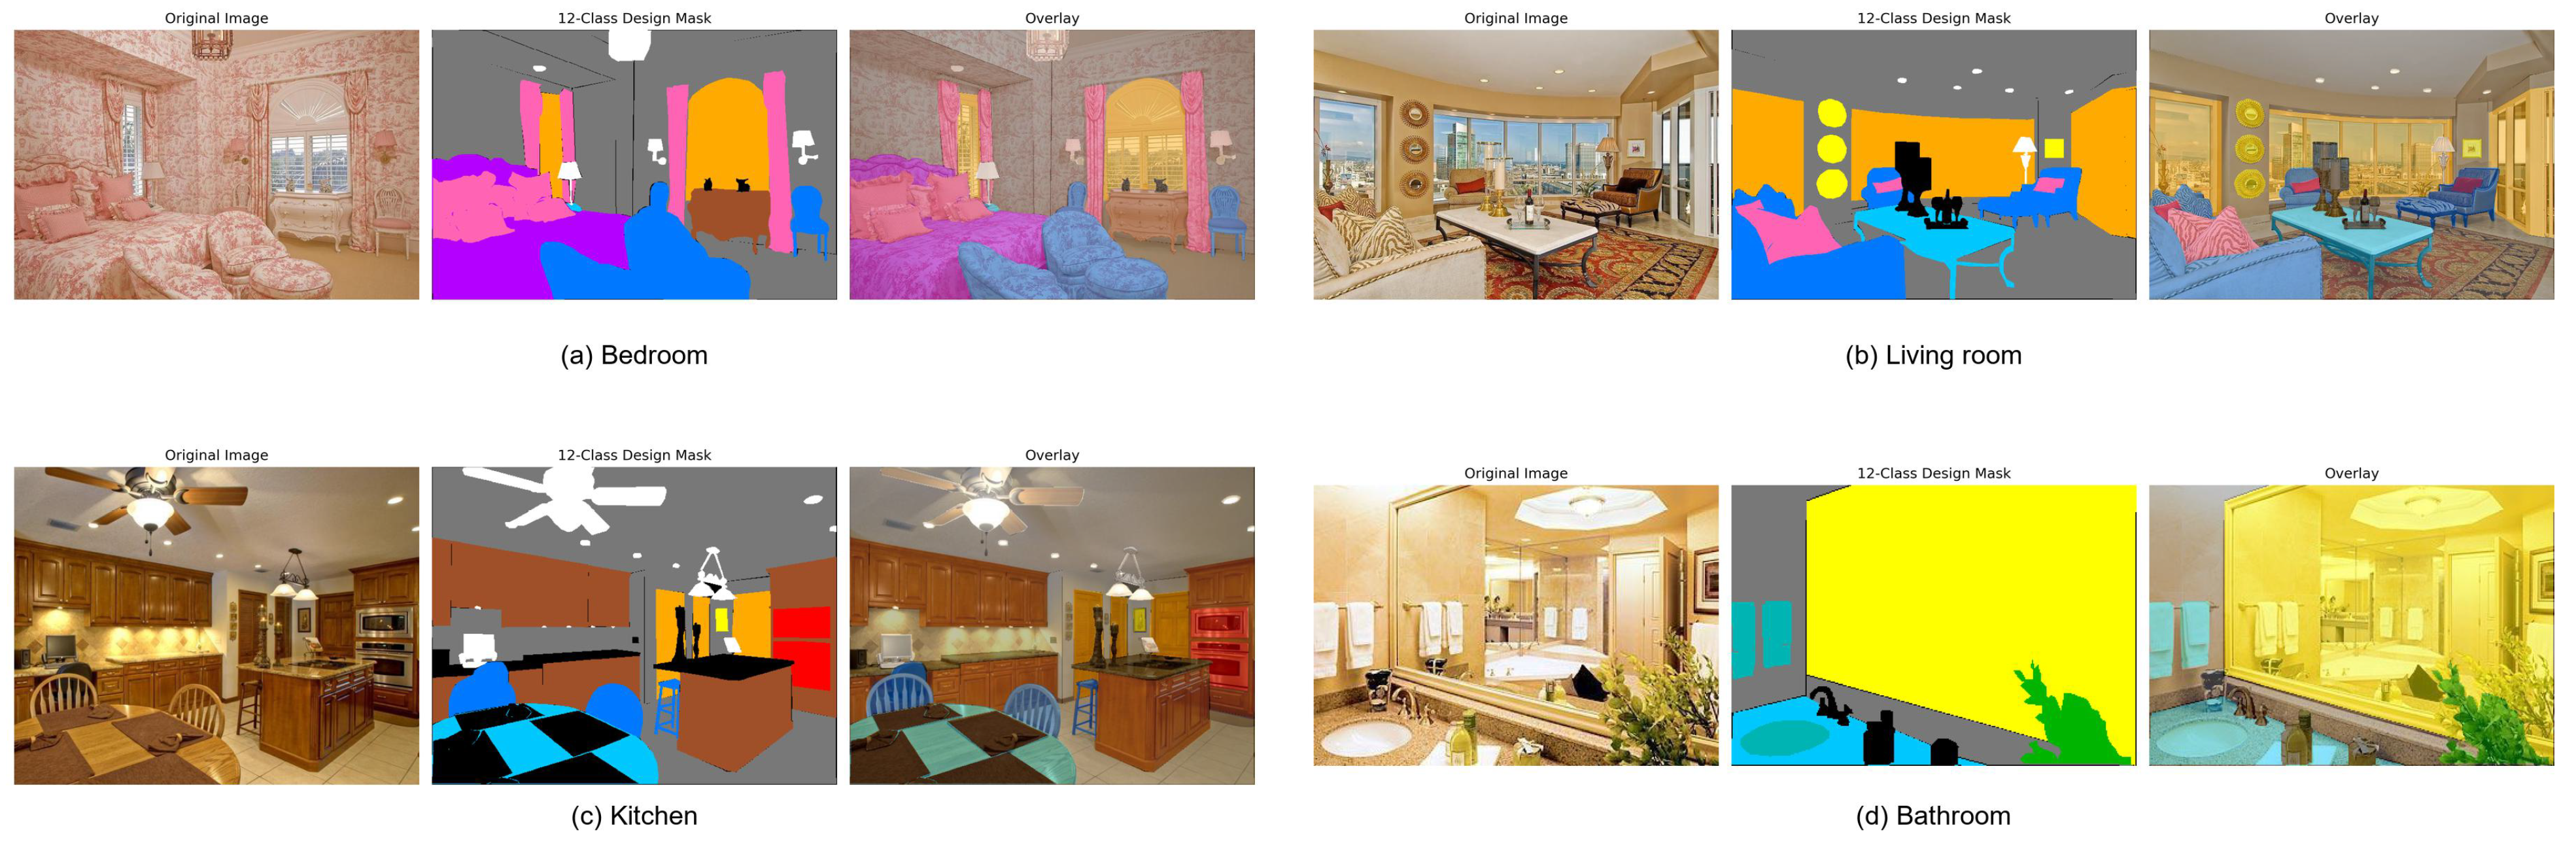
Figure 2 presents four representative examples from bedroom, living room, kitchen, and bathroom scenes. For each case, the original indoor image, the generated twelve-class design mask, and the overlay visualization are shown together. The results indicate that the proposed re-mapping strategy can transform general-purpose semantic labels into visually interpretable interior environmental design element masks, while preserving the spatial correspondence between design elements and their positions in the original scenes.
The pixel-level coverage of the proposed twelve design element categories is summarized in
Table 3. Among all valid semantic pixels in the ADEIndoorDesignSubset, the twelve proposed interior environmental design element categories cover approximately 99.02%, while only 0.98% of pixels are assigned to Other/Non-Design. This result provides quantitative evidence that the proposed category system captures the majority of semantically meaningful indoor visual elements and is therefore suitable for subsequent segmentation and design feature quantification.
Spatial Envelope accounts for the largest proportion of pixels, reaching 48.27%, which is consistent with the fact that walls, floors, ceilings, and columns form the dominant visual structure of indoor environments. Furniture-related categories, including Seating Furniture, Tables & Work Surfaces, Storage Furniture, and Sleeping Furniture, also occupy substantial proportions, reflecting the important role of furniture in defining indoor functional layouts. In contrast, Greenery Elements and Lighting & Functional Equipment show relatively smaller pixel proportions, which is reasonable because these elements usually appear as smaller or more localized objects in indoor scenes.
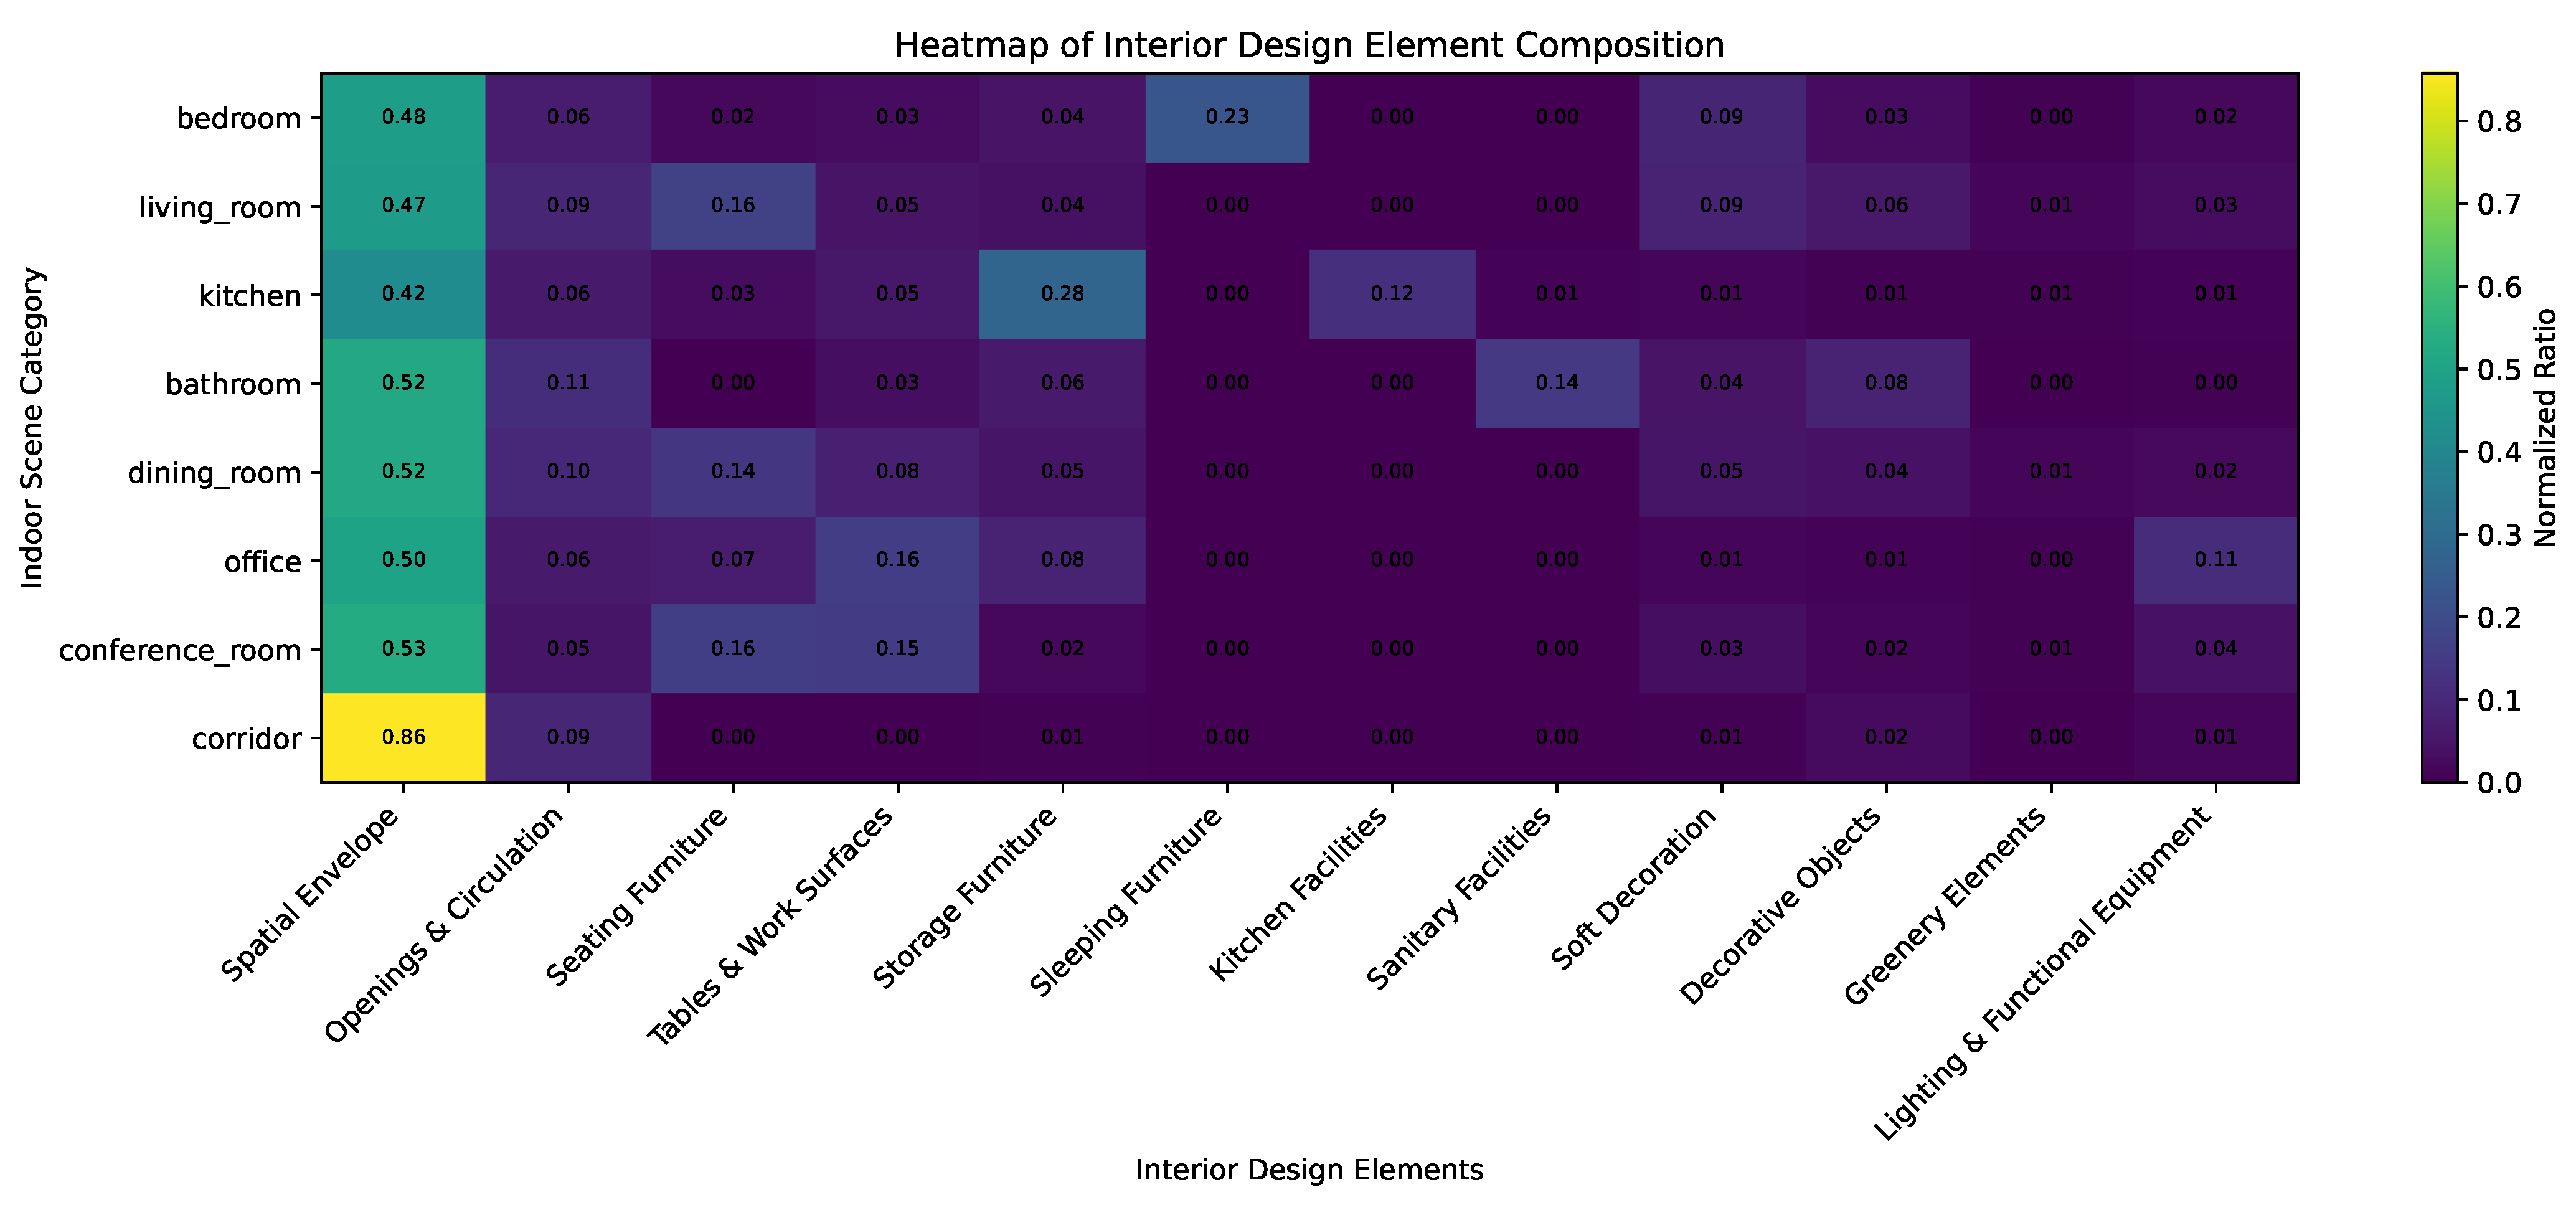
To further examine whether the re-mapped design element categories can reflect scene-specific interior design characteristics, the composition of the twelve design element categories was analyzed across the eight selected indoor scene categories. As shown in
Figure 3, different indoor scenes exhibit distinct design element distributions. Corridor scenes are dominated by Spatial Envelope, indicating their strong enclosure and circulation-oriented spatial characteristics. Kitchen scenes show higher proportions of Storage Furniture and Kitchen Facilities, while bathroom scenes have a higher Sanitary Facilities ratio. Living room and dining room scenes contain more Seating Furniture, Soft Decoration, and Decorative Objects, reflecting their stronger furnishing and decorative characteristics.
These results indicate that the proposed twelve-class re-mapping strategy is not only able to achieve high pixel-level coverage, but also capable of preserving meaningful differences among indoor scene categories. Therefore, the re-mapped annotations provide an appropriate semantic basis for the following segmentation experiments and for quantitative analysis of interior environmental design patterns.
3.2. Semantic Segmentation Performance
Table 4 compares the performance of four semantic segmentation models on the twelve-class interior environmental design element segmentation task. Among the evaluated models, DeepLabv3+ achieved the best overall performance, with an mIoU of 0.494, a Pixel Accuracy of 0.755, and a Mean Accuracy of 0.661. PSPNet obtained the second-best performance, while U-Net showed slightly lower segmentation accuracy. SegFormer-B0 performed noticeably worse under the current experimental setting.
These results indicate that DeepLabv3+ is more suitable for the proposed interior design element segmentation task. The advantage of DeepLabv3+ may be attributed to its ability to capture multi-scale contextual information, which is important for indoor scenes containing both large structural regions and smaller object-level design elements. Therefore, DeepLabv3+ was selected as the final segmentation model in the IDESQ Framework and was used to generate predicted masks for subsequent design feature quantification.
The per-class segmentation performance of DeepLabv3+ is shown in
Table 5. Spatial Envelope achieved the highest IoU of 0.742, followed by Sleeping Furniture with an IoU of 0.714. These categories usually occupy relatively large and visually coherent regions, making them easier to identify. Several furniture- and facility-related categories, such as Seating Furniture, Storage Furniture, Sanitary Facilities, and Openings & Circulation, achieved moderate IoU values, indicating that the model was able to capture their main spatial extents but still faced challenges in boundary precision and object-level variation.
In contrast, Lighting & Functional Equipment, Soft Decoration, and Tables & Work Surfaces obtained relatively lower IoU values. These categories often contain small objects, thin structures, diverse appearances, or partial occlusions, which increases the difficulty of pixel-level segmentation. This result suggests that although DeepLabv3+ provides the best overall performance, fine-grained segmentation of small and visually diverse design elements remains challenging.
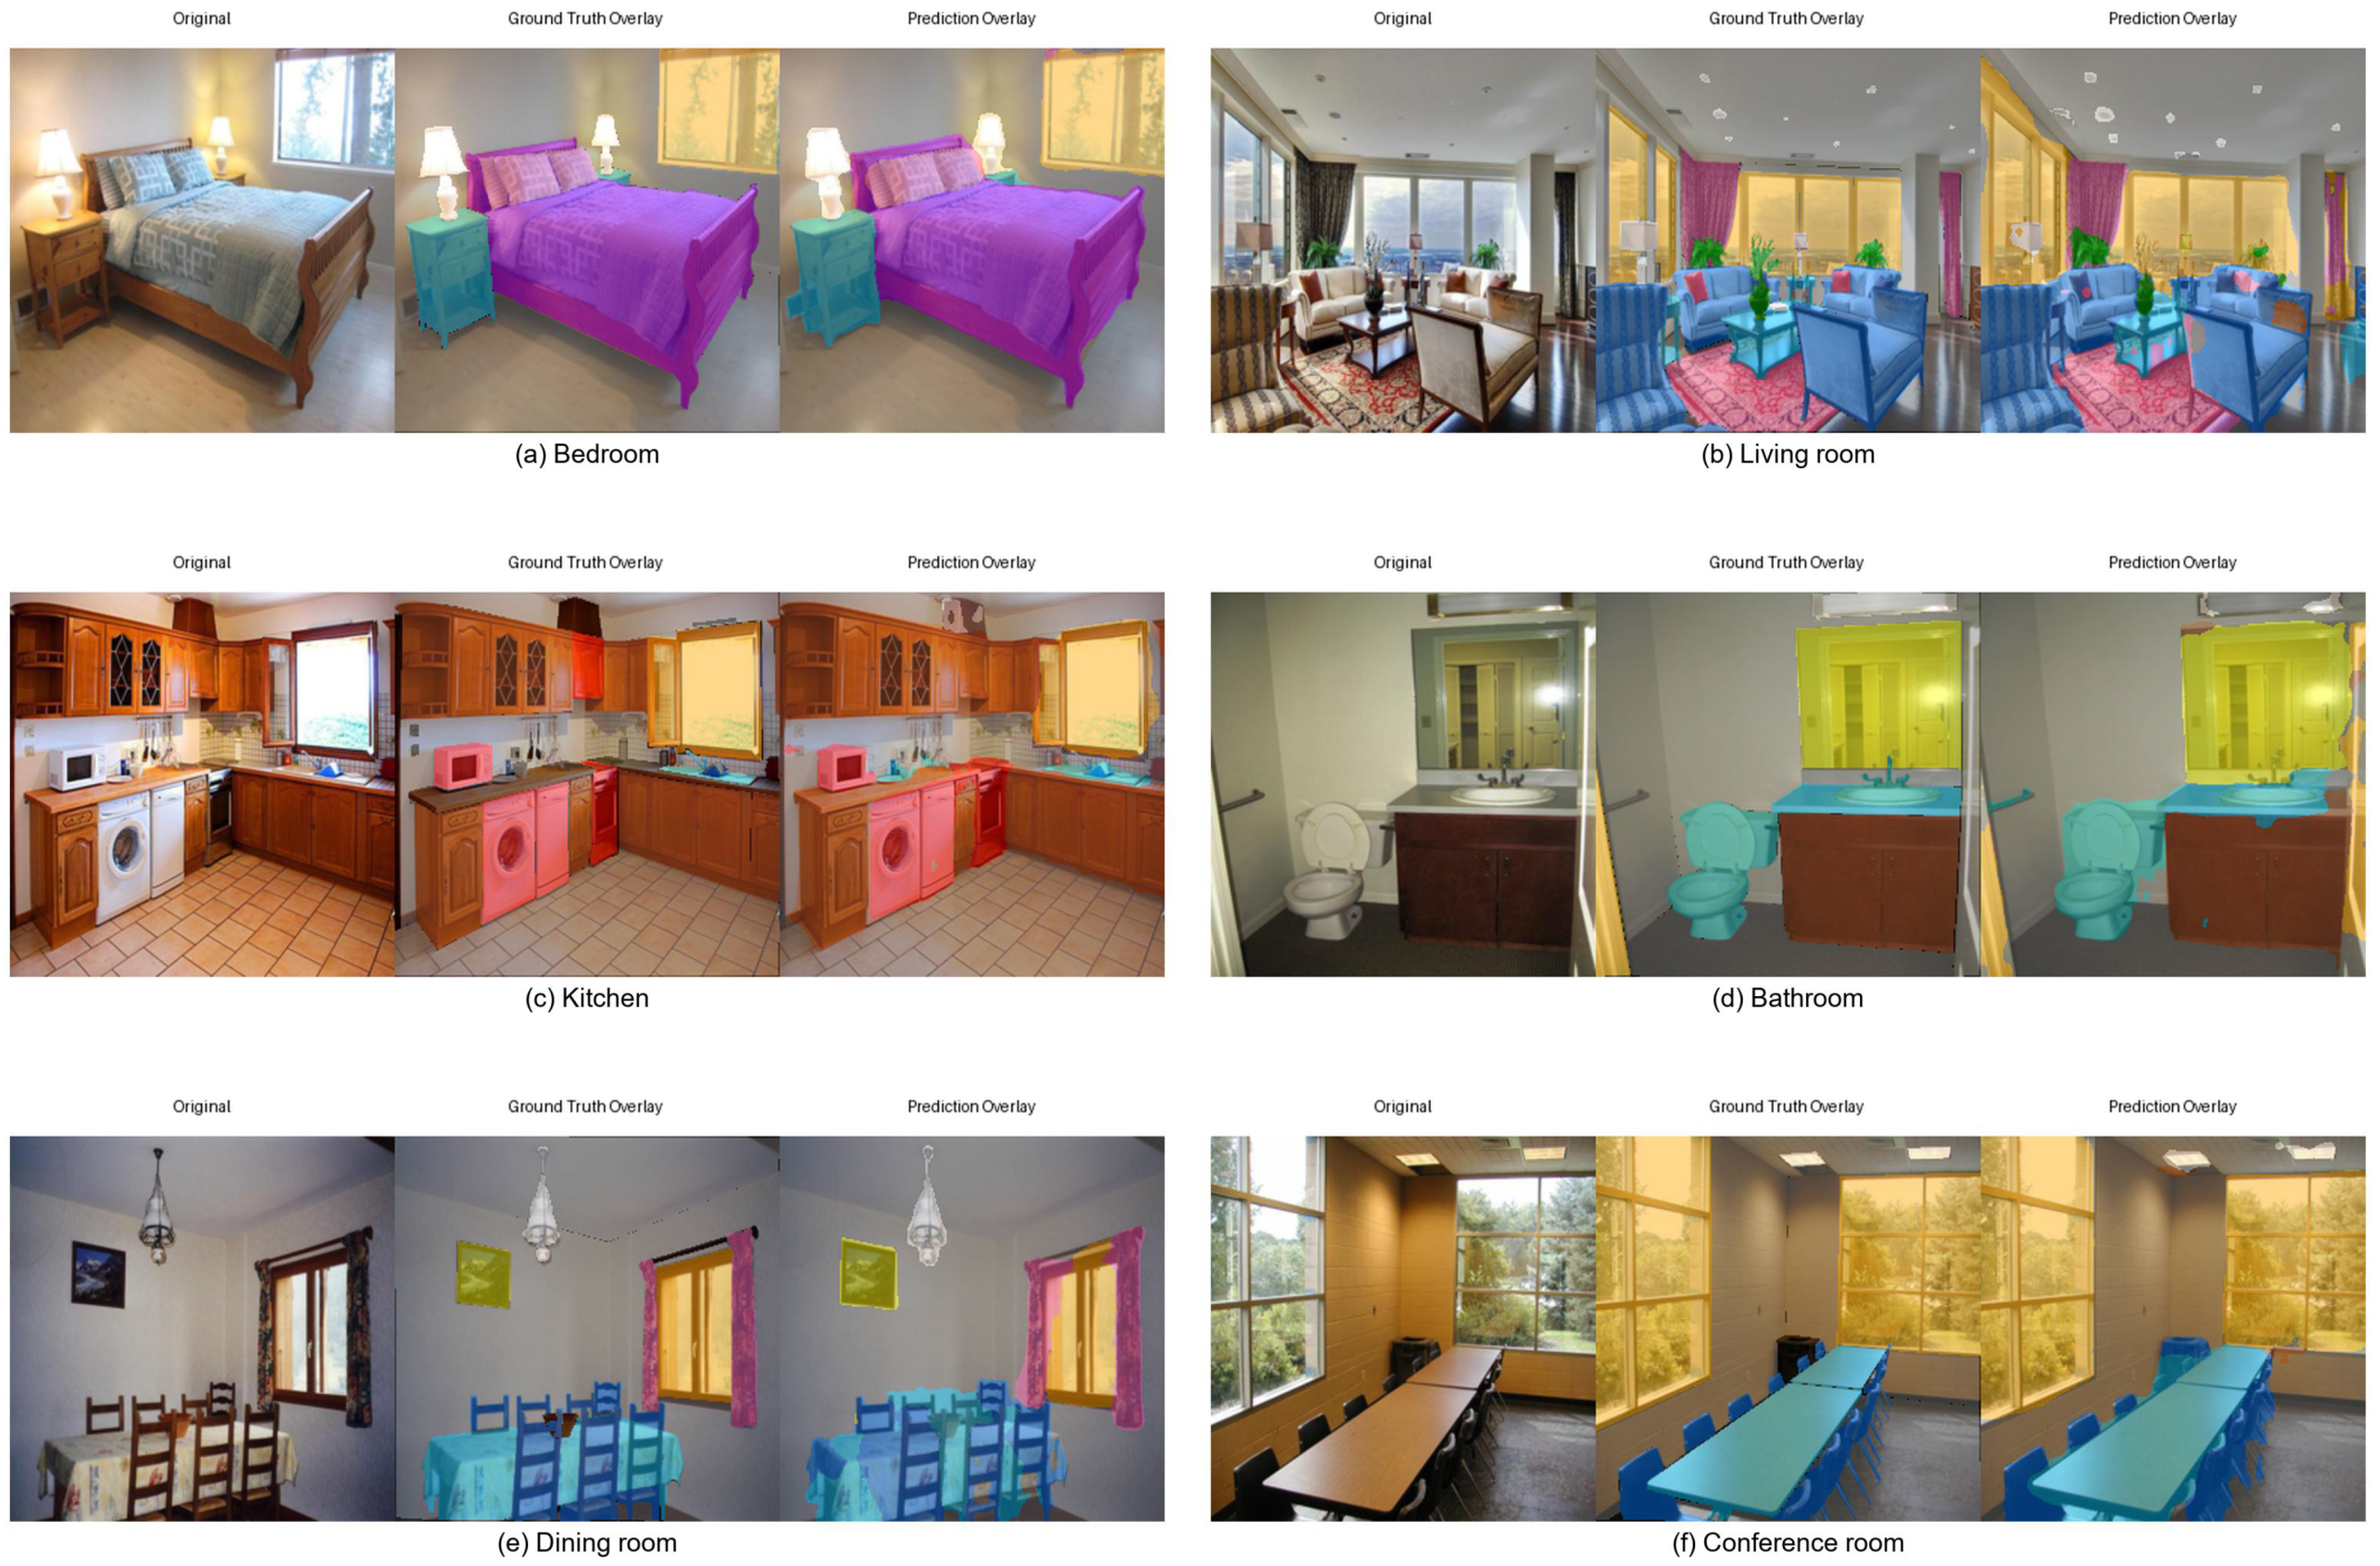
Figure 4 presents representative segmentation visualization results of DeepLabv3+ across six indoor scene categories. The prediction overlays are generally consistent with the ground-truth overlays for major design elements, including spatial envelopes, furniture regions, kitchen facilities, sanitary facilities, and decorative elements. The visual results further support the quantitative findings, showing that the selected model can produce interpretable design element masks for different indoor scenes.
Overall, the semantic segmentation results demonstrate the feasibility of automatically extracting interior environmental design elements from indoor scene images. More importantly, the predicted masks generated by DeepLabv3+ provide the necessary pixel-level basis for subsequent spatial feature quantification and scene-level interior design pattern analysis.
3.3. Generalization Evaluation of DeepLabv3+
To further evaluate the robustness of the selected segmentation model, DeepLabv3+ was tested on the original ADE validation subset, which was not involved in model training, validation, testing, or hyperparameter selection. As shown in
Table 6, the internal test split contained 638 images, while the independent ADE validation subset contained 428 images.
The segmentation performance on the original ADE validation subset was highly consistent with that on the internal test split. Specifically, DeepLabv3+ achieved an mIoU of 0.495, a Pixel Accuracy of 0.756, and a Mean Accuracy of 0.659 on the independent validation subset, compared with 0.494, 0.755, and 0.661 on the internal test split, respectively. The small differences between the two evaluation settings indicate that the model did not show obvious performance degradation when applied to unseen validation images from the original ADE dataset.
This result provides additional evidence for the reliability of DeepLabv3+ as the segmentation component of the proposed IDESQ Framework. Since the independent validation subset was separated from the model development process, the comparable performance indicates that the model maintained stable performance on unseen images from the same ADE dataset. Therefore, the predicted masks generated by DeepLabv3+ can be used as a stable basis for the subsequent automatic quantification of interior design features.
3.4. Quantitative Analysis of Interior Design Features
In this section, GT-mask-derived features are first used to describe reference scene-level design patterns, while prediction-mask-derived spatial distribution features are then presented to demonstrate the automatic application capability of the proposed framework. Based on the twelve-class design element masks, the proposed IDESQ Framework further quantified the composition and spatial characteristics of indoor environmental design elements.
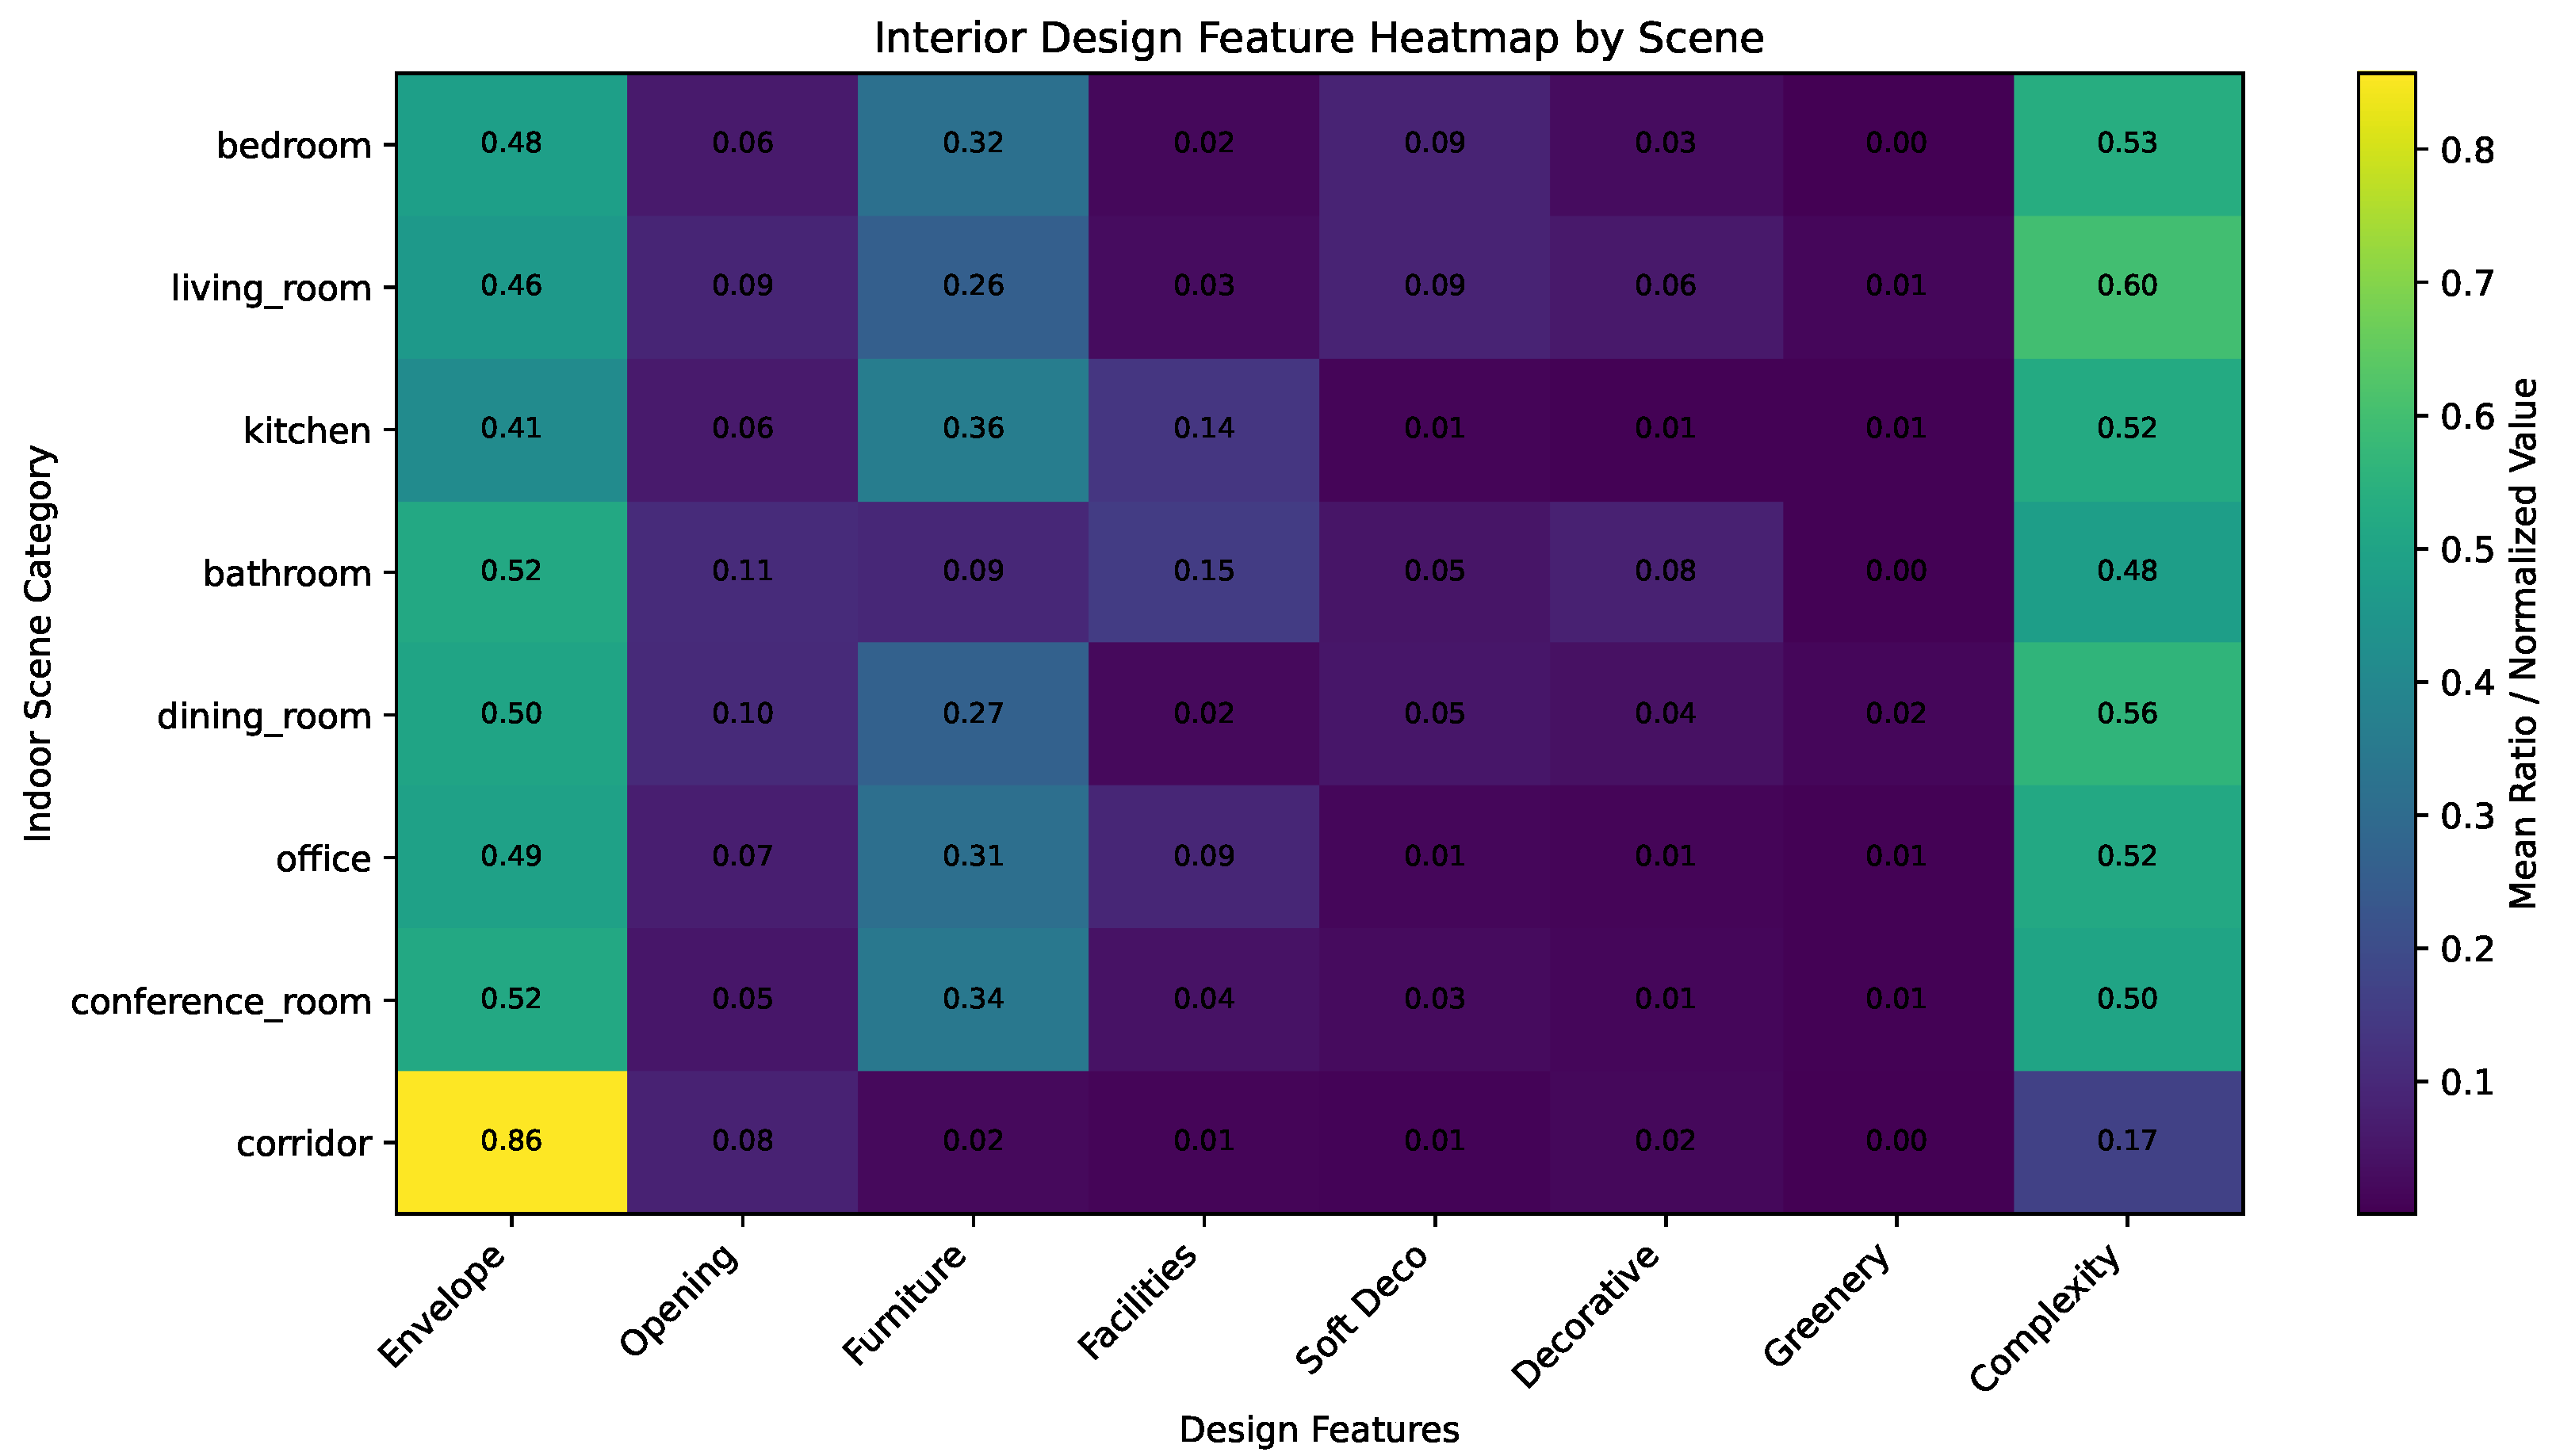
Table 7 reports the major design features extracted from GT masks across the eight indoor scene categories, including spatial envelope ratio, opening ratio, furniture density, functional facility ratio, soft decoration ratio, decorative object ratio, greenery ratio, and normalized visual complexity entropy.
Figure 5 further visualizes the scene-wise differences in these design features.
The results show that corridor scenes have the most distinctive feature profile. The spatial envelope ratio of corridor scenes reaches 0.857, which is substantially higher than that of other indoor scene categories. In contrast, their furniture density, functional facility ratio, greenery ratio, and visual complexity are all relatively low, with the normalized visual complexity entropy being only 0.167. This indicates that corridor spaces are mainly composed of enclosing surfaces such as walls, floors, and ceilings, while containing fewer movable furniture, decorative elements, and functional objects. This pattern is consistent with the circulation-oriented function and relatively simple spatial organization of corridor environments.
Kitchen and bathroom scenes present stronger functional characteristics. Kitchen scenes show the highest furniture density, with a value of 0.363, as well as a relatively high functional facility ratio of 0.137. This reflects the presence of cabinets, counters, kitchen appliances, and other equipment related to cooking and storage activities. Bathroom scenes show the highest functional facility ratio, reaching 0.153, which corresponds to the dominant presence of sanitary facilities such as toilets, sinks, bathtubs, and related bathroom elements. These results demonstrate that the proposed design feature indicators can capture functional differences among service-oriented indoor spaces.
Living room and dining room scenes exhibit more diverse and visually rich design compositions. Living room scenes have the highest normalized visual complexity entropy, with a value of 0.598, and also show relatively high proportions of soft decoration, decorative objects, and greenery. This suggests that living rooms usually contain richer furnishing and decorative configurations, which are closely related to comfort, social interaction, and visual expression. Dining room scenes also show relatively high furniture density and opening ratio, reflecting their dependence on tables, chairs, and spatial openness for dining activities.
Bedroom, office, and conference room scenes show intermediate feature patterns. Bedroom scenes are characterized by a relatively high furniture density and soft decoration ratio, which is consistent with the presence of beds, bedding, curtains, and other soft furnishing elements. Office and conference room scenes contain relatively high furniture densities, reflecting the presence of desks, tables, chairs, and work-related furniture. Compared with living rooms, however, these spaces generally show lower levels of decorative objects and visual complexity, indicating a stronger functional orientation.
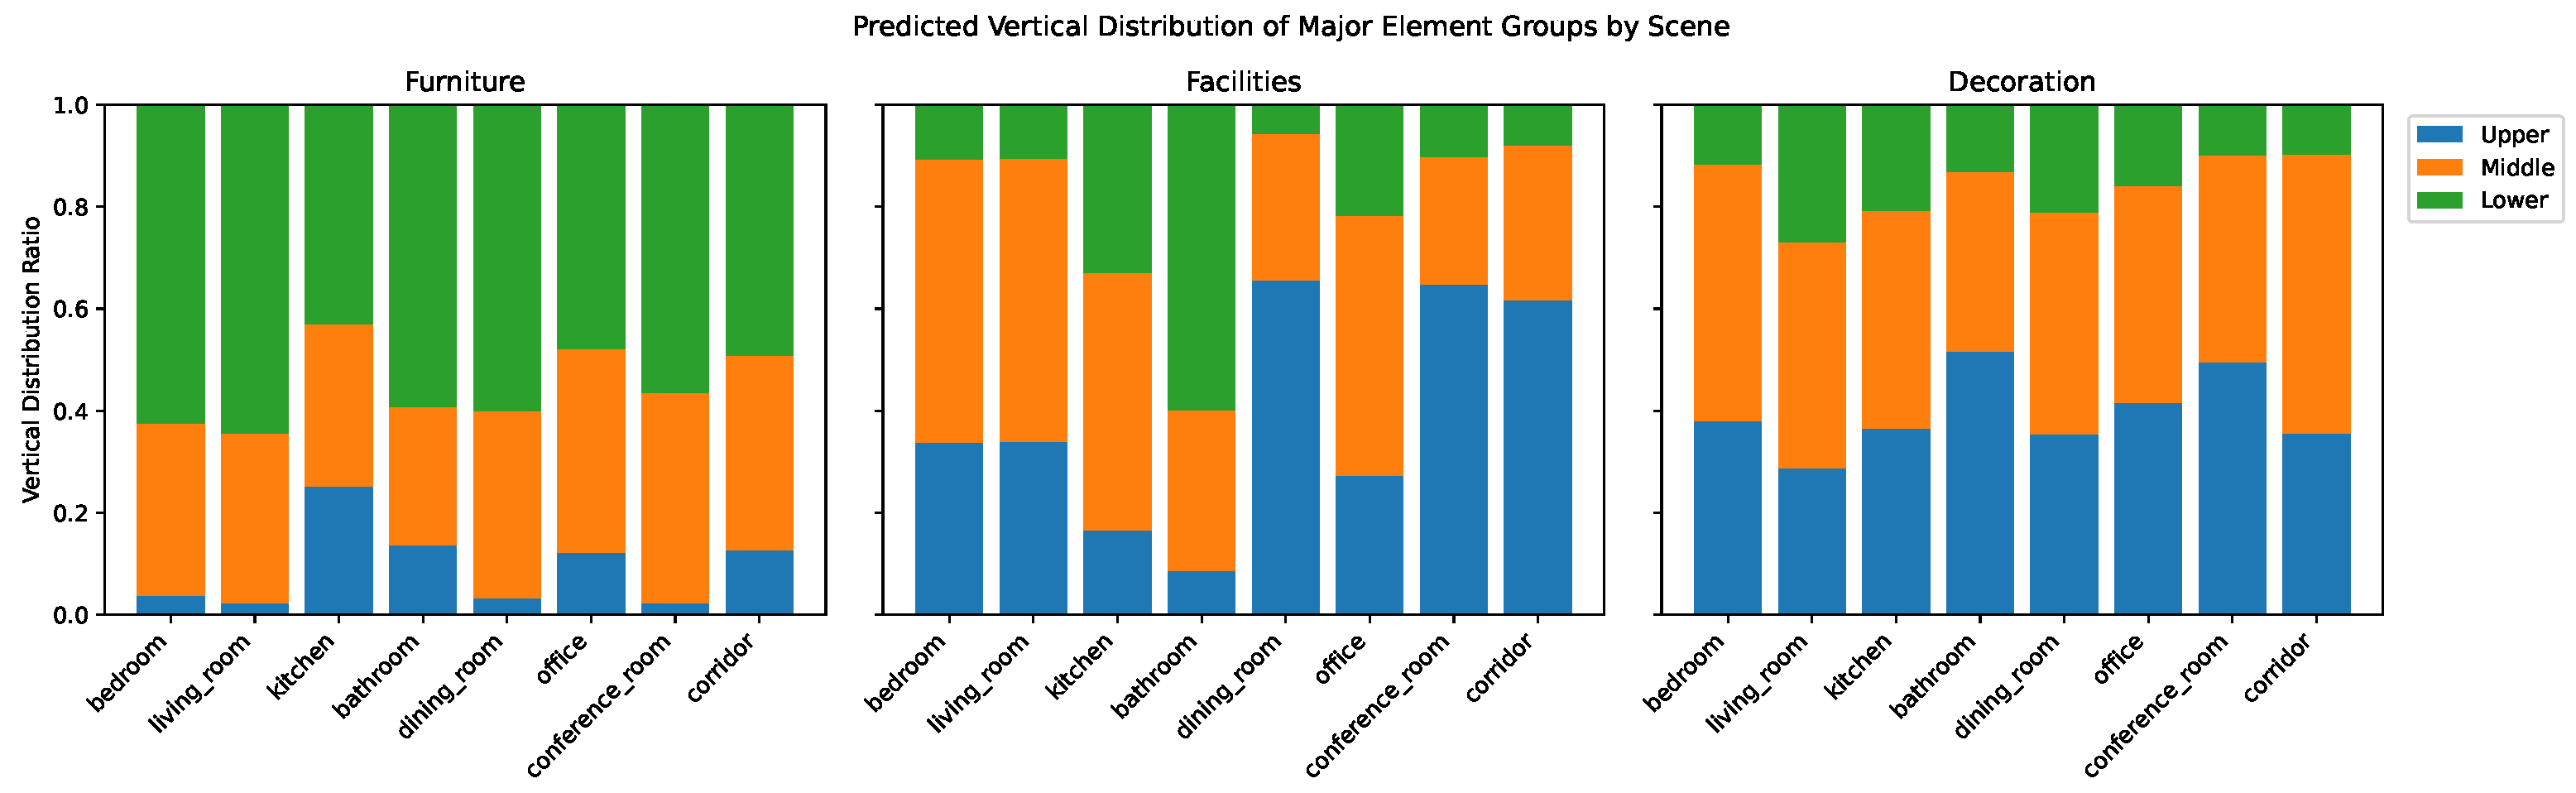
In addition to composition-based design features, the proposed framework also quantified the spatial distribution of major design element groups from predicted masks.
Figure 6 shows the predicted vertical distribution of furniture, facilities, and decoration across the eight indoor scene categories. Furniture elements are mainly distributed in the middle and lower regions of indoor images, which is consistent with their physical placement near floors and human activity zones. Facilities show more scene-dependent vertical patterns, reflecting differences between kitchen, bathroom, office, and circulation-related spatial functions. Decorative elements tend to appear in both upper and middle regions, corresponding to wall-mounted, suspended, or visually exposed decorative objects.
Overall, the quantitative design feature results demonstrate that the IDESQ Framework can transform pixel-level design element masks into interpretable spatial indicators. These indicators not only quantify how much of each design-related element exists in different indoor spaces, but also reveal how these elements are organized spatially. Therefore, the proposed framework provides a data-driven basis for comparing and interpreting interior environmental design characteristics across different indoor scene categories.
3.5. GT–Pred Consistency of Design Feature Quantification
To further evaluate whether prediction-derived masks can support reliable interior design feature quantification, the design features extracted from GT masks and predicted masks were compared at both the image level and the scene level. As shown in
Table 8, the consistency was evaluated using MAE, RMSE, Pearson correlation, Spearman correlation, and
for both the main design indicators and all extracted design features.
At the per-image level, the prediction-derived design features showed moderate to strong consistency with the GT-mask-derived features. For the eight main design indicators, the MAE and RMSE were 0.038 and 0.062, respectively, with a Pearson correlation of 0.779 and a Spearman correlation of 0.765. For all twenty features, the MAE and RMSE were 0.031 and 0.054, respectively, and the Pearson and Spearman correlations were 0.775 and 0.750. These results indicate that although individual image-level predictions still contain segmentation errors, the extracted design features generally follow the same variation trends as those derived from GT masks.
A clear improvement was observed after aggregating image-level features into scene-level descriptors. For the eight main indicators, the scene-level MAE decreased to 0.016 and the RMSE decreased to 0.018, while the Pearson and Spearman correlations increased to 0.960 and 0.943, respectively. Similarly, for all twenty features, the scene-level MAE and RMSE were reduced to 0.011 and 0.013, and the Pearson correlation and reached 0.965 and 0.860. These results demonstrate that prediction-derived features are more stable and reliable when used for scene-level indoor design analysis than for individual image-level interpretation.
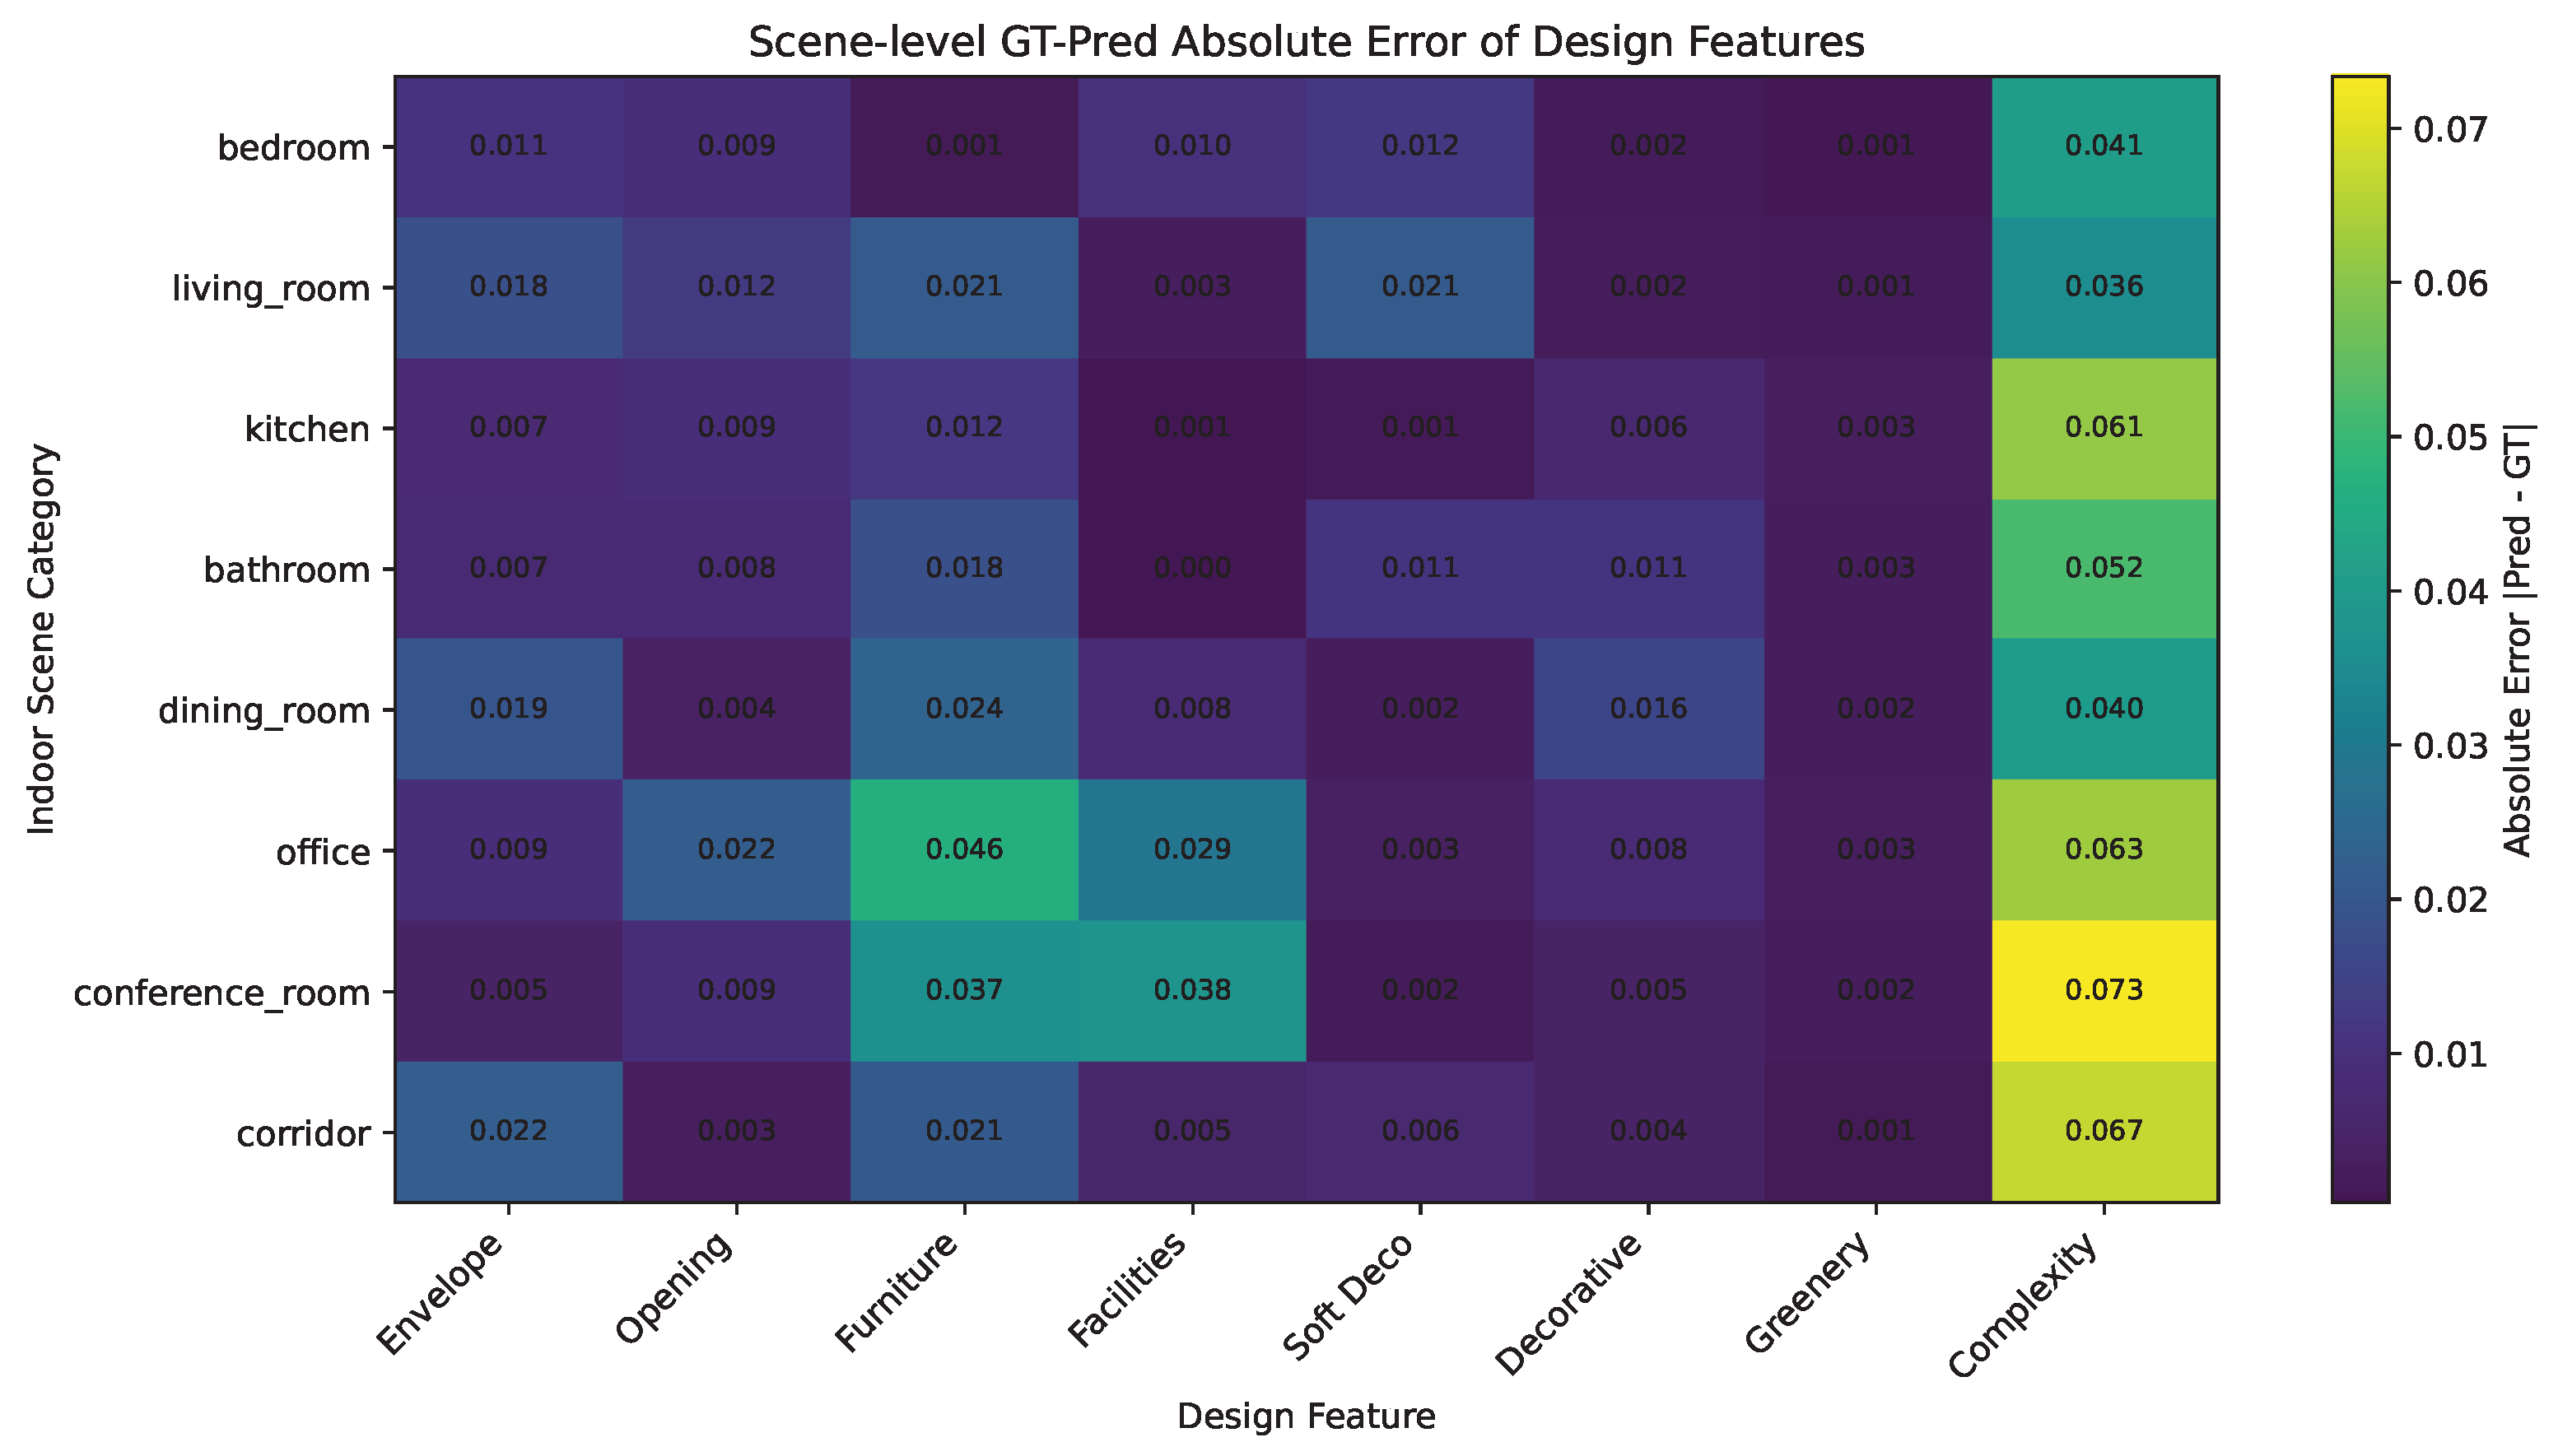
Figure 7 further shows the scene-level absolute error between GT-mask-derived and prediction-mask-derived design features. Most composition-related features, such as Envelope, Opening, Soft Decoration, Decorative, and Greenery, show relatively small errors across scene categories. Larger errors are mainly observed for Complexity and, in some scenes, Furniture and Facilities. This suggests that the model can more reliably recover area-based design composition features, whereas features related to visual complexity or object-level functional grouping are more sensitive to local segmentation errors.
Overall, the GT–Pred consistency results indicate that the proposed IDESQ Framework does not rely solely on pixel-perfect segmentation accuracy. Although prediction masks may introduce errors at the individual image level, their aggregated design features remain highly consistent with GT-derived features at the scene level. Therefore, the predicted masks generated by DeepLabv3+ can provide a reliable basis for automatic quantification and interpretation of interior environmental design patterns across indoor scene categories.
4. Discussion
This study proposed the IDESQ Framework to connect semantic segmentation with quantitative indoor environmental design analysis. Different from conventional scene parsing studies that mainly focus on pixel-level recognition accuracy, the proposed framework further transforms segmentation masks into interpretable spatial design indicators. In this sense, semantic segmentation is used not as the final objective, but as an intermediate tool for extracting measurable information about interior design element composition, visual complexity, and spatial distribution.
Recent studies have shown that image-based and segmentation-based methods can support quantitative analysis of built environments. For example, street-view studies have extracted visual elements such as greenery, sky, buildings, and street interfaces to evaluate urban perception, spatial quality, and environmental exposure [
5,
6,
8]. Building-related semantic segmentation has also been applied to indoor point clouds, Scan-to-BIM workflows, and facade parsing, mainly serving geometric reconstruction, object recognition, or building information extraction [
13,
14,
16]. In addition, recent residential and architectural design studies have introduced deep learning or visual perception analysis to support design evaluation [
2,
4]. Compared with these studies, the present work focuses on ordinary indoor scene images and reorganizes general semantic labels into design-oriented interior environmental elements. The main contribution is therefore not only the segmentation of indoor objects, but also the conversion of pixel-level masks into interpretable design indicators, such as furniture density, functional facility ratio, decorative composition, visual complexity, and spatial distribution. This extends the logic of segmentation-based environmental measurement from outdoor or building-object analysis to indoor environmental design pattern interpretation.
One important contribution of this study is the design-oriented re-mapping of the original ADE categories. The original ADE labels were developed for general semantic scene parsing and are not directly organized according to interior environmental design logic. By reorganizing them into twelve design element categories, the proposed label system provides a more interpretable semantic basis for indoor design analysis. The pixel distribution results show that these twelve categories cover 99.02% of valid indoor semantic pixels, indicating that the proposed category system captures most visually meaningful indoor design elements while keeping the label structure compact.
The segmentation experiments demonstrate that automatic extraction of interior design elements from ordinary indoor images is feasible. Among the compared models, DeepLabv3+ achieved the best overall performance and showed stable results on the independent ADE validation subset. The per-class results further indicate that large and spatially continuous elements, such as spatial envelope and sleeping furniture, are easier to segment, whereas small, diverse, or partially occluded elements, such as lighting equipment and soft decoration, remain more challenging. This suggests that the framework is currently more reliable for scene-level spatial composition analysis than for fine-grained object-level interpretation.
The design feature quantification results show that the extracted indicators can reflect meaningful differences among indoor scene categories. For example, corridor scenes are dominated by spatial envelope and have the lowest visual complexity, which corresponds to their circulation-oriented function. Kitchen and bathroom scenes show higher functional facility ratios, reflecting their service-oriented spatial characteristics. Living rooms present higher visual complexity and richer decorative elements, which is consistent with their role in social interaction and visual expression. These findings suggest that the proposed indicators can provide a quantitative basis for comparing indoor environmental design patterns across scene types.
The GT–Pred consistency analysis further supports the practical value of the framework. Although prediction-derived features still contain errors at the individual image level, their consistency with GT-derived features improves substantially after aggregation at the scene level. This indicates that the predicted masks generated by DeepLabv3+ can be used to support scene-level design feature quantification, especially when the research objective is to compare general spatial patterns rather than to inspect every object boundary in a single image. Therefore, the proposed framework has potential value for large-scale indoor image analysis, design pattern mining, and data-driven environmental design research.
Several limitations should also be acknowledged. First, the proposed dataset is derived from ADEChallengeData2016 rather than from a dataset specifically collected for professional interior design evaluation. Therefore, some design-related attributes, such as material, color, lighting quality, style, and user experience, are not explicitly modeled. Second, the twelve-category label system improves interpretability but inevitably simplifies the richness of real interior environments. Third, the current segmentation model still has difficulty with small objects and visually diverse categories. Future work may construct more design-specific datasets, integrate color-histogram and texture analysis to capture color, material, lighting, and style-related attributes, improve small-object segmentation through object-detection priors or multi-scale feature attention, and validate the proposed indicators with expert assessments or real design evaluation tasks.
5. Conclusions
This study proposed the Interior Design Element Segmentation and Spatial Quantification Framework, namely the IDESQ Framework, to transform ordinary indoor scene images into interpretable spatial design indicators. Based on ADEChallengeData2016, eight representative indoor scene categories were selected, and the original ADE semantic labels were reorganized into twelve interior environmental design element categories, covering 99.02% of valid indoor semantic pixels. Comparative experiments showed that DeepLabv3+ achieved the best segmentation performance among U-Net, DeepLabv3+, PSPNet, and SegFormer-B0, with an mIoU of 0.494, a Pixel Accuracy of 0.755, and a Mean Accuracy of 0.661 on the internal test split. The predicted masks were further converted into quantitative design indicators, including element area proportions, furniture density, functional facility ratio, soft decoration ratio, decorative object ratio, greenery ratio, visual complexity, and spatial distribution features. The results revealed distinct spatial design patterns across indoor scene categories, such as high spatial envelope ratio and low visual complexity in corridors, stronger functional facility characteristics in kitchens and bathrooms, and richer decorative and visually complex compositions in living rooms. Furthermore, the GT–Pred consistency analysis showed that prediction-derived features became more reliable after scene-level aggregation, with a scene-level MAE of 0.016, Pearson correlation of 0.960, and Spearman correlation of 0.943 for the eight main design indicators. These findings indicate that the proposed framework is more reliable for aggregated comparisons across indoor scene categories than for detailed interpretation of individual images. Overall, the IDESQ Framework provides an automated and reproducible approach for connecting semantic segmentation with quantitative scene-level analysis of interior environmental design elements.