1. Introduction
1.1. Research Background
In high-density cities, rail transit stations are not merely nodes within the transportation system, but also spaces where commercial development, pedestrian networks, and public life highly intersect. With the development of Transit-Oriented Development (TOD) theory, urban renewal, and station-city integration practices, the commercial spaces surrounding rail transit stations are no longer just ancillary spaces for transportation transfers. Instead, they have gradually evolved into composite public places integrating transit, shopping, dining, resting, rendezvous, social interaction, and urban image display. Particularly in large-scale rail hubs, underground commercial streets, and station-city integrated complexes, users frequently move continuously among subway entrances, underground passages, commercial atriums, escalator nodes, and public corridors. Their behavior encompasses not only rapid passage but also waiting, staying, consuming, observing, meeting, and interacting [
1].
Current rail transit design codes generally take passenger volume as the core quantitative evaluation criterion, which directly makes pedestrian movement efficiency the top priority in station planning and architectural layout. Nevertheless, complete urban place experience relies on users’ voluntary prolonged presence, so stay behavior serves as a vital indicator for evaluating place quality. However, in many rail-transit commercial space practices, design and operation still heavily emphasize pedestrian flow induction, commercial area, and transportation efficiency, paying insufficient attention to issues such as “how people stay,” “how spaces are used,” and “how traffic flows are transformed into place activities”. Some station commercial spaces have high foot traffic but lack public spaces for staying, legibility, and communication. Some underground connection spaces handle massive transfer flows, yet users’ willingness to stay remains low. Some commercial corridors possess good diversion functions but struggle to foster stable spatial memories and public life atmospheres. This indicates that the performance of rail-transit commercial spaces cannot be measured solely by the number of passing pedestrians, commercial area, or rental income. It is also necessary to examine users’ stay behavior, spatial use patterns, and the capacity to accommodate public life. Comprehensive assessment must incorporate users’ stay behavior, spatial use patterns and the capacity to support public life, which further justifies the necessity to rethink the design logic of transit-integrated commercial spaces.
This paper takes “rail-transit commercial circulation spaces” as its research object. The so-called rail-transit commercial circulation space refers to a composite pedestrian space system formed by relying on rail transit stations and commercial developments. This includes spaces connecting station halls to commerce, underground commercial streets, commercial atriums, public corridors, escalator nodes, entrance/exit transition spaces, and semi-public spaces connected to urban streets, plazas, and public buildings. Its core characteristic is that users do not just pass through unidirectionally, but repeatedly choose, circulate, and stay amidst transportation, commerce, and public activities. The core questions this paper focuses on are: Which spatial factors can promote the transformation of rail-transit commercial circulation spaces from “passing spaces” into “staying places”? What are the differences in spatial connection, place composition, and spatial configuration among cases in different countries and cities? And how do these differences affect how users utilize the space?
1.2. Research Questions
Based on the above background, this paper proposes three research questions:
RQ1: In rail-transit commercial circulation spaces, what spatial distributions and behavioral types characterize users’ stay behavior?
RQ2: How do C1 public transport connection, C2 space place composition, and C3 spatial configuration affect the number of staying users, stay ratio, and spatial use patterns?
RQ3: What are the differences between Chinese and Japanese rail-transit commercial circulation spaces regarding legibility, connection methods, resting facilities, commercial interfaces, and spatial publicness, and what implications do these differences offer for design optimization?
The objective of this paper is not simply to judge the superiority or inferiority of Chinese and Japanese commercial spaces, but to identify the spatial mechanisms influencing stay behavior in rail-transit commercial circulation spaces through case differences, and to propose actionable optimization directions for the design of station-city integrated commercial spaces. The focus of this paper is to derive strategies for improving the quality of public spaces through behavioral analysis methods.
1.3. Research Contributions
At present, existing research has yielded rich results in TOD in terms of transportation space, pedestrian flow, commercial and economic benefits, and other aspects. However, compared with existing research on transportation accessibility, pedestrian flow, and station area commerce, this study breaks through the long-standing research paradigm of TOD and station city integration that focuses solely on traffic efficiency. It expands the research from “traffic flow” to “stopping behavior transformation”, thus forming a new theoretical interpretation system of spatial form, pedestrian flow transformation, and place experience linkage, filling the gap in behavior transformation theory perspective in existing literature.
Against the extensive body of prior transit-oriented development and urban design scholarship that prioritizes circulation capacity and land-use economic returns, this paper further clarifies its unique niche within established research frameworks.
The contributions of this paper are mainly reflected in three aspects:
First, regarding the research object: This paper focuses on the rail-transit commercial circulation space—a composite spatial type possessing transit transfer, commercial consumption, and public stay attributes—differentiating it from traditional commercial space or pure transit transfer space studies.
Second, regarding the research content: This paper positions “stay behavior” as the core indicator for observing the utilization performance of rail-transit commercial circulation spaces, emphasizing that such spaces should not solely pursue transit efficiency but also focus on waiting, resting, interaction, and non-consumptive stays. This core argument empirically proves that high-quality station-city integrated environments must balance pedestrian mobility efficiency and comfortable, inclusive place-making experience, a critical complement to mainstream TOD and urban design discourse.
Third, regarding the methodology: This paper combines field observation, behavioral counting, questionnaire surveys, and spatial module analysis to explain the relationship between stay behavior and spatial use patterns from three levels: C1 public transport connection, C2 space place composition, and C3 spatial configuration.
Fourth, regarding the theory: A theoretical framework of “space perception response retention” and a behavioral chain of “identification retention consumption re movement” have been established, clarifying the theoretical mechanism of retention behavior.
Fifth, regarding the design practice: Suggestions have been put forward to enhance the vitality of China’s rail transit space retention.
3. Research Design and Methodology
3.1. Case Selection and Data Sources
This paper selects representative rail-transit commercial circulation spaces from Shanghai (China), Tokyo, and Nagoya (Japan) as research objects. Case selection followed three principles:
Cases should connect directly or indirectly to rail transit stations, possessing a strong foundation of transit passenger flows.
Cases should encompass composite functions, including commerce, transit, staying, and public activities.
Cases should have an observable circulation space structure, including underground passages, commercial streets, atriums, escalator nodes, entrance/exit transition spaces, or station-city connection spaces.
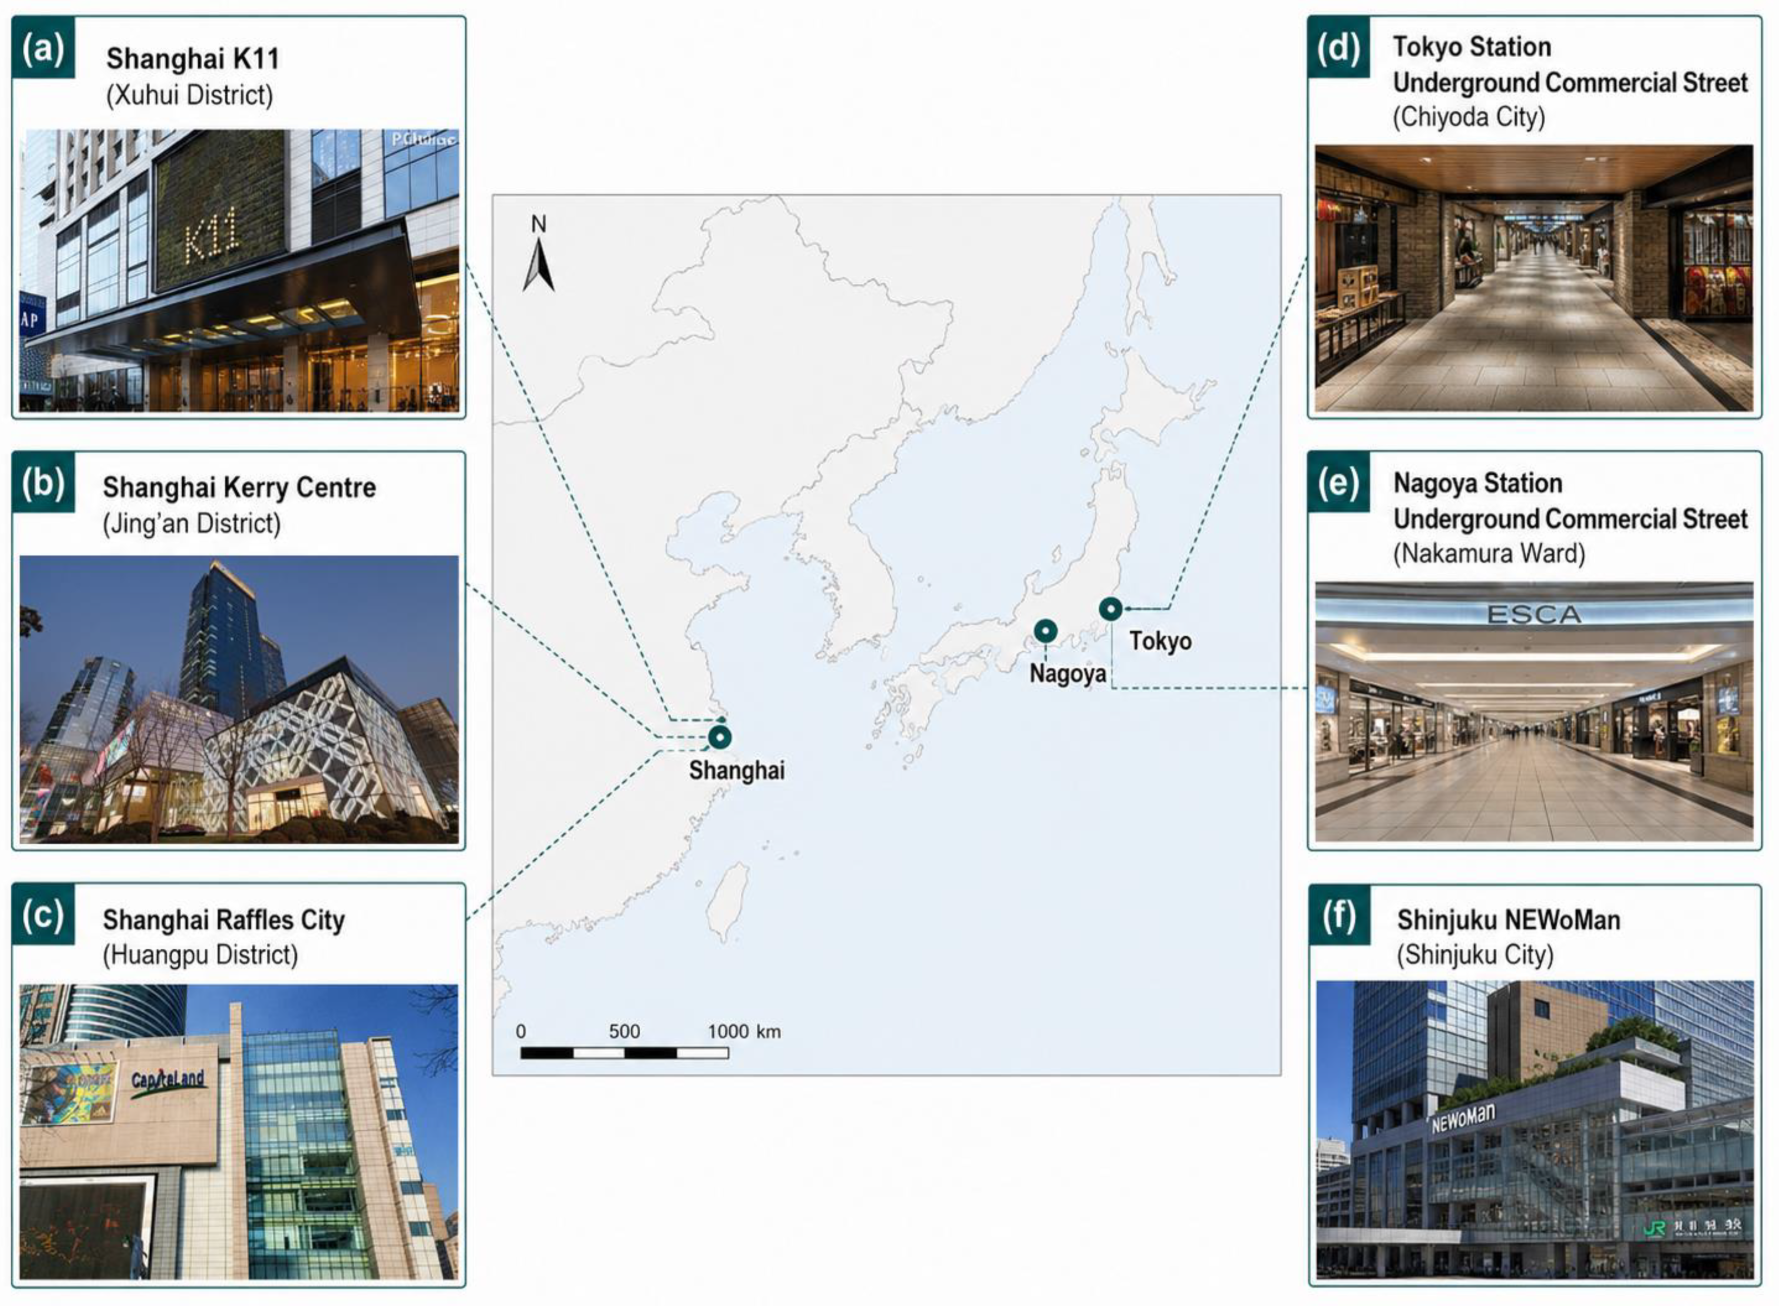
Chinese cases primarily utilize typical transit-connected commercial spaces in Shanghai, including Shanghai K11, Shanghai Kerry Centre, and Shanghai Raffles City. Japanese cases mainly include Nagoya Station, Tokyo Station, and Shinjuku NEWoMan, which are highly integrated station-city commercial spaces. These cases are comparable regarding transit connection, commercial integration, above/below-ground transitions, and public space utilization, while exhibiting differences in spatial organization maturity, resting facility configurations, and public stay conditions. This makes them suitable for comparing spatial mechanisms that transform passing flows into staying activities. In terms of scale, the research cases of China and Japan respectively selected spatial scales of approximately 5000 square meters, 10,000 square meters, and 15,000 square meters in three large, medium, and small areas, with an average daily transit flow of over 15,000 people. Through comprehensive horizontal and vertical comparisons, efforts were made to avoid research errors caused by differences in distance, size, and other factors (
Table 1).
The empirical materials for this paper include three categories:
Spatial module observation data: Following spatial integrity and behavior occurrence conditions, spaces were divided into modules such as metro interfaces, connection passages, atriums, escalator nodes, commercial interfaces, resting nodes, and entrance/exit transition spaces, to record instantaneous flows, passing flows, and number of staying users.
Time-grouped data: Observations were conducted on weekdays and weekends, across morning, noon, afternoon, and evening periods, to identify behavioral shifts under different time rhythms.
User questionnaire data: 300 questionnaires were collected from Chinese cases and 300 from Japanese cases to compare users’ evaluations of connection space legibility, diversion convenience, willingness to rest/interact, and stay experiences.
The spatial relationships and structural composition of the six case studies are schematically illustrated in
Figure 1, which establishes the comparative baseline for the Chinese and Japanese cases regarding urban location, station-city interfaces, and transit-commercial spatial typologies.
3.2. C1/C2/C3 Analytical Framework
This paper categorizes the factors influencing stay behavior in rail-transit commercial circulation spaces into three levels: C1 public transport connection, C2 space place composition, and C3 spatial configuration. C1 primarily explains “how transit flows enter commercial public spaces”. C2 explains “whether users have conditions to stay, rest, and interact”. C3 explains “how pedestrian flows distribute, circulate, and transfer within the space”. Together, they determine the probability of transforming a transit space into a staying place (
Table 2).
C1 public transport connection is mainly quantitatively compared and analyzed by observing the following three types of data in commercial migration space: 1. The number of stranded people and instantaneous flow of people inside the commercial space; 2. The commercial space can attract pedestrian flow data from the connected rail transit system; 3. The ratio of direct sexual traffic to purposeful traffic in commercial spaces. This dimension can quantify the metrics of retention rate and conversion rate, thereby enabling analysis of the impact on customer conversion.
C2 space place composition: correlation analysis is conducted between the instantaneous number of people stranded in the video shooting area of each spatial module as the dependent variable and the secondary observation content in the table above. This dimension quantifies the direct driving effect of site facilities and environmental factors on users’ willingness to stay.
C3 spatial configuration conducts correlation analysis on the spatial integration, visibility, number of courtyards, number of vertical traffic, and number of stranded individuals in the research case within the framework of spatial syntax. This dimension can analyze and judge the impact of spatial organization on lingering behavior, revealing how spatial layout determines the distribution patterns of staying activities [
24].
In this framework, stay behavior is seen as a crucial representation of the space’s utilization performance. The paper examines how C1, C2, and C3 collectively impact the number of staying users, instantaneous flow, passing flow, stay ratio, spatial legibility, and willingness to rest and interact. The three dimensions follow a progressive analytical logic: C1 defines the basic boundaries of passenger flow, C2 explains the strength of willingness to stay, and C3 describes the spatial distribution characteristics of staying behavior.
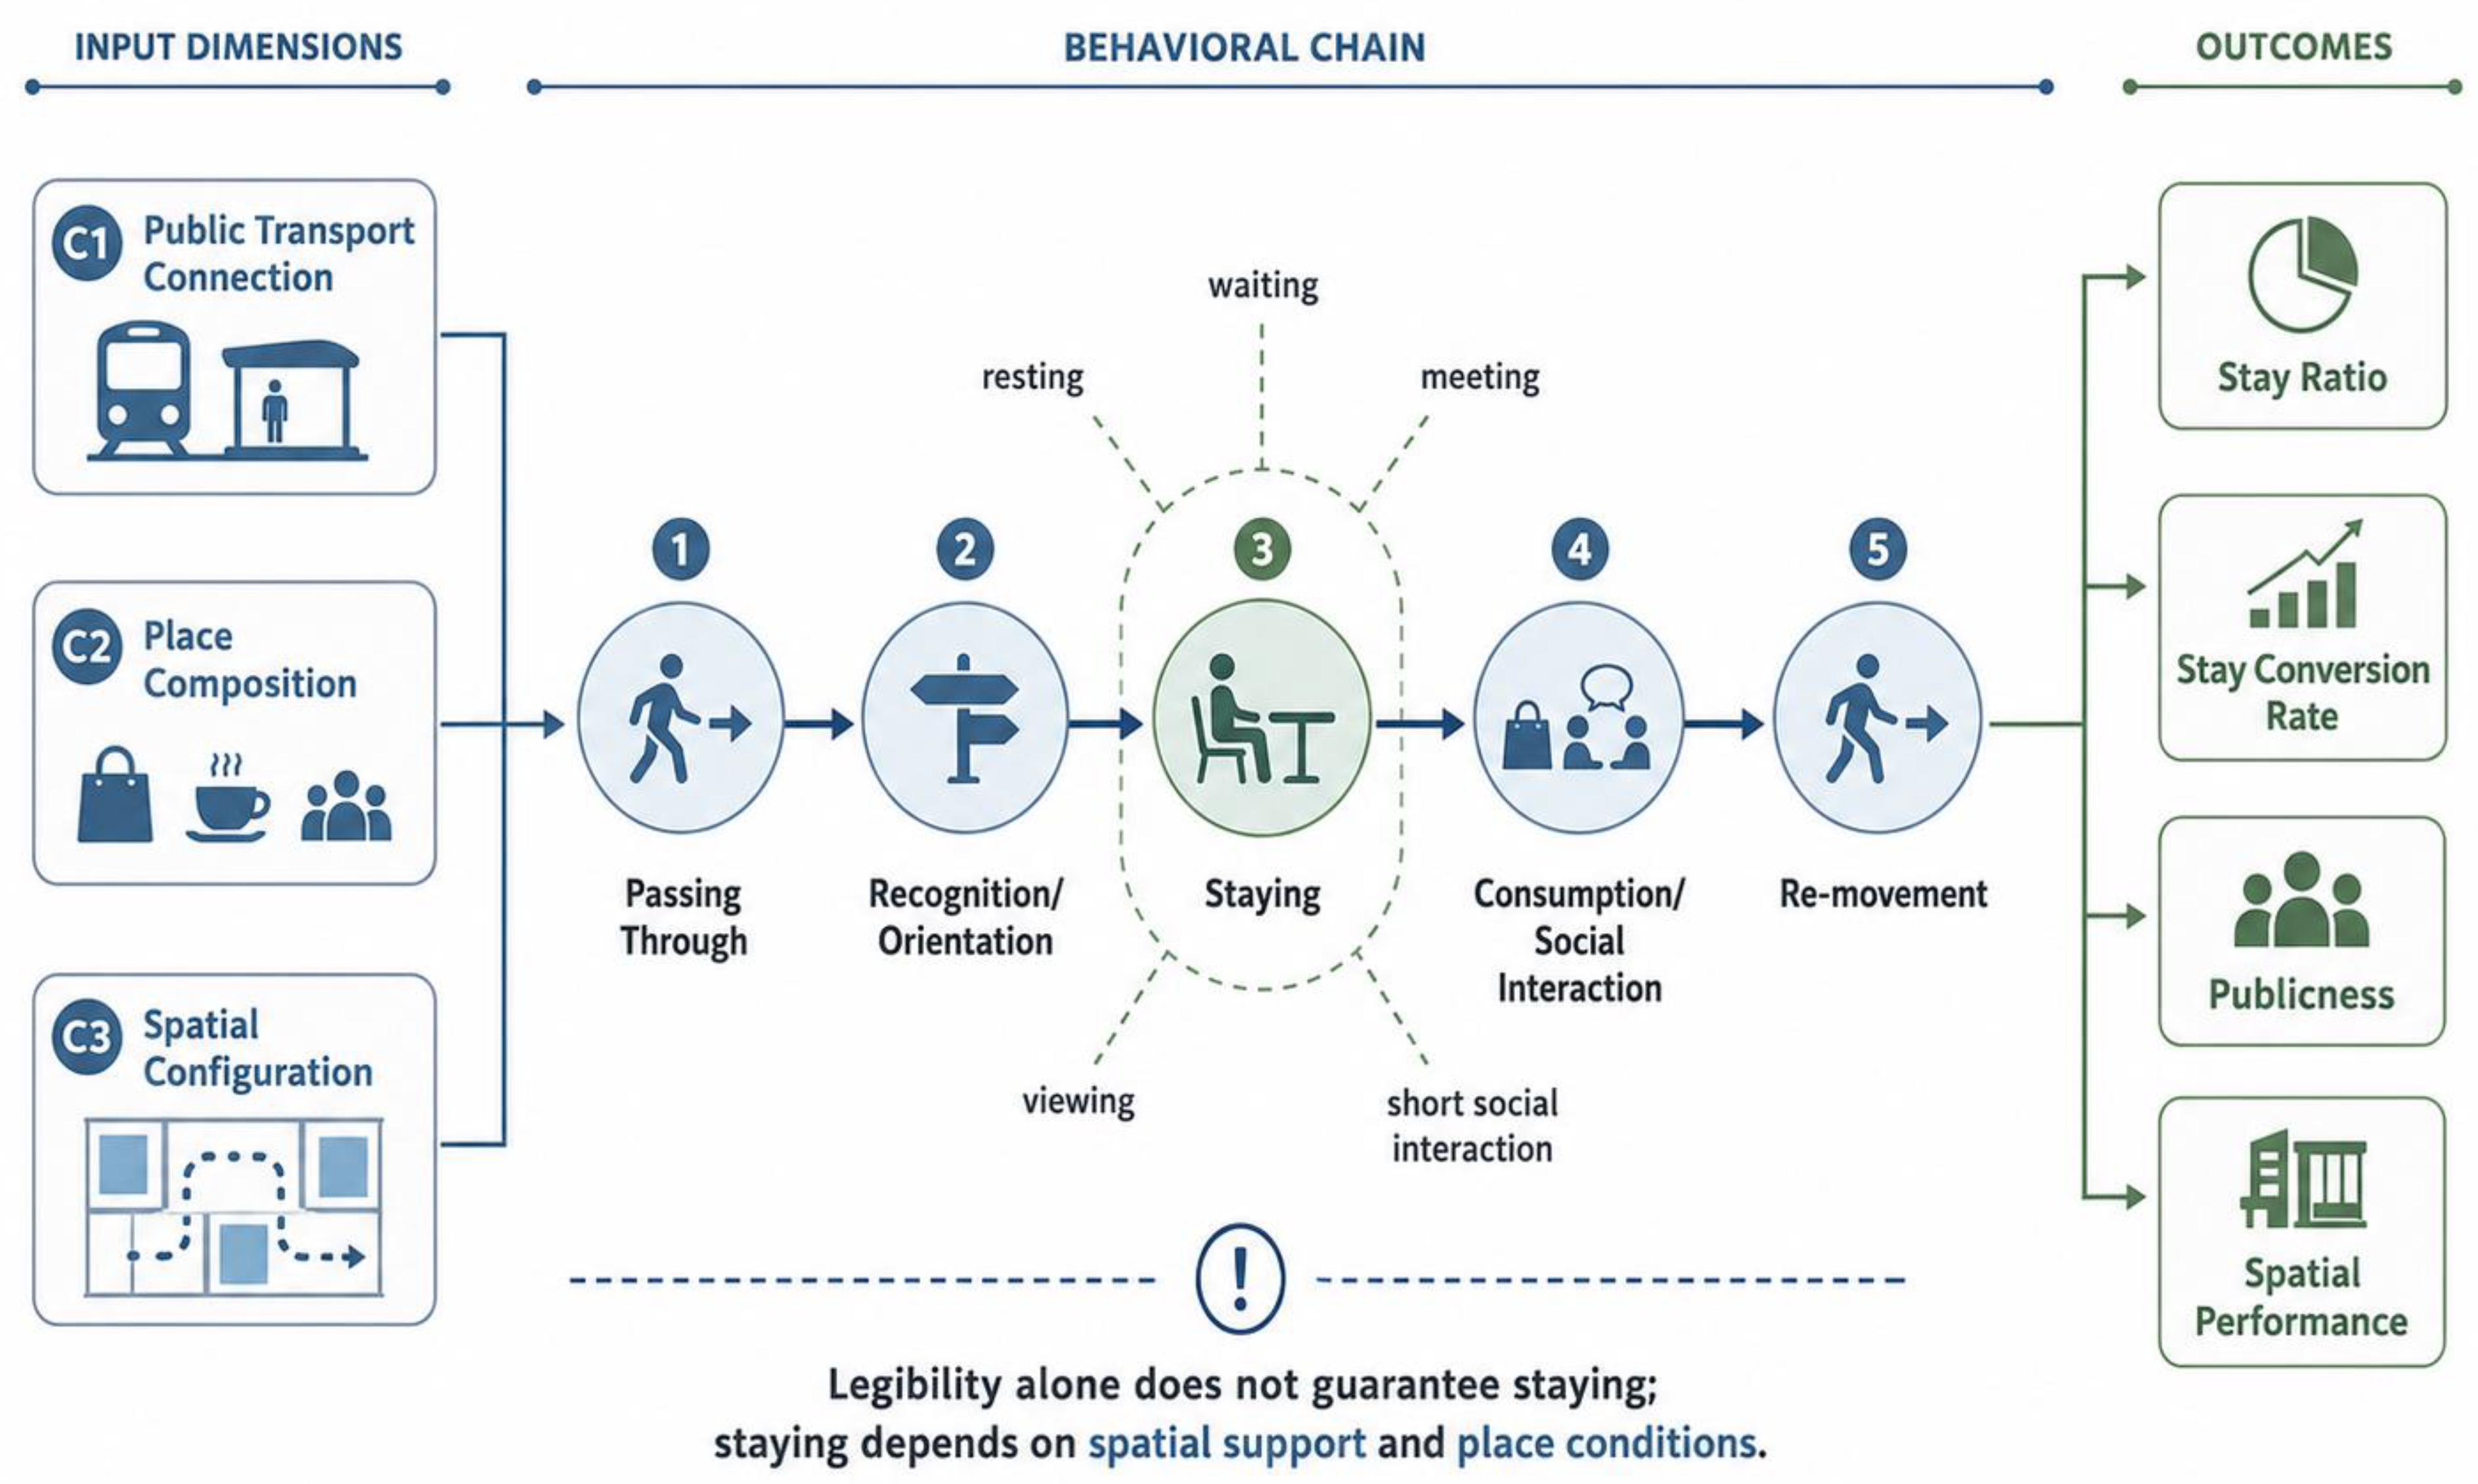
Based on these dimensions, the paper constructs a behavioral chain of
“Passage—Recognition—Stay—Consumption/Socialization—Re-movement” to explain how transit corridors supported by place conditions transform into public spaces accommodating staying behaviors, as diagrammed in
Figure 2.
3.3. Behavioral Chain Classification
User behavior in rail-transit commercial circulation spaces is not singular but constitutes a behavioral chain comprising transit transfer, path recognition, commercial consumption, waiting/meeting, resting/interacting, and re-movement. To clarify user behaviors under varying spatial conditions, this paper categorizes five typical behavioral chains (
Table 3).
These behavioral chains indicate that the design goal for rail-transit commercial circulation spaces should not stop at transfer efficiency, but should support users in making continuous transitions among transit, commerce, and public activities.
3.4. Behavioral Observation and Counting Methods
This paper recorded user activities across different spatial modules through field observations and behavioral counting. Observational data included instantaneous counts, passing flows, number of staying users, stay locations, types of stay behavior, and space utilization patterns. Based on spatial integrity, behavioral conditions, and observational feasibility, each case was divided into modules such as metro interfaces, connecting corridors, commercial interfaces, atriums, escalator nodes, entrance/exit spaces, and public resting nodes. Observation covers working days and rest days, and selects four time periods: morning (9:00–10:00), noon (11:30–12:30), afternoon (15:00–16:00), and evening (19:00–20:00). The observation duration for each time period is 1 h to reflect the behavioral changes in rail transit commercial spaces under different usage rhythms. Two investigators will be assigned for each case. The investigators will walk at a speed of 20 min around the research area, and conduct the investigation in a total of three rotations per observation.
Stay behavior was identified by observing whether users engaged in non-passage activities. Actions such as waiting, resting, conversing, observing, meeting, taking photos, and lingering before or after consumption were recorded as stay behaviors. Users moving rapidly without significant pauses were recorded as passing behaviors. By comparing passing flows, staying numbers, and stay ratios across modules, the study identifies which node types more readily foster stays.
All observational data were aggregated by spatial module and time block. No personal identification, facial recognition, or individual tracking was conducted. The research results are presented solely in the form of aggregated data (
Table 4).
3.5. Questionnaire Survey and User Evaluations
Alongside behavioral observations, intercept questionnaires were used to understand users’ subjective evaluations. Content included spatial legibility, diversion convenience, transfer satisfaction, resting facility evaluations, willingness to stay, consumption convenience, and overall spatial experience. Six cases were surveyed, with 100 user questionnaires collected for each case (300 user questionnaires collected for each case in China and Japan) to compare perceptional differences.
According to the survey, differences in evaluations of connection space legibility were minor between Chinese and Japanese users. In the Japanese sample, 68% of respondents perceived high legibility; in the Shanghai sample, 65% shared this view. The gap is a mere 3 percentage points. However, a significant gap emerged regarding willingness to linger, rest, or converse in connection spaces. 82% of Japanese respondents expressed willingness to stay, rest, or interact, compared to only 24% of Shanghai respondents. This suggests that spatial legibility does not necessarily equate to stayability. Factors such as resting facilities, node scales, public interfaces, environmental comfort, and non-consumptive stay conditions may be the more critical drivers of stay behavior in these spaces (
Table 5).
3.6. Indicator Definitions and Statistical Testing Methods
This paper uses the following indicators to describe behavior and spatial use patterns (
Table 6):
This paper utilizes the stay ratio as the primary indicator describing spatial stay levels, and the stay conversion rate as a supplementary indicator explaining the conversion of passing flows into stay activities. If a space possesses high passing flows but a low stay ratio, it functions primarily as a corridor. If both passing flows and stay ratios are high, it functions dually as a transit transfer and an activity place.
Regarding statistical methods, Chi-square tests were used to compare proportional differences in questionnaires between China and Japan, focusing on legibility and willingness to rest/interact. For stay ratio differences between weekdays and weekends, independent-samples t-tests or Mann–Whitney U tests were used depending on data distribution. One-way ANOVA or Kruskal–Wallis tests were utilized for differences among varying spatial modules.
4. Results
4.1. Spatial Distribution Characteristics of Stay Behavior
Observations reveal that stay behavior is not distributed evenly but concentrates in specific nodes exhibiting place characteristics. Highly utilized stay spaces typically share the following traits:
They are adjacent to subway entrances or main transfer paths, guaranteeing a stable traffic baseline.
The spatial scale is generous enough that staying is not crowded out by heavy passing traffic.
The surroundings possess stay inducements such as dining, retail, service desks, signage, seating, or landscape interfaces.
They provide good visibility and directional legibility, making users comfortable to wait or meet.
In contrast, narrow corridors, directionless underground corners, commercial corridors devoid of seating and boundaries, and isolated corner spaces generally display high passage rates but weak stayability. While these spaces may host massive foot traffic, they struggle to generate stable resting, social, or staying activities.
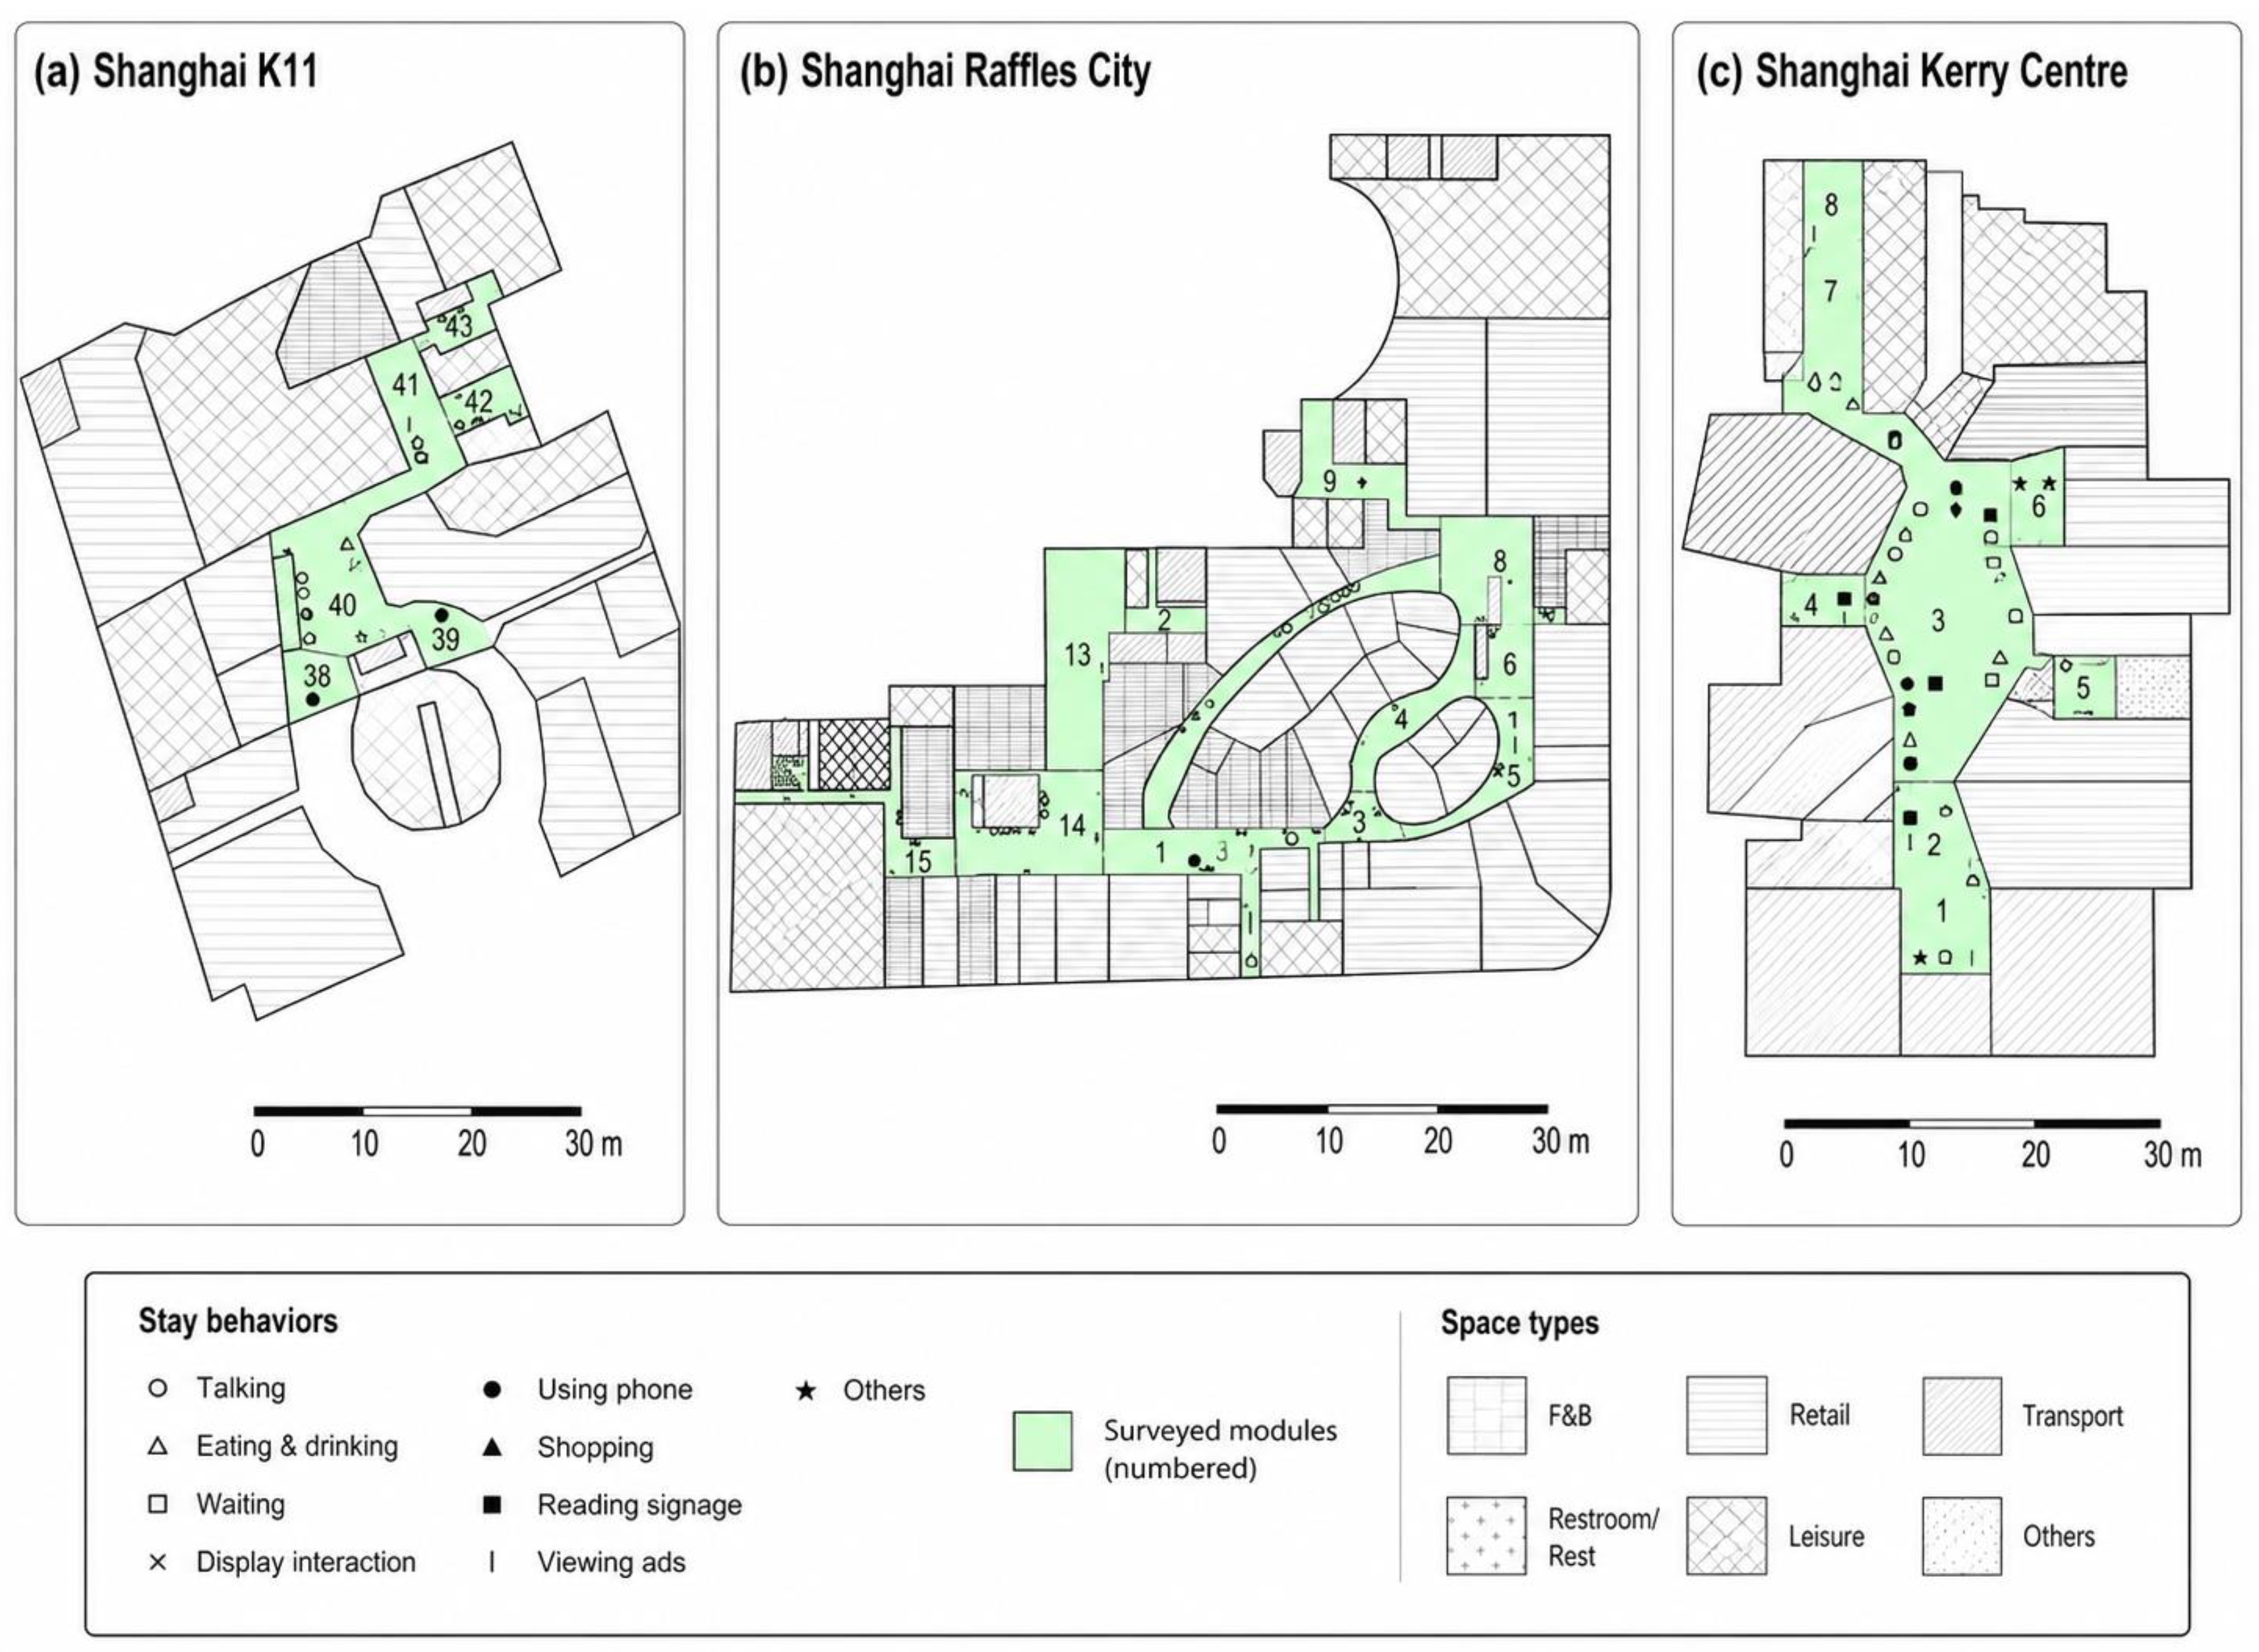
Under the C1/C2/C3 analytical framework, high-stay spaces show weak correlation with isolated superior metrics, yet bear robust correlational relationships with the combined effects of transit linkage, place composition and spatial configuration. For instance, if a subway entrance possesses clear signage, an appropriate scale, and seating or commercial interfaces simultaneously, it can easily convert from a passing node into a spot for waiting, meeting, and short rests. Conversely, spaces lacking resting amenities and spatial boundaries appear to operate primarily as transit corridors despite high pedestrian volume. The spatial module classification and the distribution of stay behavior for the three Shanghai cases are illustrated in
Figure 3. It can be observed that stay behavior is primarily concentrated in atrium nodes, commercial interfaces, and escalator transition zones, whereas general passage spaces mainly fulfill the function of throughput traffic.
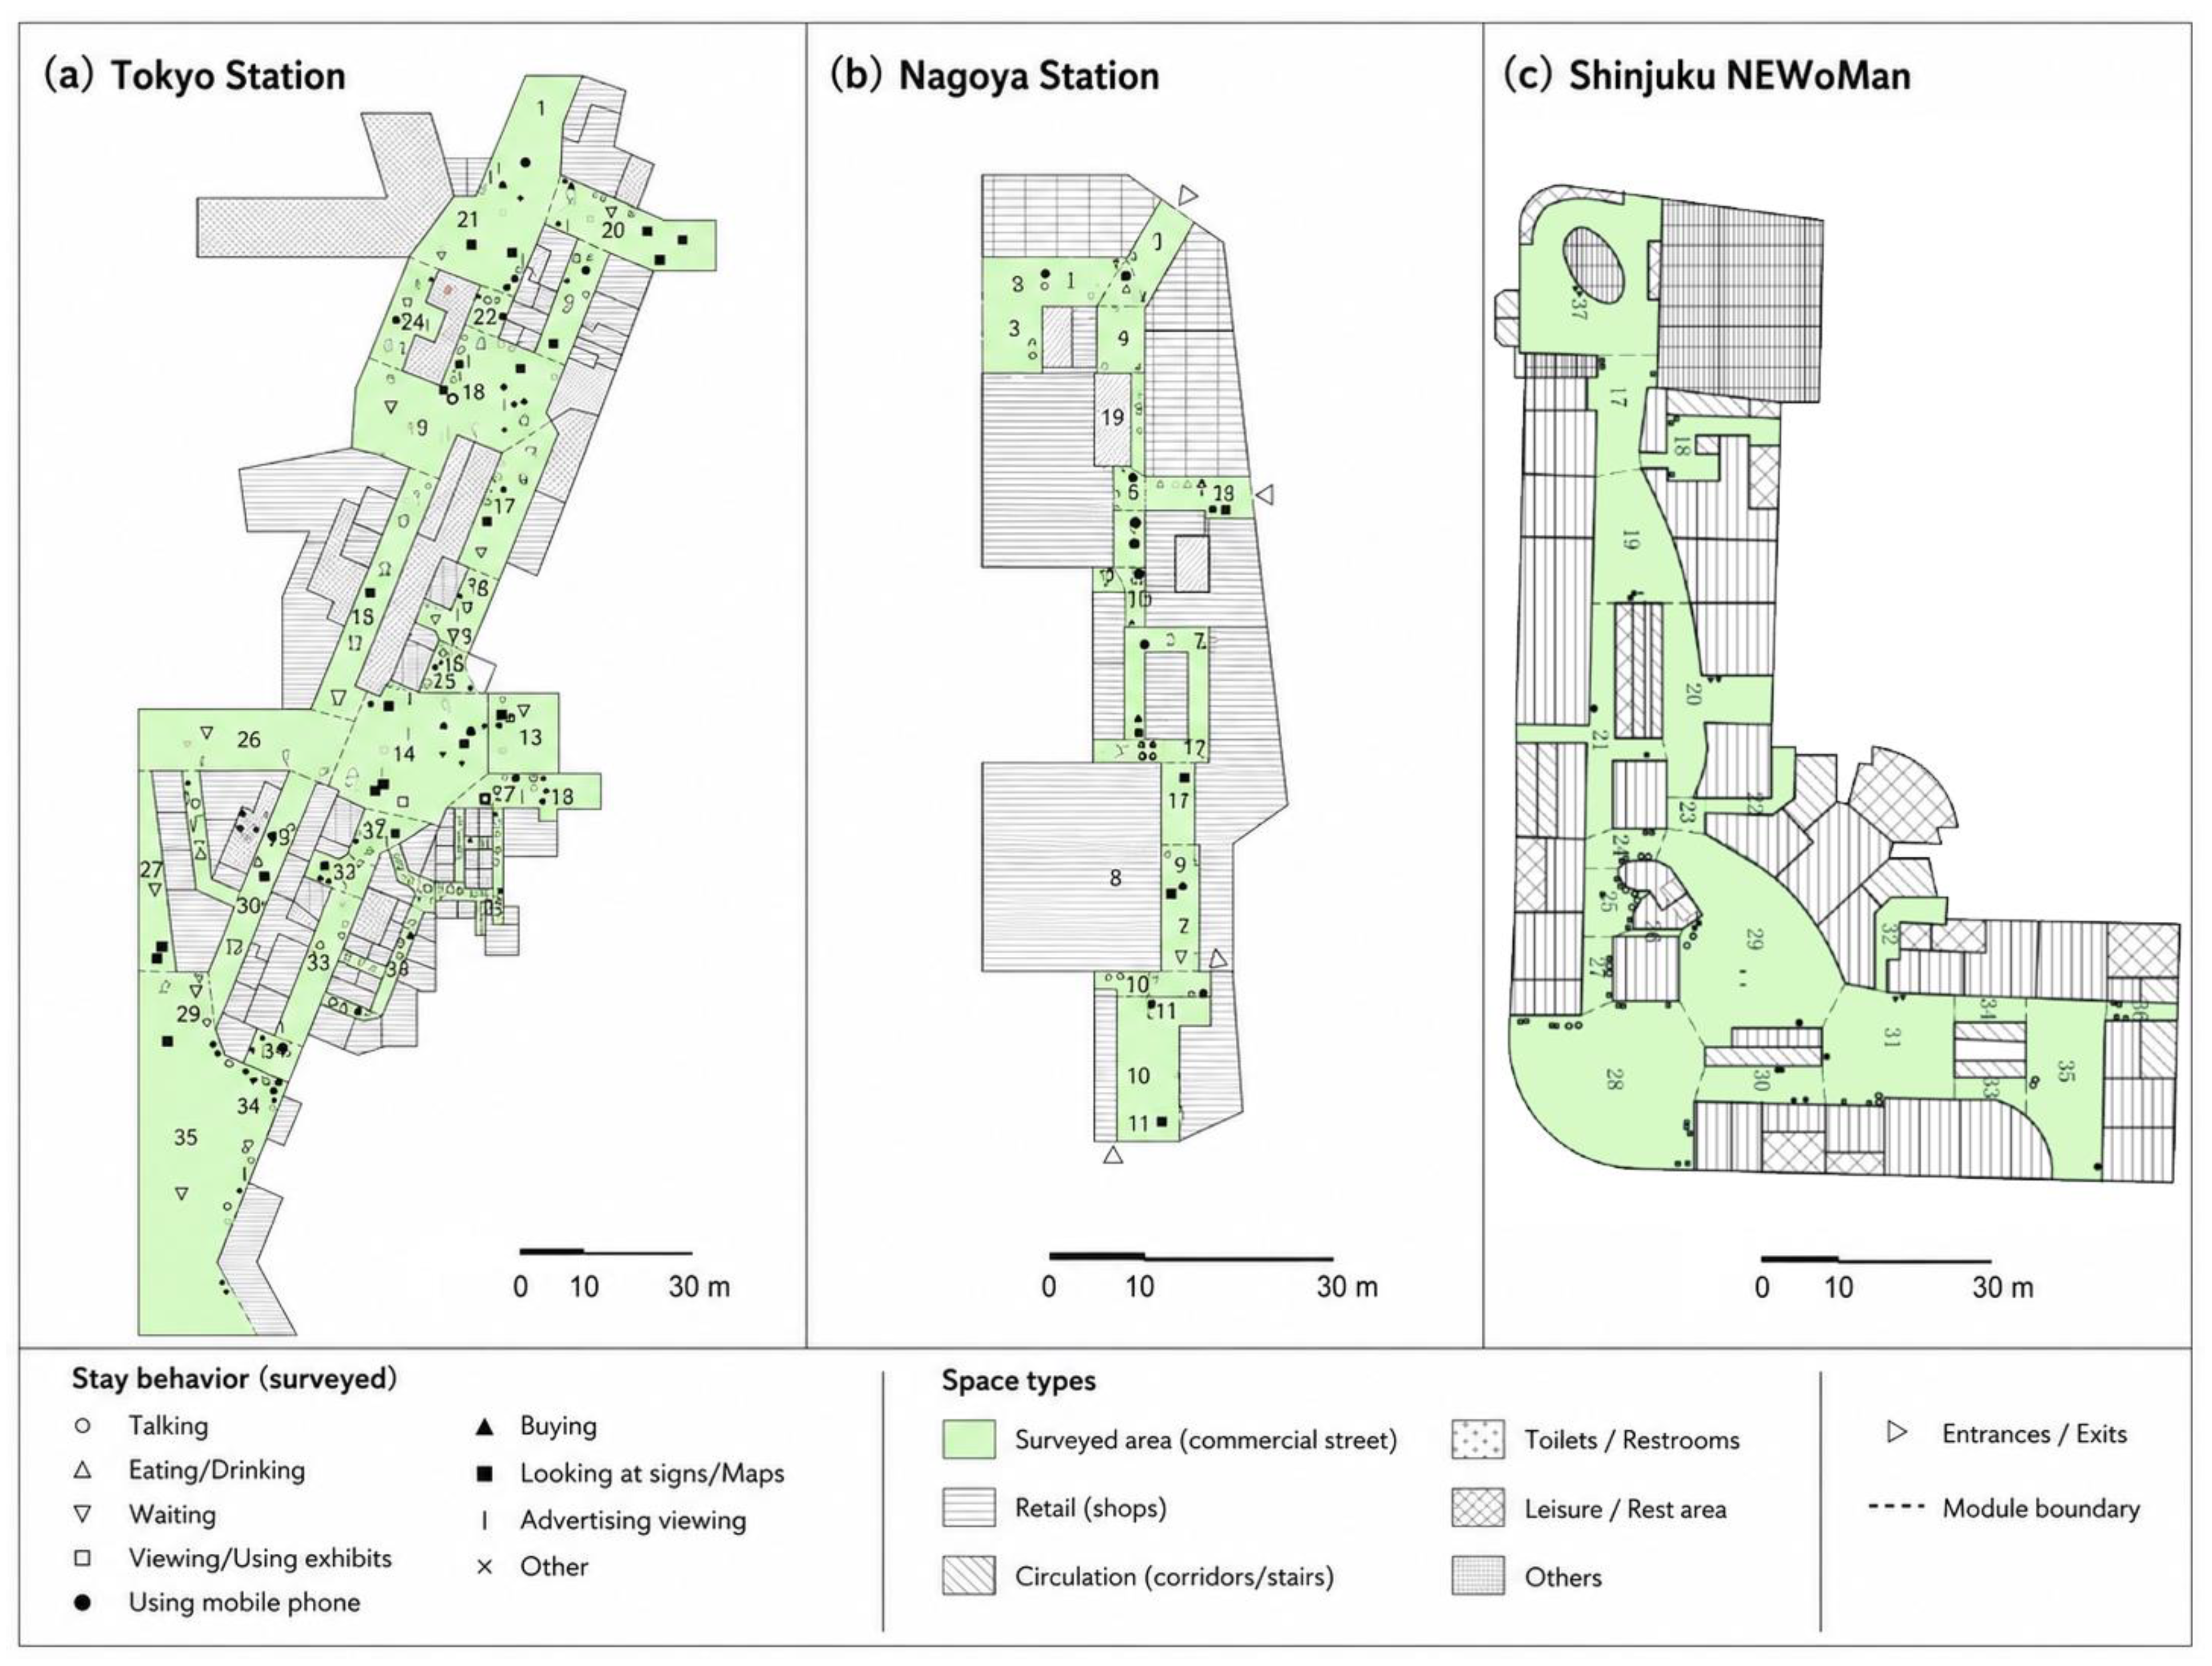
The spatial module classification and the distribution of stay behavior for the three Japanese cases are illustrated in
Figure 4. Compared with the Shanghai cases, the Japanese cases exhibit a more continuous distribution of stay behavior across underground commercial streets, station-city connection nodes, and public platforms. This suggests that these circulation spaces are more effective at converting passing flows into activities such as resting, social interaction, and consumption.
Table 7 indicates that the Japanese cases demonstrate higher overall stay ratios than the Shanghai cases, with Shinjuku NEWoMan (39.9%) and Nagoya Station (38.1%) leading the group. Among the Shanghai cases, the Kerry Centre registered a relatively higher stay ratio (30.2%), driven primarily by dining interfaces, lunchtime office-crowd stays, and resting nodes. While K11 and Raffles City possess robust transit connections and commercial draw, their connection spaces still exhibit strong passage-oriented attributes.
4.2. Stay Differences on Weekdays, Weekends, and Different Time Periods
Observational results reveal clear temporal rhythms in spatial behavior. On weekdays, space use is dominated by commuting, office arrivals, lunch breaks, and evening returns; users possess highly purposeful agendas, and stay behaviors sharply concentrate during midday dining and evening consumption blocks. On weekends, user purposefulness decreases, driving noticeable increases in browsing, meeting, resting, family/friend interactions, and pre/post-consumption stays; consequently, weekend stay ratios are typically higher than on weekdays.
Behavioral differences across distinct time periods are also pronounced. In the morning, transit passages dominate, yielding fewer stays. At noon, stay behavior surges around dining interfaces, resting spots, and commercial entrances, manifesting as waiting, queuing, and pre/post-meal stays. In the afternoon, browsing, resting, and non-purposeful consumption increase, turning atriums and commercial streets into stable stay nodes. In the evening, the overlap of transit returns, dining, and socialization creates rich, composite stay activities, provided the space offers adequate lighting, signage, and resting amenities.
Table 8 breaks down the weekday vs. weekend data. Generally, weekend stay ratios exceed weekday figures, proving that leisure, social, and browsing behaviors easily facilitate stays. The Japanese cases maintain high stay ratios across both parameters. From the spatial comparison of Sino-Japanese cases, the Japanese case has more advantages in terms of the number of public recreational nodes, public recreational facilities, commercial interfaces, etc., suggesting their stayability relies not just on weekend leisure peaks but on structurally stable station-city connections, continuous underground interfaces, and dedicated public resting nodes.
Based on
Table 8, the average weekend stay ratio is 33.1%, higher than the weekday average of 31.1%. Using paired sample t-tests to contrast the six cases reveals a positive trend. This bolsters the paper’s core assertion: low-purpose trips and social consumption on weekends are highly conducive to elevating spatial stay levels. Based on the above analysis, the characteristics of retention behavior at different time periods were summarized in
Table 9.
4.3. Impact of Transport Connection on the Conversion of Passing Flows
Public transport connections define the baseline pedestrian volume entering rail-transit commercial circulation spaces. If subway entrances, station halls, underground streets, and commercial areas are clearly connected, users can easily enter the commercial domain and form stays during the transition process. Conversely, if connections are narrow, poorly signed, or have discontinuous operating hours, large crowds will merely rush through, suppressing the stay ratio.
Comparative analysis shows that some Japanese rail-transit commercial spaces form highly continuous connection systems among station halls, underground streets, commercial atriums, and urban streets, allowing users to effortlessly identify commercial nodes, resting zones, and vertical transit. While some Chinese cases are connected to subway systems, the transitional spaces predominantly serve transit functions and lack sufficient resting amenities or public interfaces, resulting in low efficiency when converting passing flows to stay behaviors.
Regarding C1 (Public Transport Connection), the determining factor is not merely “is it connected to the subway,” but whether the connection is clear, continuous, identifiable, and equipped with resting conditions. Corridors boasting high stay potential typically blend clear routing, uncrowded dimensions, continuous commercial interfaces, and visible resting points.
4.4. Differences Between Legibility and Willingness to Stay
Survey outcomes prove that evaluations of connection space legibility between Chinese and Japanese users are remarkably similar. The Shanghai sample rated spatial legibility positively at 65%, while the Japanese sample stood at 68%. A Chi-square test confirms the difference is non-significant, dispelling the notion that Shanghai’s cases drastically lack wayfinding or directional clarity.
However, when asked about willingness to linger, rest, or socialize in these transitional areas, the chasm was stark. 82% of Japanese respondents were willing to stay, against just 24% in Shanghai. This outcome conclusively demonstrates that spatial legibility does not equate to stayability within our research context. Forming stay behaviors relies heavily on resting facilities, spatial scaling, public interfaces, environmental comfort, and non-consumptive resting conditions. In addition, the commercial operation of Japanese stations is unified and integrated by the railway group, so there are more commercial recreational facilities implanted in the connecting space; Shanghai’s stations are operated by subway companies, while commercial areas are operated by independent commercial developers. The connecting spaces are usually under the management of subway companies, and from a safety and management perspective, it is hoped that these spaces will take on more transportation and evacuation roles, which may also be a factor contributing to this difference.
Executing a Chi-square test on proportional data cements this insight. The legibility indicator shows no significant variance, yet the willingness to stay indicator presents a massive, statistically significant gap. This stands as the paper’s most critical behavioral discovery: optimizing rail-transit commercial spaces must go beyond ensuring users “can understand, navigate, and flow smoothly,” to solving whether users are “willing to stop, capable of stopping, and comfortable staying” (
Table 10).
4.5. Impact of Space Place Composition on Resting and Interacting Behaviors
There is a strong correlation between the composition of spatial locations and whether users are willing to stay. Observations verify that seating, steps, wide edges, outdoor dining, landscape nodes, public art, lighting, and explicit signage significantly augment spatial attractiveness. Specifically in rail-transit spaces, users frequently need to wait for peers, check routes, rest briefly, or decide where to shop; spaces equipped with low-barrier stopping conditions are associated with more frequent stay behaviors in our field records.
Looking at C2 (Space Place Composition), the driver of stay behavior is not a single seat count, but the synergistic effect of resting amenities, commercial interfaces, environmental comfort, and possibilities for public activity. In the Japanese cases, connection spaces are systematically integrated with underground streets, commercial nodes, public seating, and discernible borders, grounding stay behaviors with robust spatial support. In certain Shanghai cases, although transit paths are clear, public resting assets are scarce; even knowing their directions, users lack the physical settings required to stop, socialize, or rest.
This reiterates that the publicness of transit commercial spaces should not be outsourced entirely to consumption venues (e.g., shops and restaurants). If one must patronize a store merely to stop walking, the transitional spaces remain sterile traffic tunnels. High-quality transit circulation spaces must inject non-consumptive resting nodes so that users—regardless of purpose, time crunch, or spending intent—receive fundamental spatial support.
4.6. Impact of Spatial Configuration on Circulation Paths and Stay Nodes
There is also a strong correlation between the structure of commercial migration space in rail transit and the distribution, return, and conversion of pedestrian flow. Spaces built with continuous loops, clear atriums, visible escalators, and multi-directional entry points effortlessly prompt cyclical movement and repeated choices from users. In contrast, linear, disjointed, or poorly oriented spaces push users to find the shortest exit, diminishing the diversity of spatial utilization.
Atriums and escalators act as critical structural nodes. Atriums provide visual anchoring, floor-to-floor linkage, and public stay capacity; escalators guide vertical transitions and directional flow. If atriums and escalators are tightly interwoven with commercial fronts and main corridors, users naturally engage in waiting, viewing, meeting, and consumption-adjacent stays. If an atrium is offset, escalators are hidden, or vertical shifts are disconnected, the circulation loop breaks, undermining stayability.
Evaluating C3 (Spatial Configuration), high-stay spaces display three hallmarks: First, paths are not unidirectional throughputs but offer looped returns and re-selection options. Second, nodes are not mere transit switches but act as visually prominent spots with defined boundaries for staying. Third, vertical transport is entirely visible and maintains a seamless relationship with retail interfaces. Consequently, structural optimization must transition from purely accelerating traffic flow to weaving multi-path, multi-node, and multi-level behavioral networks.
4.7. Comprehensive Impact of C1/C2/C3 on Stay Behavior
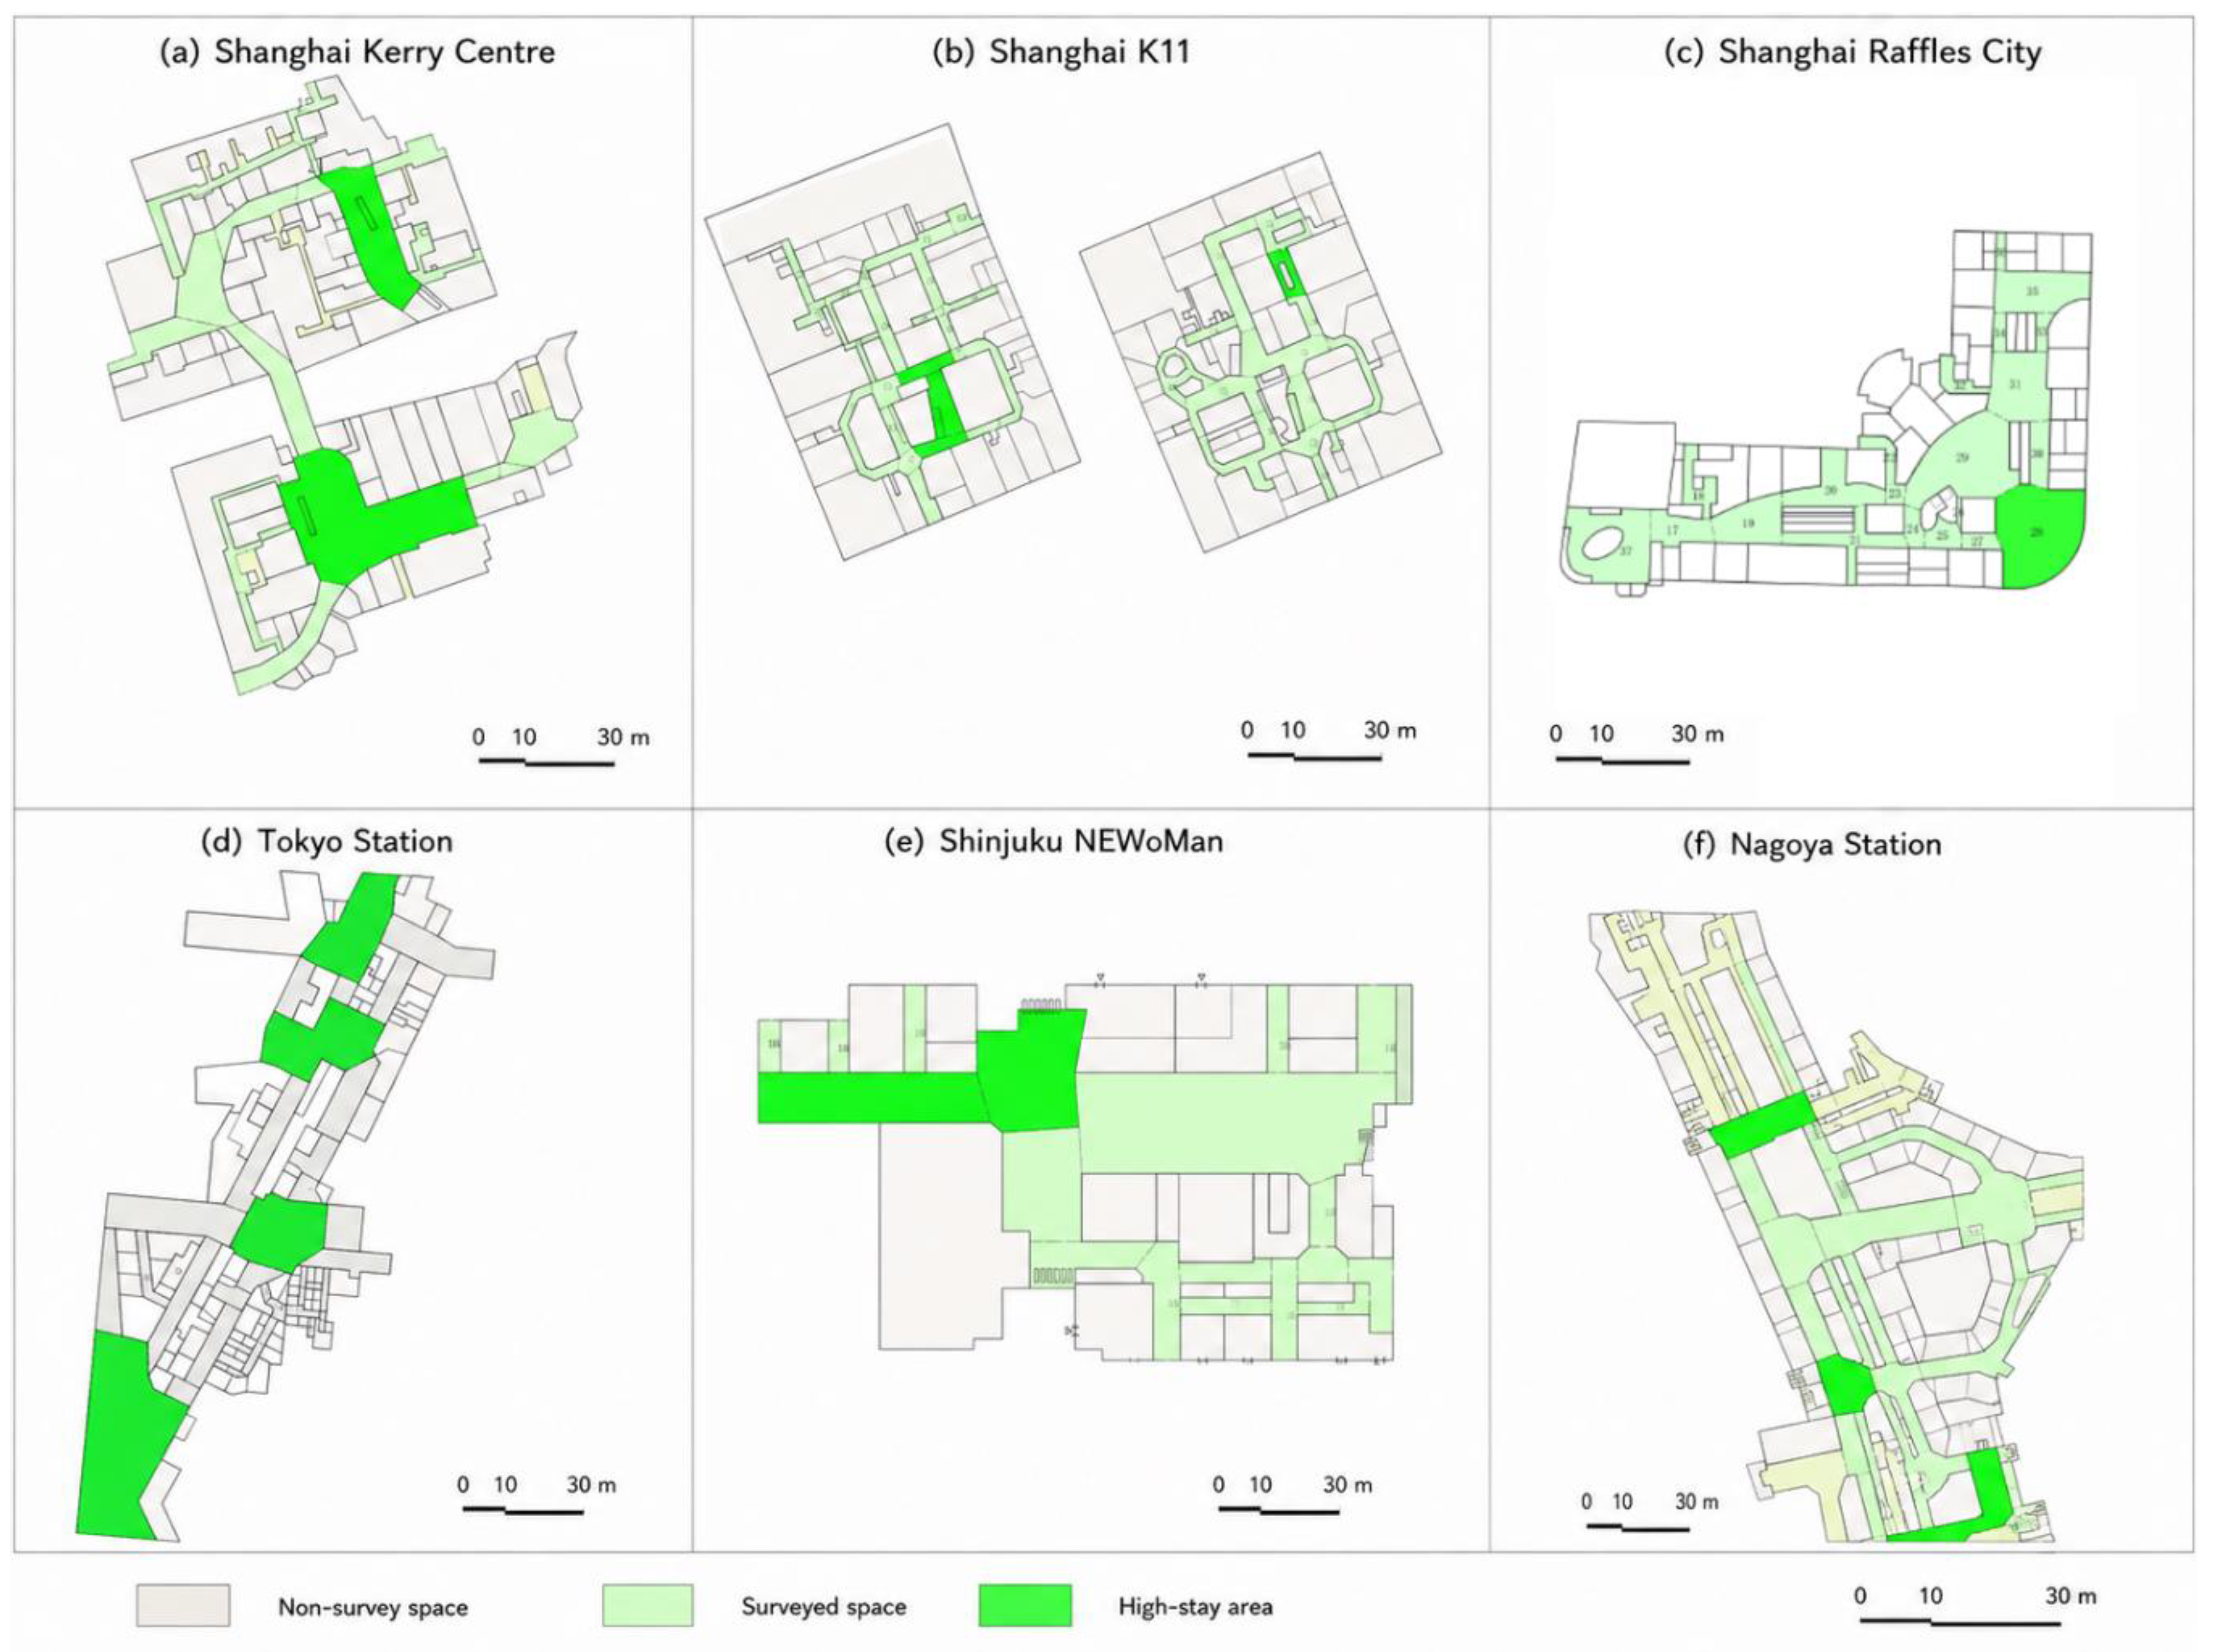
Consolidating the China-Japan cases, the influence of C1, C2, and C3 on stay behavior adheres to clear patterns. Nearly all high-stay modules captured in field observations simultaneously exhibit favorable performance across C1 transit connections, C2 place composition and C3 spatial configuration. Low-stay zones generally feature functioning paths but deficient place conditions, or open spaces that are physically divorced from the main traffic rivers and vertical transit. The spatial locations of high-stay areas in each case are shown in
Figure 5. High-stay areas are not randomly distributed; rather, they are mostly located at rail-transit interfaces, continuous commercial interface zones, atrium/escalator transition nodes, and spatial nodes that provide conditions to support staying. These impacts are summarized in
Table 11.
To further quantify the relationship between C1/C2/C3 and stay behavior, the study compiled grouped statistics based on spatial module typologies. The results establish that spatial modules excelling across C1, C2, and C3 yield the highest average stay ratios; modules that boast excellent traffic connections but lack resting amenities and spatial nodes exhibit conspicuously depressed stay ratios. This outcome conclusively proves that stellar stayability is not guaranteed by transit linkages alone, but rather via the synchronous action of transport connections, place composition, and spatial configuration.
Comparing the average stay ratios in
Table 12, resting platforms, atrium nodes, and commercial interfaces decidedly outperform standard traffic corridors. This data cements the paper’s central thesis: converting passing traffic into stay activities does not hinge merely on raw foot traffic volumes, but on outfitting spaces with identifiable, stoppable, explorable, and socially conducive place conditions.
Synthesizing the layered influences of C1, C2 and C3 on stay behavior, this study establishes a progressive theoretical transmission framework: Spatial characteristics → User multi-dimensional perception → Behavioral response → Staying activity, which further unpacks the internal mechanism of pedestrian flow transformation in transit-integrated commercial spaces. As underlying objective spatial attributes, C1 public transport connection, C2 place composition and C3 spatial configuration jointly shape four distinct subjective perceptual dimensions of users: transit connection conditions determine spatial legibility and accessibility, place amenities dominate environmental comfort, and the coordination of all three tiers constructs holistic place experience. Legibility and accessibility merely guarantee basic wayfinding and transfer efficiency and cannot independently generate lingering activities; as core mediating perceptions, environmental comfort and place experience break the single pursuit of movement efficiency, prompting users to shift from rapid passage to behavioral responses such as waiting, resting and social interaction, which are ultimately quantified by stay ratio and stay conversion rate. Comparative data between Chinese and Japanese cases and stay indicators across spatial modules jointly validate this transmission logic. While respondents from China and Japan hold similar perceptions of legibility and accessibility, the stark gap in environmental comfort and holistic place experience leads to dramatic divergence in willingness to stay and overall stay ratios. This evidence proves that merely optimizing circulation routes and spatial connectivity fails to activate place vitality. Only by supplementing resting facilities and multi-layered public nodes to improve comfort and place experience can transit through-flows be effectively converted into sustained staying activities.
5. Discussion
5.1. From Passing Pedestrian Flows to Staying Activities
The core challenge in rail-transit commercial circulation spaces is not merely acquiring foot traffic, but figuring out how to sublimate passing flows into stay activities bearing public life significance. While passing flows reflect transit efficiency and spatial connectivity, stay behaviors capture spatial attractiveness, comfort, and “placeness”. A station commercial space might boast staggering footfalls, but if the vast majority simply rushes through, its public space performance remains stunted.
Data from this research directly supports the conclusion that stays reliably occur at the intersection of traffic transitions and rich place conditions. When a location is situated on a critical transit route while offering seating, edges, commercial fronts, visual anchoring, and comfortable scaling, users are highly prone to linger. Consequently, architects should eschew treating connecting nodes as mere tubes, and deliberately infuse critical path junctions with features supporting waiting, observing, interacting, and resting.
5.2. The Difference Between Legibility and Stayability
Transit commercial space designs frequently obsess over clear signage and path legibility, yet comparative data from this research directly indicates that legibility cannot be equated with stayability. Legibility simply ensures a user can untangle the spatial map and locate their exit; stayability dictates whether the environment extends the amenities, comfort, and social hooks necessary to delay their departure. A space can be intensely legible, yet users will still flee immediately if it lacks seats, edges, resting nooks, or a hospitable atmosphere.
Broader design implications drawn from this research reveal that upgrading rail-transit commercial circulation spaces cannot rest solely on polishing the wayfinding graphics. True optimization demands “place-making”. Particularly in subway links, underground tunnels, and retail vestibules, interventions like scaling up dimensions, opening interfaces, installing boundary seating, harmonizing lighting, and fostering micro-public events are imperative to amplify stayability and publicness.
5.3. The Behavioral Chain Mechanism in Transit Commercial Circulation Spaces
Observations reveal that user actions within these complexes rarely unfold as isolated steps; they unfurl as interconnected behavioral chains. A user might emerge from the subway, survey the paths, wait for a companion, pause momentarily, enter a shop, buy something, ascend an escalator, and then dip back into the transit network. Spaces architected to nourish this exact sequence naturally brew sustained vitality.
This paper summarizes this cycle as the “Passage—Recognition—Stay—Consumption—Re-movement” behavioral chain. Public transit connections correlate with visitor entry; spatial legibility shapes the willingness to explore; node characteristics relate to instances of lingering; commercial interfaces are associated with spending behaviors; and circulatory loops alongside vertical transit influence how visitors move and circulate back. Optimization strategies must cradle this holistic chain, rather than tweaking isolated nodes in a vacuum.
5.4. Implications for the Optimization of Transit Commercial Spaces in China
For China’s rapidly multiplying transit commercial developments, future upgrades should pivot around four axes:
Elevate the publicness of connecting spaces: Links between metros and retail must shed their “tunnel” identity and provide basic resting and orientation functions. This design logic can be implemented at the schematic design stage of new station complexes and station renewal projects, by reserving continuous transitional zones instead of narrow single-function passages to lay a foundation for converting passing crowds into staying users. The human-centered station planning principle should be embedded throughout the design process, prioritizing users’ demands for waiting, resting and social interaction in the design of passage width, lighting and interfaces, rather than taking evacuation efficiency as the sole control standard.
Fortify non-consumptive resting assets: Strategically deploying seats, ledges, steps, waiting zones, and public lounges fiercely elevates the public’s willingness to linger. The overall resting infrastructure system should be refined in renovation schemes, with categorized facilities for short waiting and long rest: simple backrest benches and stepped seating are arranged at transfer nodes; continuous wide resting ledges with lighting are equipped at atriums and transitional zones. During station renovation, resting facilities can be scattered along main circulation routes, atrium edges and transfer nodes rather than being limited to paid catering areas, creating inclusive public spaces accessible without consumption.
Optimize atriums and escalators: Atriums, escalators, entrances, and retail fronts should fuse into a continuous, highly visible circulation system to erase friction in floor transitions and wayfinding. Targeted design tactics for different core spatial nodes are specified: atriums adopt open visual layouts with unobstructed standing zones; escalator areas expand surrounding buffer spaces with compact waiting seating; entrances and exits are equipped with landmark installations and unified signage to strengthen spatial recognition. This spatial configuration strategy can be directly applied to the vertical layout design of underground commercial streets to balance smooth pedestrian mobility and recognizable activity nodes during new construction and renovation.
Diversify spatial utility: By threading events, exhibitions, pop-up markets, public art, and resting hardware throughout the complex, rail-transit commercial spaces can secure robust vitality across both transit peaks and off-peak hours. Segmented continuous commercial frontages are adopted to avoid large enclosed walls separating public areas; open shop windows and outdoor display zones are arranged along corridors and atrium boundaries to blur the dividing line between commercial consumption and public circulation. Independent public interaction spaces are specially arranged, including small communication platforms, art exhibition zones and temporary event venues to accommodate conversation, waiting, sightseeing and other social activities. Spatial renewal can be carried out in phases: short-term interventions including temporary art installations and pop-up activities activate underused circulation areas, while long-term regeneration plans integrate multi-functional public platforms to sustain long-term spatial vitality.
6. Conclusions
This paper focused on rail-transit commercial circulation spaces, leveraging field observations, behavioral tallies, and user surveys from Chinese and Japanese cases to dissect the relationship between stay behavior and spatial utilization formats. The research concluded that a commercial space’s utilization performance is not merely decided by the raw scale of passenger flow, but is closely associated with whether transit connections, place composition, and spatial structures cohesively support the “Passage—Recognition—Stay—Consumption—Re-movement” behavioral chain.
The findings confirm that spaces boasting clear transit linkages, appropriate node scales, ample resting hardware, continuous commercial fronts, and visible vertical circulation are associated with higher capacity to convert passing pedestrians into lingering users. Cross-referencing the China-Japan data illuminated that while legibility evaluations were practically identical between Shanghai and Japanese samples, a massive divide existed regarding the willingness to stay. This underscores that the central dilemma in rail-transit spaces is not simply accelerating traffic or clarifying signs; it is utilizing resting amenities, place nodes, public interfaces, and spatial fluidity to transmute transit corridors into thriving, stayable, social, and commercially potent public arenas.
The innovation of this paper lies in pivoting the analysis of rail-transit commercial circulation spaces away from mere traffic efficiency and real estate yields, aiming the lens squarely at user stay behavior and spatial utility. It untangles the conversion mechanism of passing-to-staying via C1 Transit Connections, C2 Place Composition, and C3 Spatial Configuration. The research emphatically advocates that rail-transit commercial space design must graduate from a transit-centric orientation into a composite behavioral orientation, reinforcing spatial recognition, node stays, and public activity capacity without cannibalizing transfer efficiency.
This paper does harbor limitations. First, behavioral observations remain anchored to specific cases and distinct time windows; the quantity of research cases is limited, and future work could expand the roster of sample cities and case volumes. Second, while rooted in visual observation and surveys, the study is highly dependent on field observation and questionnaire survey data, lacking multi-source objective tracking data for cross-verification; future studies might weave in space syntax, trajectory tracking, mobile signaling, and commercial operation data to quantitatively drill down on spatial structures’ exact impact on stay behaviors. Third, stay behavior is co-determined by non-spatial confounding variables including demographic traits, commercial appeal, cultural customs and economic factors, as well as cross-national cultural disparities that may exist between different countries, which are not systematically quantified in this research. Thus, this study only identifies correlation rather than strict direct causality between spatial design and staying activities, and follow-up research is required to distinguish spatial effects from social and behavioral factors. Finally, evaluating the quality, duration, and social depth of stay activities requires finer methodologies. For example, when taking the spatial module as the unit of analysis with the number of staying users as the dependent variable, Poisson regression or Negative Binomial regression could be applied to test the relative influence of different spatial factors on stay behavior. Future explorations could plunge deeper into the publicness, sustainable operation, and total station-city integration performance of rail-transit commercial spaces.