Article

Mechanical and Structural Performance of 3D-Printed Cement Mortar Incorporating Modified Basic Oxygen Furnace Slag and Waste Printed Circuit Board Powder: Experimental and Numerical Study


1
Department of Civil Engineering, National Taipei University of Technology, Taipei 10608, Taiwan
2
Department of Semiconductor Engineering, Lunghwa University of Science and Technology, Taoyuan 333326, Taiwan
3
Department of Molecular Science and Engineering, National Taipei University of Technology, Taipei 10608, Taiwan
4
Institute of Mineral Resources Engineering, National Taipei University of Technology, Taipei 10608, Taiwan
5
Department of Civil and Environmental Engineering, Faculty of Science and Technology, University of Macau, Avenida da Universidade, Taipa, Macau 999078, China
*
Author to whom correspondence should be addressed.
Buildings 2026, 16(15), 3037; https://doi.org/10.3390/buildings16153037
Submission received: 10 June 2026 / Revised: 28 July 2026 / Accepted: 29 July 2026 / Published: 31 July 2026

Abstract

This study developed 3D-printable cement mortar (3DPCM) incorporating modified basic oxygen furnace slag (MBOFS) sand and waste printed circuit board powder (WPCBP). Five WPCBP-to-cement ratios, namely 0, 10, 20, 30, and 40 wt.%, were adopted, and the printability of each mixture was first evaluated. Subsequently, the compressive, flexural, and splitting tensile behaviors of mold-cast and 3D-printed specimens were compared, and the structural response of 3D-printed truss members was assessed through four-point bending tests and finite element analysis. The results showed that all mixtures could be printed stably. For the standard 3D-printed specimens, WPCBP/C = 20 wt.% provided the highest quasi-static mechanical performance, and the mechanical response exhibited clear anisotropic behavior. In contrast, the mechanical performance of the mold-cast specimens decreased with increasing WPCBP content. In the 3D-printed truss members, the average peak load increased from 8.041 to 20.710 kN, the displacement corresponding to the peak load increased from 0.201 to 0.683 mm, and the finite element analysis reasonably captured the overall load–displacement response. Overall, MBOFS sand and WPCBP can be effectively incorporated into 3DPCM and show potential for sustainable structural material applications.

1. Introduction

Concrete, as the cornerstone of modern infrastructure, is the second-most-consumed material worldwide after water, with annual production exceeding 30 billion tons [1]. However, the rapid advancement of human civilization has intensified challenges related to resource depletion and environmental burdens, particularly in industries such as infrastructure development, steel manufacturing, and information technology, which collectively underpin global economic growth. In the construction sector, natural sand and gravel constitute the primary raw materials for concrete; their extensive and prolonged extraction has led to the progressive depletion of natural resources and significant ecological imbalances [2,3,4,5]. Concurrently, in the steel and electronics industries, the expansion of production capacity has resulted in a continuous increase in metallurgical by-products and non-biodegradable electronic waste [6,7]. As a result, the combined pressures of excessive resource exploitation and industrial waste accumulation have exposed the inherent limitations of the conventional linear “take–make–dispose” model. In response to global initiatives on the circular economy and net-zero emissions, the high-value utilization of industrial by-products from energy-intensive sectors has become a critical research priority [8,9].
According to the World Steel Association, global steel production reaches approximately 1.85 billion tons annually [10], inevitably generating substantial quantities of industrial by-products. Among these, Basic Oxygen Furnace (BOF) slag is the dominant by-product of the steelmaking process, with an annual production exceeding 200 million tons [11,12,13]. BOF slag exhibits favorable physical properties, including high hardness and excellent abrasion resistance [14,15]. However, the presence of free calcium oxide (f-CaO) and free magnesium oxide (f-MgO) induces significant volumetric instability due to delayed hydration and expansion [16,17,18]. Consequently, untreated BOF slag has been largely restricted from structural applications and is primarily downcycled for asphalt pavements, ground improvement, or non-structural filling materials [19]. To address these limitations, China Steel Corporation (CSC) developed a hot-slag modification technology to mitigate volumetric expansion. This process involves oxygen injection into molten slag immediately after furnace discharge, promoting the oxidation of FeO to Fe2O3. Subsequently, siliceous modifiers, such as SiO2 or glass powder, are introduced and dissolved within the slag matrix. These modifiers react with expansive f-CaO to form stable dicalcium silicate (2CaO·SiO2), or with Fe2O3 to produce stable dicalcium ferrite (2CaO·Fe2O3). Through this chemical stabilization mechanism, the unstable phases are effectively eliminated, yielding Modified Basic Oxygen Furnace Slag (MBOFS) [20].
Recent studies have demonstrated that MBOFS can be utilized as a partial or complete replacement for natural fine aggregates, producing concrete with enhanced mechanical performance while simultaneously reducing dependence on natural resource extraction. This approach provides a viable pathway for the high-value reutilization of steel industry by-products within sustainable construction systems [21,22].
With the rapid expansion of the global electronics industry and the continuous shortening of product lifecycles, waste electrical and electronic equipment (WEEE) has become one of the fastest-growing waste streams worldwide, with projections indicating a total volume of approximately 70 million tons by 2030 [23,24]. Waste printed circuit boards (WPCBs), as an important component of WEEE, account for approximately 4% to 7% of its total mass [25]. Waste printed circuit boards typically contain approximately 30 wt.% metallic constituents, such as Cu, Zn, Au, Ag, and Pd, while the remaining portion consists of non-metallic constituents. After recycling, crushing, and metal-separation processes, this non-metallic fraction is generally referred to as waste printed circuit board powder (WPCBP), which is mainly composed of resin, glass fibers, and residual metals. In this context, residual metals refer to trace metallic constituents that remain in the non-metallic WPCBP after metal recovery, such as Cu, Fe, Al, and Sn [26,27,28]. Current WPCB recycling strategies primarily focus on recovering high-value metals through pyrometallurgical, hydrometallurgical, and bio-metallurgical processes [29,30]. However, large quantities of residual non-metallic WPCBP are still mainly disposed of by landfilling or incineration. These disposal methods may pose potential environmental risks due to the release of hazardous substances into soil, air, and groundwater systems [28,31].
Recent studies have incorporated non-metallic WPCBP into cementitious composites as natural aggregate substitutes or micro-reinforcing materials, demonstrating its potential to improve mechanical performance [31,32,33,34]. Although WPCBP may contain residual metallic elements originating from printed circuit board manufacturing and recycling processes, previous studies have reported that its incorporation into cementitious composites remains feasible. Reported Toxicity Characteristic Leaching Procedure (TCLP) results showed that Cu leaching from pure WPCBP exceeded the regulatory limit, whereas the leaching concentrations of heavy metals from WPCBP-incorporated cement mortar were below the corresponding limits. This indicates that the cementitious matrix can provide a potential immobilization effect on residual metallic elements [35]. Therefore, converting WPCBP into cementitious composites can reduce electronic waste accumulation and enable high-value resource recovery while minimizing secondary environmental pollution, which is consistent with the development of the circular economy and sustainable materials engineering.
Faced with the dual challenges of resource depletion and escalating environmental burdens, the pursuit of resource-efficient and sustainable construction technologies has brought 3D Concrete Printing (3DCP), a representative Additive Manufacturing (AM) technique, to the forefront of global research [35,36,37]. By eliminating the need for conventional formwork and enabling the fabrication of complex geometries, 3DCP significantly reduces material consumption and carbon emissions, thereby providing a promising pathway toward sustainable construction practices [38,39,40]. Current 3DCP systems are predominantly extrusion-based, with hardware configurations generally classified into gantry-type systems and robotic arm systems [41,42]. To enhance the structural performance of printed elements, fiber reinforcement has been widely incorporated into cementitious matrices used in 3DCP [43,44]. However, due to the inherent layer-by-layer deposition process, printed materials exhibit pronounced mechanical anisotropy, resulting in direction-dependent properties and potential interlayer weaknesses [45,46,47,48]. The performance of 3DCP materials is typically evaluated based on four key criteria: extrudability, flowability (workability), setting behavior, and buildability [35]. Extrudability refers to the ability of the material to be continuously and uniformly extruded without segregation or blockage, ensuring stable deposition during printing [49,50]. Adequate flowability is essential to facilitate smooth extrusion and can be effectively adjusted through the use of superplasticizers [51,52]. Buildability, which characterizes the capacity of the printed structure to maintain its shape under self-weight during layer accumulation, is critical to preventing collapse or excessive deformation [53]. In this context, the initial setting time plays a decisive role; by incorporating accelerators to shorten the setting process, the lower layers can rapidly develop sufficient early-age strength to support subsequent layers, thereby ensuring structural stability throughout the printing process [54].
This study systematically developed 3DPCM incorporating MBOFS sand and WPCBP. The printability of the mixtures was evaluated using fresh-state performance indicators, while the anisotropic mechanical behavior in the hardened state was examined through quasi-static mechanical tests, including compressive strength, flexural strength, and splitting tensile strength tests. In addition, 3D-printed truss members were fabricated and subjected to four-point bending tests to assess their structural performance. FEM was further employed to simulate the load–displacement responses of the 3D-printed truss members, and the FEM results were validated by comparison with the experimental four-point bending test results. The findings provide an experimental and numerical basis for the development of sustainable 3DPCM incorporating industrial by-products.

2. Materials and Specimen Preparation

The characteristics of the raw materials, the rationale for the mix design, and the specimen preparation procedures are described in this section, including the dimensional specifications of the specimens used for the mechanical tests.

2.1. Raw Materials and Characterization

Type I Portland cement, manufactured by Taiwan Cement Corporation (Taipei, Taiwan), was used as the primary binder in this study. Silica fume, characterized by its high specific surface area, was incorporated as a supplementary cementitious material to enhance mechanical strength and densify the microstructure of the cementitious matrix.
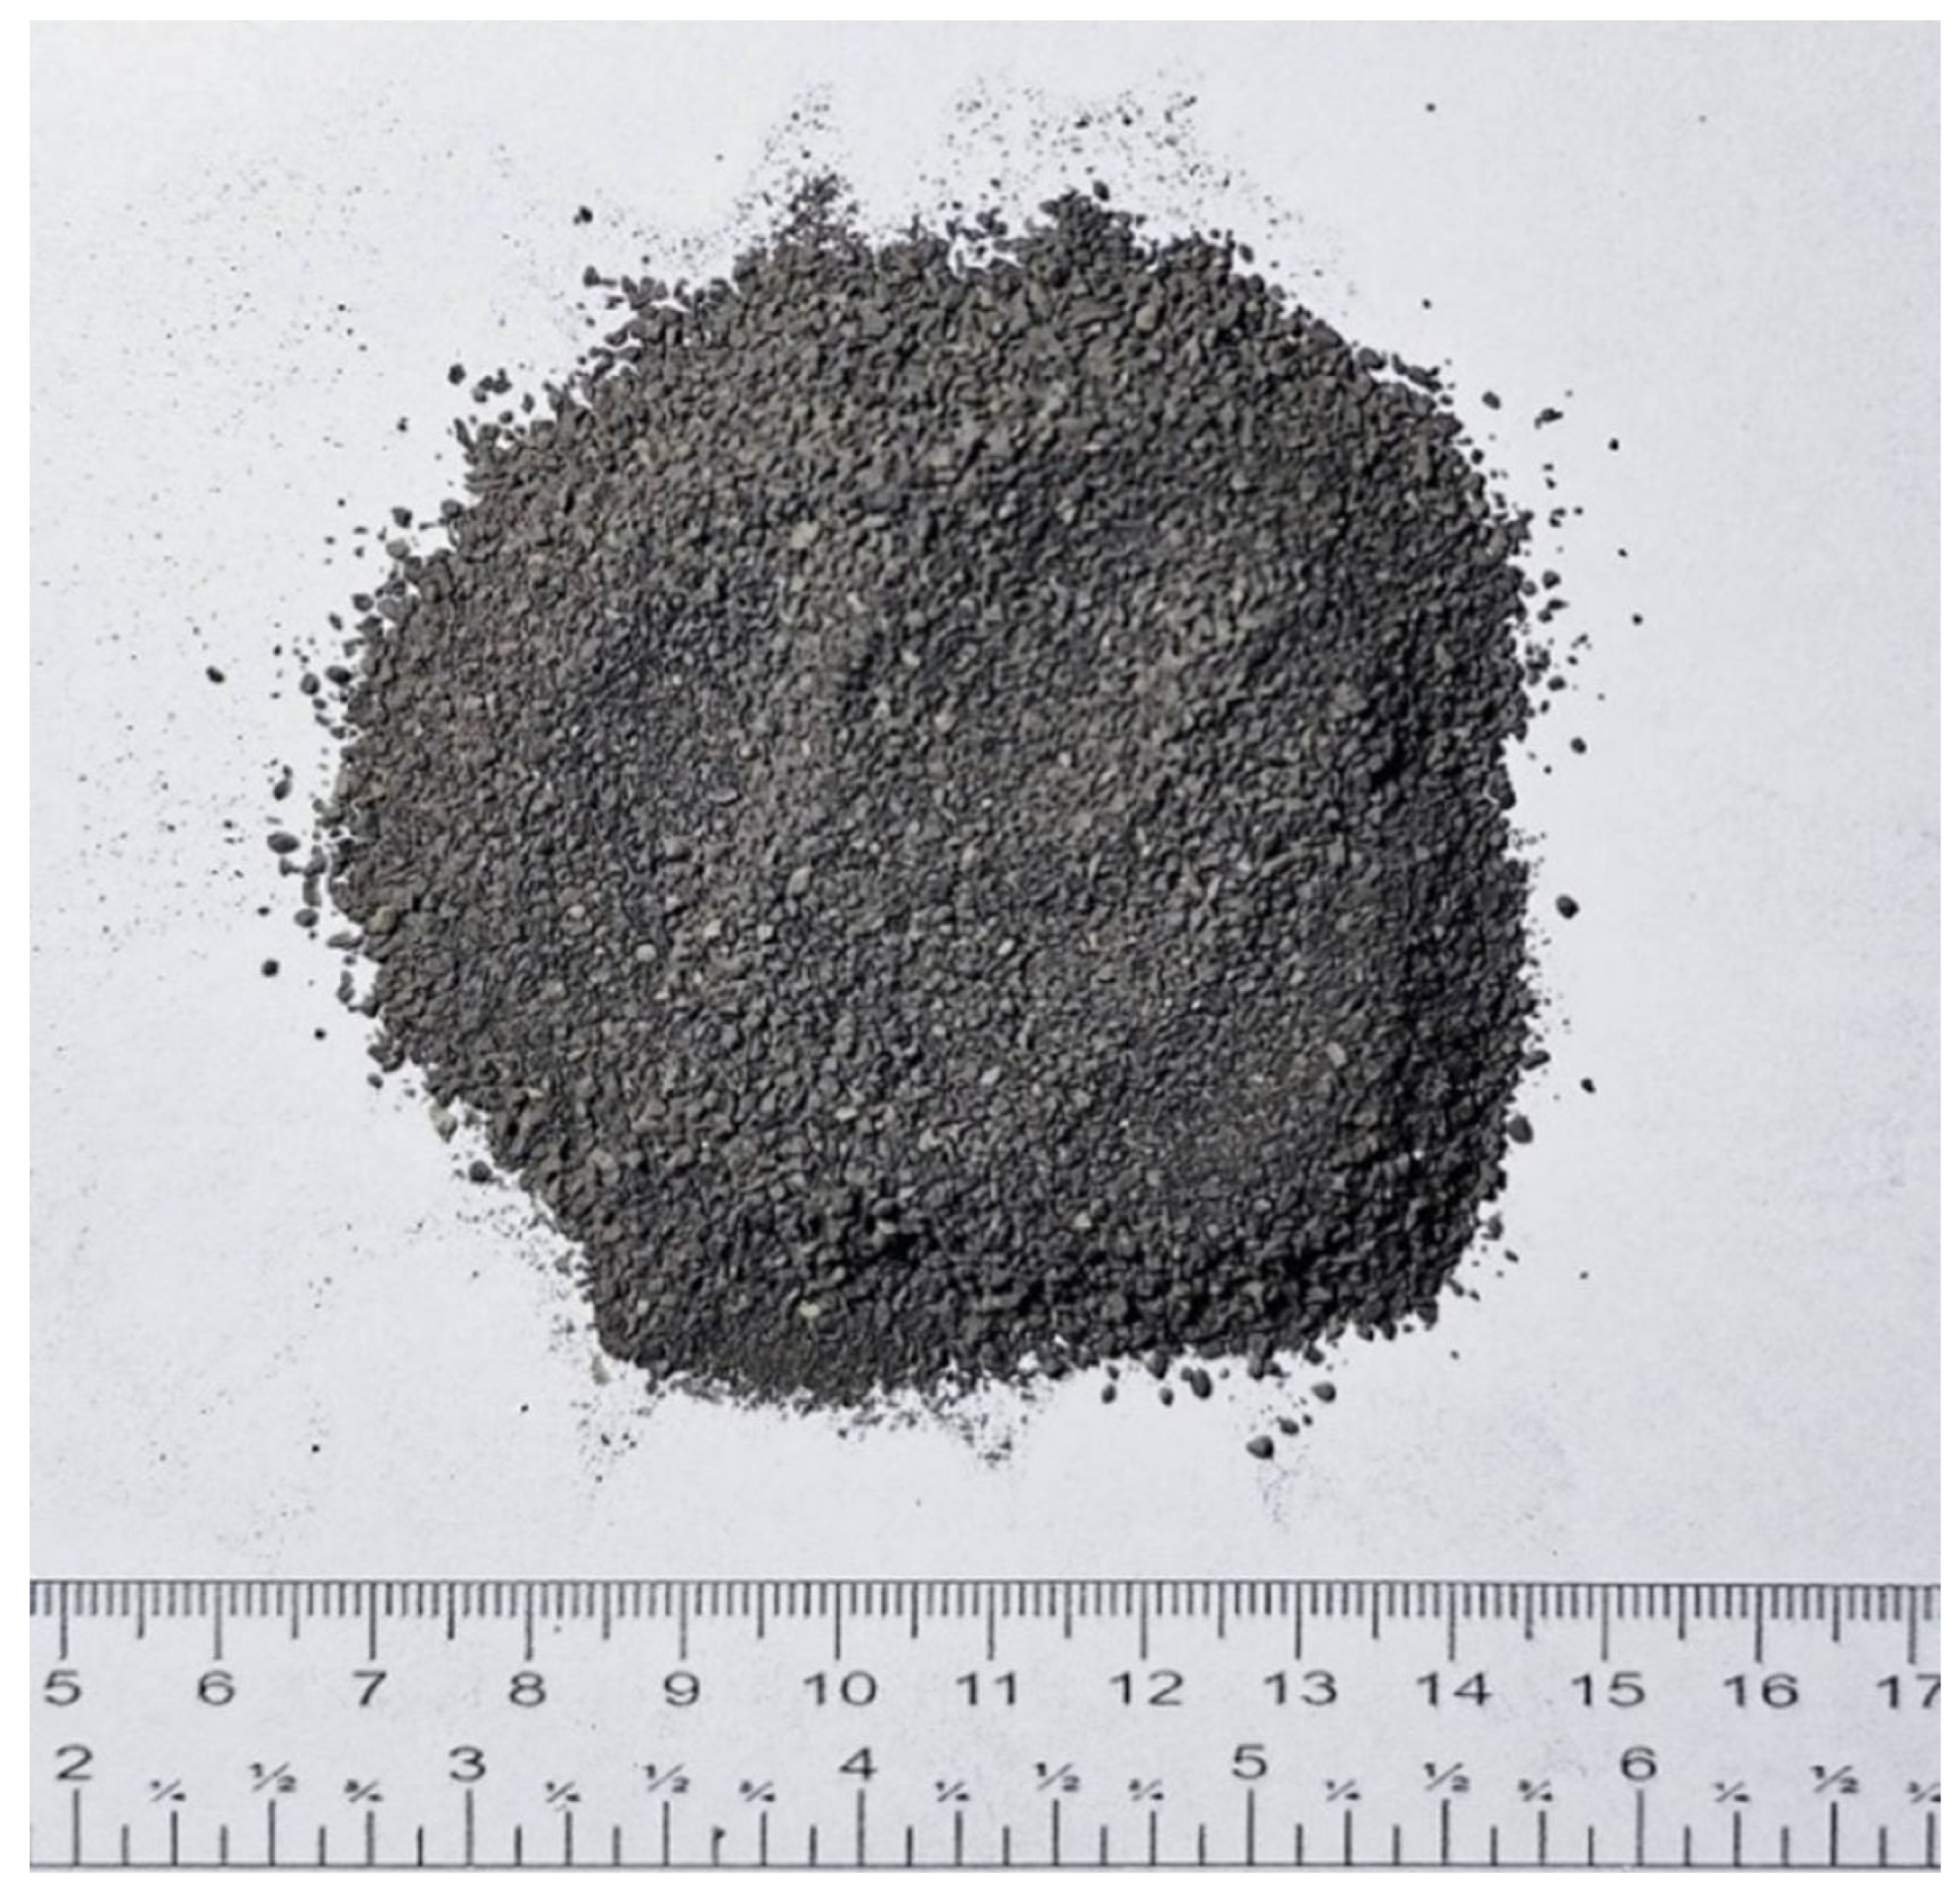
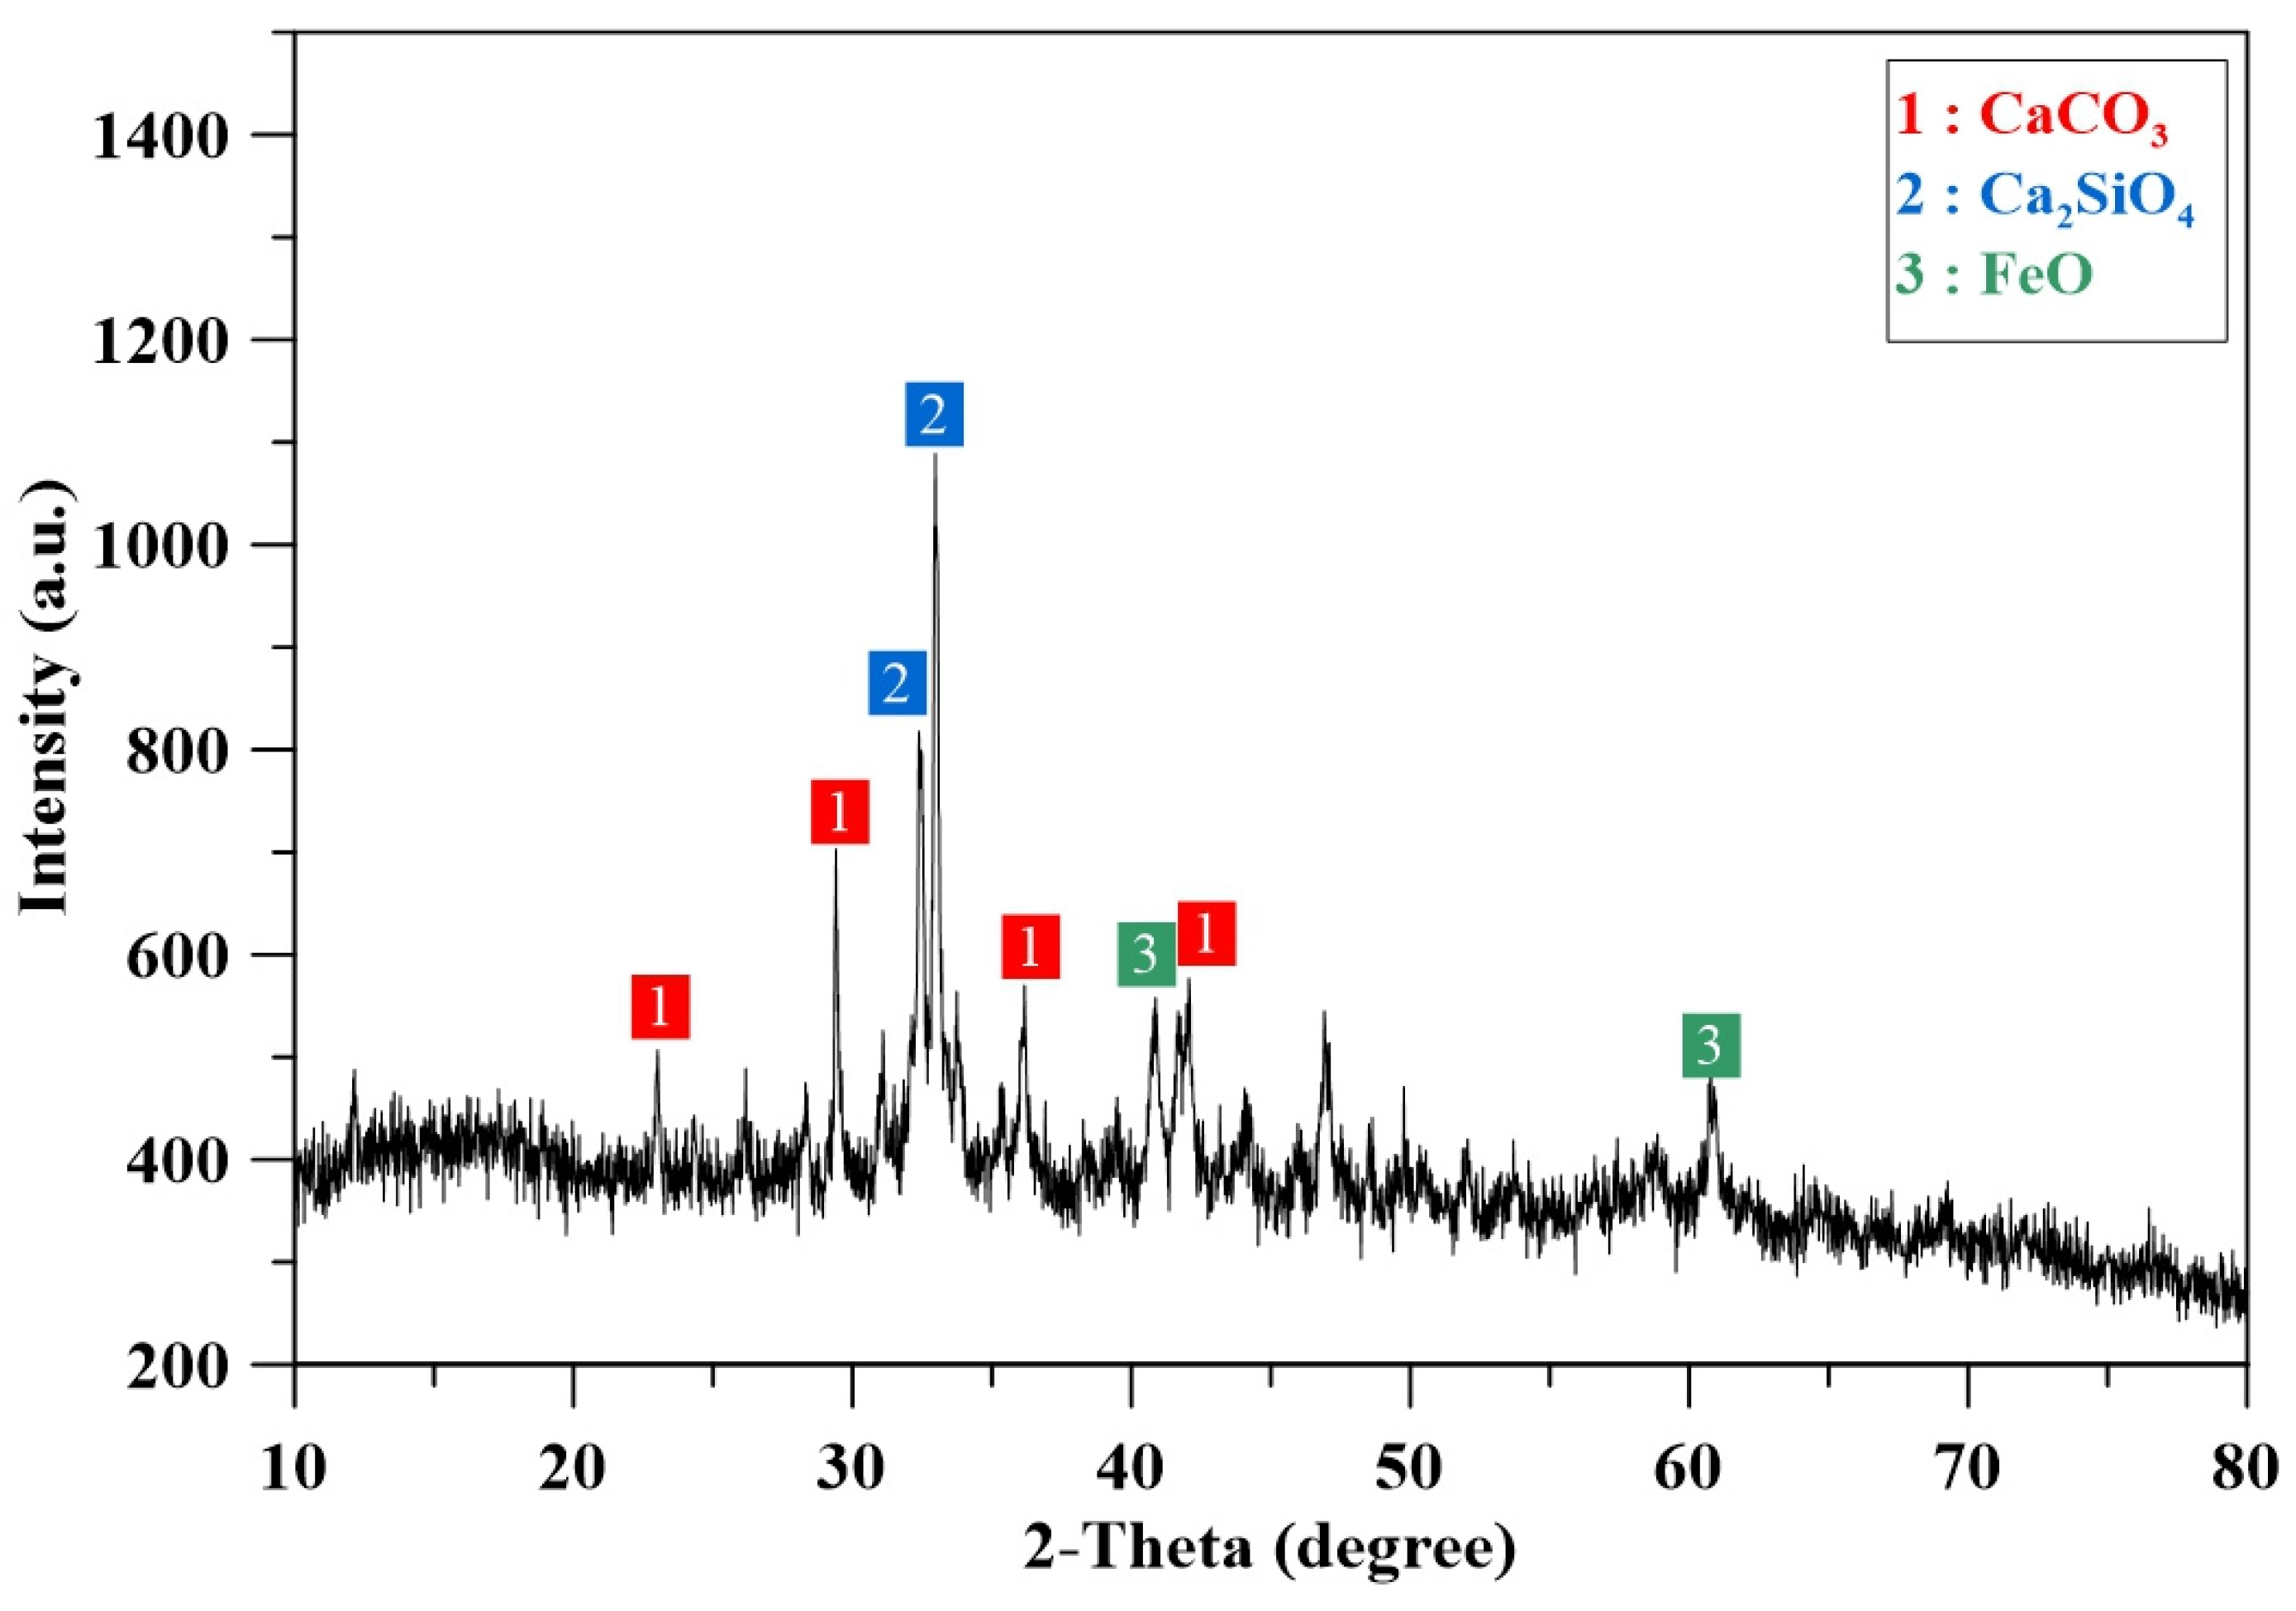
MBOFS sand, supplied by China Steel Corporation (Kaohsiung, Taiwan), was used as the fine aggregate to replace natural sand. To ensure extrusion stability and prevent nozzle blockage during the 3D printing process, the MBOFS sand was sieved to pass through a No. 16 ASTM sieve, corresponding to an opening size of 1.18 mm. The fineness modulus of the processed MBOFS sand was 2.3, as shown in Figure 1. The mineralogical phases of MBOFS were characterized by X-ray diffraction (XRD), and the results are presented in Figure 2. The XRD pattern indicates that MBOFS mainly consists of CaCO3, Ca2SiO4, and FeO. The presence of Ca2SiO4 suggests that part of the calcium-bearing phases was transformed into a more stable silicate phase during the hot-slag modification process.
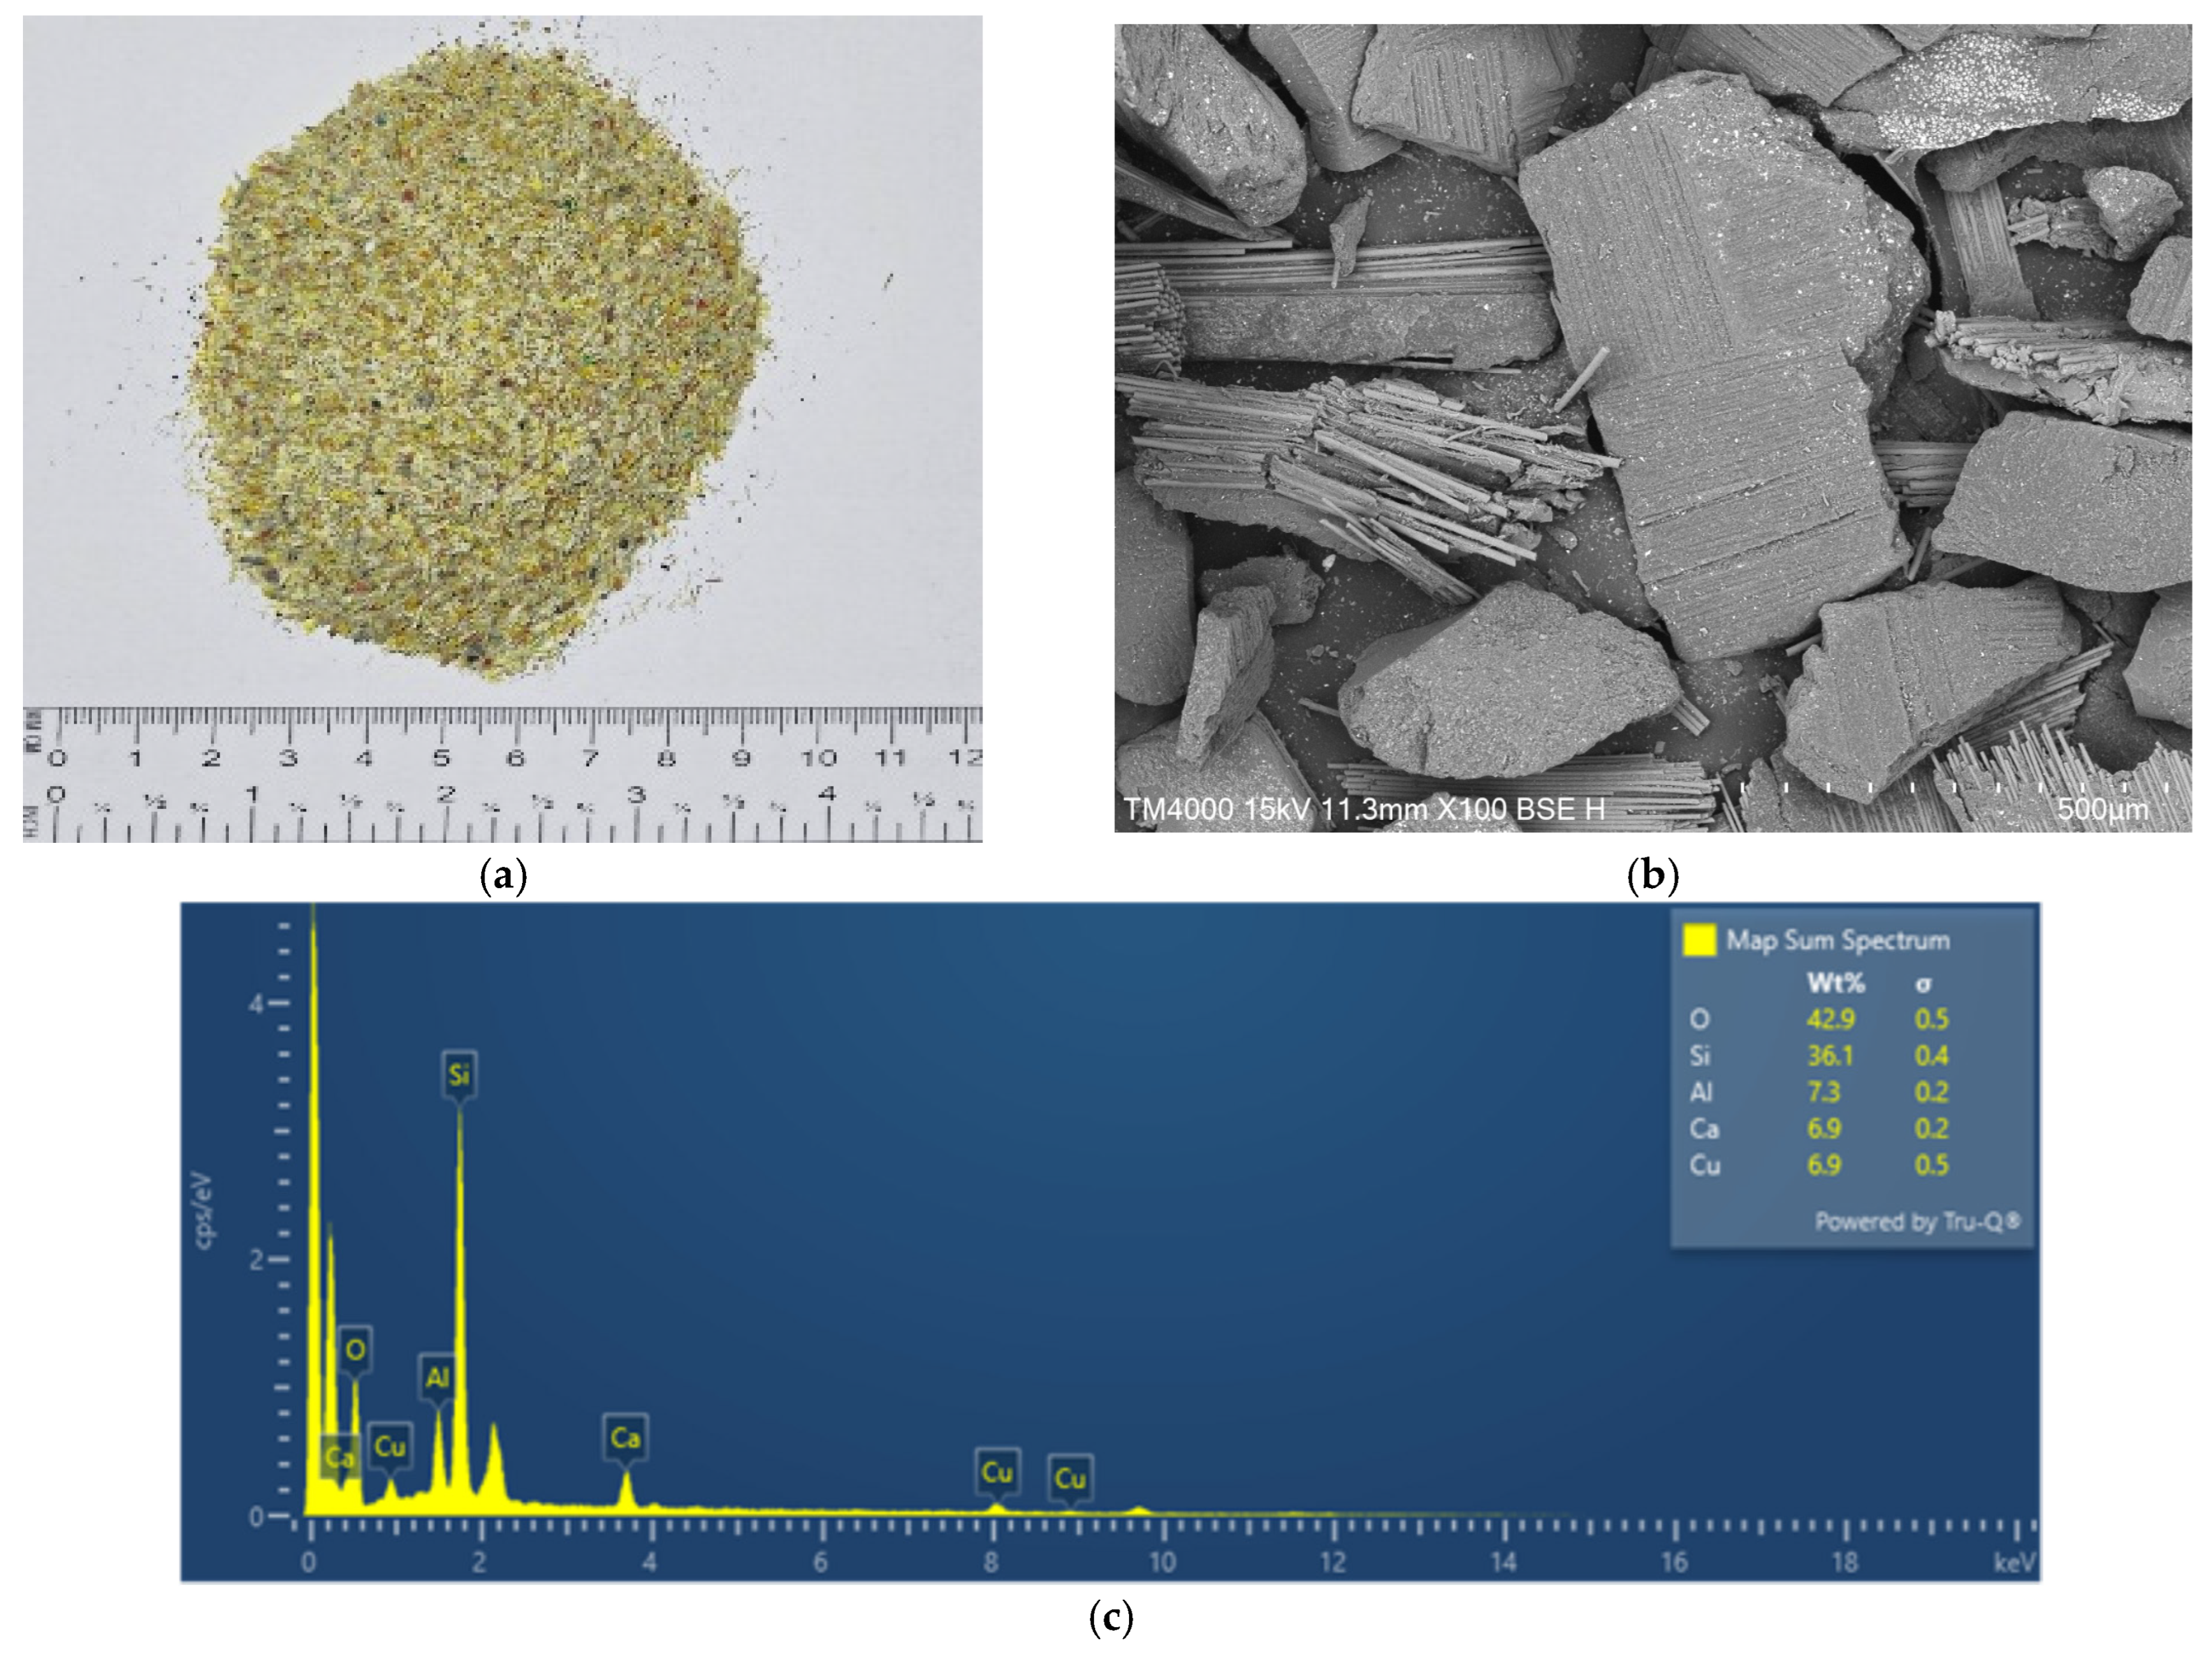
WPCBP was supplied by Super Dragon Technology Co., Ltd., Taoyuan, Taiwan. This powder is the residual non-metallic fraction obtained from waste printed circuit boards after mechanical grinding and metal-recovery separation. The supplied WPCBP mainly consisted of fine powder, together with a small amount of elongated glass fiber fragments. All powders were able to pass through a No. 16 ASTM sieve, and the fineness modulus of WPCBP was 1.87, as shown in Figure 3a. The morphology and elemental composition of WPCBP were further examined using SEM and EDS analysis, as shown in Figure 3b,c. The SEM image shows the fibrous morphology of the glass fiber bundles and irregular WPCBP particles. The EDS results indicate that WPCBP mainly contains O, Si, Al, Ca, and Cu, which is consistent with the presence of glass-fiber-rich constituents and residual metallic components in WPCBP. The ICP-OES results presented in Table 1 further confirmed the presence of residual inorganic and metallic constituents in WPCBP. The main detected elements included Cu, Ca, P, Fe, K, Na, and Al, with Cu and Ca contents of 6.9 and 2.6 g/kg, respectively.
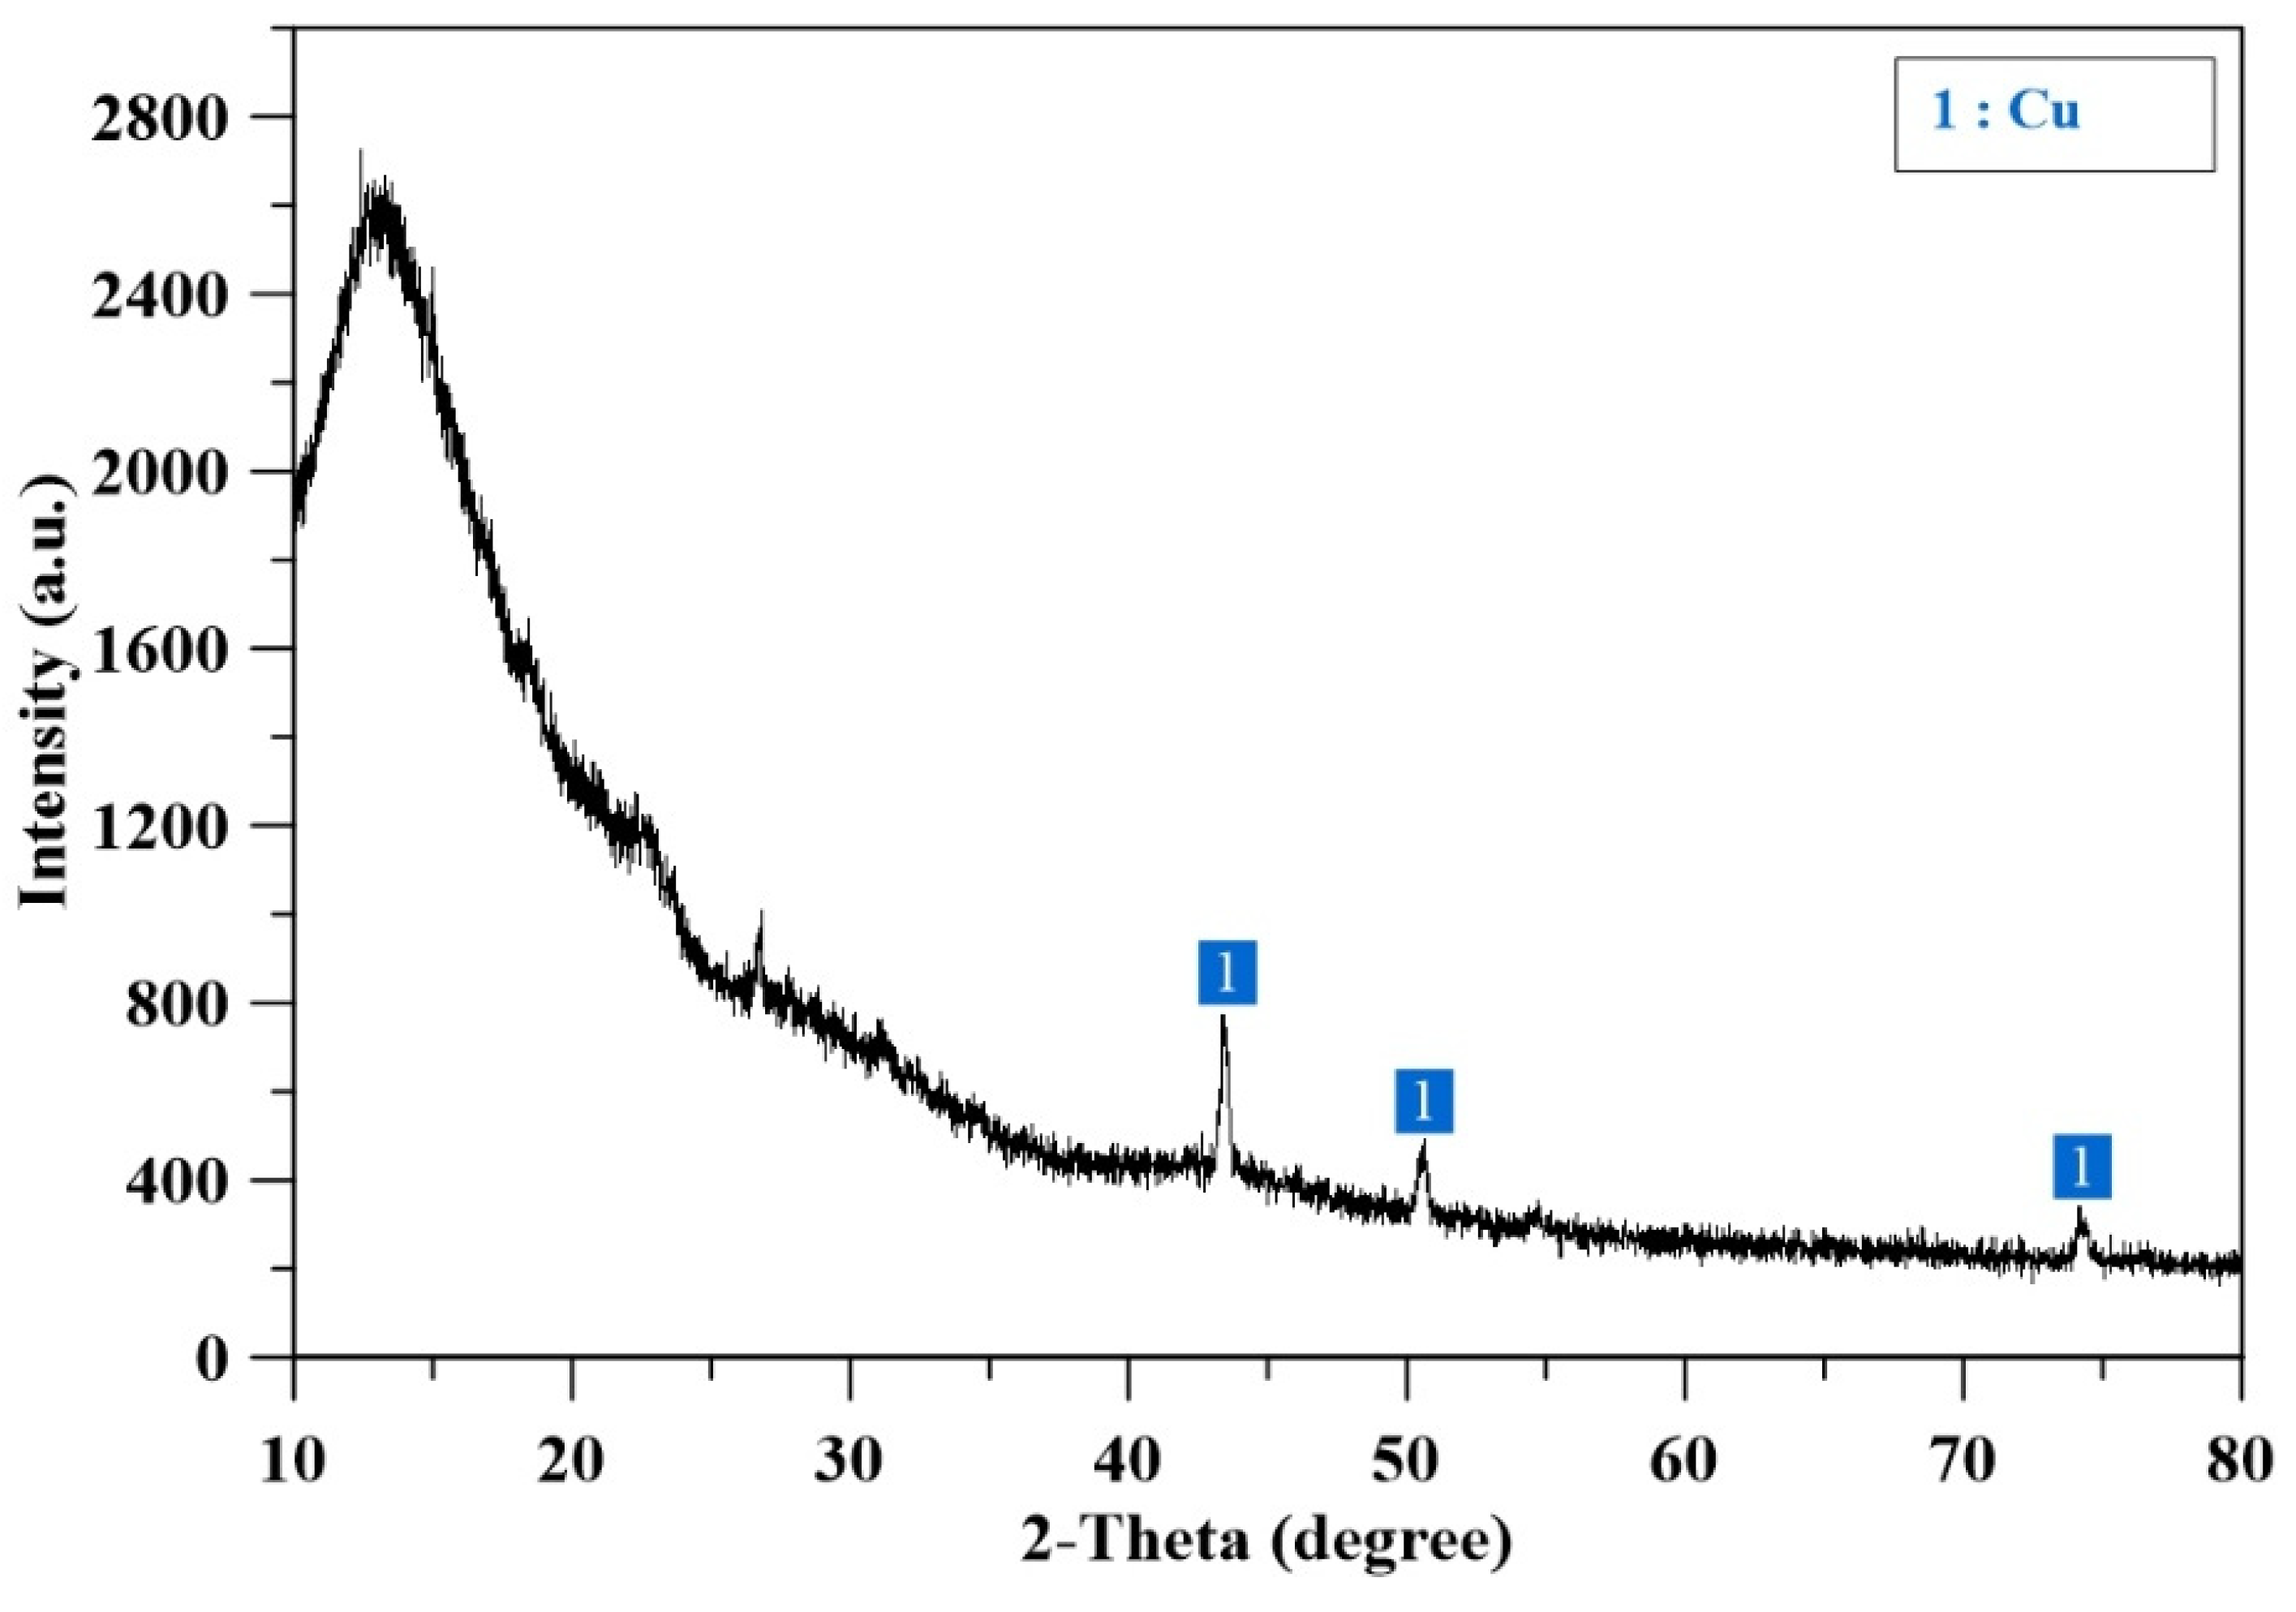
Its mineralogical characteristics were analyzed by XRD, and the results are shown in Figure 4. The XRD pattern of WPCBP shows a broad amorphous background, which may be associated with the glass fiber and resin phases in the non-metallic fraction. In addition, several weak diffraction peaks corresponding to Cu were observed, indicating that a small amount of residual metallic copper remained after the recycling and separation process.
To regulate the rheological properties and setting behavior of the mixtures, a superplasticizer (SP) and an accelerator (AC) were used. The SP was G-TYPE High-Performance Superplasticizer, manufactured by Kuan-Chiang Industry Co., Ltd. (Taoyuan, Taiwan), and the AC was Sika® Sigunit® L-54 AF, a liquid alkali-free accelerator supplied by Sika Taiwan Ltd. (Taipei, Taiwan). These admixtures were employed to optimize flowability, control the initial setting time, and ensure the extrudability and buildability required for the 3D printing process.

2.2. Mix Proportions

The mix proportions were designed on a cement weight basis. The water-to-cement ratio (w/c) was fixed at 0.40, while the MBOFS sand-to-cement ratio (s/c) was maintained at 1.05. WPCBP was incorporated into the cement mortar, with dosage levels defined as WPCBP-to-cement weight ratios of WPCBP/C = 0, 10, 20, 30, and 40 wt.%. To compensate for variations in rheological behavior induced by WPCBP incorporation, the SP dosage was adjusted to achieve comparable workability across all mixtures. The detailed mix proportions are summarized in Table 2.
A standardized mixing procedure was adopted to ensure uniform dispersion of all constituents. Initially, all dry materials, including cement, silica fume, MBOFS sand, and WPCBP, were dry-mixed for 1 min per batch to achieve preliminary homogenization. Subsequently, the premixed liquid phase, consisting of water, SP, and AC, was gradually introduced under low-speed mixing. Finally, the mixture was subjected to high-speed mixing for 30 s to obtain a homogeneous 3DPCM.

2.3. Specimen Preparation and Configuration

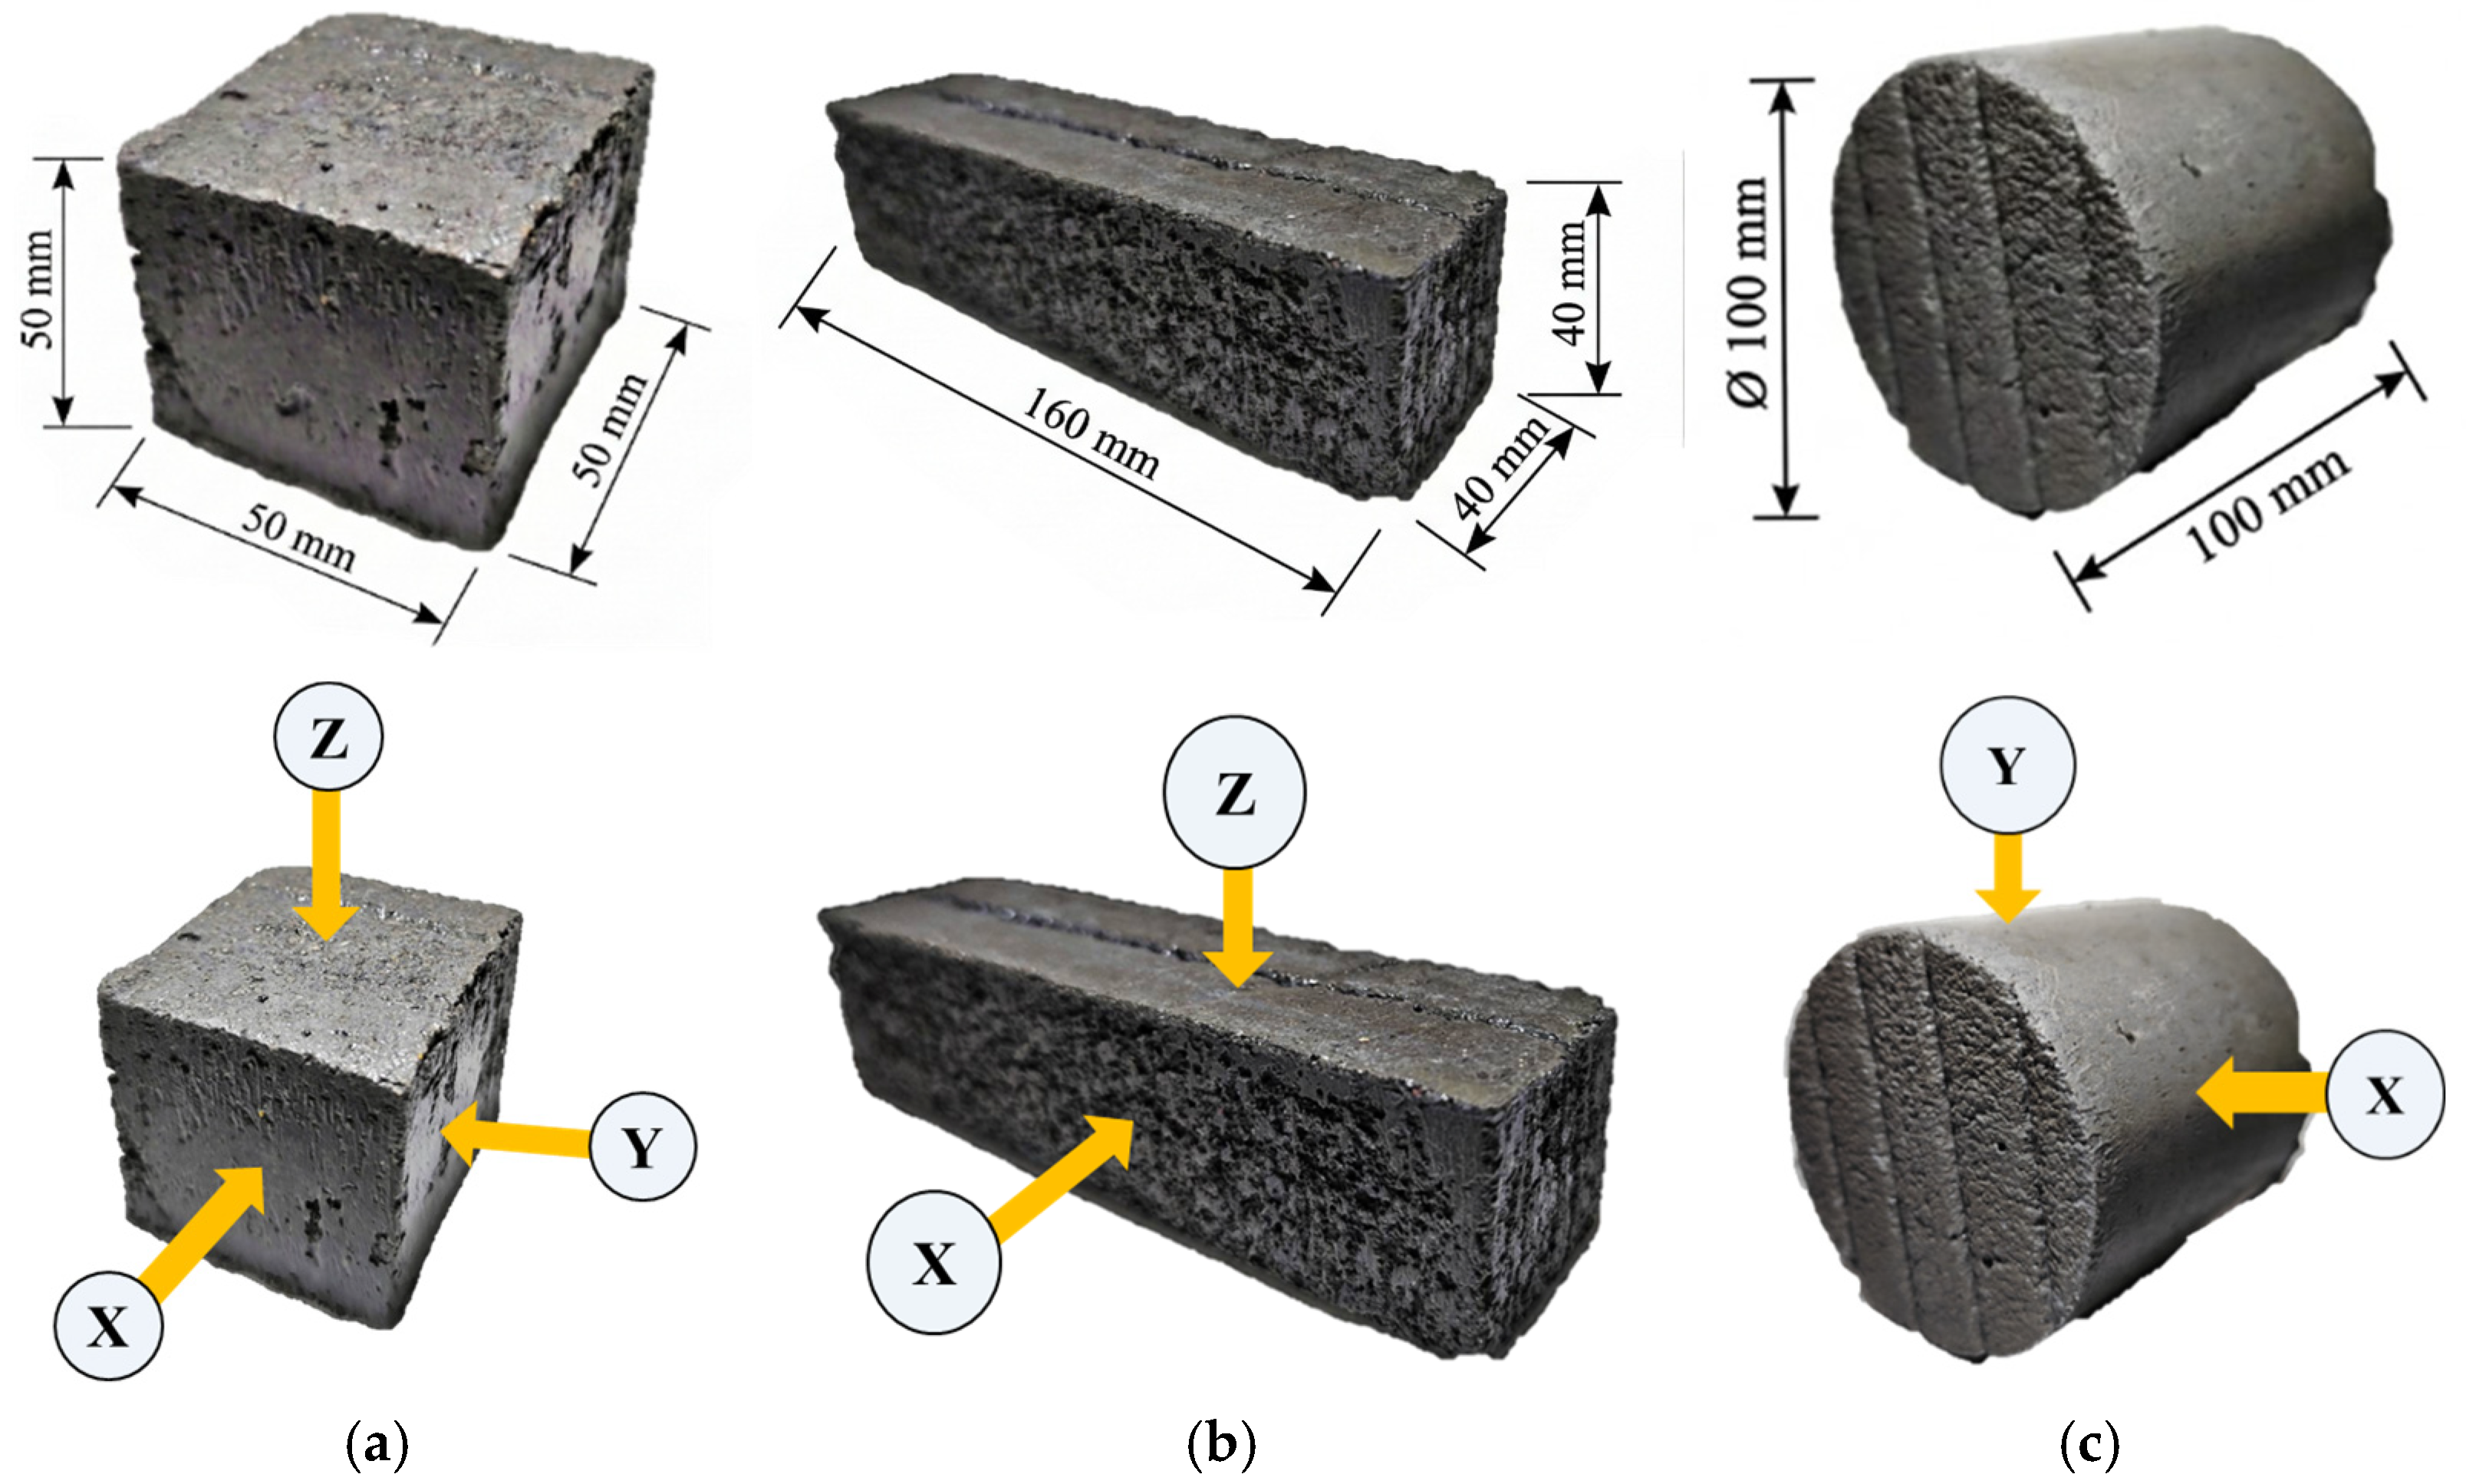
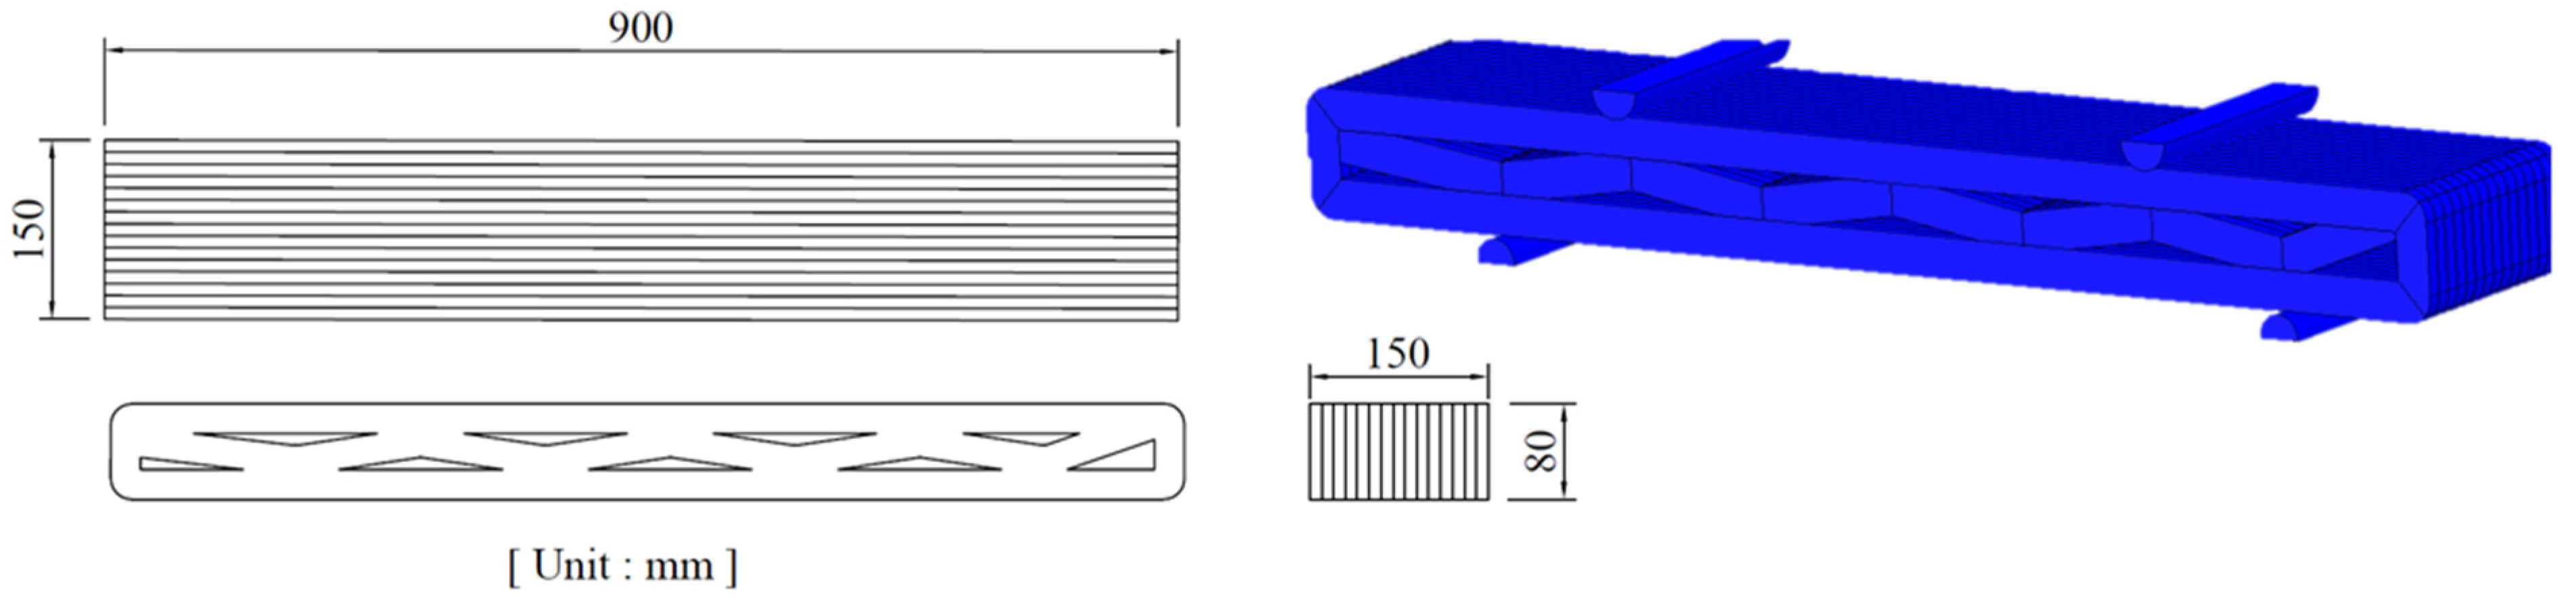
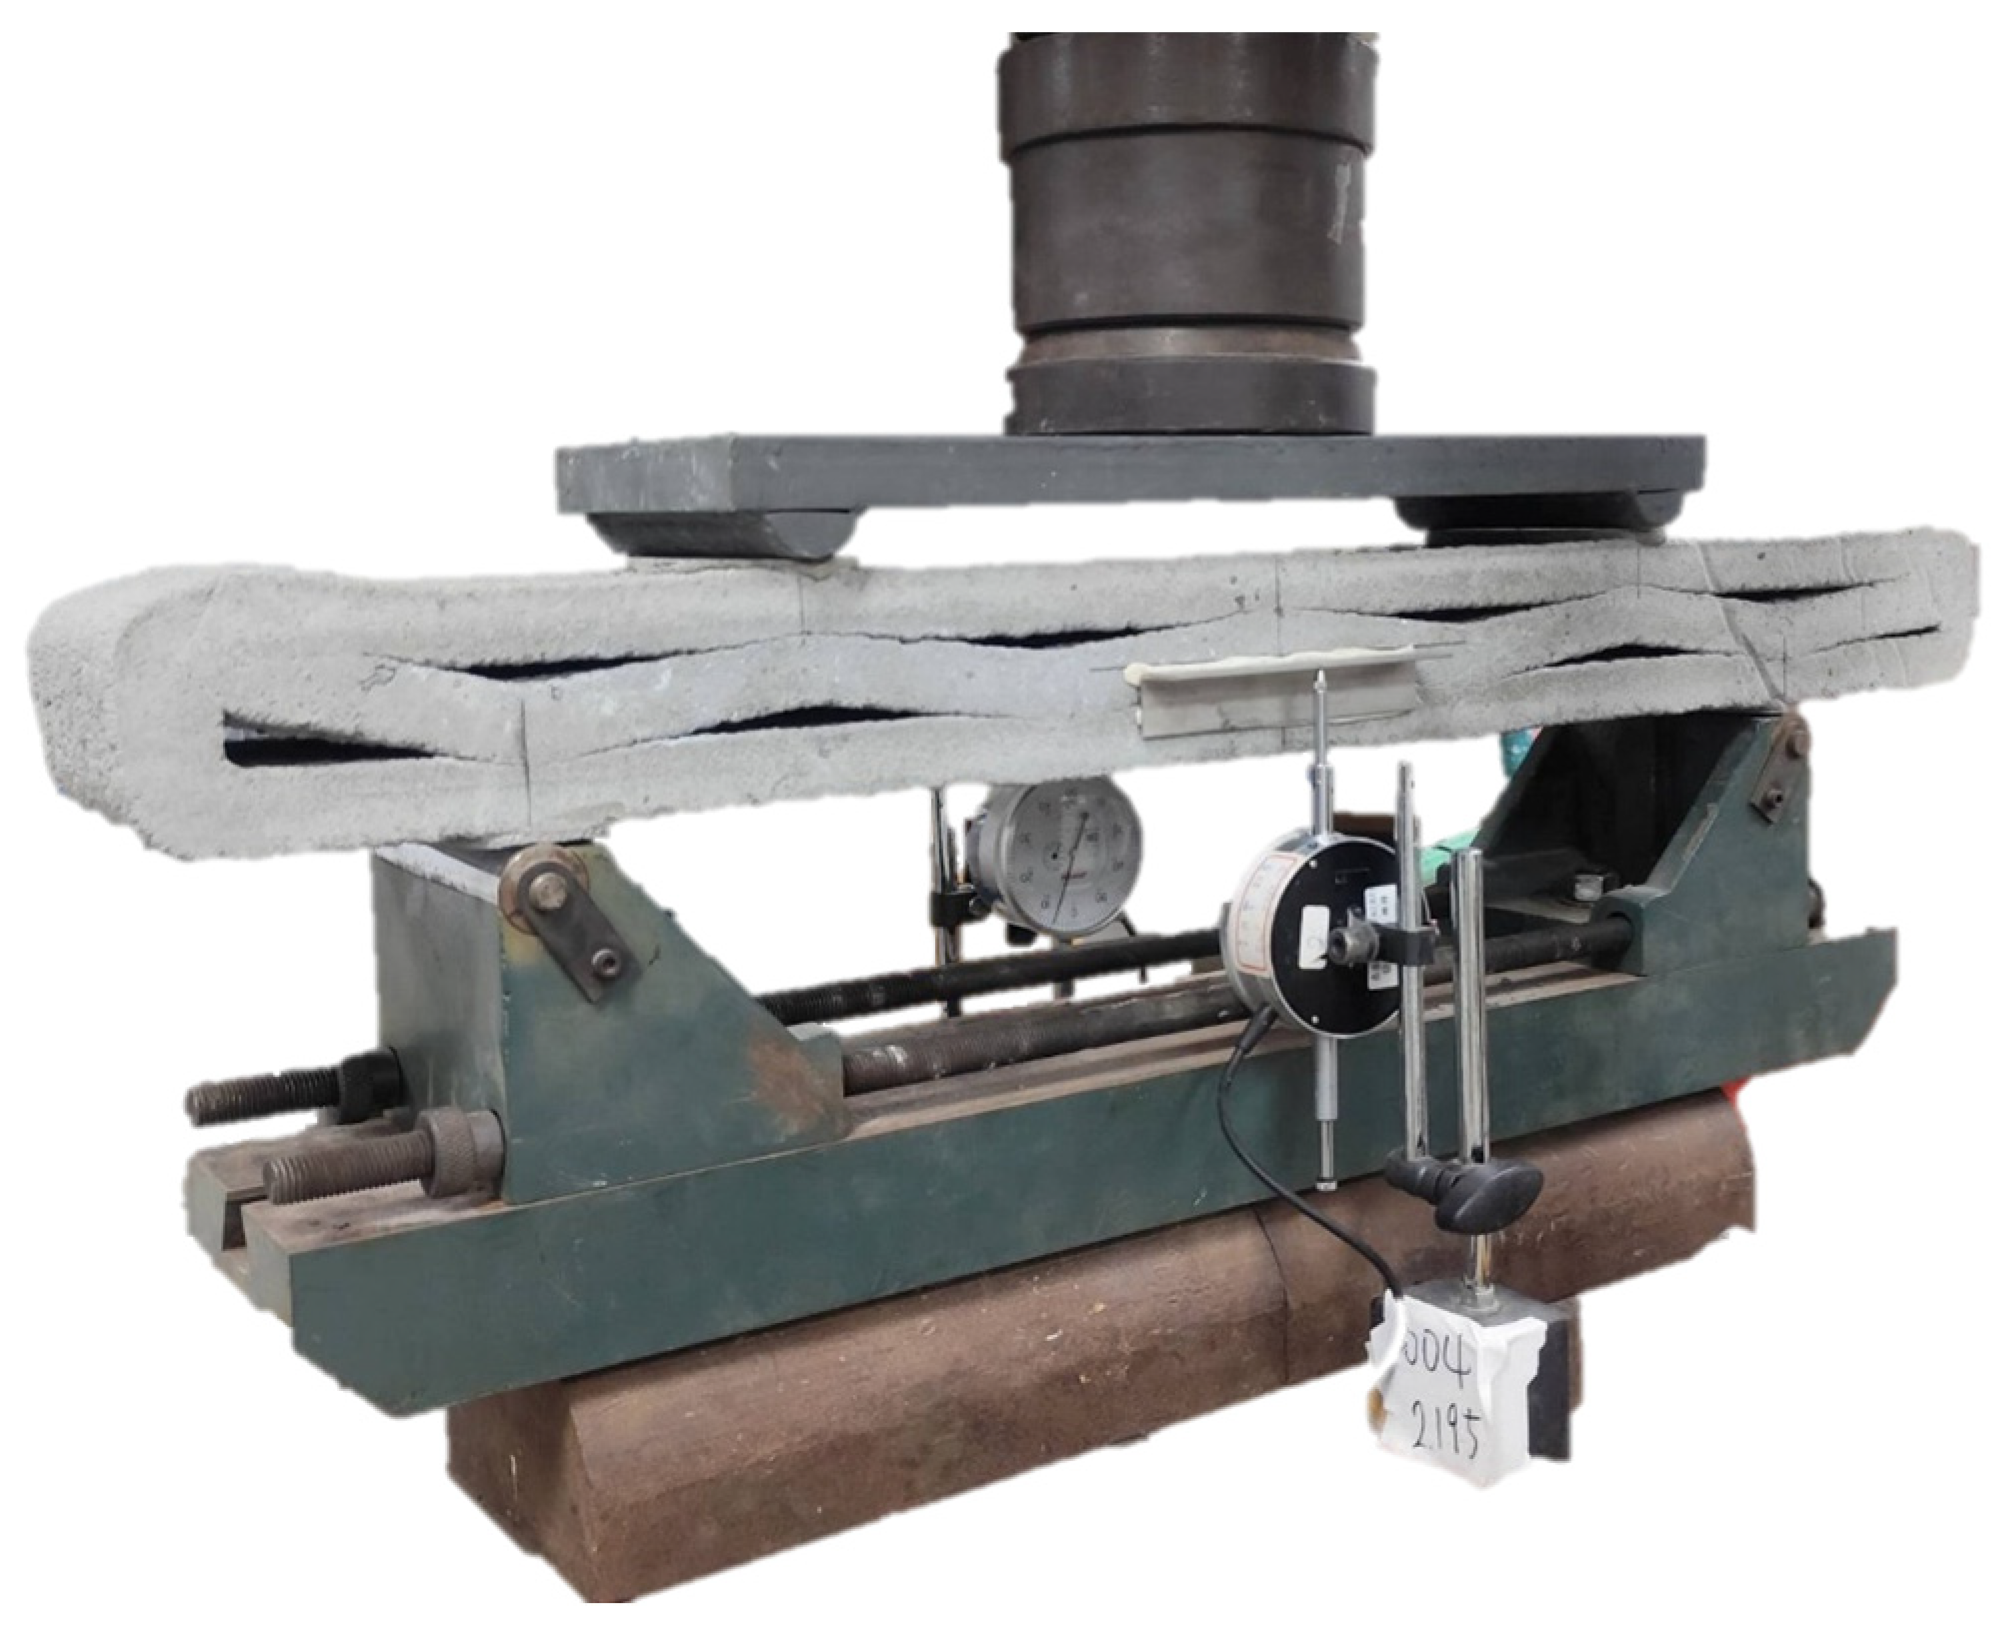
To systematically evaluate the mechanical performance and anisotropic behavior of 3DPCM, both 3D-printed and mold-cast specimens were prepared for comparative analysis. Because 3D-printed specimens are not homogeneous materials and exhibit anisotropic characteristics, the coordinate directions of the 3D-printed specimens were defined. The Y-direction was defined as the printing direction, the X-direction was defined as the direction perpendicular to the printing direction, and the Z-direction was defined as the extrusion-head direction. Three types of specimens were fabricated to characterize the fundamental mechanical properties. The testing procedures, applicable standards, and number of replicate specimens are described in Section 3.2. As shown in Figure 5a, cubic specimens measuring 50 mm × 50 mm × 50 mm were used for compressive strength testing, with loading applied along three orthogonal directions, namely the X, Y, and Z axes. As shown in Figure 5b, prismatic specimens measuring 160 mm × 40 mm × 40 mm were used for flexural strength testing, with loading applied along the X and Z directions. As shown in Figure 5c, cylindrical specimens with a diameter of 100 mm and a height of 100 mm were used for splitting tensile strength testing, with loading applied along the X and Y directions. To further assess the structural applicability of the developed materials, large-scale 3D-printed truss members measuring 900 mm × 150 mm × 80 mm were fabricated and subjected to four-point bending tests, as shown in Figure 6. The four-point bending test was conducted with a support span of 630 mm and a spacing of 425 mm between the two loading points. The midspan displacement of each specimen was measured using dial gauges.
A standardized nomenclature system was established to ensure clarity and consistency in data interpretation. The coding rules and abbreviation definitions are summarized in Table 3. For example, the designation “C-CMW10-X” represents a mold-cast compressive specimen containing WPCBP with a WPCBP/C ratio of 10 wt.%, tested under loading along the X-axis.

3. Experimental Program

The experimental program is divided into three primary sections: the printability of 3DPCM, quasi-static mechanical property tests, and four-point bending tests of 3D-printed truss members.

3.1. Printability Evaluation

The printability performance of the 3DPCM was evaluated based on four key indicators: initial setting time, flowability, extrudability, and buildability.

3.1.1. Initial Setting Time Test

The setting time of the cement mortar was determined using a Vicat apparatus (Kao Wei Precision Instruments Co., Ltd., Taipei, Taiwan). The testing procedure was conducted with reference to ASTM C191-26 [55], with appropriate modifications made according to the actual characteristics of the mortar. The measured setting time profile was used as the basis for determining the optimal AC dosage, which was kept constant in all subsequent mixture proportions.

3.1.2. Flowability Test

The flowability of the cementitious mortar was evaluated using a flow table apparatus (Kuang Hsin Instruments Co., Ltd., Kaohsiung, Taiwan) in accordance with ASTM C1437-20 [56]. The target flow diameter was controlled within the range of 150–190 mm [51], which served as the primary criterion for adjusting the dosage of SP for mixtures with varying WPCBP contents. To further assess the printability of 3DPCM, a mini-slump test was conducted on the optimized mortar compositions containing WPCBP and MBOFS sand. The mini-slump test was performed to determine the slump value of 3DPCM. The dimensions of the mini-slump cone used were 50 mm in top diameter, 100 mm in bottom diameter, and 150 mm in height.

3.1.3. Extrudability Test

The extrusion performance of 3DPCM was evaluated using a peristaltic pump (Model WS-300, Dongbin Co., Ltd., New Taipei City, Taiwan). During the test, four cement mortar filaments with a length of 300 mm were continuously extruded to assess extrusion stability and continuity [50,57].

3.1.4. Buildability Test

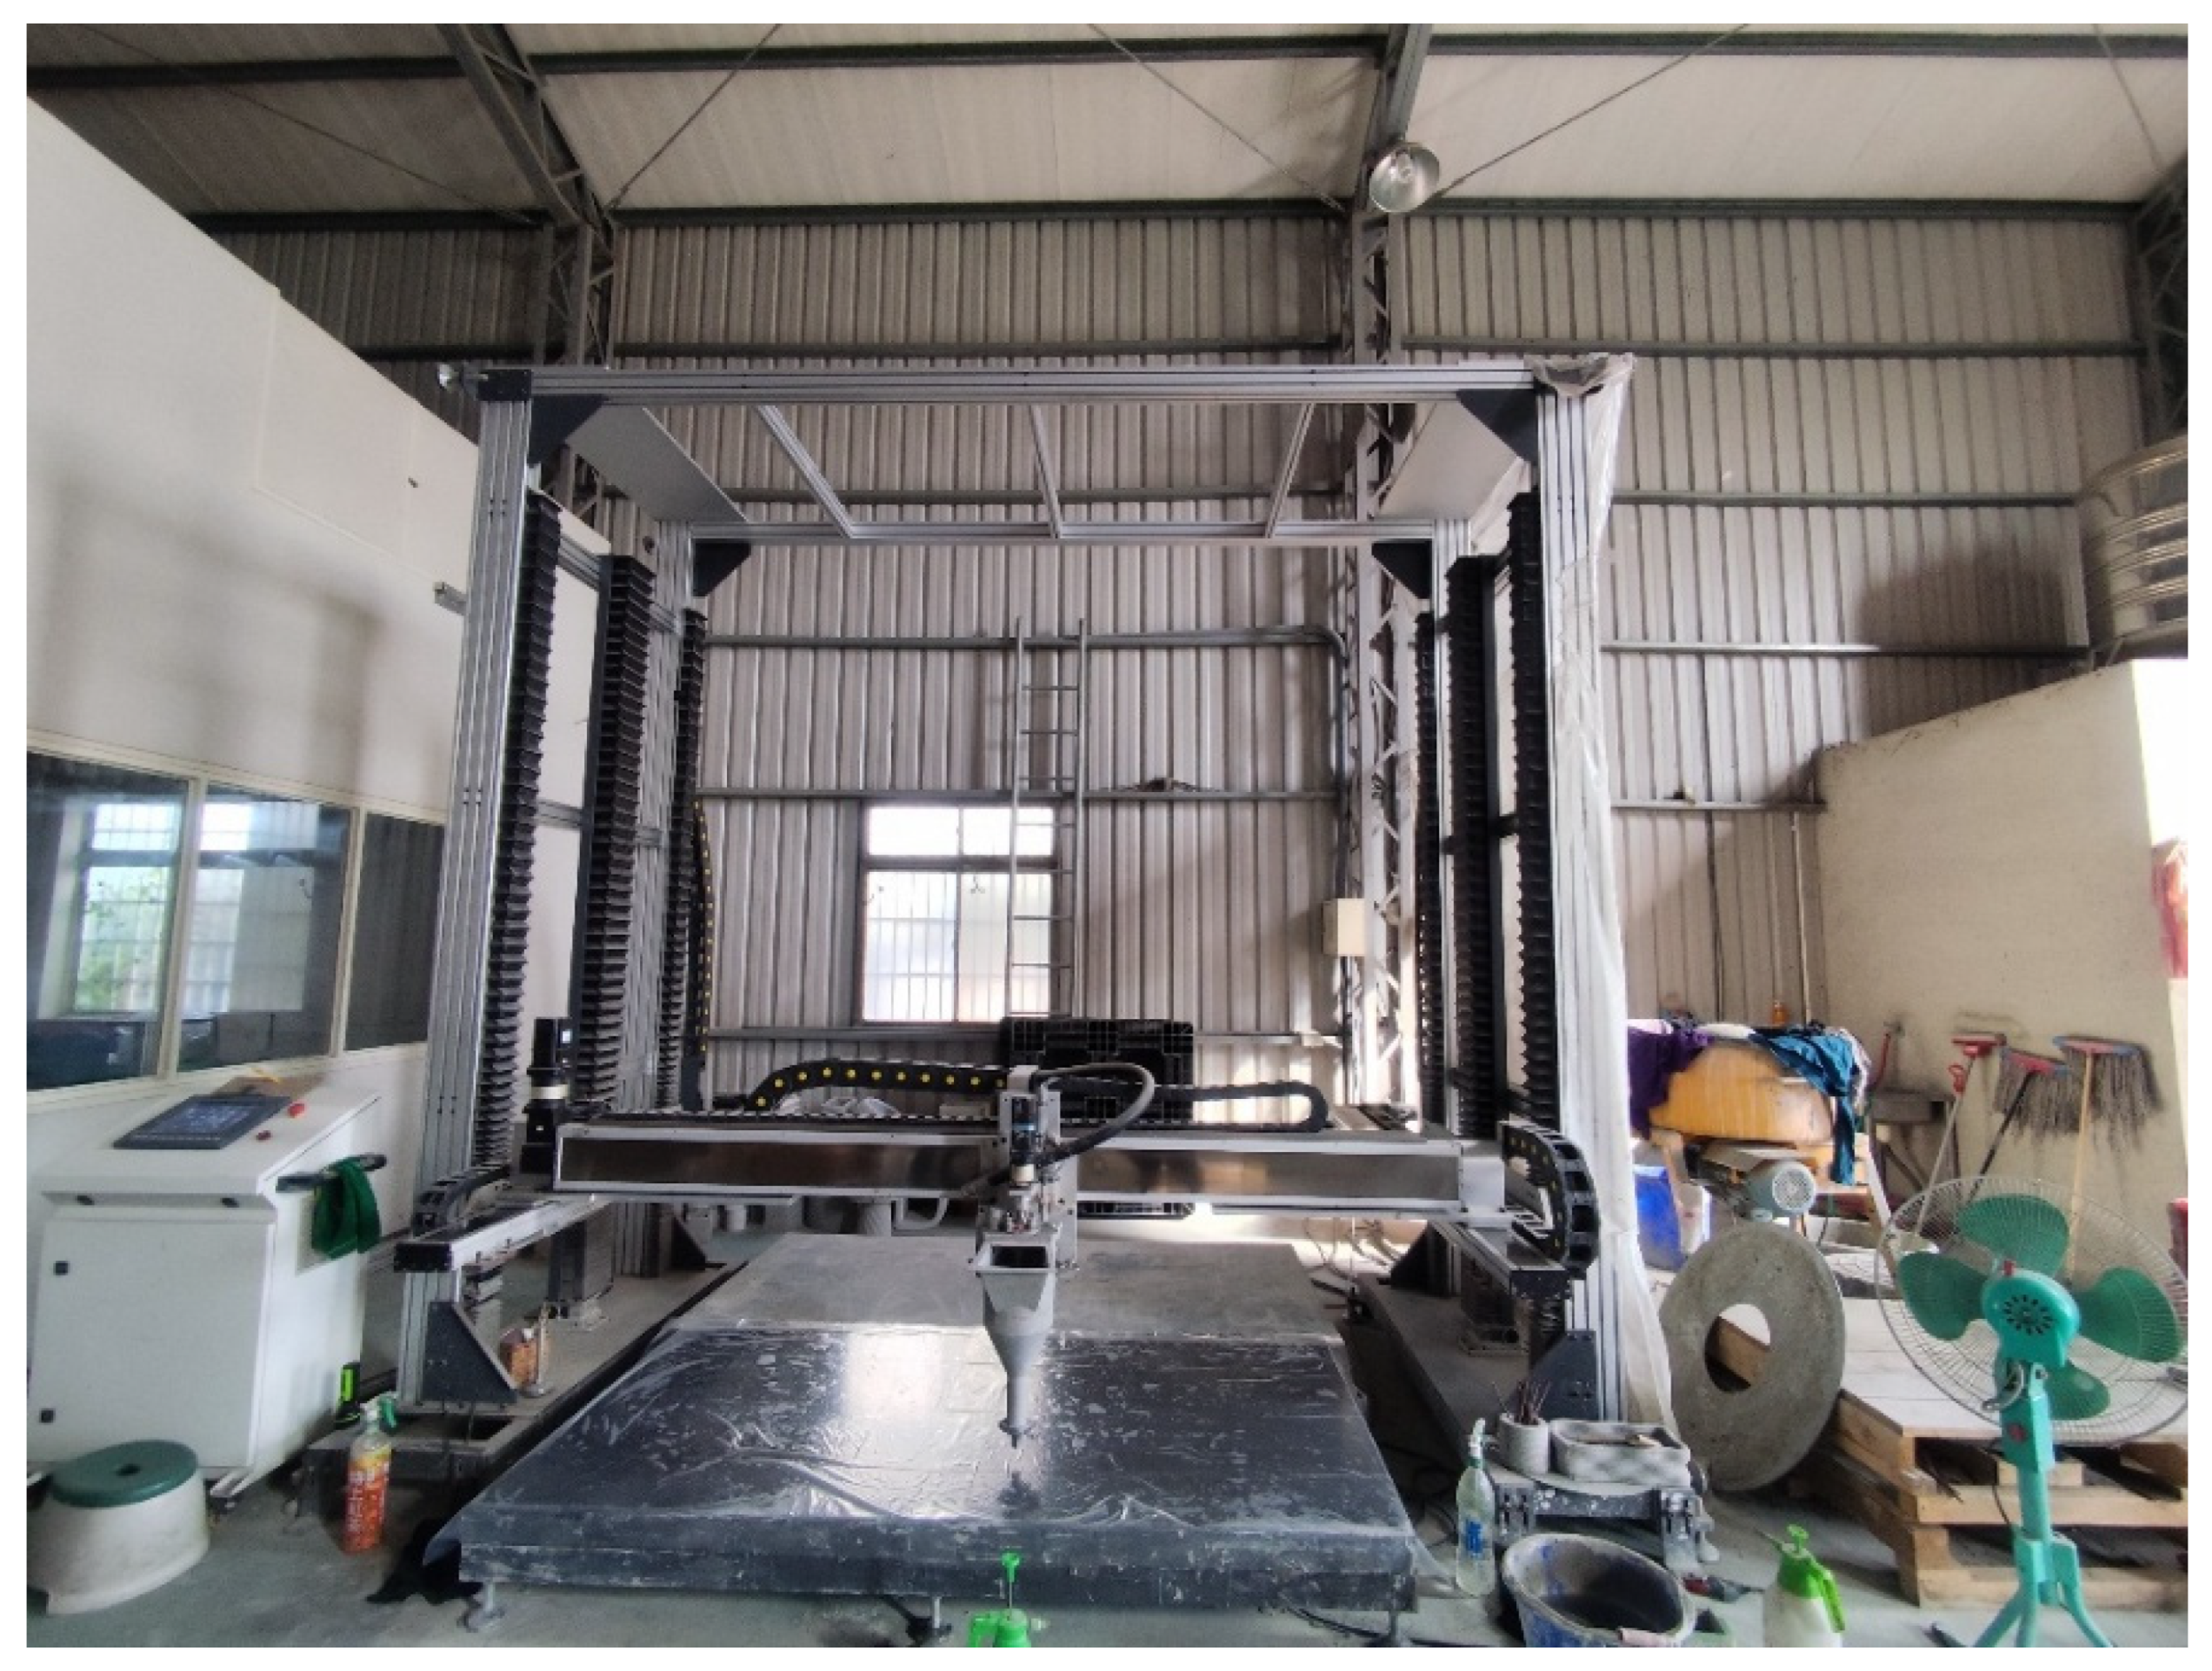
A gantry-type 3D printing system manufactured by UMAS Technology Co., Ltd. (Taichung City, Taiwan) was used, as shown in Figure 7. To evaluate buildability, the nozzle diameter and printing speed were set to 20 mm and 42 mm/s, respectively. The successful fabrication of a 25-layer hollow cylinder with a diameter of 100 mm and a height of 200 mm, without collapse or interruption, was adopted as the criterion for buildability verification.

3.2. Quasi-Static Mechanical Tests

The compressive and flexural strength tests were conducted in accordance with ASTM C109/C109M-24 [58] and ASTM C348-21 [59], respectively. Three replicate specimens were tested for each mixture and printing direction in each quasi-static mechanical test. For the structural tests, two 3D-printed truss members were tested for each mixture.

3.2.1. Compression Test

The compressive strength test was conducted in accordance with ASTM C109/C109M-24 [58]. Cubic specimens measuring 50 mm × 50 mm × 50 mm were tested using a 100-ton universal testing machine (Model HT-9501, Hung Ta Instrument Co., Ltd. (Taichung, Taiwan) at a loading rate of 100 kN/min.

3.2.2. Flexural Test

The flexural strength test was conducted in accordance with the ASTM C348-21 [59] standard, and the specimens used were rectangular prisms with dimensions of 160 × 40 × 40 mm (length × width × height). A 10-ton universal testing machine (Model WM-10EUTM, World Measurement Co., Ltd., Shenzhen China) was used to conduct the test at a loading rate of 1.2 MPa/min. The flexural strength was determined through a three-point bending test, and its calculation formula is as follows:
S f = 3 P f L 2 b d 2
where S f is flexural strength (MPa), P f is the failure load (N), L is the span (mm), and b and d are the width and depth of the specimen cross-section (mm).

3.2.3. Splitting Tensile Test

The splitting test was conducted in accordance with the ASTM C496/C496M-17 [60] standard, and the specimens used were cylindrical specimens with dimensions of diameter 100 × height 100 mm. The HT-9501 testing machine (Taichung, Taiwan) was used to conduct the test at a loading rate of 1.4 MPa/min. The splitting tensile strength is calculated as follows:
T = 2 P s t π L D
where T is the splitting tensile strength (MPa), P s t is the maximum applied load (N), L is the length (mm), and D is the diameter (mm).

3.3. Four-Point Bending Test of 3D-Printed Truss Member

The four-point bending test of the 3D-printed truss members was developed with reference to ASTM C78M-22 [61]. The specimens were 900 mm in length, 150 mm in width, and 80 mm in height, and were designed to evaluate structural performance under varying WPCBP contents. A schematic of the test setup is presented in Figure 8. The span between the two supports was 630 mm, while the distance between the two loading points was 425 mm, forming a moment region at the midspan of the specimen. Loading was applied under displacement-controlled conditions at a rate corresponding to 1600 N/min. To accurately capture the flexural response, dial gauges were installed symmetrically on both sides of the specimen at midspan, at a height of 75 mm corresponding to the neutral axis.

4. Printability Evaluation of 3DPCM

The printability of the developed 3DPCM incorporating MBOFS sand and varying WPCBP contents was systematically evaluated. To ensure practical applicability in extrusion-based 3D printing, the performance of 3DPCM was assessed based on key printability indicators, including initial setting time, flowability, extrudability, and buildability.

4.1. Initial Setting Time Test Result

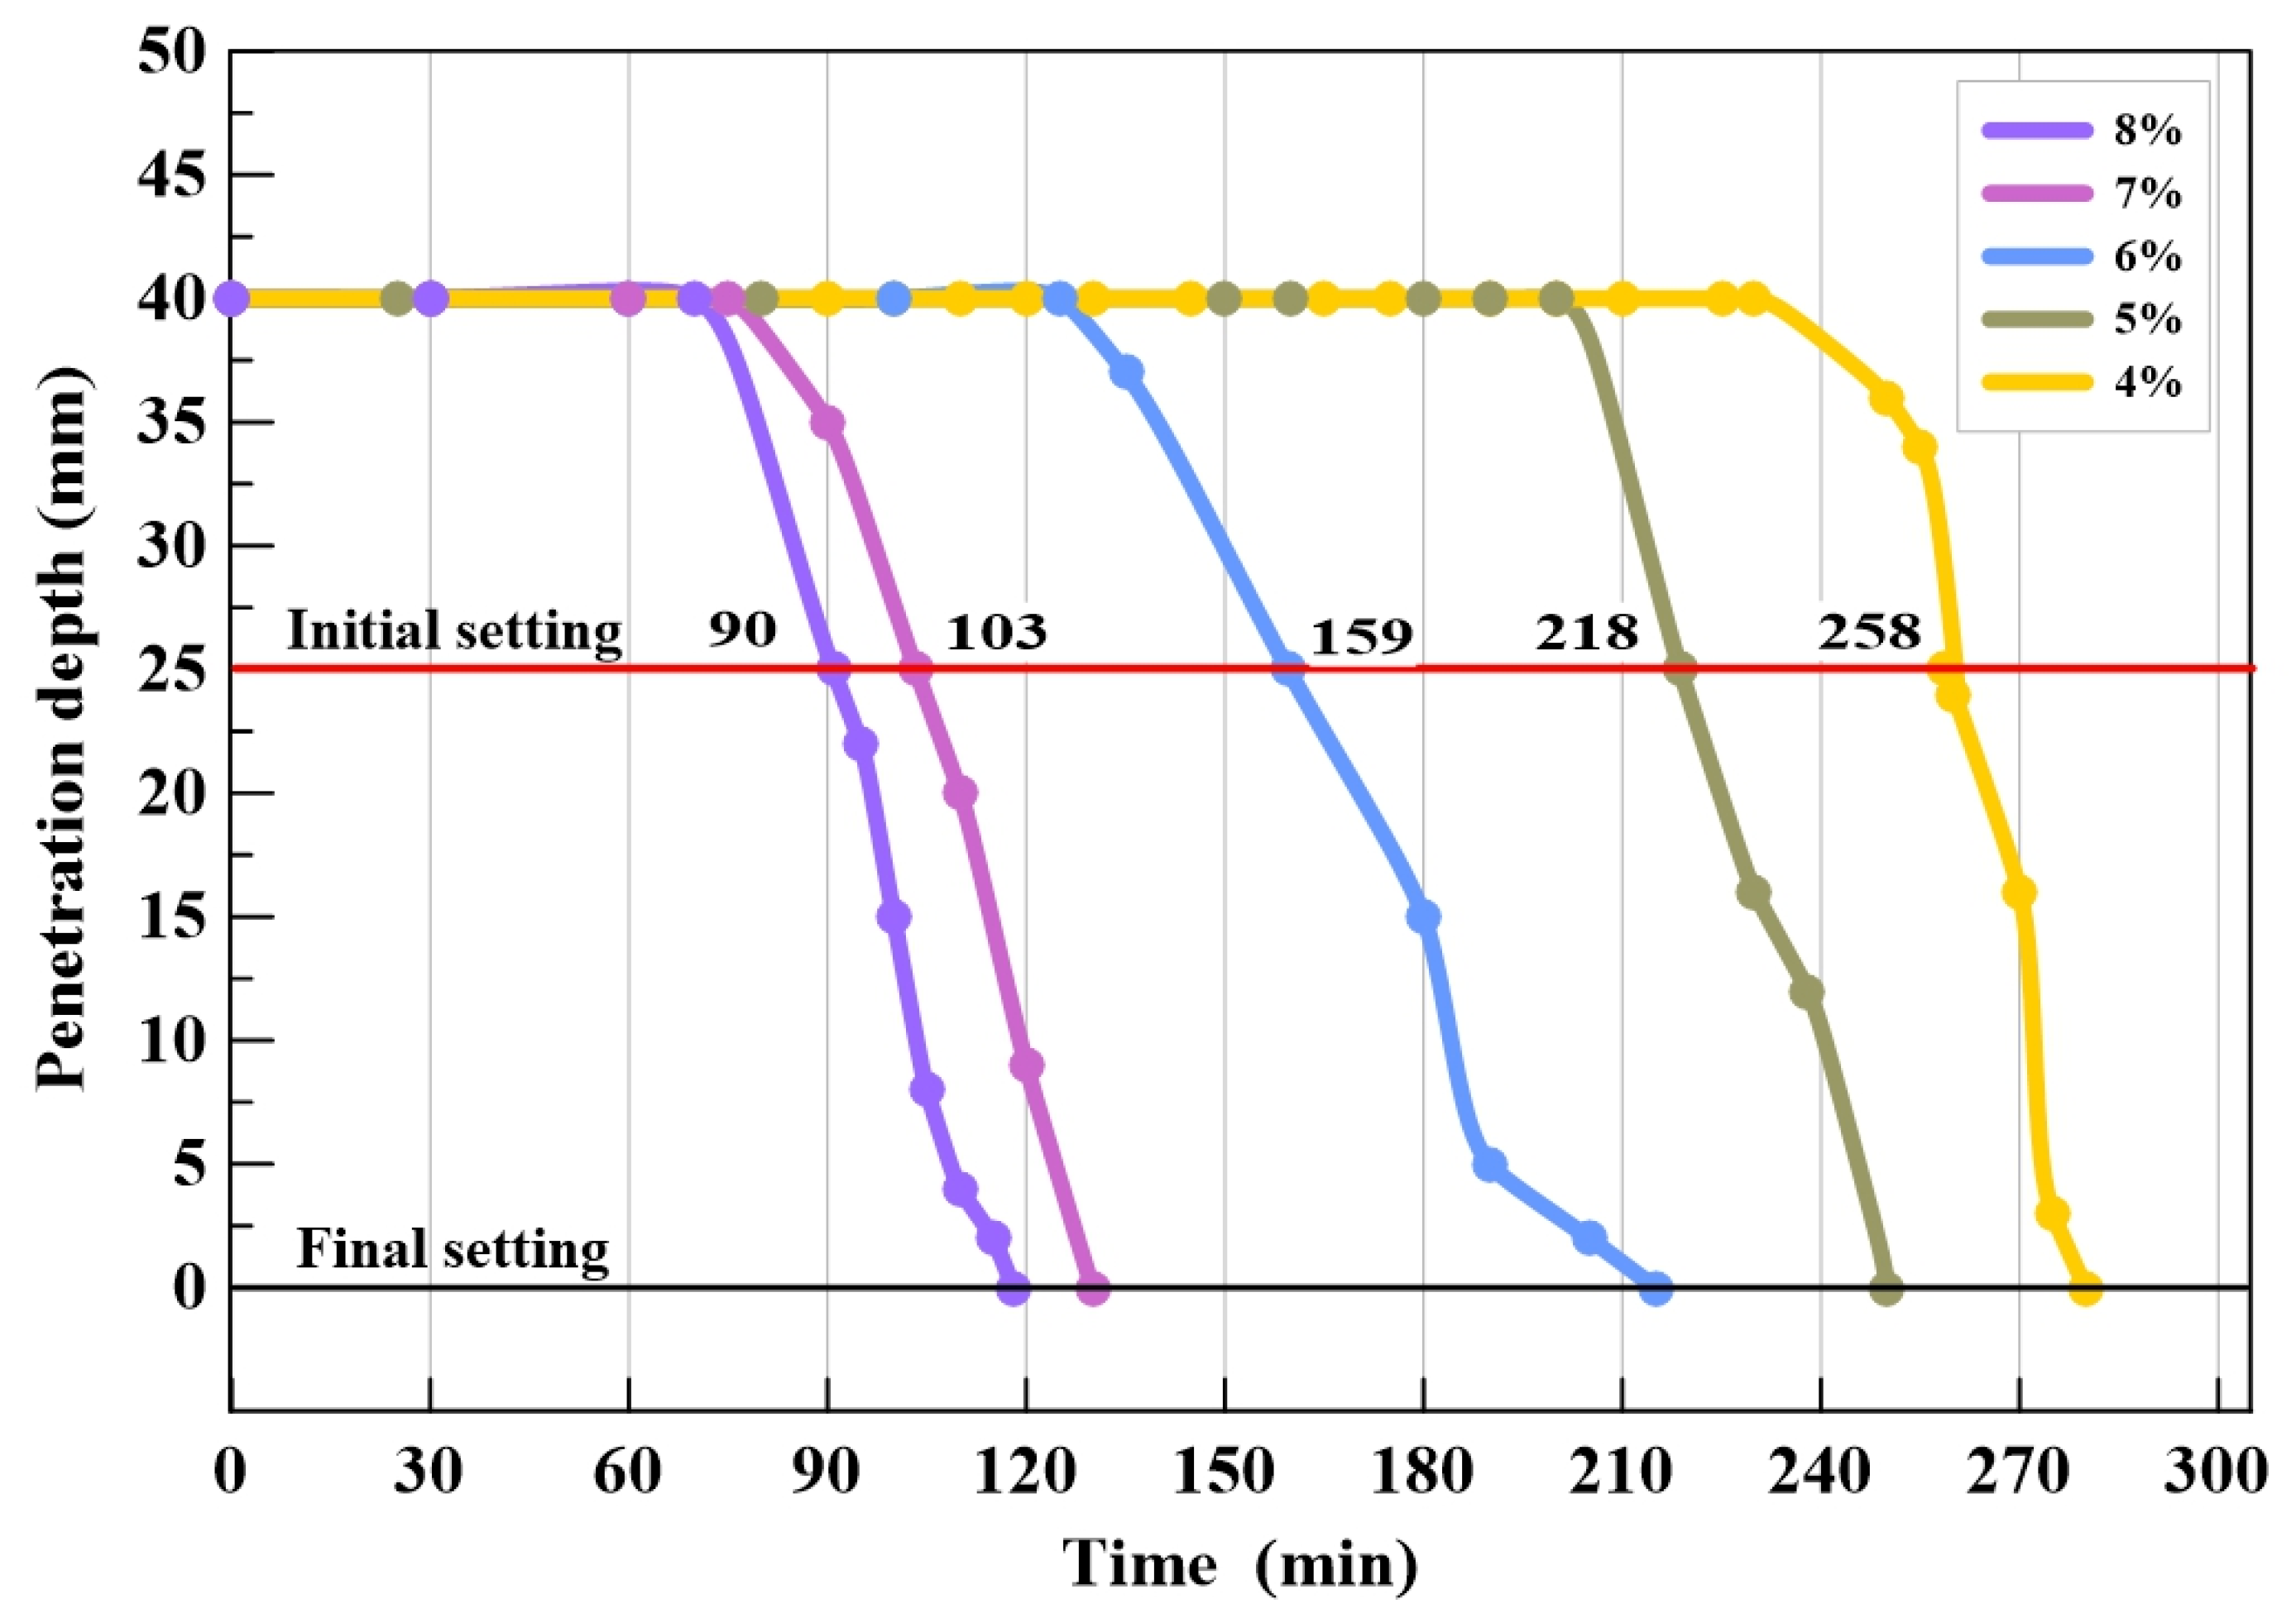
To establish appropriate settings and hardening kinetics for extrusion-based 3DPCM, the setting behavior of a baseline mortar was first evaluated. In the preliminary stage, the baseline mortar was prepared with a water-to-cement ratio of 0.40 and a cement-to-MBOFS sand ratio of 1:1.05. No WPCBP or SP was incorporated at this stage to isolate the effect of AC. The influence of AC/C = 4–8 wt.% on the initial and final setting times is presented in Figure 9. The results show that both the initial and final setting times were significantly shortened with increasing AC/C, indicating accelerated hydration kinetics and rapid development of early-age structure.
From the perspective of 3DCP, a reduced initial setting time is essential for achieving sufficient early structural build-up to support subsequent layers. However, excessively rapid setting may adversely affect extrusion continuity and workability. The initial setting time obtained at AC/C = 6 wt.% was close to the value of 162 min in the literature [52]. Based on these results, AC/C = 6 wt.% was selected as the optimal dosage and was adopted for all subsequent 3DPCM mixtures.

4.2. Flowability Test Result

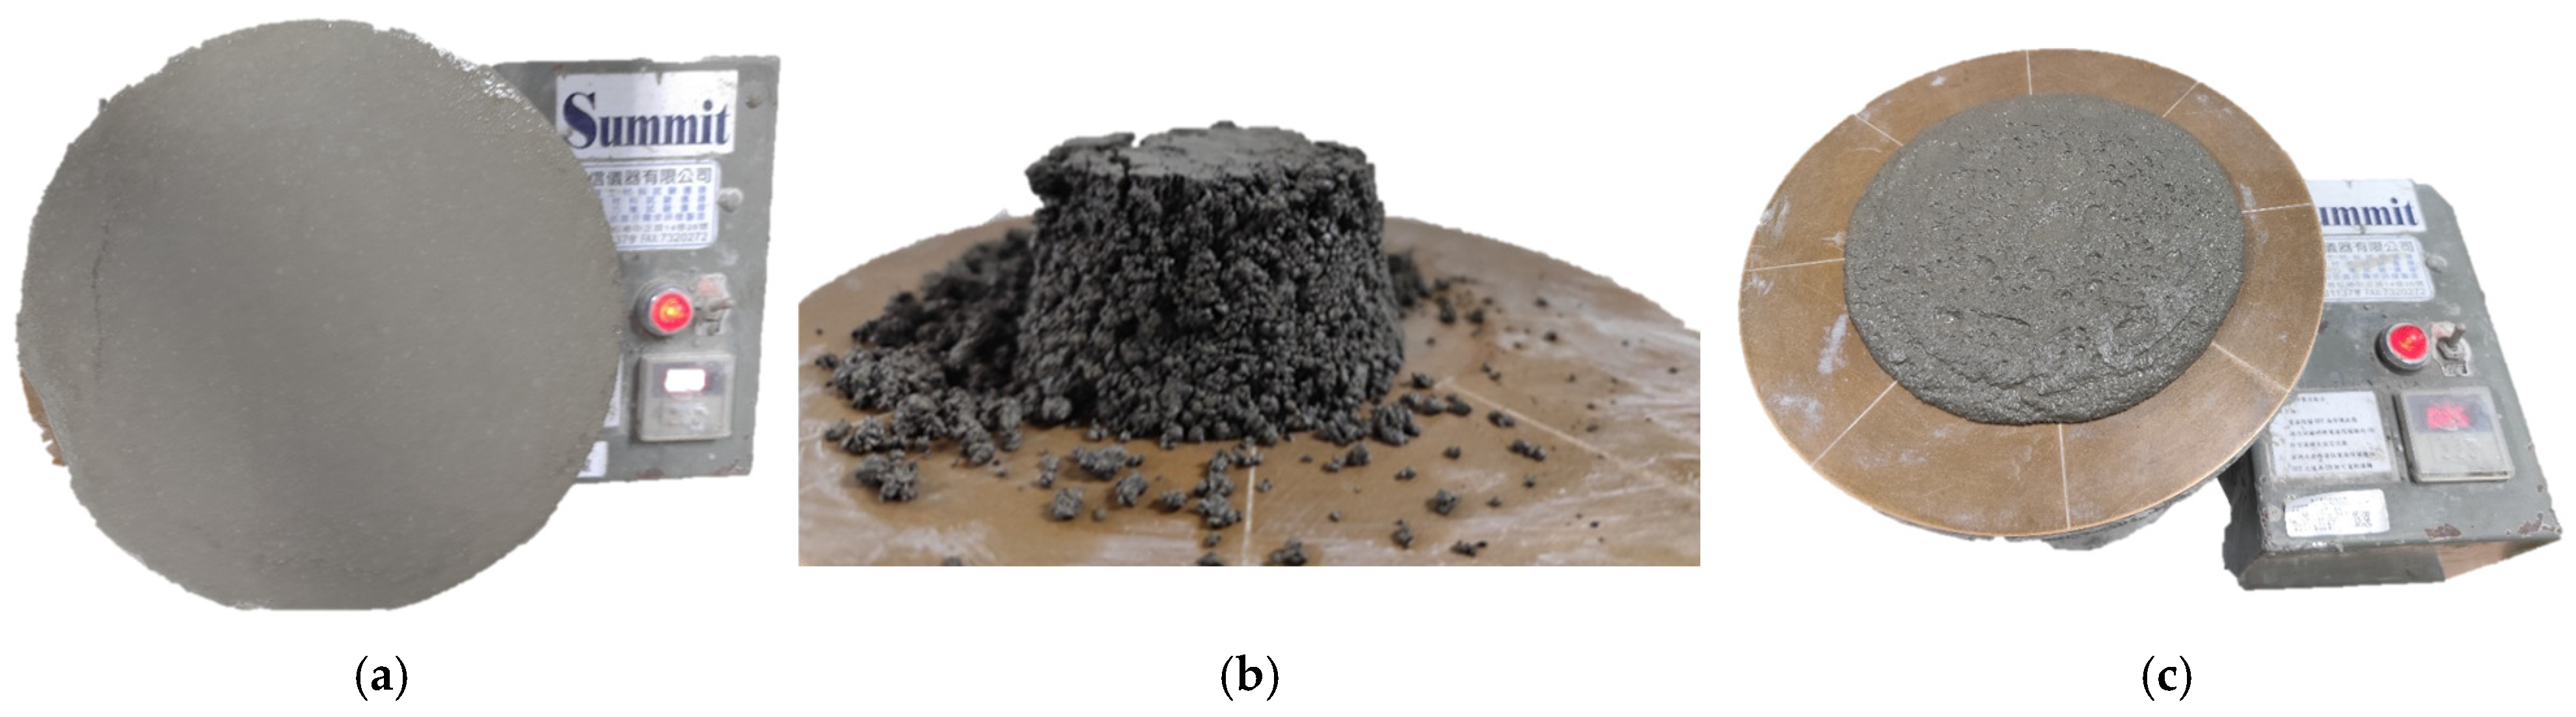
As summarized in Table 4, flowability tests were conducted for five WPCBP/C levels, namely 0, 10, 20, 30, and 40 wt.%, under three admixture conditions: SP only, AC only, and the combined use of AC and SP. For each WPCBP/C level, the appropriate SP dosage was determined under a fixed AC dosage based on the printable flow range of 150–190 mm recommended in the literature [51]. The resulting SP/C values ranged from 2.0 to 4.3 wt.%. Under the SP-only condition, the measured flow values exceeded the printable flow range for all WPCBP/C levels. In particular, flow values greater than 255 mm were obtained for WPCBP/C = 0 and 10 wt.%, indicating excessive flowability and insufficient shape retention, as shown in Figure 10a. Under the AC-only condition, all mixtures exhibited a dry and crumbly appearance, and no measurable flow value could be obtained, as shown in Figure 10b. Under the combined use of AC and SP, the average flow values ranged from 162 to 177 mm, which fell within the printable flow range, as shown in Figure 10c.
In addition, the mini-slump test results of the printable mixtures are summarized in Table 5, with measured slump values ranging from 50 to 71 mm.

4.3. Extrudability Test Result

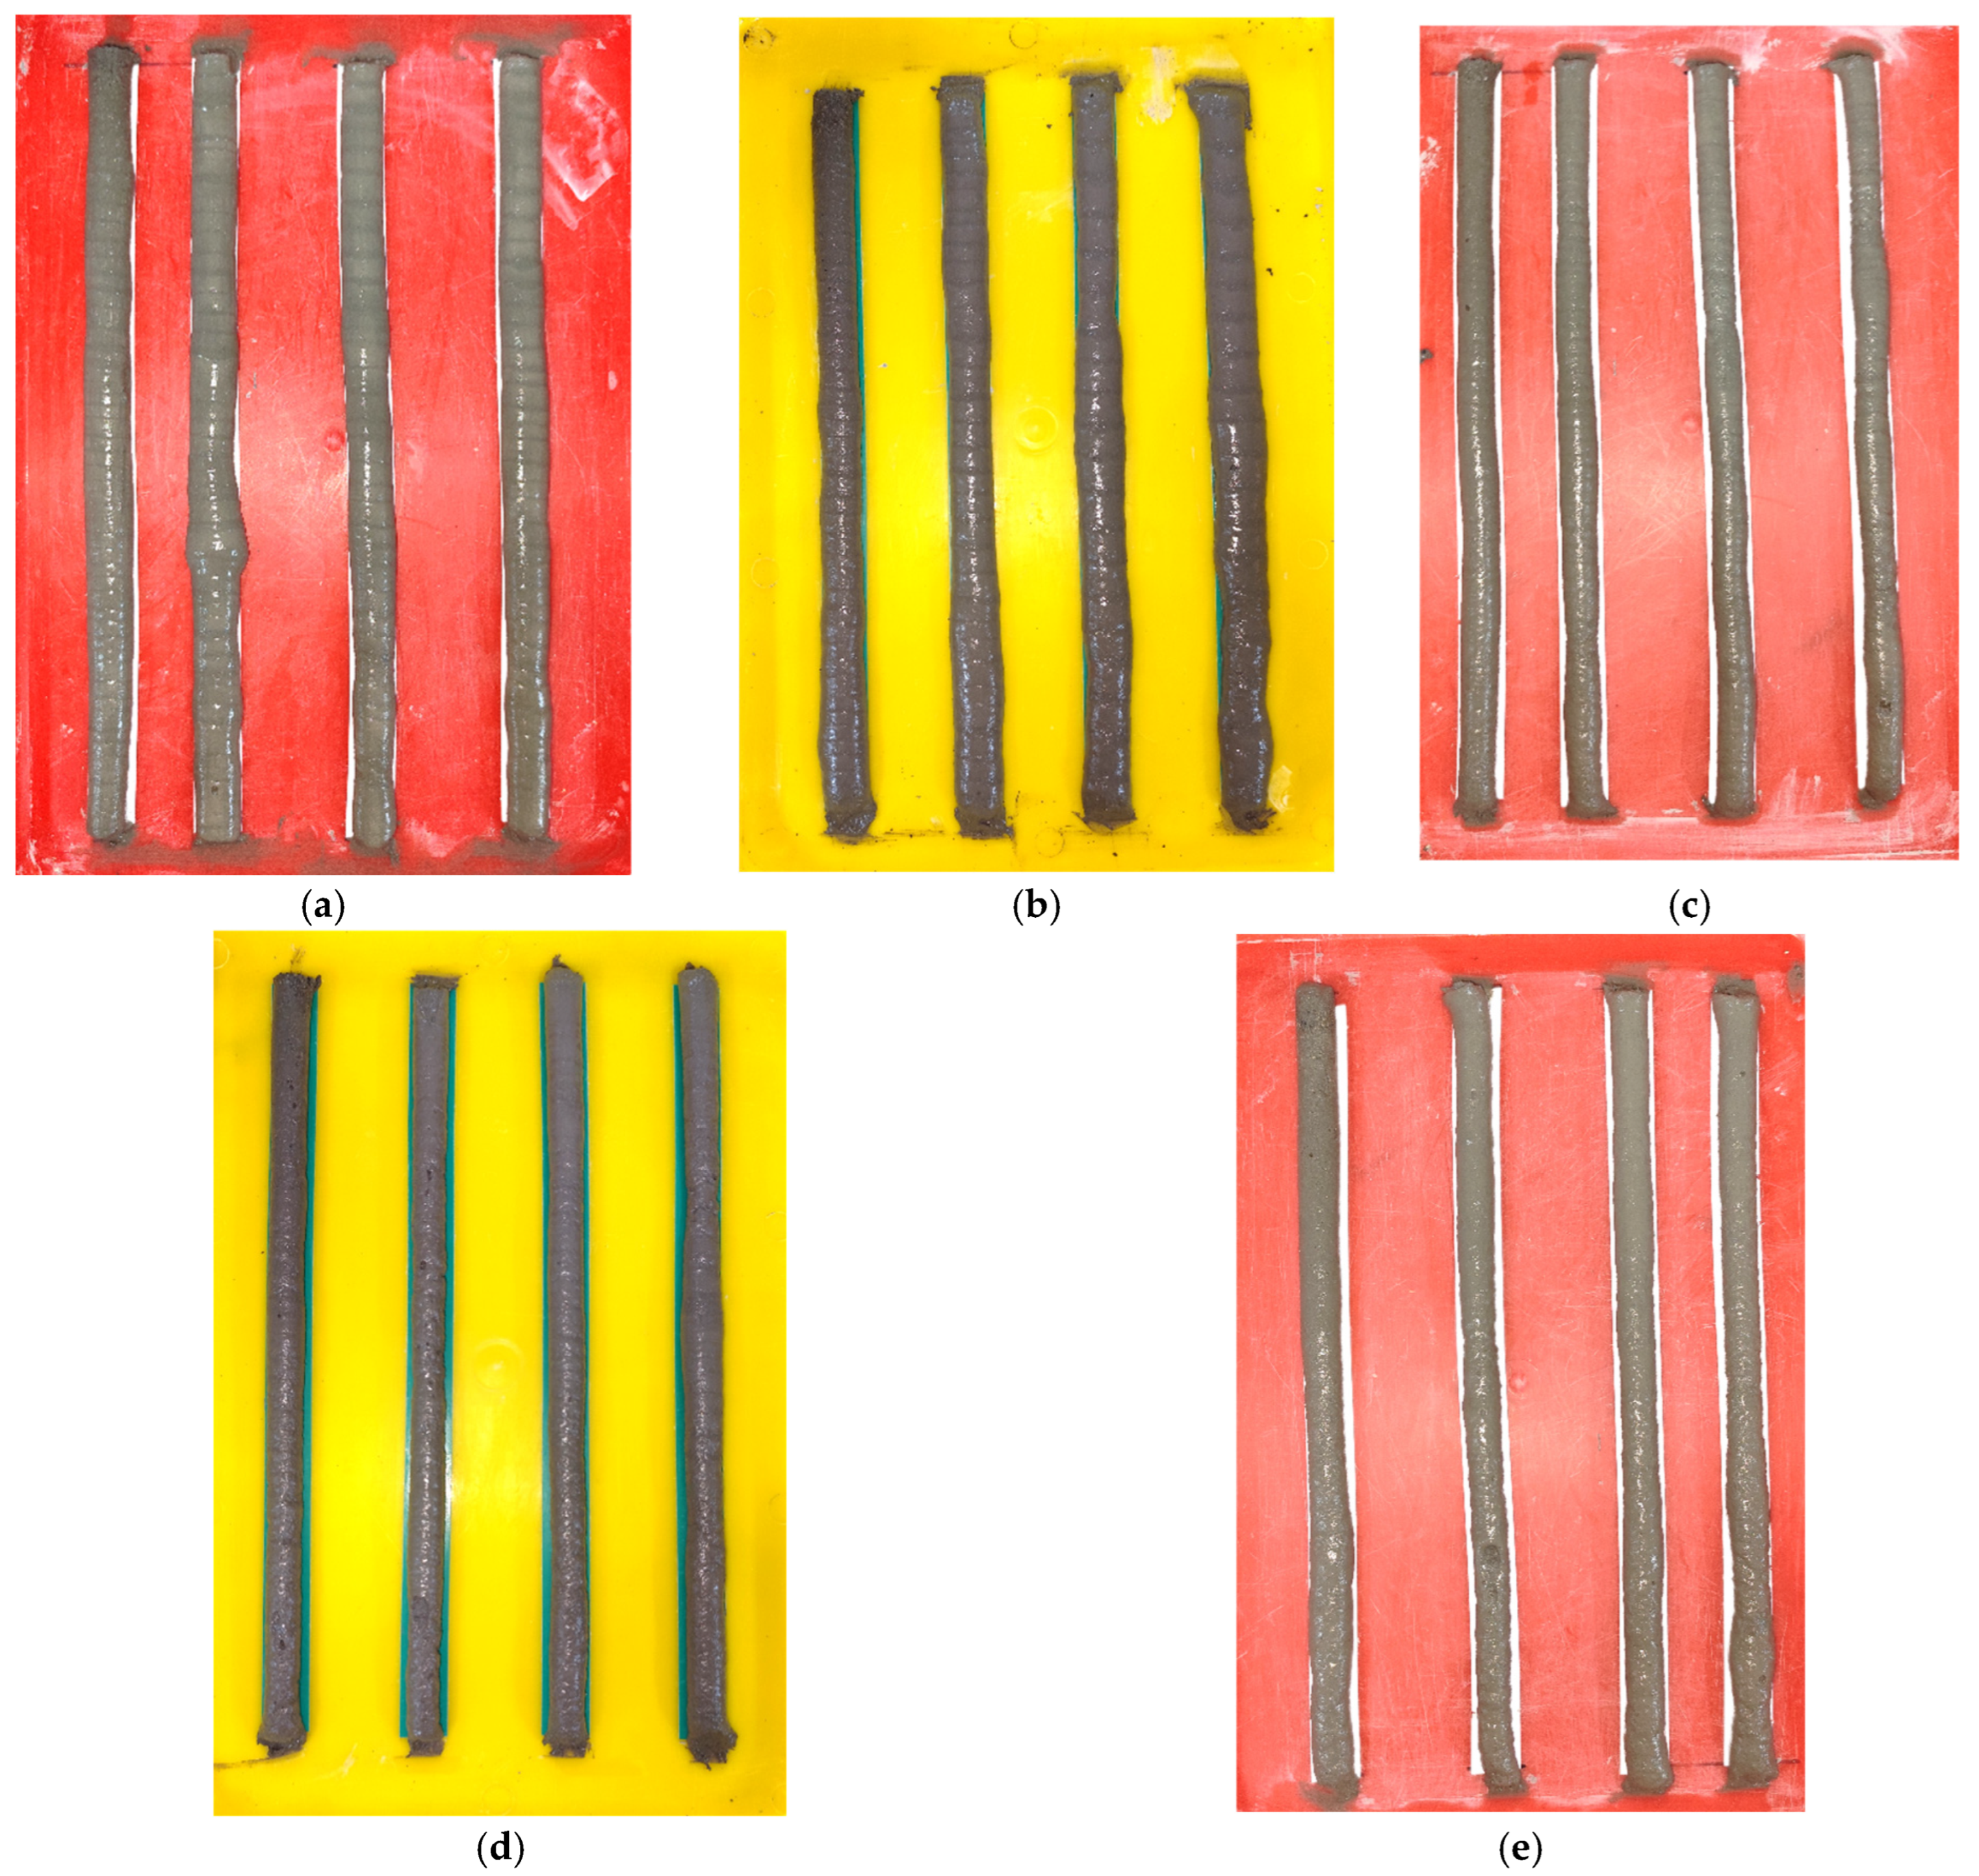
The 3DPCM mixtures were prepared based on the previously established water-to-cement ratio, cement-to-MBOFS sand ratio, and admixture dosages. The stability and continuity of the extrusion process were evaluated for each mixture by confirming whether four continuous filaments with a length of 300 mm could be extruded. As shown in Figure 11, stable and continuous extrusion behavior was observed for all mixtures, with no noticeable filament breakage or nozzle blockage. These results indicate that the proposed mixtures possessed stable extrudability, satisfying the fundamental requirements for extrusion-based 3DCP and providing a reliable basis for subsequent buildability and mechanical performance evaluations.

4.4. Buildability Test Result

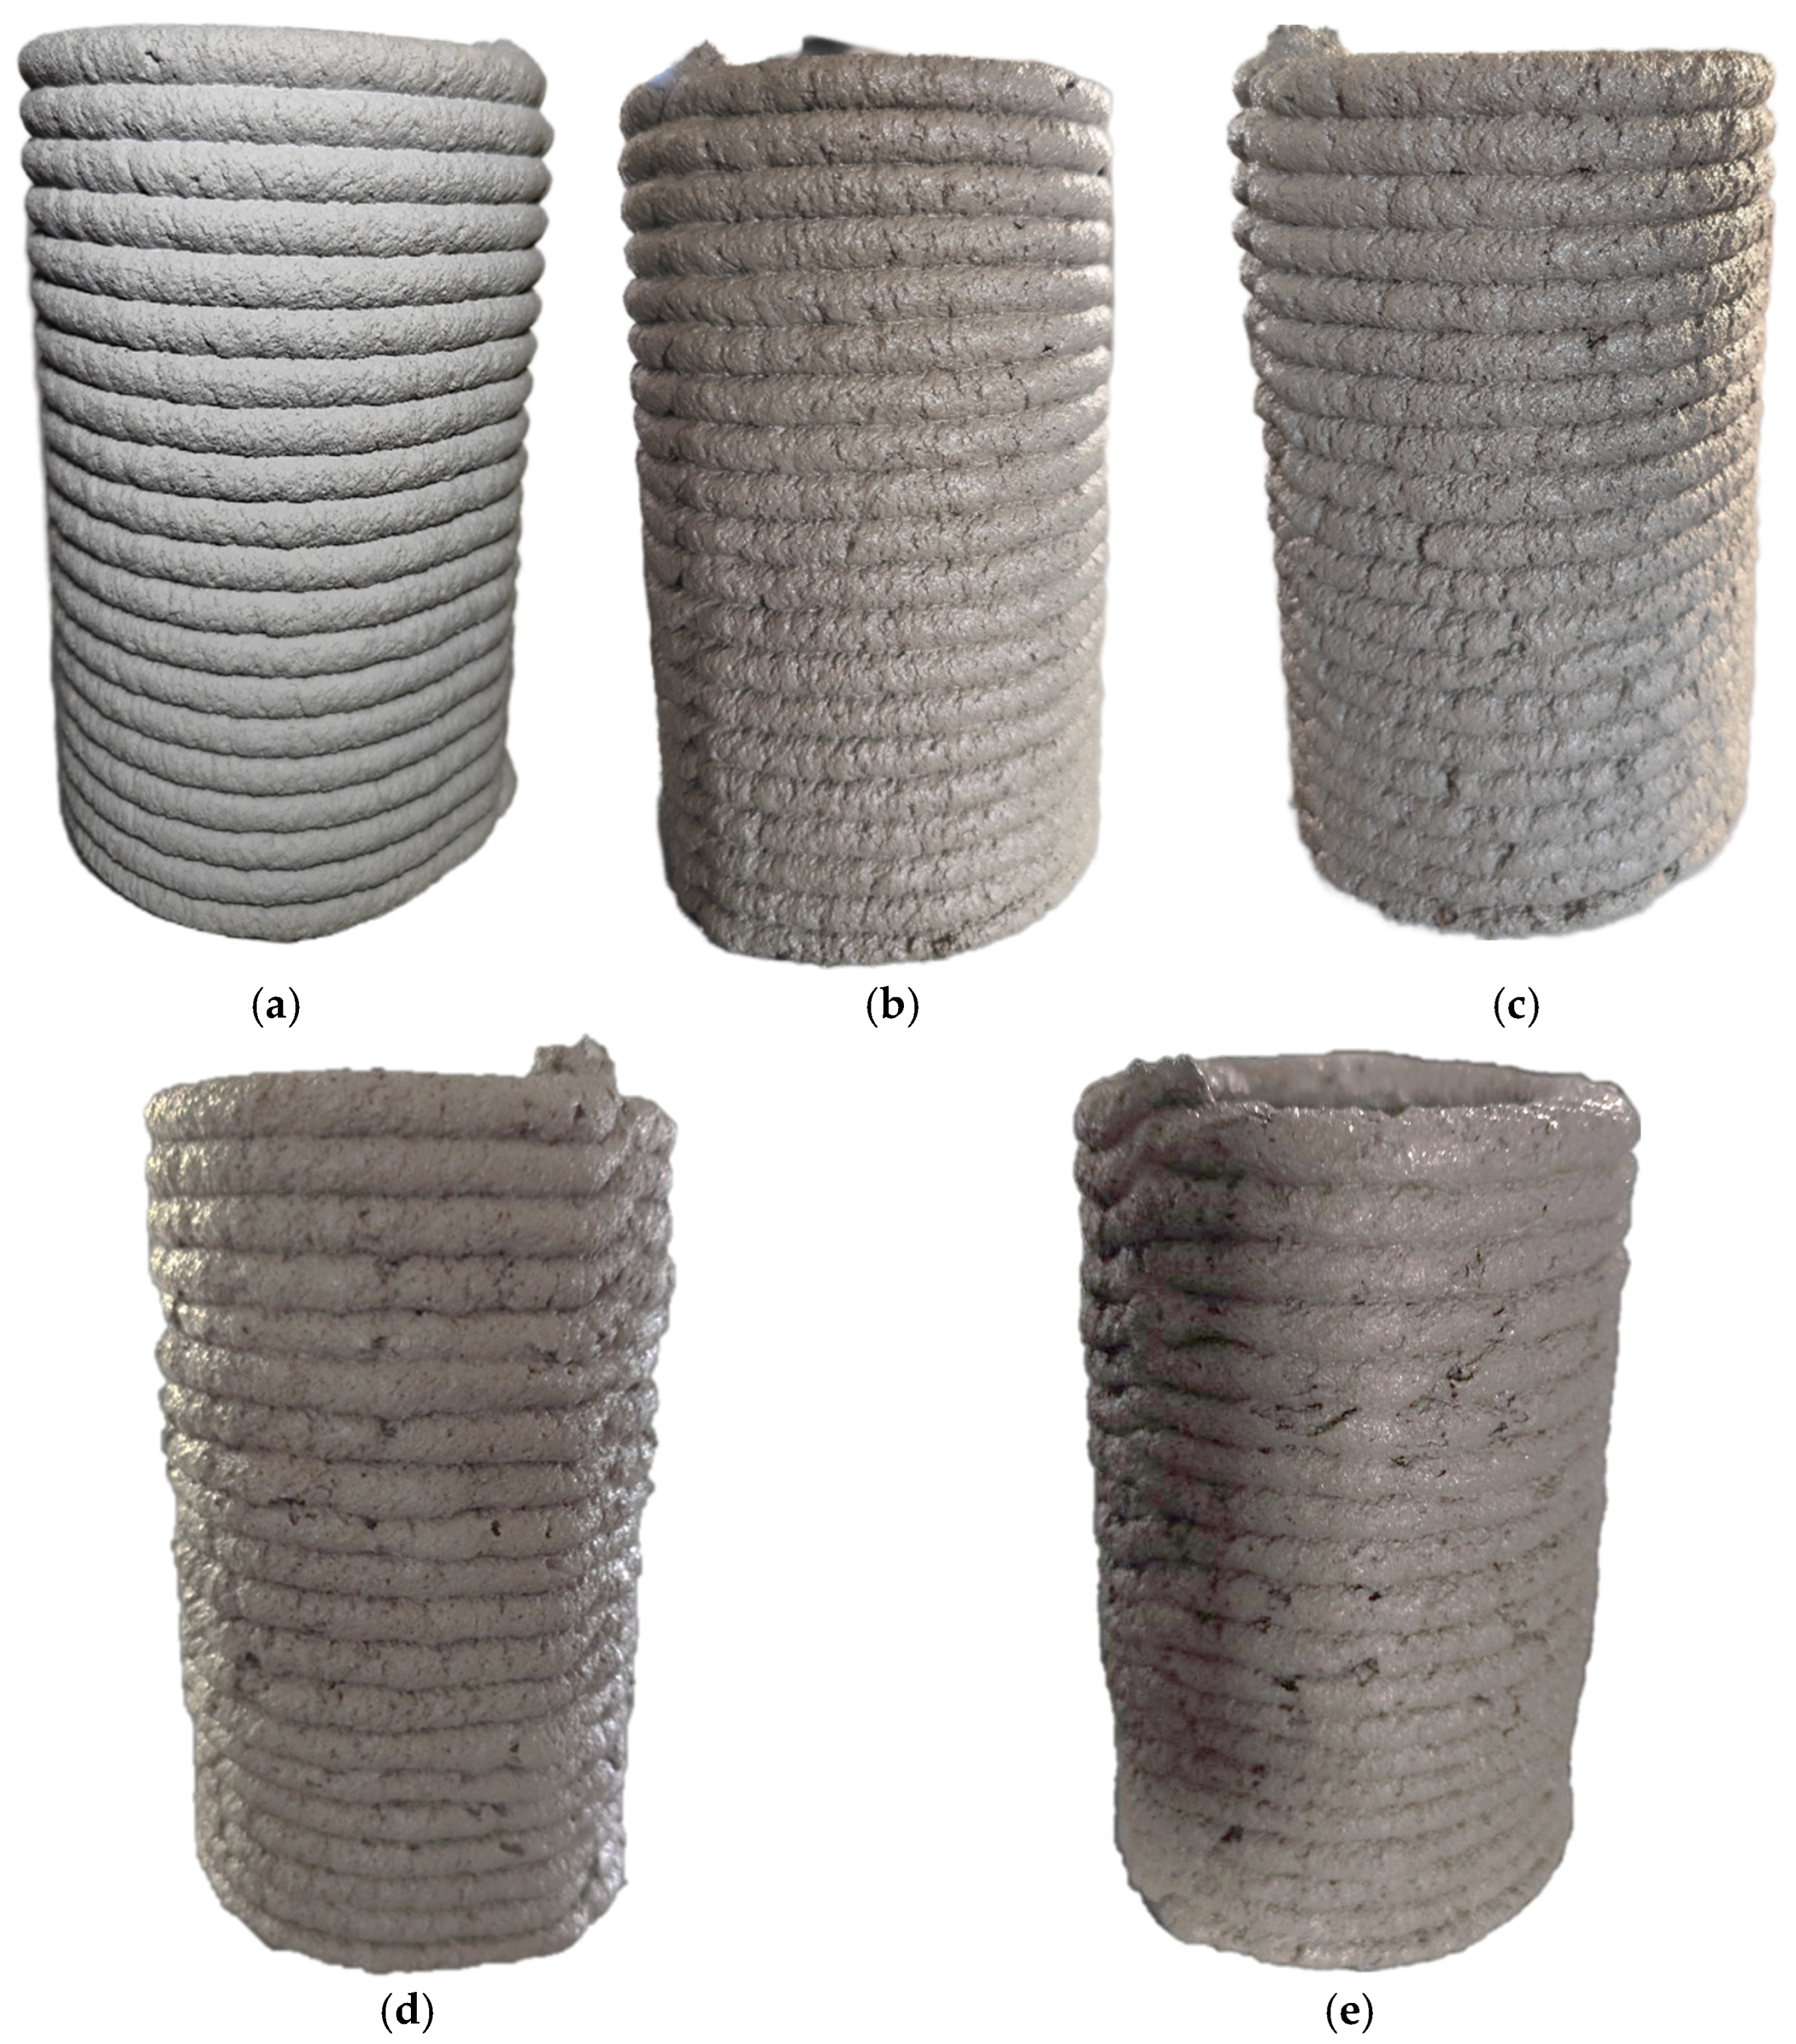
The buildability of the five finalized 3DPCM mixtures was evaluated to confirm their ability to maintain structural integrity under self-weight and layer-by-layer stacking pressure. As shown in Figure 12a–e, all 25-layer hollow cylindrical specimens were successfully printed without collapse or noticeable deformation, indicating satisfactory buildability for all mixtures.
Further observation of the surface morphology showed that the mixtures incorporating WPCBP exhibited slightly greater surface roughness than the control mixture with WPCBP/C = 0. This behavior may be attributed to the fibrous morphology of WPCBP particles, which can modify the rheological characteristics of the mixtures and affect filament deposition and surface formation during extrusion. Despite the slight increase in surface roughness, all specimens maintained good geometric fidelity and stable layer stacking. These results confirm that all mixtures satisfied the buildability requirements for extrusion-based 3DCP.

5. Quasi-Static Mechanical Test Results

5.1. Compression Test Result

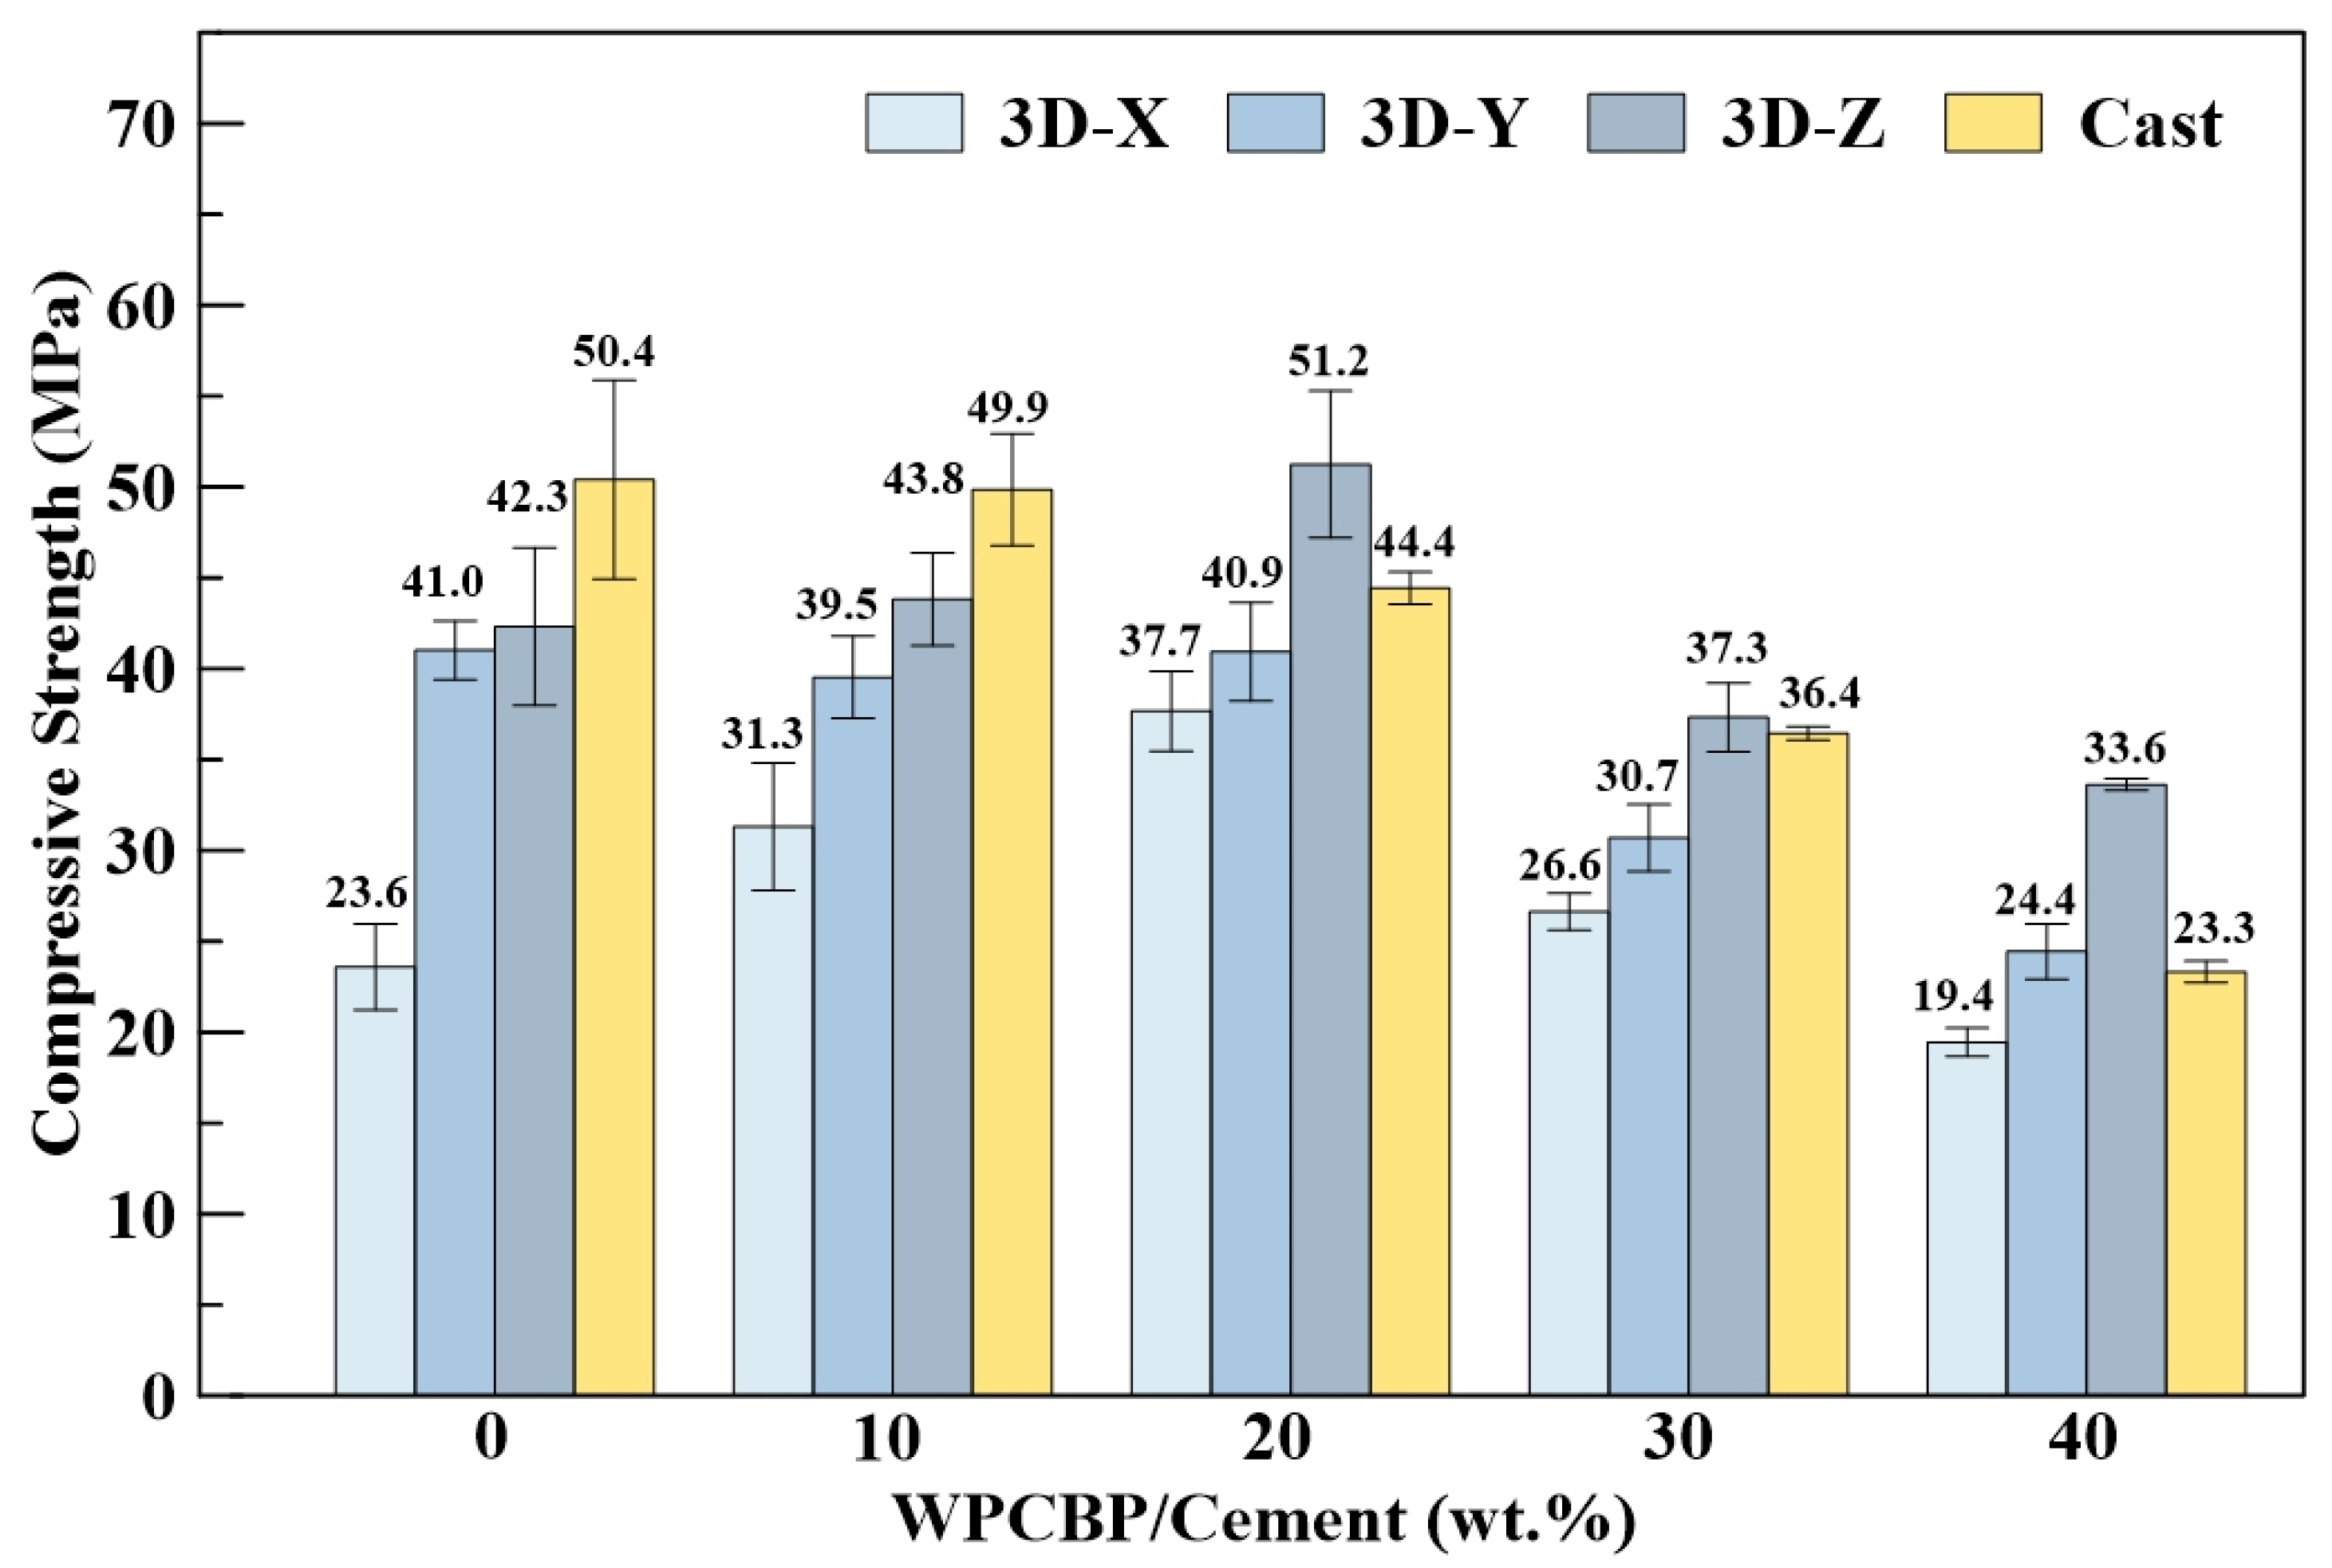
The compressive strength of both 3D-printed and cast specimens is significantly affected by the incorporation of WPCBP. As shown in Figure 13, the cast specimens exhibit the highest compressive strength at WPCBP/C = 0 wt.%. However, as the WPCBP content increases, a continuous reduction in compressive strength is observed in the cast specimens, indicating that WPCBP incorporation does not provide a beneficial effect on the compressive strength of conventionally cast specimens. In contrast, the 3D-printed specimens show a different response to WPCBP incorporation. When the WPCBP/C ratio increases to 20 wt.%, the compressive strength of the 3D-printed specimens is generally enhanced. The maximum value is obtained in the 3D-Z direction at WPCBP/C = 20 wt.%, reaching 51.2 Mpa, which is higher than that of the corresponding cast specimen (44.4 Mpa). However, when the WPCBP/C ratio exceeds 20 wt.%, the compressive strength of the 3D-printed specimens no longer increases but instead begins to decline. Therefore, WPCBP/C = 20 wt.% can be regarded as the optimal dosage for the compressive performance of 3DPCM in this study.
In terms of anisotropic behavior, the 3D-Z specimens consistently exhibit the highest compressive strength among all 3D-printed specimens, whereas the 3D-X specimens show comparatively lower strength. This trend confirms the anisotropic characteristics of 3DCP specimens. At WPCBP/C = 40 wt.%, the compressive strength of the 3D-printed specimens, particularly in the 3D-Z and 3D-Y directions, remains higher than that of the cast specimens. This phenomenon may be attributed to extrusion-induced compaction during printing, which promotes matrix densification and partially compensates for the adverse effects of increased porosity.

5.2. Flexural Test Result

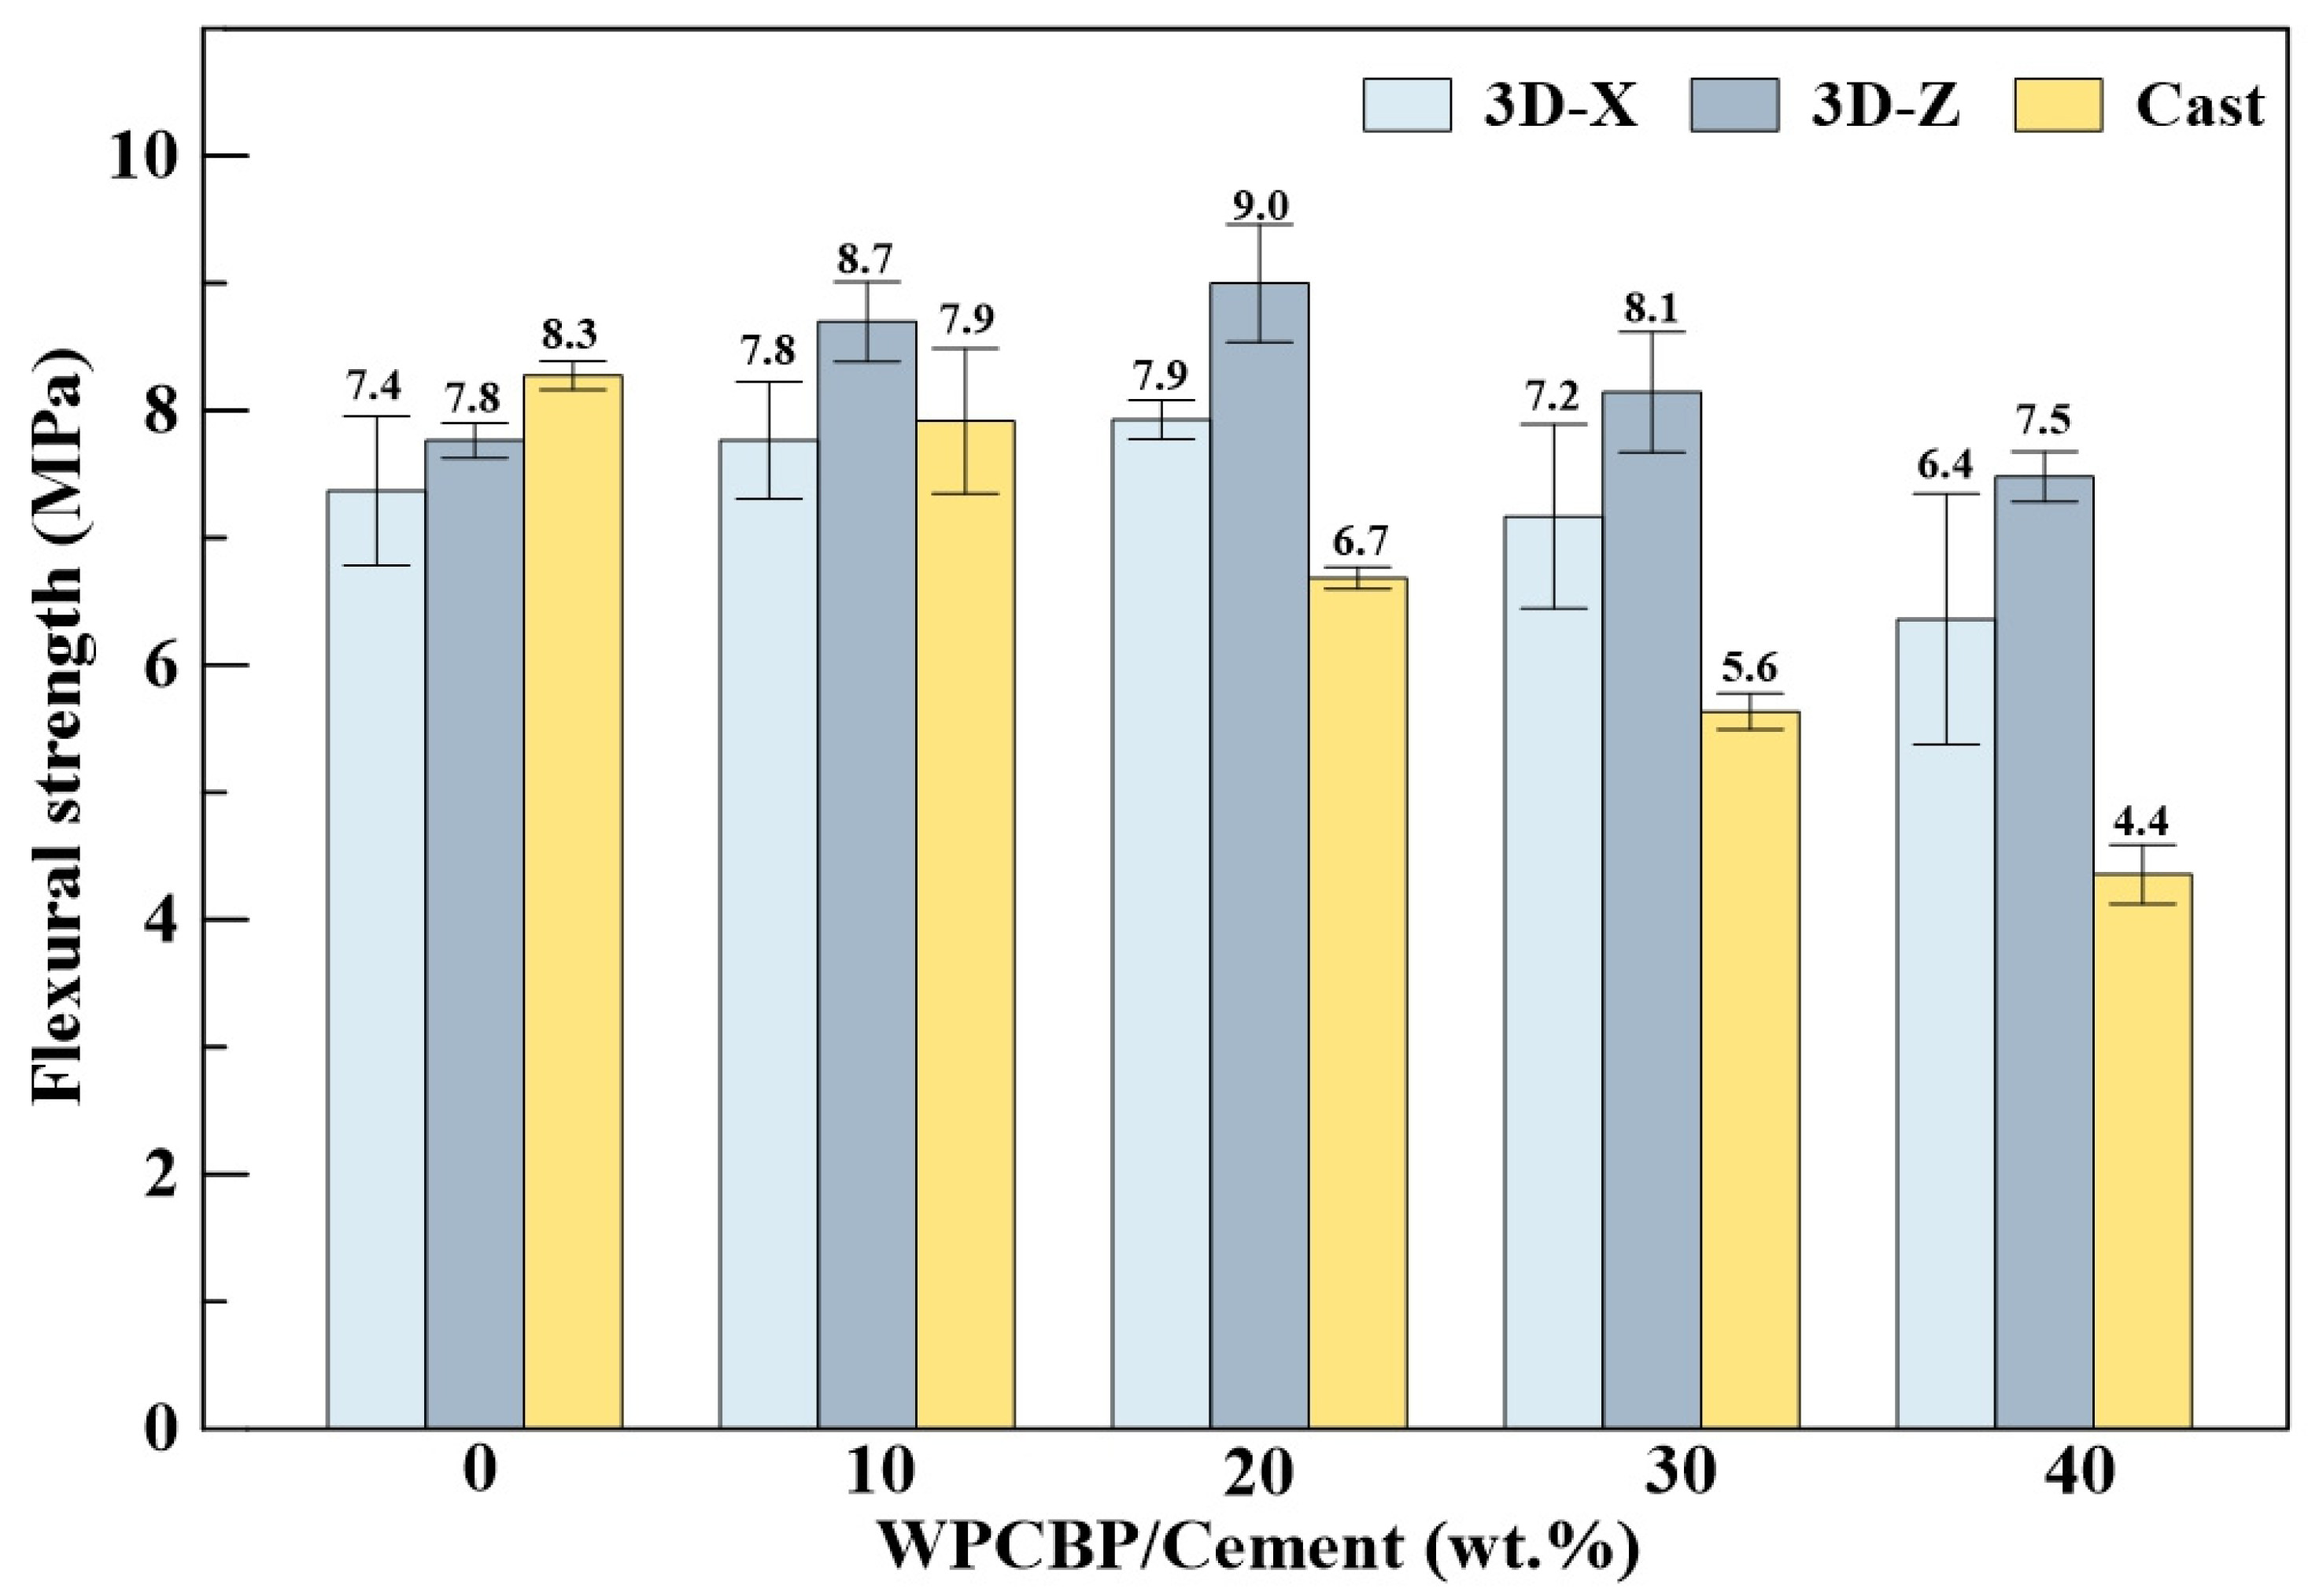
The flexural strength of both 3D-printed and cast specimens is significantly affected by the incorporation of WPCBP, showing a trend generally consistent with that observed in the compressive strength results. As shown in Figure 14, the cast specimens exhibit the highest flexural strength at WPCBP/C = 0 wt.%, reaching 8.3 Mpa. However, as the WPCBP content increases, a continuous reduction in flexural strength is observed in the cast specimens, decreasing to 4.4 Mpa at WPCBP/C = 40 wt.%. Similar to the compressive strength results, this finding indicates that WPCBP incorporation does not provide a beneficial effect on the flexural strength of cast specimens. In contrast, the 3D-printed specimens show a different response to WPCBP incorporation. When the WPCBP/C ratio increases to 20 wt.%, the flexural strength of the 3D-printed specimens is improved, with the 3D-Z direction exhibiting the best performance. At WPCBP/C = 20 wt.%, the flexural strength in the 3D-Z direction reaches 9.0 Mpa, which is higher than that of the corresponding cast specimen (6.7 Mpa). However, when the WPCBP/C ratio exceeds 20 wt.%, the flexural strength of the 3D-printed specimens no longer increases and begins to decline. Therefore, WPCBP/C = 20 wt.% can be regarded as the optimal dosage for the flexural performance of 3DPCM in this study.
In terms of anisotropic behavior, the 3D-Z specimens exhibit higher flexural strength than the 3D-X specimens across all WPCBP/C ratios. This trend confirms that the flexural response of 3DCP specimens is significantly influenced by layer orientation and interlayer bonding. At WPCBP/C = 40 wt.%, the flexural strength of the 3D-Z specimen remains 7.5 Mpa, which is approximately 70% higher than that of the cast specimen (4.4 Mpa). This improvement may be attributed to extrusion-induced compaction and the reinforcing effect of WPCBP fibers, which enhance crack-bridging capacity and partially compensate for the strength degradation caused by high WPCBP content.

5.3. Splitting Tensile Test Result

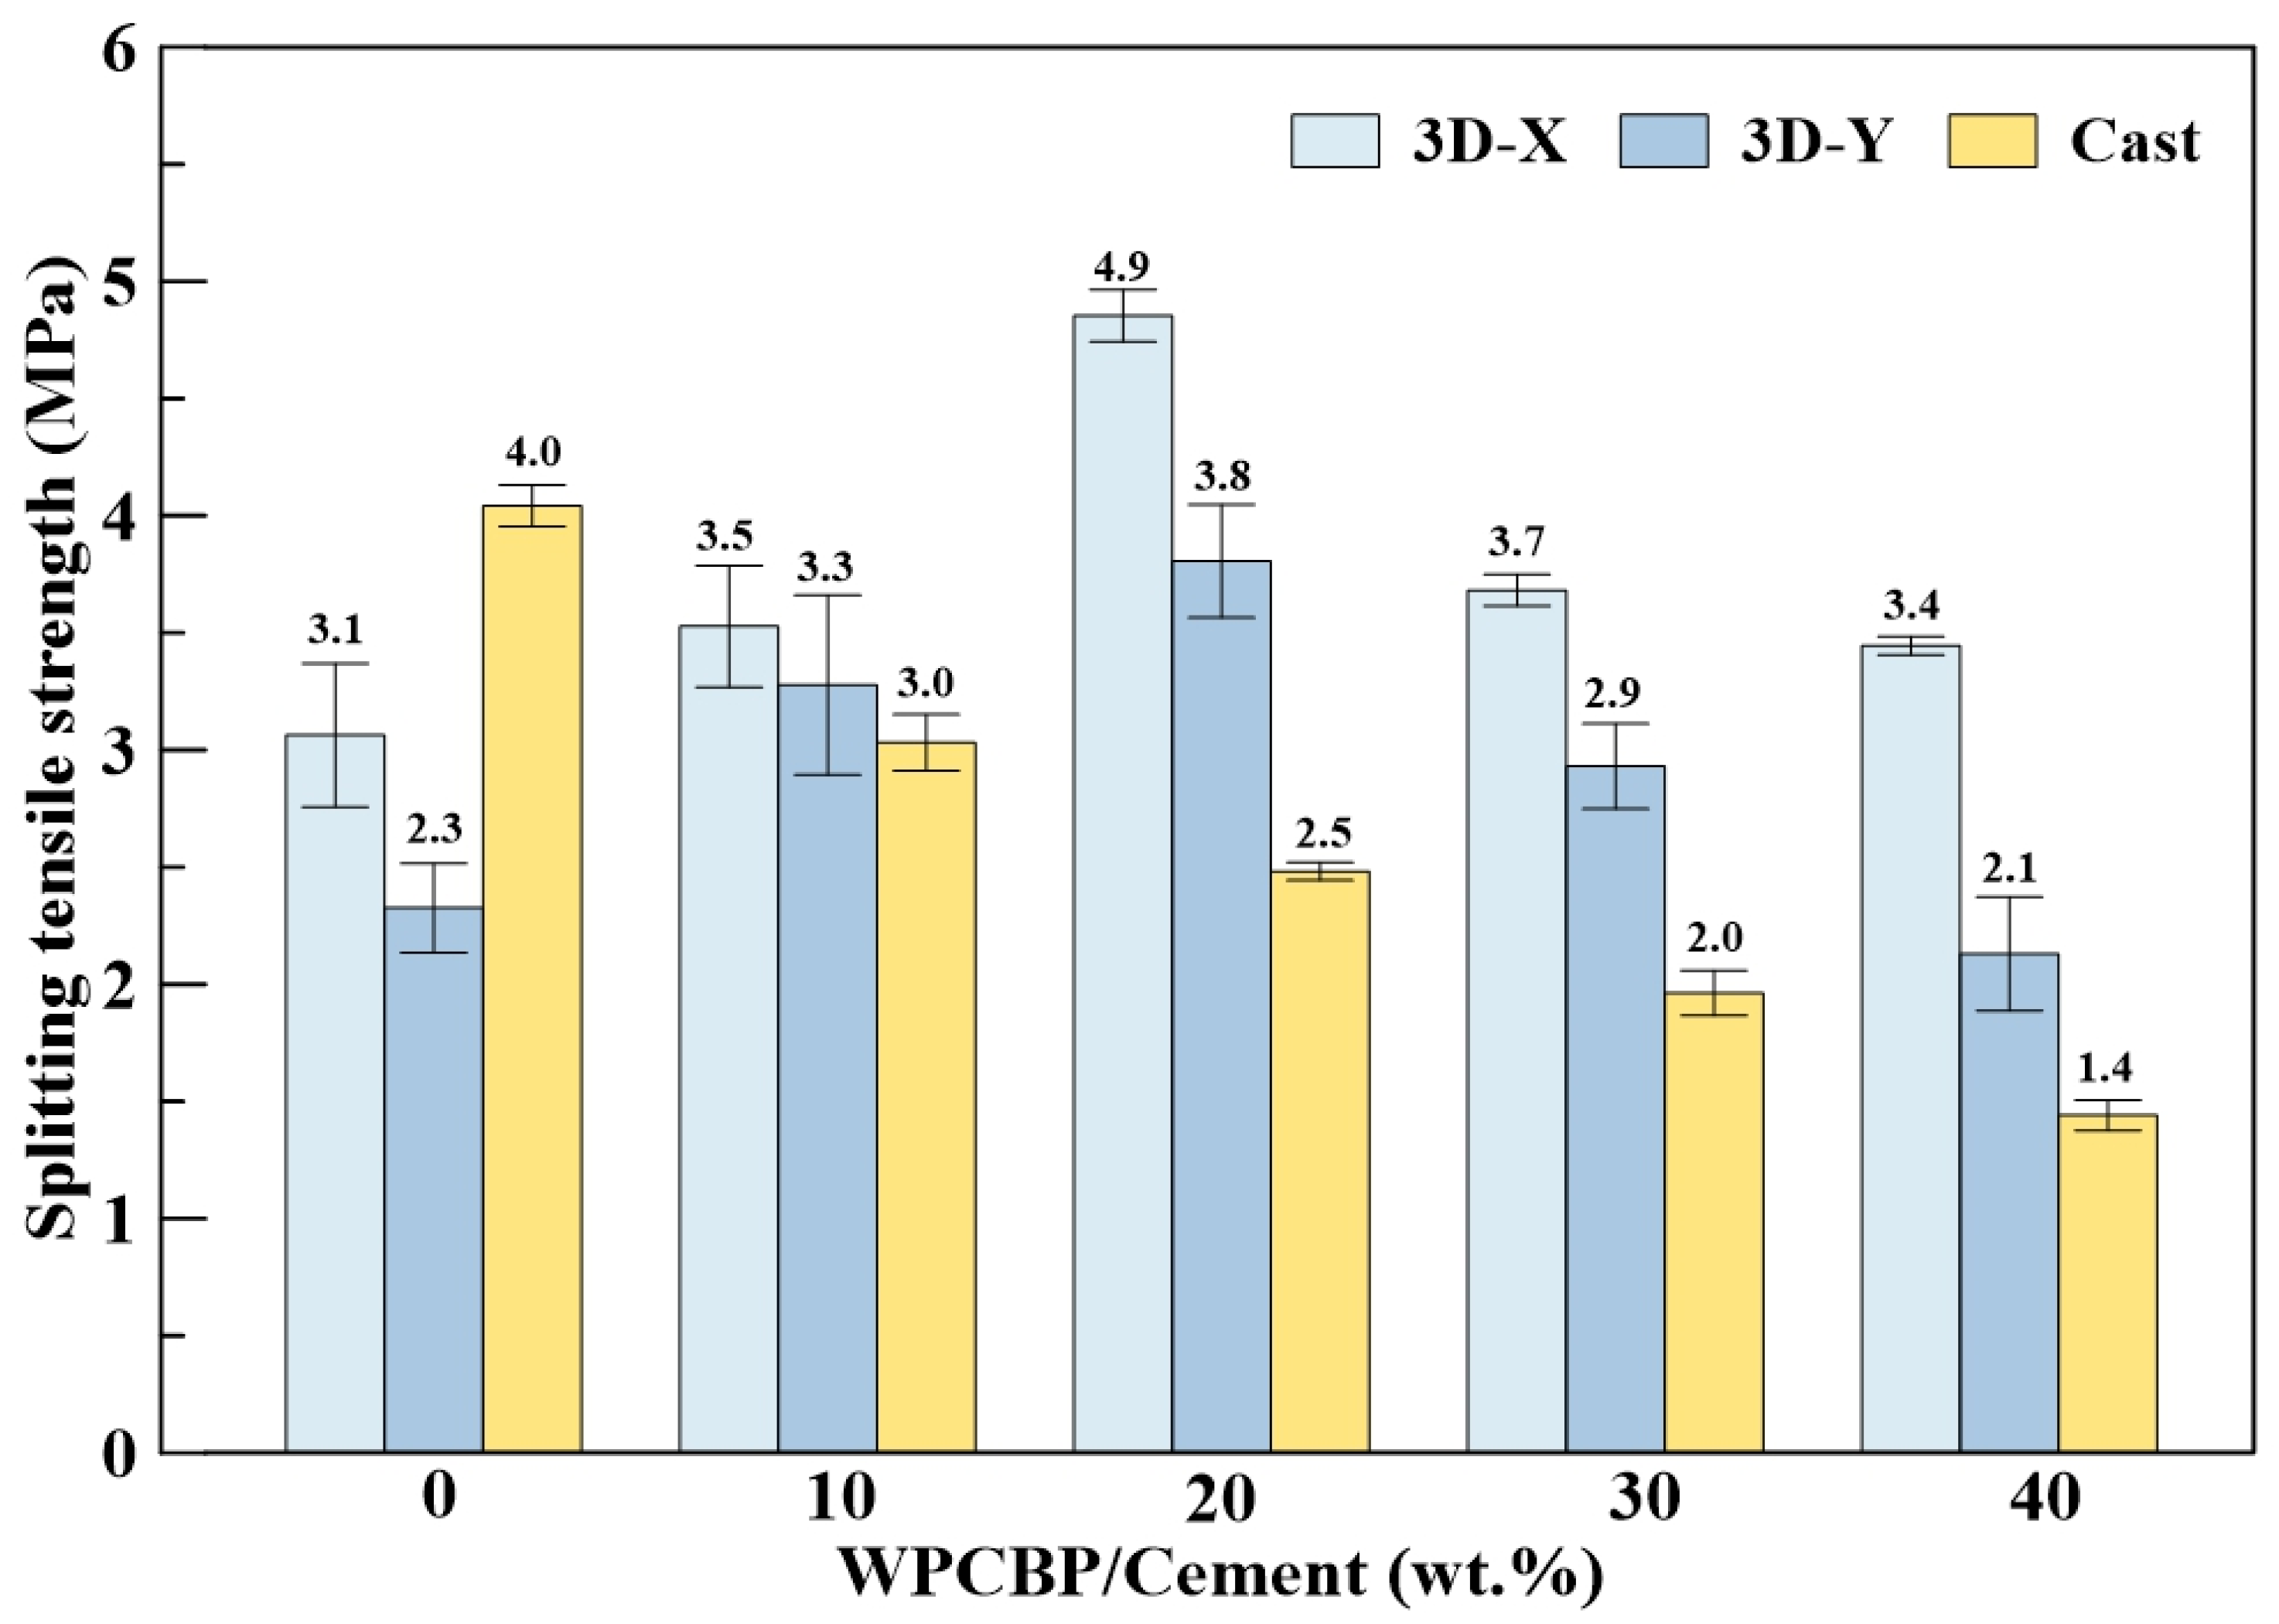
As shown in Figure 15, the splitting tensile strength of both 3D-printed and cast specimens is significantly affected by the incorporation of WPCBP. The cast specimens exhibit the highest splitting tensile strength at WPCBP/C = 0 wt.%, reaching 4.0 Mpa. However, as the WPCBP content increases, a continuous reduction in splitting tensile strength is observed in the cast specimens, decreasing to 1.4 Mpa at WPCBP/C = 40 wt.%. This result indicates that WPCBP incorporation does not provide a beneficial effect on the splitting tensile strength of conventionally cast specimens. In contrast, the 3D-printed specimens show a different response to WPCBP incorporation. When the WPCBP/C ratio increases to 20 wt.%, the splitting tensile strength of the 3D-printed specimens is clearly enhanced. The maximum value is obtained in the 3D-X direction at WPCBP/C = 20 wt.%, reaching 4.9 Mpa, which is nearly twice that of the corresponding cast specimen (2.5 Mpa). However, when the WPCBP/C ratio exceeds 20 wt.%, the splitting tensile strength of the 3D-printed specimens no longer increases and begins to decline. Therefore, WPCBP/C = 20 wt.% can be regarded as the optimal dosage for the splitting tensile performance of 3DPCM in this study.
In terms of anisotropic behavior, the 3D-X specimens consistently exhibit higher splitting tensile strength than the 3D-Y specimens across all WPCBP/C ratios. This trend confirms that the splitting tensile response of 3DCP specimens is affected by the relative orientation between the loading direction and interlayer interfaces. At WPCBP/C = 40 wt.%, the splitting tensile strengths of the 3D-X and 3D-Y specimens remain 3.4 and 2.1 Mpa, respectively, both of which are higher than that of the cast specimen (1.4 Mpa). This improvement may be attributed to extrusion-induced compaction, which promotes matrix densification and partially compensates for the strength degradation caused by high WPCBP content.

6. Three-Dimensionally Printed Truss Member

Four-point bending tests and numerical analyses were conducted to investigate the structural performance and failure behavior of 3D-printed truss members with varying WPCBP/C ratios. The experimental results were used to evaluate the load-bearing capacity, displacement response, and failure characteristics of the truss members, while the finite element method was employed to simulate the structural response and assess the agreement between the numerical predictions and experimental observations. The geometry and dimensions of the specimens are illustrated in Figure 6.

6.1. Four-Point Bending Tests on 3D-Printed Truss Members

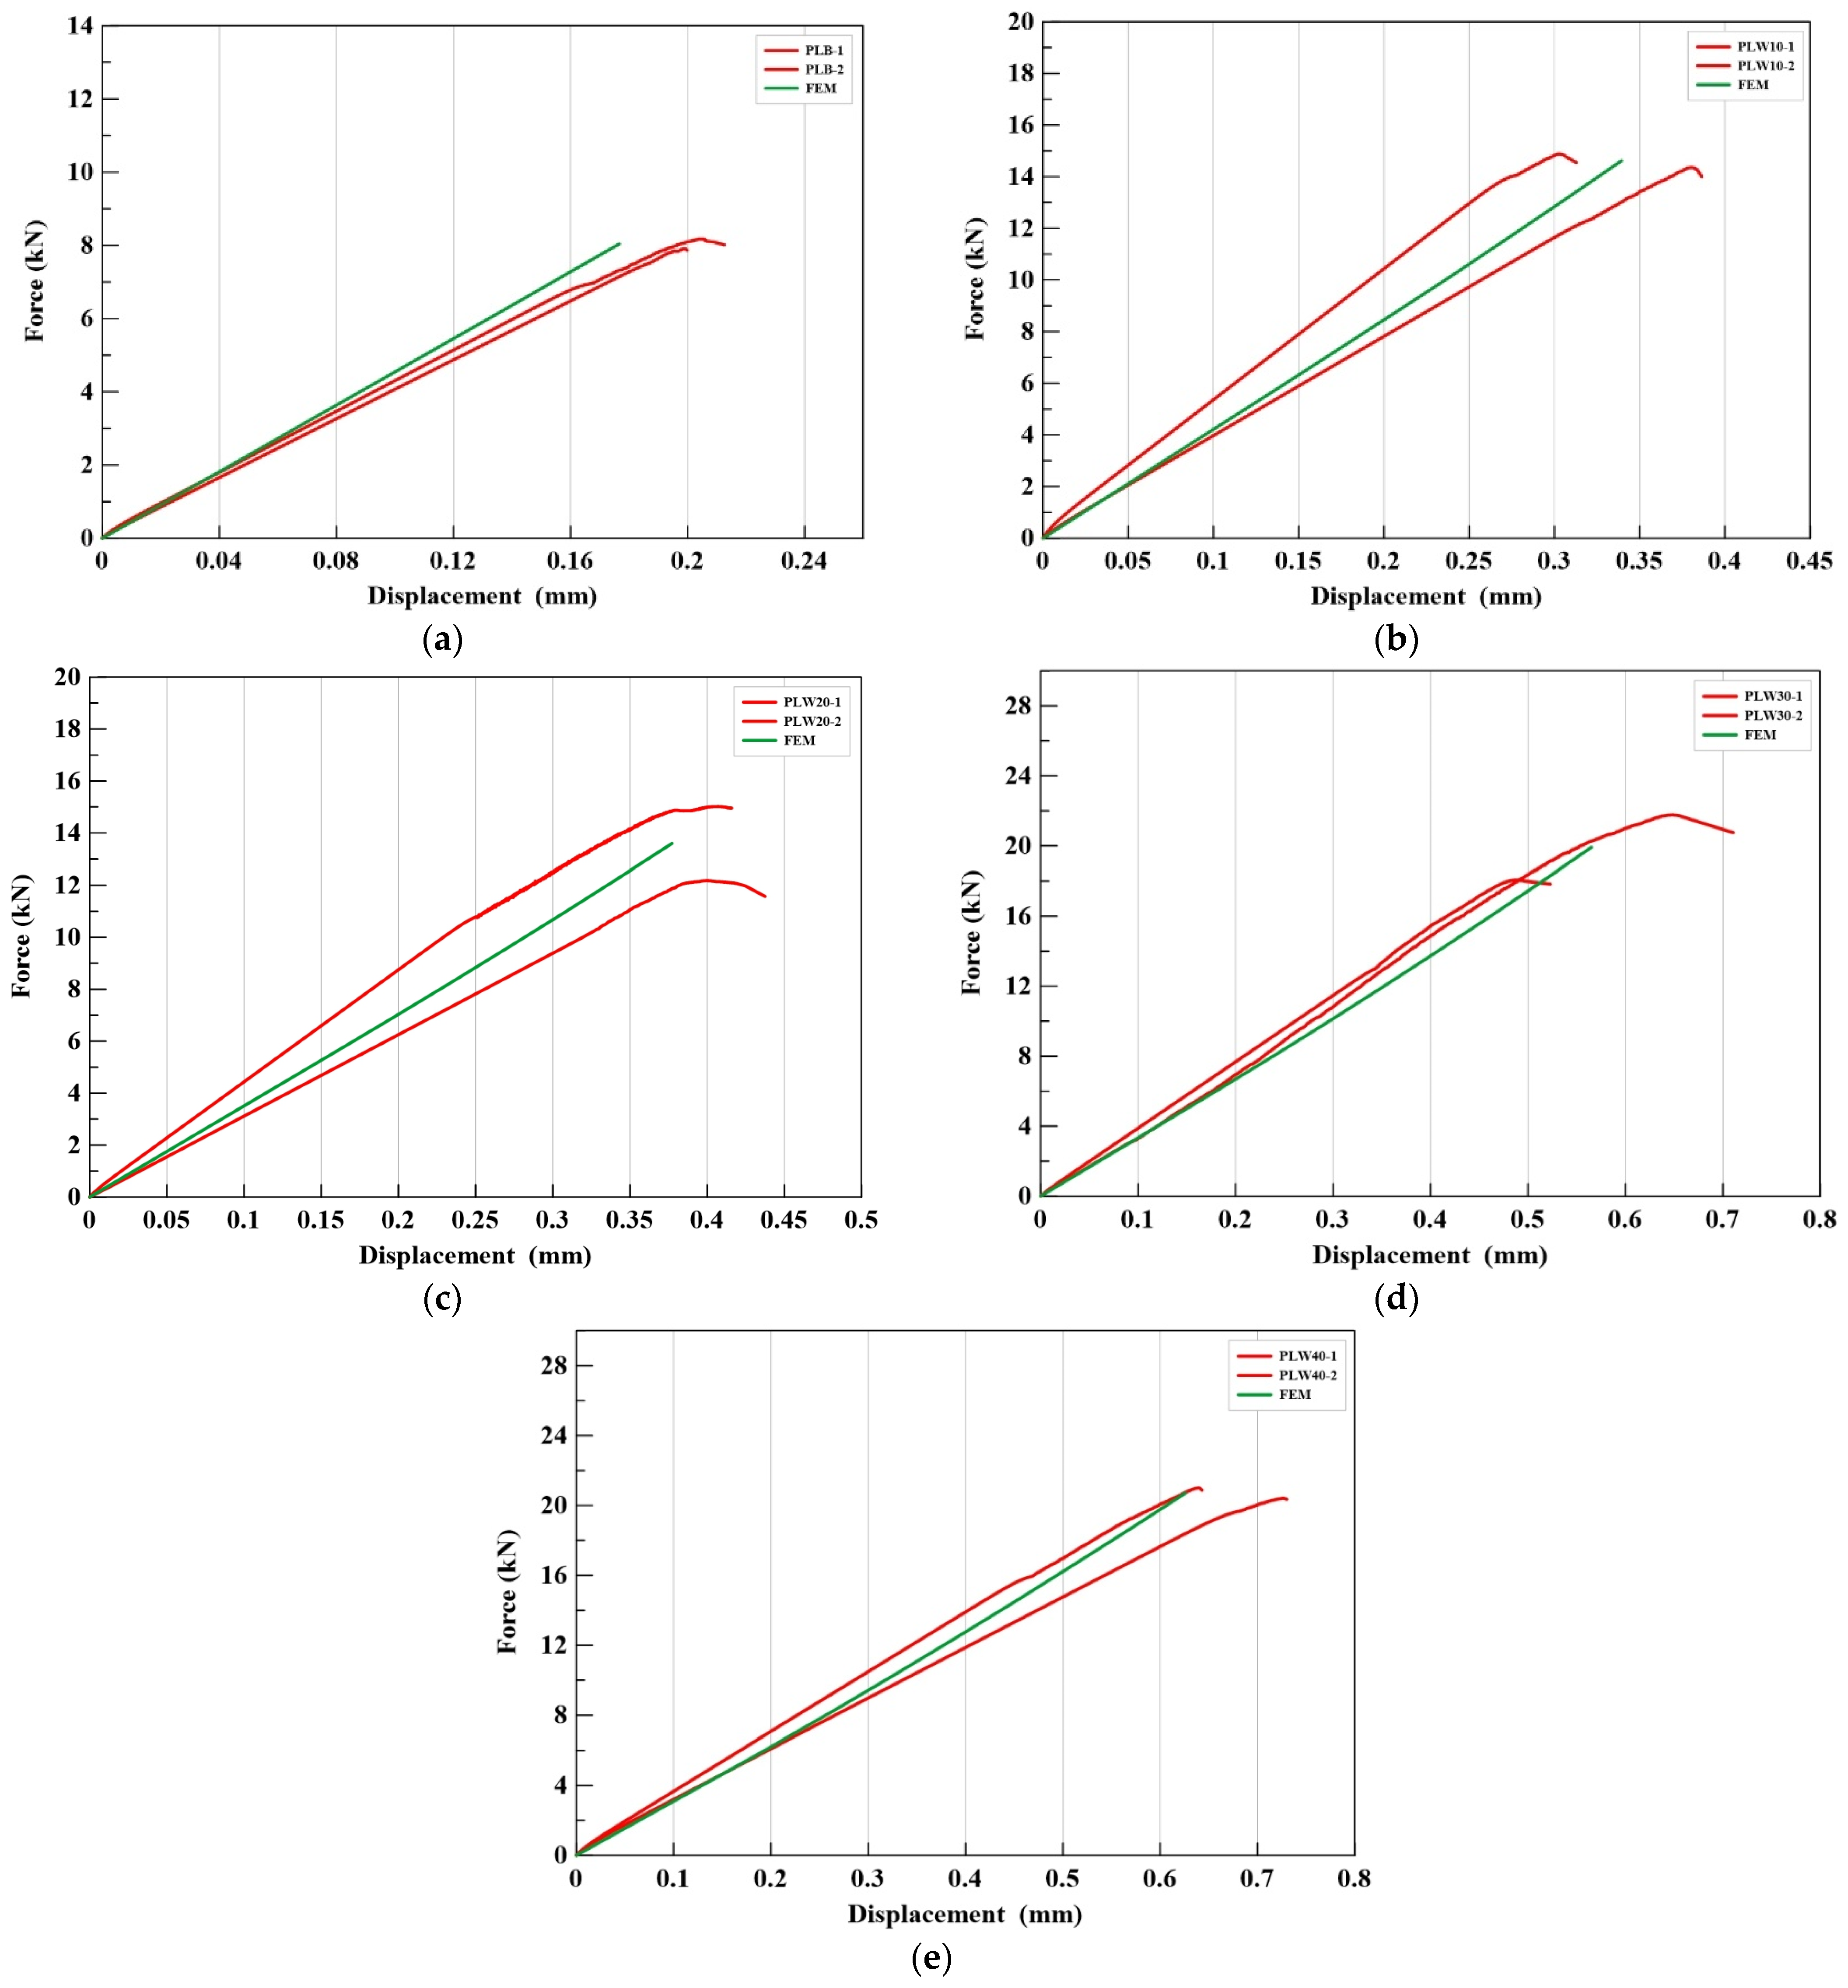
Four-point bending tests were conducted on 3D-printed truss members to evaluate their structural response, and two specimens were tested for each mixture. The structural behavior was assessed based on the load–displacement curves. The specimen nomenclature is illustrated by F-PLB-1, which denotes the first truss member in the F-PLB group. As summarized in Table 6, the incorporation of WPCBP significantly enhanced the structural performance of the truss members. The average peak load of F-PLB was 8.041 kN, whereas those of F-PLW10, F-PLW20, F-PLW30, and F-PLW40 were all increased. In particular, the average peak loads of F-PLW30 and F-PLW40 increased by 148% and 158%, respectively, compared with F-PLB, indicating that the flexural load-bearing capacity of the 3D-printed truss members was markedly improved by WPCBP incorporation. In addition, the displacement corresponding to the peak load showed a similar increasing trend. The average displacement at peak load increased from 0.201 mm for F-PLB to 0.683 mm for F-PLW40, corresponding to an increase of 239%. These results indicate that WPCBP incorporation improved not only the load-bearing capacity of the 3D-printed truss members under four-point bending but also their deformation capacity. The failure appearances of the truss members after four-point bending are shown in Table 7. Cracks were mainly concentrated between the two loading points, corresponding to the main flexural region of the four-point bending test. This indicates that failure was primarily governed by localized flexural cracking in the region between the two loading points, rather than support failure or global instability.
The enhanced structural performance of the 3D-printed truss members may be related to the morphology and interfacial behavior of the glass fiber bundles in WPCBP. Compared with the other constituents in the 3DPCM mixtures, the slender fiber bundles in WPCBP can provide crack-bridging and fiber pull-out effects across fractured surfaces. These mechanisms dissipate fracture energy and delay crack propagation, thereby reducing the tendency toward brittle failure. In addition, the rough epoxy-rich surface of the glass fiber bundles may enhance mechanical interlocking with the cement matrix, further improving load transfer and contributing to the increased load-bearing and deformation capacities of the 3D-printed truss members.
It should be noted that the mechanical response of the standard specimens and that of the 3D-printed truss members should be interpreted at different evaluation levels. The standard specimens were used to evaluate the material-scale properties of 3DPCM under relatively simple loading conditions, whereas the truss members represented structural-scale components subjected to four-point bending. Therefore, the structural response of the truss members was governed not only by the intrinsic material strength but also by the truss geometry, stress redistribution, crack propagation path, layer arrangement, and interaction between printed filaments. Consequently, the WPCBP/C ratio that produced the optimal material-scale mechanical performance does not necessarily correspond to the maximum structural-scale load-bearing response. In this study, WPCBP/C = 20 wt.% was identified as the optimal dosage for quasi-static mechanical performance of the standard specimens, while the truss members exhibited a different structural response because of their bending-dominated stress state and geometric configuration.

6.2. Finite Element Modeling

6.2.1. Numerical Modeling and Material Parameters

The finite element method (FEM) was adopted as the numerical approach in this study, and ANSYS 2019 R3 was used to simulate the structural behavior of 3D-printed truss members under four-point bending. Considering the layer-by-layer stacking characteristics of 3DCP and the resulting directional anisotropy, an orthotropic material model was adopted. The elastic moduli in the three principal directions, Ex, Ey, and Ez, were determined from the compressive test results of 3D-printed cube specimens, as summarized in Table 8. It can be observed that as the WPCBP content increased, the elastic moduli in all three directions decreased, indicating that the displacement of the 3D-printed truss members also increased. Poisson’s ratios in the XY, YZ, and XZ planes were assumed to be 0.2. The shear moduli in the XY, YZ, and XZ planes were calculated using G = E/[2(1 + ν)].

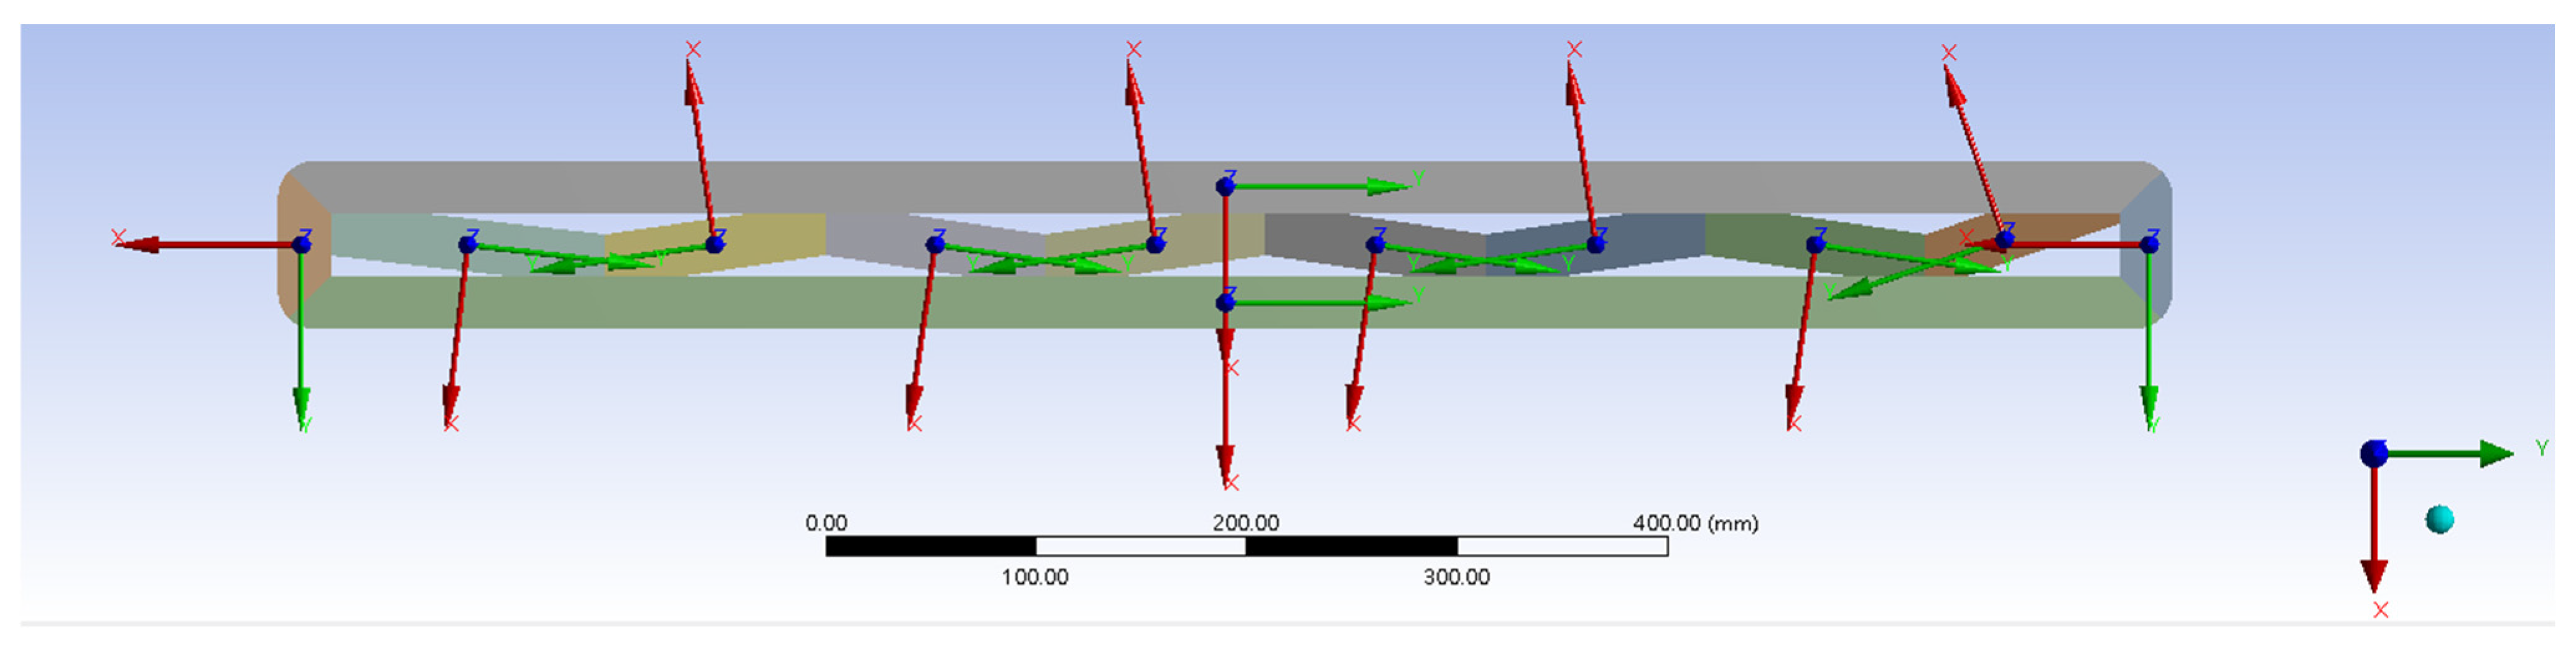
6.2.2. Contact Definition and Local Coordinate Systems

For model construction, the 3D-printed truss member was represented by 15 stacked printed layers, each with a thickness of 10 mm. To account for the anisotropic behavior induced by the printing process, a separate local coordinate system was assigned to each component, as illustrated in Figure 16. In the FEM model, the orthotropic material properties were assigned using local coordinate systems to reflect the printing-path-dependent anisotropy of the 3D-printed truss members. For each printed member, the local Y-axis was defined as the printing direction. For diagonal members with angled print paths, the local coordinate system was rotated to align the local Y-axis with the member axis/printing path, shown in Figure 5a.
The interfaces between adjacent printed layers were defined using a frictional contact formulation, with a friction coefficient of 0.4 adopted from the literature [62]. All other contact surfaces were defined as bonded contact, thereby assuming perfect bonding without relative sliding under loading. To evaluate the sensitivity of the numerical response to this assumption, the friction coefficient was varied from 0 to 1.0 under a force-controlled condition. In each analysis, the same experimental failure-load level was applied, and the corresponding displacement response was compared. Therefore, this sensitivity analysis was intended to evaluate the influence of the friction coefficient on the global displacement response, rather than to determine the peak load capacity for each friction coefficient. The results are summarized in Table 9. The displacement decreased slightly from 0.1788 mm at μ = 0 to 0.1750 mm at μ = 1.0, corresponding to a maximum difference of 0.0038 mm. At the adopted friction coefficient of μ = 0.4, the displacement was 0.1767 mm. Within the investigated range, the limited variation in displacement suggests that the predicted global response was relatively insensitive to the assumed friction coefficient. However, this sensitivity assessment was limited to the displacement response at the selected load level.

6.2.3. Mesh Convergence Analysis

A mesh convergence analysis was conducted to ensure the accuracy and stability of the numerical simulation. The X-direction displacement at the center of the truss member was selected as the convergence indicator. Six element sizes, namely 10, 9, 8, 7, 6, and 5 mm, were evaluated, and the results are summarized in Table 10. As the element size was reduced from 10 to 8 mm, the X-direction displacement changed from 0.206 to 0.148 mm, indicating a relatively large variation in the numerical response. When the element size was further reduced to 7 and 6 mm, the relative error decreased to 4.2% and 2.5%, respectively, suggesting that the numerical results had reached an acceptable level of convergence. Although the 6 mm mesh exhibited a slightly lower relative error, the 5 mm mesh was adopted for subsequent analyses to ensure higher spatial resolution and numerical stability. The final model contained 102,696 elements.

6.3. Finite Element Analysis and Experimental Results

As shown in Figure 17a–e, the load–displacement curves obtained from the FEM simulations show good agreement with the experimental results in terms of peak load and overall response trend. This indicates that the developed FEM model can effectively represent the global load-bearing behavior of the 3D-printed truss members under four-point bending. The agreement also suggests that the use of orthotropic material parameters, interlayer contact definitions, and local coordinate system assignments can reasonably describe the effects of printing path and material directionality on the structural response.
It should be noted that the experimental curves exhibit slight nonlinearity before reaching the peak load, whereas the FEM results mainly show an approximately linear elastic response. This discrepancy does not indicate that the model fails to capture the overall structural behavior; rather, it reflects that the present model is primarily intended to predict the global stiffness and peak load-bearing capacity. In the actual tests, the pre-peak nonlinearity may be associated with the gradual formation of microcracks within the mortar matrix, localized damage at interlayer interfaces, and progressive stiffness reduction in the tensile region. Since damage evolution and crack propagation were not explicitly incorporated into the orthotropic elastic model, the simulation of minor pre-peak nonlinear behavior remains limited. Nevertheless, the developed FEM model can reasonably predict the primary structural response of the 3D-printed truss members.

7. Conclusions

This study investigated the feasibility of incorporating MBOFS sand and WPCBP into 3DPCM. The printability, mechanical anisotropy, four-point bending behavior of 3D-printed truss members, and FEM-based numerical response were evaluated. Based on the experimental and numerical results, the following conclusions can be drawn:
  • All 3DPCM mixtures exhibited satisfactory printability. Stable flowability, extrudability, and buildability were achieved for all mixtures, and the specimens were successfully printed without collapse, filament breakage, or nozzle blockage.
  • WPCBP incorporation showed different effects on cast and 3D-printed specimens. For cast specimens, the compressive, flexural, and splitting tensile strengths decreased with increasing WPCBP content, indicating that WPCBP did not provide a positive reinforcing effect under conventional casting conditions. In contrast, the 3D-printed specimens exhibited better mechanical performance at an appropriate WPCBP dosage, suggesting that 3DCP can enhance the effective utilization of WPCBP in 3DPCM.
  • WPCBP/C = 20 wt.% was identified as the optimal dosage for quasi-static mechanical performance in this study. At this dosage, the maximum compressive strength, flex-ural strength, and splitting tensile strength of the 3D-printed specimens reached 51.2 MPa in the 3D-Z direction, 9.0 MPa in the 3D-Z direction, and 4.9 MPa in the 3D-X direction, respectively. When the WPCBP/C ratio exceeded 20 wt.%, the mechanical strength decreased, which may be associated with reduced material homogeneity and weakened continuity of the cementitious matrix caused by excessive WPCBP incorporation.
  • Pronounced mechanical anisotropy was observed in the 3D-printed specimens. In the compressive test, the 3D-Z direction exhibited the highest compressive strength, followed by the 3D-Y and 3D-X directions. In the flexural test, the 3D-Z direction showed higher flexural strength than the 3D-X direction. In the splitting tensile test, the 3D-X direction exhibited higher splitting tensile strength than the 3D-Y direction. These results confirm that the mechanical response of 3DPCM is significantly affected by the loading direction, printing path, and interlayer interfaces.
  • The four-point bending tests confirmed the structural application potential of the developed 3DPCM. WPCBP incorporation significantly improved the load-bearing and deformation capacities of the 3D-printed truss members. The average peak load increased from 8.041 kN for F-PLB to 20.710 kN for F-PLW40, corresponding to an increase of 158%, while the average displacement at peak load increased from 0.201 mm to 0.683 mm.
  • The FEM results showed good agreement with the experimental results in terms of peak load and overall load–displacement trend. Through the use of orthotropic material parameters, interlayer contact definitions, and local coordinate system assignments, the developed model reasonably captured the global load-bearing behavior of the 3D-printed truss members. However, the FEM curves mainly exhibited an approximately linear elastic response, whereas the experimental curves showed slight nonlinearity before reaching the peak load. This difference may be associated with microcrack initiation, localized interlayer damage, and stiffness degradation, which were not explicitly incorporated into the current orthotropic elastic model. Therefore, the present FEM model should be interpreted as a simplified structural-level model for evaluating the global response and peak load trend, rather than as a fully calibrated nonlinear damage model for point-by-point prediction of the load–displacement curve.

Author Contributions

Y.-F.L.: conceptualization, funding acquisition, methodology, project administration, supervision, and writing—review and editing; C.-H.C.: data curation, formal analysis, and writing—original draft; T.-H.Y.: validation, data curation, and writing—review and editing; S.-M.C.: validation, data curation, and writing—review and editing; W.-H.L.: validation, data curation, and writing—review and editing; M.-H.L.: validation and writing—review and editing. All authors have read and agreed to the published version of the manuscript.

Funding

This research was funded by the National Science and Technology Council of Taiwan government under contract No. NSTC 114-2221-E-027-003.

Data Availability Statement

The original contributions presented in this study are included in the article. Further inquiries can be directed to the corresponding author.

Conflicts of Interest

The authors declare no conflicts of interest.

Nomenclature

AbbreviationFull term
3DCP3D concrete printing
3DPCM3D-printable cement mortar
MBOFSModified basic oxygen furnace slag
BOFSBasic oxygen furnace slag
WPCBPWaste printed circuit board powder
WPCBWaste printed circuit board
WEEEWaste electrical and electronic equipment
SPSuperplasticizer
ACAccelerator
W/CWater-to-cement ratio
WPCBP/CWaste printed circuit board powder-to-cement ratio
SP/CSuperplasticizer-to-cement ratio
AC/CAccelerator-to-cement ratio
XRDX-ray diffraction
TCLPToxicity characteristic leaching procedure
FMFineness modulus
FEMFinite element method
FEAFinite element analysis
LVDTLinear variable differential transformer
SDStandard Deviation

References

  1. Xiao, J.; Zou, S.; Poon, C.S.; Sham, M.L.; Li, Z.; Shah, S.P. We use 30 billion tonnes of concrete each year—here’s how to make it sustainable. Nature 2025, 638, 888–890. [Google Scholar] [CrossRef] [Scilit] [PubMed]
  2. Ren, Z.; Li, D. Application of steel slag as an aggregate in concrete production: A review. Materials 2023, 16, 5841. [Google Scholar] [CrossRef] [Scilit] [PubMed]
  3. Rifa, A.; Subhani, S.M.; Bahurudeen, A.; Santhosh, K.G. A systematic comparison of performance of recycled concrete fine aggregates with other alternative fine aggregates: An approach to find a sustainable alternative to river sand. J. Build. Eng. 2023, 78, 107695. [Google Scholar] [CrossRef] [Scilit]
  4. Santhosh, K.G.; Subhani, S.M.; Bahurudeen, A. Cleaner production of concrete by using industrial by-products as fine aggregate: A sustainable solution to excessive river sand mining. J. Build. Eng. 2021, 42, 102415. [Google Scholar] [CrossRef] [Scilit]
  5. Dinh, H.L.; Liu, J.; Ong, D.E.; Doh, J.H. A sustainable solution to excessive river sand mining by utilizing by-products in concrete manufacturing: A state-of-the-art review. Clean. Mater. 2022, 6, 100140. [Google Scholar] [CrossRef] [Scilit]
  6. Naidu, T.S.; Sheridan, C.M.; van Dyk, L.D. Basic oxygen furnace slag: Review of current and potential uses. Miner. Eng. 2020, 149, 106234. [Google Scholar] [CrossRef] [Scilit]
  7. Ahmad, F.; Qureshi, M.I.; Rawat, S.; Alkharisi, M.K.; Alturki, M. E-waste in concrete construction: Recycling, applications, and impact on mechanical, durability, and thermal properties—A review. Innov. Infrastruct. Solut. 2025, 10, 246. [Google Scholar] [CrossRef] [Scilit]
  8. Collivignarelli, M.C.; Cillari, G.; Ricciardi, P.; Miino, M.C.; Torretta, V.; Rada, E.C.; Abbà, A. The production of sustainable concrete with the use of alternative aggregates: A review. Sustainability 2020, 12, 7903. [Google Scholar] [CrossRef] [Scilit]
  9. Ramteke, J.; Rathore, K.; Supe, J.D. Green concrete incorporating industrial waste and E-waste: A review of compressive strength, CO2 emissions, and replacement levels. Asian J. Civ. Eng. 2025, 26, 1881–1906. [Google Scholar] [CrossRef] [Scilit]
  10. World Steel Association. Total Production of Crude Steel. Available online: https://worldsteel.org/data/annual-production-steel-data/?ind=P1_crude_steel_total_pub/CHN/IND (accessed on 27 February 2026).
  11. Ma, C.; Zhang, S.; Li, K.; Zhao, T.; Meng, Q.; Guan, D.; Zhang, A. Stainable utilization strategies for basic oxygen furnace slag: Properties, processing, and future directions. Metals 2025, 15, 537. [Google Scholar] [CrossRef] [Scilit]
  12. Zhao, Q.; Pang, L.; Wang, D. Adverse effects of using metallurgical slags as supplementary cementitious materials and aggregate: A review. Materials 2022, 15, 3803. [Google Scholar] [CrossRef] [Scilit] [PubMed]
  13. Oh, G.; Oh, S.; Choi, S. Carbonated Basic Oxygen Furnace Slag Fine Aggregate in Concrete: Laboratory Assessment and Sustainable Application in 3D-Printed Concrete Components. J. Build. Eng. 2026, 121, 115665. [Google Scholar] [CrossRef] [Scilit]
  14. Jiang, Y.; Ling, T.-C.; Shi, C.; Pan, S.-Y. Characteristics of steel slags and their use in cement and concrete—A review. Resour. Conserv. Recycl. 2018, 136, 187–197. [Google Scholar] [CrossRef] [Scilit]
  15. Kambole, C.; Paige-Green, P.; Kupolati, W.; Ndambuki, J.; Adeboje, A. Basic oxygen furnace slag for road pavements: A review of material characteristics and performance for effective utilisation in southern Africa. Constr. Build. Mater. 2017, 148, 618–631. [Google Scholar] [CrossRef] [Scilit]
  16. Li, Z.; Zhao, S.; Zhao, X.; He, T. Cementitious property modification of basic oxygen furnace steel slag. Constr. Build. Mater. 2013, 48, 575–579. [Google Scholar] [CrossRef] [Scilit]
  17. Ferreira Neto, J.B.; Fredericci, C.; Faria, J.O.; Chotoli, F.F.; Ribeiro, T.R.; Malynowskyj, A.; Silva, A.L.; Quarcioni, V.A.; Lotto, A.A. Modification of basic oxygen furnace slag for cement manufacturing. J. Sustain. Metall. 2017, 3, 720–728. [Google Scholar] [CrossRef] [Scilit]
  18. Li, Q.; Li, B.; Li, X.; He, Z.; Zhang, P. Microstructure of pretreated steel slag and its influence on mechanical properties of cement stabilized mixture. Constr. Build. Mater. 2022, 317, 125799. [Google Scholar] [CrossRef] [Scilit]
  19. Gao, W.; Zhou, W.; Lyu, X.; Liu, X.; Su, H.; Li, C.; Wang, H. Comprehensive utilization of steel slag: A review. Powder Technol. 2023, 422, 118449. [Google Scholar] [CrossRef] [Scilit]
  20. Tseng, Y.; Lee, Y.; Sheu, B. Application and Breakthrough of BOF Slag Modification. China Steel Tech. Rep. 2015, 28, 46–51. [Google Scholar]
  21. Syu, J.-Y.; Li, Y.-W.; Li, Y.-F.; Huang, C.-H.; Chen, S.-H.; Lee, W.-H. A Study on Thermal Performance for Building Shell of Modified Basic Oxygen Furnace Slag Replacing Partial Concrete Aggregate. Buildings 2025, 16, 108. [Google Scholar] [CrossRef] [Scilit]
  22. Li, Y.-F.; Lin, H.-S.; Syu, J.-Y.; Lee, W.-H.; Huang, C.-H.; Tsai, Y.-K.; Shvarzman, A. Investigating the Static and Dynamic Mechanical Properties of Fiber-Reinforced Concrete Incorporating Recycled Carbon Fiber and Modified Basic Oxygen Furnace Slag Aggregate. Recycling 2025, 10, 206. [Google Scholar] [CrossRef] [Scilit]
  23. Gdowska, K.; Pham, W. Optimizing E-Waste Collection for Sustainable Recovery of Critical Metals in Urban Collection Systems. Sustainability 2026, 18, 2231. [Google Scholar] [CrossRef] [Scilit]
  24. Selvaraj, T.; T, S.; Kaliyavaradhan, S.K.; Kakria, K.; Malladi, R.C. Use of e-waste in metakaolin blended cement concrete for sustainable construction. Sustainability 2022, 14, 16661. [Google Scholar] [CrossRef] [Scilit]
  25. Niu, B.; Shanshan, E.; Xu, Z.; Guo, J. How to efficient and high-value recycling of electronic components mounted on waste printed circuit boards: Recent progress, challenge, and future perspectives. J. Clean. Prod. 2023, 415, 137815. [Google Scholar] [CrossRef] [Scilit]
  26. Hao, J.; Wang, Y.; Wu, Y.; Guo, F. Metal recovery from waste printed circuit boards: A review for current status and perspectives. Resour. Conserv. Recycl. 2020, 157, 104787. [Google Scholar] [CrossRef] [Scilit]
  27. Kumar, A.; Kuppusamy, V.K.; Holuszko, M.E.; Janke, T. Improving the energy concentration in waste printed circuit boards using gravity separation. Recycling 2018, 3, 21. [Google Scholar] [CrossRef] [Scilit]
  28. Gao, Y.; Chen, T.; Li, Y.; Gu, X.; Cheng, Z.; Zhu, J. Study on the properties and microstructure of polymer modified waste printed circuit board cement-based materials. J. Build. Eng. 2024, 91, 109542. [Google Scholar] [CrossRef] [Scilit]
  29. Faraji, F.; Golmohammadzadeh, R.; Pickles, C.A. Potential and current practices of recycling waste printed circuit boards: A review of the recent progress in pyrometallurgy. J. Environ. Manag. 2022, 316, 115242. [Google Scholar] [CrossRef] [Scilit] [PubMed]
  30. Pop, L.-C.; Szima, S.; Fogarasi, S. Recovery of Critical Metals from Waste-Printed Circuit Boards for Sustainable Energy Transition. Crystals 2026, 16, 67. [Google Scholar] [CrossRef] [Scilit]
  31. Kakria, K.; Thirumalini, S.; Secco, M.; Priya, T.S. A novel approach for the development of sustainable hybridized geopolymer mortar from waste printed circuit boards. Resour. Conserv. Recycl. 2020, 163, 105066. [Google Scholar] [CrossRef] [Scilit]
  32. Schneider, E.L.; Veit, H.M.; Hartmann, W.L.; Stolz, C.M.; Robinson, L.C.; Oliveira, C.T.; Vargas, A.S.d. Cement matrix containing lightweight aggregate based on non-metallic fraction printed circuit boards (NMFPCB’S). J. Mater. Res. Technol. 2021, 14, 2992–2997. [Google Scholar] [CrossRef] [Scilit]
  33. Zhao, X.; Chow, C.L.; Lau, D. Mechanical enhancement induced by high interfacial interlocking in cement-based composite mixed with waste printed circuit boards. Constr. Build. Mater. 2025, 499, 144034. [Google Scholar] [CrossRef] [Scilit]
  34. Senthil Kumar, K.; Baskar, K. Recycling of E-plastic waste as a construction material in developing countries. J. Mater. Cycles Waste Manag. 2015, 17, 718–724. [Google Scholar] [CrossRef] [Scilit]
  35. Li, Y.-F.; Lin, C.-C.; Syu, J.-Y.; Huang, C.-H.; Chiu, Y.-T.; Lok, M.-H.; Kuo, W.-S. Enhancing 3D-Printed Cement Mortar with Recycled PCB Glass Fibers: Printability, Mechanical Strength, and FEM-Based Structural Assessment. J. Build. Eng. 2025, 115, 114485. [Google Scholar] [CrossRef] [Scilit]
  36. Gerges, I.; Abi Farraj, F.; Youssef, N.; Antczak, E.; Hage Chehade, F. Methodologies to Design Optimum 3D Printable Mortar Mix: A Review. Buildings 2025, 15, 2497. [Google Scholar] [CrossRef] [Scilit]
  37. Ahmed, G.H.; Askandar, N.H.; Jumaa, G.B. A review of largescale 3DCP: Material characteristics, mix design, printing process, and reinforcement strategies. Structures 2022, 43, 508–532. [Google Scholar] [CrossRef] [Scilit]
  38. De Schutter, G.; Lesage, K.; Mechtcherine, V.; Nerella, V.N.; Habert, G.; Agusti-Juan, I. Vision of 3D printing with concrete—Technical, economic and environmental potentials. Cem. Concr. Res. 2018, 112, 25–36. [Google Scholar] [CrossRef] [Scilit]
  39. Wang, J.; Anwar, M.K.; Zhu, X.; Zhang, Y.; Gilabert, F.A. Robust optimization of formulation ratios for the mechanical, microstructural and printing performance of cost-effective 3D printing geopolymer. J. Build. Eng. 2025, 111, 113586. [Google Scholar] [CrossRef] [Scilit]
  40. Anwar, M.K.; Zhu, X.; Zhang, Y.; Wang, J.; Wu, Y.; Gilabert, F.A. Synergistic effects of microwave curing regimes on early, mid, and long-term strengths and microstructural performance of fly ash-slag based 3D-printed geopolymers. Clean. Mater. 2025, 18, 100343. [Google Scholar] [CrossRef] [Scilit]
  41. Hassan, A.; Alomayri, T.; Noaman, M.F.; Zhang, C. 3D printed concrete for sustainable construction: A review of mechanical properties and environmental impact. Arch. Comput. Methods Eng. 2025, 32, 2713–2743. [Google Scholar] [CrossRef] [Scilit]
  42. Camacho, D.D.; Clayton, P.; O’Brien, W.J.; Seepersad, C.; Juenger, M.; Ferron, R.; Salamone, S. Applications of additive manufacturing in the construction industry—A forward-looking review. Autom. Constr. 2018, 89, 110–119. [Google Scholar] [CrossRef] [Scilit]
  43. Puzatova, A.; Shakor, P.; Laghi, V.; Dmitrieva, M. Large-scale 3D printing for construction application by means of robotic arm and gantry 3D printer: A review. Buildings 2022, 12, 2023. [Google Scholar] [CrossRef] [Scilit]
  44. Liu, J.; Lv, C. Properties of 3D-printed polymer fiber-reinforced mortars: A review. Polymers 2022, 14, 1315. [Google Scholar] [CrossRef] [Scilit] [PubMed]
  45. Li, S.; Khieu, H.H.; Black, J.R.; Nguyen-Xuan, H.; Tran, P. Two-scale 3D printed steel fiber reinforcements strategy for concrete structures. Constr. Build. Mater. 2025, 458, 139626. [Google Scholar] [CrossRef] [Scilit]
  46. Lim, J.H.; Zhang, X.; Ting, G.H.A.; Pham, Q.-C. Stress-cognizant 3D printing of free-form concrete structures. J. Build. Eng. 2021, 39, 102221. [Google Scholar] [CrossRef] [Scilit]
  47. Ye, J.; Cui, C.; Yu, J.; Yu, K.; Dong, F. Effect of polyethylene fiber content on workability and mechanical-anisotropic properties of 3D printed ultra-high ductile concrete. Constr. Build. Mater. 2021, 281, 122586. [Google Scholar] [CrossRef] [Scilit]
  48. Aminpour, N.; Memari, A. Analysis of anisotropic behavior in 3D concrete printing for mechanical property evaluation. J. Build. Eng. 2025, 99, 111652. [Google Scholar] [CrossRef] [Scilit]
  49. Rahul, A.; Santhanam, M.; Meena, H.; Ghani, Z. 3D printable concrete: Mixture design and test methods. Cem. Concr. Compos. 2019, 97, 13–23. [Google Scholar] [CrossRef] [Scilit]
  50. Arunothayan, A.R.; Nematollahi, B.; Ranade, R.; Bong, S.H.; Sanjayan, J. Development of 3D-printable ultra-high performance fiber-reinforced concrete for digital construction. Constr. Build. Mater. 2020, 257, 119546. [Google Scholar] [CrossRef] [Scilit]
  51. Tay, Y.W.D.; Qian, Y.; Tan, M.J. Printability region for 3D concrete printing using slump and slump flow test. Compos. Part B Eng. 2019, 174, 106968. [Google Scholar] [CrossRef] [Scilit]
  52. Souza, M.T.; Ferreira, I.M.; de Moraes, E.G.; Senff, L.; de Oliveira, A.P.N. 3D printed concrete for large-scale buildings: An overview of rheology, printing parameters, chemical admixtures, reinforcements, and economic and environmental prospects. J. Build. Eng. 2020, 32, 101833. [Google Scholar] [CrossRef] [Scilit]
  53. Xu, W.; Jiang, D.; Zhao, Q.; Wang, L. Study on printability of 3D printing carbon fiber reinforced eco-friendly concrete: Characterized by fluidity and consistency. Case Stud. Constr. Mater. 2024, 21, e03589. [Google Scholar] [CrossRef] [Scilit]
  54. Li, Y.-F.; Liang, Y.-F.; Syu, J.-Y.; Huang, C.-H.; Tsai, Y.-K.; Lok, M.-H. Static and dynamic mechanical characteristics of 3D-Printed anisotropic basalt fiber-reinforced cement mortar. J. Build. Eng. 2025, 100, 111692. [Google Scholar] [CrossRef] [Scilit]
  55. ASTM C191-26; Standard Test Methods for Time of Setting of Hydraulic Cement by Vicat Needle. ASTM International: West Conshohocken, PA, USA, 2026.
  56. ASTM C1437-20; Standard Test Method for Flow of Hydraulic Cement Mortar. ASTM International: West Conshohocken, PA, USA, 2020.
  57. Li, Y.-F.; Tsai, P.-J.; Syu, J.-Y.; Lok, M.-H.; Chen, H.-S. Mechanical properties of 3D-printed carbon fiber-reinforced cement mortar. Fibers 2023, 11, 109. [Google Scholar] [CrossRef] [Scilit]
  58. ASTM C109/C109M-24; Standard Test Method for Compressive Strength of Hydraulic Cement Mortars (Using 50 mm [2 in.] Cube Specimens). ASTM International: West Conshohocken, PA, USA, 2024.
  59. ASTM C348-21; Standard Test Method for Flexural Strength of Hydraulic-Cement Mortars. ASTM International: West Conshohocken, PA, USA, 2021.
  60. ASTM C496-96; Standard Test Method for Splitting Tensile Strength of Cylindrical Concrete Specimens. ASTM International: West Conshohocken, PA, USA, 2021.
  61. ASTM C78/C78M-22; Standard Test Method for Flexural Strength of Concrete (Using Simple Beam with Third-Point Loading). ASTM International: West Conshohocken, PA, USA, 2022.
  62. To, Q.B.; Pham, K.V.A.; Lee, G.; Shin, M.; Shin, D.W.; Lee, K. Experimental and FEM evaluation of the influence of interlayer bonding strength in 3D printed concrete members under compressive and flexural loadings. J. Build. Eng. 2024, 94, 109979. [Google Scholar] [CrossRef] [Scilit]
Figure 1. Modified basic oxygen furnace slag sand.
Buildings 16 03037 g001
Figure 2. XRD pattern of MBOFS.
Buildings 16 03037 g002
Figure 3. Morphology and microstructural characteristics of WPCBP: (a) appearance of WPCBP; (b) SEM image; and (c) EDS spectrum of WPCBP.
Buildings 16 03037 g003
Figure 4. XRD pattern of WPCBP.
Buildings 16 03037 g004
Figure 5. Geometric dimensions and schematics of the specimens used in this study: (a) cube specimen for compressive strength testing; (b) prism specimen for flexural strength testing; and (c) cylindrical specimen for splitting tensile strength testing.
Buildings 16 03037 g005
Figure 6. Three-dimensionally printed truss members.
Buildings 16 03037 g006
Figure 7. Gantry-type 3D printing system.
Buildings 16 03037 g007
Figure 8. Experimental setup for the four-point bending test of the 3D-printed truss member.
Buildings 16 03037 g008
Figure 9. Initial and final setting times of the 3DPCM at different AC-to-cement ratios.
Buildings 16 03037 g009
Figure 10. Observation of flowability tests of the benchmark mixture (without WPCBP) with the following admixture conditions: (a) using 2% SP only; (b) using 6% AC only; and (c) using 2% SP and 6% AC.
Buildings 16 03037 g010
Figure 11. Extrusion test results of 3DPCM mixtures with varying WPCBP contents: (a) B; (b) W10; (c) W20; (d) W30; and (e) W40.
Buildings 16 03037 g011
Figure 12. Buildability of 3DPCM mixtures with varying WPCBP contents: (a) B; (b) W10; (c) W20; (d) W30; and (e) W40.
Buildings 16 03037 g012
Figure 13. Compressive strength of 3DPCM and cast specimens.
Buildings 16 03037 g013
Figure 14. Flexural strength of 3DPCM and cast specimens.
Buildings 16 03037 g014
Figure 15. Splitting tensile strength of 3DPCM and cast specimens.
Buildings 16 03037 g015
Figure 16. Configuration of the local coordinate systems for 3D-printed truss members.
Buildings 16 03037 g016
Figure 17. Comparison of experimental and FEM load–displacement curves for 3D-printed truss members with different mixtures: (a) PLB; (b) PLW10; (c) PLW20; (d) PLW30; and (e) PLW40.
Buildings 16 03037 g017
Table 1. Element and content of the WPCBP.
ElementContent (g/kg)
Si<0.1
Al0.1
Ca2.6
Na0.1
K0.2
Fe0.2
Ti<0.1
P0.5
Pb<0.1
Cd<0.1
Cr<0.1
As<0.1
Se<0.1
Zn<0.1
Cu6.9
Mn<0.1
Table 2. Mixture proportions of the 3DPCM.
MaterialValue
Cement1
Silica fume0.1
MBOFS sand1.05
Water0.4
WPCBP (wt.%)0, 10, 20, 30, 40
Superplasticizer (wt.%)2.0~4.3
Accelerator (wt.%)6
Note: All mixture proportions are expressed on a mass basis relative to the cement content.
Table 3. The nomenclature of specimens.
CategoryDescriptionNaming
Test TypeCompressive testC
Flexural testF
Splitting tensile testS
Specimen TypeMold-cast specimenCM
3D-printed specimen3D
3D-printed truss members—component platePL
Material AdditiveWPCBPW
Benchmark (without WPCBP)B
Testing DirectionFor the compressive testX, Y, Z
For the flexural testX, Z
For the tensile splitting testX, Y
Table 4. Flowability and workability of 3DPCM mixtures with varying WPCBP/cement ratios under different chemical admixture conditions.
AdditivesWPCBP/C
(wt.%)
SP/Cement
(wt.%)
AC/Cement
(wt.%)
Flow Value (mm)Average of the Flow Value (mm)
AC
and
SP
02.06175~178177
102.4171~173172
202.7171~174172
303.5166~177170
404.3160~164162
SP only02.00>255>255
102.4>255>255
202.7240~249244
303.5237~239237
404.3235~238236
AC only006Dry and crumbly appearance
10
20
30
40
Table 5. Mini-slump test results of printable 3DPCM mixtures.
WPCBP/C (wt.%)SP/C (wt.%)Slump Value (mm)
02.065
102.455
202.750
303.558
404.371
Table 6. Peak load and corresponding displacement of 3D-printed truss members.
SpecimenPeak Load (kN)Mean ± Standard Deviation (kN)Increase in Average Peak Load (%)Displacement at Peak Load (mm)Mean ± Standard Deviation (mm)Increase of
Average Displacement (%)
F-PLB-18.1768.041 ± 0.190-0.2040.201 ± 0.004-
F-PLB-27.9070.199
F-PLW10-114.88314.621 ± 0.371820.3020.342 ± 0.05670
F-PLW10-214.3580.381
F-PLW20-115.01613.600 ± 2.003690.4070.403 ± 0.006100
F-PLW20-212.1830.399
F-PLW30-121.77119.914 ± 2.6261480.6490.568 ± 0.115182
F-PLW30-218.0570.487
F-PLW40-120.41720.710 ± 0.4141580.7270.683 ± 0.062239
F-PLW40-221.0030.639
Table 7. Failure appearance of 3D-printed truss members.
SpecimenFailure Appearance
F-PLBBuildings 16 03037 i001
Buildings 16 03037 i002
F-PLW10Buildings 16 03037 i003
Buildings 16 03037 i004
F-PLW20Buildings 16 03037 i005
Buildings 16 03037 i006
F-PLW30Buildings 16 03037 i007
Buildings 16 03037 i008
F-PLW40Buildings 16 03037 i009
Buildings 16 03037 i010
Table 8. Elastic moduli of 3D-printed specimens for various mixtures.
SpecimenEx (Gpa)Ey (Gpa)Ez (Gpa)
C-3DB11.9112.0212.23
C-3DW109.4811.8212.00
C-3DW208.249.5711.43
C-3DW308.108.9710.45
C-3DW407.228.459.46
Table 9. Sensitivity analysis of the interlayer friction coefficient in the FEM model using the PLB specimen.
Friction Coefficient (μ)Displacement at Failure Load (mm)
00.1788
0.10.1783
0.20.1779
0.30.1774
0.40.1767
0.50.1766
0.60.1763
0.70.1759
0.80.1756
0.90.1754
1.00.1750
Table 10. Results of mesh convergence analysis and displacement error evaluation.
Element Size (mm)Number of ElementsX-Displacement (mm)Relative Error (%)
1015,6510.20631.4
940,6970.1719.2
844,7760.1485.4
758,9700.1504.2
674,0870.1602.5
5102,6960.156-
Disclaimer/Publisher’s Note: The statements, opinions and data contained in all publications are solely those of the individual author(s) and contributor(s) and not of MDPI and/or the editor(s). MDPI and/or the editor(s) disclaim responsibility for any injury to people or property resulting from any ideas, methods, instructions or products referred to in the content.