Article

Quantitative Assessment of Carbon Pricing and Green Finance Synergistically Driving Deep Decarbonization in the Building Sector


1
School of Management, China University of Mining & Technology (Beijing), Beijing 100083, China
2
School of Mathematics and Statistics, Beijing Technology and Business University, Beijing 100048, China
*
Author to whom correspondence should be addressed.
Buildings 2026, 16(15), 2974; https://doi.org/10.3390/buildings16152974
Submission received: 11 June 2026 / Revised: 19 July 2026 / Accepted: 21 July 2026 / Published: 26 July 2026
(This article belongs to the Section Building Energy, Physics, Environment, and Systems)

Abstract

To quantify the potential of carbon pricing and green finance to jointly drive deep decarbonization in the building sector, this paper extends the MESSAGEix-Buildings model using a policy-endogenous approach. It incorporates the internalization of carbon pricing and carbon emission costs, as well as mechanisms to relax capital constraints in green finance, into the system optimization framework, thereby enabling the quantification of marginal abatement costs and policy interactions. Using civil buildings in Beijing as case studies, four scenarios were devised for simulation analysis. The results show that: (1) carbon pricing alone can achieve a 11.44% reduction in carbon emissions by 2050, whereas green finance can only alleviate investment barriers and deliver only modest additional emission reductions; (2) when the two policies are implemented in tandem, the joint framework generates complementary price constraints and financial incentives, achieving an additional 4.68% reduction in final energy consumption and a nearly 5.27% saving in total investment compared with the carbon-pricing-only scenario. The study elucidates the complementary mechanism of ‘price constraints and cost incentives’, highlighting the methodological value of an endogenous policy approach, and provides quantitative support for the implementation of carbon neutrality in construction and green finance in megacities.

1. Introduction

Global climate governance is accelerating the low-carbon transition of energy and industrial systems. As the world’s largest carbon emitter, China has set the targets of ‘peaking carbon emissions by 2030 and achieving carbon neutrality by 2060’, marking a critical phase in the comprehensive green transition of the country’s economic and social development [1]. As one of China’s three major end-use energy sectors, the success of the construction industry’s low-carbon transition directly determines the overall progress towards achieving the ‘dual carbon’ targets. However, the industry currently faces two key challenges: (1) existing emissions reduction policies tend to focus on individual stages, resulting in a significant fragmentation of tools and a lack of coordination mechanisms across departments and stages; (2) an integrated modeling approach for emissions reduction in buildings has not yet been established, making it difficult to support systematic decision-making. In 2024, carbon emissions from the building sector during the operational phase accounted for 22.1% of the country’s total energy-related carbon emissions, with an average annual growth rate of approximately 2.8% [2]. As urbanization progresses and residential energy demand rises, the pressure to decarbonize the building operations phase is becoming increasingly apparent.
This pressure stems essentially from shortcomings in the regulatory framework for deep decarbonization during the current building operation phase. “Deep decarbonization” refers to a systematic transformation process over the medium-to-long-term development cycle, which involves reducing carbon emissions during building operation phases significantly and approaching near-zero levels through a combination of energy structure transition, building energy efficiency upgrades, and market-oriented policies [3]. In policy practice, emissions reductions in China’s building sector have long relied on administrative measures, while the market-based carbon pricing [4] and emission reduction mechanism centered on the carbon emissions trading market remains underutilized [5]. Although some pilot carbon markets have brought large public buildings under regulation, a unified national carbon market mechanism for buildings has not yet been established, and the transmission pathways for carbon price signals remain unclear, with their effectiveness diminishing [6]. At the same time, the scale of green financial instruments [7] targeting low-carbon projects such as building energy efficiency upgrades and renewable energy development continues to expand, with little alignment with specific emission-reduction technologies, project viability or stringent carbon reduction targets [8]. These two types of market-based policy instruments operate in isolation, lacking coordinated design and quantitative assessment of their effects, and are thus unable to address the practical challenge of diminishing marginal returns associated with individual policies [9,10,11,12,13].
In response to these challenges, the academic community has conducted extensive research into the evaluation of building emissions reduction policies. With regard to individual policy instruments such as carbon pricing and green finance, existing studies have largely examined their respective mechanisms of action and implementation outcomes: research on carbon markets has focused on rules such as allowance allocation and the macro-level incentives for emissions reduction [14,15], whilst research on green finance has concentrated on the role of product innovation in driving renovation projects [16]. However, there has been a general failure to recognize the mechanism through which carbon markets facilitate emissions reductions from indirect emissions in the building sector, nor has there been a corresponding assessment of the incentive effects of green finance within a market environment subject to stringent carbon constraints. In terms of modeling tools, bottom-up techno-economic optimization models such as MESSAGEix and LEAP have become the mainstream tools for assessing long-term emissions reduction scenarios, as they are capable of modeling technology substitution pathways and cost-benefit characteristics [17]. The international academic community has already undertaken a systematic exploration of low-carbon transition pathways for the global and Chinese construction sectors using the MESSAGEix-Buildings model [18].
Previous studies have investigated carbon pricing and complementary policy measures for building decarbonization [19], green finance using system dynamics approaches [20], CGE models, and carbon accounting separately. However, these studies either treat policy variables exogenously, focus on macroeconomic equilibrium, or evaluate isolated policy instruments. In contrast, the present study develops a policy-endogenous MESSAGEix-Buildings framework that explicitly incorporates carbon pricing and green finance within a unified system optimization model, enabling the dynamic evaluation of their nonlinear interactions and synergistic decarbonization effects under localized Beijing conditions.
However, existing models suffer from three distinct limitations described as: (1) Exogenization of policy variables: Existing models typically treat policy elements such as carbon pricing and green finance support as fixed scenario parameters input from outside the model, failing to establish dynamic links with core variables such as building energy intensity and the cost of technological retrofitting. Consequently, they are unable to reflect the endogenous feedback effects on the energy system following policy implementation; (2) Failure to capture interaction effects: The models lack quantitative modules to account for policy synergies; consequently, they cannot capture the cumulative amplification effect of carbon price signals and green finance incentives, nor can they identify potential negative interactions between the two policy types, such as conflicting objectives or offsetting benefits; (3) Insufficient local adaptation: Core parameters in existing models such as technology costs, carbon emission factors and energy types are largely derived from internationally recognized databases. They fail to adequately incorporate localized factors specific to China, such as building characteristics across different climate zones, stages of urbanization and policy implementation pathways, resulting in discrepancies between scenario projections and actual emission reduction potential. These shortcomings directly prevent current research from conducting a scientific, quantitative assessment of the synergistic effects between carbon markets and green finance, and also fail to provide detailed decision-making support for the systematic design of policy instruments in the construction sector [21].
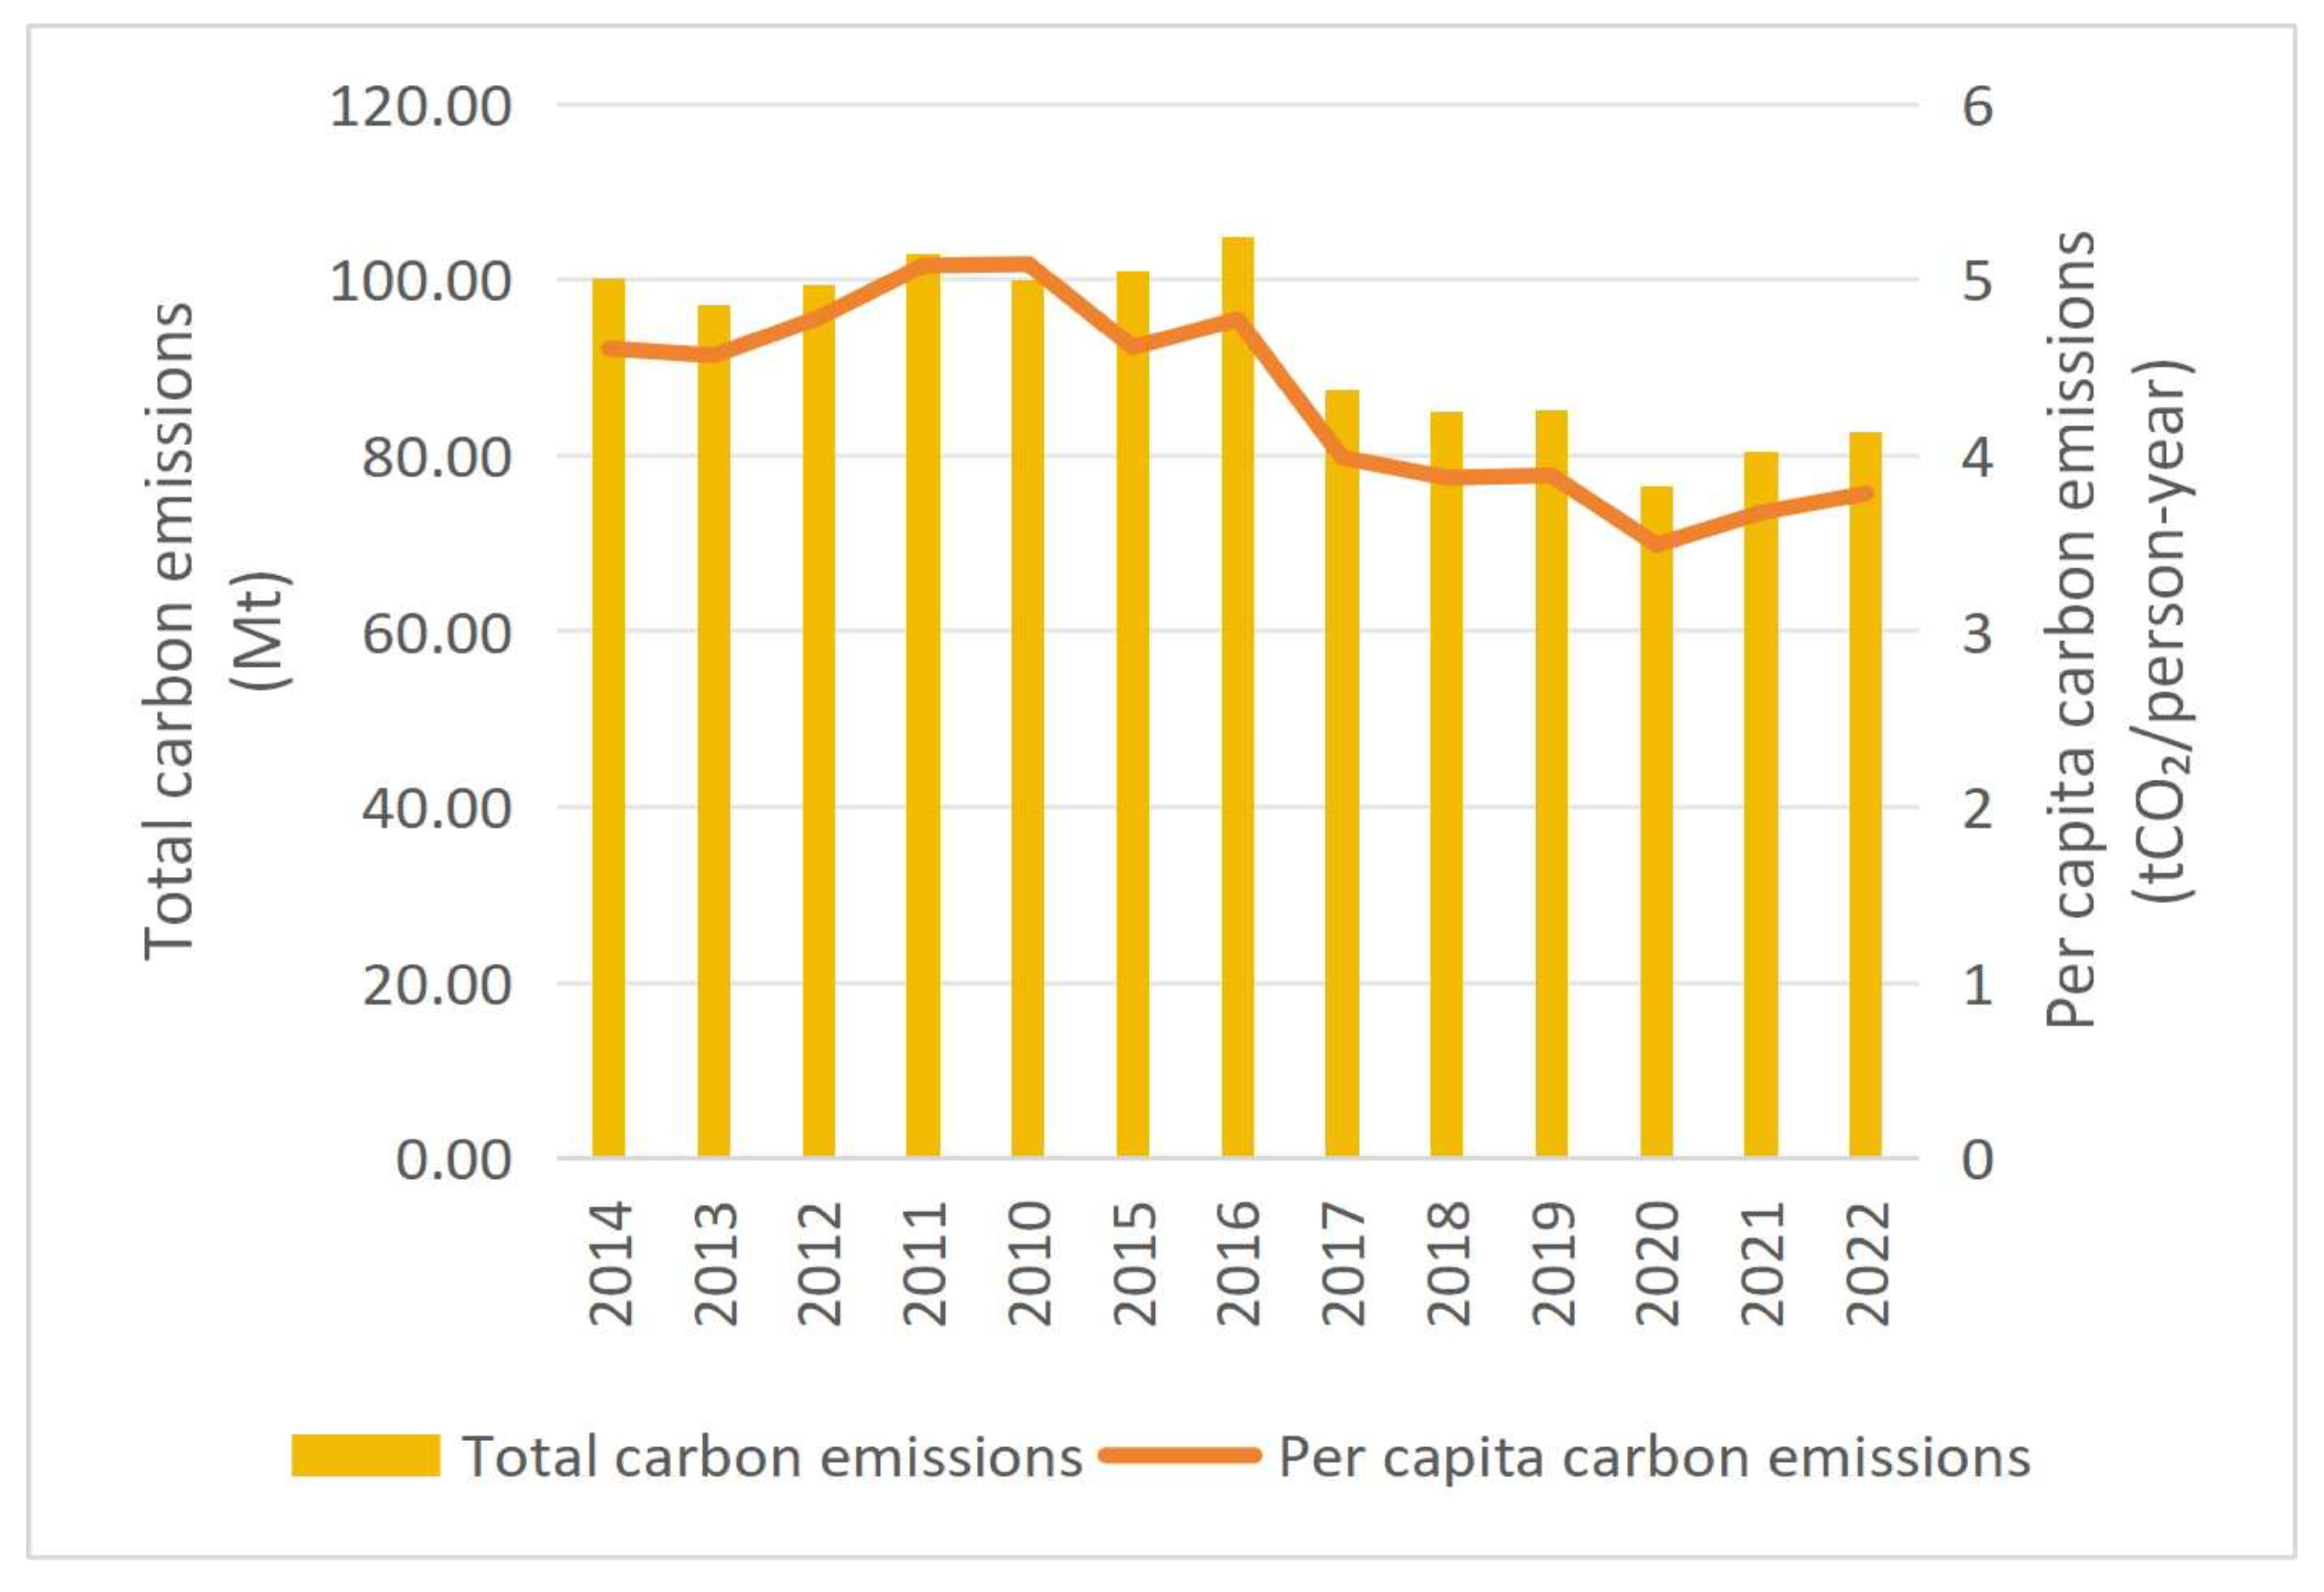
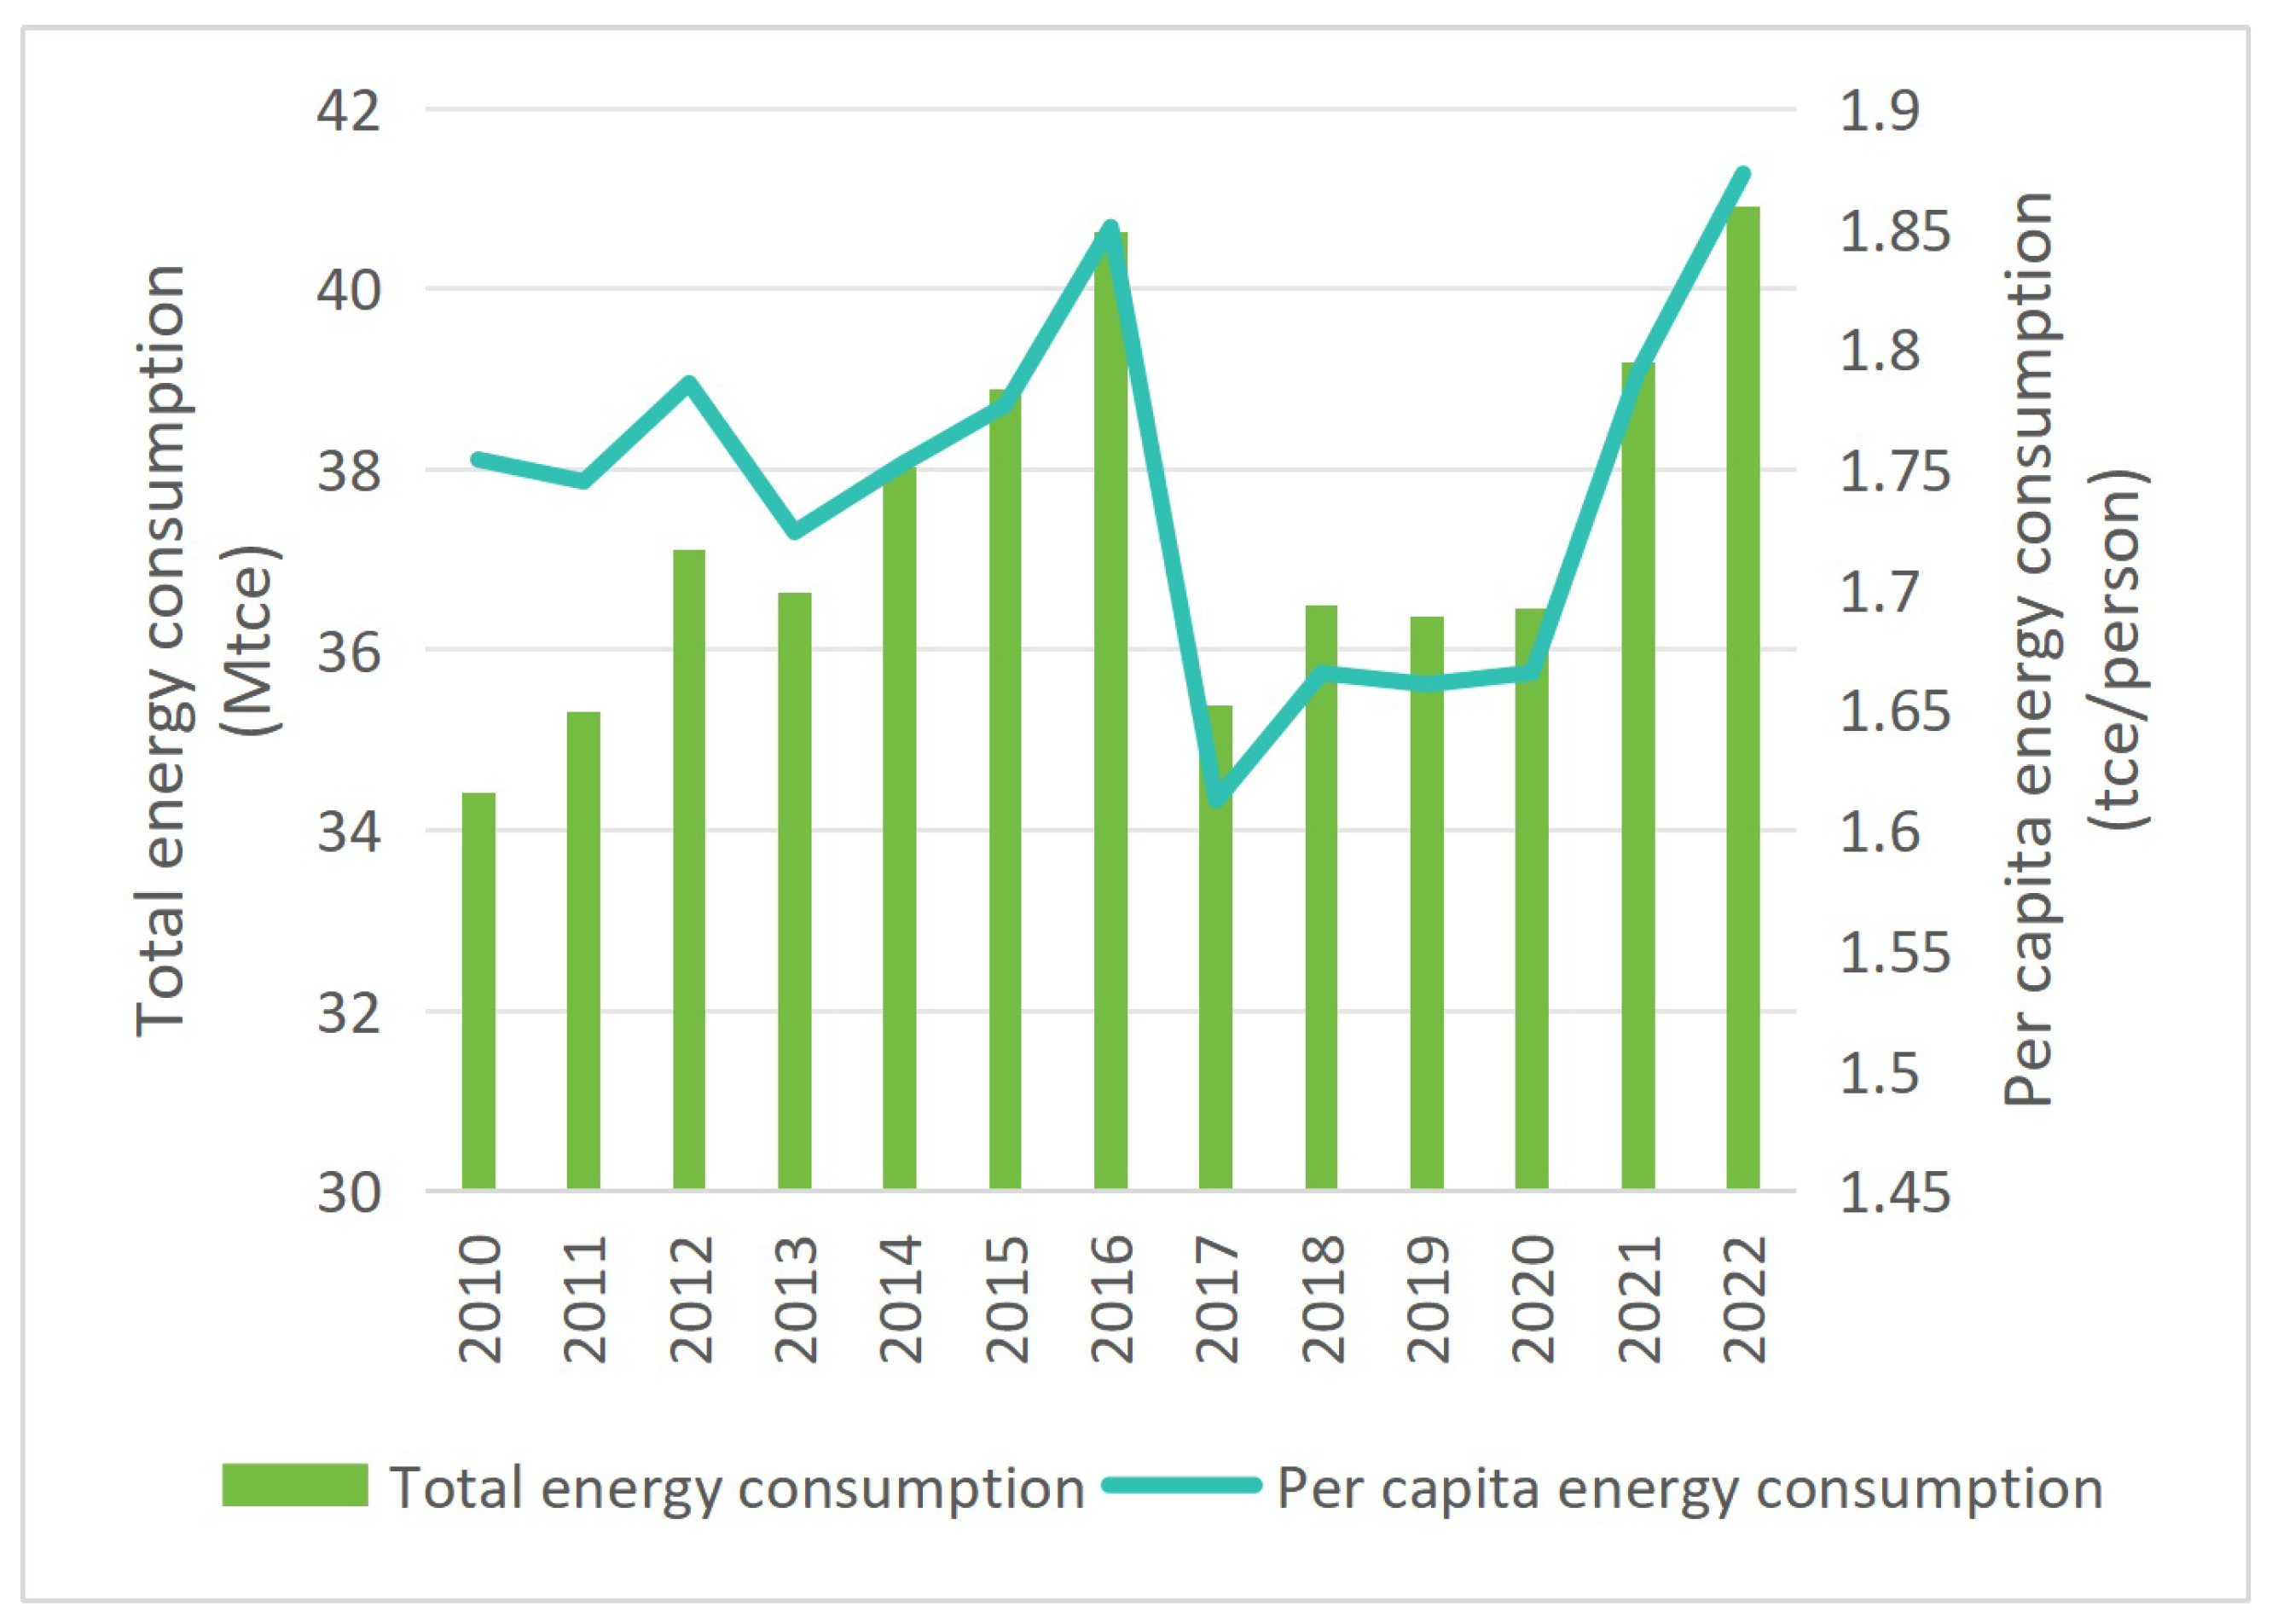
As one of the first pilot cities for carbon emissions trading in the country and a national-level pilot zone for green finance reform and innovation, Beijing possesses both a mature carbon market operating mechanism and a systematic foundation of green finance policy practices, making it a natural case study for researching the synergies between these two market-based instruments. Preliminary calculations from this study indicate that carbon emissions from the operation of civil buildings in Beijing account for over 25% of the city’s total carbon emissions [2]. Total emissions peaked around 2016, whilst total energy consumption entered a plateau phase in 2015, demonstrating a transition characterized by ‘carbon emissions falling first, followed by energy consumption stabilizing’ (see Figure 1 and Figure 2). This characteristic is the result of the combined effects of Beijing’s sustained efforts over many years to optimize its energy structure, implement carbon pricing mechanisms and innovate green financial instruments, and provide a solid empirical basis for the framework of the synergistic analysis of these two types of instruments developed in this paper.
In light of the aforementioned practical needs and research gaps, this paper focuses on the key issue of deep decarbonization during the operational phase of non-residential buildings. Taking Beijing as a representative case study, it systematically examines the synergistic driving mechanisms, quantifiable effects and implementation pathways of carbon pricing and green finance instruments in relation to building emissions reduction. The study addresses two key research questions: (1) How to construct a building energy system optimization model capable of incorporating policy parameters from both carbon pricing and green finance, thereby enabling the endogenous treatment of policy variables and the characterization of their interactive effects; (2) how to quantitatively evaluate the independent contributions and synergistic effects of two policy categories in Beijing’s building decarbonization efforts, thereby providing actionable decision-making support for policy combination design?

2. Research Methods and Model Development

2.1. A Framework for the Synergistic Driving Mechanism of Supply and Demand

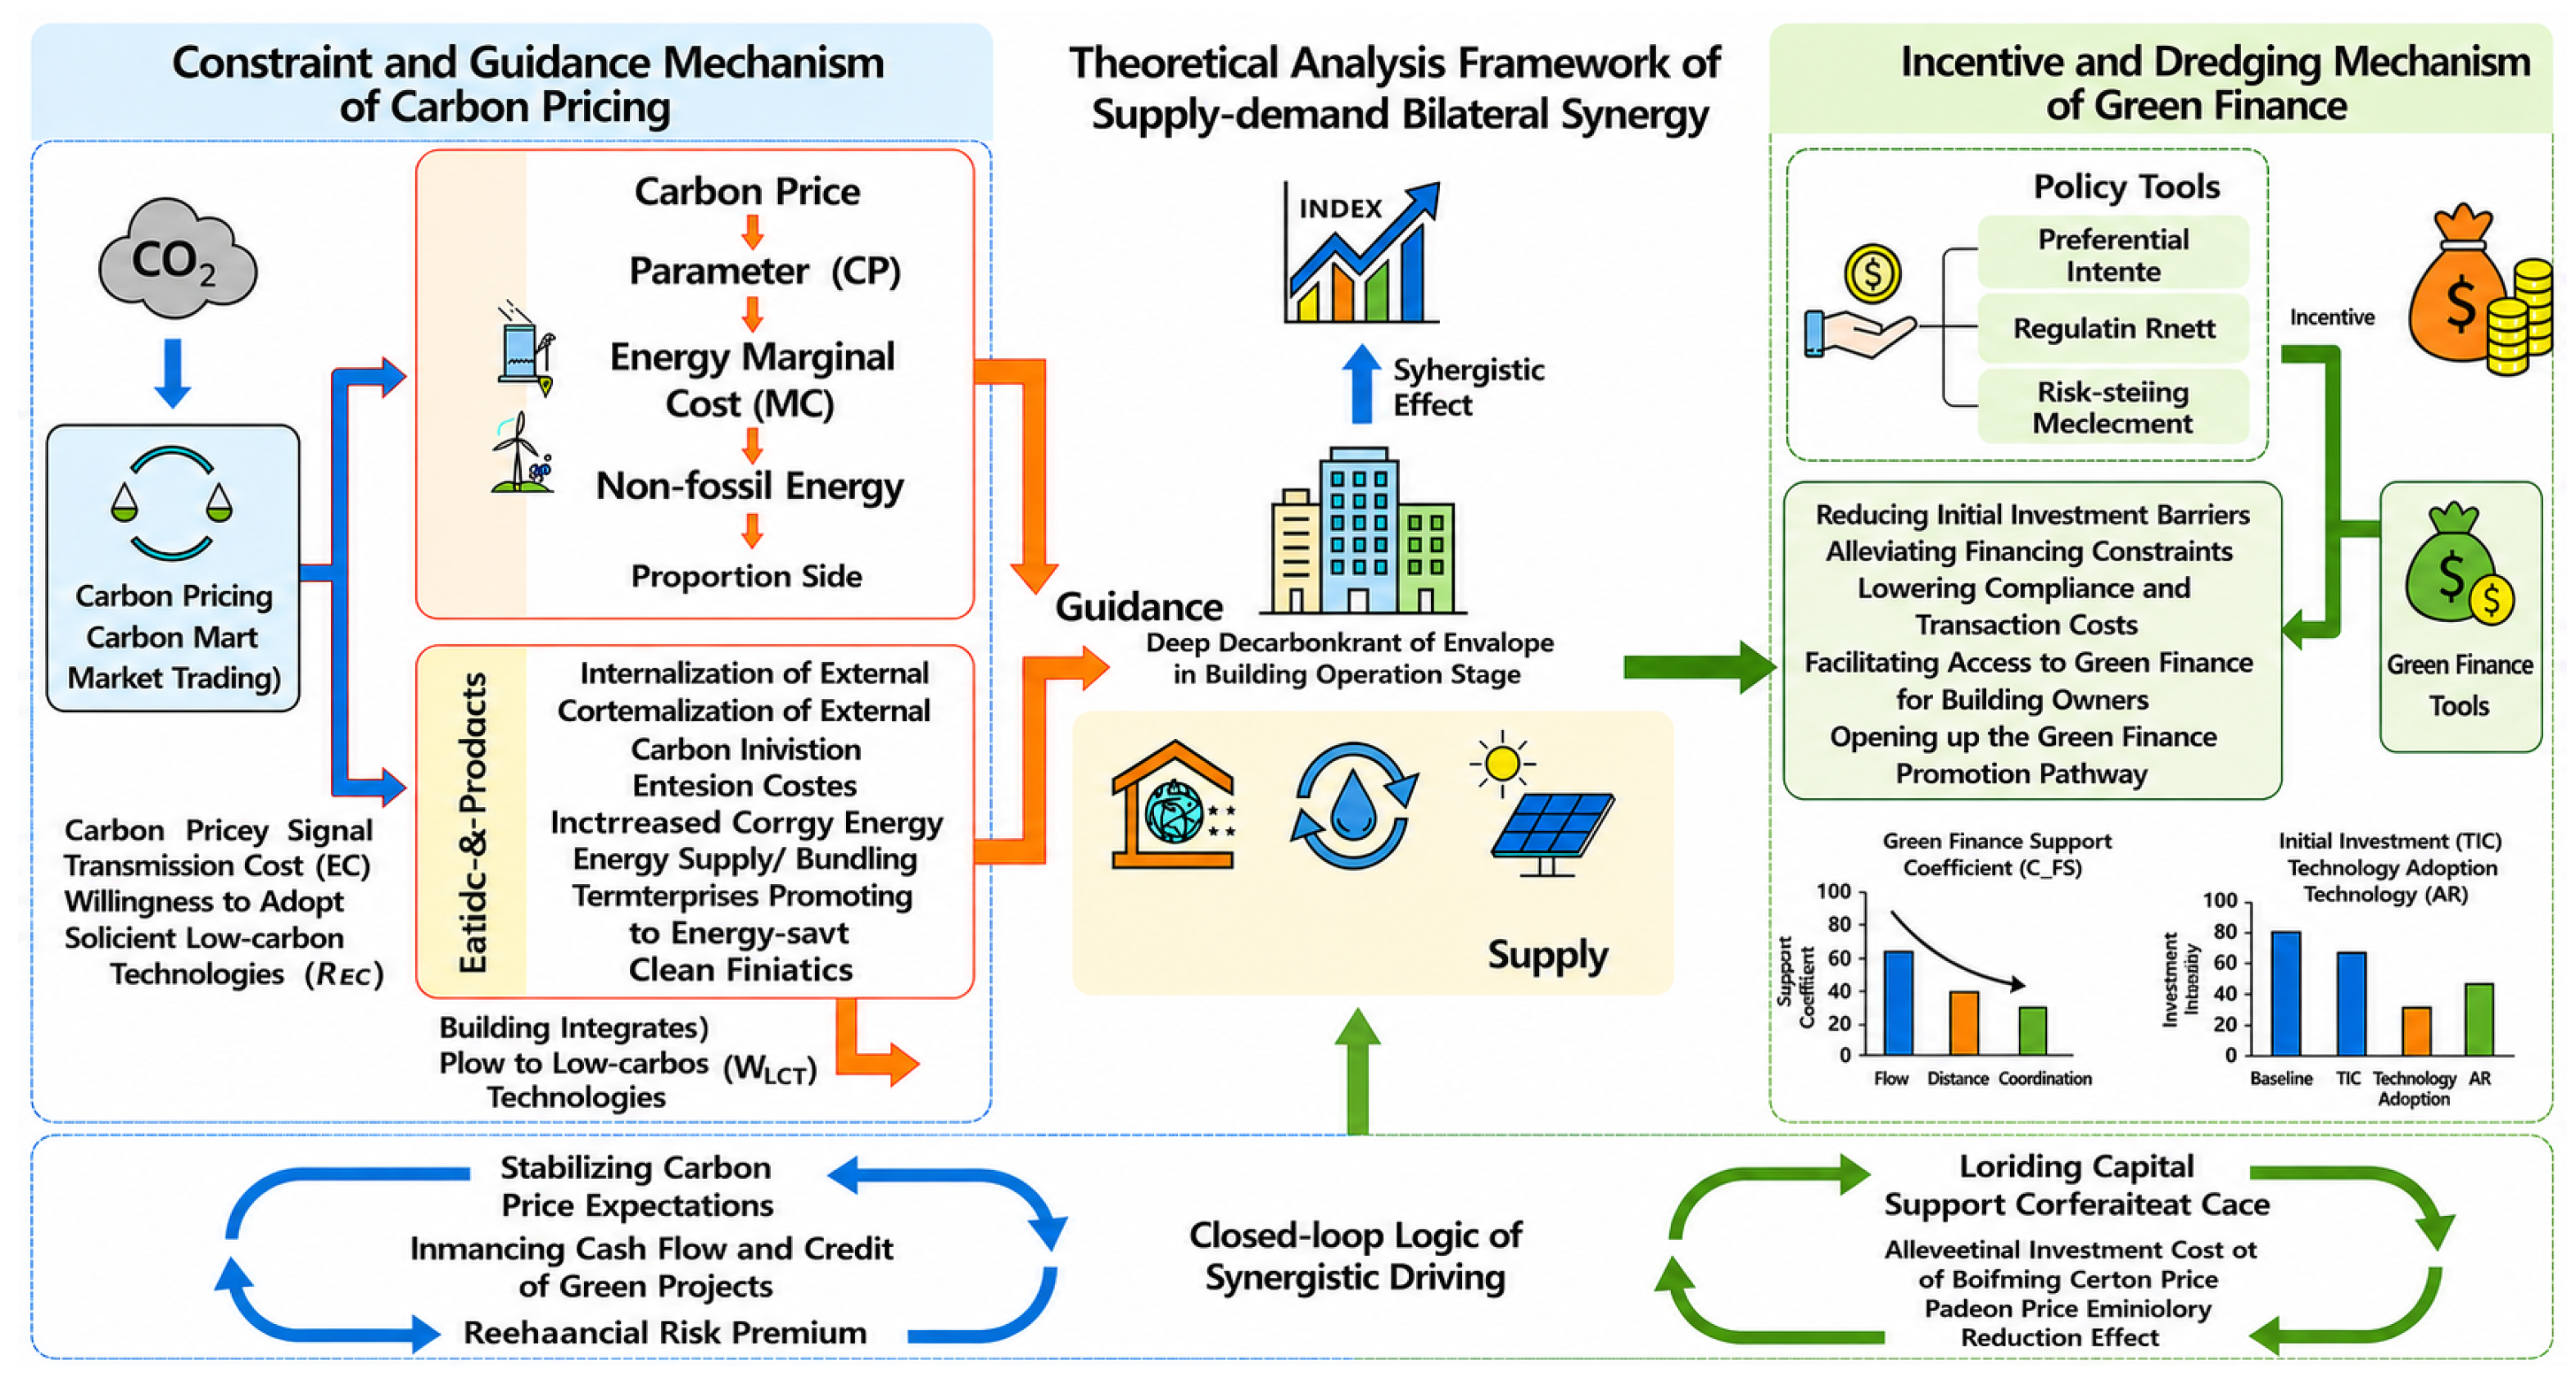
To accurately quantify the synergistic driving effects of carbon pricing and green finance using two market-based instruments on deep decarbonization during the building operation phase, this study constructs a theoretical analytical framework for supply–demand coordination. The core logic is illustrated in the conceptual diagram in Figure 3; all transmission pathways within the framework correspond to the endogenous parameters and variable settings of the subsequent model. The transmission pathways, intrinsic synergistic logic, and mapping relationships between the two types of instruments and the model variables are as follows.
(1) Constraints and incentive mechanisms of carbon pricing
The core principle of carbon pricing (with carbon market trading as its primary mechanism) lies in internalizing the external costs of carbon emissions [22] and correcting the price distortions associated with the use of fossil fuels in traditional market conditions. Supply-side transmission internalizes the external costs of carbon emissions from upstream electricity and heat generation—which are generated by building operations—as explicit financial costs for energy suppliers, through the establishment of a cap on total carbon emissions, an allocation mechanism for allowances, and market-based trading rules [23,24,25]. Carbon pricing directly increases the marginal supply costs of high-carbon energy sources such as coal-fired power and natural gas heating [26], prompting the power system to accelerate its transition towards non-fossil energy sources such as wind and solar power. This drives a year-on-year reduction in the grid’s carbon emission factor as the share of non-fossil energy installations rises, thereby directly reducing indirect carbon emissions from end-use electricity and heating in buildings. On the demand side, carbon pricing signals are transmitted to end-users via the energy price chain, directly linking building energy costs to carbon emission levels. This provides building owners with a clear value benchmark for decisions on technical upgrades and the optimization of energy consumption behavior, thereby guiding capital towards low-carbon technology pathways.
(2) Incentive and facilitation mechanisms in green finance
The core mechanism of green finance lies in overcoming the initial investment barriers to low-carbon technologies by optimizing financing costs [27], which corresponds to the endogenous adjustment of the investment cost parameters for low-carbon technologies in the model. The deep decarbonization of buildings depends on the large-scale adoption of technologies requiring high initial investment, such as improvements to the performance of building envelopes, the replacement of systems with high-efficiency heat pumps, and the integration of photovoltaics into buildings. Such technologies are generally characterized by long payback periods and low short-term returns, making them difficult to promote under traditional financing models [28]. Green finance effectively reduces the costs and barriers to adopting low-carbon technologies through measures such as preferential interest rates, the provision of long-term loans, and risk-sharing mechanisms [29]. By alleviating cost constraints for building owners on the demand side, it facilitates an effective response to carbon pricing signals by end-users [12], thereby preventing insufficient technology adoption caused by excessively high investment barriers.
(3) Synergy-driven logic
The synergy between carbon pricing and green finance essentially lies in the two-way reinforcement of ‘price signal guidance’ and ‘capital availability support’, corresponding to the interactive effects of the two types of policy parameters in the model. Stable carbon price expectations enable low-carbon retrofitting projects supported by green finance to generate predictable carbon asset returns (such as surplus allowance revenues and carbon credit trading income) [30], thereby optimizing project cash flows and creditworthiness, which in turn enhances the green finance support coefficient and reduces risk premiums. Low-cost, widely accessible green finance can effectively alleviate the capital constraints faced by end-users in responding to carbon price signals [31], thereby preventing ‘price signal failure’ caused by excessively high initial investment thresholds or a rapid rise in the marginal cost of emissions reduction, and amplifying the emissions reduction transmission effect of carbon pricing.
Together, they channel technological, financial and policy resources towards the path that offers the lowest marginal cost of emissions reduction across society as a whole [32], thereby overcoming the limitations of individual policy instruments and minimizing the total system-wide cost of emissions reduction under deep decarbonization targets.

2.2. Model Selection and Localization Extension

To achieve the objective of translating a theoretical framework into an assessment tool capable of quantification and simulation, this study selected and further developed the MESSAGEix-Buildings model. This model employs a bottom-up techno-economic optimization framework to determine optimal transition pathways by minimizing system costs; it is suitable for evaluating technology choices, energy consumption patterns and carbon emission trajectories under long-term policy scenarios [18,33]. This study has undertaken two key localization and mechanistic extensions to the MESSAGEix-Buildings model, with core modules comprising those listed in Table 1.

2.2.1. Model Module Settings

(1) Technical Activities and Capabilities Module
In this study, the energy technology module of the MESSAGEix-Buildings model, tailored to the context of residential buildings in Beijing, is configured as follows. The supply-side technology set covers the entire upstream supply chain for building energy consumption, encompassing two categories: primary energy (natural gas and emergency reserve oil) and secondary energy (electricity and heat). In line with the requirements set out in the ‘Beijing Energy Development Plan for the 14th Five-Year Plan Period’—namely, the elimination of coal use in non-emergency scenarios by 2025 and the achievement of a coal-free district heating system across the city by 2035—this study has comprehensively excluded coal-based supply pathways from the residential building scenario, retaining only a very small number of petroleum-based supply pathways for emergency backup in remote areas to reflect the actual energy consumption structure of residential buildings in Beijing.
The collection of end-use energy technologies was screened based on local policy constraints and the practical foundations for large-scale application (excluding coal-fired heating technologies that have been completely banned, and biomass heating technologies that are only at the pilot stage and have not been rolled out on a large scale), ultimately resulting in the inclusion of four core end-use energy technologies: gas heating systems, direct electric heating units, heat pumps, and electric refrigeration systems. The calculation formulas for the model’s investment cost ( I n v C o s t ), fixed cost ( F i x C o s t ) and variable cost ( V a r C o s t ) are as follows:
InvCost = i I InvCost i , t × CapNew i , t
FixCost = i I FixCost i , t × Cap i , t
In this context, I n v C o s t i , t and F i x C o s t i , t denote the initial investment cost, fixed operating and maintenance costs, and variable operating and maintenance costs of technology i in year t, respectively; C a p N e w i , t and C a p i , t represent the new installed capacity and the effective installed capacity of technology i in year t, respectively. The formula for calculating the effective installed capacity ( C a p i , t ) is as follows:
Cap i , t = τ t CapNew i , τ × Alive i , τ , t
Alive i , τ , t = 1 , if t τ < Life i 0 , otherwise
Here, C a p i , t represents the total effective installed capacity of technology i in year t; τ represents the year of construction for technology i; A l i v e i , τ , t represents the indicator variable for the operational status of the capacity from that batch in year t; L i f e i denotes the rated lifespan of technology i. If the time difference between the accounting year t and the year of construction τ is less than the rated lifespan of the technology, this indicates that the capacity from that batch is still within its service life; the indicator variable is set to 1, and the capacity is included in the calculation of the effective stock. If the time difference exceeds the rated lifespan, this indicates that the capacity from that batch has been decommissioned; the indicator variable is set to 0, and the capacity is no longer included in the effective stock.
This study did not include biomass heating technologies, primarily because the costs of storing and transporting biomass resources in Beijing are high and environmental regulations are stringent. Currently, such technologies are only at the pilot stage and have not yet established a foundation for large-scale application, which aligns with the realities of energy use in local buildings. Should renewable heating technologies such as biomass heating and solar thermal heating be rolled out on a large scale in the future, this would further diversify the supply of low-carbon technologies and reduce the system’s reliance on electricity and natural gas. Consequently, within the framework of coordinated policies, this would further enhance the depth of emissions reductions, lower end-use energy consumption and reduce overall system costs. However, the promotion of such technologies will not alter the core conclusion of the coordinated policy framework—namely, that ‘carbon pricing should be the primary driver, supplemented by green finance’—but will merely optimize the structure of the technology mix and reduce the marginal cost of emissions reductions. It will not lead to technological lock-in or a reversal of policy effects.
(2) Energy Demand Module
At the level of demand module design, this study defines the effective energy service demand Dc,t for building operations as two core proxy variables: heat demand (heat) and useful energy demand (useful energy, referred to as ‘useful’ in this paper) [18,33]. Here, ‘heat’ refers to the demand for heating services, whilst ‘useful’ encompasses energy consumption for cooling, domestic appliances and lighting. Taking 2020 as the base year, the baseline heat demand for building operations in Beijing D h e a t , 2020 is set at 2.4 EJ, and the baseline useful energy demand D u s e f u l , 2020 is set at 1.8 EJ. The formula for calculating D c , t is as follows:
D c , t = D c , 2020 × ( 1 + g pre ) t 2020 , t 2030 D c , 2020 × ( 1 + g pre ) 10 × ( 1 + g post ) t 2030 , t > 2030
In the equation, D c , t denotes the effective energy service demand for building operations associated with energy pathway c in year t, where c is either heat or useful; g pre and g post represent the growth rates of energy service demand before and after 2030, respectively. This study employs recursive modeling [34] based on growth trajectories of 1.0% and 0.6%, respectively, thereby deriving the annual demand levels for the entire study period. The growth rates set not only align perfectly with the scope of Beijing’s building energy statistics available for the project [14], but also avoid the methodological bias inherent in traditional modeling approaches that treat demand expansion as exponential growth without bounds, thereby ensuring the reasonableness of the demand limits.
The formula for calculating the annual total energy consumption ( E t ) is as follows:
E t = i I Act i , t = i I CF i , t × Cap i , t
In this context, E t represents the total end-use energy consumption of the residential sector in Beijing in year t; A c t i , t represents the actual activity level of technology i in year t; and C F i , t represents the capacity factor of technology i in year t, with values ranging from 0 to 1.
Unlike existing studies, which treat the demand module merely as an exogenous input sequence [18,33], the demand module in this study is a functional unit with interactive properties. In subsequent scenario simulations, it is necessary to incorporate the end-use demand response effects triggered by carbon pricing and green finance policies. Within the model, demand parameters serve both as a rigid right-hand boundary for the energy supply-demand balance constraint and as the core interface through which policy signals are transmitted to the building operations sector. Based on this design, the demand module serves a dual function: (1) utilizing localized statistical data to perform baseline calibration of the total service demand within Beijing’s building operations sector, thereby ensuring the regional applicability of the model’s fundamental parameters; and (2) without exceeding the physical service boundaries of end-use energy consumption, characterizing fluctuations in effective service demand resulting from factors such as adjustments in residential energy consumption behavior and energy-efficiency retrofits of existing buildings through the setting of demand scaling factors, thereby supporting the full-chain transmission of policy effects.
(3) Policy Mapping Module
This module represents the most significant methodological innovation in this paper. Designed to address the need for assessing the synergistic effects of multiple policies on civil buildings in Beijing, it introduces a key extension to the MESSAGEix-Buildings model by making policy effects endogenous. By embedding carbon pricing and green finance parameters into the model’s optimization process, this module enables the endogenous simulation of policy effects, thereby allowing for a dynamic depiction of the interactive transmission and non-linear synergistic mechanisms between these two types of policies.
The impact pathways of both carbon pricing and green finance policies ultimately feed into the model’s variable cost ( V a r C o s t ) calculation stage, as per the following formula:
VarCost t = i I VarCost i , t GF + VarCost i , t CP × Act i , t
VarCost i , t CP represents the variable cost per unit of activity for technology i in year t following the introduction of carbon market constraints. By incorporating carbon price signals into the variable costs of fossil fuel-based energy technologies, carbon market policies ensure that rising carbon prices directly increase the operating costs of such technologies—such as gas-fired boilers—thereby encouraging market participants to voluntarily switch to zero-carbon alternatives such as heat pumps. This approach avoids the rigid imposition of exogenous policy constraints and better aligns with the actual operational logic of the carbon market. The formulas for VarCost i , t CP are as follows:
VarCost i , t CP = VarCost i , t + p t CO 2 × φ i
p t CO 2 = p 0 1 + g p t 2020
In this context, V a r C o s t i , t represents the baseline variable cost of technology i in a scenario without carbon market; p t CO 2 × φ i represents the additional carbon cost incurred per unit of technical activity, p t CO 2 denotes the carbon price in year t; φ i denotes the direct CO2 emission intensity per unit of activity for the i-th type of end-use energy technology; p 0 denotes the baseline carbon price for 2020, set at 50 U S D / t C O 2 (to comply with international requirements under the CBAM and align with the IMF’s forward carbon price projections [35]); and g p is the compound annual growth rate of the carbon market trading price, set here at 2% [36,37].
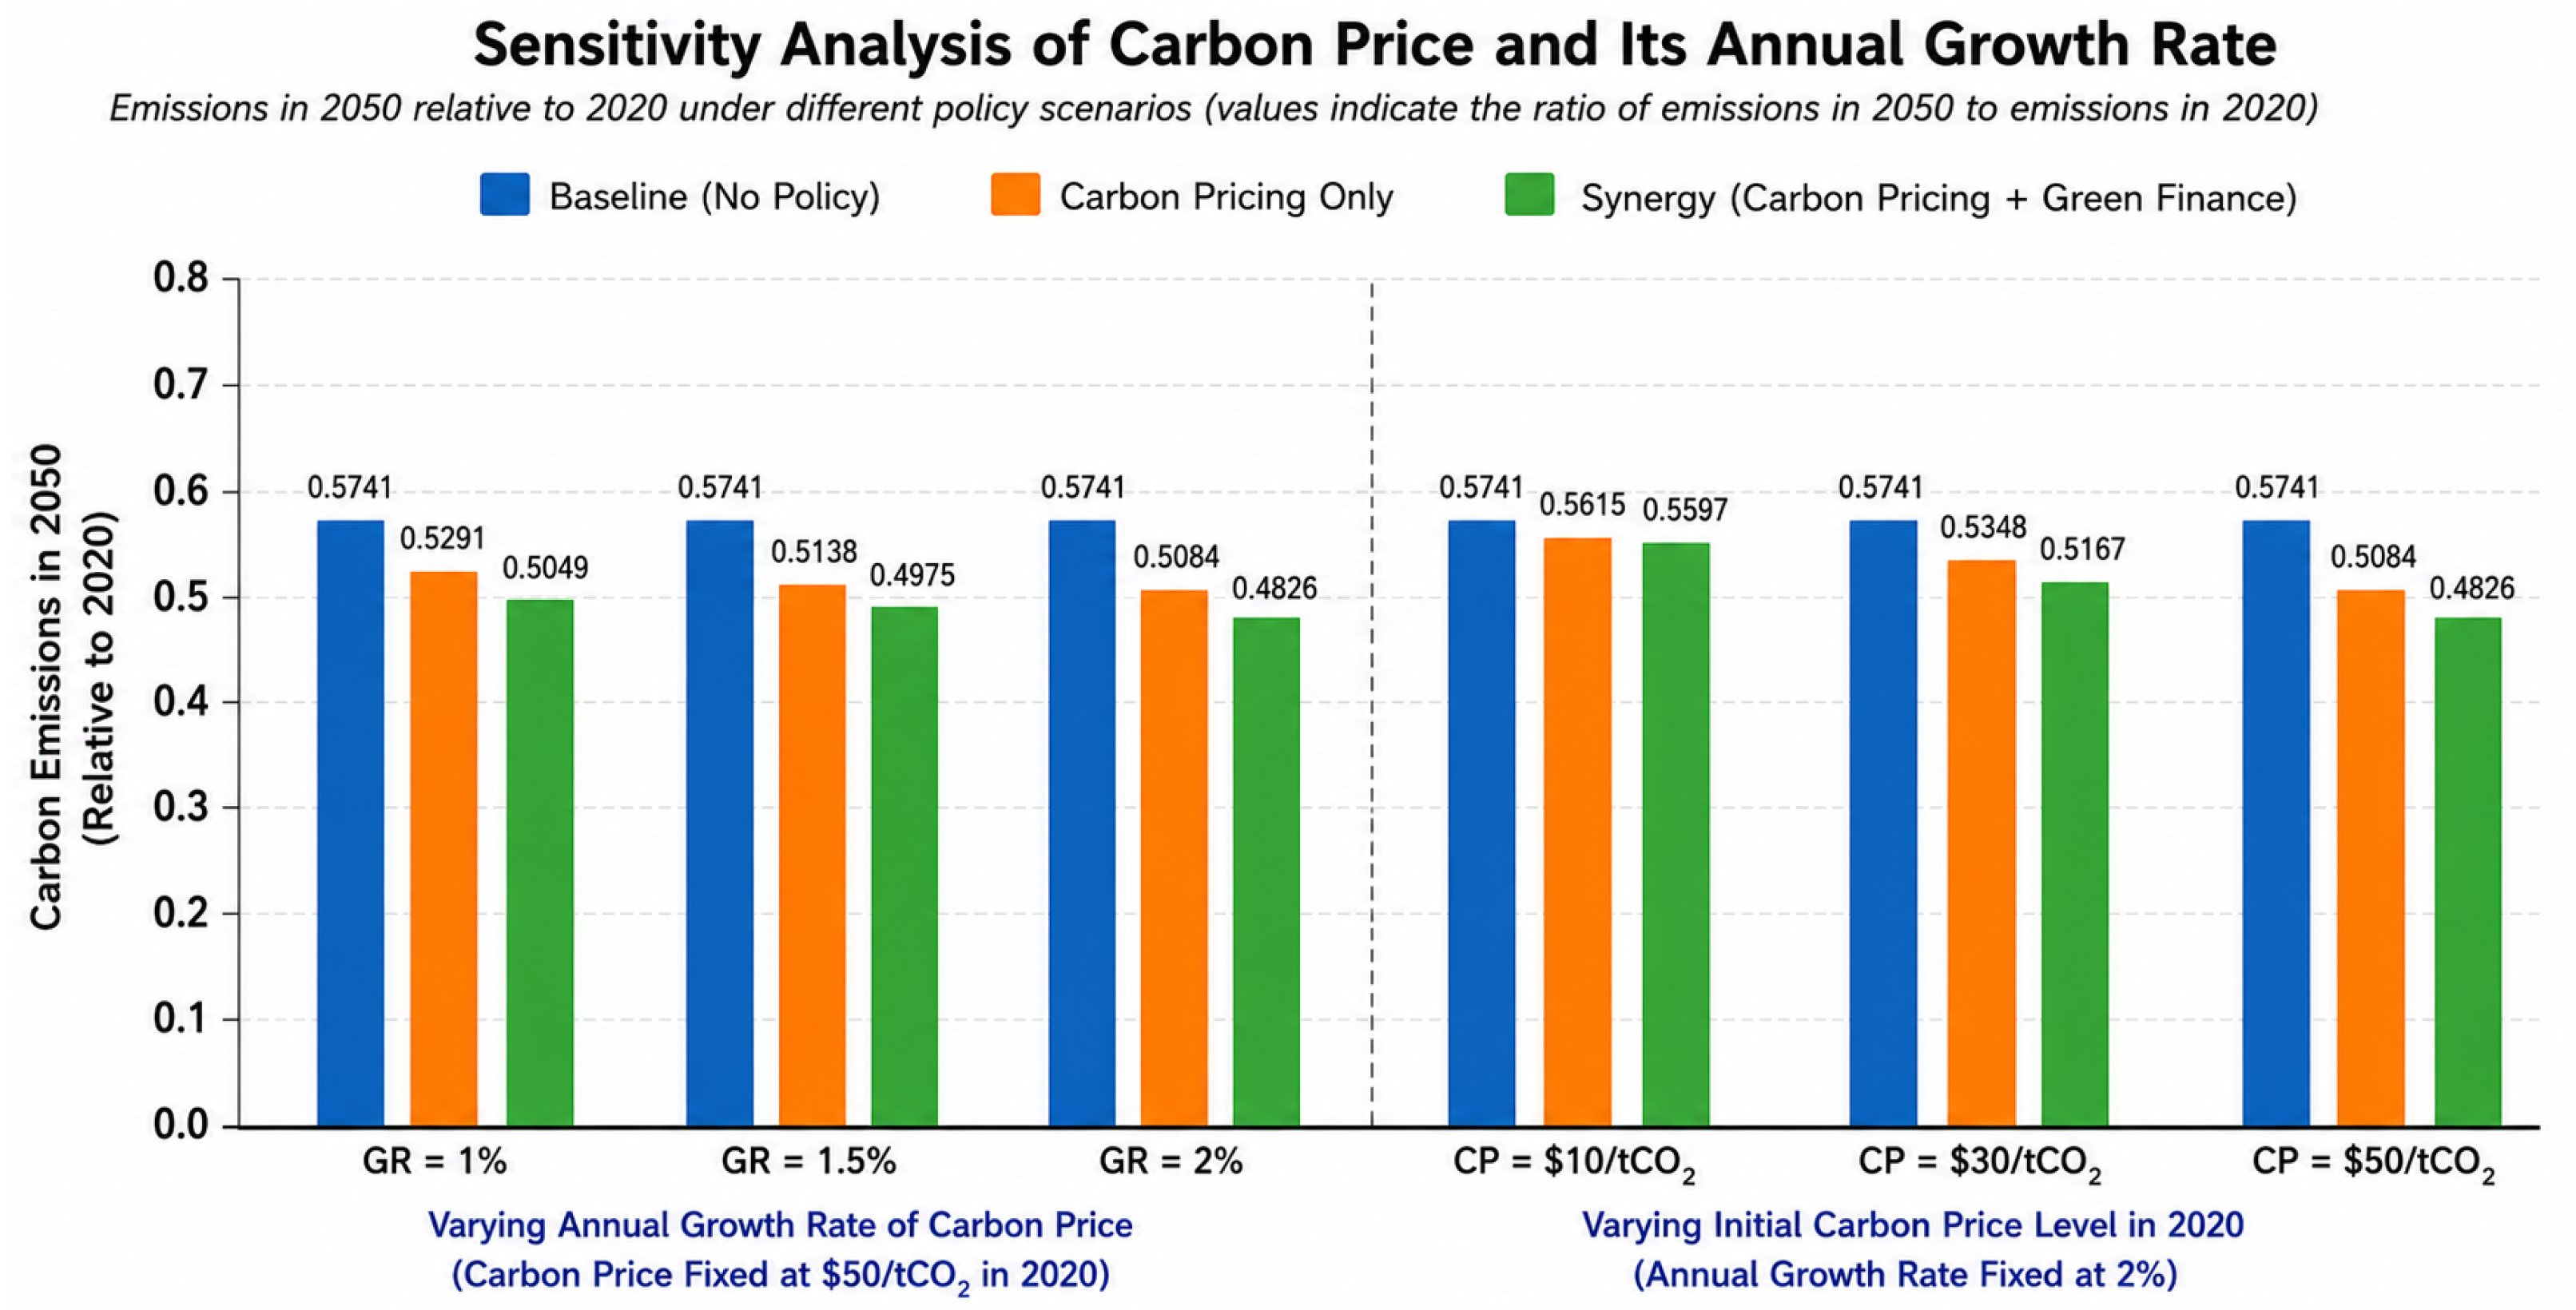
To evaluate the robustness of the selected carbon price trajectory, additional scenario analyses were conducted by considering annual carbon price growth rates of 1%, 1.5%, and 2%. The comparative results indicate that moderate variations in the carbon price growth rate do not alter the overall decarbonization pathway or the synergistic effects between carbon pricing and green finance. Therefore, the baseline value of 2% is retained in this study.
Green finance policies achieve modeling mapping through the calibration of two types of parameters: (1) preferential financing measures for clean technologies, such as low-interest loans and interest subsidies, which lower the initial investment threshold for clean technologies; (2) the application of a specific subsidy reduction factor to the variable costs of green building technologies. The formula for calculating variable costs ( V a r C o s t i , t ) after incorporating green finance policy constraints is as follows:
VarCost i , t GF = 1 δ i GF × VarCost i , t
Here, VarCost i , t GF represents the variable cost per unit of activity for technology i in year t, after incorporating green finance constraints; δ i GF represents the discount factor for the operational cost subsidy for clean technology i; in this paper, it is set at 12%, whilst δ i GF for fossil fuel technologies is fixed at 0. To ensure the empirical validity of the model, the subsidy discount factor is not arbitrarily determined but is calibrated based on the intensity of green finance support in Beijing, encompassing interest subsidies, preferential loans, and fiscal incentives for energy-saving technologies. This parameter does not represent a single policy instrument, but rather comprehensively reflects the role of multiple financial mechanisms in reducing the effective operating costs of low-carbon technologies. This study focuses on the structural interaction between carbon pricing and green finance under typical policy intensities; therefore, this coefficient is set to a benchmark value to ensure internal consistency across scenarios.
(4) Carbon Emissions Calculation
Following the optimization of technology selection and activity volume modeling under multiple policy constraints, carbon emissions are calculated separately for each type of end-use energy technology. This approach is fully aligned with the model’s technical modules and energy consumption accounting framework, thereby effectively avoiding the discrepancies that arise from a uniform calculation of total energy consumption. As a core output variable for assessing the effectiveness of carbon market and green finance policies in reducing emissions, as well as for calculating the marginal cost of emission reductions, the formula is as follows:
EM t = i I EF i × E t
In this context, E M t represents the total CO2 emissions in year t, with the scope of calculation covering emissions from the combustion of end-use energy, as well as emissions from the upstream production of electricity and heat; E F i represents the carbon emission factor per unit of activity for technology category i, with values taken from the 2020 carbon emission factors for oil, natural gas, electricity and heat in Beijing.
This formula enables a technical breakdown of emission contributions, allowing for the identification of key emission-reduction technologies at different stages. It also facilitates the quantification, through scenario comparisons, of the respective emission-reduction contributions and synergistic effects of carbon market and green finance policies, thereby providing quantitative support for adjusting the intensity of Beijing’s phased clean heating policies.
(5) Model Objective Function
The core objective of this model is to minimize the cumulative total system cost over the entire study period from 2020 to 2050. The total cost encompasses four categories: investment costs, fixed costs, variable operating costs, and carbon emission costs. Taking into account the scaling of policy effects described earlier, the incorporation of green finance subsidies within the cost adjustment module, and the moderating effect of carbon price fluctuations [38]. The specific expression of the model’s objective function is as follows:
min Z = t T 1 + r t ( t t 0 ) × InvCost t + FixCost t + VarCost t + EmiCost t
EmiCost t = p t CO 2 × EM t
In the equation, Z represents the total discounted cost of the system, comprising investment costs, fixed costs, variable costs and carbon costs; p t CO 2 represents the carbon price in year t; E M t represents carbon emissions in year t; and r t represents the discount rate in year t. The formula for calculating the discount rate r t GF under the influence of green finance policies is:
r t GF = max r 0 1 θ GF , r min
In this context, r 0 represents the market-based benchmark discount rate in the absence of policy intervention; in this study, the benchmark value is set at 5%. θ GF denotes the green finance interest subsidy ratio, with a range of [0, 1].
(6) Marginal Abatement Cost
Based on the cumulative system investment costs and cumulative carbon emission reductions under each scenario relative to the baseline scenario by 2050, this paper calculates the societal marginal abatement cost (MAC) under different policy combinations using the following formula:
M A C = EmiCost scenario EmiCost baseline EM scenario EM baseline
In Equation (15), M A C represents the marginal abatement-cost of carbon reduction. EmiCost scenario and EmiCost baseline denote the cumulative social-system investment-cost from 2020 to 2050 under the policy-implementation scenario and baseline scenario, respectively. EM scenario and EM baseline stand for total CO2 emissions in 2050 under the policy scenario and baseline scenario. The numerator calculates the difference in full-cycle system-cost between the policy scenario and baseline scenario, and the denominator is the amount of reduced carbon-emissions brought by policy implementation. Consequently, M A C quantifies the change in social-system cost for each additional unit of CO2 emission reduction. A negative value of M A C means that carbon-abatement activities reduce the overall system-wide cost.

2.2.2. Summary of the Model Extension

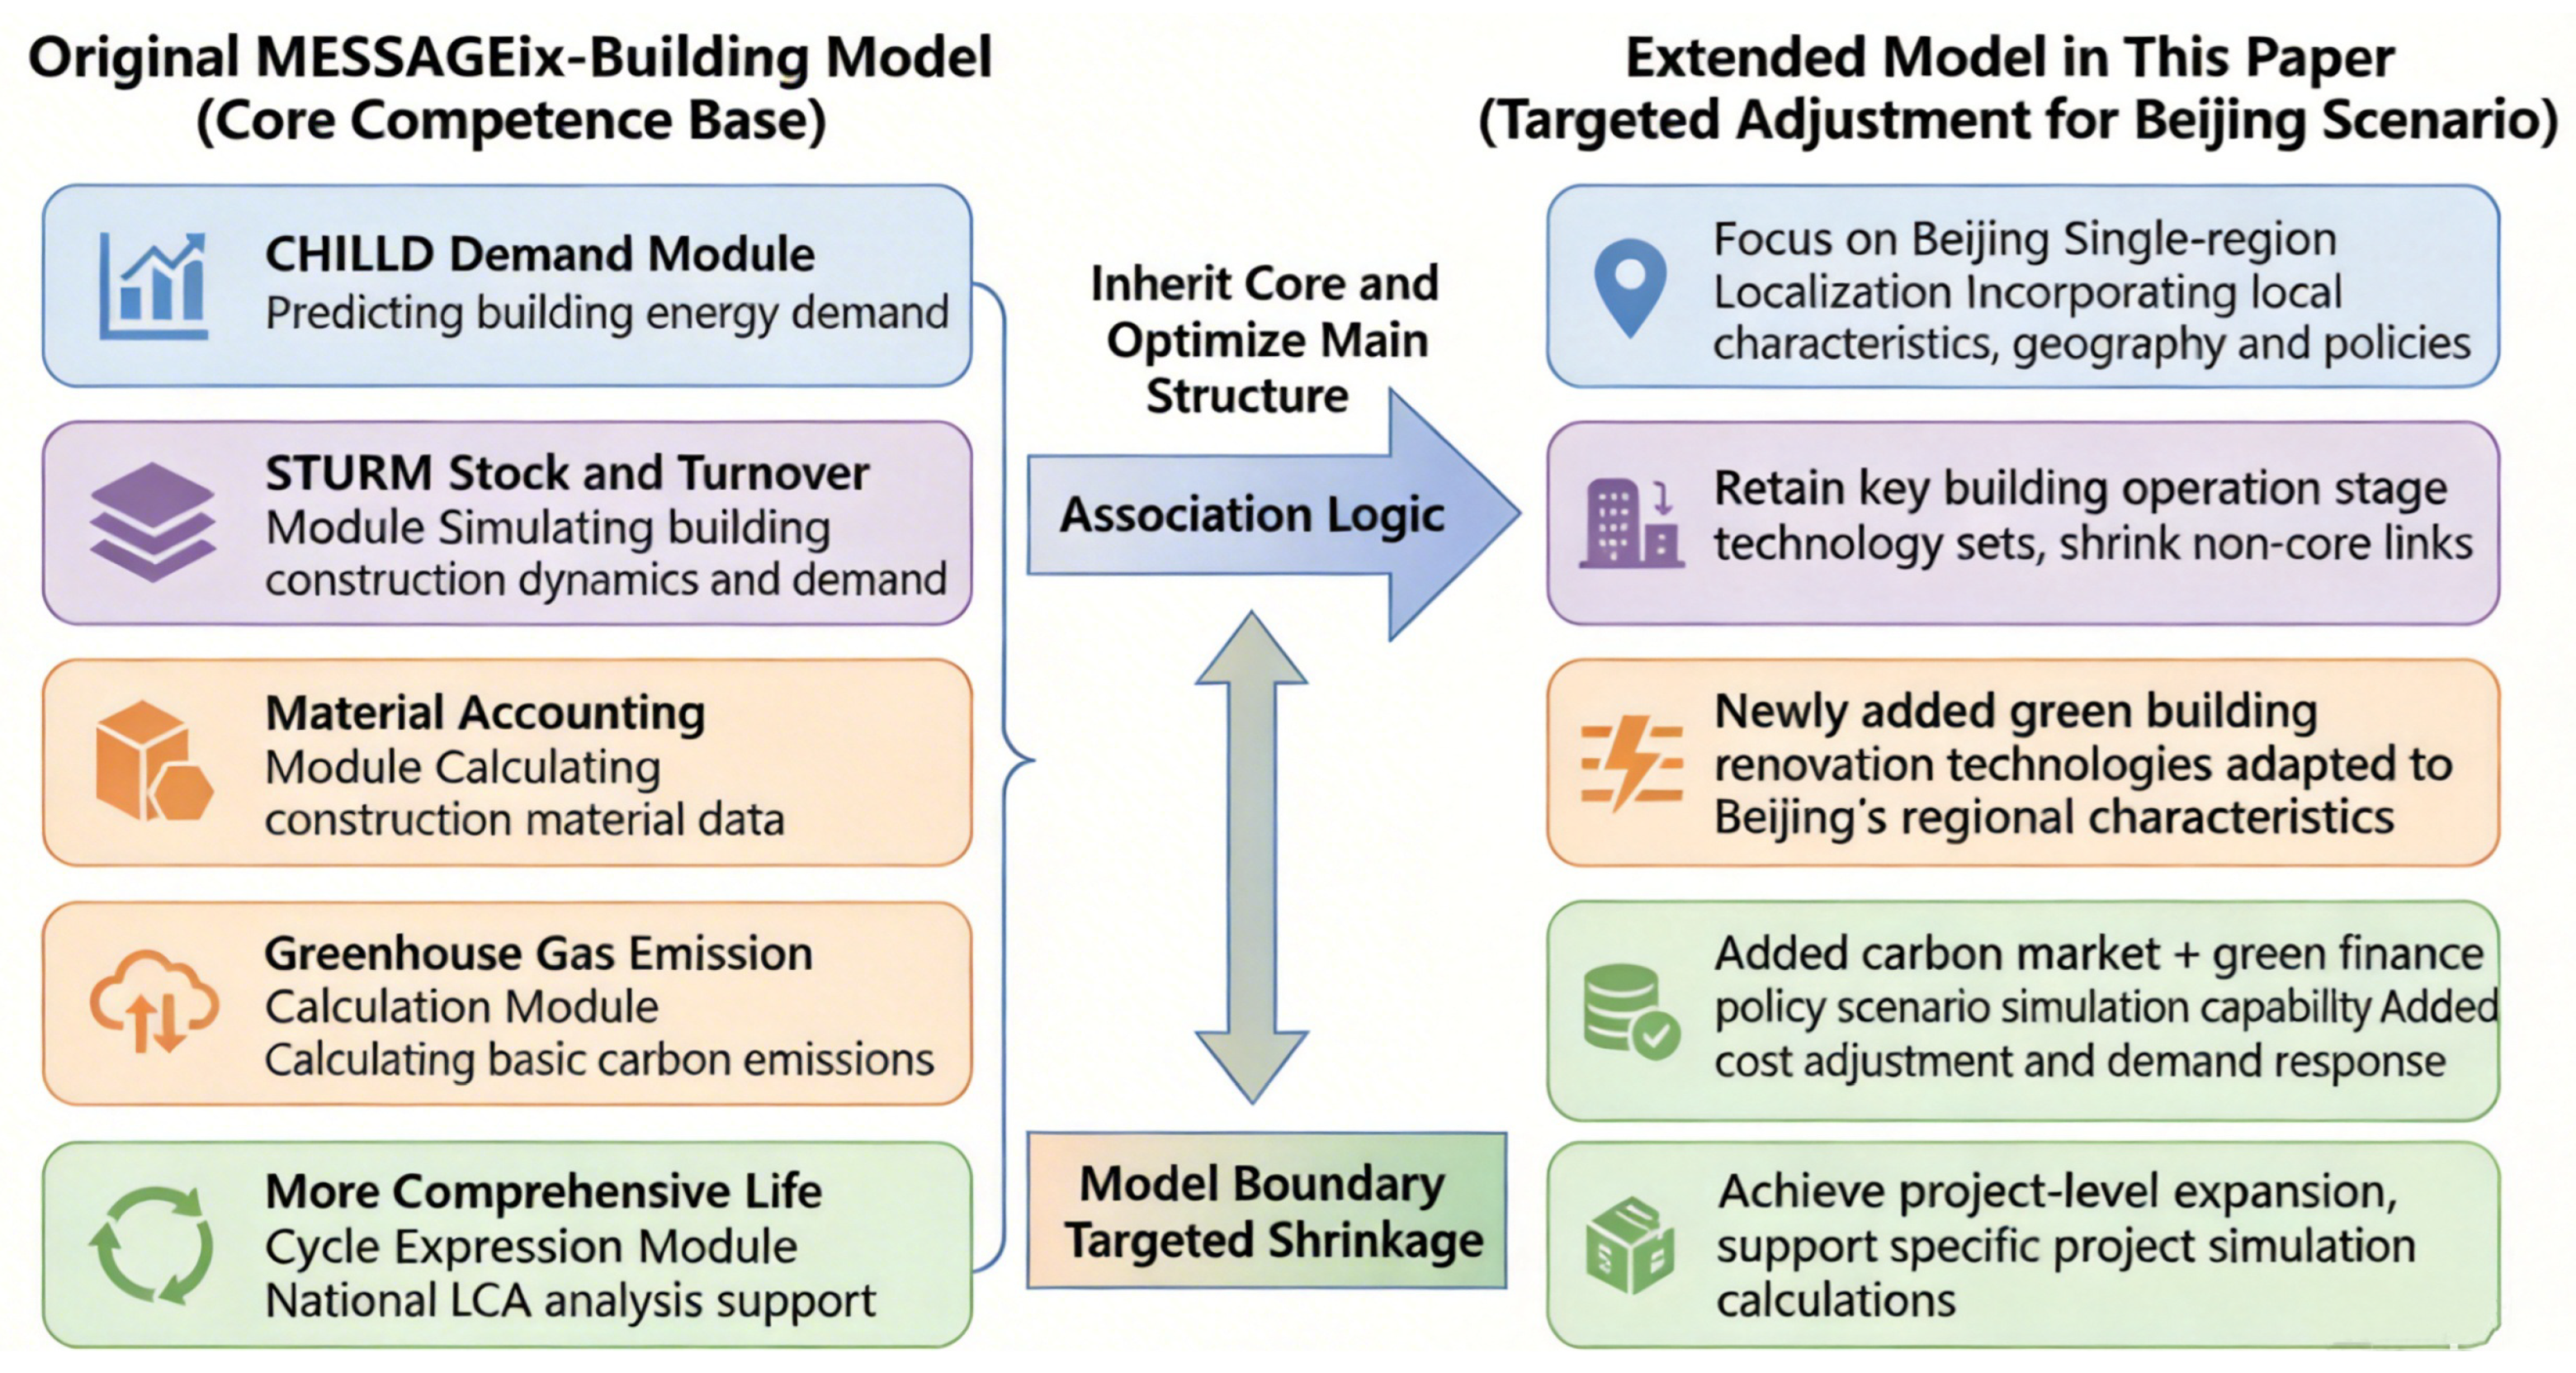
This paper employs a localized extension model constructed using project code based on the MESSAGEix-Buildings framework, rather than replicating the modules from the original literature. The original model establishes a framework for the entire building life cycle [33]; this paper draws upon its core structure, focusing on the building operation phase, and incorporates Beijing’s power supply structure as well as the synergy mechanisms between green finance and the carbon market, thereby addressing the research questions and aligning with existing, stable code modules. From the perspective of module configuration, the original MESSAGEix-Buildings model provides a more comprehensive characterization of building stock and renovation, with modules such as CHILLD and STURM serving as its theoretical origins and the literature basis for this paper. However, in the current project code, only the components centred on the MESSAGEix optimization framework and comprising a suite of technologies for the building operation phase have been utilized.
This paper explores the extended model as follows: (1) the spatial focus is narrowed to Beijing, as the synergies between the carbon market and green finance must first be identified in a sample city before being generalized; extending the analysis to multiple regions at the outset risks obscuring the mechanisms underlying policy effects. (2) The complex STURM stock-flow module has been simplified. Drawing on local building retrofitting practices in Beijing, boundary constraints have been set for technology retirement rates, and the scope of the study has been limited to the building operation phase. The policy variables in the current project are directly linked to operational energy consumption and emissions; the research focuses on identifying policy synergies during the operational phase, rather than reconstructing a full life-cycle accounting system. (3) The carbon market and green finance are incorporated into the objective function and the parameter updating process. Although the original framework accommodates price and technology constraints, this study integrates measures such as emissions taxes into a synergistic policy module and introduces a policy endogenization module. Carbon prices and the intensity of green finance support are treated as core optimization variables rather than exogenous parameters. This approach integrates the core themes into the main body of the model, rather than confining them to the level of scenario description. The aforementioned policy endogenization constitutes a significant methodological contribution of this paper, substantially enhancing the dynamism and credibility of policy evaluation, as shown in Figure 4.

2.3. Scenario Design

To compare the driving effects of different policy instruments, this study has established four core scenarios that are strictly comparable (see Table 2). All scenarios are based on the same end-use energy demand and share the same technology database and underlying economic parameters, thereby ensuring that any differences in the results are entirely attributable to variations in the policy variables. This chapter will discuss the scenario design under three headings: the carbon trading market mechanism, the green finance mechanism, and the synergy between the two.
There are three core principles of scenario design. (1) Policy variables must correspond to actual policy instruments and must not deviate from the practical operational logic of China’s carbon market and green finance systems; (2) parameter changes must exhibit a progressive temporal nature to reflect the dynamic cumulative effects of policy intensity; (3) all scenarios must be consistent with the technical conditions prevailing during the operational phase of Beijing’s buildings; that is, policies cannot alter the laws of physics, but can only influence technological choices and energy allocation outcomes through costs, constraints and structural boundaries. On this basis, this chapter will discuss scenario design by dividing it into three parts: the carbon trading market mechanism, the green finance mechanism, and the synergy between the two.

2.4. Data Sources and Parameter Calibration

The local calibration of model parameters is a key factor in ensuring the reliability of quantitative assessment results. The core input parameters for this study are derived partly from publicly available or accessible local datasets, government planning documents and published academic research; the remainder consists of harmonized engineering parameters required for scenario comparisons, thereby ensuring that the model is grounded in a solid empirical foundation (see Table 3).
Base-year energy consumption and carbon emission data: The base-year (2020) energy consumption data by category for the operational phase of civil buildings in Beijing was derived by integrating the city’s energy balance sheets from the “Beijing Statistical Yearbook” [14] and the “China Energy Statistical Yearbook” [39], and calculating them using a top-down decomposition method [2]. The corresponding carbon emission factors for electricity and heat were derived using Beijing’s localized factors for 2020 (for example, Beijing’s electricity emission factor for 2020 was 0.583 kg CO2/kWh).
Technical and economic parameters: These include the investment costs, operating and maintenance costs, efficiency parameters and service life of low-carbon technologies. The data is primarily sourced from the “2025 Beijing Municipal Green Building Development Incentive Fund Demonstration Projects (Energy-saving and Green Retrofits of Public Buildings)” [40] the “Technical Specifications for the Construction of Energy-Saving Projects in Ultra-Low Energy Consumption Residential Buildings (DB11/T 1971-2022)” [41], and research by scholars such as Zhou and Zhu [42,43].
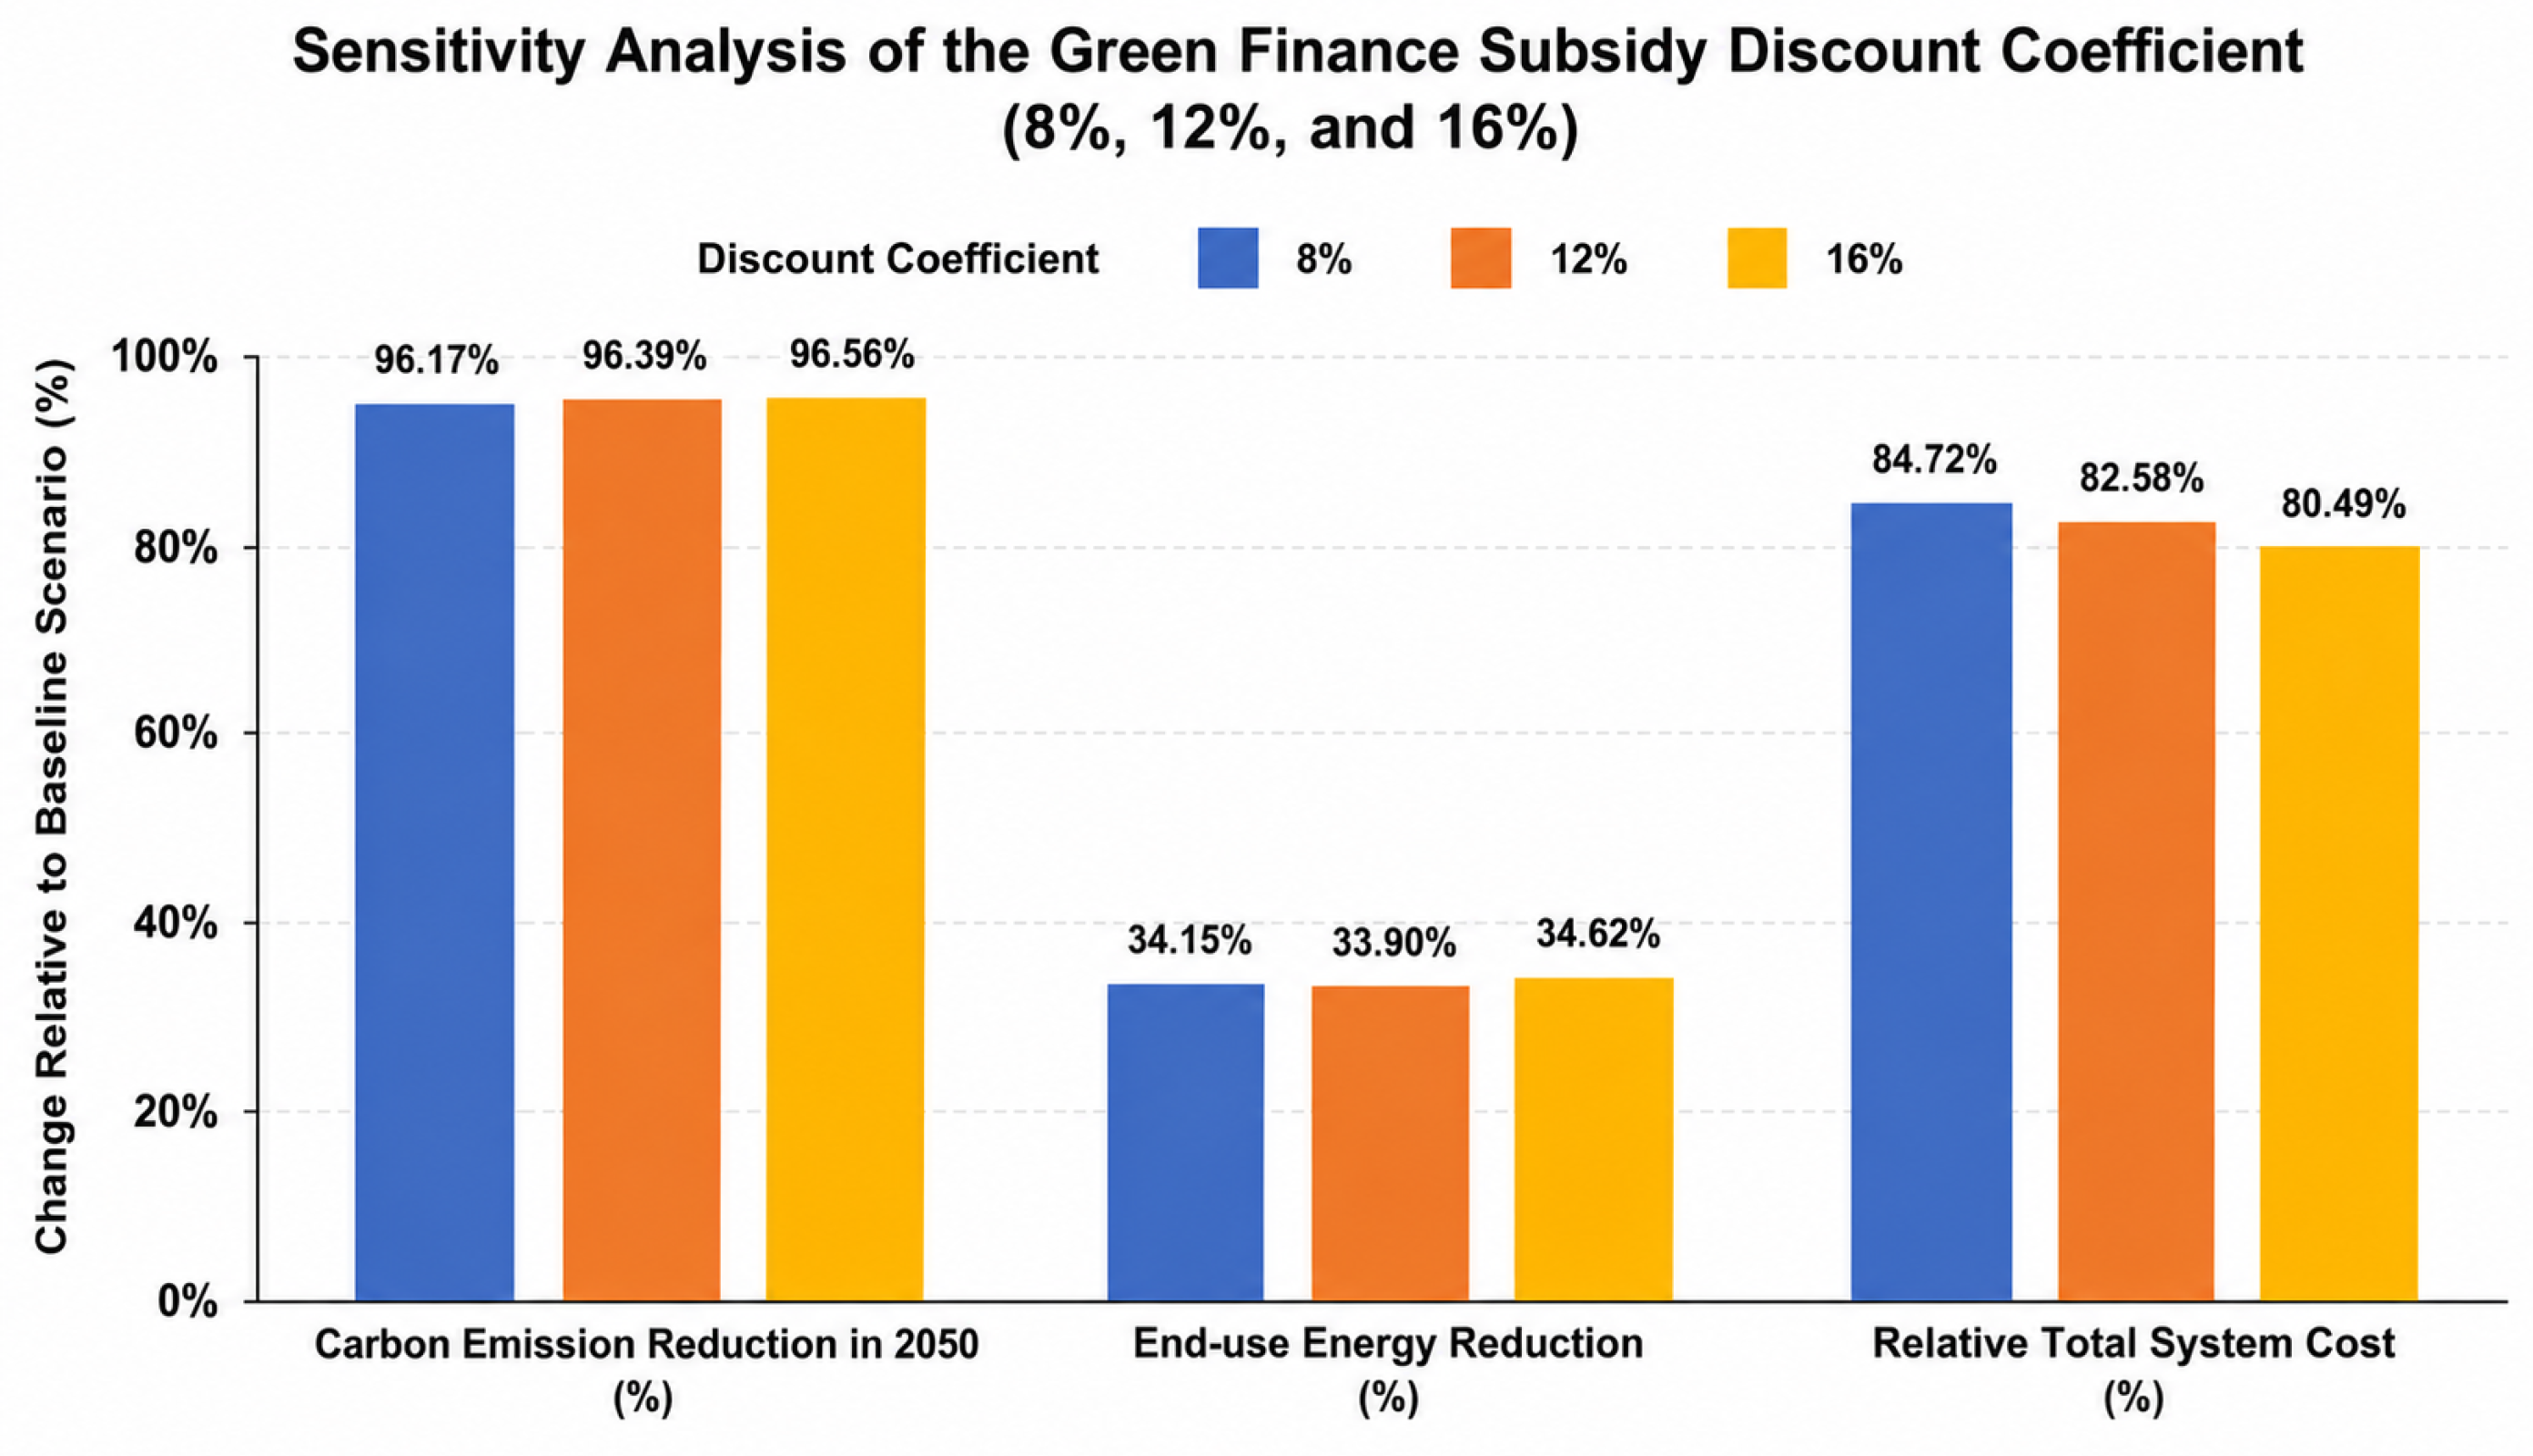
Policy parameters: The carbon price trajectory is set by taking into account both current market conditions and the requirements of long-term scenario simulations. The carbon price adopted in this study represents the equivalent value of long-term policy intensity; it is not a direct replication of spot market transaction prices. Its core objective is to support continuous policy simulation experiments covering the entire 2020–2050 period, thereby avoiding interference from short-term price fluctuations on the conclusions drawn from the long-term trajectory. Combined with the existing subsidy data for energy-saving retrofits of existing buildings in Beijing and relevant literature [44], the operational-subsidy reduction coefficient of green finance is set as 12%. This parameter comprehensively reflects the overall incentive effect of diversified green-financial instruments on the operational stage of low-carbon technologies, which is consistent with the engineering-oriented modeling logic of the MESSAGE-ix-Buildings model. To evaluate the robustness of the selected subsidy discount coefficient, a sensitivity analysis (see Figure 5) was conducted by assigning three representative values (8%, 12%, and 16%) to δ i GF . The results indicate that varying the discount coefficient within this range causes only minor changes in the simulation outputs. Specifically, the carbon emission reduction rate in 2050 varies by only 0.39 percentage points, the end-use energy reduction varies by less than 0.8 percentage points, and the relative total system cost remains within a 4.3% variation range. These findings indicate that moderate variations in the subsidy discount coefficient do not affect the overall policy effectiveness or the synergistic mechanism between carbon pricing and green finance, thereby confirming the robustness of the selected baseline parameter (12%). This section constitutes a scenario-based mapping of policy effects within the model and does not correspond directly to the specific provisions of individual policies.
To further evaluate the robustness of the selected carbon price pathway, sensitivity analyses were performed by considering different initial carbon price levels ($10, $30, and $50/tCO2) together with annual carbon price growth rates of 1%, 1.5%, and 2%. The corresponding results are presented in Figure 6.

2.5. Multi-Objective Performance Evaluation

To avoid over-reliance on a single indicator, this study conducts a comparative analysis of the four scenarios across three dimensions: emission reduction performance, energy consumption constraints and investment efficiency [45]. The evaluation formula is as follows:
S = k w k Score k + ε n l
Here, S represents the composite performance score, with a range of 0 to 100; w k denotes the weight corresponding to the kth dimension—in this study, equal weights are assigned, with each dimension weighted at 1/3 to avoid the interference of subjective preferences on the evaluation results; S c o r e k represents the standardized score for the kth dimension; and ε n l is the tanh-type non-linear correction term.
First, the Min–Max standardization method is applied [46] to uniformly map the raw indicators of each dimension to the 0–100 range, thereby eliminating differences in units of measurement between indicators:
Score k = X k X k , min X k , max X k , min × 100
Here, x k represents the raw indicator value for the kth dimension of a given scenario, whilst X k , min and X k , max denote the minimum and maximum raw values for that dimension across the four scenarios, respectively.
Next, the standardized component scores are linearly weighted and coupled. To prevent scores in the middle range from becoming overly concentrated, which would result in insufficient discrimination between scenarios, a slight tanh-type non-linear correction term is introduced to adjust the score distribution [47,48]:
ε n l = α · tanh β · k w k Score k 100 0.5
Here, α is the correction amplitude coefficient (set to 5 in this study) and β is the non-linearity intensity coefficient (set to 2 in this study). This function is a bounded smooth non-linear function with an output range of [−1, 1], which does not disrupt the range of standardized scores from 0 to 100, thereby ensuring the interpretability of the results. The hyperbolic tangent function (tanh) reaches its maximum slope near 0.5, effectively enhancing the discriminatory power for scores in the middle range and resolving the issue of scores becoming concentrated and difficult to distinguish after weighting; at the extremes of 0 and 1, the slope gradually flattens, preventing the exaggeration of differences in extreme scenarios and ensuring the robustness of the evaluation. This correction constitutes an unbiased, dimensionless and non-distorting adjustment and is a commonly used method for improving discriminatory power in multi-objective decision-making.
The hyperbolic tangent (tanh) correction is used solely to optimize the distribution of scores and enhance the distinguishability of the scenarios; it does not alter the relative ranking of the four scenarios. The order of the collaborative scenario, the carbon market scenario, the green finance scenario and the baseline scenario remains exactly the same before and after the correction, indicating that the conclusions are highly robust. This adjustment serves only to improve the readability of the results and does not affect the core conclusions of the policy comparison.

3. Analysis of Results

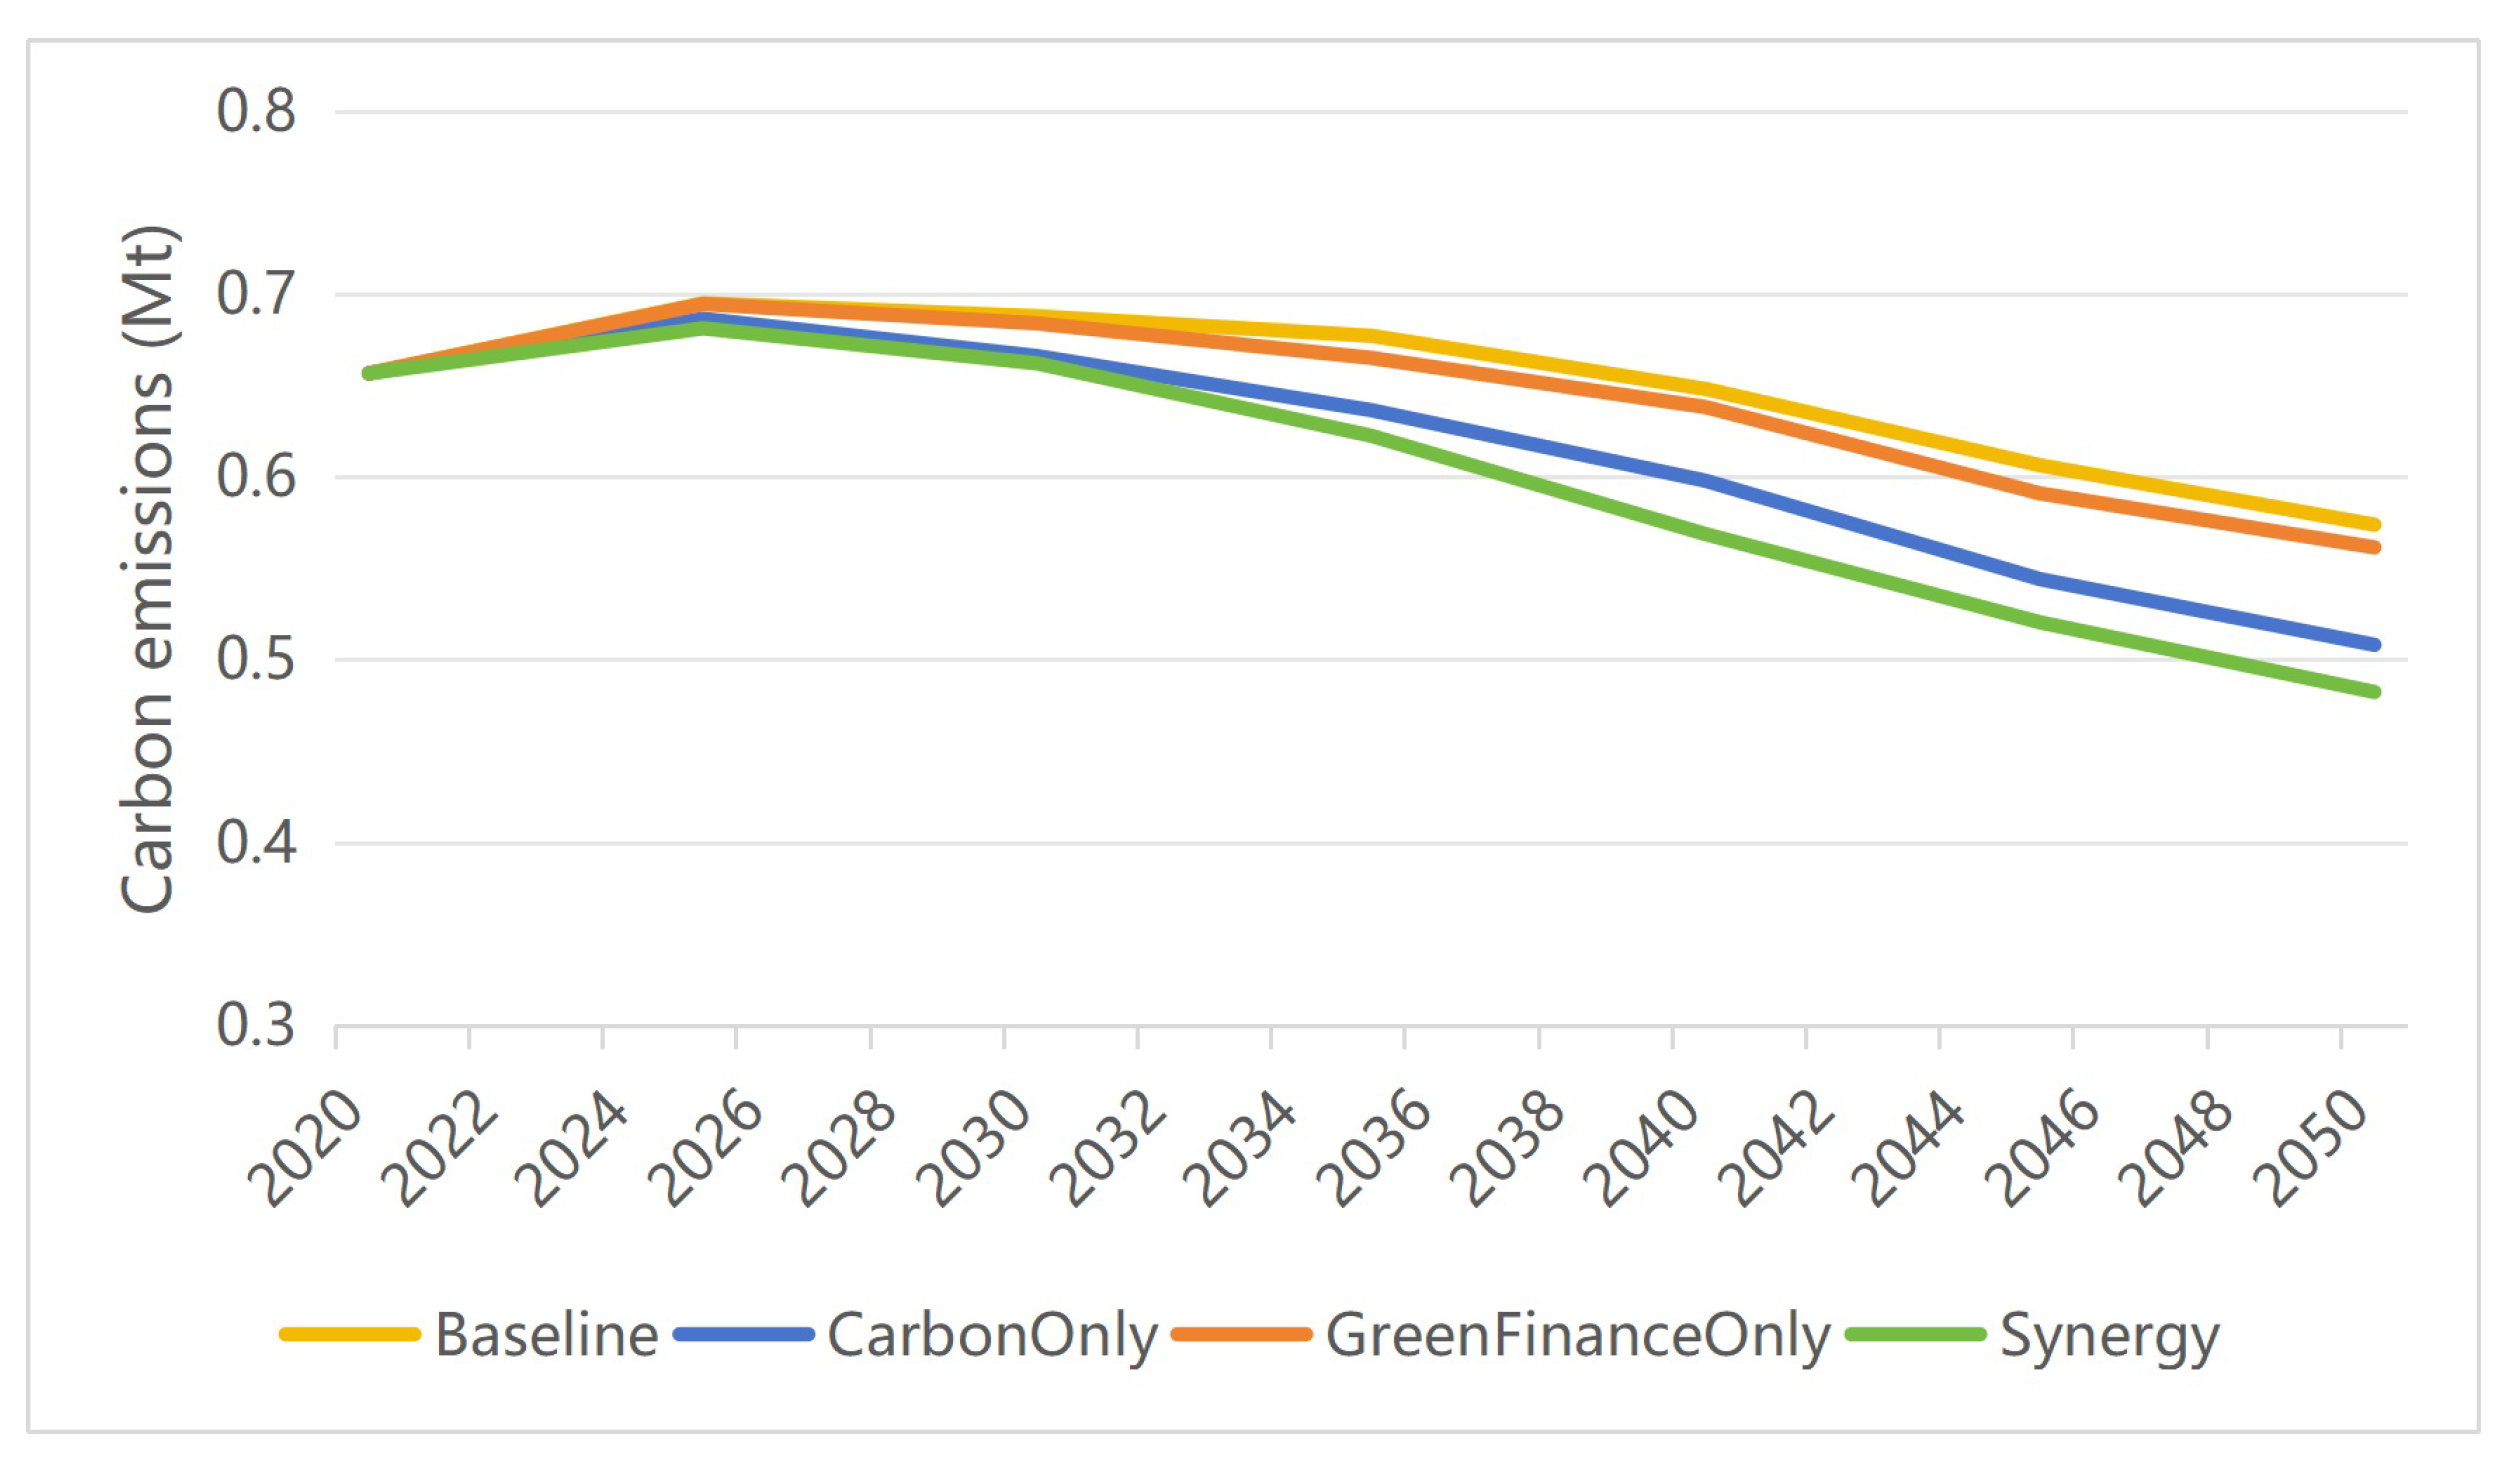
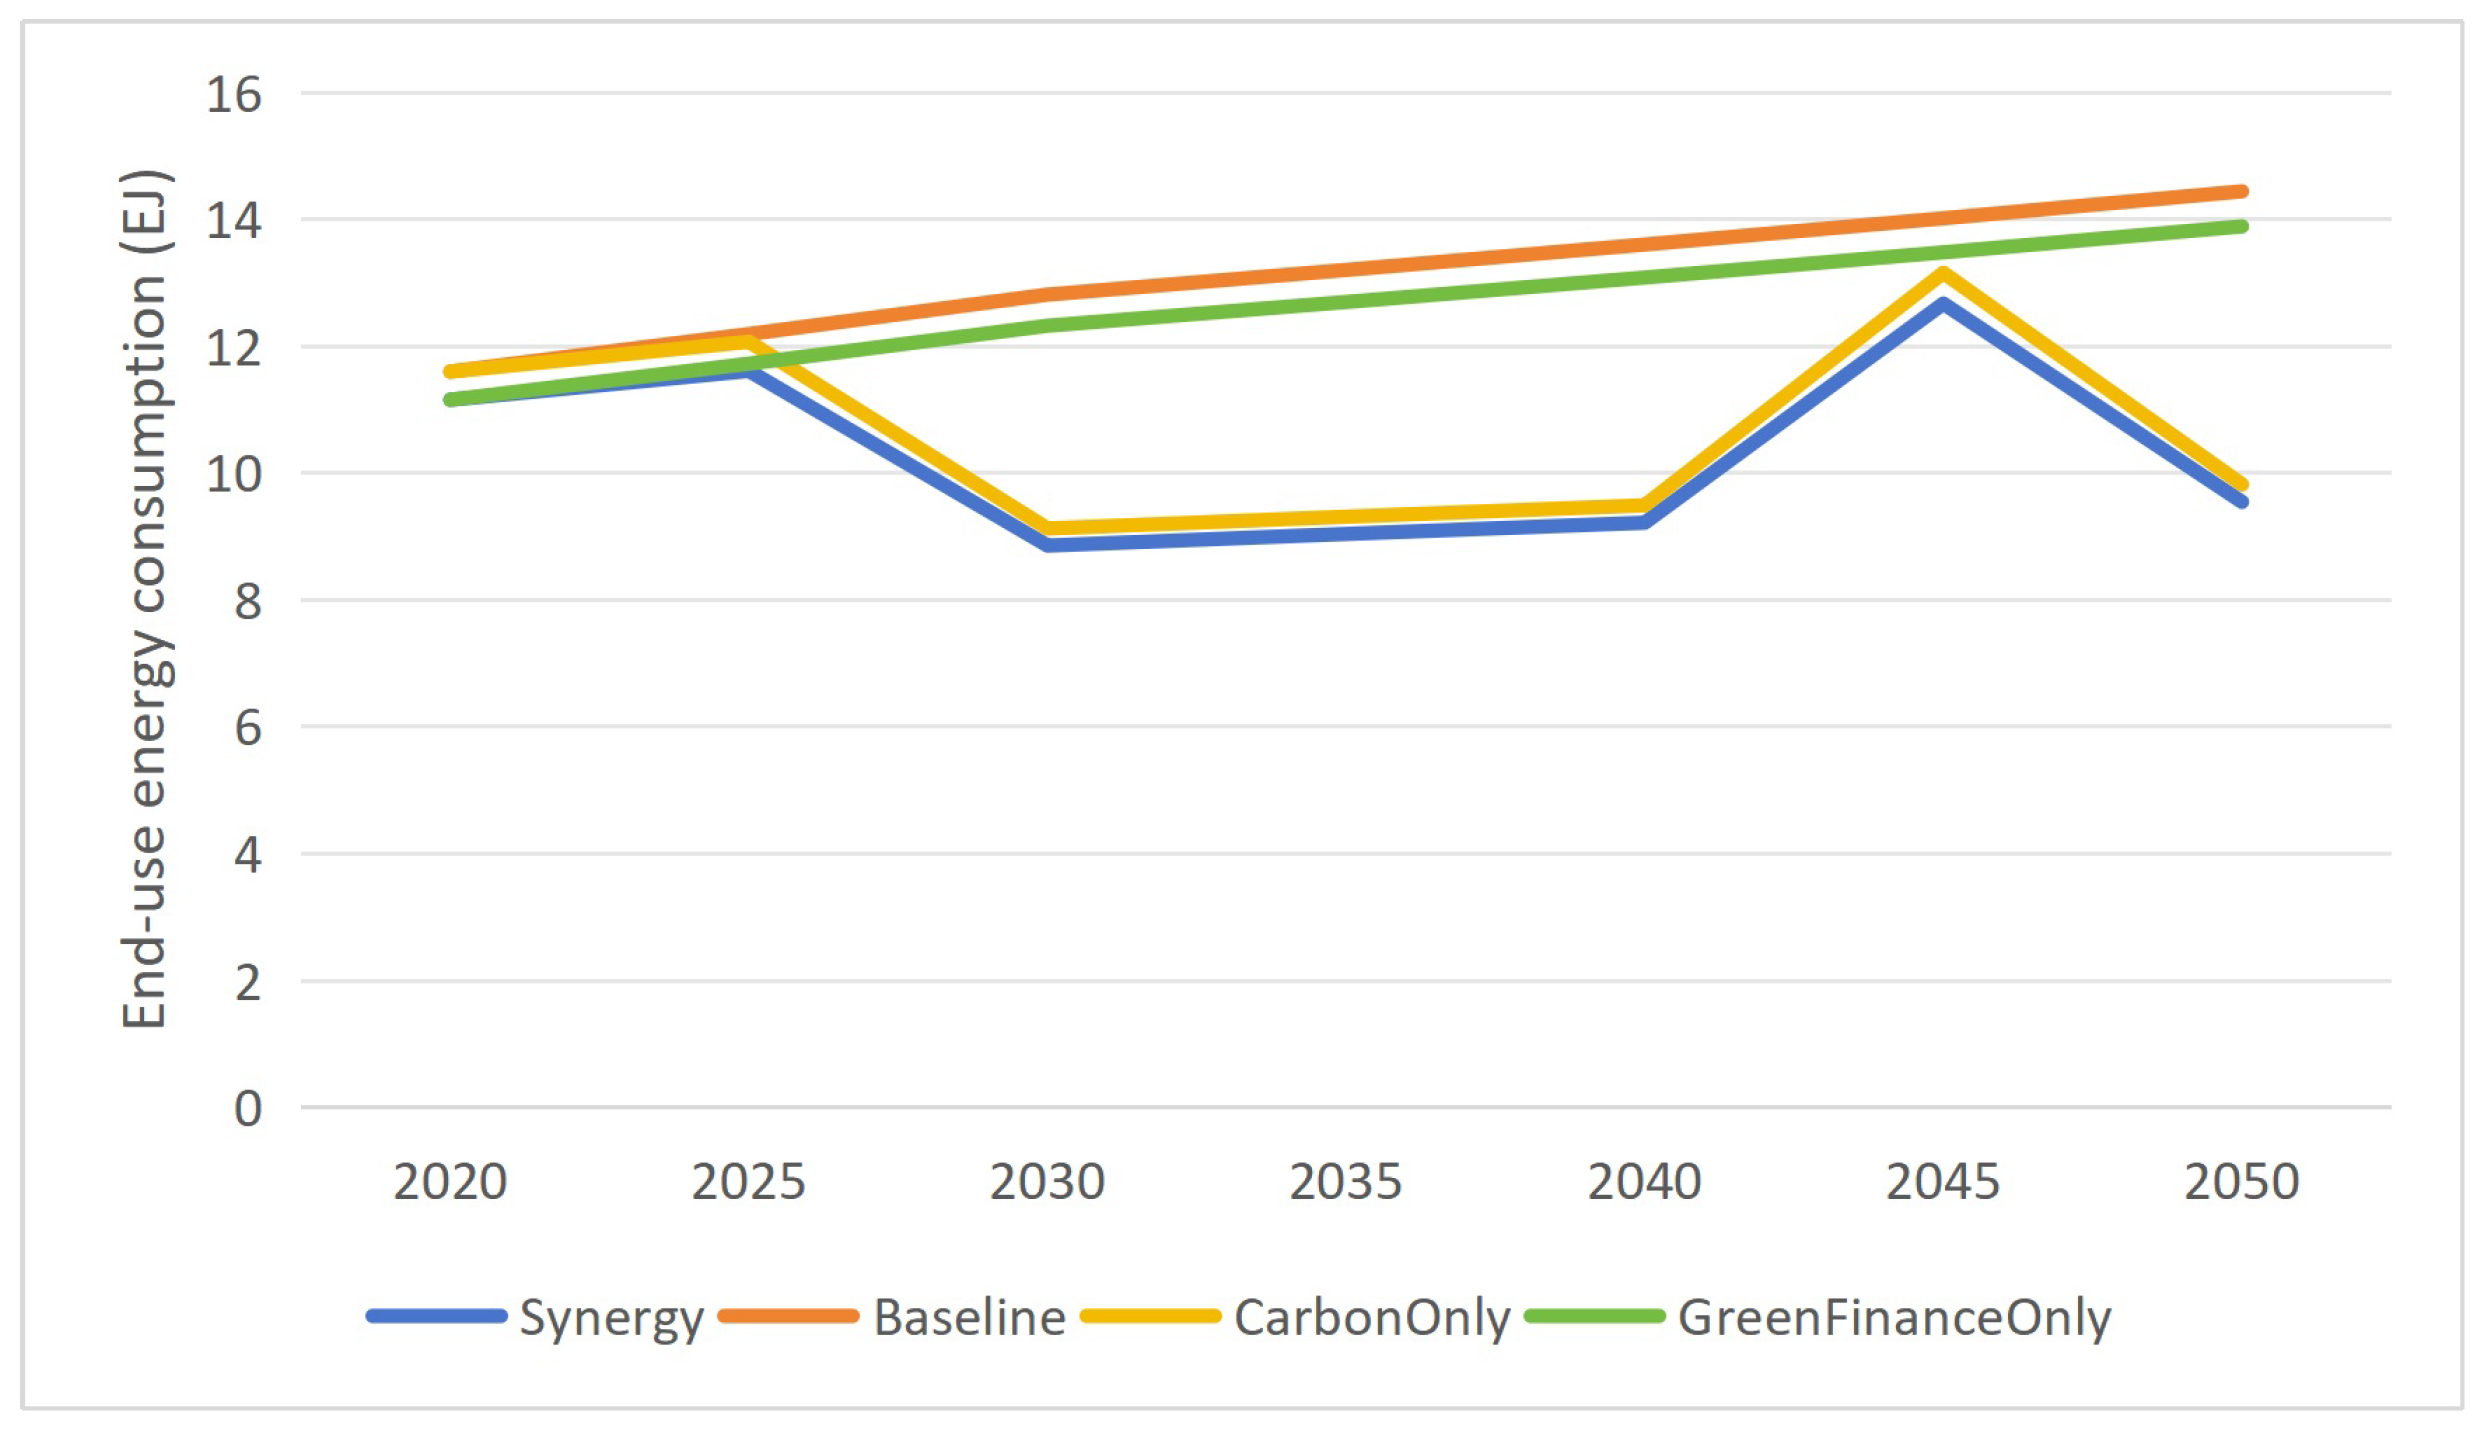
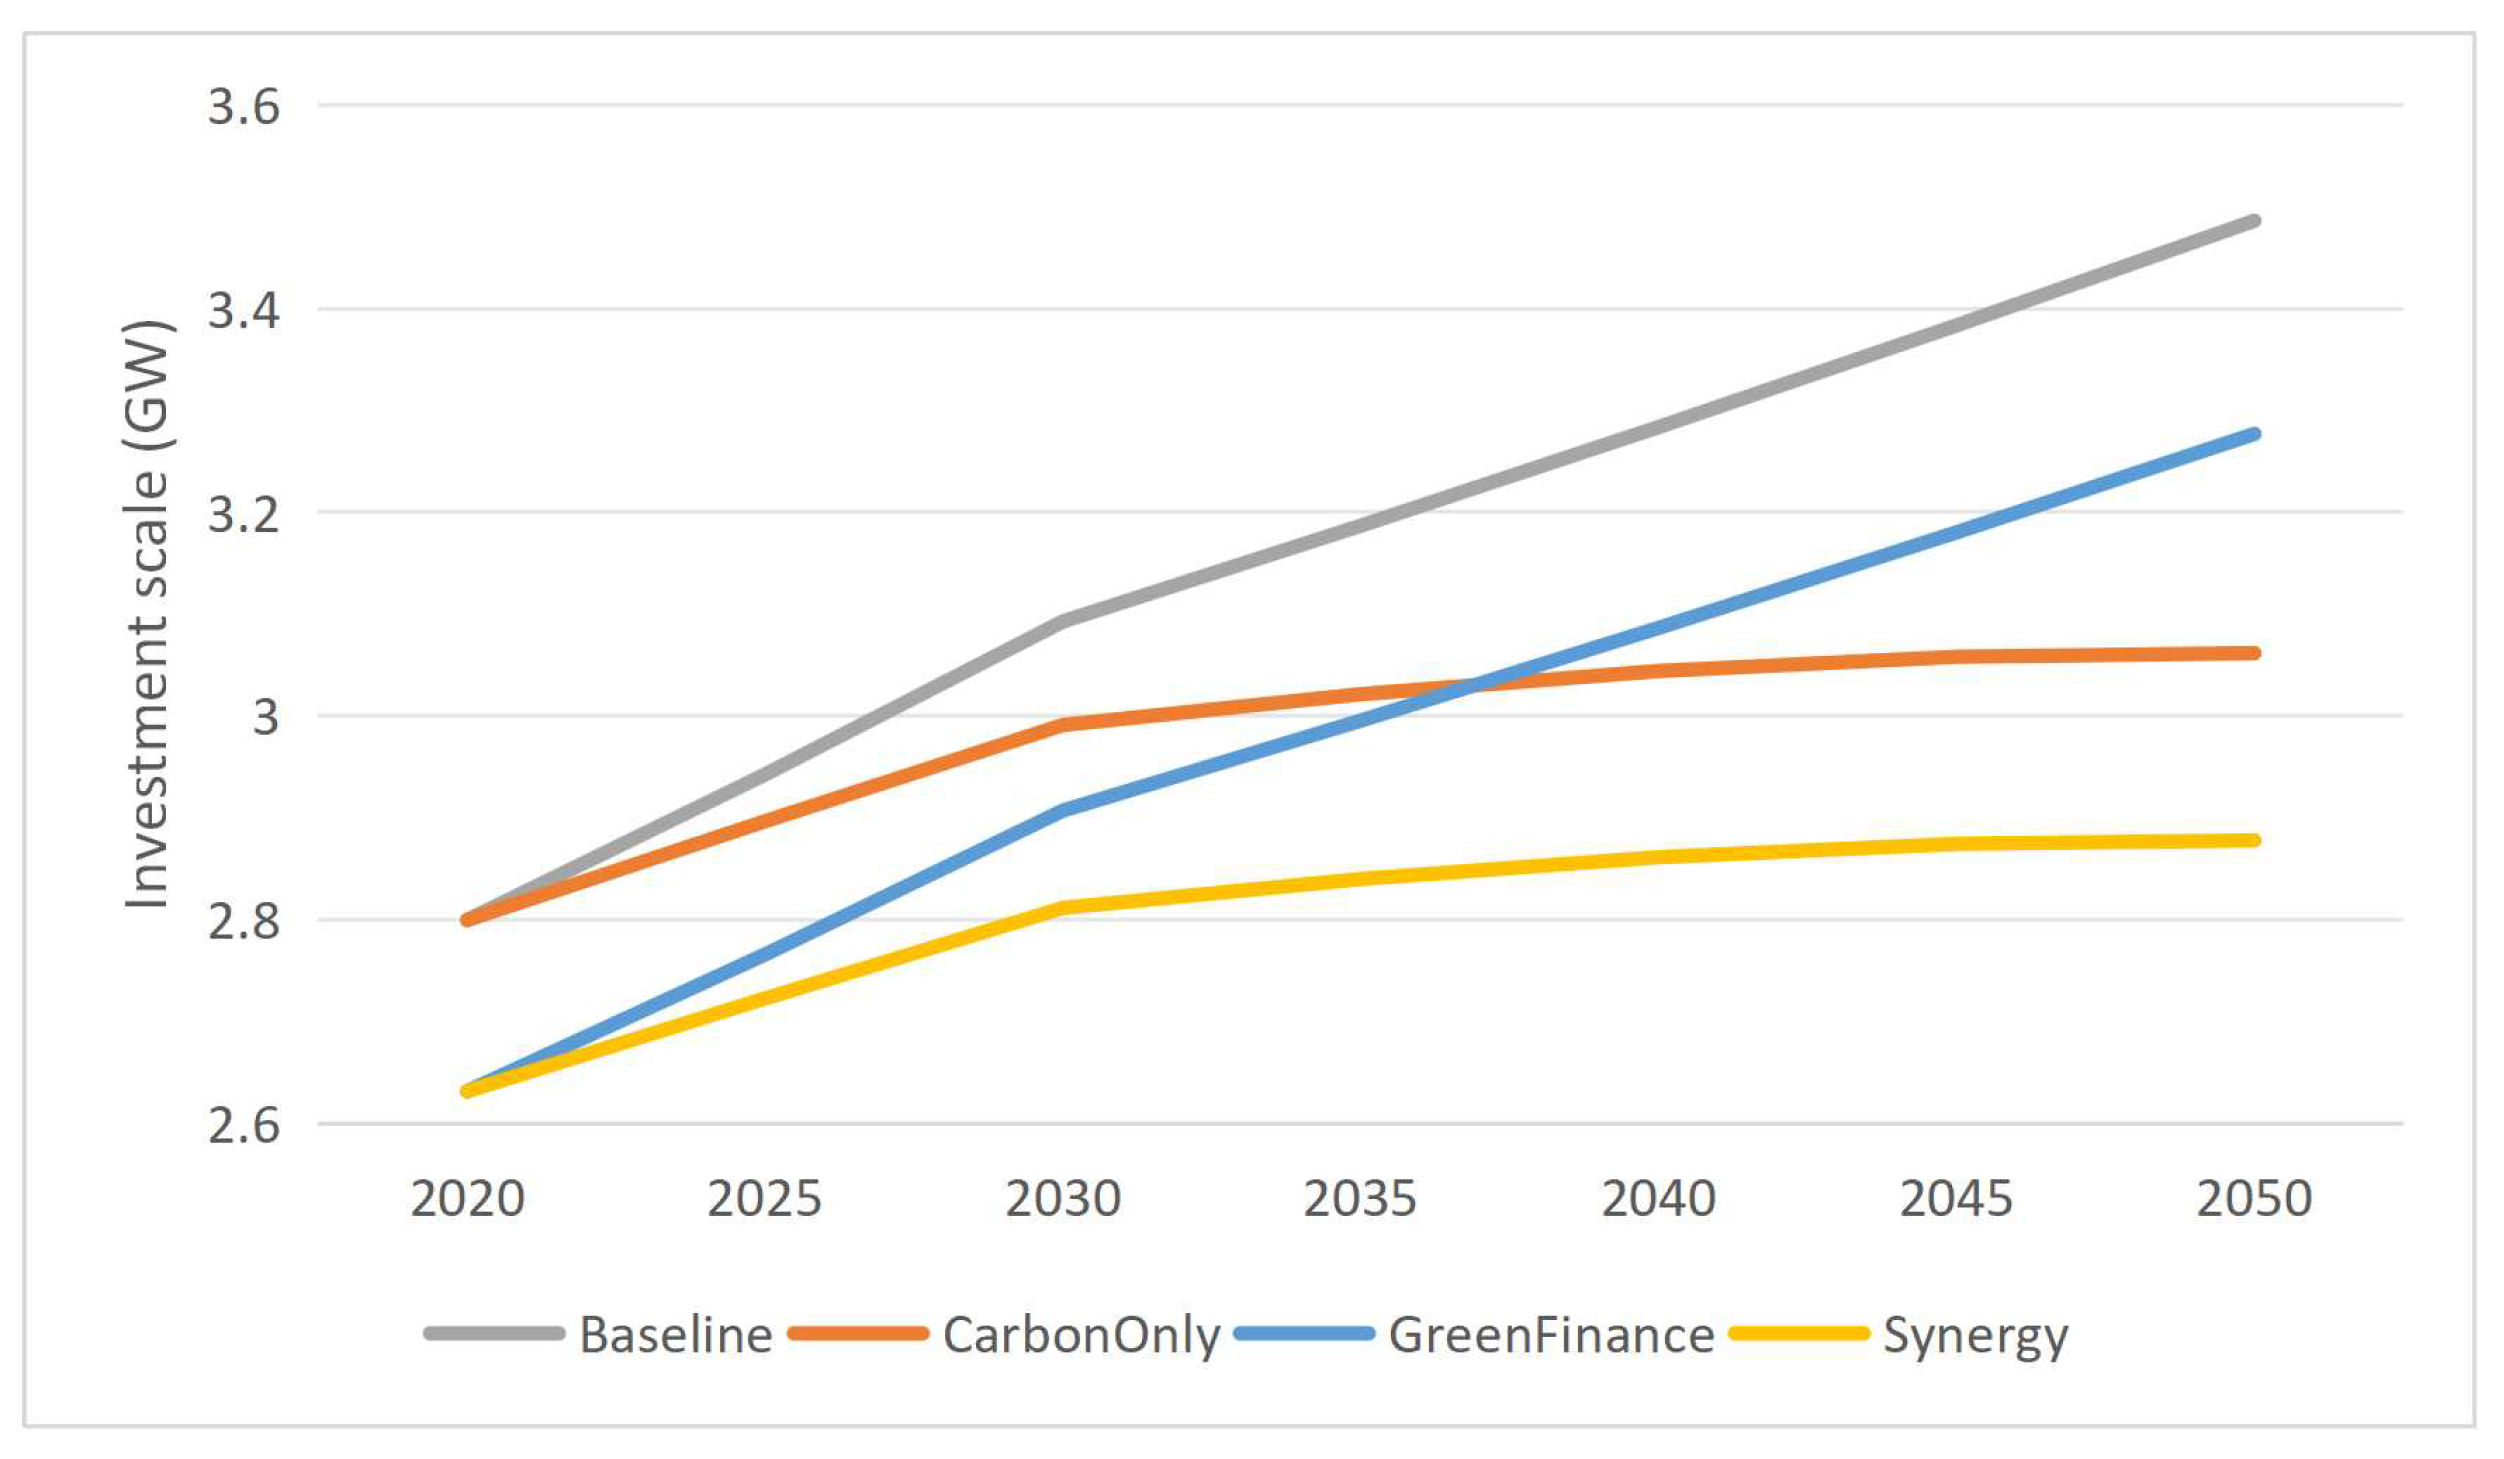
Based on the MESSAGEix-Buildings model with localized extensions, this study established four comparable scenarios: a baseline scenario, the isolated effects of the carbon market, the isolated effects of green finance, and policy synergy. It systematically assessed the transition pathways for Beijing’s residential buildings during the operational phase from 2020 to 2050 under different policy combinations, evaluating dimensions such as carbon dioxide emissions, final energy consumption and investment scale (see Figure 7, Figure 8 and Figure 9).

3.1. Results of Scenarios

The carbon reduction and energy consumption improvement outcomes of various scenarios compared to the baseline scenario are shown in Table 4. The baseline scenario reflects the natural trajectory of development in the absence of new policies and serves as a uniform reference standard for evaluating policy effectiveness. The model results indicate that under the baseline scenario, Beijing’s building operation-related CO2 emissions were 65.69 Mt in 2020, rose to 69.52 Mt in 2025, declined slightly to 68.81 Mt in 2030, and further decreased to 57.41 Mt in 2050, exhibiting a pattern of “initial modest increase followed by sustained decline”. End-use energy consumption increases in tandem from 11.60 EJ in 2020 to 14.442 EJ in 2050, with the rigid growth in service demand offsetting the gains from natural improvements in energy efficiency; the proxy value for new investment reaches 3.486 GW by 2050, with the investment structure dominated by ‘maintenance-oriented expansion’ rather than transformative upgrades.
For the CarbonOnly scenario, carbon pricing delivers growing decarbonization effects across the whole period. CO2 emissions drop to 66.63 Mt (3.17% below the baseline) in 2030 and further decline to 50.84 Mt with an 11.44% emission-reduction rate by 2050. The final-energy-consumption value decreases to 12.62 EJ (−1.54%) in 2030 and 14.22 EJ (−1.52%) in 2050. Moreover, the proxy value of newly-added investment is cut by 12.17% in 2050 relative to the baseline level.
When green-finance policy is implemented independently, its CO2 abatement performance remains relatively weak. The CO2 emission level only declines by 0.57% compared with the baseline scenario in 2030, and the corresponding emission-reduction rate reaches merely 2.16% in 2050, which is substantially lower than that under the carbon-pricing scenario. Nevertheless, the benefits brought by green-finance policies on energy-consumption saving and investment optimization gradually emerge in the long-run period. The final energy consumption in 2030 is roughly equivalent to the baseline level with a reduction rate of −0.07%, while the value declines by 3.83% by 2050. In addition, the proxy value of newly-added investment decreases steadily by 14.59% in 2050 relative to the baseline scenario.
When carbon pricing and green finance are implemented jointly, obvious policy-synergy effects can be observed. The CO2 emissions decrease to 66.23 Mt in 2030 with a 3.75% emission reduction relative to the baseline scenario, and further drop to 48.26 Mt in 2050 with the emission-reduction rate reaching 15.94%. Such decarbonization performance outperforms scenarios with a single policy. In terms of final-energy consumption, the value falls to 12.47 EJ in 2030 (2.70% lower than the baseline) and 13.55 EJ in 2050 (6.20% lower than the baseline), which is much higher than the reduction obtained under single-policy scenarios. From the investment perspective, the proxy value of newly-added investment in 2050 is reduced by 17.44% compared with the baseline scenario, which achieves the best investment-saving performance among all scenarios.
According to the calculated marginal abatement cost (MAC) results, the MAC value of the carbon-only scenario is −17.15 USD/MtCO2, the MAC value of the green-finance-only scenario is −8.46 USD/MtCO2, and the MAC value under the joint-policy scenario reaches −24.58 USD/MtCO2. A negative MAC value indicates that each additional 1 MtCO2 emission reduction will cut the corresponding social system-wide cost.

3.2. Multi-Objective Performance Evaluation and Validation of Collaborative Schemes

The evaluation results(see Table 5) show that the Synergy Scenario ranked first with a composite score of 91.64, whilst the Carbon Pricing Scenario, Green Finance Scenario and Baseline Scenario scored 78.61, 27.15 and 14.35 respectively. The breakdown of scores reveals that the Synergy Scenario did not achieve an overwhelming advantage in any single dimension, but rather maintained high levels across all four core dimensions, thereby delivering the best overall performance; the Carbon Pricing Scenario performed strongly in terms of emissions reduction and transition momentum, but scored lower than the Synergy Scenario in energy efficiency and investment efficiency; the Green Finance Scenario possessed a comparative advantage only in the investment efficiency dimension and was unable to support deep decarbonization targets. These results underscore the necessity of multi-objective evaluation, as a single emissions reduction rate indicator is insufficient to fully reflect the comprehensive performance of a policy.
When examining the individual indicators, the distinct characteristics of the different policies become clearly apparent. In terms of emissions, the carbon market scenario and the synergy scenario significantly outperform the green finance scenario and the baseline scenario, confirming that supply-side price constraints are the primary driver of deep emissions reductions in building operations; in terms of energy consumption, the synergy scenario outperforms the carbon market scenario, whilst the green finance scenario outperforms the baseline scenario, demonstrating that demand-side incentives have clear value in improving energy efficiency. In terms of investment efficiency, the Synergy Scenario exhibits the lowest proxy value for new capacity, thereby better facilitating the optimization of capital allocation under given emission reduction targets. This comparison reveals the core policy implication: the low-carbon transition of buildings is not simply a matter of ‘the higher the price, the better’ or ‘the more incentives, the better’, but rather requires a balance between constraints and incentives. Excessive constraints coupled with insufficient incentives can lead to excessively high transition friction costs, whilst ample incentives without sufficient constraints fail to achieve deep emission reduction targets. Only through the synergy of these two types of tools can resources be directed towards efficient, low-carbon technological pathways.

3.3. Discussion

Building on the results of the multi-scenario quantitative assessment of the Beijing building sector presented earlier, this section systematically analyses the effectiveness, scope of application and coordination mechanisms of various policy instruments, and examines how market-based policies can alter the natural decarbonization trajectory of the building sector. However, all policy scenarios are based on idealized implementation conditions and do not take into account real-world constraints such as behavioural inertia, implementation deviations and transaction costs; these factors may, to some extent, undermine the actual effectiveness of policy implementation and slow down the pace of transition.

3.3.1. Baseline Scenario

The baseline scenario simulates a development pathway reliant solely on the inertia of existing policies and the natural iteration of technology, which fails to meet the deep decarbonization targets for the building sector. It confirms that, in the absence of systematic policy intervention, spontaneous market evolution alone is unlikely to align with the timeline requirements of the ‘dual carbon’ goals. This highlights the urgency of introducing strong, binding market-based policy instruments.

3.3.2. Carbon Market Scenario

Under a single carbon market scenario, CO2 emission reductions reached 3.17% and final energy consumption fell by 1.54% in 2030; by 2050, emission reductions had further increased to 11.44% and final energy consumption had fallen by 1.52%, with a full-cycle investment savings rate of 12.17% and an overall performance rating of Grade B. These figures fully demonstrate the core emission reduction efficacy of carbon pricing instruments: by internalizing the external costs of carbon emissions, establishing a unified standard for measuring the value of emission reductions, and restructuring the relative cost advantages of different energy technologies, price signals can be transmitted upstream along the energy chain to drive the decarbonization of the power sector and downstream to incentivize the adoption of low-carbon technologies at the end-use level. This simultaneously achieves dual reductions in emissions and energy consumption, directs capital towards technology portfolios with more favorable life-cycle costs, and reduces inefficient investment.
However, the limitations of a single carbon pricing mechanism are also significant. Simulation results indicate that around 2040 there will be a short-term window of increased emissions due to the concentrated replacement of high-carbon stock equipment, and the transition costs are high. Furthermore, when the initial investment threshold for low-carbon technologies is too high, small and medium-sized business owners find it difficult to respond effectively to price signals, and the incentive effect for the diffusion of low-carbon technologies at the end-user level is significantly lacking, requiring supporting policies to further strengthen this aspect.
The high emission reduction rate of nearly 11.44% by 2050 primarily stems from the combined effects of Beijing’s early achievement of peak carbon emissions in buildings, deep decarbonization of its power system, comprehensive electrification of end-use sectors, and widespread adoption of low-carbon technologies. This represents a long-term technological optimization outcome driven by policy constraints, yet significant further reductions remain achievable through supportive policies to unlock full decarbonization potential.

3.3.3. Green Finance Scenario

Under a single green finance scenario, by 2050, the CO2 reduction rate would reach only 2.16%, with a 3.83% decrease in end-use energy consumption, and an overall performance rating of Grade D. These results indicate that relying solely on the optimization of financing costs cannot independently drive a profound restructuring of the upstream energy mix, nor is it sufficient to support the building sector in achieving its deep decarbonization targets. This also clarifies the functional boundaries of green finance: its essence lies in serving as a demand-side cost incentive tool; its core value is to alleviate the capital constraints of individual property owners by selectively reducing the financing costs of low-carbon projects, thereby enabling a smooth technological transition at a lower cost of capital. It is a vital supporting tool for optimizing the efficiency of the transition and reducing resistance to retrofitting, rather than a core emission-reduction constraint tool; it cannot replace the central constraining role of carbon pricing, and its function is primarily focused on enhancing the feasibility of policy implementation.
Green finance has a relatively limited impact when operating in isolation, primarily for the following three reasons: (1) Green finance can only lower the barriers to investment in and operation of low-carbon technologies; it cannot fundamentally alter the relative cost advantage of high-carbon energy sources, nor can it effectively drive the deep decarbonization of upstream electricity and heat supply systems; (2) in the absence of strong price constraints such as carbon pricing, the building sector continues to favor low-cost, high-inertia fossil fuel consumption patterns. Low-carbon technologies can only achieve partial substitution and struggle to drive systemic transformation of the energy mix; (3) green finance incentives exhibit diminishing marginal returns; relying solely on fiscal and financial subsidies cannot generate long-term, stable signals for emissions reduction. Therefore, green finance must be coordinated with binding instruments such as carbon pricing to achieve greater effectiveness.
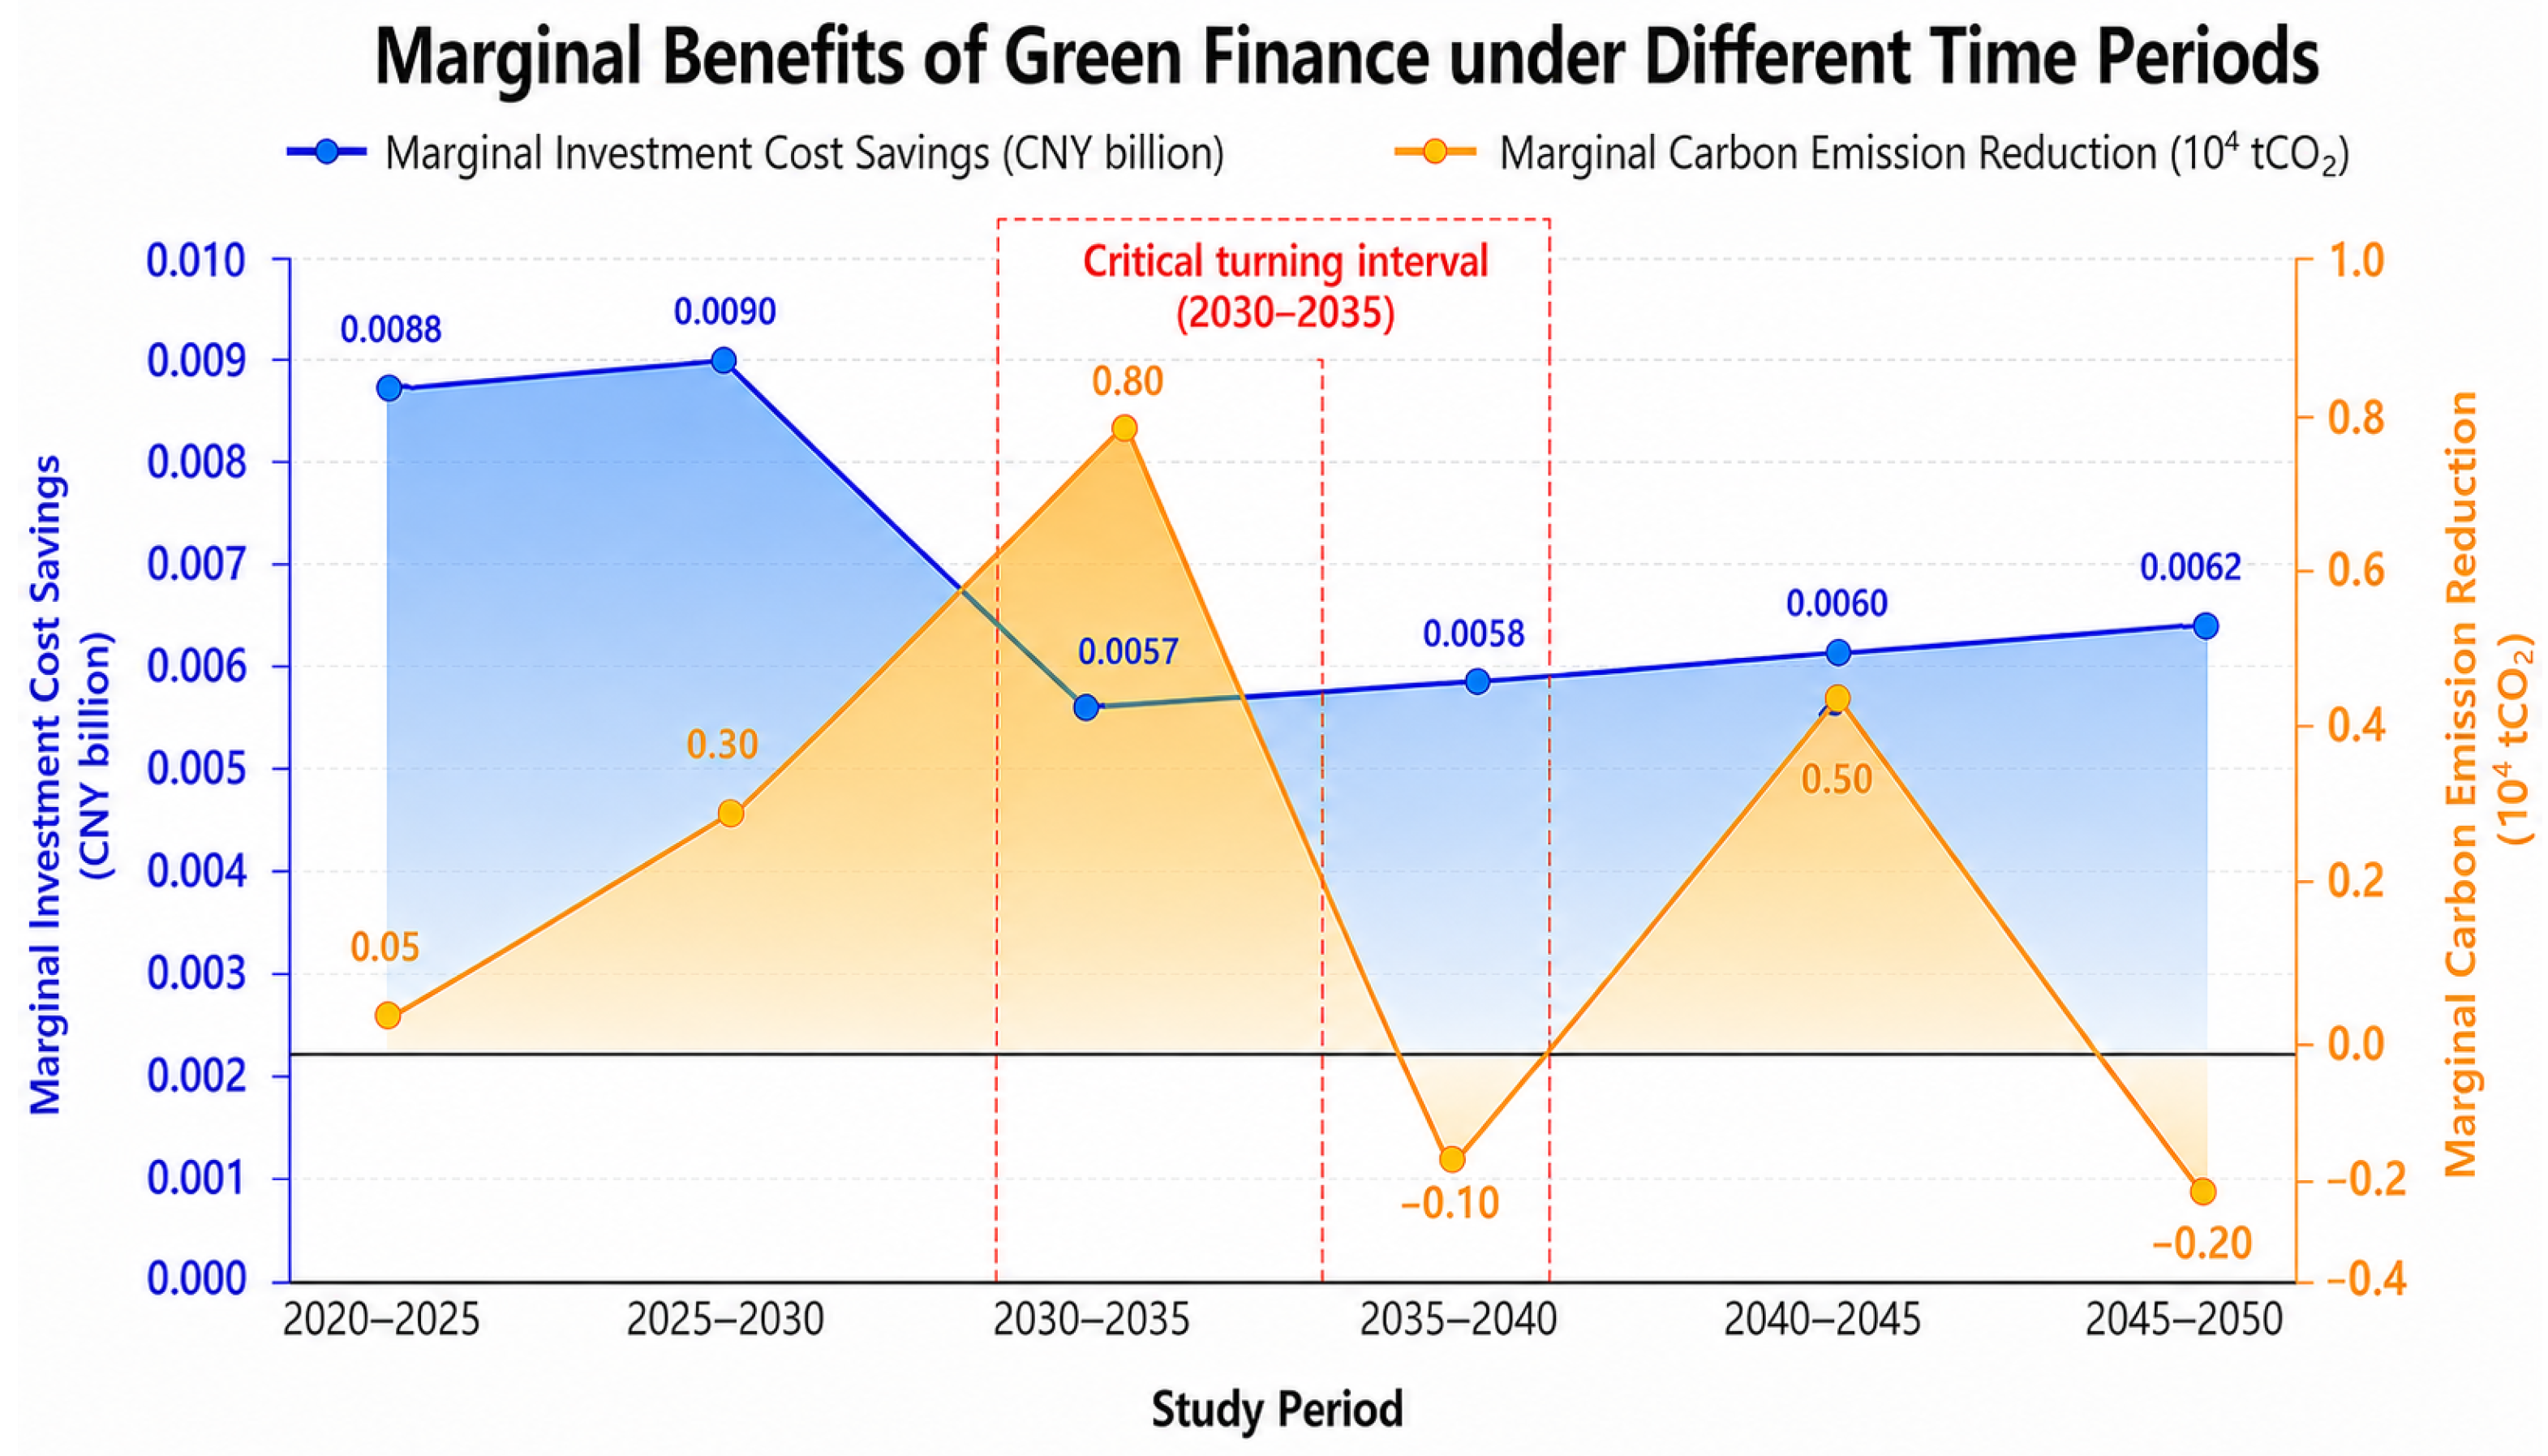
To further examine the diminishing marginal benefits of green finance, the marginal emission reduction and marginal investment cost savings were evaluated for each study period, and the corresponding results are presented in Figure 10. The analysis identifies 2030–2035 as the critical turning interval, beyond which the marginal emission reduction begins to decline, while the growth in marginal investment cost savings becomes progressively slower. These results provide quantitative evidence for the diminishing marginal benefits of green finance.

3.3.4. Synergy Scenario

A comparative analysis of simulation results across four scenarios reveals that the carbon reduction percentages under the synergistic scenario and the standalone carbon pricing scenario are essentially equivalent by 2030 and 2050. This finding does not indicate that green finance lacks carbon reduction potential, but rather reflects how its mitigation capacity during the 2020–2050 period remained constrained by practical factors such as financial support levels, building renovation timelines, and energy supply structures, preventing full realization. The synergistic effect between carbon markets and green finance can be quantified: by 2050, energy consumption reduction further increases to 6.2%, generating additional savings of approximately 4.68% and 2.37% compared to standalone carbon pricing and green finance scenarios respectively; the total investment savings rate reaches 17.44%, exceeding both the standalone carbon market scenario (by 5.27 percentage points) and the standalone green finance scenario (by 11.44 percentage points). Further analysis shows synergistic scenarios achieve carbon reductions of 3.75% in 2030 and 15.94% in 2050—significantly higher than standalone green finance scenarios and outperforming standalone carbon market scenarios by 0.58 percentage points (2030) and 4.50 percentage points (2050), respectively. These results demonstrate that policy synergy enables dual benefits of energy efficiency improvements and investment savings beyond individual measures, with overall effectiveness surpassing simple additive effects—a clear validation of the “1 + 1 > 2” synergistic principle.
The core mechanism of this synergy stems from the complementary functions of these two policy types. The carbon market constrains emission intensity at the supply side by increasing the variable costs of high-carbon technologies, thereby defining the long-term direction for decarbonization and providing clear cost signals for end-market participants regarding emission reduction. Green finance, meanwhile, improves the conditions for equipment upgrades from the demand side by reducing capital constraints and operational barriers for low-carbon technologies, thereby enhancing the building sector’s responsiveness to carbon price signals. When these two mechanisms are combined, the system tends to favor low-carbon, high-efficiency technology combinations whilst meeting equivalent building service demands. Consequently, under the premise of achieving the same emission reduction targets, both energy consumption and costs are optimized.
A comparative analysis based on Marginal Abatement Cost (MAC) demonstrates that the reduction in marginal abatement costs under the combined carbon pricing and green finance policy approach is significantly greater than that achieved by either policy alone. This result quantitatively confirms, from a marginal cost perspective, that their synergy enables the building sector to achieve deep decarbonization at lower social costs. Further analysis reveals that when evaluating solely based on emission-related metrics, there is no significant difference in emission reduction levels between the synergistic scenario and the standalone carbon pricing scenario, which can easily lead to an underestimated marginal contribution of green finance to building decarbonization; only when energy consumption and investment-related indicators are simultaneously incorporated does the value of synergistic policies in reducing overall decarbonization transition costs become clearly evident. This conclusion aligns with previous findings regarding energy consumption reductions and investment savings.

3.3.5. A Comparison with the Findings of Previous Studies

The simulation results in this study demonstrate that under the carbon pricing and green finance synergy scenario, the building sector will achieve a 15.94% reduction in carbon emissions, a 6.20% decrease in end-use energy consumption, and a 17.44% savings in full-life-cycle investments by 2050—results that align closely with the long-term decarbonization targets for the global building sector outlined in the IPCC Sixth Assessment Report (AR6) and the IEA Net-Zero Emissions (NZE) scenario. The IPCC Sixth Assessment Report states that to achieve the 1.5 °C temperature control target, the global building sector must achieve near-zero operational carbon emissions and a significant reduction in final energy intensity by around 2050, with the core pathways being final-use electrification, energy efficiency improvements and zero-carbon electricity supply. The IEA NZE scenario similarly emphasizes that the global construction sector must achieve simultaneous reductions in carbon emissions and end-use energy consumption through systematic performance upgrades, widespread adoption of low-carbon technologies, and a cleaner energy mix, thereby providing crucial support for achieving the global net-zero goal.
Compared with existing simulation scenarios at the global level and those for emerging economies, the localized simulation results derived from the Beijing scenario demonstrate a higher emission reduction magnitude. This difference primarily stems from Beijing’s early achievement of peak carbon emissions from buildings, a faster pace of grid clean-up transition, and more defined prospects for end-use electrification and low-carbon technology adoption. The study’s findings of a 6.20% reduction in end-use energy consumption and a 15.94% carbon emission reduction rate are also broadly consistent with advanced domestic and international research conclusions as well as policy target ranges.
The marginal contribution of this paper is primarily manifested in three dimensions: first, it transforms globally agreed decarbonization targets into localized research scenarios tailored to Beijing’s development characteristics, establishing technology-specific synergistic emission reduction pathways that integrate policy considerations; second, it systematically quantifies the differences in effectiveness between individual policy instruments and policy synergy mechanisms across the dimensions of emission reduction, energy consumption reduction, and cost reduction; third, the findings provide quantitative support and a decision-making basis for formulating decarbonization policy combinations in the building sector for similar megacities across China.

4. Conclusions and Limitations

4.1. Key Conclusions

Facing the global climate governance process and the practical needs of achieving China’s “dual carbon” goals, deep decarbonization during the operational phase of buildings has become a core focus in the field of urban emission reduction. This study focuses on the practical issue of the limited effectiveness boundary of single policy tools, selects Beijing as a typical case of a megacity, and first constructs a supply-demand bilateral coordination theoretical framework of “carbon pricing anchoring emission reduction direction and green finance smoothing implementation path”. Then, it expands and forms the MESSAGEix-Building model embedded with localized parameters and endogenous policy variables. The important methodological contribution of this paper lies in the construction of a policy-endogenous policy mapping module, which achieves dynamic simulation and collaborative quantification of the effects of carbon pricing and green finance. For the operational scenario of buildings in megacities, a systematic quantitative evaluation is conducted on the long-term dynamic effects of carbon pricing and green finance collaboratively driving deep decarbonization of buildings. The core conclusions can be summarized into three points:
(1) In the next 25 years, two types of market-oriented policies, namely carbon pricing and green finance, can play a significant role in the field of building energy efficiency and emission reduction. Carbon pricing forms a clear value anchor for emission reduction by internalizing the external costs of carbon emissions, driving the clean transformation of the energy structure from the supply side, and is the core constraint tool for achieving deep decarbonization. Green finance alleviates capital constraints for market entities by lowering the financing and operational thresholds for low-carbon technologies and is an important supporting tool for reducing the friction costs of transformation and enhancing policy acceptance. The two policies form a closed-loop linkage mechanism, driving technology selection, capital allocation, and policy signals to continuously converge towards the path with the lowest long-term marginal emission reduction cost for the entire society.
(2) Under the single policy scenario, the comprehensive effects of carbon pricing on energy conservation, emission reduction, and cost reduction are significantly better than those of green finance. The carbon pricing scenario in 2050 can achieve an emission reduction rate of 11.44% compared to the baseline scenario, a decrease of 1.52% in terminal energy consumption, and a system-wide investment savings rate of 12.2%; meanwhile, the green finance scenario can only achieve an emission reduction rate of 2.16%, a decrease of 3.8% in terminal energy consumption, and an investment savings rate of 6.0%. Implementing green finance alone is difficult to support the deep decarbonization goal of the building sector.
(3) The coordinated implementation of these two policies preserves the high carbon reduction achieved by carbon pricing while further reducing end-use energy consumption and overall investment costs, thereby improving the cost-effectiveness and implementation efficiency of deep decarbonization. Compared to the baseline emission level in 2020, carbon emissions in 2050 under the coordinated scenario can be reduced by 96.4%, and final energy consumption can be reduced by 33.9%. Compared to the single carbon pricing scenario, the coordinated scenario can further reduce final energy consumption by 4.3%, and the cumulative discounted cost of the entire system can be saved by 17.4% compared to the baseline scenario, demonstrating the synergistic advantages in terms of energy efficiency and investment cost reduction. This can achieve the goal of reducing carbon emissions during the operation phase of buildings under the constraint of minimum social cost.
In summary, through rigorous model extensions and multi-scenario quantitative assessments, this study has revealed the underlying logic and practical potential of carbon pricing and green finance working in tandem to drive deep decarbonization in the construction sector. With regard to the design of ‘dual carbon’ policies for the building sector in Beijing, reliance on either carbon pricing or green finance instruments alone is insufficient. It is necessary to expedite the establishment of a mechanism for the coordinated interaction between these two policy types: using carbon pricing as the core to anchor emission reduction targets, and employing green finance as a complementary measure to reduce implementation barriers. Only in this way can the deep decarbonization targets be achieved at the lowest overall cost. This study provides a scientific basis for decision-making in the formulation of building emission reduction strategies at the level of megacities and even nationwide.

4.2. Proposed Phased Implementation Pathway

Based on the quantitative assessment results and identification of collaborative mechanisms from Beijing’s construction sector, this study proposes a three-stage progressive collaborative implementation framework for the years 2025–2050. It provides a practical action reference for the deep decarbonization of the construction sector in megacities, and the overall path aligns with the overall requirements of Beijing’s carbon peak implementation plan.
(1) Foundation-Building Phase (2025–2030)
The primary objectives of this phase are to refine the relevant institutional framework and lay the foundation for market development. Policy coordination focuses on three key areas: First, advancing the implementation of green finance: expanding the coverage of the “Jinglv Tong” special rediscount product program to include energy-saving renovations of building envelopes and high-efficiency lighting upgrades across the entire interest subsidy support catalog; establishing a whitelist system for building energy efficiency retrofits and streamlining credit approval procedures for low-carbon projects. Second, developing supporting mechanisms for carbon pricing: integrating all large public buildings citywide into the carbon market’s indirect regulatory framework, refining simplified calculation rules for carbon quota allocation in the construction sector; gradually raising the baseline carbon price level to align with that of developed countries, thereby establishing stable long-term price expectations; temporarily exempting small and medium-sized residential buildings from mandatory emission reduction obligations to mitigate short-term transition costs.
(2) Synergistic Acceleration Phase (2031–2040)
The core objective of this phase is to strengthen policy constraints, broaden the scope of incentives, and drive systemic technological substitution. Policy coordination must be implemented comprehensively: (1) Strengthen the constraining effect of carbon pricing, driving carbon prices to rise steadily to the critical threshold for low-carbon technology substitution. Leveraging carbon price signals to compel upstream power and heating sectors to increase their share of renewable energy, thereby continuously reducing indirect carbon emissions from buildings on the supply side; (2) promote targeted green finance to empower the sector, shifting the focus of financial support towards systemic retrofit projects such as heating electrification (heat pump deployment), large-scale replacement of high-efficiency cooling equipment, and building-integrated photovoltaics (BIPV), whilst innovating and developing differentiated financial products directly linked to project carbon emission reductions; (3) strengthen the synergy between technical standards and industry by publishing and mandatorily enforcing higher-level building energy efficiency standards and promoting the coordinated development of related industrial chains such as green building materials and smart operation and maintenance.
(3) Deep Decarbonization Phase (2041–2050)
The core objectives of this phase are to consolidate the achievements of the transition, overcome technical challenges and achieve near-zero emissions. Policy coordination will focus on establishing long-term mechanisms: firstly, by leveraging established market-based mechanisms, utilizing the stable high carbon price signals that have already been established and the mature green finance market, to drive the complete phase-out of remaining high-carbon equipment (such as aging gas boilers). Secondly, financial instruments will be used to support cutting-edge technological innovation, with green finance providing targeted support for the demonstration and large-scale deployment of advanced technologies such as near-zero energy buildings, photovoltaic-storage-direct-flexible systems, and the interaction between building energy systems and the power grid. Thirdly, low-carbon governance models will be institutionalized by incorporating low-carbon operation and management requirements into building life-cycle management systems, thereby establishing a long-term governance mechanism for low-carbon building operations.

4.3. Shortcoming and Prospects

Although this study has achieved preliminary progress in the field of quantitative assessment of policy coordination, its research design is subject to clear limitations. Future research could be deepened and expanded in the following three directions:
(1) The system boundaries could be further expanded. The accounting scope of this study focuses on carbon emissions during the building operation phase and does not cover other stages of the building’s full life cycle, such as the production of building materials and construction. In future, a full life-cycle analysis framework could be developed that couples embodied carbon with operational carbon, thereby providing a more comprehensive assessment of the impact of policy coordination on emissions reductions across the entire building industry chain.
(2) The characterization of heterogeneity could be further refined. This study conducted simulations using Beijing as a single regional case; future research could extend the model to multi-regional coupled analysis across the country and introduce methods such as agent-based modeling (ABM) to more precisely capture differences in policy responses across distinct climate zones, building types, and decision-maker preferences. The present model assumes fixed energy demand growth rates and does not explicitly incorporate population and urbanization as dynamic drivers. Future work will consider these factors to improve long-term energy demand projections.
(3) The model mechanisms could be further refined. This study has reasonably simplified the building stock turnover process; in future, it may be possible to further couple more detailed building stock dynamics models and explore the incorporation of behavioral economics factors (such as decision-makers’ risk preferences and market information asymmetry) into the technology diffusion decision-making process, thereby enhancing the model’s ability to capture the complexity of real-world scenarios.
Although the present framework captures the overall policy effects of carbon pricing, it does not explicitly distinguish carbon cost transmission across different energy categories such as electricity, heat, and natural gas. Incorporating energy-specific carbon emission factors and transmission pathways will be an important direction for future model development. Moreover, in this study, we have focused on representative policy scenarios rather than identifying optimal policy intensity ratios. In futuristic work, determining stage-specific carbon pricing and green finance combinations through a multi-objective optimization framework can be explored.
(4) The technology portfolio can be further expanded. This study did not include biomass heating technology, primarily due to the high cost of storage and transportation of biomass resources in Beijing, as well as strict environmental regulations. Currently, it is only in the pilot stage and has not yet formed a foundation for large-scale application, which is in line with the reality of local building energy consumption. If renewable heating technologies such as biomass heating and solar thermal energy are promoted on a large scale in the future, it can further enrich the supply of low-carbon technologies, reduce the system’s dependence on electricity and natural gas, and thus further enhance emission reduction depth, reduce terminal energy consumption, and lower total system costs under a collaborative policy framework. However, the promotion of such technologies will not change the core conclusion of the collaborative policy of “carbon pricing as the main approach, supplemented by green finance”, but will only optimize the technology portfolio structure and reduce the marginal cost of emission reduction, without triggering technology lock-in or policy effect reversal.
(5) The regional transferability of research conclusions requires further verification. The policy coordination conclusions derived from the case study of Beijing, a megacity, cannot be directly applied to cities in central and western China. When transplanting the model, core parameters must be calibrated specifically and tailored to distinct implementation approaches. At the parameter level, these regions should increase the benchmark energy consumption and renovation cost coefficients for old buildings, lower the regional clean energy penetration rate, reduce green finance interest subsidy levels and carbon price benchmarks, while incorporating higher financing premiums to adjust system investment costs. In terms of policy implementation, cities in central and western China face stricter fiscal constraints and greater capital gaps for building emission reduction; thus, priority should be given to leveraging green finance to alleviate investment constraints and implementing gradual, moderate carbon pricing; direct adoption of high-intensity carbon reduction targets from developed eastern cities should be avoided, with instead pursuing low-cost building decarbonization tailored to regional characteristics.
Despite the aforementioned limitations, the ‘supply–demand coordination’ analytical framework constructed in this study, the localized policy endogenous evaluation model developed from it, and the quantitative validation conclusions derived from the Beijing case study, can still provide a solid quantitative basis and decision-making reference for academic research and policy formulation in the field of building decarbonization.

Author Contributions

Conceptualization, K.C.; methodology, K.C.; software, K.C.; validation, K.C. and S.G.; resources, K.C.; formal analysis, K.C. and S.G.; investigation, K.C.; data curation, K.C.; writing—original draft, K.C.; writing—review and editing, K.C. and S.G.; visualization, K.C. and S.G.; supervision, S.G. and X.C.; funding acquisition, X.C. All authors have read and agreed to the published version of the manuscript.

Funding

The research work is funded by the National Natural Science Foundation of China under Grant number 62427811.

Data Availability Statement

The data sources of this study are all public databases, and the relevant links have been marked in detail in this paper. The model code and scenario parameters supporting the findings of this study are available from the corresponding author upon reasonable request.

Acknowledgments

During this study, the author used Python 3.12.7 and RStudio-2025.09.1 to calculate the efficiency of carbon quota utilization and marginal emission-reduction costs. The authors have reviewed and edited the output and take full responsibility for the content of this publication.

Conflicts of Interest

The funders had a role in the decision to publish the results. The authors declare no conflicts of interest.

References

  1. Fleurbaey, M.; Kartha, S.; Bolwig, S.; Chee, Y.L.; Chen, Y.; Corbera, E.; Lecocq, F.; Lutz, W.; Muylaert, M.S.; Norgaard, R.B.; et al. Sustainable Development and Equity. In Climate Change 2014: Mitigation of Climate Change. Contribution of Working Group III to the Fifth Assessment Report of the Intergovernmental Panel on Climate Change; Edenhofer, O., Pichs-Madruga, R., Sokona, Y., Farahani, E., Kadner, S., Seyboth, K., Adler, A., Baum, I., Brunner, S., Eickemeier, P., et al., Eds.; Cambridge University Press: Cambridge, UK; New York, NY, USA, 2014. [Google Scholar]
  2. Special Committee on Building Energy Consumption and Carbon Emission Data, China Association of Building Energy Efficiency. Research Report on Carbon Emissions in China’s Urban and Rural Construction Sector (2025). Buildings 2025, 15, 56–63. [Google Scholar]
  3. Adeleke, O.J.; Jovanovich, K.D.; Ogunbunmi, S.; Samuel, O.; Kehinde, T.O. Comprehensive exploration of smart cities: A systematic review of benefits, challenges, and future directions in telecommunications and urban development. IEEE Sens. Rev. 2025, 2, 228–245. [Google Scholar] [CrossRef]
  4. Zhang, B.; Yu, L.; Cai, H. Evaluation of the Buffer-Valve Effect of Carbon Tariff Shocks on China’s Carbon Market Expansion and Price Increase. China Ind. Econ. 2025, 5–22. [Google Scholar] [CrossRef]
  5. Tang, Y.; Hu, Y.; Cui, A. Research on the synergistic effects of market-oriented environmental regulations on pollution and carbon emission reduction. J. Environ. Manag. 2025, 380, 125115. [Google Scholar] [CrossRef]
  6. Bai, J.; Ma, W.; Wang, Y. Political incentives in market-based environmental regulation: Evidence from China’s carbon emissions trading scheme. Heliyon 2024, 10, e25730. [Google Scholar] [CrossRef] [PubMed]
  7. Ma, J. On the Construction of China’s Green Financial System. Financ. Forum 2015, 20, 18–27. [Google Scholar] [CrossRef]
  8. Chen, J.; Liu, P.; Lin, B. Optimizing green finance policies to promote the diffusion of prefabricated construction technology: An agent-based and exploratory scenario simulation. Eng. Constr. Archit. Manag. 2026, 1–21. [Google Scholar] [CrossRef]
  9. Guo, Y.; Zhang, Z. Reducing carbon emissions through green renewal: Insights from residential energy consumption in Chinese urban inventory districts from an evidence-based decision-making perspective. Humanit. Soc. Sci. Commun. 2024, 11, 54. [Google Scholar] [CrossRef]
  10. Jahanger, A.; Balsalobre-Lorente, D.; Ali, M. Going away or going green in ASEAN countries: Testing the impact of green financing and energy on environmental sustainability. Energy Environ. 2024, 35, 3759–3784. [Google Scholar]
  11. Li, H.; Yu, Z.; Chen, G. Research on the impact of green finance on regional carbon emission reduction and its role mechanisms. Sci. Rep. 2025, 15, 17293. [Google Scholar] [CrossRef] [PubMed]
  12. Liu, W.; Chen, Y.; Zhu, P. Can carbon reduction policies promote sustainable construction development? Evidence from China’s green building market. PLoS ONE 2024, 19, e0303149. [Google Scholar] [CrossRef] [PubMed]
  13. Qadir, S.; Dosmagambet, Y. CAREC energy corridor: Opportunities, challenges, and impact of regional energy trade integration on carbon emissions and energy access. Energy Policy 2020, 147, 111427. [Google Scholar] [CrossRef]
  14. Beijing Municipal Bureau of Statistics. Beijing Statistical Yearbook 2023; China Statistics Press: Beijing, China, 2023.
  15. Luo, W.; Zhang, Y.; Gao, Y. Life cycle carbon cost of buildings under carbon trading and carbon tax system in China. Sustain. Cities Soc. 2021, 66, 102509. [Google Scholar] [CrossRef]
  16. Nieto, M.J.; Papathanassiou, C. Financing the orderly transition to a low carbon economy in the EU: The regulatory framework for the banking channel. J. Bank. Regul. 2024, 25, 112–126. [Google Scholar] [CrossRef]
  17. Pettifor, H.; Mastrucci, A.; Wilson, C. Endogenous simulation of low-carbon lifestyle change in global climate mitigation pathways. Environ. Res. Lett. 2024, 19, 014016. [Google Scholar]
  18. Mastrucci, A.; Ruijven, B.V.; Byers, E. Global scenarios of residential heating and cooling energy demand and CO2 emissions. Clim. Change 2021, 168, 14. [Google Scholar] [CrossRef]
  19. Braungardt, S.; Bürger, V.; Köhler, B. Carbon Pricing and Complementary Policies—Consistency of the Policy Mix for Decarbonizing Buildings in Germany. Energies 2021, 14, 7143. [Google Scholar] [CrossRef]
  20. Liu, P.; Lin, B.; Zhou, H.; Li, X.; Papachristos, G. Effect of Green Finance on the Green Transformation of China’s Building Sector: A System Dynamics Assessment for Targeted Financing Instruments and Policies. Energy 2025, 334, 137845. [Google Scholar] [CrossRef]
  21. Pedersen, L.H. Carbon pricing versus green finance. J. Financ. 2026, 81, 561–602. [Google Scholar] [CrossRef]
  22. Chen, X.; Zhang, M. Carbon emission trading market: International experience, Chinese characteristics and policy suggestions. Shanghai Financ. 2022, 22–33. [Google Scholar]
  23. Ye, S.; Dai, P.F.; Nguyen, H.T. Is the cross-correlation of EU carbon market price with policy uncertainty really being? A multiscale multifractal perspective. J. Environ. Manag. 2021, 298, 113490. [Google Scholar] [CrossRef]
  24. Wang, T.; Zhang, X.; Ma, Y. Risk contagion and decision-making evolution of carbon market enterprises: Comparisons with China, the United States, and the European Union. Environ. Impact Assess. Rev. 2023, 99, 107036. [Google Scholar] [CrossRef]
  25. Künar, A.; Uyar, T.S.; Bilto, M. ESCO and EPC models for energy efficiency transformation. In Renewable Energy Based Solutions; Uyar, T.S., Javani, N., Eds.; Springer International Publishing: Berlin/Heidelberg, Germany, 2022; pp. 241–272. [Google Scholar]
  26. Gan, L. Research on the Impact of Tertiary Industry Development on Carbon Emissions of Public Buildings and Total Carbon Emission Allocation. Doctoral Dissertation, Chongqing University, Chongqing, China, 2025. [Google Scholar]
  27. Ye, C. Impact of green finance on regional carbon emissions. J. Chang. Financ. Coll. 2024, 37–47. [Google Scholar]
  28. Zhang, Y. Current situation, restrictive factors and policy suggestions of financial support for green building development. Financ. Perspect. J. 2019, 76–83. [Google Scholar]
  29. Ma, J.; Shao, D.; Xu, J. How green finance can effectively support green buildings. Constr. Sci. Technol. 2020, 23–26, 31. [Google Scholar]
  30. Cui, W. Research on Strategic Decision-Making of Energy-Saving Renovation of Existing Buildings: Taking Office Buildings in Hot Summer and Cold Winter Areas as an Example. Doctoral Dissertation, Chongqing University, Chongqing, China, 2024. [Google Scholar]
  31. Wang, S.; Wang, S.; Cheng, Y. How do heterogeneous green financial policy tools affect pollution emission reduction of enterprises? Financ. Res. Lett. 2025, 77, 107121. [Google Scholar] [CrossRef]
  32. Niu, J.; Xin, B.; Xin, B. Research on the coordinated development of provincial urbanization and carbon emission efficiency of construction industry in China. Carbon Balance Manag. 2024, 19, 12. [Google Scholar] [CrossRef] [PubMed]
  33. Mastrucci, A.; Zhong, X.; Maczek, F. Circular strategies for building sector decarbonization in China: A scenario analysis. J. Ind. Ecol. 2024, 28, 1089–1102. [Google Scholar] [CrossRef]
  34. Weng, Z.; Song, Y.; Ma, H.; Ma, Z.; Liu, T. Forecasting energy demand, structure, and CO2 emission: A case study of Beijing, China. Environ. Dev. Sustain. 2023, 25, 10369–10391. [Google Scholar]
  35. Zhang, X.L.; Huang, X.D.; Zhang, D.; Geng, Y.; Tian, L.X.; Fan, Y.; Chen, W.Y. Research on Energy and Economic Transition Paths and Policies Under the Carbon Neutrality Goal. Manag. World 2022, 38, 35–66. [Google Scholar] [CrossRef]
  36. Liu, J.; Zhang, X.; Song, X. Regional carbon emission evolution mechanism and its prediction approach driven by carbon trading—A case study of Beijing. J. Clean. Prod. 2018, 172, 2799–2810. [Google Scholar] [CrossRef]
  37. Strefler, J.; Kriegler, E.; Bauer, N.; Luderer, G.; Pietzcker, R.C.; Giannousakis, A.; Edenhofer, O. Alternative carbon price trajectories can avoid excessive carbon removal. Nat. Commun. 2021, 12, 2264. [Google Scholar] [CrossRef] [PubMed]
  38. Giraudet, L.G.; Guivarch, C.; Quirion, P. Exploring the potential for energy conservation in French households through hybrid modeling. Energy Econ. 2012, 34, 426–445. [Google Scholar] [CrossRef]
  39. Department of Energy Statistics, National Bureau of Statistics of China. China Energy Statistical Yearbook 2023; China Statistics Press: Beijing, China, 2024.
  40. Beijing Municipal Commission of Housing and Urban-Rural Development. Public Notice on the 2025 Demonstration Projects of Beijing’s Building Green Development Reward Fund (Energy-Saving and Green Renovation of Public Buildings). Available online: https://www.bcebca.org.cn/ShowPolicy.aspx?id=14645 (accessed on 8 April 2026).
  41. DB11/T 1971-2022; Technical Specifications for the Construction of Energy-Saving Projects in Ultra-Low Energy Consumption Residential Buildings. Beijing Municipal Commission of Housing and Urban-Rural Development: Beijing, China, 2022.
  42. Zhou, H.; Lin, B.; Liu, J. Discussion on key technologies for green building and building energy conservation development based on expert scoring. Build. Energy Effic. 2019, 47, 139–145. [Google Scholar]
  43. Zhu, X.; Liu, S.; Zhang, S. Investigation on current situation of air conditioning system of office buildings in Beijing and analysis of energy-saving renovation potential. Archit. Technol. 2024, 55. [Google Scholar] [CrossRef]
  44. Xu, Y. Beijing launches 10-billion-yuan “Jinglvtong” special rediscount to guide financial resources to support carbon reduction. China Business News, 2021; p. A07.
  45. Si, B.; Wang, J.; Yao, X. Multi-objective optimization design of a complex building based on an artificial neural network and performance evaluation of algorithms. Adv. Eng. Inform. 2019, 40, 93–109. [Google Scholar] [CrossRef]
  46. Henderi, H.; Wahyuningsih, T.; Rahwanto, E. Comparison of min-max normalization and Z-score normalization in the K-nearest neighbor (kNN) algorithm to test the accuracy of types of breast cancer. Int. J. Inform. Inf. Syst. 2021, 4, 13–20. [Google Scholar] [CrossRef]
  47. Hager, R.; Chang, C.S. Gyrokinetic neoclassical study of the bootstrap current in the tokamak edge pedestal with fully non-linear coulomb collisions. Phys. Plasmas 2016, 23, 042503. [Google Scholar] [CrossRef]
  48. Fan, E. Extended tanh-function method and its applications to nonlinear equations. Phys. Lett. A 2000, 277, 212–218. [Google Scholar] [CrossRef]
Figure 1. Changes in carbon emissions from civilian buildings in Beijing, 2010–2022.
Buildings 16 02974 g001
Figure 2. Changes in energy from civilian buildings in Beijing, 2010–2022.
Buildings 16 02974 g002
Figure 3. Schematic diagram of the synergistic mechanism between carbon pricing and green finance in building operational decarbonization.
Buildings 16 02974 g003
Figure 4. Relationship between the original MESSAGEix-Buildings and the extended model in this paper.
Buildings 16 02974 g004
Figure 5. Sensitivity analysis of the green finance subsidy discount coefficient (8%, 12%, and 16%). The results demonstrate that moderate variations in the discount coefficient produce only minor changes in carbon emission reduction, end-use energy reduction, and relative total system cost, thereby confirming the robustness of the selected baseline parameter (12%).
Buildings 16 02974 g005
Figure 6. Sensitivity analysis of the carbon price pathway. The left panel illustrates the influence of different annual carbon price growth rates (1%, 1.5%, and 2%) with the initial carbon price fixed at $50/tCO2, while the right panel compares different initial carbon price levels ($10, $30, and $50/tCO2) with the annual growth rate fixed at 2%. The results demonstrate that higher carbon prices and faster growth rates generally lead to greater emission reductions, while the principal conclusions of the proposed policy framework remain robust across the examined parameter ranges.
Buildings 16 02974 g006
Figure 7. Carbon emission trajectories of Beijing’s civil buildings during the operational phase under different policy scenarios (2020–2050).
Buildings 16 02974 g007
Figure 8. Energy consumption trends of civil building terminals in Beijing under different policy scenarios from 2020 to 2050.
Buildings 16 02974 g008
Figure 9. The evolution trend of new investment scale in Beijing’s civil buildings under different policy scenarios from 2020 to 2050.
Buildings 16 02974 g009
Figure 10. Marginal benefits of green finance under different study periods. The results show that the marginal carbon emission reduction reaches its maximum during 2030–2035, after which a clear turning point is observed, followed by a sustained decline in incremental emission reduction benefits. Meanwhile, the marginal investment cost savings exhibit their first evident deceleration during the same period and continue to increase at a progressively slower rate thereafter. These findings quantitatively identify 2030–2035 as the critical turning interval, confirming the existence of diminishing marginal benefits associated with green finance.
Buildings 16 02974 g010
Table 1. Module Configuration of the MESSAGEix-Buildings Extension Model in This Study.
Module NameCore Functions
Energy Demand ModuleBased on historical energy consumption data of civil buildings in Beijing, it accounts for the temporal evolution of end-use energy service demand including heating, cooling, lighting and other needs by energy consumption scenarios.
Technology Activity and Capability ModuleThree categories of core low-carbon technologies, namely building envelope renovation, heating and cooling system upgrade, and renewable energy application, are included. Parameters such as technical service life, efficiency and cost are set to simulate the technology substitution process.
Carbon Market and Green Finance Mapping ModuleThe two types of policies are explicitly parameterized and embedded into the model optimization process to realize the endogenous simulation of policy effects.
Table 2. Core scenario settings.
Scenario NameCore ParametersScenario Definition
Baseline ScenarioNo additional carbon emission constraints, no supporting green financial incentivesTo measure the carbon emission evolution inertia and full life cycle cost trajectory of Beijing’s building operation sector under the existing technology system and established investment scale
Carbon Market ScenarioBased on the carbon price of 50 USD per tonne of CO2 in 2020, with a steady annual increase rate of 2% thereafterTo raise the marginal cost of high-carbon energy consumption through carbon price signals and quantitatively evaluate the indirect regulatory effect of supply-side carbon emission constraints on emissions in the building operation sector
Green Finance ScenarioFinancing cost of green low-carbon projects reduced by 30%, and operating cost of energy-saving low-carbon equipment reduced by 12%To lower the promotion threshold of end-use low-carbon technologies and measure the driving effect of relaxed demand-side capital constraints on building energy efficiency retrofit upgrading
Synergistic Policy ScenarioSimultaneously implement carbon price regulation constraints and green financial incentive policiesTo evaluate the marginal emission reduction gain, cost synergy effect and long-term emission reduction potential of the combined implementation of the two types of policies
Table 3. Key simulation parameters and settings.
Category/SettingValue
RegionBeijing, China
Building TypePublic Buildings
Energy CarrierElectricity, Natural Gas, Petroleum, District Heating
Table 4. Emission reduction and energy consumption performance of different scenarios relative to the baseline scenario.
YearScenario NameCO2 Emission Reduction Rate (vs. Baseline, %)Energy Consumption Reduction Rate (vs. Baseline, %)Investment Saving Rate (vs. Baseline, %)
2030Carbon Market3.171.543.28
Green Finance0.57−0.076.00
Synergistic Policy3.752.709.09
2050Carbon Market11.441.5212.17
Green Finance2.163.8314.59
Synergistic Policy15.946.2017.44
Table 5. Results of multi-objective performance evaluation.
Scenario Name2030 End-Use Energy2050 End-Use Energy2030 CO2 Emission2050 CO2 Emission2050 InvestmentComprehensive ScoreRanking
Synergistic Policy2.706.203.7515.9417.4491.641
Carbon Market1.541.523.1711.4412.1778.612
Green Finance−0.073.830.572.166.0027.153
Baseline0.000.000.000.000.0014.354
Disclaimer/Publisher’s Note: The statements, opinions and data contained in all publications are solely those of the individual author(s) and contributor(s) and not of MDPI and/or the editor(s). MDPI and/or the editor(s) disclaim responsibility for any injury to people or property resulting from any ideas, methods, instructions or products referred to in the content.