Article

Occupant-Centred Acoustic Assessment of Teachers’ Responses to Sound Sources in a Secondary School


1
School of Architecture and Urban Planning, Shenyang Jianzhu University, Shenyang 110168, China
2
Liaoning Key Laboratory of Eco-Building Physics Technology and Evaluation, Shenyang Jianzhu University, Shenyang 110168, China
3
School of Science, Shenyang Jianzhu University, Shenyang 110168, China
*
Author to whom correspondence should be addressed.
Buildings 2026, 16(14), 2894; https://doi.org/10.3390/buildings16142894
Submission received: 27 June 2026 / Revised: 13 July 2026 / Accepted: 17 July 2026 / Published: 21 July 2026
(This article belongs to the Section Building Energy, Physics, Environment, and Systems)

Abstract

The acoustic quality of a school’s indoor environment affects the health, performance and comfort of the teachers who work in it, yet assessment often reduces that environment to a single overall level. In a cross-sectional case study of one secondary school in China, all 148 teachers rated eleven school sound-source categories on audibility, annoyance and interference with teaching and office concentration, and reported perceived noisiness, voice raising, voice strain, fatigue, emotional distress and noise sensitivity, while selected-room acoustic measurements provided site context not matched to individual respondents. Ratings across the eleven sources were dominated by one component, but the resulting composite score was not associated with all teacher responses alike. Source load was associated with emotional distress, voice raising and perceived noisiness but not fatigue, which instead tracked voice strain, whereas emotional distress was associated most strongly with noise sensitivity. In exploratory source-specific models, traffic and other external sources had the largest associations with perceived noisiness, whereas playground activity and student talking had the largest associations with voice raising. No tested subgroup interaction survived false-discovery-rate correction. The selected-room measurements documented conditions compatible with source intrusion and raised vocal effort. The findings support an occupant-centred, source-resolved approach to school indoor acoustics and provide hypotheses for future multi-school testing.

1. Introduction

The acoustic environment of schools shapes how effectively teaching and learning can take place. Classrooms combine intermittent internal activity with intrusion from outside, and the resulting background noise and reverberation degrade speech intelligibility throughout a room [1,2]. The two degrade speech together, since reverberation smears it in time while noise masks it, so a room that is adequate when empty can become demanding once it is occupied and active [3,4]. Field measurements in occupied classrooms repeatedly find noise levels and reverberation times above the values recommended for comfortable listening, across primary, secondary and university settings [5,6], and speech-transmission and reverberation criteria for classrooms have been formalised precisely because these conditions are so often unmet [1]. For children, whose linguistic and attentional systems are still maturing, the costs are measurable, in speech perception, verbal working memory and reading [7,8]. Background noise has been tied to poorer reading and to lapses in classroom attention [9,10], exposure to traffic noise around schools to slower cognitive development [11], and acoustic comfort to pupils’ engagement and well-being [12,13]. School acoustic design guidance has expanded in step with this evidence [14], yet that guidance, like the research behind it, is written largely around the pupil who learns, with far less attention to the teacher who must produce speech throughout the day.
Teachers spend much of their working day in classrooms, and they face a demand the pupils do not: they must produce intelligible speech for hours each day, often against the very noise that degrades it. They are accordingly recognised as professional voice users at high occupational risk, with voice-disorder prevalence well above that of the general working population [15,16]. Because teaching is among the largest of all occupations, the public-health footprint of teacher voice disorders is correspondingly wide. The resulting dysphonia is common, persistent and costly to treat, with consequences for sickness absence and career as well as for health [17,18], and it falls most heavily on women, who both predominate in teaching and report more voice problems [16]. Its documented risk factors include cumulative vocal load, classroom noise and unfavourable room acoustics [19,20], and teachers’ personal noise exposure has itself been measured in schools, documenting sustained raised levels across the working day [21]. Surveys comparing teachers with other occupations find more frequent voice complaints among teachers and associate them with the conditions of the job [22,23], with the highest risk where vocal load is greatest, such as teaching young or large classes [24]; the same burden appears among Chinese teachers [25]. One plausible behavioural route involves vocal effort: as background noise rises, speakers raise their voices to stay intelligible, an adjustment that is largely involuntary, so that sustained raising across a working day may contribute to vocal strain.
Teachers’ responses to the school sound environment are not confined to the voice. Noise acts as a general occupational stressor that erodes well-being [26], and teaching already carries a heavy load of emotional demand and documented burnout [27,28], with vocal problems and emotional exhaustion tending to co-occur in this workforce [29]. In the wider population the most widespread reaction to environmental noise is annoyance [30], a negative affective state that is itself associated with poorer mental health [31]; the pathway is generally read as a stress response, in which repeated appraisal of sound as intrusive sustains emotional arousal [32]. The same physical exposure, though, provokes markedly different reactions across individuals. Noise sensitivity, a stable personal trait reflecting general reactivity to sound, moderates the relationship between noise and both annoyance and health, so that sensitive individuals suffer more at a given level of exposure [33,34]. Validated instruments make the trait measurable, including in Chinese samples [35], so that susceptibility can be treated as a variable rather than assumed away; in schools specifically, teachers’ noise sensitivity has been linked to how they appraise school noise and to their efforts to prevent it [36]. An account of how teachers respond to school sound should therefore weigh individual susceptibility alongside the exposure itself.
How sound is appraised depends on what is heard, not only on how loud it is. A soundscape perspective places the meaning and source of sound at the centre, treating perception as organised around recognisable sources and the context in which they occur [37,38]. On this view the composition of the sound environment governs appraisal in workplaces and other indoor settings as strongly as the overall level does [39,40], so that two environments of equal loudness can be judged very differently according to which sources fill them. Even the affective language people use to describe sound can be culturally specific, so findings do not transfer unaltered between languages [41]. Schools hold an unusually mixed set of sources, from traffic and construction outside the building, through playground and corridor activity on the campus, to talking and movement in adjacent rooms, and each is likely to be appraised differently; road traffic and other external sources have been documented as major contributors at school sites since early field surveys [42]. Classroom acoustics have already been linked to teachers’ vocal load and to vocal and cognitive fatigue [43], evidence consolidated in recent reviews of classroom acoustic conditions, learning and teacher health [44,45], and teachers’ own soundscapes have begun to be surveyed directly [46,47]. What this evidence has not done is resolve the specific sources of school sound and map each onto the reported response with which it is most strongly associated. Assessment still typically collapses the environment into one overall level, even though the sources that fill a school differ in where they originate and in what they demand of a teacher, so a single metric cannot distinguish these source-specific association patterns.
This study addresses that gap through a cross-sectional case study of one secondary school in China. Every teacher on the staff completed a questionnaire that asked how often each of eleven categories of school sound was heard, how annoying it was, and how much it interfered with teaching and with office concentration, together with short measures of perceived noisiness, voice raising, voice strain, fatigue, emotional distress and noise sensitivity; acoustic measurements in selected classrooms and an office describe the rooms these teachers work in, though they are not matched to individual respondents. Four questions organise the analysis: whether the eleven sources cohere into an interpretable overall source load; which teacher responses that load is associated with; whether exploratory source-specific models show different leading associations; and whether any tested association differs across teacher subgroups defined by gender, age, experience, teaching hours and homeroom role. Complete staff participation gives comprehensive within-school coverage, while the single-school design leaves between-school variation for future study. The contribution is an occupant-centred, source-resolved map of associations within one school and a set of hypotheses for multi-school research.

2. Materials and Methods

2.1. Study Design and Data Source

This cross-sectional study analysed a teacher questionnaire dataset and selected-room acoustic measurements from Fushun No. 50 Middle School, a secondary school in the central Xinfu District of Fushun, Liaoning, China. The school operates a main campus and a branch campus with three teaching buildings in total. The main campus occupies a dense city-centre site bordered by local roads on three sides, with residential and educational neighbours; its South Building, in which the acoustic measurements were made, faces residential buildings across two-lane roads to the east and south and a primary school across a fence to the west. The unit of questionnaire analysis is the teacher, and the objective measurements provide site context for interpreting the questionnaire findings.
The questionnaire was distributed online through Wenjuanxing over four days to all teachers at the school. All 148 returned questionnaires were complete and valid, with no duplicate respondents and no out-of-range values. The respondents span all three teaching sites: 36 Grade 7 teachers at the branch campus and 66 Grade 8 and 46 Grade 9 teachers in the main-campus South and North Buildings, respectively.
The study was approved by the Ethics Committee of the School of Architecture and Urban Planning, Shenyang Jianzhu University (No. 20200305). All participating teachers were informed of the study purpose, data use and anonymisation, and gave informed consent before completing the questionnaire anonymously.

2.2. Questionnaire Measures

The questionnaire recorded five demographic or work variables: gender, age group, teaching-experience group, weekly teaching-hours group and homeroom-teacher status. The response variables retained for analysis were perceived noisiness, voice raising, amplification-device use, voice strain, self-reported fatigue, emotional distress and noise sensitivity. Perceived noisiness was a single 1–5 item rating the noisiness of the teacher’s own teaching area. Voice raising was a single 1–5 frequency item asking whether teachers needed to raise their voice so that others could hear clearly. Voice strain was the mean of three 1–6 symptom-frequency items concerning hoarseness, throat pain and difficulty phonating. Emotional distress was the mean of two 1–5 items concerning anxiety and annoyance attributed to the auditory environment. Other multi-item constructs were also scored as the mean of their recorded items. Noise sensitivity was kept in the recorded direction because the item-total correlations did not support reversing the third item.
Teachers rated 11 school sound-source categories on four dimensions: audibility, annoyance, interference with teaching and interference with office concentration. Source-specific means were computed by averaging the four dimensions for each source, and the overall source-load score was the equal-weight mean of the 11 source-specific means, so that all 44 source ratings contribute equally. This transparent equal-weight index was the primary source score in every adjusted model. Because annoyance and the two interference ratings are evaluative rather than purely perceptual, the score represents perceived source burden rather than objective acoustic exposure, and it was analysed alongside an audibility-only sensitivity score defined as the equal-weight mean of the 11 frequency-heard ratings (Section 2.4). Source-by-dimension descriptives, scale reliability and the source parallel-analysis details are provided in Supplementary Tables S1–S3.

2.3. Selected-Room Acoustic Measurement Protocol

The site measurement record describes selected classrooms and an office in the main-campus South Building, built in 2007. The empty-room background-noise, reverberation, airborne-separation and floor-impact measurements were all made on 21 January 2022, a weekday during the winter school vacation, when the measured rooms were unoccupied and the adjacent classrooms, corridors and campus were not in use. Background noise and the airborne-separation and floor-impact levels were received with a Class 1 sound level meter (2250L; Brüel & Kjær (B&K), Nærum, Denmark). Reverberation was measured with a B&K Dirac room-acoustic system comprising a 2734-A-001 power amplifier, a 4292-L dodecahedral omnidirectional source, a ZE-0948 audio interface, a 1704-A-002 conditioning amplifier and a 4189 microphone, run from Dirac 6.0 software; the same source and amplifier generated the airborne-separation test signal, and floor impact sound was generated with a B&K 3207 tapping machine. Each receiver, including the binaural microphone used in the one-teacher-day record below, was calibrated immediately before its measurement set with a B&K 4231 sound calibrator (1 kHz pure tone); post-measurement drift checks were not performed.
The measurement positions for every test are shown in Supplementary Figure S1, reproduced from the original field record. Empty-room background noise was measured at nine positions per classroom in classrooms on three floors and in a third-floor office, with a 1 min reading per position and doors and windows jointly open or closed and building equipment operating. Classroom reverberation measurements used a source height of 1.5 m and a microphone height of 1.2 m at nine positions, with two readings per position and a per-band signal-to-noise ratio above 15 dB. The office reverberation measurements used two source positions and seven microphone positions, also with two readings per position; both source and microphone heights were 1.2 m. All reverberation measurements were made with doors and windows closed and the lighting, projector, air conditioning and computers operating. Classroom-to-classroom and classroom-to-corridor field airborne-separation tests used two source positions, with the source 1.5 m high and at least 0.5 m from a wall, and five microphone positions in each source and receiving space, with 30 s readings repeated twice. The received test signal was at least 10 dB above background in every frequency band, and the classroom-to-corridor test used a source-to-microphone separation of at least 1 m. The classroom-to-classroom test compared untreated door gaps with the same gaps sealed using adhesive tape; the door itself and the windows were closed in both conditions and in the classroom-to-corridor test. The floor-impact measurement used four tapping-machine positions in the room above the selected office and six receiver positions in the office, with 30 s readings repeated twice; both rooms were unoccupied with doors and windows closed.
The occupied classroom and office levels came from a separate one-day observation of one teacher on a normal teaching day (16 November 2021), recorded with a B&K 4101-A binaural microphone and a SQuadriga II acquisition front end (HEAD acoustics GmbH, Herzogenrath, Germany) over five classroom and three office sessions between 08:00 and 17:00. The measurement record does not identify the standardised airborne-separation descriptor unambiguously, so the separation values are reported without assigning one. These measurements were not matched to individual questionnaire respondents or entered as respondent-level predictors.

2.4. Statistical Analysis

All respondent-level analyses used complete cases because the questionnaire data had no missing values. Continuous questionnaire scores were standardised before regression. Descriptive construct associations were examined with Spearman correlations and bootstrap confidence intervals. The source-measurement structure was examined with principal-component summaries and parallel analysis.
Adjusted linear models used HC3 robust standard errors and included gender, age group, weekly teaching-hours group and homeroom-teacher status as controls. The central source-load models estimated the association of overall source load and noise sensitivity with each response or health-related outcome. The voice-health models included overall source load, noise sensitivity, voice raising, amplification-device use and voice strain simultaneously. Source-specific screens fitted one adjusted model per source and outcome. These one-source-at-a-time screens were exploratory because correlated sources can co-occur and their coefficients do not represent mutually independent effects. Two sensitivity models addressed this dependence. A simultaneous source-family model included external sources (construction, traffic and neighbourhood activity), campus or nearby activity (playground, corridor, adjacent-classroom and upstairs-classroom activity), own-classroom activity (student talking and furniture moving), and equipment sources. A post hoc four-source model included traffic, construction, playground activity and student talking simultaneously. Because the primary source score mixes audibility with evaluative annoyance and interference ratings, a further sensitivity analysis repeated the central, voice-health and source-specific models with the audibility-only score replacing the overall source-load index. For these screens and model families, false-discovery-rate control used the Benjamini–Hochberg procedure, reported as q values. All statistical analyses were performed in R version 4.5.3 (R Foundation for Statistical Computing, Vienna, Austria).
Exploratory boundary checks tested whether the main source-load and voice-strain associations differed by noise-sensitivity group, homeroom role, weekly teaching hours, age, teaching experience or gender. Descriptive profiles were estimated from source load, noise sensitivity, voice raising, voice strain, fatigue and emotional distress. These profile and boundary analyses were treated as supporting checks because their purpose was to locate possible heterogeneity, not to define primary claims.

3. Results

3.1. Teachers Reported a Broad School Sound-Source Load

The analysis sample comprised 148 teachers with complete questionnaire data. Most respondents were female (109, 73.6%), aged 46 years or older (92, 62.2%) and had at least 21 years of teaching experience (97, 65.5%). A total of 82 teachers (55.4%) taught at least 10 lessons per week and 34 (23.0%) were homeroom teachers. The multi-item constructs were internally consistent, with Cronbach’s alpha ranging from 0.72 for noise sensitivity to 0.93 for emotional distress. Mean scores were 3.10 for noise sensitivity, 3.74 for voice strain, 3.87 for fatigue, 2.94 for emotional distress, 3.01 for perceived noisiness and 3.06 for voice raising (Table 1).
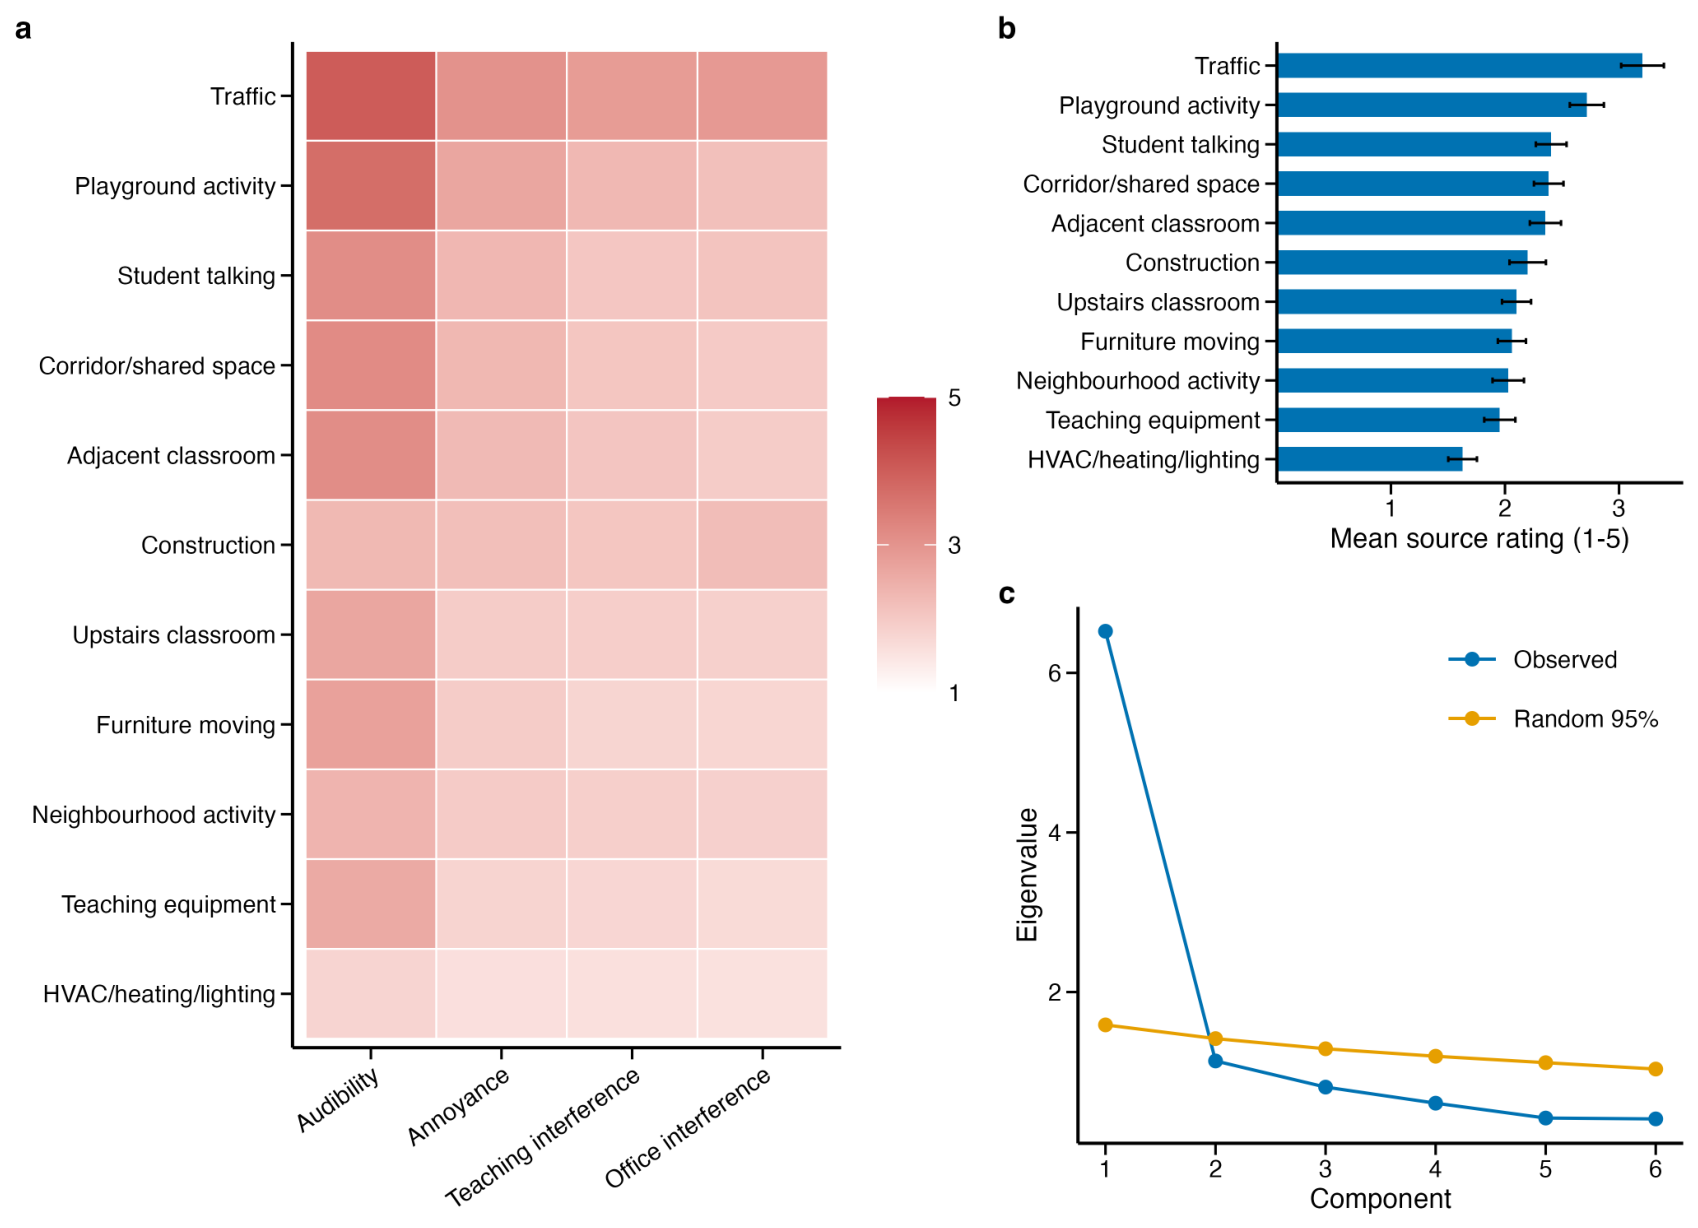
The source ratings provided the first substantive finding. Traffic had the highest overall source mean (3.21), followed by playground activity (2.72), student talking (2.41), corridor or shared-space activity (2.38) and adjacent-classroom activity (2.35; Figure 1a,b). These leading sources spanned external, campus and within-building activity, so the reported burden was not confined to one origin.
Parallel analysis supported a compact overall source-load summary. The first source component had an eigenvalue of 6.52 and explained 59.3% of variance, while every later component fell below the random 95th-percentile threshold (Figure 1c). At construct level, the overall source score was most tightly linked to annoyance, teaching interference and office-concentration interference, while emotional distress grouped more closely with noise sensitivity and voice-related responses (Supplementary Figure S2 and Table S4).

3.2. Associations Differed Across Emotional, Vocal and Fatigue Outcomes

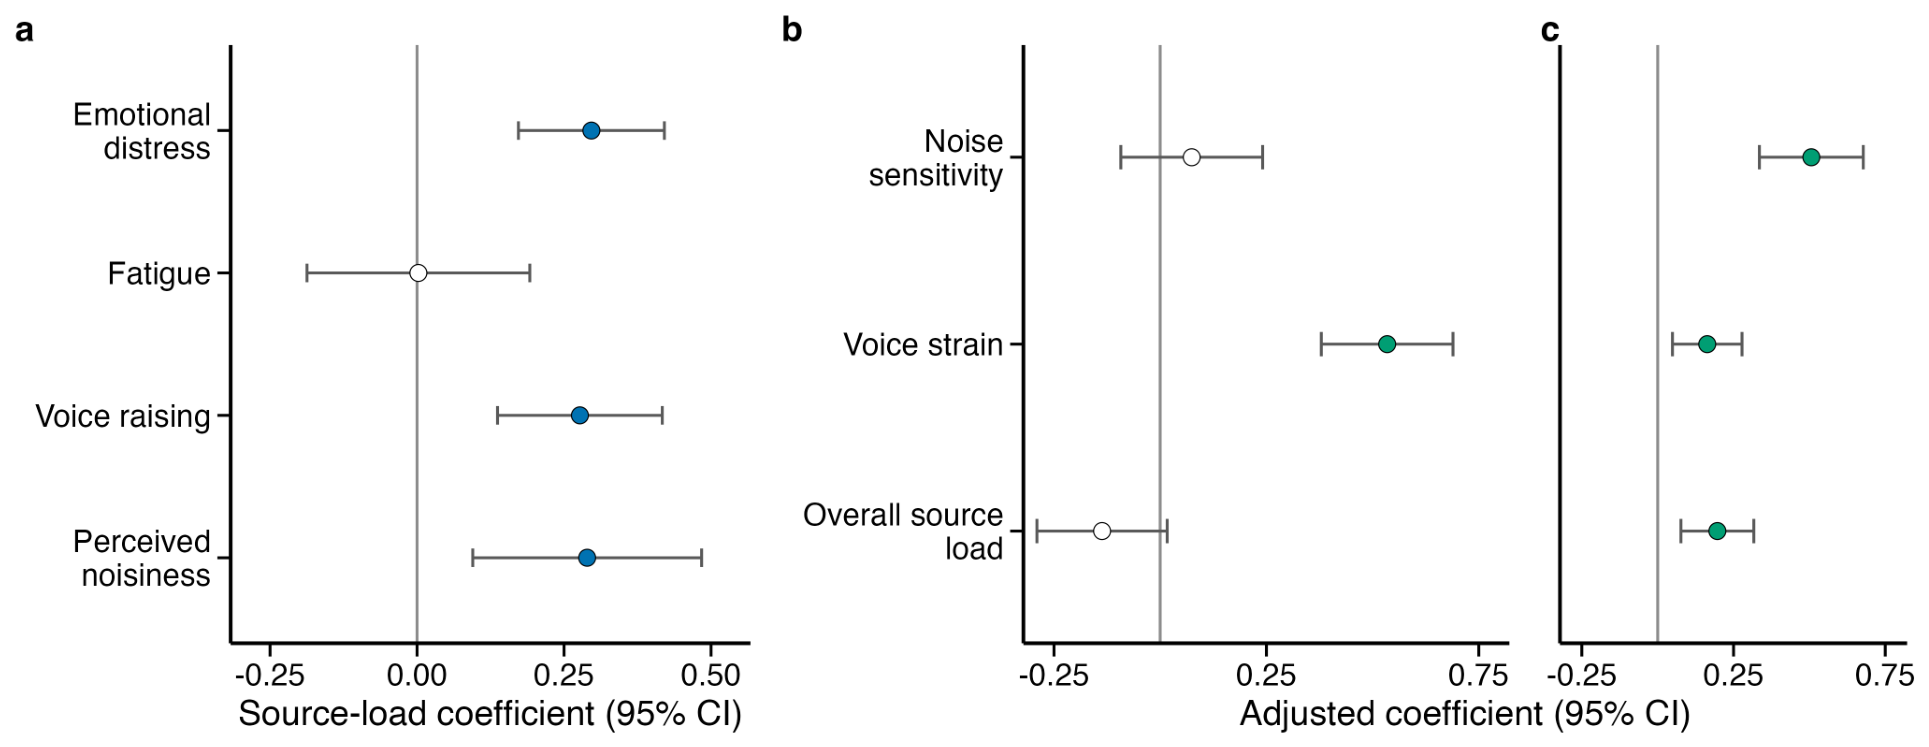
Overall source load showed a selective association pattern after adjustment for teacher characteristics. It was associated with emotional distress ( β = 0.30 , 95% CI 0.17 to 0.42, q < 0.001 ), voice raising ( β = 0.28 , 95% CI 0.14 to 0.42, q < 0.001 ) and perceived noisiness ( β = 0.29 , 95% CI 0.09 to 0.48, q = 0.027 ), while the fatigue coefficient was centred on zero ( β = 0.00 , 95% CI 0.19 to 0.19, q = 1.000 ; Table 2; Figure 2a).
When voice strain was added to the health-related models, the fatigue boundary became clearer. Voice strain was strongly associated with fatigue ( β = 0.53 , 95% CI 0.38 to 0.69, q < 0.001 ), while overall source load showed no corresponding positive association. Emotional distress followed a different pattern: noise sensitivity was the largest coefficient ( β = 0.51 , 95% CI 0.34 to 0.68, q < 0.001 ), overall source load remained associated after adjustment ( β = 0.20 , 95% CI 0.08 to 0.32, q = 0.007 ), and voice strain was also associated ( β = 0.16 , 95% CI 0.05 to 0.28, q = 0.019 ). Full focal coefficients are reported in Supplementary Table S5.
The audibility-only sensitivity score reproduced the central boundary. Voice raising ( β = 0.24 , q = 0.006 ), amplification use ( β = 0.21 , q = 0.033 ) and emotional distress ( β = 0.17 , q = 0.029 ) remained associated with the audibility-only score, fatigue did not ( β = 0.04 , q = 0.807 ), and perceived noisiness narrowly missed the FDR threshold ( β = 0.22 , q = 0.062 ). In the audibility-only voice-health model, however, the adjusted emotional-distress association did not persist ( β = 0.07 , q = 0.387 ), so that association is specific to the evaluative burden composite. The audibility-only source screen retained the external-source association with perceived noisiness and the playground and student-talking associations with voice raising (Supplementary Tables S6 and S7).
The central association pattern therefore differed among teacher responses: source load aligned with emotional distress, voice raising and perceived noisiness, fatigue aligned primarily with voice strain, and noise sensitivity was the dominant correlate of emotional distress.

3.3. Exploratory Source-Specific Association Patterns

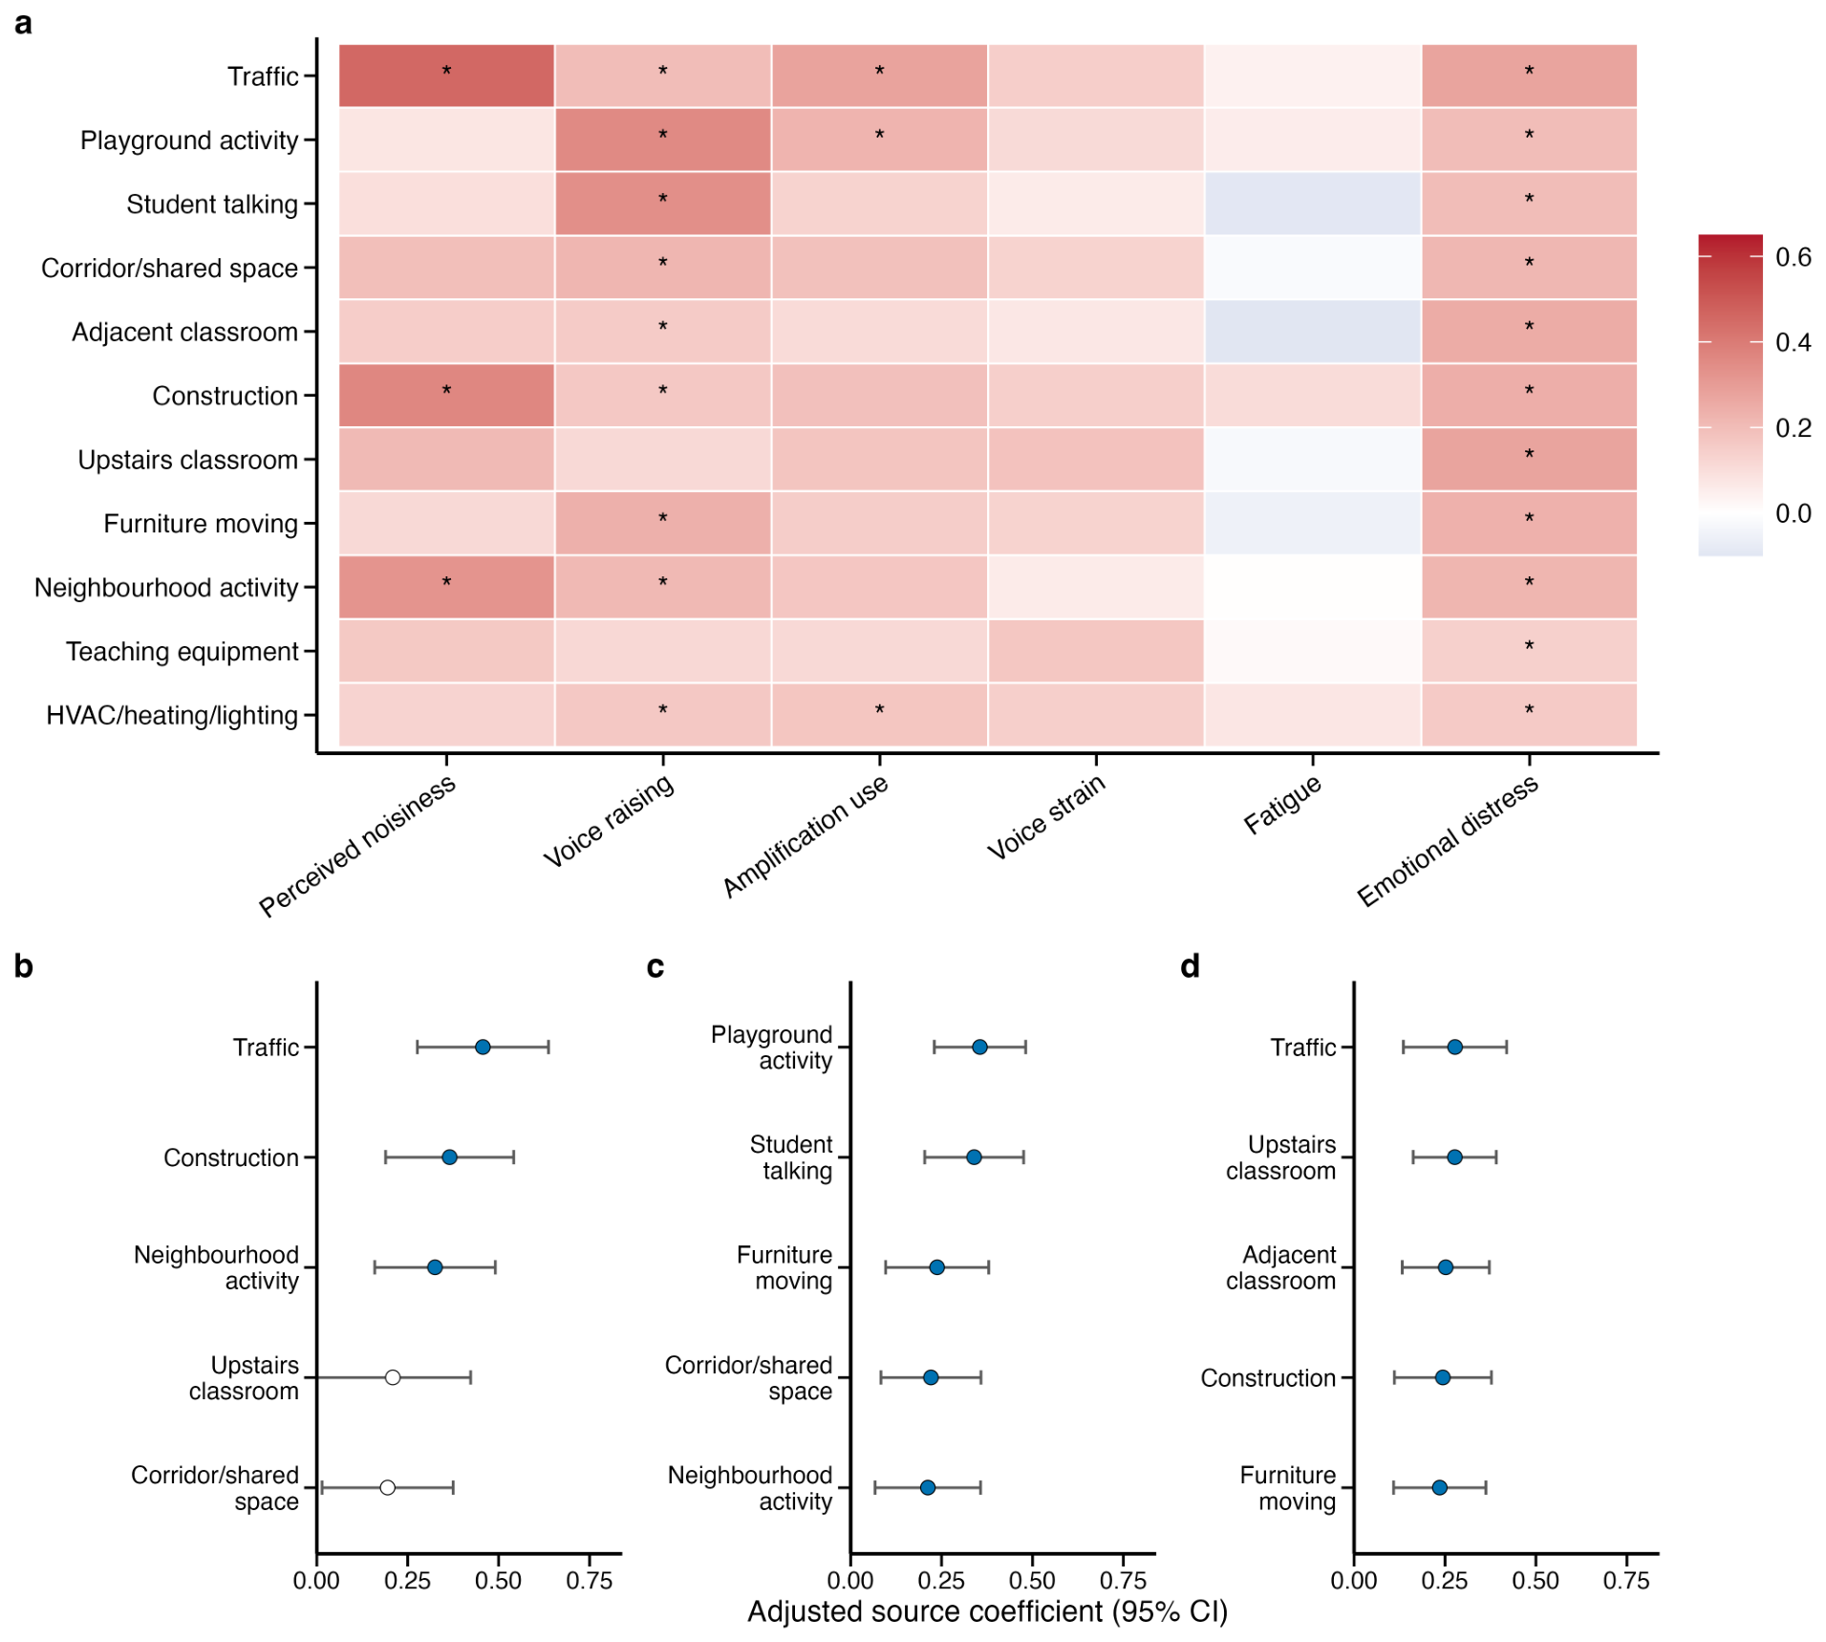
The exploratory one-source-at-a-time screen separated the outcomes by their leading marginal associations (Figure 3). These coefficients should not be interpreted as mutually independent source effects. Perceived noisiness was most clearly associated with external sources: traffic had the largest adjusted coefficient ( β = 0.46 , 95% CI 0.28 to 0.64, q < 0.001 ), followed by construction ( β = 0.37 , 95% CI 0.19 to 0.54, q < 0.001 ) and neighbourhood activity ( β = 0.33 , 95% CI 0.16 to 0.49, q < 0.001 ). Playground activity, student talking and most within-building sources did not carry FDR-significant noisiness coefficients.
Voice raising had a more teaching-proximal signature. Playground activity ( β = 0.36 , 95% CI 0.23 to 0.48, q < 0.001 ) and student talking ( β = 0.34 , 95% CI 0.20 to 0.48, q < 0.001 ) had the largest coefficients, with furniture moving, corridor or shared-space activity, neighbourhood activity, traffic, construction, adjacent-classroom activity and HVAC/heating/lighting also clearing FDR correction. Amplification-device use showed a narrower source-specific pattern: traffic, playground activity and HVAC/heating/lighting cleared FDR correction in the source screen, and overall source load was associated with amplification use in the central model ( β = 0.24 , 95% CI 0.09 to 0.39, q = 0.008 ; Supplementary Table S5).
Emotional distress was broader still in the marginal screen. Traffic was again one of the largest single-source associations ( β = 0.28 , 95% CI 0.14 to 0.42, q < 0.001 ), alongside upstairs-classroom activity ( β = 0.28 , 95% CI 0.16 to 0.39, q < 0.001 ), adjacent-classroom activity ( β = 0.25 , 95% CI 0.13 to 0.37, q < 0.001 ) and construction ( β = 0.24 , 95% CI 0.11 to 0.38, q < 0.001 ). All 11 sources had FDR-significant marginal associations with emotional distress, whereas none of the 11 source coefficients survived correction for fatigue or voice strain. The complete source-specific screen is reported in Supplementary Table S8.
The simultaneous sensitivity models narrowed these patterns. In the source-family model, the external-source family remained associated with perceived noisiness ( β = 0.58 , 95% CI 0.35 to 0.80, q < 0.001 ), while the own-classroom family remained associated with voice raising ( β = 0.35 , 95% CI 0.09 to 0.61, q = 0.046 ). In the post hoc four-source model, traffic remained associated with perceived noisiness ( β = 0.37 , 95% CI 0.16 to 0.57, q = 0.006 ), and playground activity ( β = 0.23 , 95% CI 0.09 to 0.37, q = 0.007 ) and student talking ( β = 0.20 , 95% CI 0.07 to 0.34, q = 0.012 ) remained associated with voice raising. No source family or source in the four-source model survived FDR correction for emotional distress (Supplementary Table S5).

3.4. No Subgroup Interaction Survived Multiplicity Correction

No tested interaction survived FDR correction across noise sensitivity, homeroom role, weekly teaching hours, age, teaching experience or gender. The lowest corrected values were still above the prespecified threshold, including the age and gender interactions for the source-load–voice-raising association ( q = 0.228 ). Stratified slopes were directionally similar for the main source-load and voice-strain associations, with wider intervals in smaller groups (Supplementary Figure S3 and Table S9). These non-significant interaction tests do not establish equivalence across groups.
The descriptive two-profile solution reproduced the same response-channel pattern without defining a hard typology. Compared with Profile 1 (52 teachers), Profile 2 (96 teachers) had higher source load (2.53 versus 1.81), noise sensitivity (3.59 versus 2.21), voice raising (3.69 versus 1.90) and emotional distress (3.64 versus 1.65). Fatigue and voice strain were also higher in Profile 2, but the differences were more modest for fatigue (4.03 versus 3.56) and voice strain (3.90 versus 3.44). Profile diagnostics are shown in Supplementary Figure S4 and Supplementary Table S10.

3.5. Selected-Room Acoustic Context

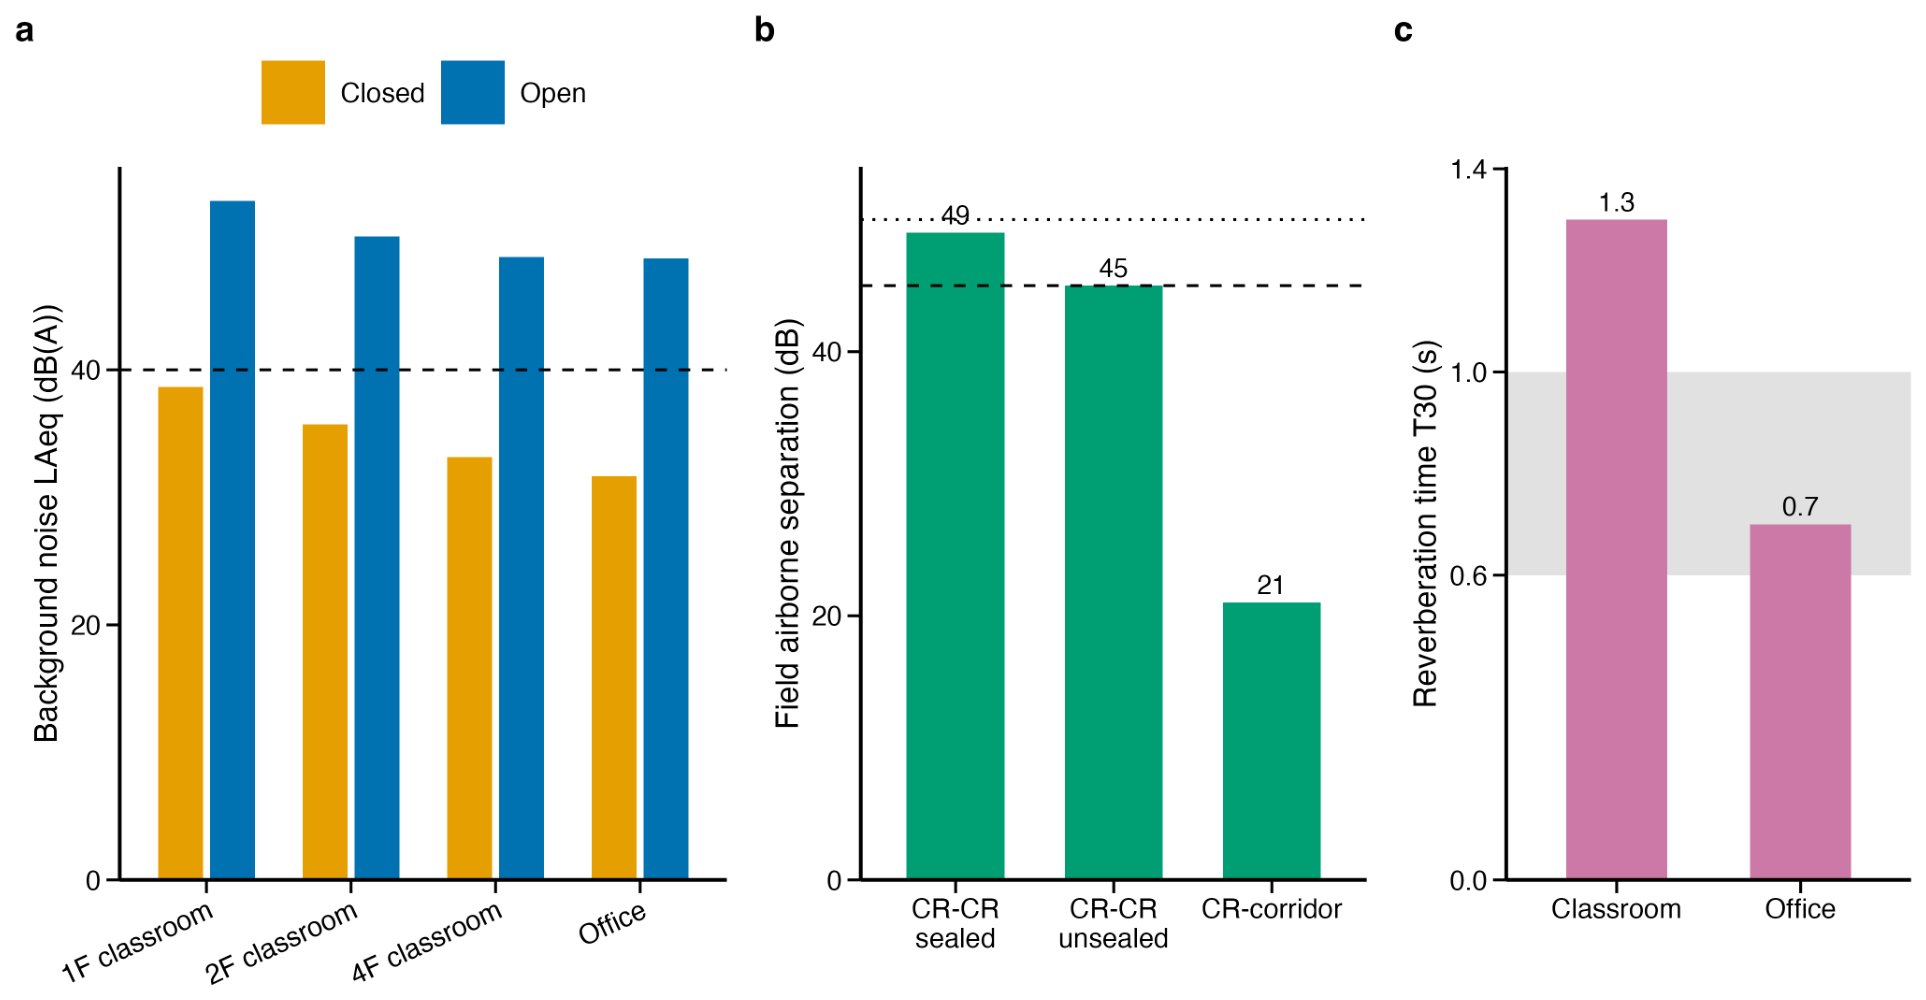
The objective site record supports the plausibility of source intrusion and speech-effort demands in the measured rooms. With doors and windows closed, classroom background-noise levels were 33.1 to 38.7 dB(A), within the cited 40 dB(A) high-requirement reference (GB 50118-2010 [48]). With doors and windows open, they rose to 48.8 to 53.3 dB(A), and the selected office was 48.7 dB(A). Separately, a one-day observation of one teacher gave approximate occupied levels of 66 dB(A) in a classroom and 55 dB(A) in an office (Table 3; Figure 4a).
Room-acoustic and airborne-separation measures provided two further contextual observations. First, classroom T 30 was 1.3 s compared with 0.7 s in the office, a condition consistent with greater vocal effort and poorer speech clarity. The measured rooms were selected as typical, untreated classrooms and offices of the building rather than for their acoustic quality, so the 1.3 s value records the as-found condition of an ordinary classroom in this building, well above the approximately 0.6–1.0 s reference band, and it motivates the room-treatment implication discussed in Section 4.2. Second, the classroom-to-corridor field airborne-separation value was 21 dB, well below the classroom–classroom comparator above 45 dB used in the measurement record; no corridor-specific criterion was applied. The classroom-to-classroom values were 45 dB with door gaps untreated and 49 dB after the gaps were tape-sealed, with the door itself and the windows closed in both conditions. The questionnaire asked about adjacent-classroom activity generally and did not record door position, so those ratings cannot be separated into open- and closed-door conditions. The full interpretive flag table is provided in Supplementary Table S11.

4. Discussion

Ratings across the eleven school sound sources were dominated by one component, but the composite score was not associated with all teacher responses alike. Overall source load was associated with emotional distress, voice raising and perceived noisiness, but not with fatigue; fatigue instead tracked voice strain, and emotional distress was associated most strongly with noise sensitivity. The audibility-only sensitivity score reproduced the vocal and fatigue pattern, while the fully adjusted emotional-distress association was specific to the evaluative burden composite. Exploratory source-specific models showed the largest perceived-noisiness associations for traffic and other external sources and the largest voice-raising associations for playground activity and student talking. Simultaneous sensitivity models retained these contrasts, whereas no source survived correction for emotional distress. No tested subgroup interaction survived correction, and the selected-room measurements described an acoustic setting compatible with source intrusion and raised vocal effort.

4.1. Separable Response Channels

The voice-raising pattern locates the strongest associations where the voice-health literature would expect them. Playground activity and student talking had the largest coefficients, although traffic and several other sources also survived correction in the marginal screen. The pattern is consistent with the Lombard mechanism and with evidence that teachers lift their voices to stay intelligible over nearby classroom and playground sound [5,20]. Because sustained and raised voicing is a principal risk factor for the voice disorders that are unusually common in this occupation [15,16], repeated voice raising is relevant to subsequent vocal strain and dysphonia [23,49]. The present cross-sectional associations do not establish that temporal progression.
A further boundary concerned fatigue. Once voice strain entered the models, overall source load carried no positive association with fatigue, which was associated most strongly with voice strain. This places fatigue closer to the effort of voicing than to the overall source rating in the present association structure. It fits work on listening-related fatigue, where perceived listening difficulty rather than measured level predicts fatigue [50,51], evidence that classroom noise and vocal load track teachers’ vocal symptoms and cognitive fatigue [43], and findings that prolonged voicing produces measurable vocal fatigue [52]. Room-acoustic treatment and control of competing activity are therefore candidate measures for reducing the need to raise the voice.
Emotional distress behaved differently again. It was associated with the widest set of individual sources and, after adjustment, most strongly with noise sensitivity, suggesting a larger role for individual susceptibility in this response. This is consistent with the established moderating role of noise sensitivity in the link between noise and health [33,34] and with evidence that sensitive individuals may react more strongly to the same sound [53,54]. The breadth of the source association is in keeping with annoyance as a general affective reaction to unwanted sound [30,31], and the trait’s tie to diminished well-being independent of exposure is well documented [55]. That vocal and emotional strain rose together echoes reports linking the two among teachers [29]. Noise sensitivity should therefore remain part of future teacher studies and be considered when interpreting self-reported distress.

4.2. Source Signatures and the Acoustic Setting

The division between external and own-classroom sources is the most actionable result. Perceived noisiness was most clearly tied to traffic and other external sources, matching the central place of transportation noise in environmental-noise annoyance [56,57] and its salience where roads adjoin occupied buildings [58,59], as they do on three sides of the present main campus; traffic around schools is itself a recognised exposure for the people inside [11,60]. Voice raising, by contrast, was most strongly associated with playground activity and student talking, and the office-concentration interference that teachers reported recalls the disruption from speech and activity noise documented in open-plan workplaces [39,61]. The selected-room measurements provide compatible site context: classroom reverberation near 1.3 s, a classroom-to-corridor field airborne-separation value far below the reference, and open-condition background levels above a common 40 dB(A) classroom criterion describe conditions in which intrusion and increased speech effort are plausible [1,2]. Because those measurements were not matched to teachers or rooms, they do not test the respondent-level associations.
Read together, the results argue for an occupant-centred and source-resolved view of the school sound environment alongside overall level. Assessment that records specific sources, proximal responses and noise sensitivity carries more design information than an aggregate metric alone [37,46]. The exploratory associations suggest distinct candidate actions: diagnosing façade and opening paths for traffic intrusion; testing door seals, partition junctions and corridor absorption for within-building sound; using spatial or temporal buffering between playground activity and instruction; reducing classroom reverberation through room-specific absorptive treatment; and evaluating voice-care or amplification support for teachers who repeatedly report voice raising or strain [14,20,43,49]. Their effectiveness should be tested prospectively. A short source-resolved questionnaire, a noise-sensitivity scale and room measurements could form part of a compact post-occupancy assessment after validation across schools.

4.3. Limitations and Strengths

Several limitations bound these readings. The data come from one secondary school and are cross-sectional and self-reported, so the associations describe co-occurring patterns rather than causal pathways and may share common-method variance. The primary source score is a perceived-burden composite whose annoyance and interference dimensions are themselves evaluative and may overlap conceptually with the outcome constructs; the audibility-only sensitivity analysis reproduced the vocal and fatigue pattern, but the fully adjusted emotional-distress association attenuated, so that association should be read as specific to evaluative burden rather than to how often sources were heard. The selected-room measurements were not matched to individual teachers, and the single perceived-noisiness item is necessarily coarse. School layout, façade conditions, classroom acoustics, traffic exposure, management and teacher demographics may differ elsewhere, so both the absolute values and the association structure require multi-school validation. A complete questionnaire return from every teacher is the corresponding strength: it provides comprehensive within-school coverage, although not external representativeness. Two extensions follow directly from these boundaries. The first is horizontal: repeating the source-resolved survey in schools that differ in layout, envelope condition, traffic exposure and management, to test whether the response channels replicate. The second is vertical: pairing the questionnaire with respondent-matched objective measurements, in which each teacher’s own classrooms and offices are measured, so that the relation between perceived source burden and measured exposure can be estimated directly rather than argued from site context.

5. Conclusions

In this single-school cross-sectional case study, the eleven sources formed one overall load, but the associations differed across teacher responses: source load aligned with emotional distress, voice raising and perceived noisiness, while fatigue was associated most strongly with voice strain and emotional distress with noise sensitivity. In exploratory models, external sources, chiefly traffic, had the largest associations with perceived noisiness, whereas playground activity and student talking had the largest associations with voice raising; simultaneous sensitivity models retained these contrasts. No tested subgroup interaction survived correction. Selected-room measurements of reverberation, airborne separation and background level provided compatible site context without being matched to individuals. The findings support an occupant-centred and source-resolved view of school indoor acoustics and generate priorities for future teacher-matched, multi-school research.

Supplementary Materials

The following supporting information can be downloaded at https://www.mdpi.com/article/10.3390/buildings16142894/s1, Supplementary Methods: construct scoring and source structure, adjusted models and source screens, the audibility-only sensitivity analysis, boundary and profile checks, and site context; Figure S1: Measurement positions for the selected-room acoustic tests; Figure S2: Construct-level Spearman correlation network; Figure S3: Stratified slopes for exploratory boundary checks; Figure S4: Descriptive two-profile solution; Table S1: Source-by-dimension descriptive statistics; Table S2: Scale reliability checks; Table S3: Parallel analysis for the 11 source means; Table S4: Thirty strongest construct-level rank correlations; Table S5: Full focal adjusted-model coefficients; Table S6: Audibility-only sensitivity, focal adjusted-model coefficients; Table S7: Audibility-only sensitivity, adjusted one-source-at-a-time screen; Table S8: Adjusted one-source-at-a-time screen; Table S9: Broad subgroup interaction screen; Table S10: Exploratory profile summaries; Table S11: Interpretive flags for selected-room objective acoustic measurements.

Author Contributions

H.F.: Methodology (equal), Investigation (equal), Formal analysis (equal), Writing—original draft. J.Z. (Jiayi Zhou): Investigation (equal), Formal analysis (supporting). J.Z. (Jie Zhang): Investigation (supporting). R.H.: Conceptualization (equal), Methodology (equal), Formal analysis (equal), Supervision (lead), Writing—review and editing (lead), Funding acquisition (supporting). Y.Z.: Conceptualization (equal), Supervision (supporting), Writing—review and editing (supporting), Funding acquisition (lead). All authors have read and agreed to the published version of the manuscript.

Funding

This study was supported by the Department of Science and Technology of Liaoning Province Project (No. 2023030045-JH2/1013).

Institutional Review Board Statement

All procedures complied with relevant ethical regulations and were approved by the Ethics Committee of the School of Architecture and Urban Planning, Shenyang Jianzhu University (No. 20200305).

Informed Consent Statement

Informed consent was obtained from all participants.

Data Availability Statement

The original data presented in the study are openly available in Mendeley Data at https://doi.org/10.17632/syzm652f3z.1.

Conflicts of Interest

The authors declare no conflicts of interest.

References

  1. Bistafa, S.; Bradley, J. Reverberation time and maximum background-noise level for classrooms from a comparative study of speech intelligibility metrics. J. Acoust. Soc. Am. 2000, 107, 861–875. [Google Scholar] [CrossRef] [PubMed]
  2. Puglisi, G.E.; Warzybok, A.; Astolfi, A.; Kollmeier, B. Effect of reverberation and noise type on speech intelligibility in real complex acoustic scenarios. Build. Environ. 2021, 204, 108137. [Google Scholar] [CrossRef]
  3. Fratoni, G.; De Salvio, D.; Tardini, V.; Garai, M.; Valdiserri, P.; Biserni, C.; D’Orazio, D. Student Activity in Suboptimal Thermal and Acoustic Conditions: An In-Field Study in Active Classrooms. Appl. Sci. 2025, 15, 3119. [Google Scholar] [CrossRef]
  4. Fratoni, G.; De Salvio, D.; D’Orazio, D.; Garai, M. Acoustical comfort in university lecture halls: Simulating the dynamic role of occupancy. In Proceedings of the Building Simulation 2021: 17th Conference of the International Building Performance Simulation Association, Bruges, Belgium, 1–3 September 2021; pp. 3704–3711. [Google Scholar] [CrossRef]
  5. Saher, K.; Bulunuz, M.; Kelmendi, J.; Nas, S. Assessment of speech intelligibility during different teaching activities in classrooms with and without acoustic treatment. Appl. Acoust. 2023, 207, 109346. [Google Scholar] [CrossRef]
  6. Yang, D.; Mak, C.M. Effects of acoustical descriptors on speech intelligibility in Hong Kong classrooms. Appl. Acoust. 2021, 171, 107678. [Google Scholar] [CrossRef]
  7. Peng, J.; Yan, N.; Wang, D. Chinese speech intelligibility and its relationship with the speech transmission index for children in elementary school classrooms. J. Acoust. Soc. Am. 2015, 137, 85–93. [Google Scholar] [CrossRef] [PubMed]
  8. Spicciarelli, G.; Gheller, F.; Celli, M.; Arfe, B. The effect of unintelligible speech noise on children’s verbal working memory performance. Front. Psychol. 2025, 16, 1565112. [Google Scholar] [CrossRef] [PubMed]
  9. McClain, M.B.; Yoho, S.E.; Drill, R.B.; Haverkamp, C.R.; Schwartz, S.E.; Barker, B.A.; Longhurst, D.N.; Upton, S.R. Reading Skills and Background Noise in Autistic and Non-autistic Children: A Pilot Study. Contemp. Sch. Psychol. 2024, 28, 283–295. [Google Scholar] [CrossRef]
  10. Zhang, Z.; Zhang, Y.; Kang, J. An experimental study on the influence of environmental noise on students’ attention. In Proceedings of the 11th EuroNoise Conference, Crete, Greece, 27–31 May 2018. [Google Scholar]
  11. van Kempen, E.; Fischer, P.; Janssen, N.; Houthuijs, D.; van Kamp, I.; Stansfeld, S.; Cassee, F. Neurobehavioral effects of exposure to traffic-related air pollution and transportation noise in primary schoolchildren. Environ. Res. 2012, 115, 18–25. [Google Scholar] [CrossRef] [PubMed]
  12. Astolfi, A.; Puglisi, G.E.; Murgia, S.; Minelli, G.; Pellerey, F.; Prato, A.; Sacco, T. Influence of Classroom Acoustics on Noise Disturbance and Well-Being for First Graders. Front. Psychol. 2019, 10, 2736. [Google Scholar] [CrossRef] [PubMed]
  13. Bhandari, N.; Tadepalli, S.; Gopalakrishnan, P. Investigation of acoustic comfort, productivity, and engagement in naturally ventilated university classrooms: Role of background noise and students’ noise sensitivity. Build. Environ. 2024, 249, 111131. [Google Scholar] [CrossRef]
  14. He, X.; Zhao, Y.; Meng, X.; Li, X.; Zhang, Y. A systematic mapping of grey literature on K-12 school acoustic design. Buildings 2026, 16, 587. [Google Scholar] [CrossRef]
  15. Sliwinska-Kowalska, M.; Niebudek-Bogusz, E.; Fiszer, M.; Los-Spychalska, T.; Kotylo, P.; Sznurowska-Przygocka, B.; Modrzewska, M. The prevalence and risk factors for occupational voice disorders in teachers. Folia Phoniatr. Logop. 2006, 58, 85–101. [Google Scholar] [CrossRef] [PubMed]
  16. Behlau, M.; Zambon, F.; Guerrieri, A.C.; Roy, N. Epidemiology of Voice Disorders in Teachers and Nonteachers in Brazil: Prevalence and Adverse Effects. J. Voice 2012, 26, 665.e9. [Google Scholar] [CrossRef] [PubMed]
  17. Cohen, S.M. Self-Reported Impact of Dysphonia in a Primary Care Population: An Epidemiological Study. Laryngoscope 2010, 120, 2022–2032. [Google Scholar] [CrossRef] [PubMed]
  18. Gonzalez-Gamboa, M.; Segura-Pujol, H.; Diaz, P.O.; Rojas, S. Are Occupational Voice Disorders Accurately Measured? A Systematic Review of Prevalence and Methodologies in Schoolteachers to Report Voice Disorders. J. Voice 2025, 39, 842.e1–842.e14. [Google Scholar] [CrossRef] [PubMed]
  19. Garcia Martins, R.H.; do Amaral, H.A.; Mendes Tavares, E.L.; Martins, M.G.; Goncalves, T.M.; Dias, N.H. Voice Disorders: Etiology and Diagnosis. J. Voice 2016, 30, 761.e1. [Google Scholar] [CrossRef] [PubMed]
  20. Schiller, I.S.; Morsomme, D.; Remacle, A. Voice Use Among Music Theory Teachers: A Voice Dosimetry and Self-Assessment Study. J. Voice 2018, 32, 578–584. [Google Scholar] [CrossRef] [PubMed]
  21. Augustyńska, D.; Kaczmarska, A.; Mikulski, W.; Radosz, J. Assessment of teachers’ exposure to noise in selected primary schools. Arch. Acoust. 2010, 35, 521–542. [Google Scholar] [CrossRef]
  22. Gadepalli, C.; Fullwood, C.; Ascott, F.; Homer, J.J. Voice burden in teachers and non-teachers in a UK population: A questionnaire-based survey. Clin. Otolaryngol. 2019, 44, 1045–1058. [Google Scholar] [CrossRef] [PubMed]
  23. Nusseck, M.; Spahn, C.; Echternach, M.; Immerz, A.; Richter, B. Vocal Health, Voice Self-concept and Quality of Life in German School Teachers. J. Voice 2020, 34, 488.e29. [Google Scholar] [CrossRef] [PubMed]
  24. Tao, Y.; Lee, C.T.C.; Hu, Y.J.; Liu, Q. Relevant Work Factors Associated with Voice Disorders in Early Childhood Teachers: A Comparison between Kindergarten and Elementary School Teachers in Yancheng, China. Int. J. Environ. Res. Public Health 2020, 17, 3081. [Google Scholar] [CrossRef] [PubMed]
  25. Lu, D.; Wen, B.; Yang, H.; Chen, F.; Liu, J.; Xu, Y.; Zheng, Y.; Zhao, Y.; Zou, J.; Wang, H. A Comparative Study of the VHI-10 and the V-RQOL for Quality of Life Among Chinese Teachers With and Without Voice Disorders. J. Voice 2017, 31, 509.e1. [Google Scholar] [CrossRef] [PubMed]
  26. Hahad, O.; Kuntic, M.; Al-Kindi, S.; Kuntic, I.; Gilan, D.; Petrowski, K.; Daiber, A.; Münzel, T. Noise and mental health: Evidence, mechanisms, and consequences. J. Expo. Sci. Environ. Epidemiol. 2025, 35, 16–23. [Google Scholar] [CrossRef] [PubMed]
  27. Renshaw, T.L.; Long, A.C.J.; Cook, C.R. Assessing Teachers’ Positive Psychological Functioning at Work: Development and Validation of the Teacher Subjective Wellbeing Questionnaire. Sch. Psychol. Q. 2015, 30, 289–306. [Google Scholar] [CrossRef] [PubMed]
  28. Markelj, N.; Kovac, M.; Leskosek, B.; Jurak, G. Occupational health disorders among physical education teachers compared to classroom and subject specialist teachers. Front. Public Health 2024, 12, 1390424. [Google Scholar] [CrossRef] [PubMed]
  29. Garcia-Real, T.J.J.; Diaz-Roman, T.M.; Mendiri, P. Vocal Problems and Burnout Syndrome in Nonuniversity Teachers in Galicia, Spain. Folia Phoniatr. Logop. 2024, 76, 68–76. [Google Scholar] [CrossRef] [PubMed]
  30. Berglund, B.; Berglund, U.; Lindvall, T. Scaling Loudness, Noisiness, and Annoyance of Community Noises. J. Acoust. Soc. Am. 1976, 60, 1119–1125. [Google Scholar] [CrossRef]
  31. Hammersen, F.; Niemann, H.; Hoebel, J. Environmental Noise Annoyance and Mental Health in Adults: Findings from the Cross-Sectional German Health Update (GEDA) Study 2012. Int. J. Environ. Res. Public Health 2016, 13, 954. [Google Scholar] [CrossRef] [PubMed]
  32. Babisch, W. The noise/stress concept, risk assessment and research needs. Noise Health 2002, 4, 1–11. [Google Scholar] [PubMed]
  33. Stansfeld, S.; Clark, C.; Smuk, M.; Gallacher, J.; Babisch, W. Road traffic noise, noise sensitivity, noise annoyance, psychological and physical health and mortality. Environ. Health 2021, 20, 32. [Google Scholar] [CrossRef] [PubMed]
  34. Schreckenberg, D.; Griefahn, B.; Meis, M. The associations between noise sensitivity, reported physical and mental health, perceived environmental quality, and noise annoyance. Noise Health 2010, 12, 7–16. [Google Scholar] [CrossRef] [PubMed]
  35. Fong, D.Y.T.; Takemura, N.; Chau, P.H.; Wan, S.L.Y.; Wong, J.Y.H. Measurement properties of the chinese weinstein noise sensitivity scale. Noise Health 2017, 19, 193–199. [Google Scholar] [CrossRef] [PubMed]
  36. Bulunuz, N.; Onan, B.C.; Bulunuz, M. Teachers’ noise sensitivity and efforts to prevent noise pollution in school. J. Qual. Res. Educ. 2021, 171–197. [Google Scholar] [CrossRef]
  37. Jo, H.I.; Jeon, J.Y. Urban soundscape categorization based on individual recognition, perception, and assessment of sound environments. Landsc. Urban Plan. 2021, 216, 104241. [Google Scholar] [CrossRef]
  38. Zhang, R.; Ma, H.; Wang, C.; Zhang, Y.; Kang, J. Soundscape and its context: A framework based on a systematic review. J. Acoust. Soc. Am. 2025, 157, 4417–4436. [Google Scholar] [CrossRef] [PubMed]
  39. Liu, Y.; Zhang, Y.; Zhang, R. Problems and impacts associated with the acoustic environment of open-plan offices from the perspective of healthy environment. Chin. Sci. Bull. 2020, 65, 511–521. [Google Scholar] [CrossRef]
  40. Li, J.; Huang, Y.; Han, R.; Zhang, Y.; Kang, J. Indoor soundscape perception and soundscape appropriateness assessment while working at home: A comparative study with relaxing activities. Buildings 2025, 15, 2642. [Google Scholar] [CrossRef]
  41. Wu, D.; Han, R.; Zhang, R.; Yang, X.; Zhang, Y.; Kang, J. The untranslatability of environmental affective scales: Insights from indigenous soundscape perceptions in China. npj Urban Sustain. 2025, 5, 38. [Google Scholar] [CrossRef] [PubMed]
  42. Lee, S.E.; Khew, S.K. Impact of Road Traffic and Other Sources of Noise on the School Environment. Indoor Environ. 1992, 1, 162–169. [Google Scholar] [CrossRef]
  43. Kristiansen, J.; Lund, S.P.; Persson, R.; Shibuya, H.; Nielsen, P.M.; Scholz, M. A study of classroom acoustics and school teachers’ noise exposure, voice load and speaking time during teaching, and the effects on vocal and mental fatigue development. Int. Arch. Occup. Environ. Health 2014, 87, 851–860. [Google Scholar] [CrossRef] [PubMed]
  44. Mealings, K.; Maggs, L.; Buchholz, J.M. The Effects of Classroom Acoustic Conditions on Teachers’ Health and Well-Being: A Scoping Review. J. Speech Lang. Hear. Res. 2024, 67, 346–367. [Google Scholar] [CrossRef] [PubMed]
  45. Mogas-Recalde, J.; Palau, R.; Márquez, M. How Classroom Acoustics Influence Students and Teachers: A Systematic Literature Review. J. Technol. Sci. Educ. 2021, 11, 245–259. [Google Scholar] [CrossRef]
  46. Cal, H.K.; Aletta, F.; Kang, J. Perception of indoor and outdoor school soundscapes: A large-scale Cross-Sectional survey with UK teachers. Appl. Acoust. 2025, 227, 110219. [Google Scholar] [CrossRef]
  47. Hytönen-Ng, E.; Pihlainen, K.; Ng, K.; Kärnä, E. Sounds of learning: Soundscapes–teacher perceptions of acoustic environments in Finland’s open plan classrooms. Issues Educ. Res. 2022, 32, 1421–1440. [Google Scholar]
  48. GB 50118-2010; Code for Design of Sound Insulation of Civil Buildings. China Architecture & Building Press: Beijing, China, 2010.
  49. Boltezar, L.; Sereg Bahar, M. Voice Disorders in Occupations with Vocal Load in Slovenia. Slov. J. Public Health 2014, 53, 304–310. [Google Scholar] [CrossRef] [PubMed]
  50. Gustafson, S.J.; Camarata, S.; Hornsby, B.W.Y.; Bess, F.H. Perceived Listening Difficulty in the Classroom, Not Measured Noise Levels, Is Associated with Fatigue in Children With and Without Hearing Loss. Am. J. Audiol. 2021, 30, 956–967. [Google Scholar] [CrossRef] [PubMed]
  51. Hicks, C.; Tharpe, A. Listening effort and fatigue in school-age children with and without hearing loss. J. Speech Lang. Hear. Res. 2002, 45, 573–584. [Google Scholar] [CrossRef] [PubMed]
  52. Caraty, M.J.; Montacie, C. Vocal fatigue induced by prolonged oral reading: Analysis and detection. Comput. Speech Lang. 2014, 28, 453–466. [Google Scholar] [CrossRef]
  53. Park, S.H.; Lee, P.J.; Jeong, J.H. Effects of noise sensitivity on psychophysiological responses to building noise. Build. Environ. 2018, 136, 302–311. [Google Scholar] [CrossRef]
  54. Di, G.; Yao, Y.; Chen, C.; Lin, Q.; Li, Z. An experiment study on the identification of noise sensitive individuals and the influence of noise sensitivity on perceived annoyance. Appl. Acoust. 2022, 185, 108394. [Google Scholar] [CrossRef]
  55. Hill, E.M.; Billington, R.; Kraegeloh, C. Noise sensitivity and diminished health: Testing moderators and mediators of the relationship. Noise Health 2014, 16, 47–56. [Google Scholar] [CrossRef] [PubMed]
  56. Gille, L.A.; Marquis-Favre, C.; Morel, J. Testing of the European Union exposure-response relationships and annoyance equivalents model for annoyance due to transportation noises: The need of revised exposure-response relationships and annoyance equivalents model. Environ. Int. 2016, 94, 83–94. [Google Scholar] [CrossRef] [PubMed]
  57. Okokon, E.O.; Turunen, A.W.; Ung-Lanki, S.; Vartiainen, A.K.; Tiittanen, P.; Lanki, T. Road-Traffic Noise: Annoyance, Risk Perception, and Noise Sensitivity in the Finnish Adult Population. Int. J. Environ. Res. Public Health 2015, 12, 5712–5734. [Google Scholar] [CrossRef] [PubMed]
  58. Lam, K.C.; Chan, P.K.; Chan, T.C.; Au, W.H.; Hui, W.C. Annoyance response to mixed transportation noise in Hong Kong. Appl. Acoust. 2009, 70, 1–10. [Google Scholar] [CrossRef]
  59. Cerletti, P.; Eze, I.C.; Schaffner, E.; Foraster, M.; Viennau, D.; Cajochen, C.; Wunderli, J.M.; Roosli, M.; Stolz, D.; Pons, M.; et al. The independent association of source-specific transportation noise exposure, noise annoyance and noise sensitivity with health-related quality of life. Environ. Int. 2020, 143, 105960. [Google Scholar] [CrossRef] [PubMed]
  60. Zhang, N.; Liu, C.; Zhang, M.; Guan, Y.; Wang, W.; Liu, Z.; Gao, W. Effects of traffic noise on the psychophysiological responses of college students: An EEG study. Build. Environ. 2025, 267, 112171. [Google Scholar] [CrossRef]
  61. Kang, S.; Ou, D.; Mak, C.M. The impact of indoor environmental quality on work productivity in university open-plan research offices. Build. Environ. 2017, 124, 78–89. [Google Scholar] [CrossRef]
Figure 1. School sound-source landscape and one-component source-load structure. (a) Mean ratings of each source on audibility, annoyance, teaching interference and office-concentration interference. (b) Overall source mean with approximate 95% confidence intervals. (c) Parallel analysis for the 11 source means, comparing observed eigenvalues with the random 95% threshold.
Buildings 16 02894 g001
Figure 2. Adjusted associations across response and health-related outcomes. (a) Association of overall source load with perceived noisiness, voice raising, fatigue and emotional distress. (b,c) Voice-health models including overall source load, voice strain and noise sensitivity for (b) fatigue and (c) emotional distress. Filled points indicate q < 0.05 within the relevant model family. Error bars show HC3 95% confidence intervals.
Buildings 16 02894 g002
Figure 3. Exploratory source-specific association patterns. (a) Adjusted marginal source coefficients across outcomes from one-source-at-a-time models. Because source ratings were correlated, coefficients do not represent mutually independent source effects. Asterisks mark associations with q < 0.05 . (bd) Five largest marginal source coefficients for (b) perceived noisiness, (c) voice raising and (d) emotional distress. Error bars show HC3 95% confidence intervals.
Buildings 16 02894 g003
Figure 4. Selected-room objective acoustic context at the study site. (a) Background-noise levels in classrooms and the office with doors and windows jointly closed or open. The dashed line marks the 40 dB(A) reference used in the site-context table. (b) Field airborne-separation values between classrooms and from classroom to corridor; the classroom–classroom conditions compare untreated door gaps with tape-sealed gaps. Dashed and dotted lines mark the 45 and 50 dB classroom–classroom comparators used in the measurement record; no corridor-specific criterion was applied. (c) Mid-frequency reverberation time for the selected classroom and office, with a shaded 0.6 to 1.0 s reference band.
Buildings 16 02894 g004
Table 1. Sample characteristics, construct scoring and descriptive values.
DomainMeasureValue
SampleTeachers with complete questionnaire data148
GenderFemale teachers109 (73.6%)
Age46 years or older92 (62.2%)
Teaching experience21 years or more97 (65.5%)
Weekly teaching hours10 or more lessons per week82 (55.4%)
Homeroom roleHomeroom teachers34 (23.0%)
Noise sensitivityNoise sensitivity score3.10 (1.03); alpha 0.72
Voice strainVoice strain score3.74 (1.13); alpha 0.88
FatigueSelf-reported fatigue score3.87 (1.14); alpha 0.87
Emotional distressEmotional distress score2.94 (1.24); alpha 0.93
Overall source loadComposite across 11 sources and four rating dimensions2.28 (0.66)
Perceived noisinessPerceived noisiness item3.01 (1.09)
Voice raisingVoice raising item3.06 (1.29)
Note. Values are n (%) or mean (SD). Alpha is Cronbach’s alpha for multi-item scales scored as recorded.
Table 2. Core adjusted models for response and health-related outcomes.
ModelOutcomePredictorBeta [95% CI]q
Overall source modelEmotional distressNoise sensitivity0.62 [0.50, 0.74]<0.001
Overall source modelEmotional distressOverall source load0.30 [0.17, 0.42]<0.001
Overall source modelFatigueNoise sensitivity0.15 [−0.04, 0.33]0.269
Overall source modelFatigueOverall source load0.00 [−0.19, 0.19]1.000
Overall source modelPerceived noisinessNoise sensitivity0.17 [−0.02, 0.35]0.253
Overall source modelPerceived noisinessOverall source load0.29 [0.09, 0.48]0.027
Overall source modelVoice raisingNoise sensitivity0.45 [0.30, 0.60]<0.001
Overall source modelVoice raisingOverall source load0.28 [0.14, 0.42]<0.001
Voice-health modelEmotional distressNoise sensitivity0.51 [0.34, 0.68]<0.001
Voice-health modelEmotional distressOverall source load0.20 [0.08, 0.32]0.007
Voice-health modelEmotional distressVoice strain0.16 [0.05, 0.28]0.019
Voice-health modelFatigueNoise sensitivity0.07 [−0.09, 0.24]0.544
Voice-health modelFatigueOverall source load−0.14 [−0.29, 0.02]0.250
Voice-health modelFatigueVoice strain0.53 [0.38, 0.69]<0.001
Note. Coefficients are standardised OLS estimates with HC3 95% confidence intervals. Overall source load is the equal-weight perceived-source-burden index defined in Section 2.2. Models additionally adjust for gender, homeroom status, weekly teaching hours and age group. q values use Benjamini–Hochberg correction within the model-family/outcome table.
Table 3. Selected-room acoustic measurements at the study site.
ParameterSelected ClassroomsSelected OfficeBenchmark
Dimensions and volume 7.3 × 8.5 × 3.3  m; 204.8 m3Same dimensions (converted classroom)
Nominal occupancy42 students10 staff
Empty-room L Aeq , doors/windows open, equipment on48.8–53.3 dB(A) (floors 1, 2 and 4)48.7 dB(A)
Empty-room L Aeq , doors/windows closed, equipment on33.1–38.7 dB(A) (floors 1, 2 and 4)31.6 dB(A)≤40 dB(A) (GB 50118-2010 [48], enhanced criterion)
One-teacher-day occupied L Aeq approximately 66 dB(A)approximately 55 dB(A)
T 30 , 500–1000 Hz1.3 s0.7 sapproximately 0.6–1.0 s (GB 50118-2010/international guidance)
Classroom–classroom field airborne separation45 dB (door gaps untreated); 49 dB (gaps tape-sealed)>45 dB (basic); >50 dB (enhanced), GB 50118-2010
Classroom–corridor field airborne separation21 dB>45 dB classroom–classroom comparator
Floor impact L nT , w 59 dB≤65 dB (enhanced criterion)
Note. The values provide site context only and were not matched to individual teachers or questionnaire responses. The occupied values came from a separate one-day observation of one teacher. No corridor-specific criterion was applied; the >45 dB entry is the classroom–classroom comparator used in the measurement record.
Disclaimer/Publisher’s Note: The statements, opinions and data contained in all publications are solely those of the individual author(s) and contributor(s) and not of MDPI and/or the editor(s). MDPI and/or the editor(s) disclaim responsibility for any injury to people or property resulting from any ideas, methods, instructions or products referred to in the content.