1. Introduction
The building and construction sector stands as a critical driver of global energy consumption and climate change. According to the United Nations Environment Programme, the sector accounts for 32% of global final energy consumption and contributes 34% of global energy-related CO
2 emissions [
1]. In China, the challenge is particularly acute; the operational energy consumption and carbon emissions of civil buildings have reached 1.30 billion tons of standard coal and 2.47 billion tons of CO
2 annually, accounting for 21.8% and 22.1% of the national totals, respectively [
2]. To mitigate these impacts, international policies are accelerating a systemic transformation toward the full decarbonization of building stock by 2050, mandating that new and retrofitted buildings achieve high-efficiency standards, such as nearly zero-energy buildings [
3,
4].
While the deployment of high-performance thermal envelopes is fundamental to these carbon-reduction goals, the industry’s traditional mitigation strategies have historically and disproportionately emphasized thermal insulation [
5]. However, uncontrolled air infiltration—quantified as the volumetric airflow rate at a defined pressure differential—constitutes a primary, yet frequently underestimated, mechanism of energy inefficiency [
6]. Decades of empirical literature across diverse climate zones have robustly quantified this impact, establishing that air leakage can contribute between 10% and 40% of space heating loads, with the upper limits consistently observed in cold and severe cold regions where thermal and barometric gradients are most pronounced [
7,
8,
9]. Beyond energy metrics, airtightness is intrinsically linked to indoor environmental quality and long-term hygrothermal durability [
10]. Suboptimal leakage control not only compromises occupant thermal comfort [
11] and facilitates the ingress of outdoor particulate pollutants [
12,
13], but also creates critical pathways for vapor migration. This phenomenon, extensively documented in classic building pathology, significantly elevates the risk of interstitial condensation [
14] and subsequent mold proliferation [
15], thereby threatening both structural integrity and occupant health.
Within the broader context of building envelope diagnostics—which has accumulated extensive empirical database profiles for traditional monolithic masonry and concrete systems over the past forty years—timber structures present a distinct and highly volatile performance profile [
16]. Despite their renewable nature and exceptional low embodied carbon potential, timber systems inherently face unique sealing challenges [
17]. Unlike cast-in-situ concrete, light wood frame structures are dry-assembled, resulting in an envelope characterized by a multitude of panel-to-panel joints, multi-layered membranes, and complex structural connection details. Consequently, the global macro-performance of timber envelopes is extraordinarily sensitive to workmanship quality and local detailing precision [
17,
18]. This high sensitivity has fueled a significant, ongoing divergence in the extant international literature regarding the reliability of timber envelopes. On one hand, several large-scale macro-assessments corroborate a systemic performance gap; for instance, Vinha’s landmark study of Finnish residential stocks revealed that while autoclaved aerated concrete and concrete dwellings achieved mean air change rates at 50 Pa of 1.5 h
−1 and 1.6 h
−1 respectively, timber-frame houses exhibited significantly higher leakages, averaging 3.9 h
−1 [
19]. On the other hand, these leakage pathways are not an inherent material liability, but are entirely manageable through rigorous quality management, as evidenced by Böhm’s investigations in Central Europe which achieved tightly controlled rates of 1.03 h
−1 [
20]. This unresolved tension highlights that timber airtightness is highly context-dependent and cannot be generalized across different regional practices.
Despite this substantial body of literature from European and North American contexts, there remains a critical paucity of localized empirical data specifically concerning light wood frame buildings in China, particularly within its cold and severe cold climate zones. These geographic regions differ critically from the milder or highly regulated maritime climates often cited in international baseline studies. While the foundational thermodynamic and physical principles governing air leakage are universal, real-world airtightness performance is strictly context-dependent—governed by local construction supply chains, regional workmanship habits, and specific climatic interactions [
16,
17,
21]. The lack of localized, high-fidelity data represents a major knowledge gap, hindering the development of targeted, climate-resilient energy efficiency standards for this rapidly expanding green building typology in China.
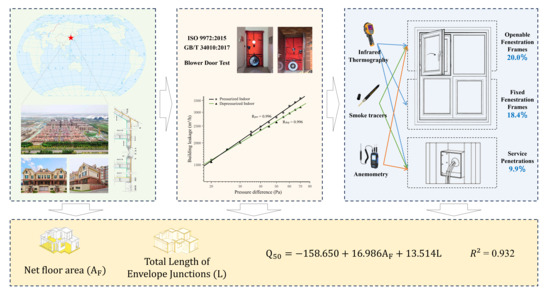
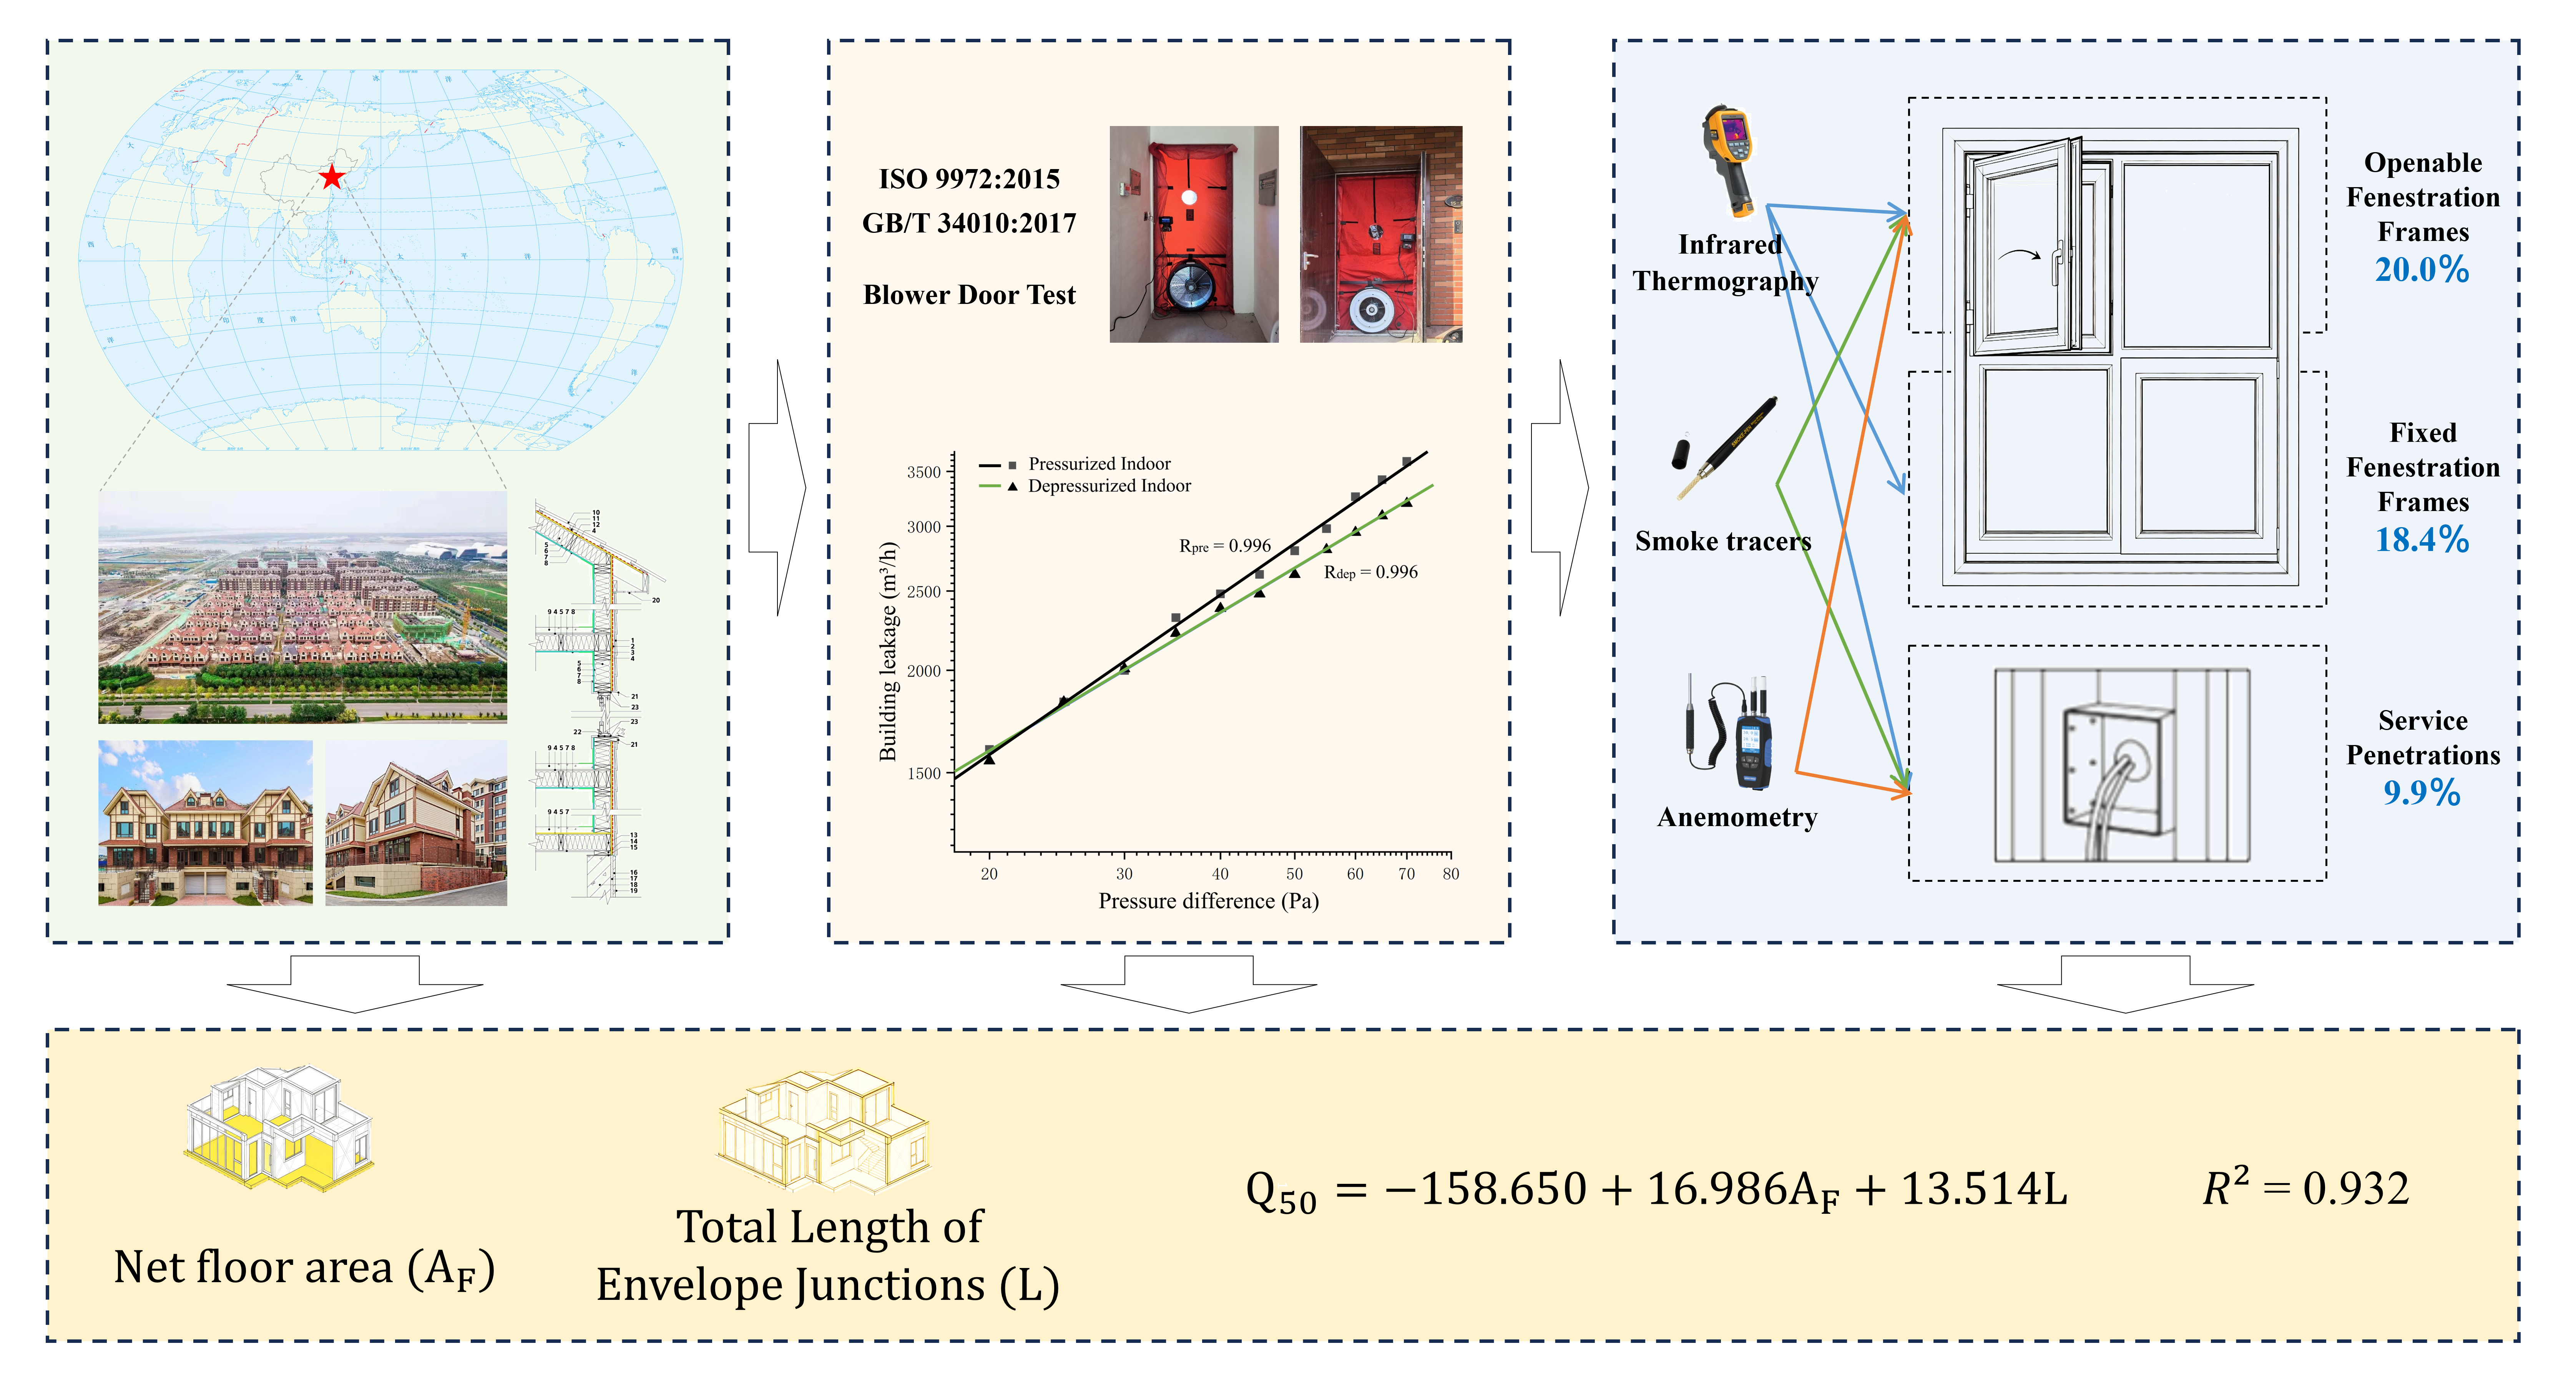
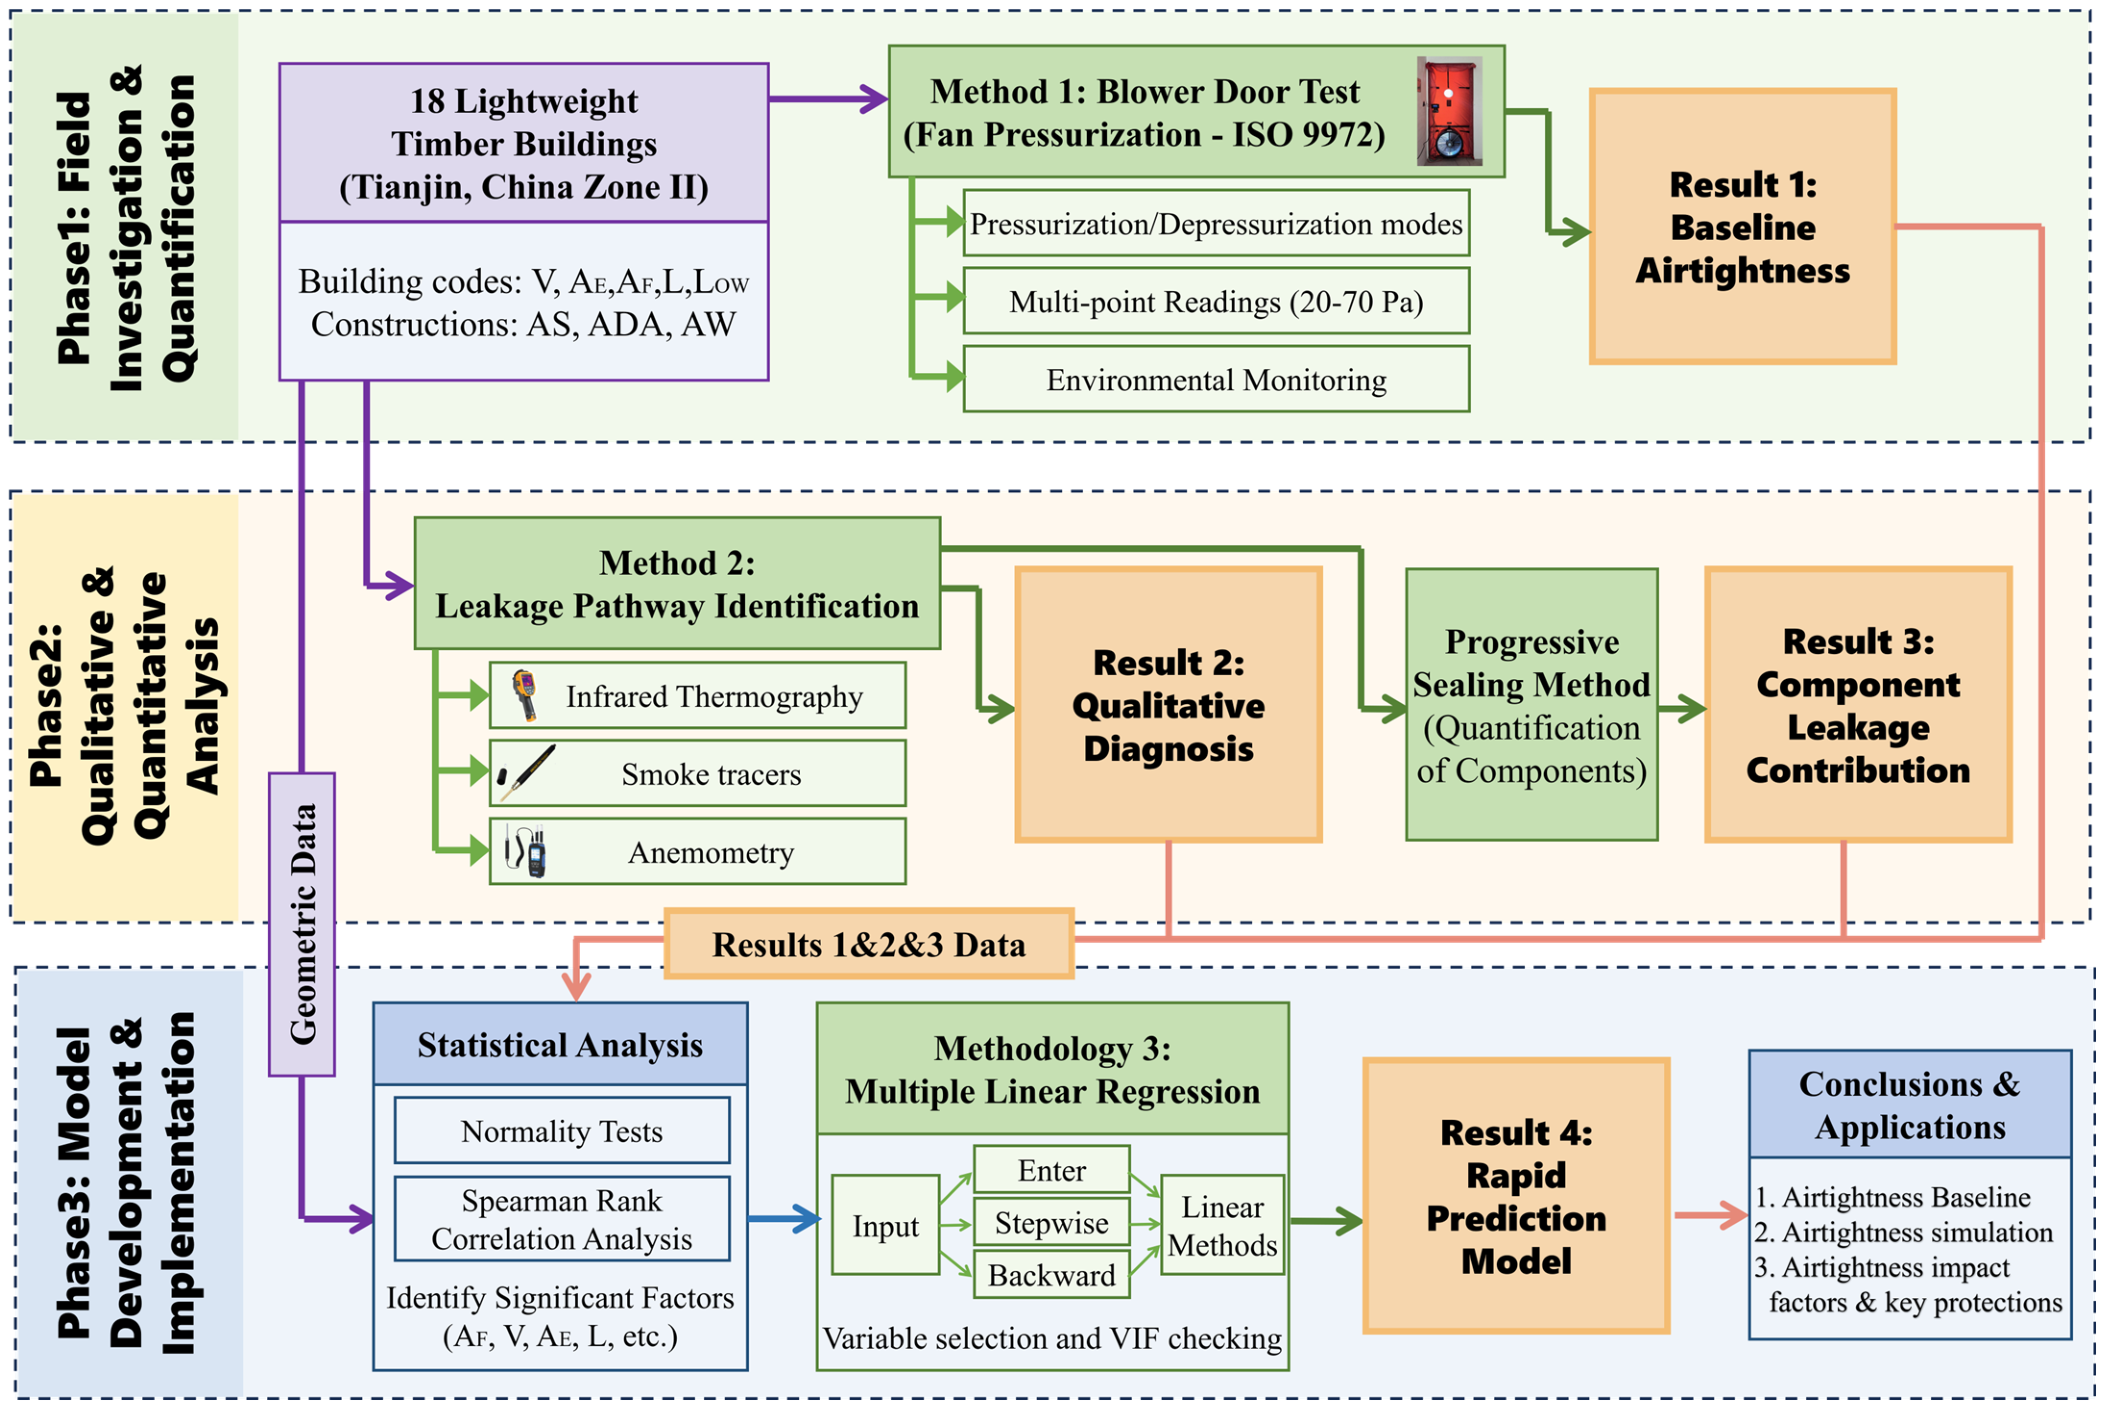
Therefore, this study establishes a comprehensive, three-phase research framework to investigate light wood-frame buildings across China’s cold regions, as illustrated in
Figure 1.
In Phase 1 (Field Investigation & Quantification), a regional benchmark is established by evaluating 18 lightweight timber buildings in Tianjin (China Zone II), encompassing diverse building codes (e.g., V, A
E, A
F, L, L
OW) and construction typologies (AS, ADA, and AW). Whole-building airtightness is systematically quantified using Method 1: Blower Door Test (Fan Pressurization in accordance with ISO 9972 [
22]) under both pressurization and depressurization modes. By incorporating multi-point readings (20–70 Pa) and rigorous environmental monitoring, this phase delivers Result 1: Baseline Airtightness.
In Phase 2 (Qualitative & Quantitative Analysis), a comprehensive pathological diagnosis is conducted. Method 2: Leakage Pathway Identification utilizes localized infrared thermography, smoke tracers, and anemometry to generate Result 2: Qualitative Diagnosis. Subsequently, the Progressive Sealing Method (Quantification of Components) is deployed to isolate and determine the airtightness of individual building elements, establishing Result 3: Component Leakage Contribution.
In Phase 3 (Model Development & Implementation), the framework integrates Geometric Data derived from Phase 1 alongside the compiled Results 1&2&3 Data into advanced predictive modelling. First, Statistical Analysis—comprising Normality Tests and Spearman Rank Correlation Analysis—is performed to screen and identify significant diagnostic factors (e.g., V, AE, AF, L). Next, Methodology 3: Multiple Linear Regression is executed using various Linear Methods (including Enter, Stepwise, and Backward elimination procedures) under strict variable selection and Variance Inflation Factor (VIF) checking. This yields Result 4: Rapid Prediction Model, which demonstrates high mathematical fidelity (R2 = 0.932).
Ultimately, these interrelated phases culminate in robust Conclusions & Applications, which specifically focus on: (1) expanding regional airtightness baselines, (2) enhancing building airtightness simulations, and (3) identifying key airtightness impact factors and critical protection strategies under climate stressors.
2. Experiment Process and Methods
2.1. Description of Measured Buildings
In this study, field measurements of building airtightness were conducted on 18 dwelling units selected from eight lightweight timber houses located in Tianjin, a representative city within China’s Cold Climate Zone (Zone II).
Table 1 summarizes the principal characteristics of the surveyed buildings. Key geometric parameters, including internal volume (V), net floor area (A
F), and total envelope area (A
E), were calculated in strict adherence to ISO 9972:2015 [
22] and GB/T 34010-2017 [
23]. The building identification codes listed in
Table 1 denote the building number (e.g., 10#) followed by the specific unit identifier (e.g., 1).
All surveyed buildings satisfied the relevant Chinese thermal requirements and were newly completed, unoccupied, and in a pre-fitout (rough) state during testing. Although the primary building envelopes, exterior fenestration, and essential service penetrations were fully installed, interior decoration and fixtures (e.g., kitchen and sanitary facilities) were absent. Testing at this structural stage represents a standard diagnostic protocol (pre-delivery testing) in lightweight timber construction, as the primary airtightness layer—comprising vapor-permeable membranes, airtight tapes, and structural sheathing (OSB) joints—is fully exposed, allowing for the precise tracking and remediation of sealing defects before they are permanently concealed by interior cladding. Nevertheless, actual airtightness is highly dynamic and subject to post-decoration variations. Subsequent fit-outs (e.g., gypsum plasterboard installation, flooring, and surface coatings) typically enhance airtightness by sealing minor cracks and fasteners, whereas potential post-occupancy modifications (e.g., HVAC retrofits) might introduce unsealed service penetrations that could deteriorate performance. Consequently, the empirical measurements and the rapid prediction model developed in this study provide a baseline estimate of the structural envelope’s airtightness in its conservative, unclad state.
The tested buildings utilize a lightweight timber construction system. The above-ground structure employs spruce-pine-fir (SPF) dimension lumber (38 × 140 mm, nominal 2 × 6 in.) as the primary load-bearing framework, capped with a lightweight timber pitched roof. The substructure consists of a reinforced concrete basement. A distinct structural feature is the application of a 50 mm thick cast-in-place concrete topping on the floor diaphragms of each story, designed to enhance structural stability.
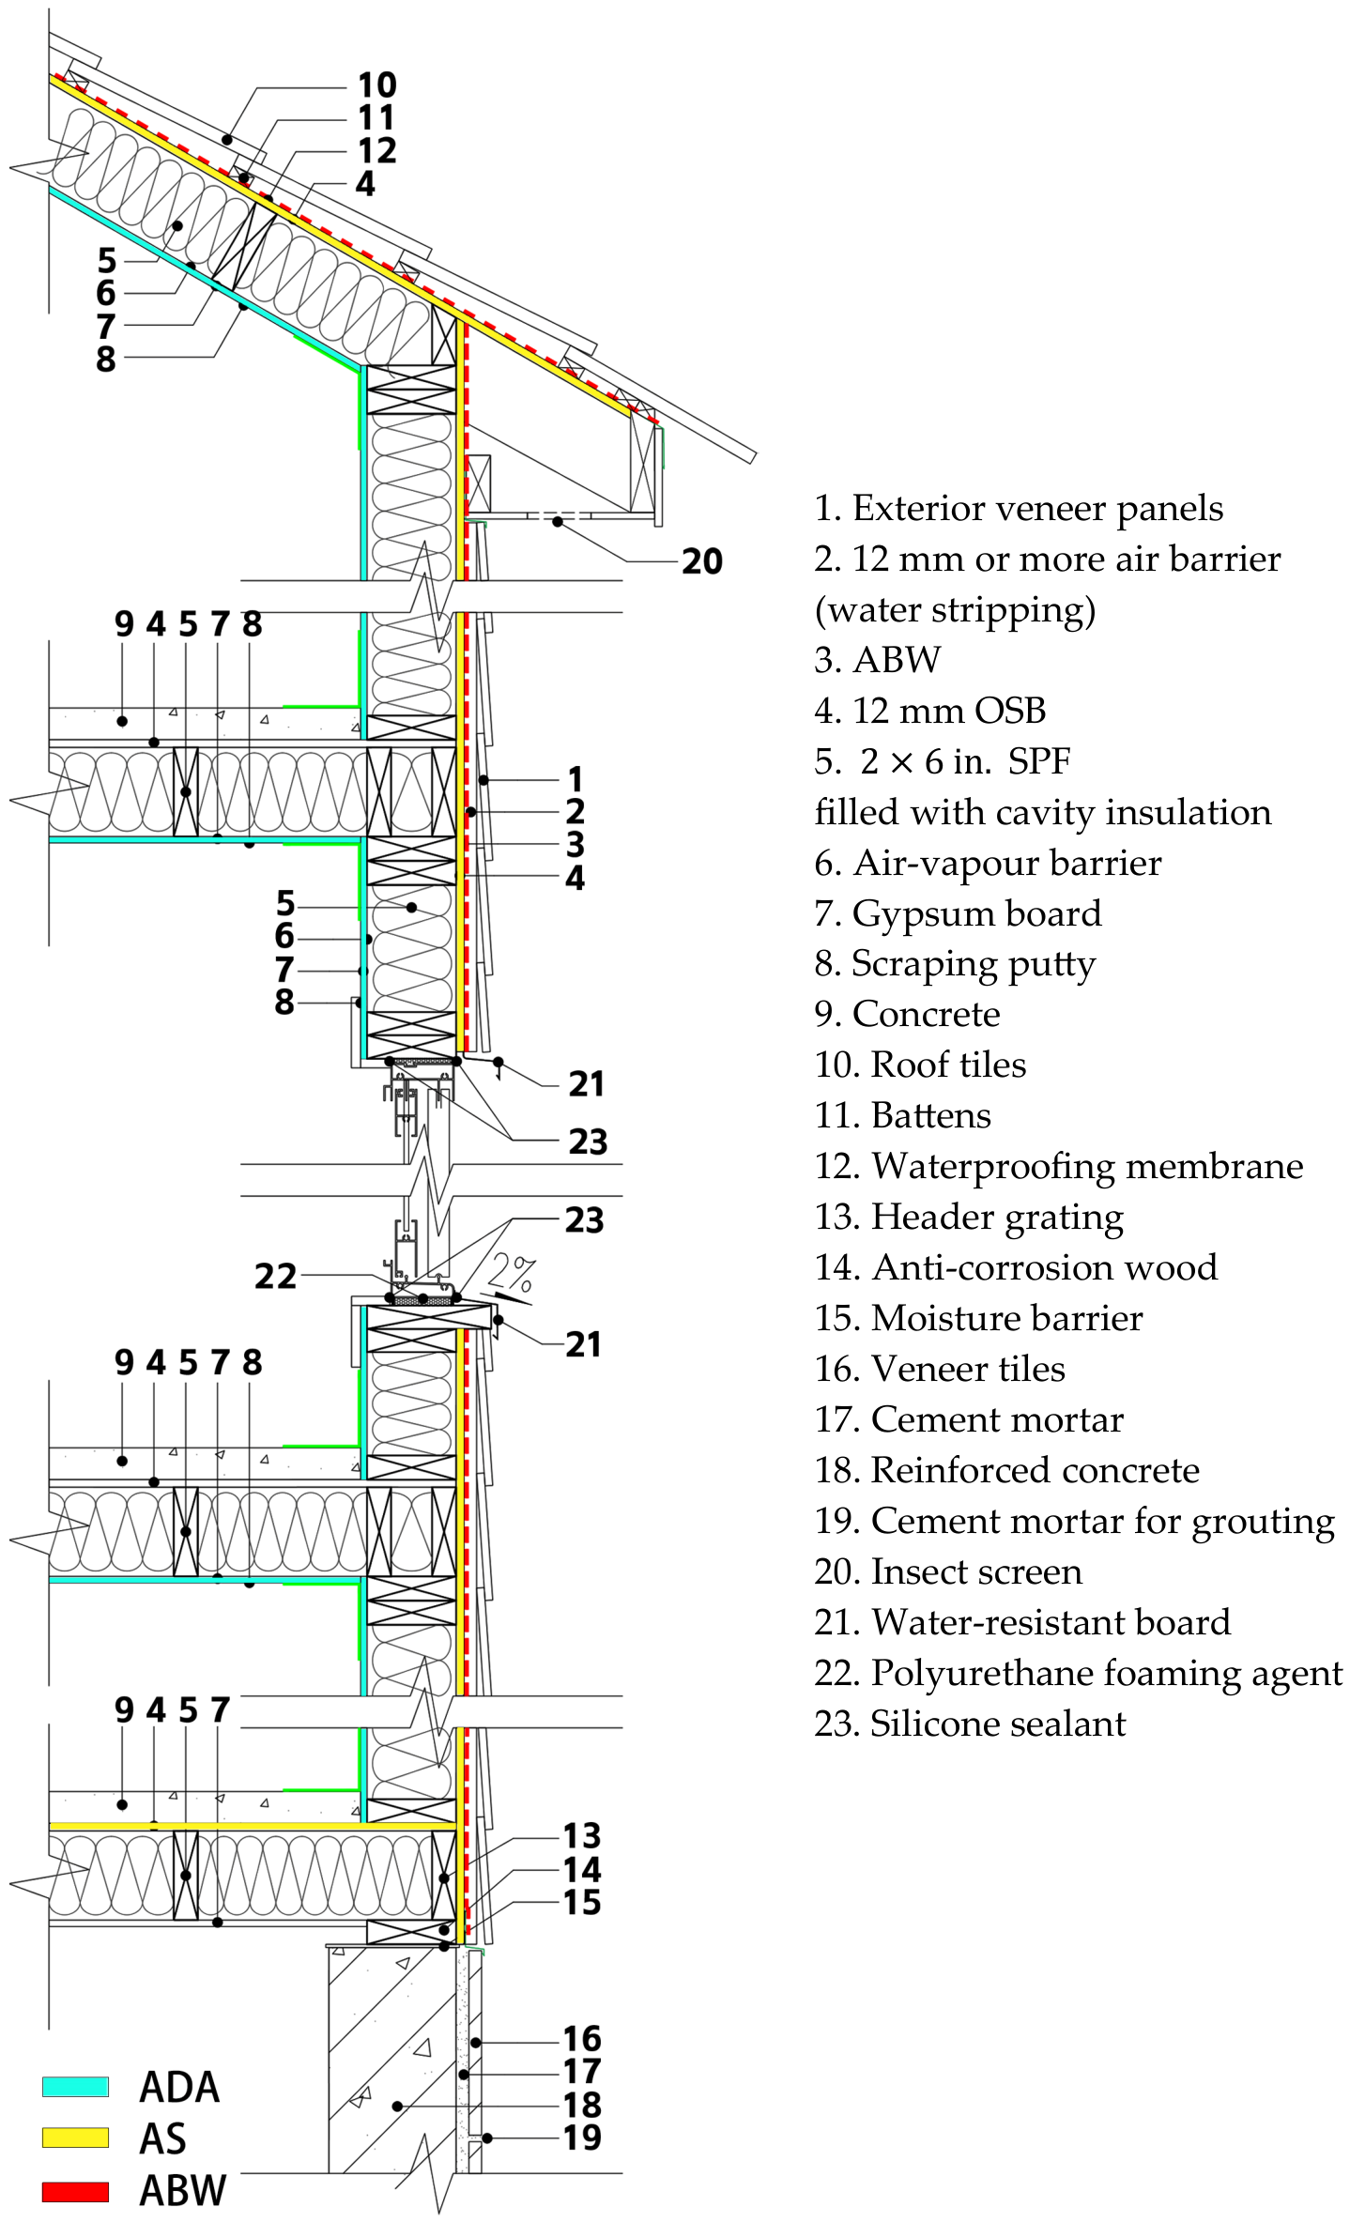
The construction execution strictly adhered to the guidelines stipulated in the Canadian Wood-Frame House Construction handbook. As schematically illustrated in
Figure 2, typical airtightness strategies in this construction typology include the airtight drywall approach (ADA), airtight breathable wrap (ABW), and airtight sheathing (AS). Among these, the surveyed buildings primarily utilize the ABW method. Consequently, no specialized airtightness detailing beyond this standard practice was implemented.
Based on the ABW strategy, the typical wall assembly, stratified from exterior to interior, consists of the following layers: exterior cladding, a ventilated air cavity (≥12 mm) formed by furring strips, the ABW, 12 mm oriented strand board (OSB), the SPF stud frame filled with cavity insulation, an air-vapour barrier, and an interior gypsum board with a putty finish. Correspondingly, the roof assembly comprises (from exterior to interior): roof tiles, battens, a waterproofing membrane, 12 mm OSB, SPF rafters filled with insulation, a vapor barrier, and gypsum board. To mitigate moisture risks in wet zones, a polymer-modified cementitious waterproof coating was applied to the floor substrates of all kitchens and bathrooms.
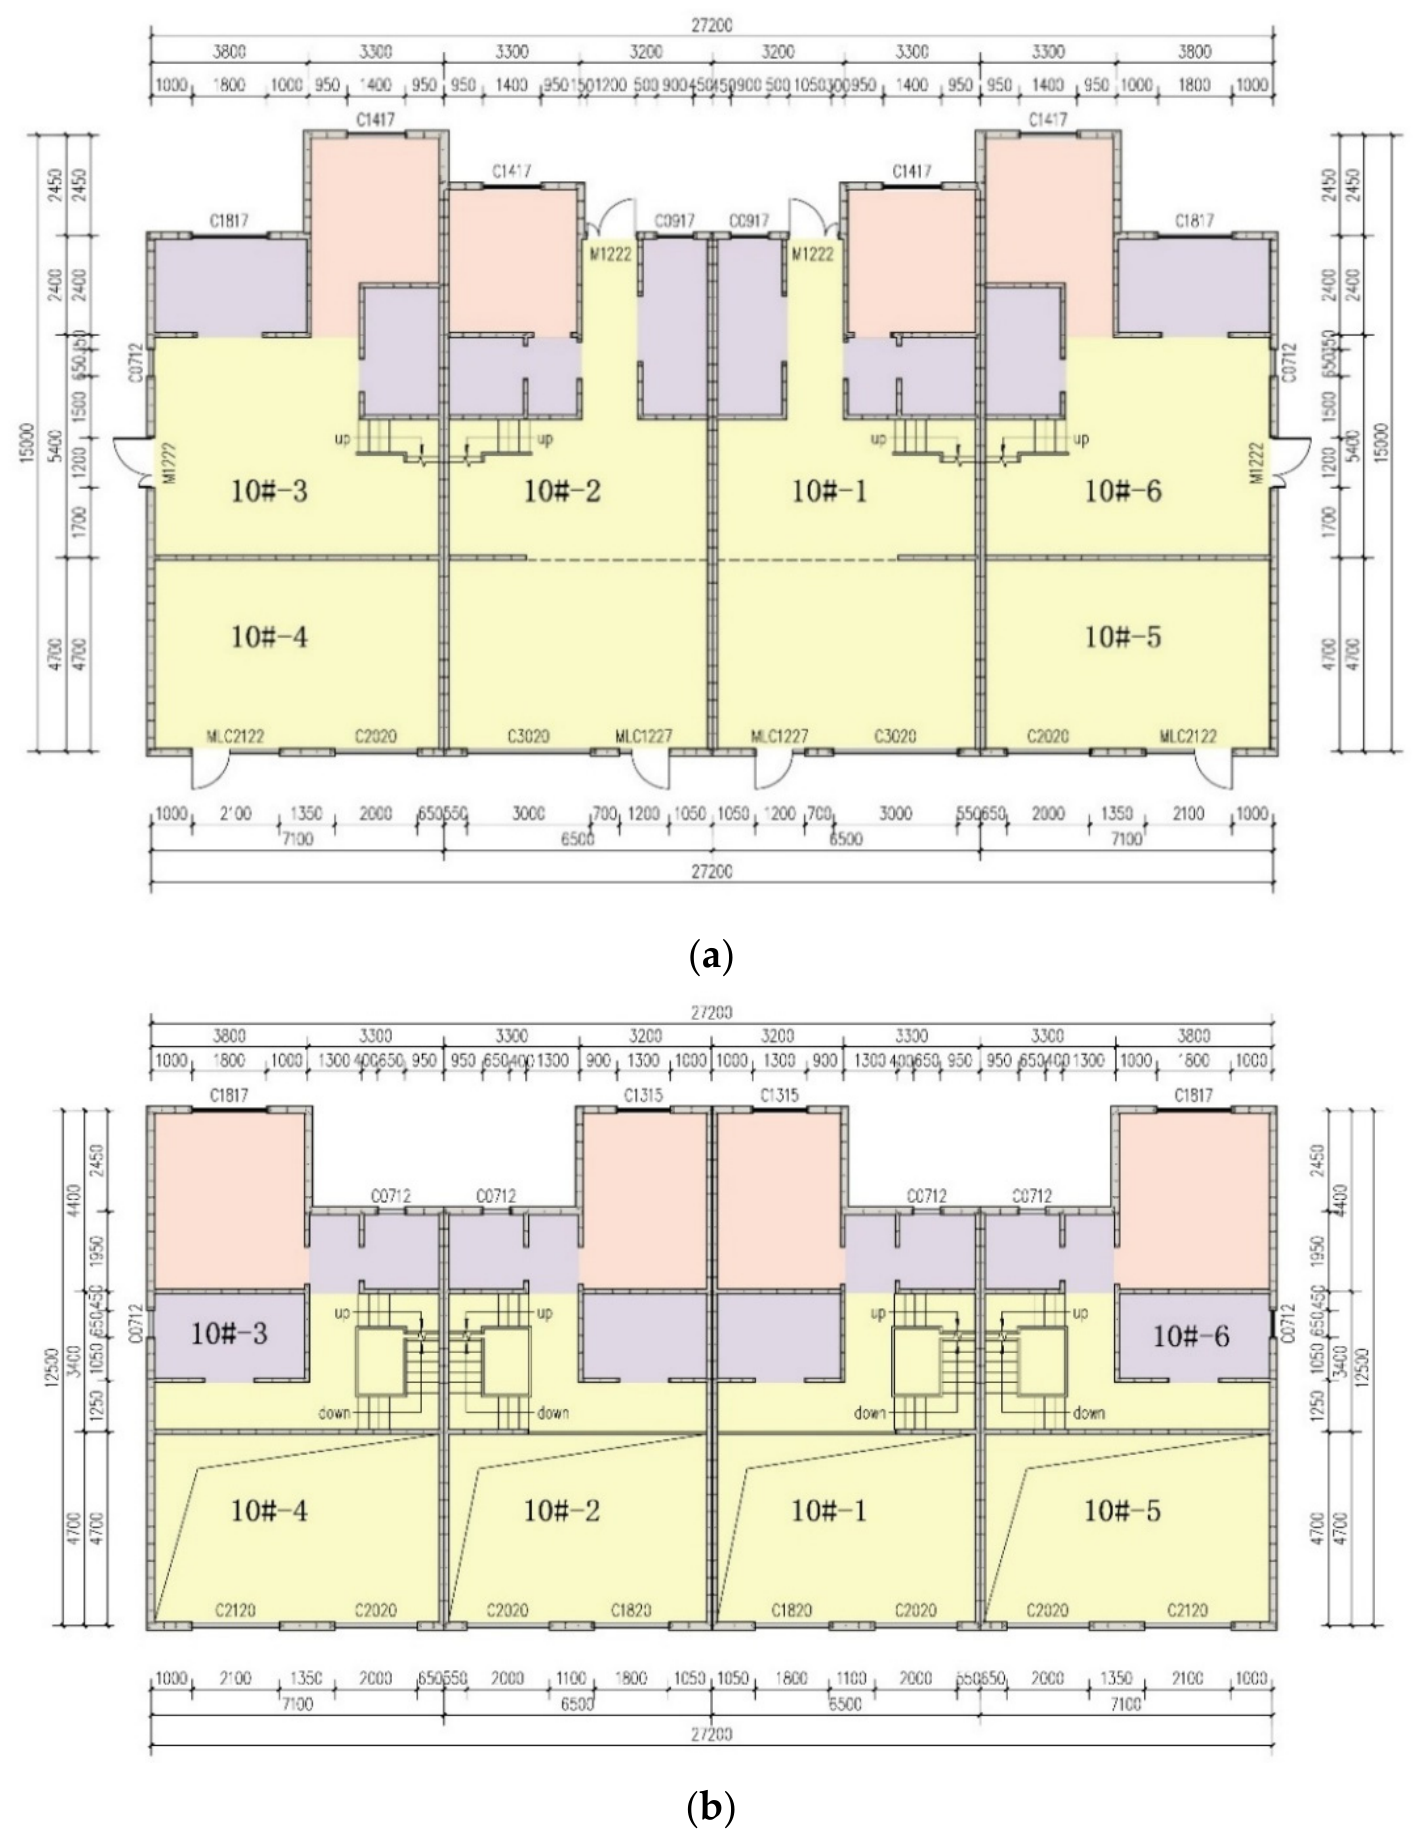
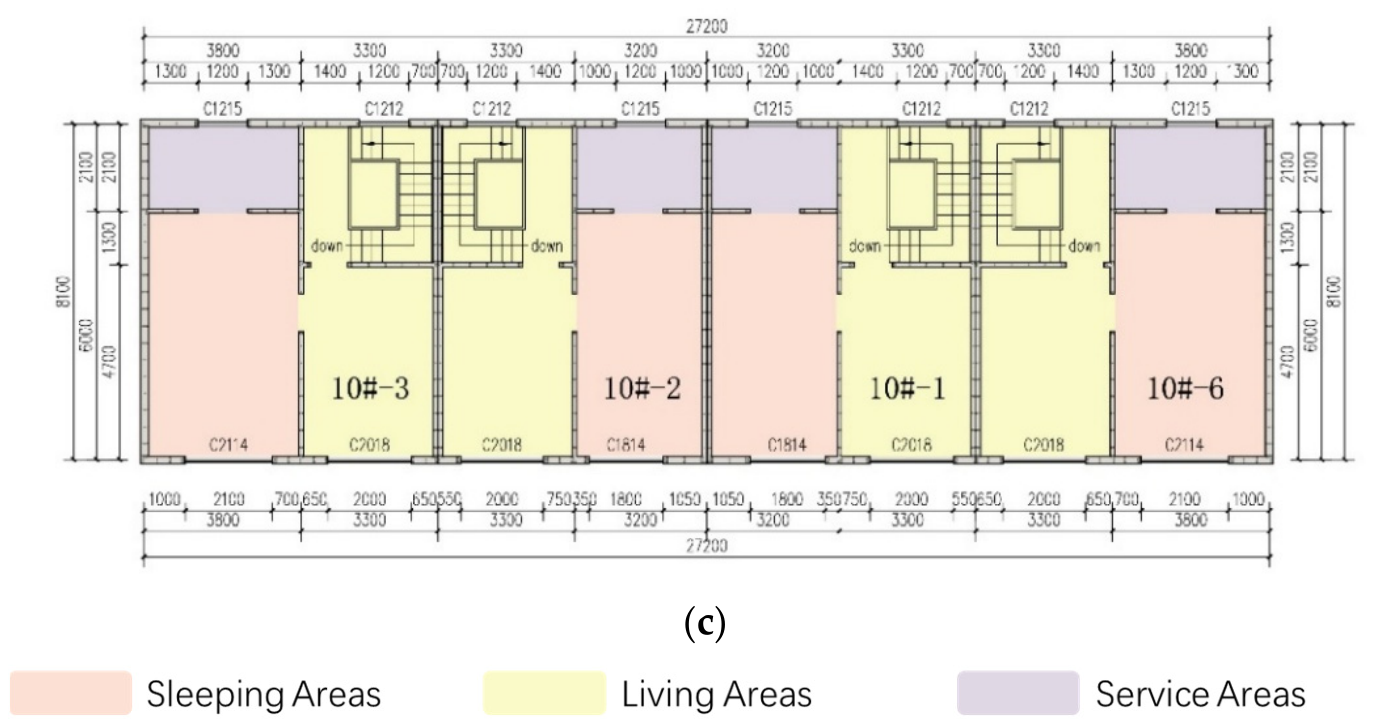
Architecturally, the surveyed houses feature a three-story superstructure rising above a basement level. A critical boundary condition of the building envelope is the pneumatic isolation of the basement from the above-ground living quarters. Consequently, the basement level is defined as falling outside the envelope and is excluded from the airtightness control volume of this study. The representative architectural layout (exemplified by Unit 10#) is presented in
Figure 3.
It is worth noting that although the building under test is a townhouse, each unit is structurally separated by double-leaf partition walls with an internal air gap. Consequently, inter-unit air leakage is assumed to be negligible, and the measured airtightness results are considered equivalent to the air infiltration between the tested unit and the outdoor environment.
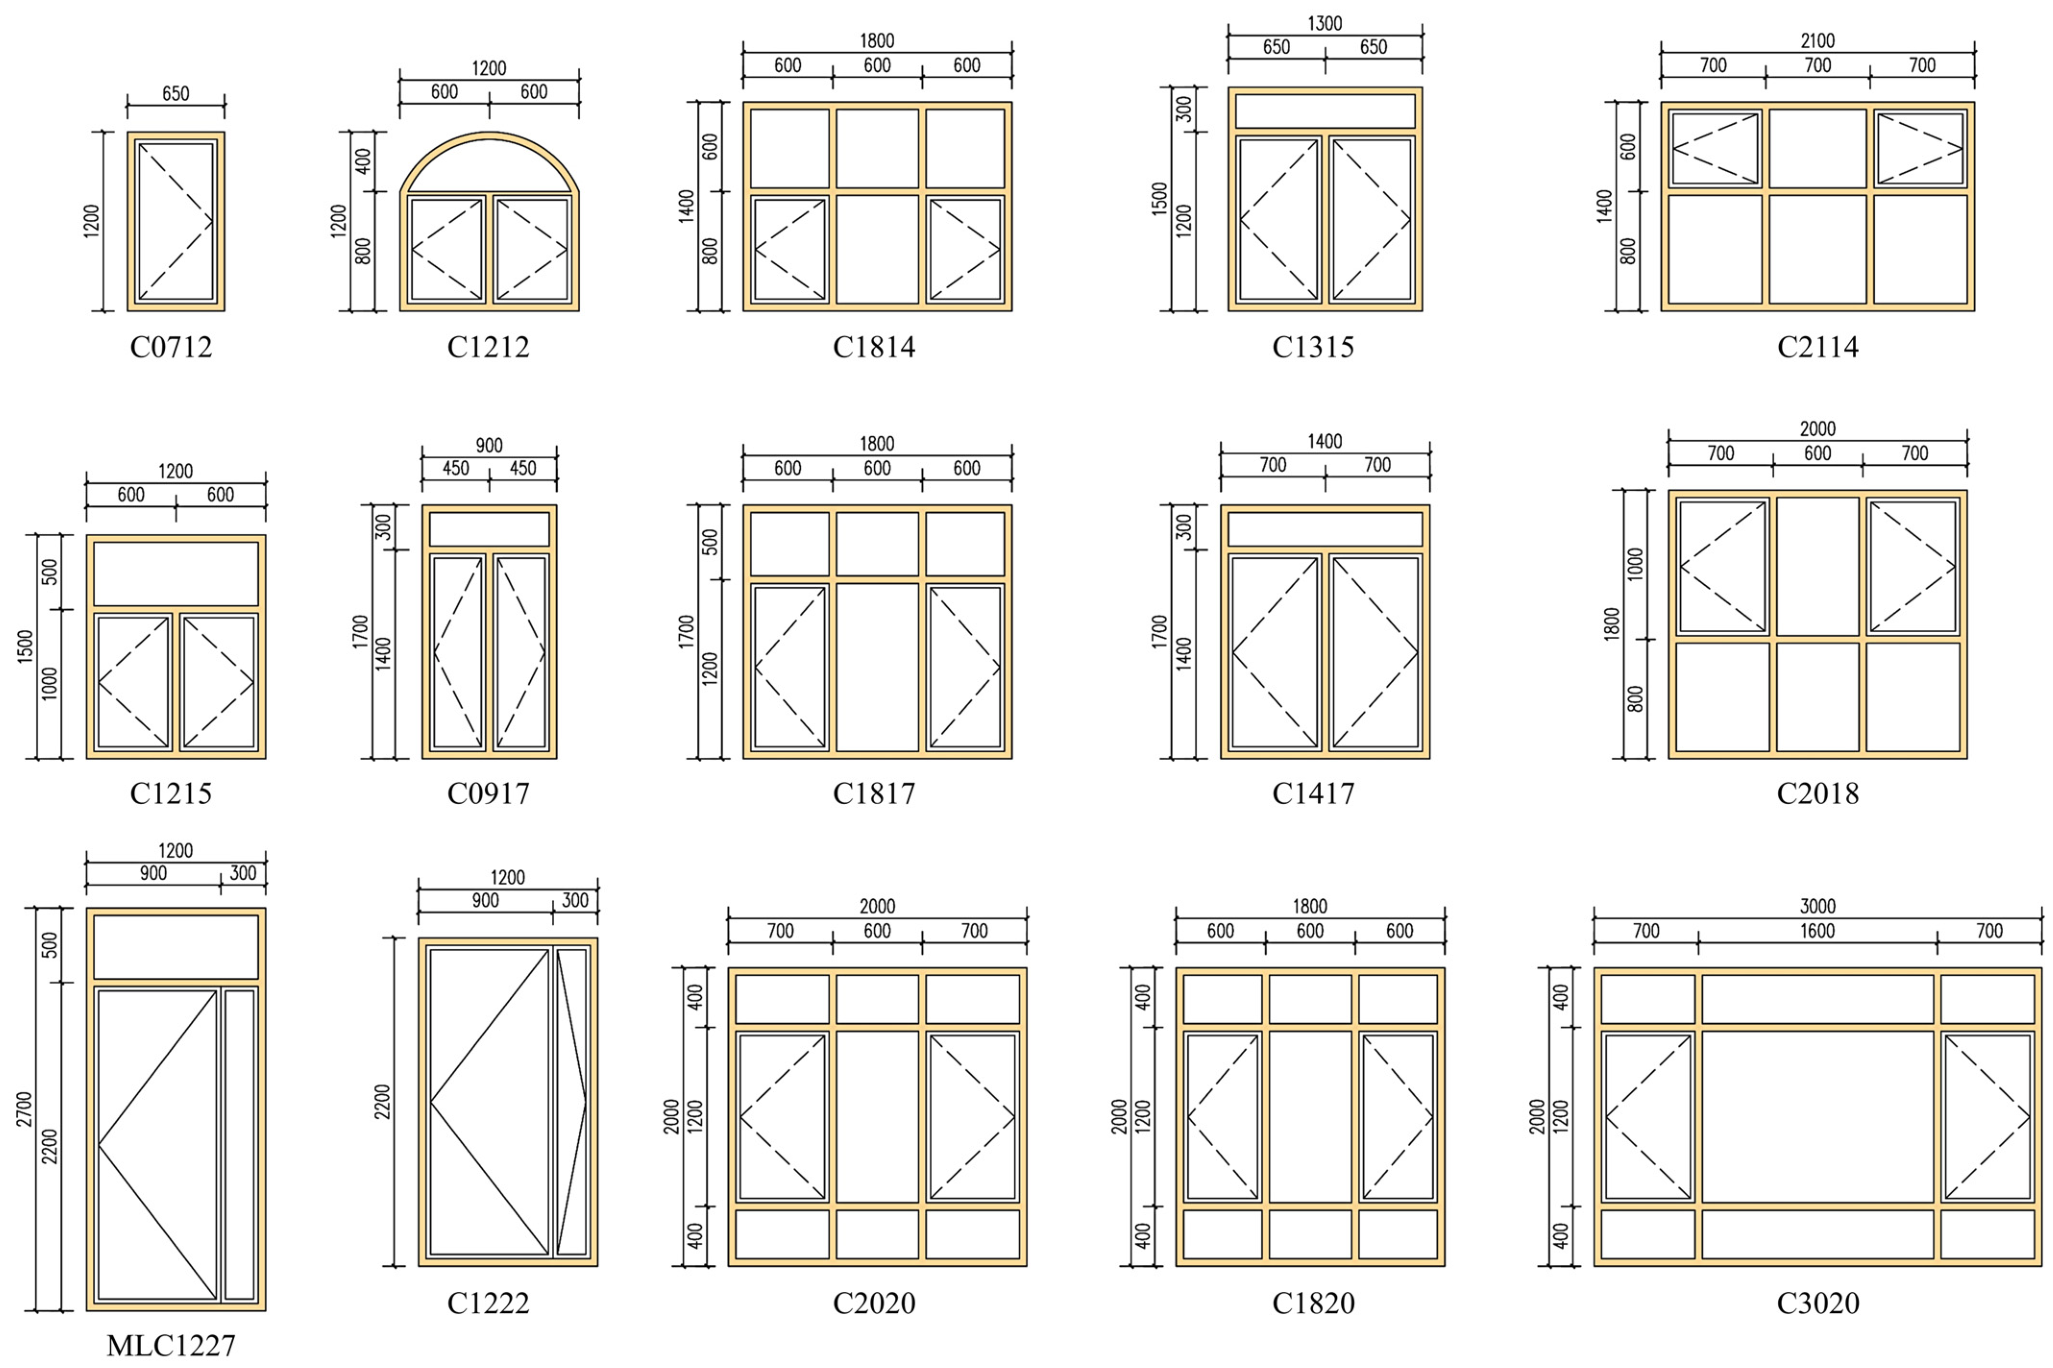
In terms of the fenestration system, the buildings are uniformly equipped with outward-opening casement windows. The specific profile geometry and frame specifications are detailed in
Figure 4.
2.2. Experimental Methodology
2.2.1. Instrumentation and Measurement Principles
The fan pressurization method (blower door test), standardized by ISO 9972, remains the predominant diagnostic technique for building airtightness and is often synergized with infrared thermography to identify leakage sites [
17,
24,
25]. In this study, the building airtightness testing was conducted in strict accordance with ISO 9972:2015 [
22] and the Chinese standard GB/T 34010-2017 [
23].
The DG-1000 building airtightness detection system was employed for the measurement campaign. The system primarily comprises a blower door assembly (Model 3 fan), differential pressure gauges, and airflow measurement devices, with the component connections illustrated in
Figure 5. The Model 3 fan was utilized to induce pressure differentials across the building envelope by mechanically supplying or extracting air. The instrumentation is capable of recording pressure differentials within a range of −2500 to 2500 Pa with an accuracy of ±1%, and airflow rates ranging from 0 to 10,700 m
3/h with an accuracy of ±3%.
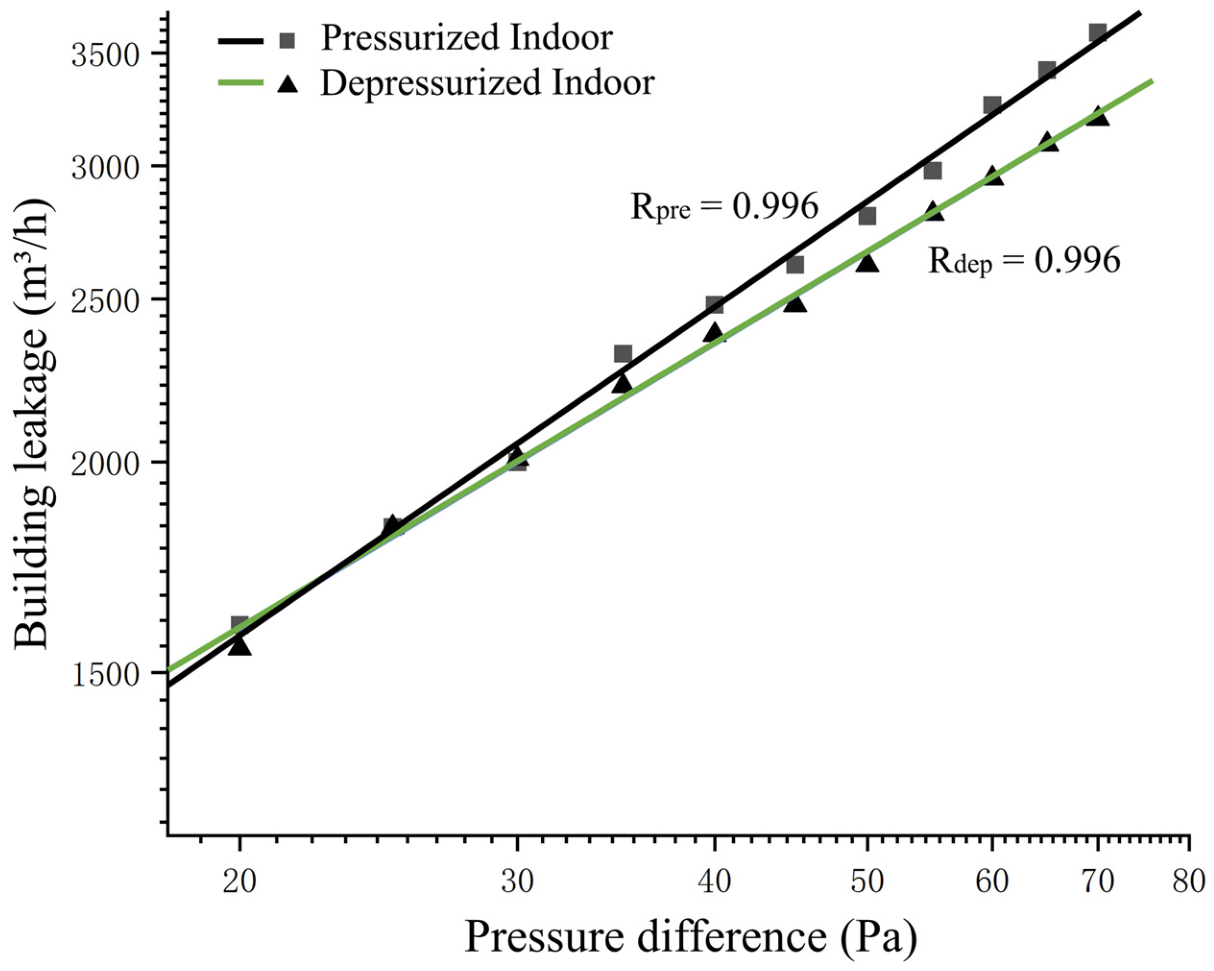
During the data acquisition phase, the pressure difference across the envelope was initially elevated to a maximum preset value. Subsequently, a multi-point test was performed by decreasing the pressure from 70 Pa to 20 Pa in decrements of 5 Pa, with readings recorded at each interval. To minimize systematic errors, air leakage rates were recorded under both pressurization and depressurization modes, and the arithmetic mean of the results was adopted as the final value. Concurrently, key environmental parameters—including indoor and outdoor temperatures, outdoor wind speed, atmospheric pressure, and relative humidity—were monitored. Detailed specifications and accuracy parameters of all environmental monitoring instruments are listed in
Table 2.
2.2.2. Building Preparation
Prior to the measurement, building preparation was conducted following Method 1 outlined in ISO 9972:2015 [
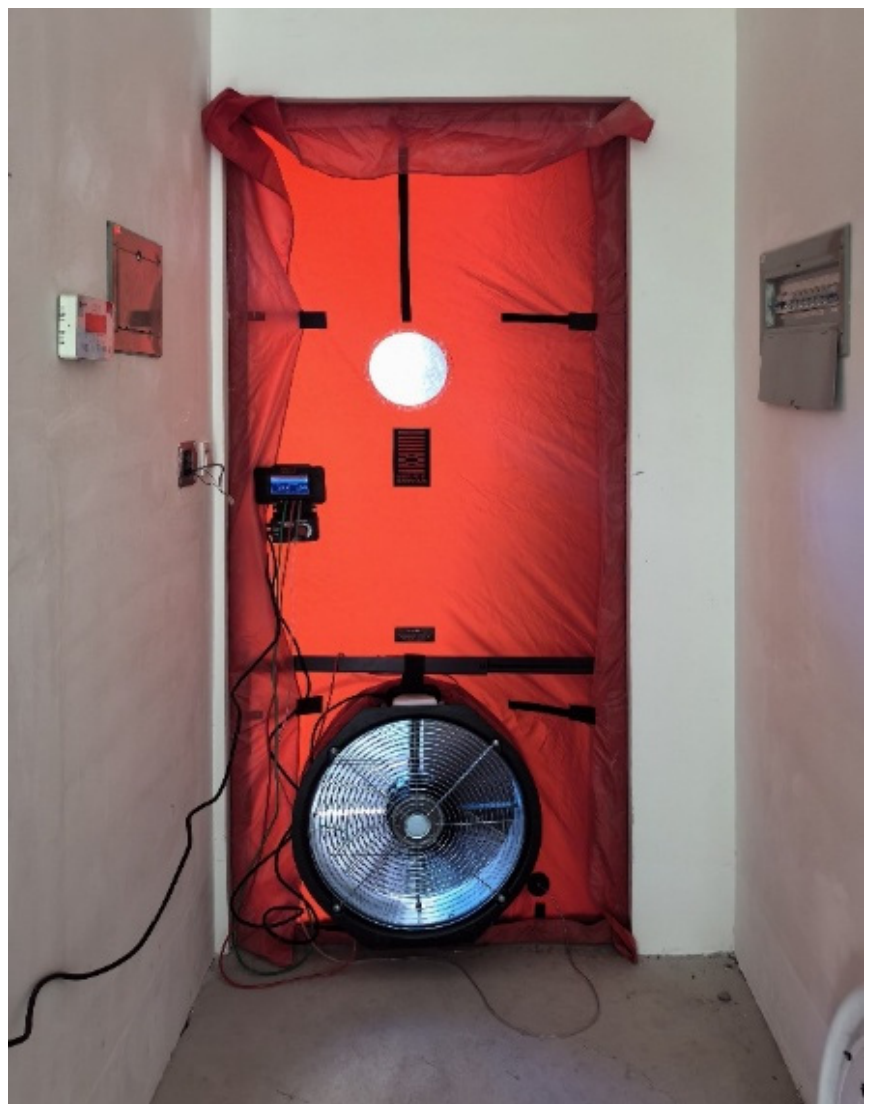
22]. The blower door assembly was installed at the opening of M1222, as illustrated in
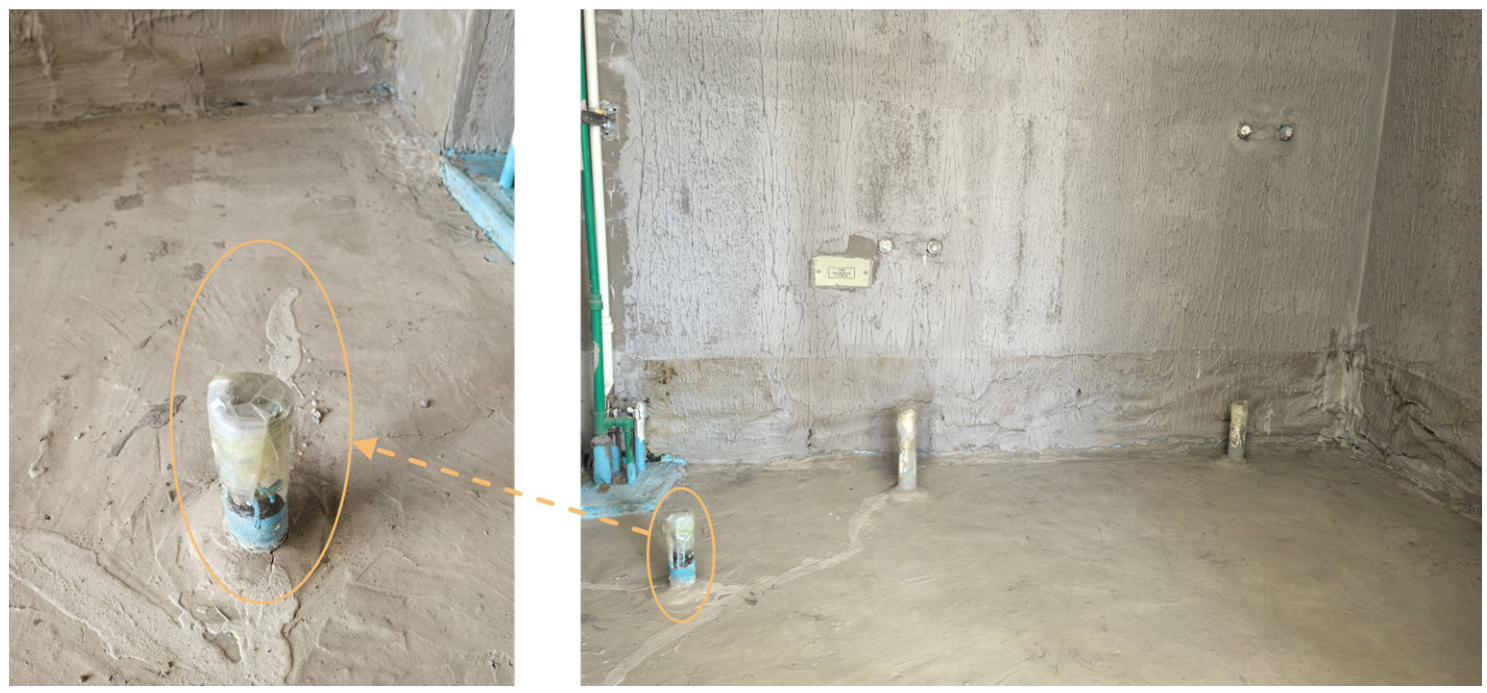
Figure 3. To ensure the entire volume acted as a single pressure zone, all interconnecting doors and windows in surrounding areas (including adjacent rooms, stairwells, and floors above/below) were kept open. Within the tested zone, all exterior fenestration was closed, while interior doors remained open to facilitate uniform pressure distribution. Furthermore, all reserved ducts and intentional openings were sealed using polyethylene film and adhesive tape to eliminate extraneous leakage paths, as illustrated in
Figure 6.
2.2.3. Leakage Pathway Identification
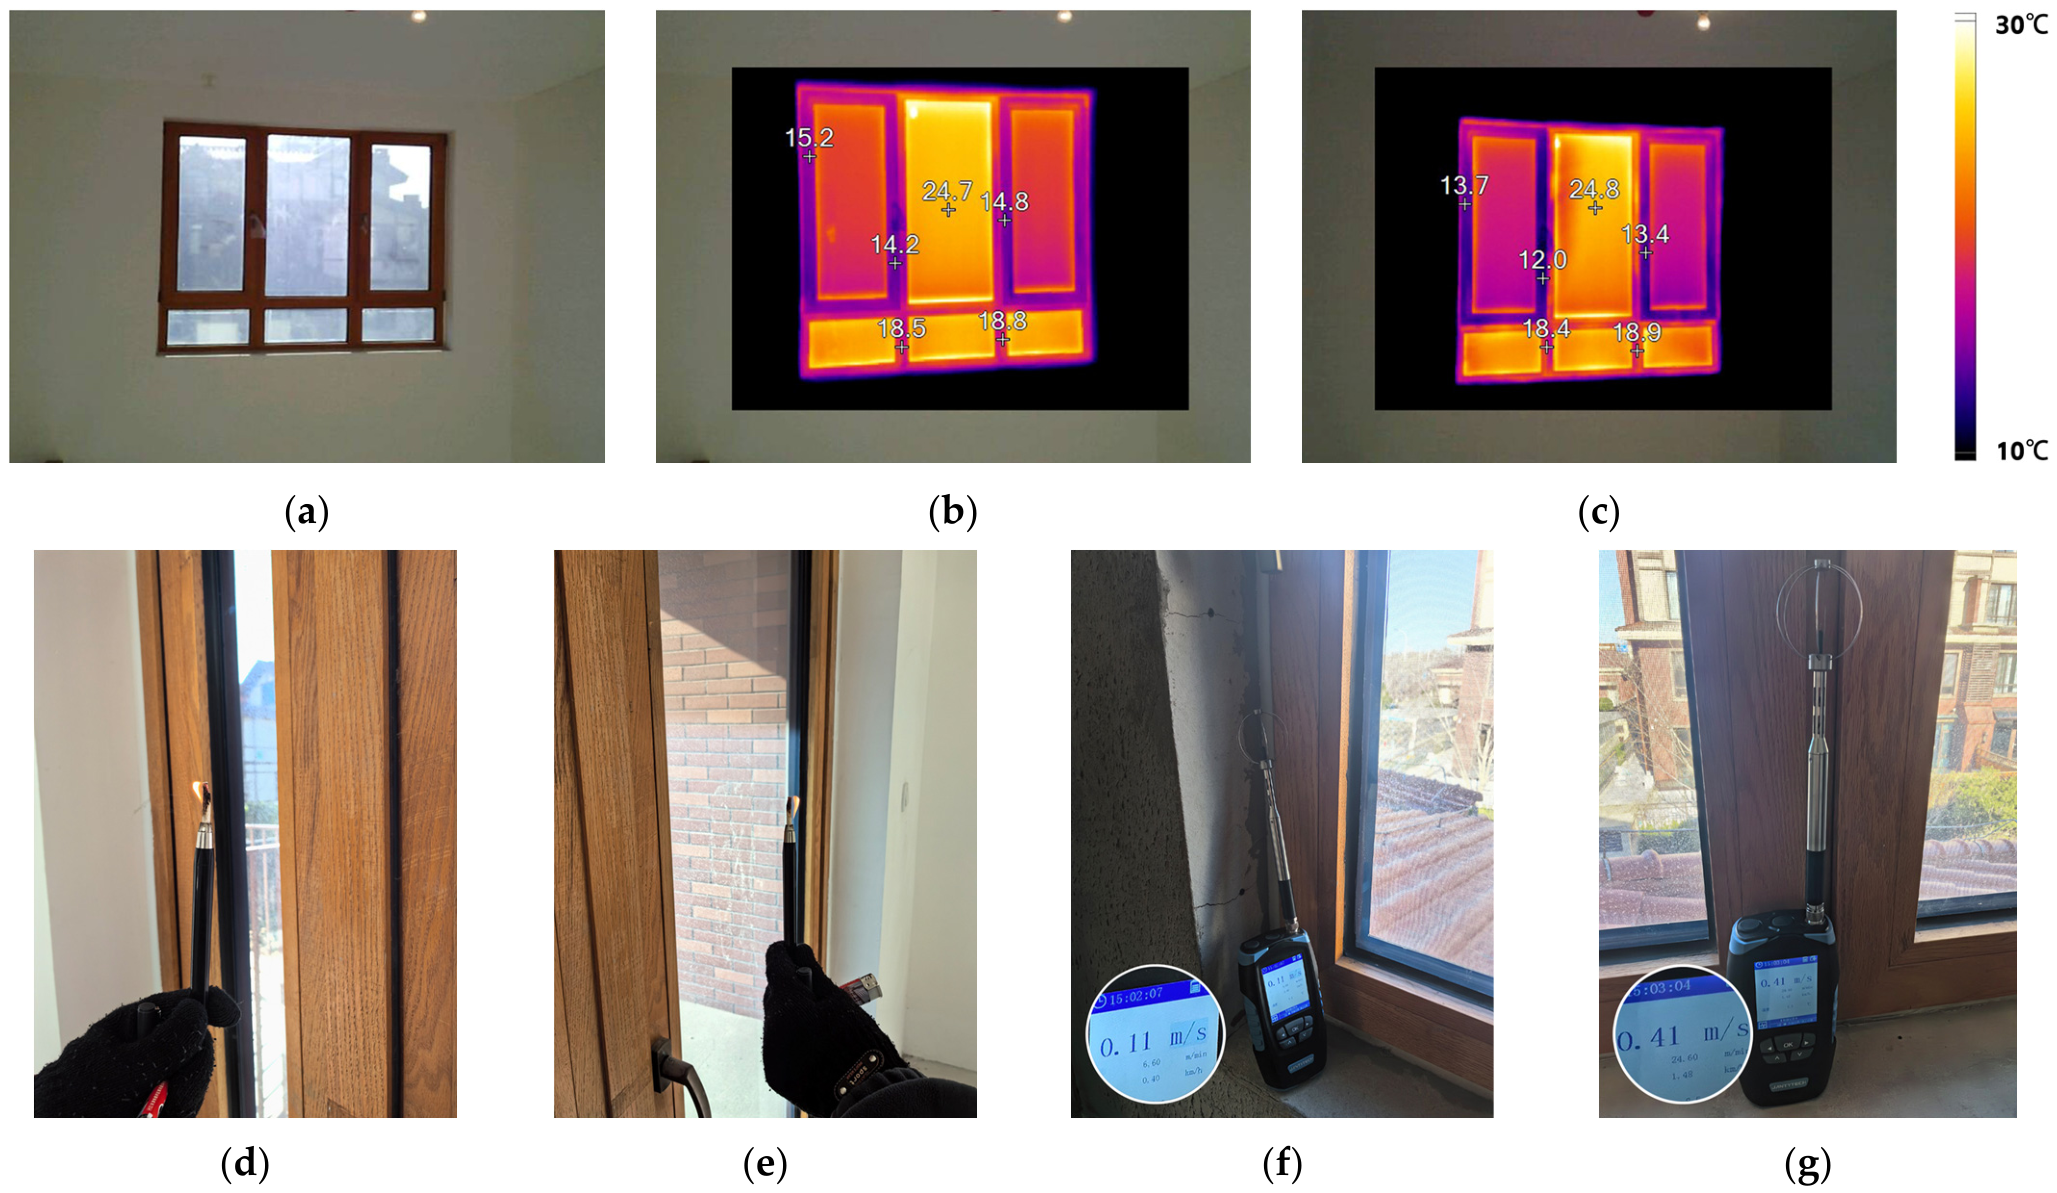
A preliminary qualitative test was conducted prior to the formal measurement. With the blower fan activated to maintain a stable pressure differential, a multi-method approach combining infrared thermography, smoke tracing, and anemometry was employed to efficiently localize primary air leakage pathways.
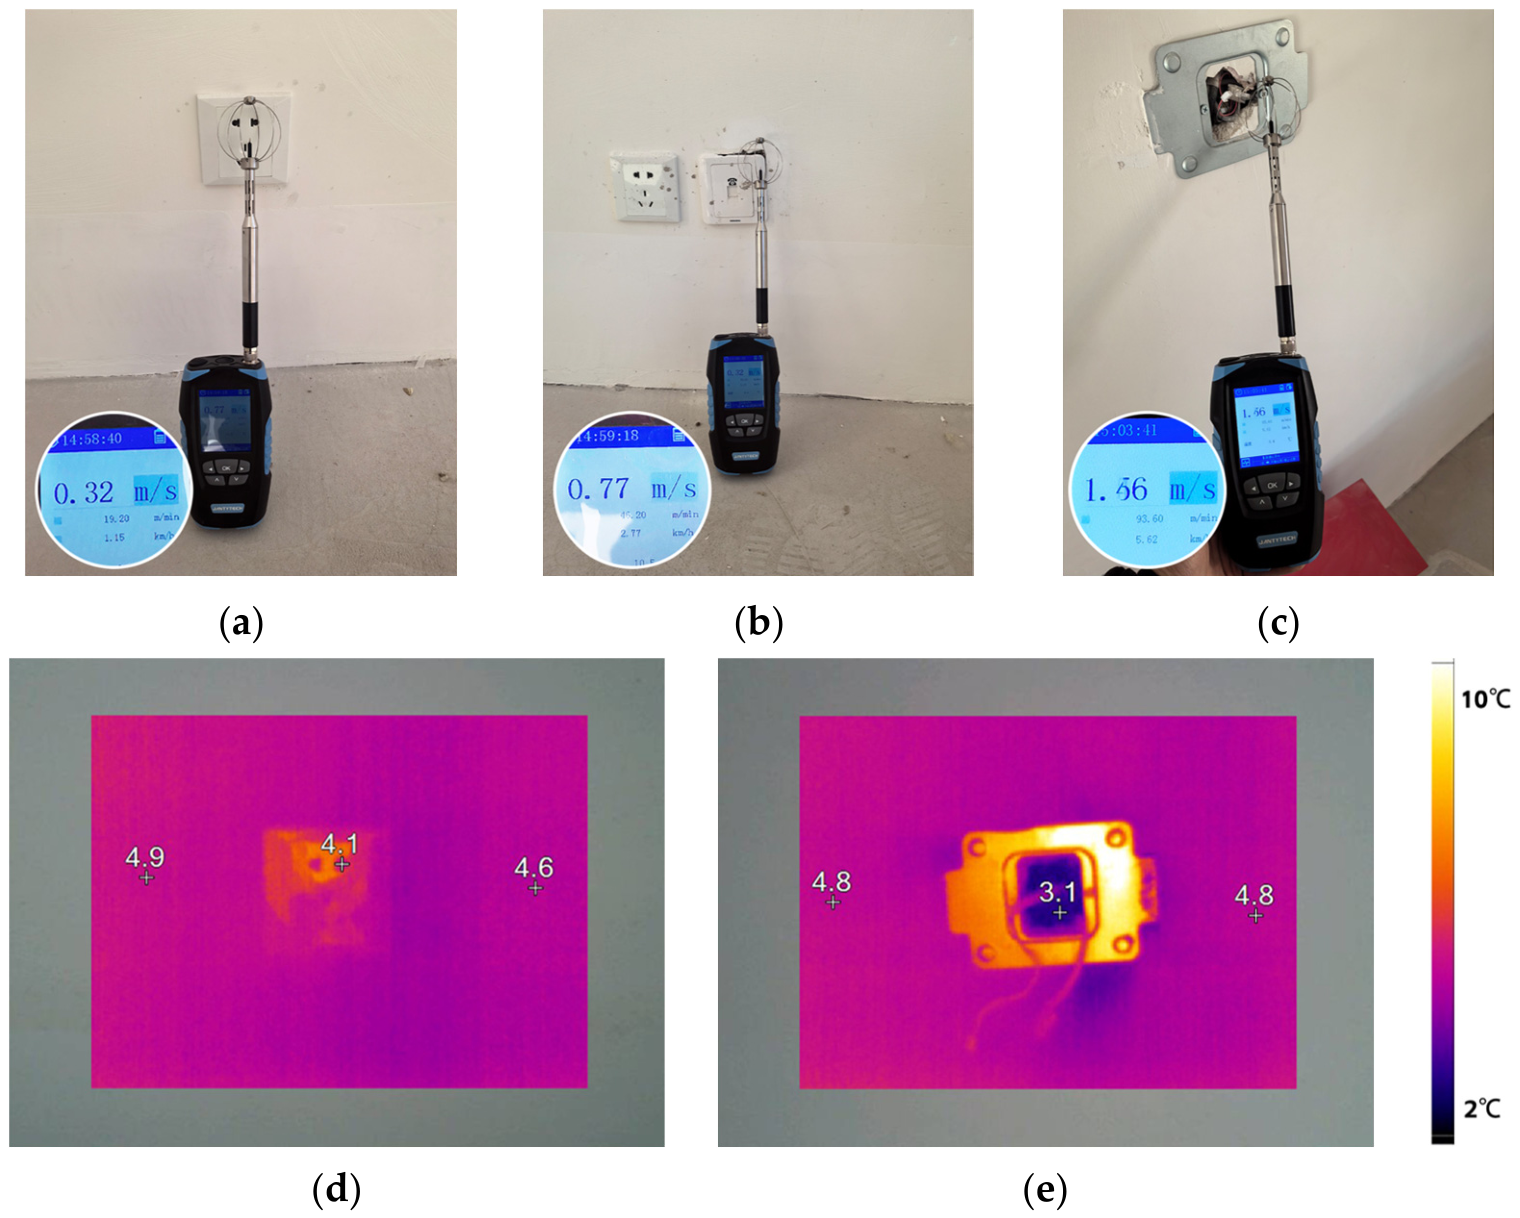
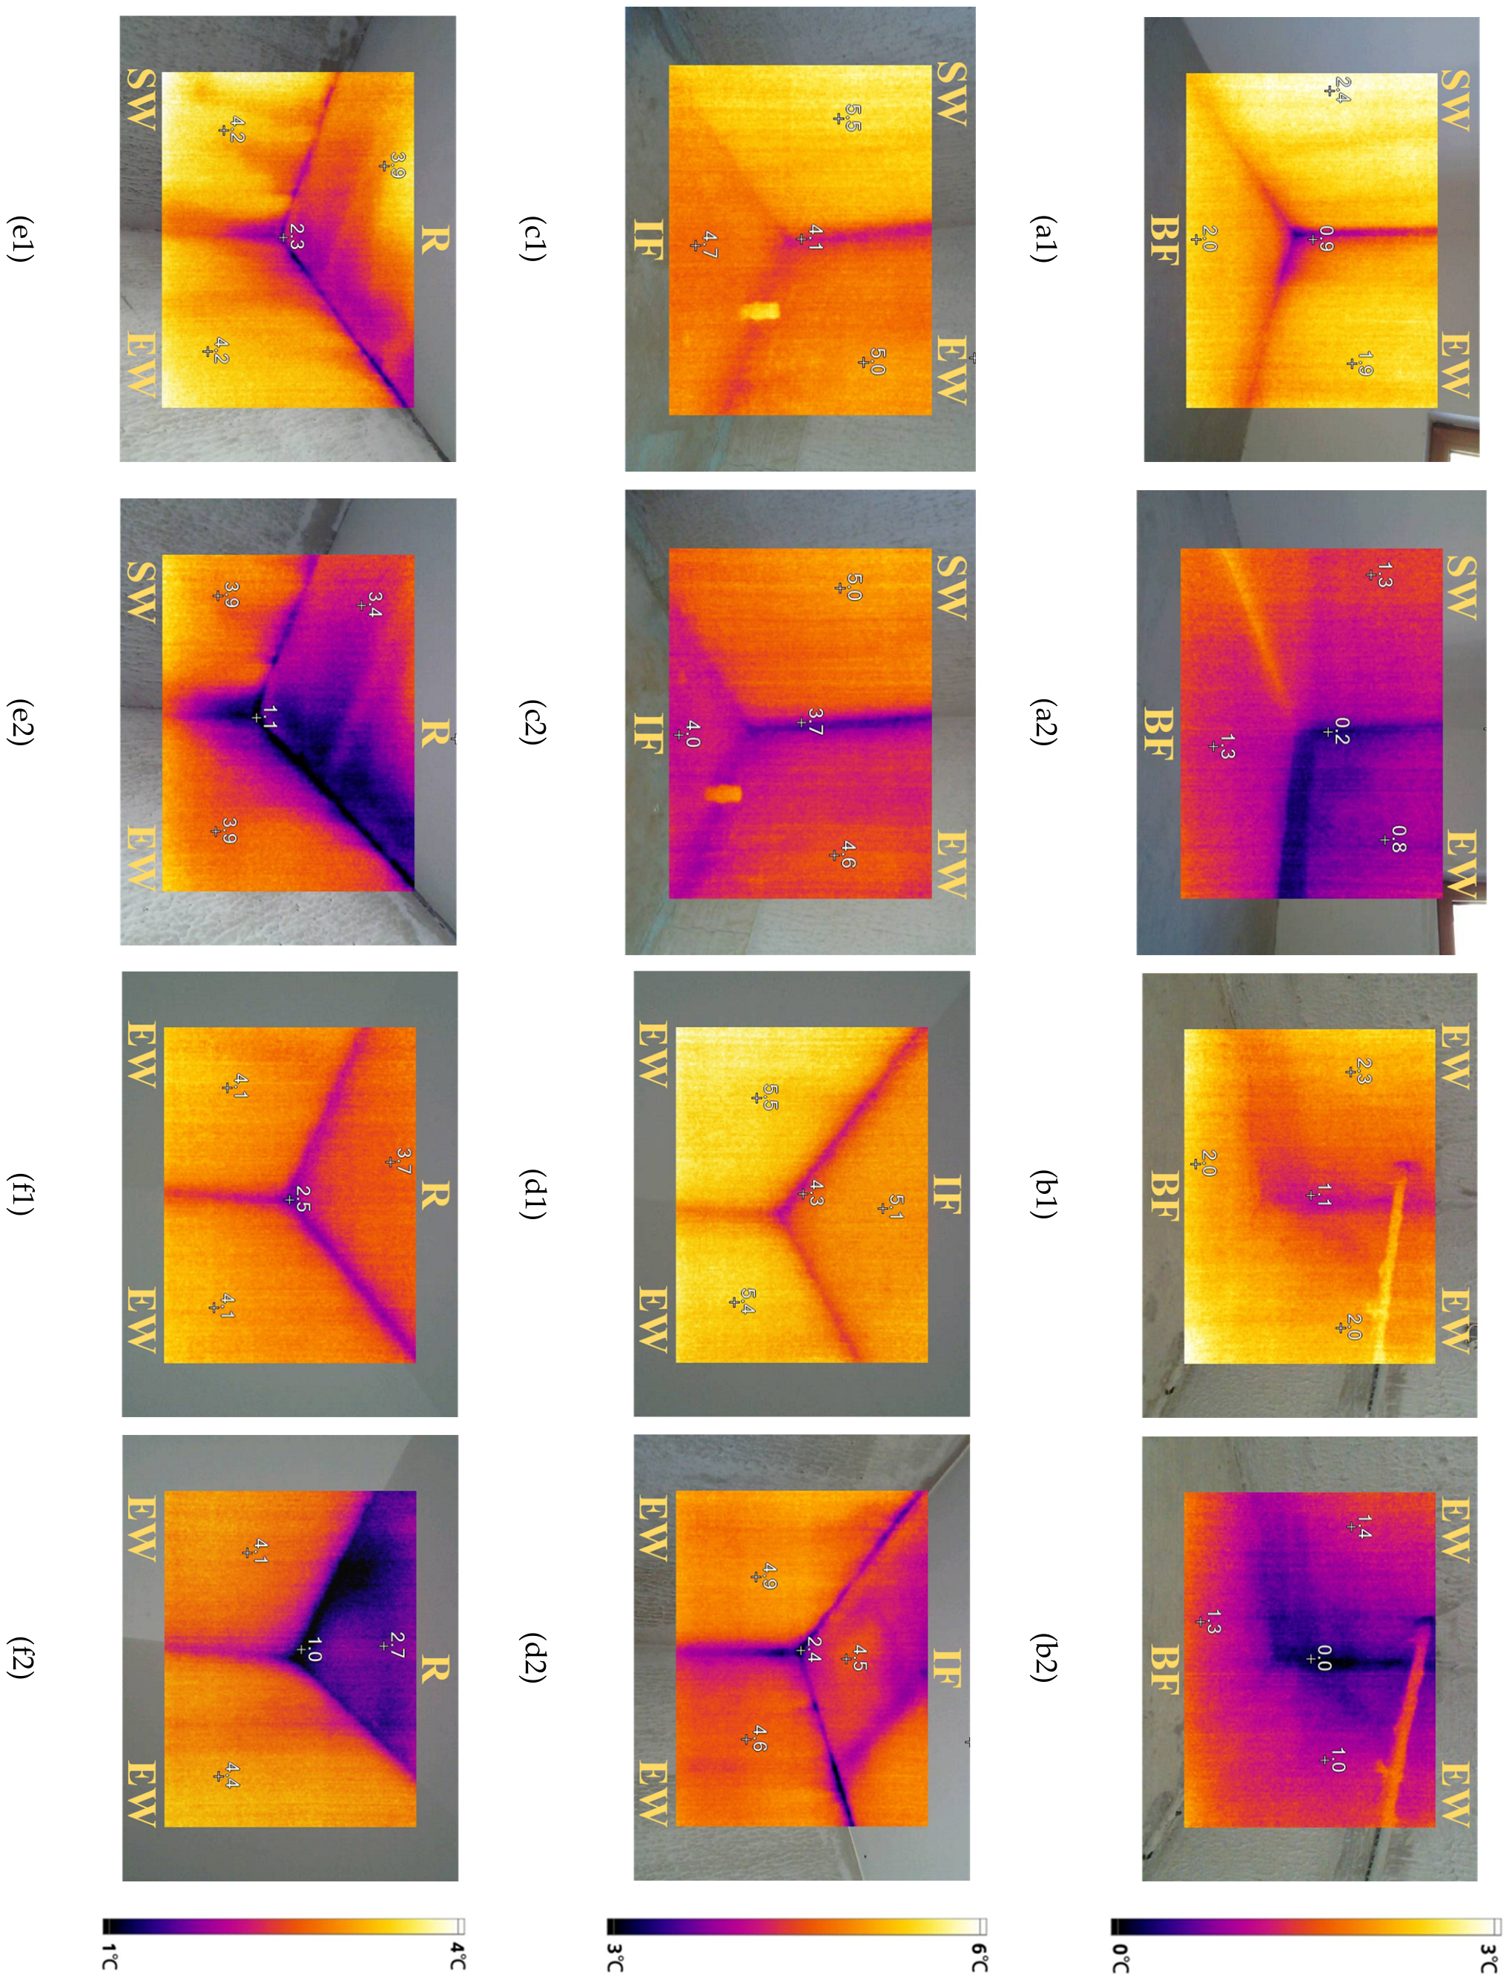
First, a comprehensive scan of the building envelope was performed using an infrared thermal imager. Areas exhibiting significant temperature anomalies under high pressure differentials compared to low pressure differentials were flagged as suspected leakage sites. Subsequently, a smoke pencil was used to visualize airflow patterns in these regions; a distinct deflection of the smoke stream confirmed the presence of air leakage. Finally, a micro-anemometer was used to monitor local air velocity at identified locations for a duration exceeding 30 s. A sustained velocity reading served as the final confirmation criterion. Preliminary diagnostics identified the primary air leakage pathways as fenestration joints, specifically at openable frames and fixed sash perimeters, as well as wall penetrations formed by electrical outlets and timber envelope connections.
2.2.4. Component Leakage Quantification via Progressive Sealing
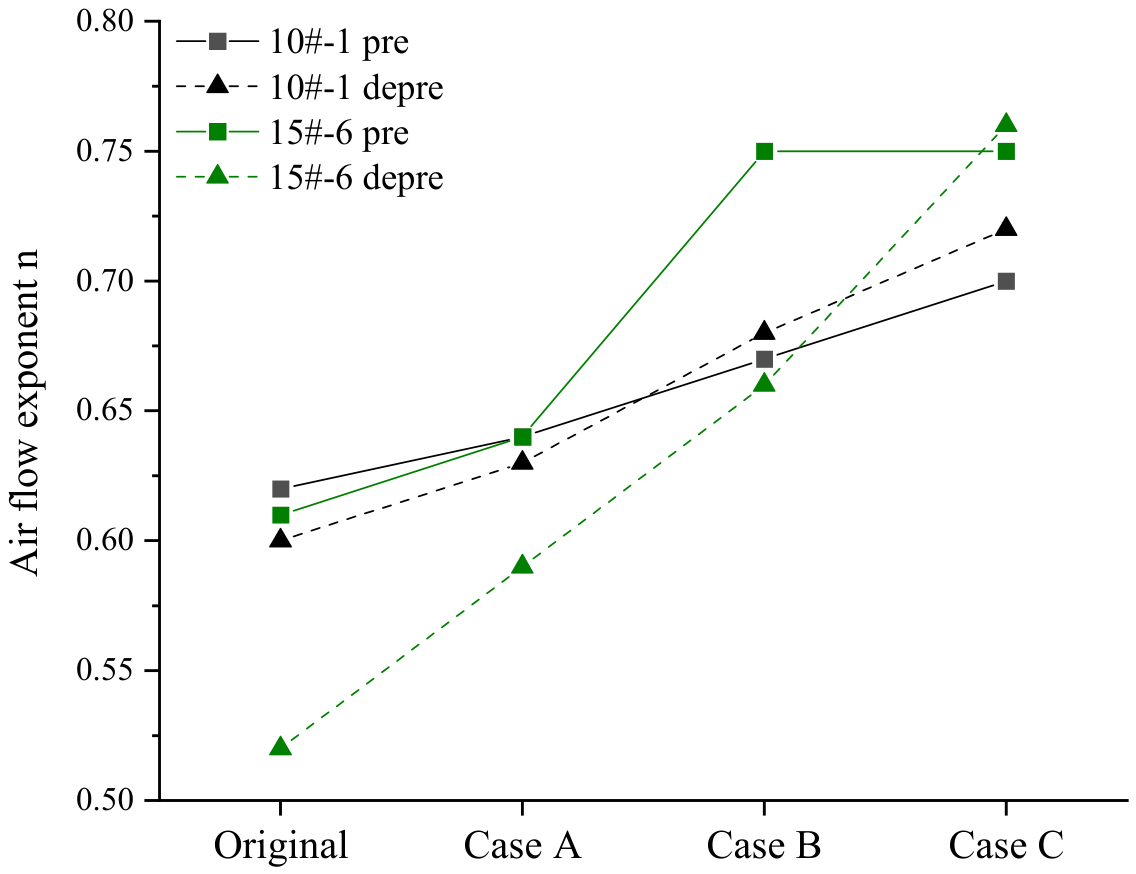
To further verify and quantify the airtightness performance of specific building components, with a particular focus on air leakage pathways through exterior fenestration and electrical wall penetrations, a comprehensive diagnostic campaign was conducted on two representative units: 10#-1 and 15#-6.
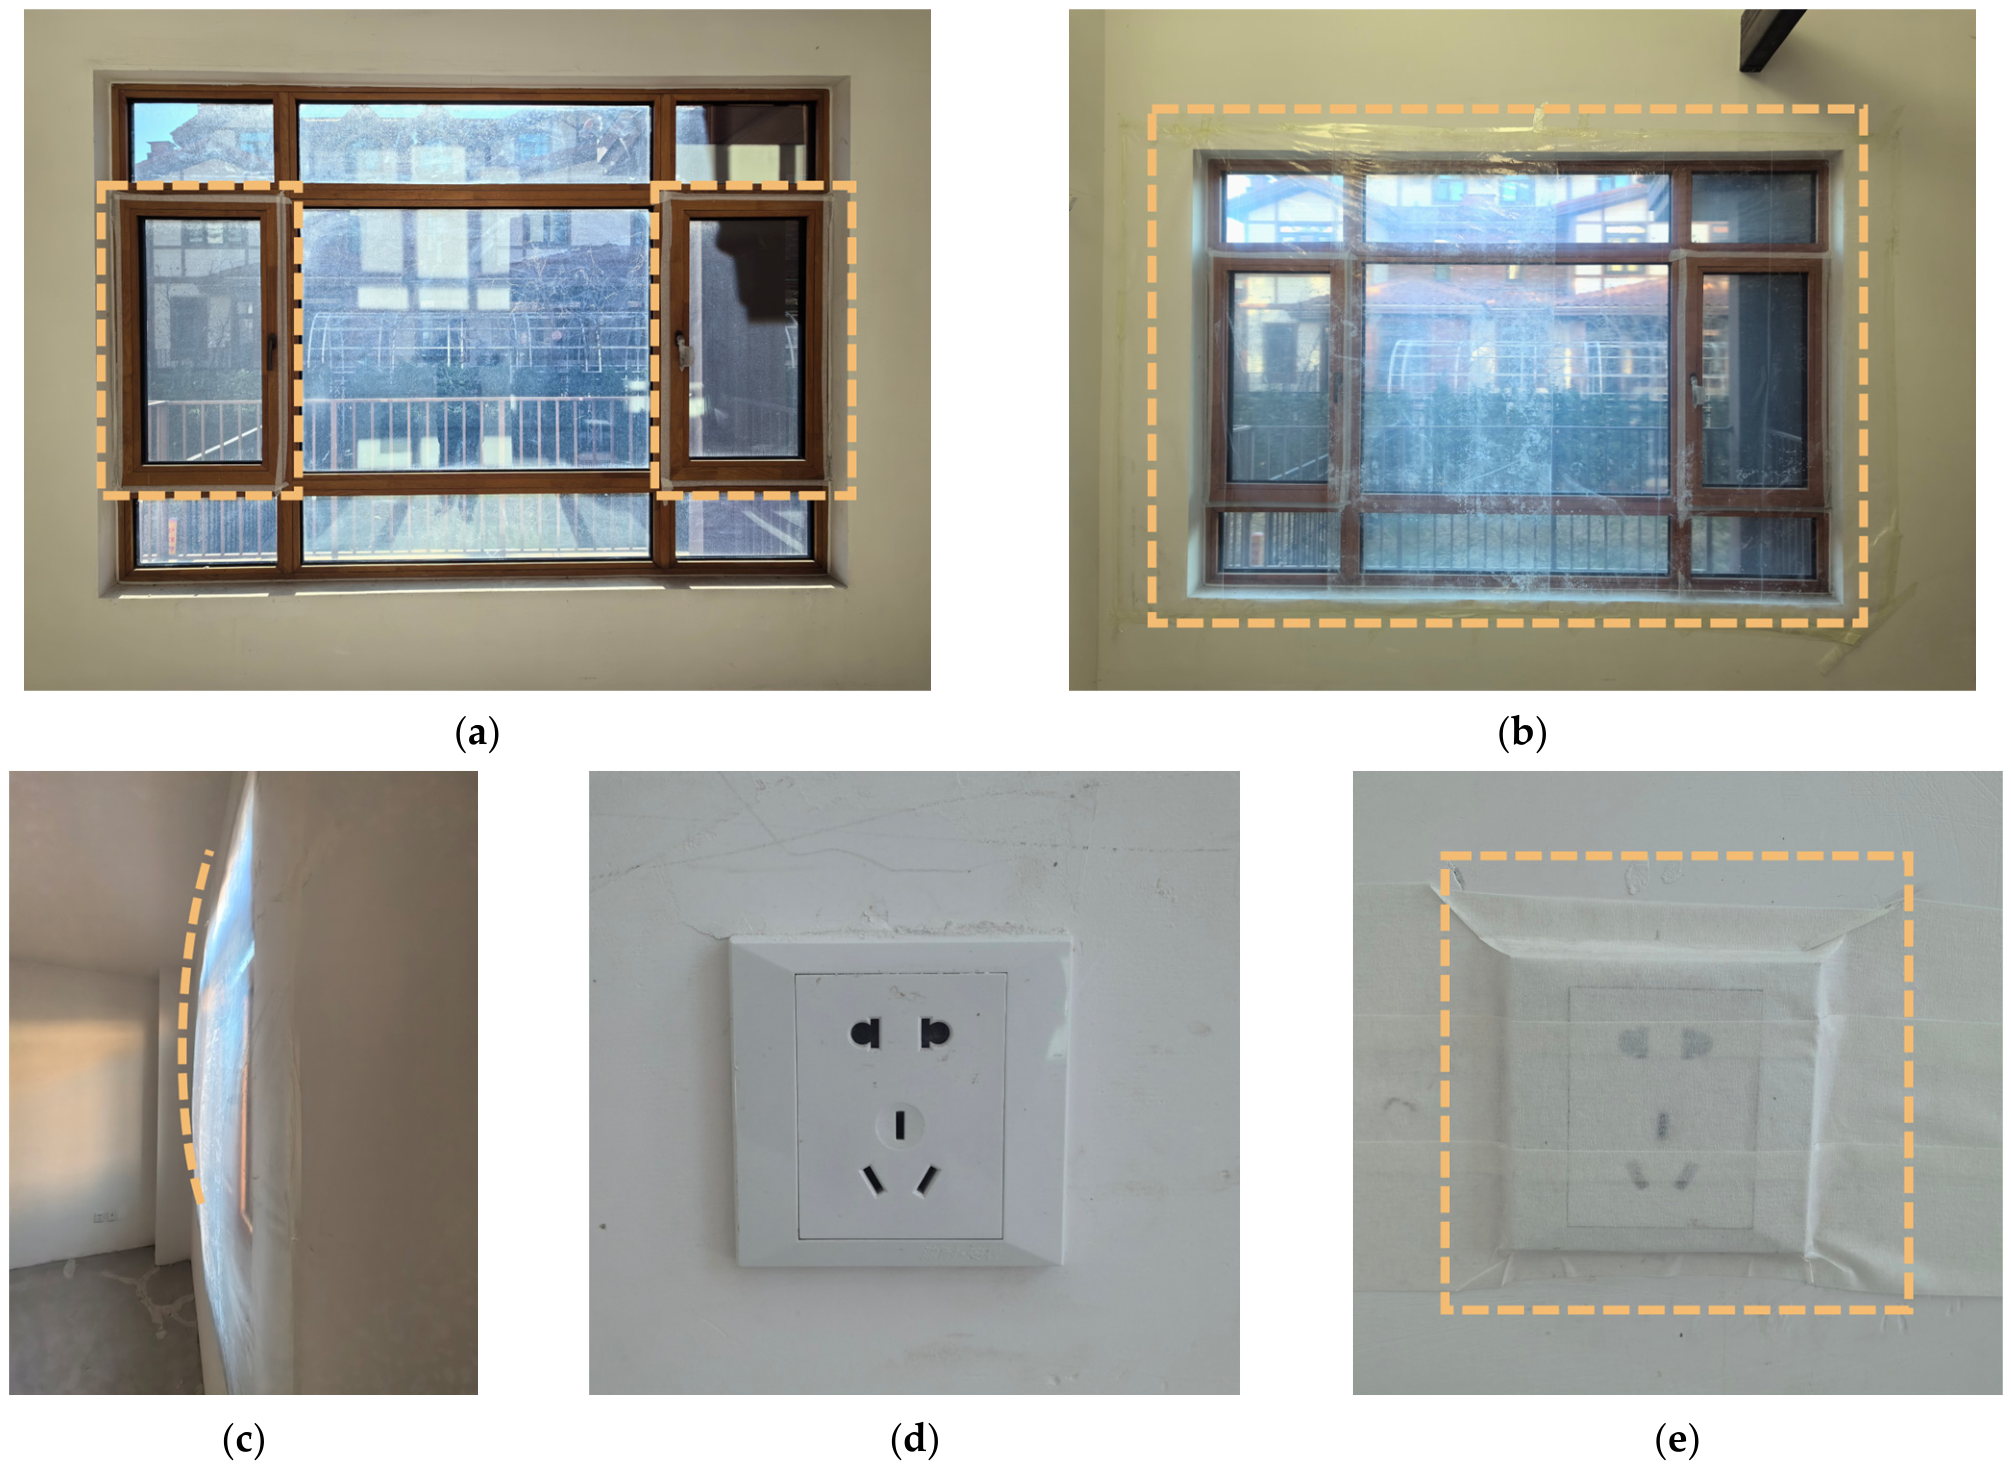
To isolate and quantify specific air leakage contributions, a progressive sealing protocol detailed in
Table 3 was implemented. The procedure commenced with Case A, which targeted operable frame joints of the exterior fenestration by sealing sash gaps with airtight tape as depicted in
Figure 7a. Subsequently, Case B involved encapsulating the entire exterior window unit using polyethylene film secured to the interior wall surface as shown in
Figure 7b; the condition of this sealed fenestration under depressurization is further illustrated in
Figure 7c. Finally, Case C addressed wall penetrations associated with electrical infrastructure such as the switches, sockets, and distribution boxes displayed in
Figure 7d, which were similarly sealed using airtight tape as demonstrated in
Figure 7e.
2.2.5. Data Validation Criteria
To quantify the air leakage contribution of specific building components, the effective leakage area (ELA) was calculated for both the baseline building envelope and the envelope with specific components sealed. By evaluating the ELA reduction across different sealing scenarios, the leakage associated with each component was isolated. The ELA is calculated using Equation (1):
where
is the airflow rate at the reference pressure difference of 4 Pa, m
3/h;
is the air density, taken as 1.29 kg/m
3;
is the reference pressure difference, taken as 4 Pa.
Furthermore, the value of
is derived by fitting the measurement data to the power law equation, expressed as Equation (2):
where
is the airflow rate through the fan, m
3/h;
is the air flow coefficient, m
3/(h·Pa
n);
is the pressure difference across the building envelope, Pa; n is the air flow exponent.
In accordance with ISO 9972:2015 [
22] and GB/T 34010-2017 [
23], the validity of the airtightness measurement results is contingent upon satisfying the following criteria:
The near-ground wind speed must be less than 3.0 m/s.
The product of the building height and the indoor-outdoor temperature difference (H·T) must be less than 250 m·K.
The correlation coefficient, derived from the least squares regression for C and n, must exceed 0.98.
The air flow exponent n must fall within the range of 0.5 to 1.0.
4. Discussion
4.1. Benchmarking Airtightness in Light Timber Constructions
The field measurements of the 18 lightweight timber houses in China’s cold region revealed a mean ACH
50 of 4.83 h
−1. When placing this empirical data within a global and regional context and systematically evaluating it against established building energy standards, as shown in
Table 8, three critical observations regarding the performance status, structural comparisons, and improvement potential of this building typology emerge.
First, the airtightness performance of the surveyed buildings aligns with the international baseline for standard timber constructions but highlights a distinct gap compared to high-performance and low-energy standards. The observed mean value 4.83 h
−1 is remarkably consistent with findings from other geographical regions where specific airtightness detailing and dedicated air barrier protocols were not rigorously enforced during the construction phase. For instance, extensive studies on lightweight timber-frame detached houses in Estonia identified a comparable mean leakage rate of 4.91 h
−1 [
26]. Similarly, researchers reported a nearly identical ACH
50 of 4.77 h
−1 for cross-laminated timber buildings in Poland [
27]. These parallels demonstrate that an ACH
50 ranging between 4.0 and 5.0 h
−1 represents a “business-as-usual” empirical baseline for timber buildings constructed globally without integrated air barrier strategies.
Second, comparative analysis confirms that lightweight timber structures possess inherent, systematically embedded vulnerabilities regarding airtightness relative to heavyweight construction systems. This performance disparity stems largely from the fundamental architectural difference between the monolithic nature of cast-in-situ concrete or masonry and the dry-assembled nature of timber systems. The latter relies heavily on the long-term precision and integrity of joint detailing, tapes, and membranes. Robust evidence for this structural divergence can be found in large-scale building stock surveys. In an extensive survey of detached houses and apartments, a distinct performance hierarchy based on envelope materials was identified [
28]. While autoclaved aerated concrete and cast-in-situ concrete dwellings achieved superior airtightness with mean ACH
50 values of 1.5 h
−1 and 1.6 h
−1, respectively, timber frame and log houses demonstrated significantly higher leakage, with average rates of 3.9 h
−1 and 6.0 h
−1, respectively [
29]. This structural trend extends to East Asian contexts as well, where light wood frame residences in Korea exhibited an average ACH
50 of 3.7 h
−1 [
30]. Although the Korean houses are slightly tighter than the 4.83 h
−1 observed in our study—likely due to differences in regional construction workflows—they consistently lag behind the performance typically achieved by reinforced concrete counterparts, underscoring the universal challenge of maintaining air barrier continuity across multi-component lightweight assemblies.
Third, despite these structural and joint-heavy challenges, high-level airtightness is not an unattainable inherent limitation for timber construction; rather, it is a direct function of workmanship quality, material selection, and regulatory stringency. It is crucial to recognize that the base material composition does not solely dictate the building’s ultimate hermeticity. For example, heavy masonry structures in regions lacking strict energy codes have been reported to perform poorly, with average leakage rates reaching as high as 6.14 h
−1 [
31]. Conversely, when engineered properly, timber construction possesses proven potential to achieve superior airtightness standards. A comprehensive study covering 558 timber-frame houses in the Czech Republic reported a significantly lower mean ACH
50 of 1.03 h
−1, with Passive House certified timber buildings achieving an elite average of just 0.44 h
−1 [
20]. This evidence explicitly demonstrates that with stringent execution and robust design, lightweight timber systems can successfully meet and surpass even the most rigorous global airtightness requirements.
Table 8.
Quantitative horizontal comparison of airtightness benchmarks.
Table 8.
Quantitative horizontal comparison of airtightness benchmarks.
| Region/Standard | Construction Type | Mean ACH50 (h−1) | Data Source |
|---|
| China (This study) | Lightweight timber houses | 4.83 (3.43–7.89) | Current Study |
| Estonia | Lightweight joist houses | 4.91 | Kalamees [26] |
| Poland | Cross-laminated timber | 4.77 | Świrska-Perkowska [27] |
| South Korea | Light wood-frame | 3.70 | Kim [30] |
| Czech Republic | Lightweight timber-frame | 1.03 | Böhm [20] |
Timber-frame houses
(Passive House Certified) | 0.44 |
| Passive House Standard | All types | ≤0.6 | Passive House Institute |
Within the specific context of China’s cold region, this sharp performance contrast provides critical insight. The higher leakage rates observed in our buildings cohort are not an unfixable defect of timber frame structures but rather reflect a localized “performance gap” driven by two coupled factors: a lack of rigid localized construction control, and the accelerated deterioration of non-specialized sealing materials under extreme seasonal thermal fluctuations. Recent evaluations under IEA EBC Annex 73 emphasize that improving whole-building airtightness in cold climates is paramount to ensuring thermal resilience and preventing energy infrastructure failure [
32]. Furthermore, because rigid exterior insulation boards (such as polyisocyanurate) and their associated membranes are often subjected to massive hygrothermal stress in cold climates, the initial material selection dictates the durability of the air barrier [
16]. Therefore, achieving ultra-low energy and passive standards in Chinese timber buildings is technically feasible, provided that rigorous airtightness workflows, specialized durable sealing tapes, and climate-resilient membranes are integrated into the regional construction specifications.
4.2. Critical Analysis of Leakage Pathways
4.2.1. Dynamic Degradation of Fenestration Airtightness
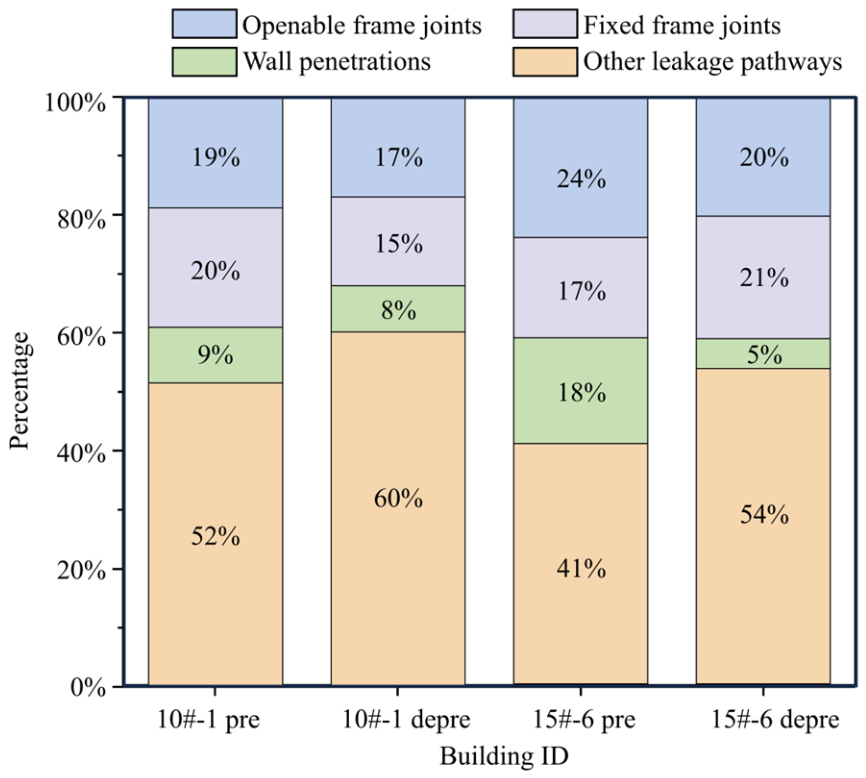
The component-specific leakage analysis revealed that fenestration systems (encompassing both openable sashes and fixed frames) acted as the primary conduit for air infiltration, contributing 38.4% to the total envelope leakage. This empirical value deviates substantially from established benchmarks; for instance, the ASHRAE Handbook and standard building physics literature typically attribute approximately 15% of total infiltration to fenestration components [
33,
34]. This discrepancy, representing a more than twofold increase over the expected baseline, cannot be explained solely by initial installation quality. Instead, it highlights the profound impact of operational aging and material fatigue. Given that the field measurements were executed five years post-construction, these insights emphasize the highly dynamic nature of building airtightness over time. While previous research by Taleb underlined that the precise initial application of appropriate sealants is a prerequisite for achieving building energy efficiency [
35], our long-term findings suggest that the durability and aging characteristics of these seals constitute the actual limiting factors.
Visual and thermographic inspections corroborated this mechanism, revealing explicit physical detachment, hardening, and shrinkage of weatherstripping materials. These physical defects directly correlated with the distinct thermal anomalies captured at the frame joints via infrared thermography. This phenomenon aligns with the longitudinal evidence presented by González-Lezcano et al., who identified carpentry joints as progressive structural weak points that degrade under environmental exposure, thereby gradually compromising the hermetic integrity of the building envelope [
36]. Furthermore, the elevated leakage rates specifically localized at openable sashes (20.0%) reflect mechanical wear-and-tear induced by repetitive cycles of occupancy operation, a behavioral degradation pathway previously documented by Gullbrekken et al. [
37] and Sfakianaki et al. [
38]. Consequently, relying exclusively on initial commissioning values recorded at building handover may significantly underestimate the actual long-term infiltration rates and associated energy penalties. To sustain the intended thermodynamic performance of the envelope, proactive maintenance protocols involving periodic gasket replacement and targeted re-caulking are imperative. In this context, Yuk et al. demonstrated that such localized maintenance retrofits can recover up to 35% of the lost airtightness performance [
39].
4.2.2. Diffuse Leakage Challenge in Timber Assemblies
Approximately half (48.2%) of the total measured air leakage was classified as “diffuse” flow, which could not be isolated or attributed to distinct macroscopic penetrations or localized fenestration elements. Driven by the thermal gradients visualized via infrared thermography, this diffuse infiltration was deduced to be heavily concentrated at complex structural intersections, primarily the wall–roof and wall–floor interfaces. This finding exposes an intrinsic vulnerability of lightweight timber frame constructions compared to monolithic configurations like concrete structures: the spatial continuity of the primary air barrier system (typically the airtight breathable wrap or vapor retarder membrane) is frequently interrupted or compromised at geometric nodes.
Although Kalamees previously identified these macro-junctions as critical failure points regarding envelope airtightness [
26], recent academic investigations suggest that the infiltration pathways extend into the inherent timber components themselves. Specifically, Cochon and Richman demonstrated that significant air paths regularly manifest through unsealed joints and structural panel edges within timber assemblies [
17]. In the multi-family buildings surveyed in this study, the deployment of conventional “wrapping” methodologies without specialized heavy-duty taping or rigid air barrier detailing at the structural intersections proved inadequate to arrest this diffuse air movement. These deficiencies strongly support the assertions of Ji et al., who argued that achieving ultra-low energy and passive house standards requires systematic, redundant safeguarding measures—such as continuous, dedicated taping of all sheathing joints and the mandatory integration of pre-compressed sealing tapes at material transitions—rather than relying on the nominal airtightness properties of standalone material layers [
40].
4.2.3. Breach of the Control Layer via Service Penetrations
In contrast to traditional masonry walls, where continuous interior plaster layers effectively establish a robust and monolithic air seal, the hollow cavity configuration inherent to lightweight timber wall assemblies renders them exceptionally susceptible to air bypass via service penetrations. Our micro-environmental measurements quantified high-velocity air currents traversing electrical junction boxes and wall outlets, reaching peak velocities of 1.56 m/s. This directly confirms that the integrity of the airtight control layer was severely breached during the first-fix installation of building services, exposing a systemic lack of coordination between the structural airtightness strategy and the mechanical, electrical, and plumbing (MEP) trades.
The significant localized thermal depressions observed at these electrical nodes indicate a direct convective bypass of the thermal insulation layer. This phenomenon not only exacerbates sensible building energy losses but also introduces a severe risk of interstitial condensation when cold, dry outdoor air meets warm, moisture-laden indoor vapor within the cavity. Hong and Kim demonstrated that the rigorous localized sealing of electrical and mechanical penetrations alone could yield a substantial reduction in the overall building air change rate by approximately 0.1 h
−1 [
41]. In the context of the investigated timber buildings, the implementation of proprietary airtight electrical back-boxes or the application of expansive polyurethane foam sealants behind faceplates represents a low-cost, high-impact technical intervention that was conspicuously omitted from the original construction specifications.
Furthermore, this challenge of maintaining control layer continuity is not confined to micro-scale penetrations but extends to macro-scale structural interfaces. Combining controlled laboratory experiments with empirical field testing, Kalamees et al. verified that the junctions connecting external walls to floors or partition walls, alongside external wall corners, exhibit the most severe structural air leakage across timber frame envelopes [
42]. Synthesized together, these findings highlight that in the absence of meticulous detailing at both the micro-scale (outlets) and macro-scale (junctions), the theoretical performance of an engineered air barrier system is easily invalidated by standard, unmonitored site construction practices.
4.3. Main Factors Affecting Building Airtightness
To isolate the primary determinants governing the airtightness of the building envelope, this study executed a systematic correlation analysis between the empirically measured air leakage rates and a selection of potential physical and geometric influencing factors. For the dependent variables—specifically the air leakage rate at 50 Pa (Q50) and the air change rate at 50 Pa (ACH50)—the arithmetic means derived from the respective pressurization and depressurization test cycles were utilized.
While the existing literature on building physics typically emphasizes macroscopic variables such as generalized construction methods, structural typologies, total fenestration ratios, and macro-envelope dimensions [
26,
43,
44], the subject buildings of this study comprise a homogenous batch of light wood-frame structures built concurrently. Consequently, the statistical analysis prioritized specific geometric and physical parameters: floor area (A
F), volume (V), cooling area (A
C), envelope area (A
E), length of windows (L
W), length of windows openable (L
WO), building length (L), and building height (H).
Standard parametric statistical measures, such as the Pearson product-moment correlation coefficient, require the underlying variables to satisfy a bivariate normal distribution. Conversely, non-parametric alternatives like the Spearman rank correlation coefficient and the Kendall rank correlation coefficient do not rely on raw variable distribution assumptions, with the latter being optimized for ordered categorical data. Because the geometric and physical parameters collected in this cohort violated the assumption of bivariate normality, the Spearman rank correlation coefficient was selected to evaluate the strength and direction of the relationships between the airtightness metrics and the geometric predictors.
The output of the Spearman rank correlation and significance analysis is compiled in
Table 9. Utilizing a critical significance threshold of 0.05, several geometric predictors demonstrated statistically significant correlations with both Q
50 and ACH
50, namely V, A
C, A
E, L
W and L
WO. Furthermore, the A
F was identified as a significant influencing factor exclusively for Q
50, whereas the L exhibited a highly significant correlation uniquely with ACH
50.
4.4. Prediction Model of Q50
To establish an empirical prediction framework suitable for practical design applications, multiple linear regression (MLR) modeling was employed to quantify the multivariate relationship between the Q
50 and the building’s geometric parameters. Given the intensive multicollinearity characteristically observed among interrelated building features, three distinct variable selection strategies were rigorously evaluated and compared. The dependent variable was rigorously defined as Q
50, while the initial independent variable pool encompassed A
F, V, A
C, A
E, A
W, L
W, L
WO, L and H. All statistical regression operations were executed utilizing the IBM SPSS Statistics 27 software environment, following the mathematical and procedural protocols detailed in
Appendix A.
To establish a practical prediction model, multiple linear regression was employed to analyze the correlation between Q50 and geometric parameters. Given the strong multicollinearity among building features, three variable selection strategies were rigorously compared. The dependent variable was defined as Q50, and the independent variables included AF, V, AC, AE, AW, LW, LWO, L and H. The entire regression process was carried out using the SPSS software, as detailed in
Appendix A.
Enter Method: In this baseline approach, all potential geometric predictors were simultaneously introduced into the regression matrix. Although this unrestricted model achieved a high coefficient of determination (R2 = 0.935), the diagnostics revealed excessively high variance inflation factors (VIF), and the majority of individual independent variables failed to achieve statistical significance (p > 0.05). This critical pathology indicated severe model overfitting driven by multicollinearity, rendering the resulting equation unstable and unsuitable for practical engineering predictions.
Stepwise Method: Utilizing strict iterative selection criteria, the entry and removal thresholds for independent variables were set at p < 0.05 and p > 0.10, respectively. The resulting optimization process retained only a single predictor variable: building volume (V). Although this single-variable model achieved a robust coefficient of determination (R2 = 0.926) and offered superior mathematical simplicity, it was ultimately rejected from an architectural engineering perspective because it failed to leverage multi-dimensional geometric characteristics to explain the underlying physical mechanisms of air leakage.
Backward Elimination: Initiating the regression matrix with the full set of independent variables, the least statistically significant predictors were systematically and iteratively removed based on probability criteria. The final parsimonious model successfully retained two critical, non-redundant geometric dimensions: floor area (A
F) and building length (L). This optimized regression structure achieved a high coefficient of determination (R
2 = 0.932, Adjusted R
2 = 0.923), with the VIF stabilized at approximately 3.1. These collinearity diagnostics demonstrate that mutual variable inflation is well-controlled and the mathematical structure of the model is robust against data perturbations. Consequently, this formulation was selected as the optimal predictive model, expressed mathematically in Equation (5):
where
is the air leakage rate at 50 Pa, m
3/h; A
F is the floor area, m
2; L is the building length, m.
Although this study is situated in the context of North China, the proposed methodology and prediction model are highly adaptable for international deployment and for various timber construction systems. The tripartite diagnostic framework, combining blower-door testing at the macroscopic level, air-velocity tracing at the microscopic level, and infrared thermography, constitutes a universal and repeatable workflow for airtightness benchmarking, especially in data-sparse environments. More importantly, while the empirical coefficients of the prediction model are inherently tied to local construction quality and specific building practices, the model’s fundamental geometric basis—using floor area and envelope length as predictors—is rooted in well-established building physics. This implies that for different construction details, material assemblies, or regional craftsmanship, researchers can readily follow the same logical procedure to derive tailored fitting equations, simply by re-estimating the coefficients using locally measured airtightness datasets. Consequently, the model not only serves the original regional context but also offers a flexible, cost-effective tool for global building performance assessment, adaptable to a wide spectrum of structural systems and construction customs.
5. Conclusions
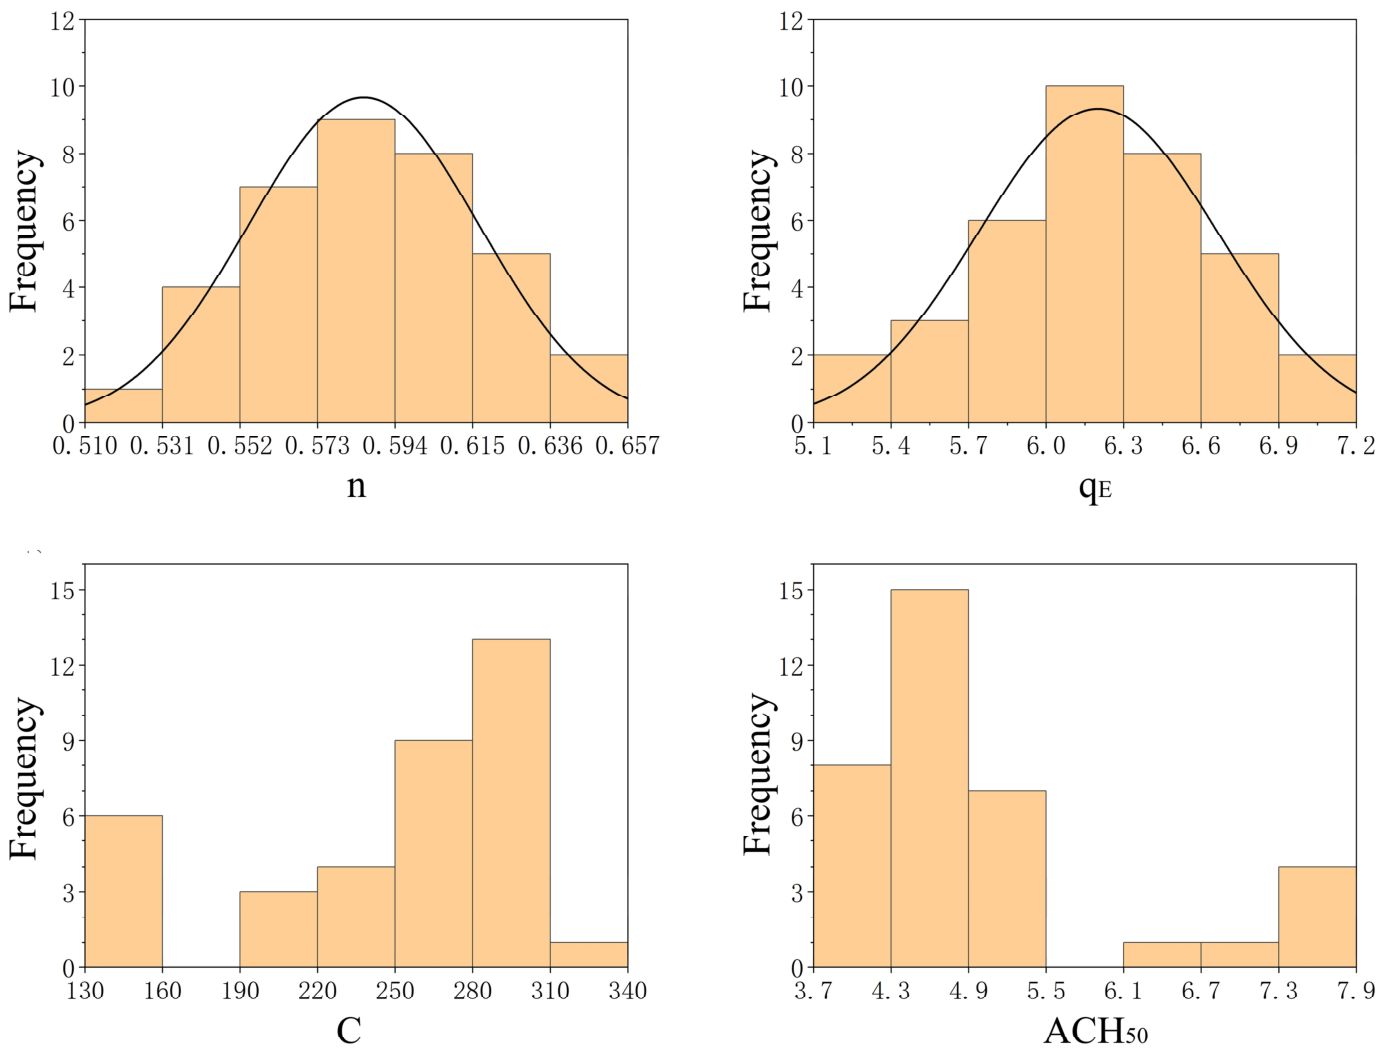
This study provides a comprehensive empirical baseline for the airtightness performance of lightweight timber buildings under the construction practices and cold climatic conditions of China. Based on field measurements of 18 representative dwelling units, the overall airtightness level was quantified, revealing an air change rate at 50 Pa (ACH50) ranging from 3.43 to 7.89 h−1 with a mean value of 4.83 h−1, while the average air leakage rate per unit envelope area (qE) was evaluated at 6.102 m3/(m2·h). The air flow exponent (n) varied between 0.520 and 0.641 with an average of 0.586, demonstrating that air leakage in these dry-assembled timber envelopes is predominantly governed by turbulent flow through macro-orifices rather than laminar diffusion. Statistically, the qE dataset adhered strictly to a normal distribution (p > 0.05), confirming its reliability as a size-independent benchmark for assessing the envelope construction quality of this specific building typology.
Through progressive sealing protocols and infrared thermography, the critical leakage pathways were diagnosed and successfully quantified, isolating 51.8% of the total effective leakage area (ELA). Exterior fenestration emerged as the most dominant compromise to the air barrier system, with openable frame joints and fixed sash perimeters contributing 20.0% and 18.4% to the total leakage, respectively, driven by mechanical wear and long-term material fatigue five years post-construction. Hollow cavity walls were found highly vulnerable to services installation, with service penetrations (e.g., electrical junction boxes and network interfaces) accounting for 9.9% of the leakage due to localized breaches of the control layers, inducing maximum airflow velocities up to 1.56 m/s. Crucially, the remaining 48.2% of unaccounted, diffuse leakage was thermographically traced to geometric intersections of the timber framing, where the severity of structural joint infiltration followed a distinct descending hierarchy of: Wall-Roof (EW-R) > Wall-Wall (EW-EW) > Wall-Bottom Floor (EW-BF) > Wall-Separating Wall (EW-SW) > Wall-Intermediate Floor (EW-IF).
Spearman rank correlation analysis validated that building air leakage rates are significantly associated with geometric parameters, indicating a proportional scaling of leakage pathways with building size. To circumvent severe multicollinearity among building features, a multiple linear regression model was successfully developed via a backward elimination approach (R2 = 0.932, Adjusted R2 = 0.923, VIF = 3.1). The derived empirical formula (,) enables a rapid, robust prediction of the building air leakage rate at 50 Pa utilizing only two fundamental, readily accessible parameters: net floor area (AF) and the total length of envelope junctions (L).
The empirical findings and the simplified prediction model presented in this study establish a pivotal engineering reference for the design, energy simulation, and policy-making of low-energy timber buildings in cold regions. The distinct performance gap between local practices and international high-performance standards (such as Passive House criteria) underscores that material properties are not the bottleneck; rather, the realization of airtightness targets hinges entirely on design detailing and workmanship control. To bridge this gap, mandatory design protocols must transcend simple “membrane wrapping” to mandate specialized structural node taping and pre-compressed sealing tapes at wall-roof and wall-floor intersections. Furthermore, the rapid deterioration of fenestration seals and the direct insulation bypass at electrical penetrations highlight that implementing airtight electrical boxes and establishing lifecycle maintenance protocols—such as periodic gasket replacement and re-caulking—are imperative to safeguarding long-term building thermal comfort and structural hygrothermal durability.