Article

Investigation of Macro–Micro Evolution Mechanisms and Development of a Particle-Damage-Based Creep Model for Calcareous Sand Under Direct Shear Creep

Guangxi Key Laboratory of Geomechanics and Geotechnical Engineering, Guilin University of Technology, Guilin 541004, China
*
Author to whom correspondence should be addressed.
Buildings 2026, 16(14), 2856; https://doi.org/10.3390/buildings16142856
Submission received: 15 June 2026 / Revised: 15 July 2026 / Accepted: 15 July 2026 / Published: 17 July 2026

Abstract

The creep behavior of calcareous sand strongly influences the long-term deformation and bearing stability of calcareous sand foundations. Understanding its macro- and microscale responses under direct shear creep loading is therefore essential for engineering applications. In this study, direct shear creep tests were conducted under normal stresses ranging from 50 kPa to 600 kPa and shear stress ratios (τ/τf) ranging from 0.3 to 0.9. Sieve analysis, scanning electron microscopy (SEM), and image analysis were used to quantify changes in shear strain, shear strain rate, particle breakage ratio, and particle morphology before and after creep. A semi-empirical direct shear creep model was developed by combining a macroscopic stress-driven component with a microscopic damage factor. The model accounts for the coupled effects of applied stresses, particle breakage, and morphology evolution on time-dependent deformation. The results showed that calcareous sand exhibited pronounced nonlinear creep behavior. Increasing the normal stress and shear stress ratio increased the final shear strain and prolonged the stabilization time, which reached 4750 min under the highest stress condition. The particle breakage ratio increased substantially from 0.001 (at σn = 50 kPa and τ/τf = 0.3) to 0.081 (σn = 600 kPa, τ/τf = 0.9). Microscopic observations showed that creep caused progressive surface abrasion, corner rounding, localized particle fracture, and particle rearrangement. Consequently, particle roughness, angularity, and aspect ratio decreased, whereas roundness increased. The proposed model effectively reproduced the evolution of shear strain over time, with coefficients of determination greater than 0.966 under all experimental conditions. These results demonstrate that the model provides a good description of the experimental creep response under the tested stress conditions. These findings provide a mechanism-informed semi-empirical framework for predicting long-term deformation and evaluating the stability of calcareous sand foundations in offshore engineering.

1. Introduction

Calcareous sand is widely distributed on coral reef islands and in tropical and subtropical marine environments. As a widely occurring biogenic granular material, it commonly serves as a foundation material for marine engineering facilities, reef-island infrastructure, port facilities, and offshore structures. Unlike terrigenous quartz sand, calcareous sand is characterized by well-developed intraparticle pores, irregular particle shapes, pronounced angularity, rough surface textures, and low resistance to particle crushing. Consequently, its mechanical behavior is highly sensitive to particle breakage, particle rearrangement, and the evolution of interparticle contact structures [1,2,3]. Under sustained loading, calcareous sand foundations may experience progressive creep deformation, leading to increased settlement, reduced bearing capacity, and compromised long-term serviceability [4]. Accordingly, understanding the macroscopic deformation characteristics and microscopic evolutionary mechanisms of calcareous sand during creep is essential for evaluating the long-term stability of reef-island engineering foundations.
In recent years, studies of the macroscopic and microscopic creep behavior of calcareous sand have primarily relied on uniaxial and triaxial testing methods. Zeng and Liu [5,6] analyzed the creep and particle breakage characteristics of calcareous sand under different stress paths using uniaxial and triaxial compression tests, respectively. Yu [7] conducted a series of triaxial tests on coral sand, demonstrating that confining pressure and cyclic loading significantly affect the degree of particle breakage. By comparing the triaxial creep responses of coral sand and quartz sand, Lv et al. [8] found that coral sand exhibits substantially greater axial and shear creep deformation than quartz sand under identical stress states. Ye et al. [9] proposed a drained creep model for South China Sea calcareous sand, emphasizing the importance of accounting for long-term deformation when predicting the settlement of reef-island foundations. Gao et al. [10] investigated the creep behavior and particle morphology evolution in calcareous sand through triaxial creep tests, highlighting the roles of confining pressure, deviatoric stress, particle size, and particle breakage in controlling creep deformation. Wei et al. [11,12] examined particle breakage and morphological changes during one-dimensional compression using dynamic image analysis and acoustic emission techniques. Although these studies have provided a valuable foundation for understanding the creep behavior of calcareous sand, deformation in uniaxial and triaxial compression is predominantly governed by volumetric compression and three-dimensional particle rearrangement. Consequently, such tests cannot adequately capture particle sliding, rolling, surface abrasion, localized breakage, and rearrangement along a predefined shear plane—mechanisms particularly relevant under direct shear conditions. Therefore, targeted investigations are needed to clarify the macroscopic and microscopic characteristics of the long-term creep behavior of calcareous sand under direct shear loading.
Currently, studies on the macroscopic and microscopic characteristics of calcareous sand under direct shear creep remain limited. Tang et al. [13] conducted direct shear creep tests on South China Sea calcareous sand and developed a breakage-dependent shear creep model by incorporating a particle breakage parameter into the Singh–Mitchell framework. Choo et al. [14] reported that particle breakage can occur even under relatively low shear stresses, thereby inducing pronounced creep deformation. Zhang et al. [15] investigated the shear behavior of calcareous sand with varying particle size distributions and demonstrated that gradation changes affect both the macroscopic shear response and particle morphology evolution. Based on direct shear testing, Feng et al. [16] and Wang et al. [17] demonstrated the effects of particle sliding, rotation, and breakage on the macroscopic shear response of calcareous sand. Li et al. [18] further demonstrated, through particle crushing tests and three-dimensional morphological analysis, that external morphology and internal pore characteristics influence the breakage mode and crushing strength of individual particles. Wei et al. [19] quantified particle morphology parameters using dynamic image analysis and validated the effectiveness of image-based descriptors in differentiating particle shapes. These studies collectively indicate that direct shear creep in calcareous sand is characterized not only by time-dependent macroscopic shear strain development but also by microscopic processes including particle breakage, surface abrasion, and the reorganization of particle contacts [20,21,22,23]. However, existing research has predominantly focused on the relationship between the particle breakage ratio and macroscopic shear creep behavior. Quantitative investigations of particle morphology evolution during direct shear creep and its relationship with macroscopic creep deformation remain insufficient.
To address this research gap, direct shear creep tests were conducted on calcareous sand collected from a reef island in the South China Sea under different normal stresses and shear stress ratios. Changes in shear strain, shear strain rate, and stabilization time under different stress conditions were analyzed. In addition, sieve analysis, scanning electron microscopy (SEM), and image analysis were used to quantify changes in the particle breakage ratio and particle morphology parameters, including roughness, angularity, aspect ratio, and roundness, before and after creep. Based on these results, a direct shear creep model incorporating macroscopic stress effects and microscopic particle damage was developed. The model provides an improved description of creep deformation under high-stress conditions involving substantial particle breakage and provides a reference for assessing the long-term stability of reef-island calcareous sand foundations.

2. Materials and Methods

2.1. Materials

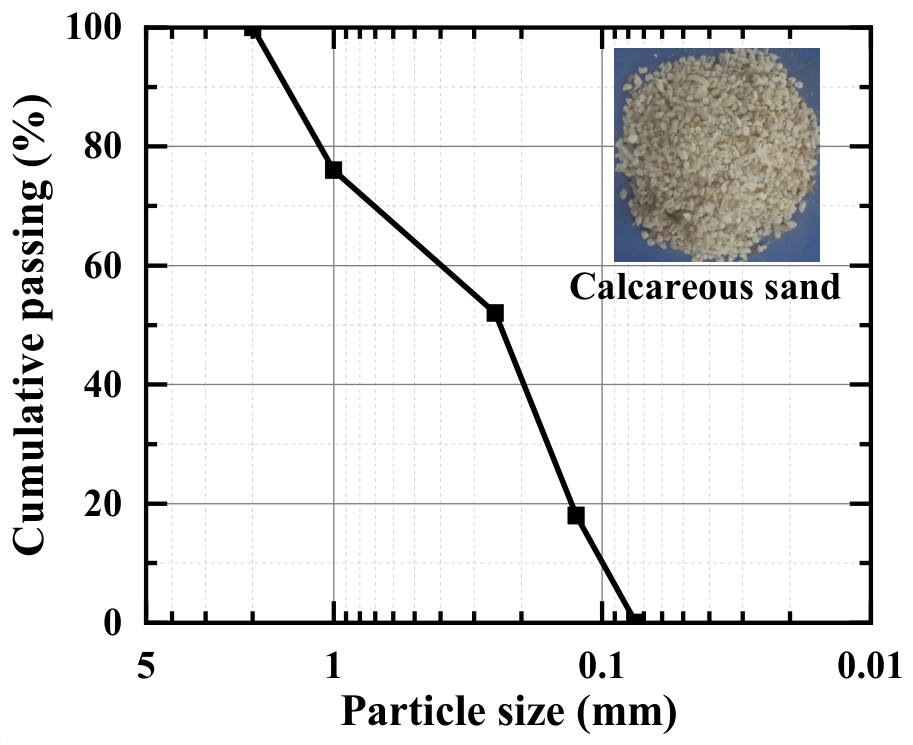
The calcareous sand used in this study was collected from a reef island in the South China Sea. Particles coarser than 2 mm and finer than 0.075 mm were removed by sieving, and the resulting particle size distribution is shown in Figure 1. The basic physical properties of the material were determined using standard laboratory tests, and the results are summarized in Table 1. The measured properties included specific gravity (Gs), maximum and minimum dry densities (ρmax and ρmin), water content (ω), coefficient of uniformity (Cu), and coefficient of curvature (Cc).

2.2. Direct Shear Creep Tests

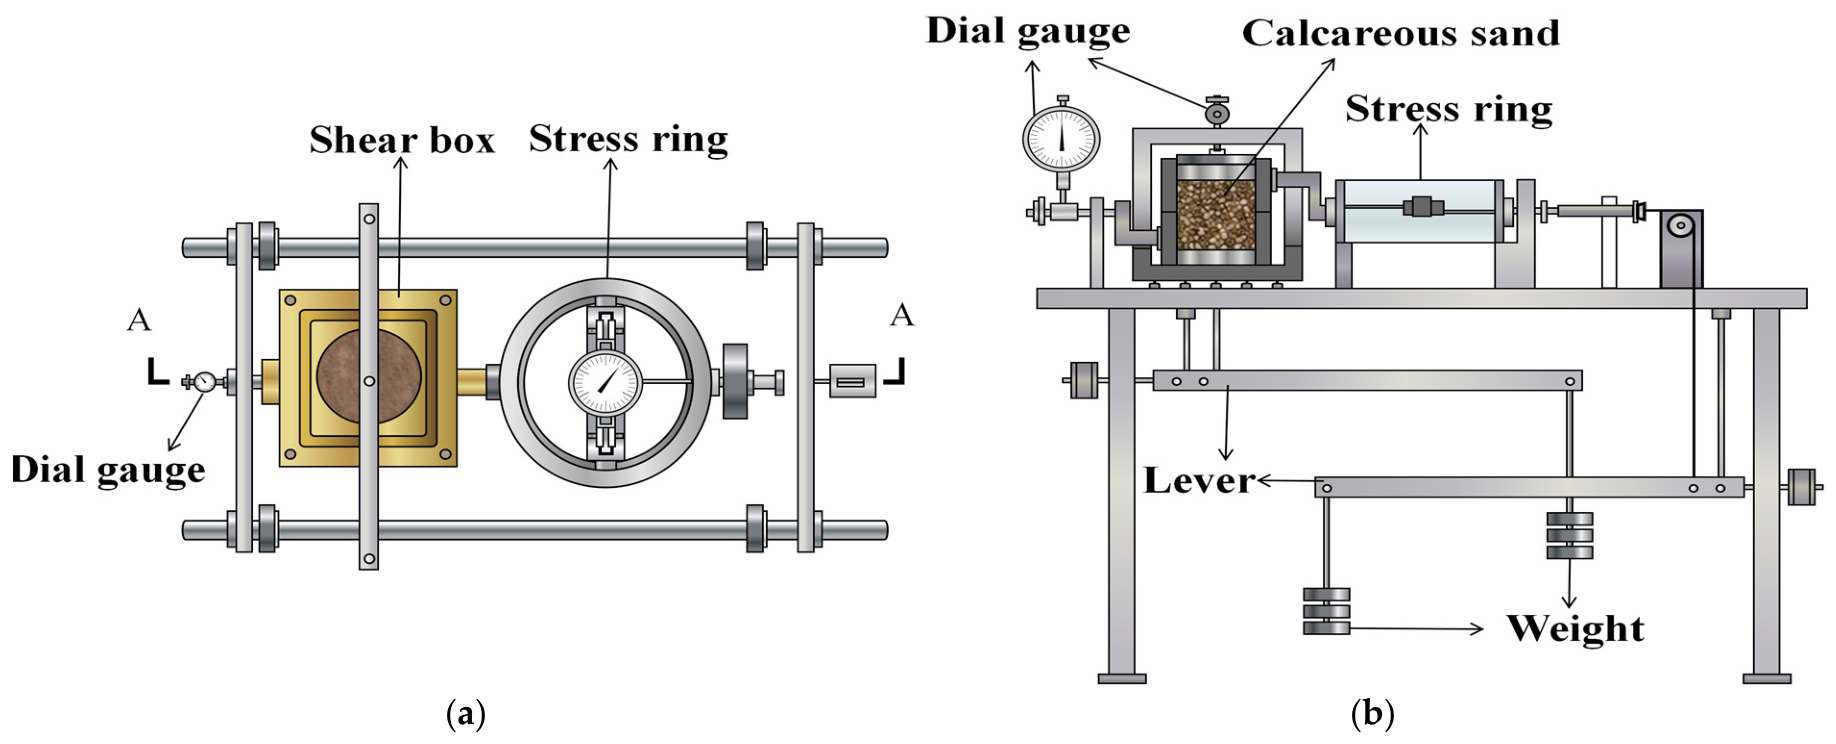
Prior to the direct shear creep tests, conventional direct shear tests were conducted to determine the shear strength of calcareous sand under normal stresses (σn) of 50, 200, 400, 500, and 600 kPa. The corresponding shear strengths (τf) were 58.6, 226.5, 457.7, 563.2, and 652.4 kPa, respectively. The long-term shear loads were then defined by setting the applied shear stress (τ) to 0.3, 0.5, 0.7, and 0.9 times the corresponding shear strength (τf). Direct shear creep tests were performed using a ZLB-1 triple rheological direct shear apparatus (Nanjing Soil Instrument Factory Co., Ltd., Nanjing, China), as shown in Figure 2. A separate-specimen loading protocol was adopted, with each τ/τf ratio applied to a different specimen. Two independent replicate tests were conducted for each test condition (n = 2). The coefficient of variation in the measured shear strain between the replicate tests was below 1% at each measurement time point. Because the replicate tests exhibited consistent overall trends and low variability, their mean values were used in the subsequent analyses [24,25]. The detailed experimental program is presented in Table 2. In this study, shear creep was considered to have reached the steady-state condition when the creep rate fell below 0.002 mm/d [26], at which point the test was terminated.

2.3. SEM Observations

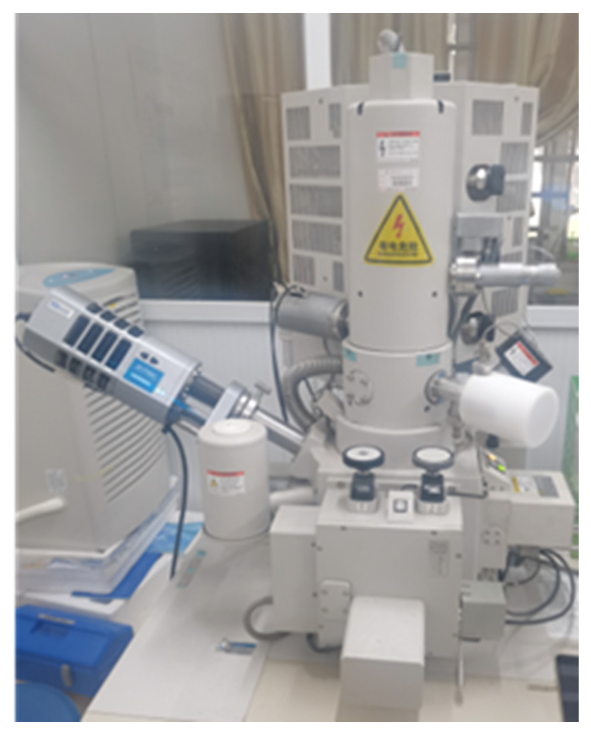
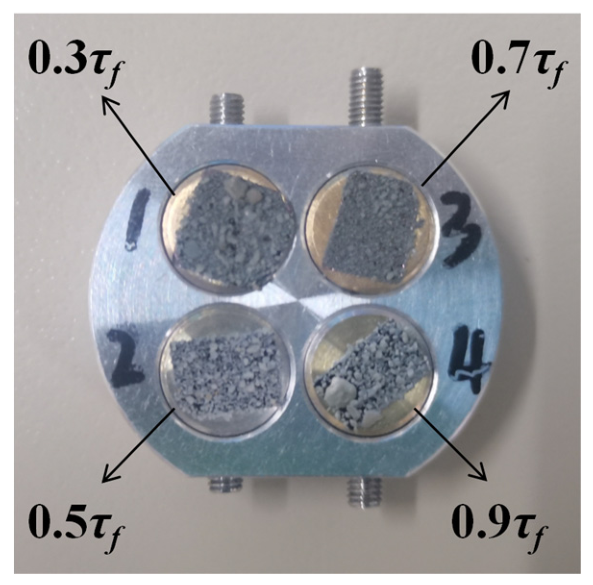
Following each direct shear creep test, approximately 5 g of sand was collected from the region adjacent to the shear plane for SEM examination, while the remaining material was retained for sieve analysis. During sampling, care was taken to preserve the original particle arrangement near the shear plane as much as possible to minimize secondary disturbance. SEM specimens were dried, mounted, and gold-coated before imaging. To facilitate comparisons between the initial and post-creep states, both pre-test and post-test SEM specimens were prepared for each test group, and 120–150 particles were examined per specimen. Figure 3 shows representative post-test particles subjected to different shear stress ratios under a normal stress of 500 kPa. SEM imaging was performed with an S-4800 field-emission scanning electron microscope (Hitachi High-Technologies Corporation, Tokyo, Japan), as shown in Figure 4.

3. Results and Discussion

3.1. Direct Shear Creep Test Results

3.1.1. Shear Strain–Time Relationship

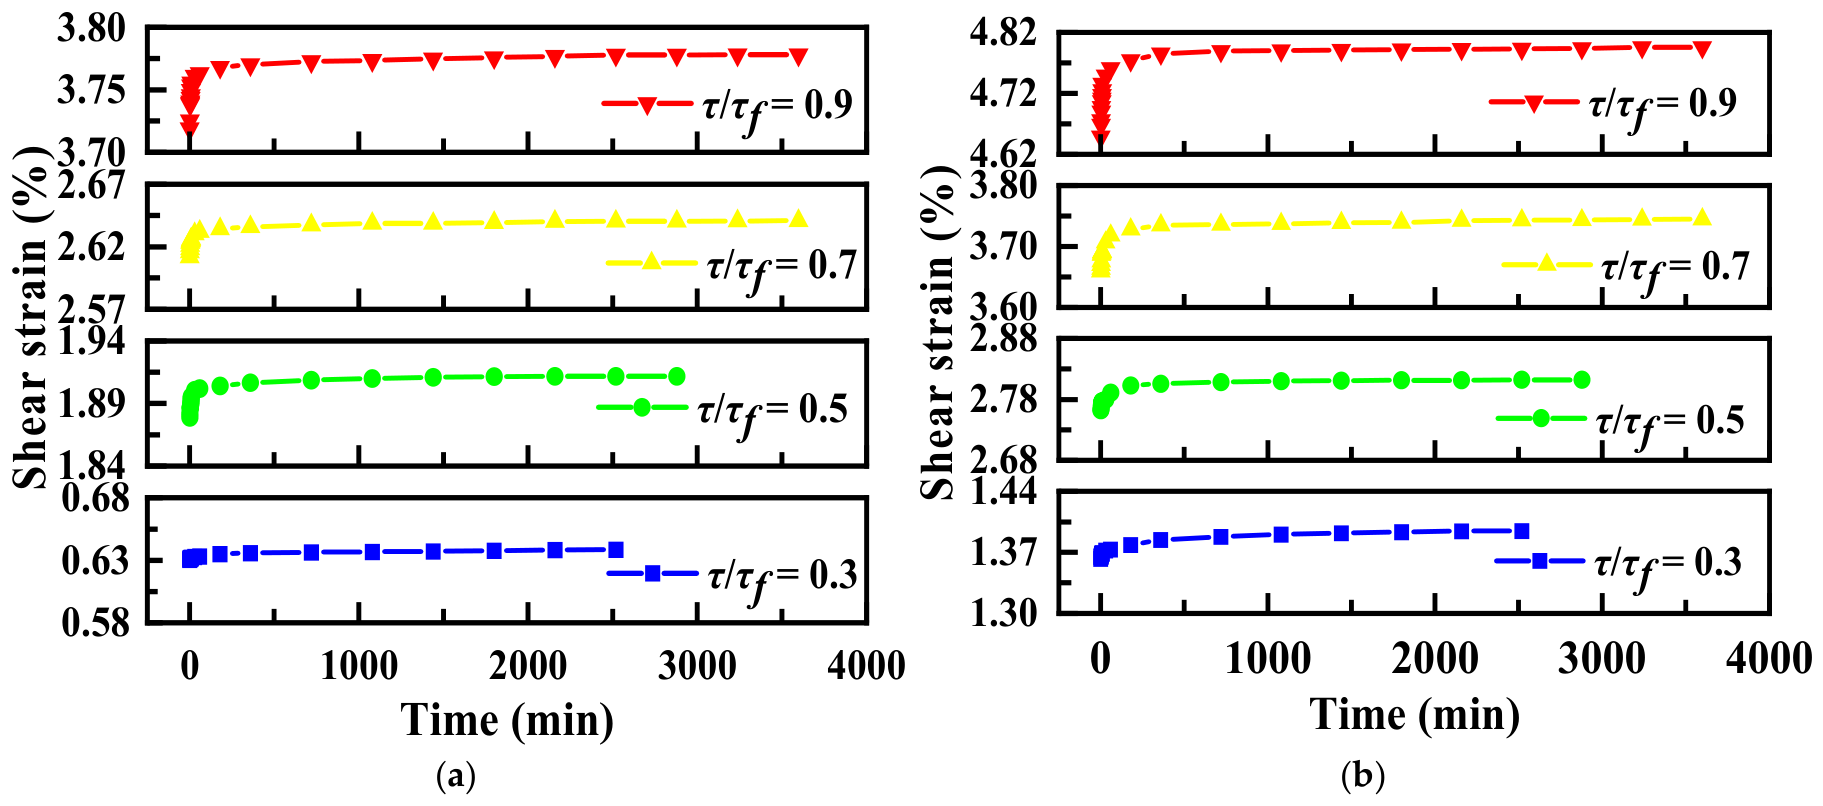
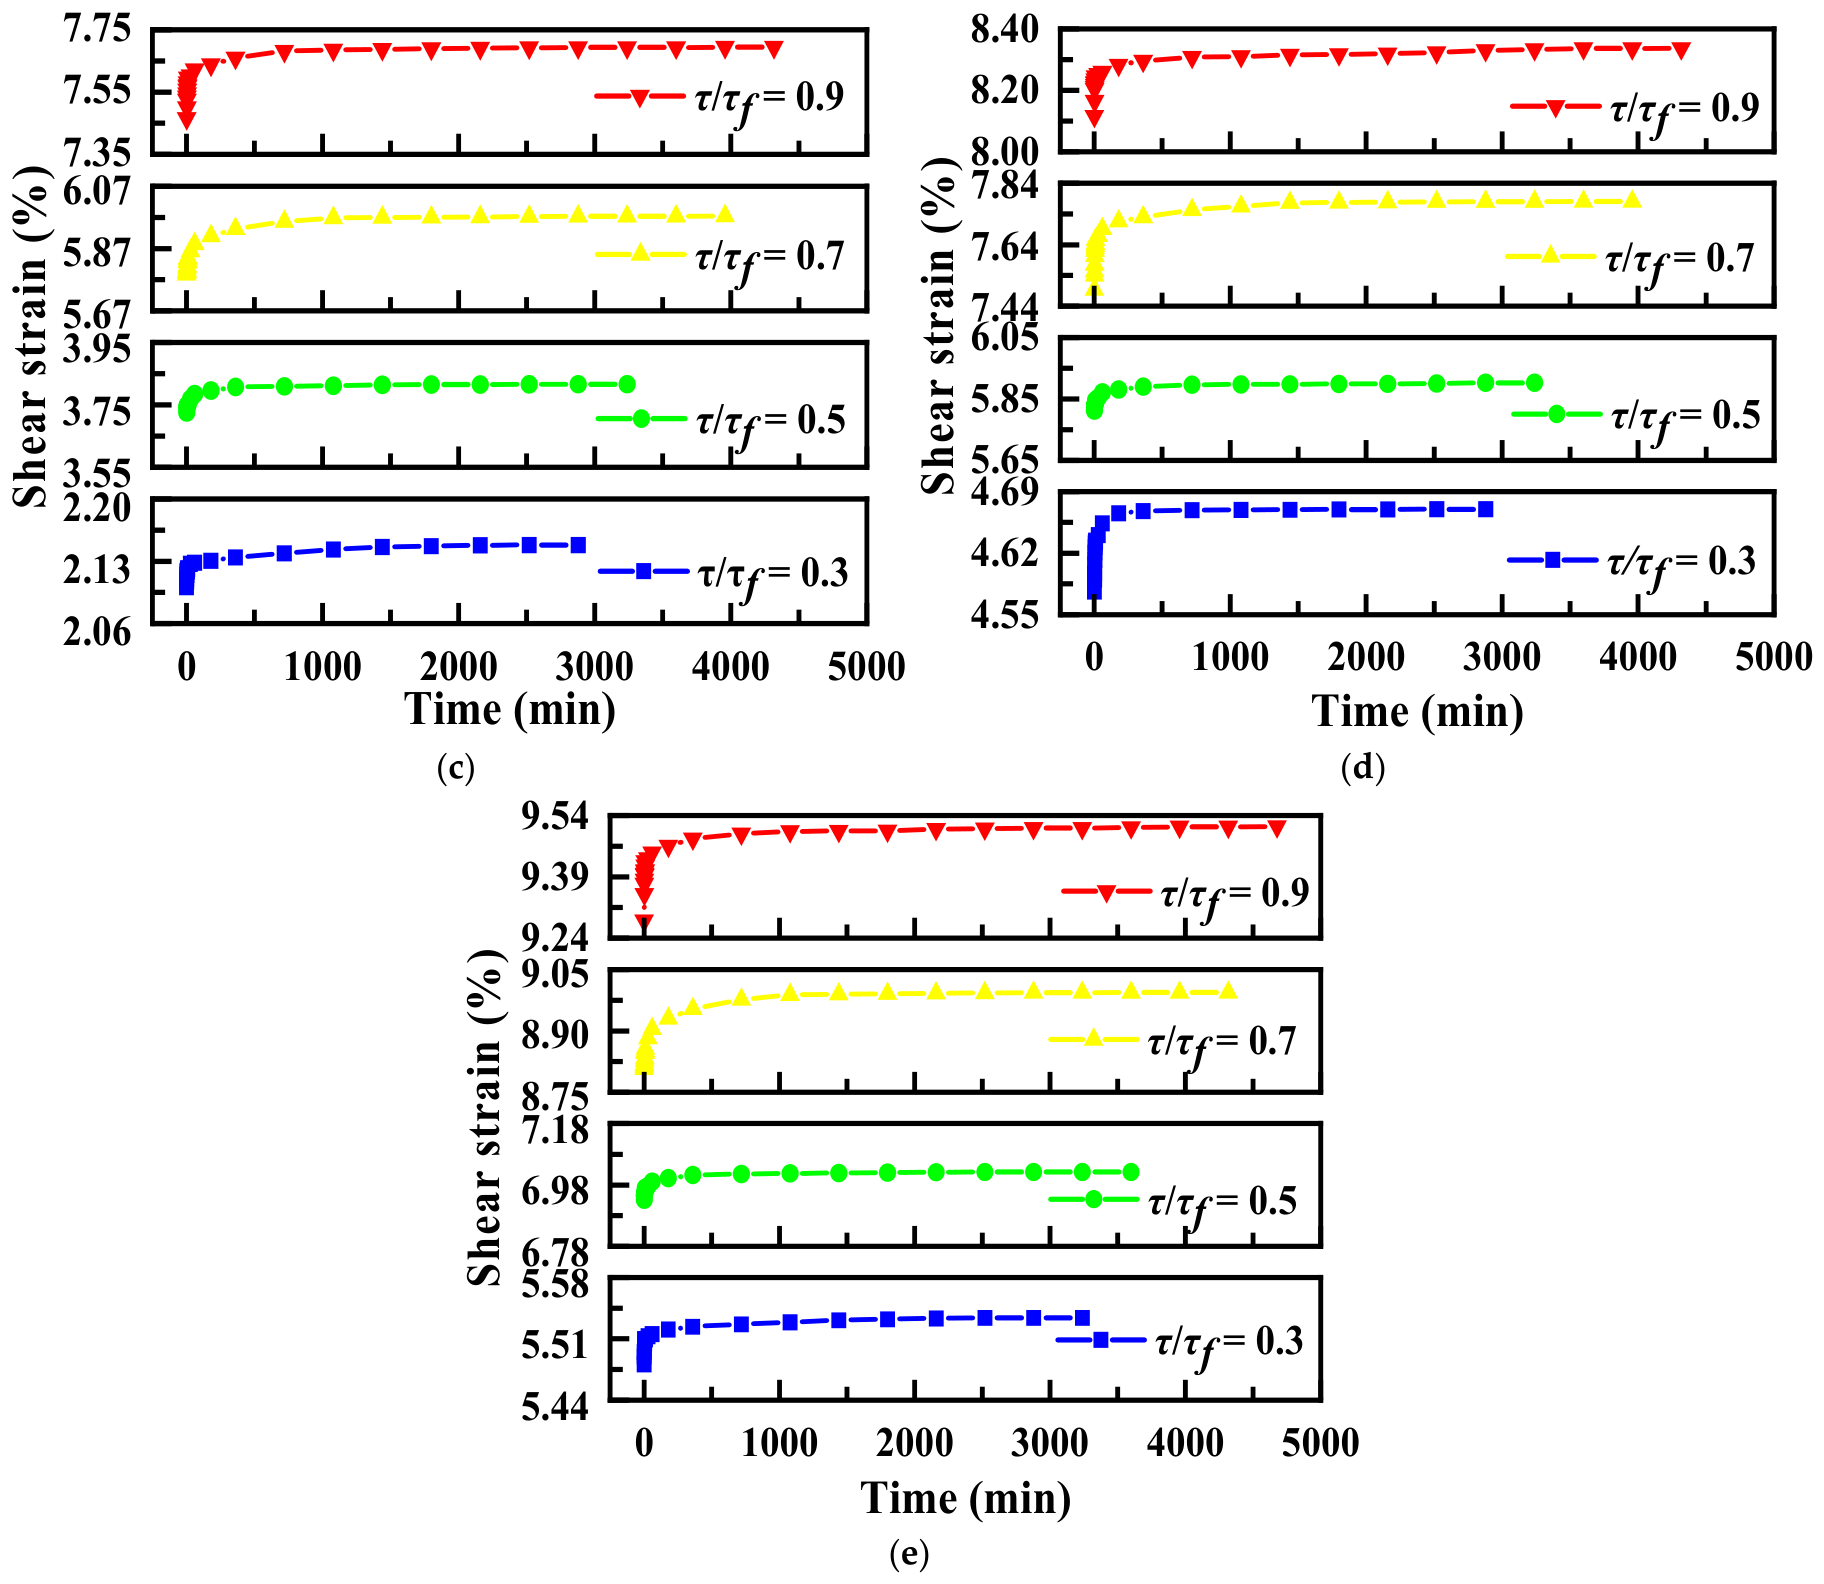
Shear strain was calculated from the displacement–time data obtained during the direct shear creep tests using Equation (1), and the resulting curves are shown in Figure 5. Under normal stresses of 50 kPa, 200 kPa, 400 kPa, 500 kPa, and 600 kPa, shear strain increased progressively with time at all applied shear stress ratios, exhibiting pronounced nonlinear decelerating creep behavior. In all cases, shear strain developed rapidly during the initial loading stage. Its rate of increase then gradually decreased until the deformation approached a stable value.
The creep response of calcareous sand can therefore be divided into three stages: instantaneous deformation, decelerating creep, and steady-state creep. No accelerated creep stage was observed, and the specimens reached the stabilization criterion within 2000–5000 min. As shown in Figure 5, the slopes of all curves decreased markedly during the later stages of the tests, and no sustained acceleration in deformation was observed. A horizontal displacement rate below 0.002 mm/d was used as the stabilization criterion. At τ/τf = 0.9, a longer testing period may be required to characterize slow cumulative deformation, delayed particle breakage, and localized particle rearrangement more fully [10,14].
ε ( t ) = L ( t ) L 0 d × 100 %
where ε(t) is the shear strain at time t, %; L(t) is the horizontal displacement at time t, mm; L0 is the initial horizontal displacement-gauge reading immediately before the application of the shear stress, mm; and d is the inner diameter of the shear box, mm.
Under a constant normal stress, the creep response varied according to the applied shear stress ratio, and the distinction between the creep stages became more evident at higher shear stress ratios. At τ/τf = 0.3, the decelerating creep stage was brief, and shear strain increased gradually. By contrast, at τ/τf = 0.9, the specimen underwent a prolonged decelerating creep stage with a more pronounced increase in shear strain over time. For example, under a normal stress of 600 kPa, Figure 5e shows that at τ/τf = 0.3, shear strain exhibited no substantial increase following instantaneous creep and remained at only 5.53%, with creep stabilization achieved at 3000 min. At τ/τf = 0.9, however, the curve increased sharply, with shear strain rising from 9.28% to 9.51%, corresponding to an increase of 0.23 percentage points, or approximately 2.48% relative to the initial value. The time required to reach stabilization increased to 4750 min, indicating a significant prolongation of the decelerating creep stage.
Under a constant shear stress ratio, creep deformation also increased with normal stress, although the relationship was nonlinear. At τ/τf = 0.3, shear strain increased from 2.14% to 4.67% and 5.53% as normal stress increased from 400 to 500 and 600 kPa, respectively. At τ/τf = 0.9, it increased from 7.69% to 8.34% and 9.51%, respectively. An increase in normal stress enhances interparticle contact forces and interlocking, thereby restricting particle sliding and rotation. However, increased normal stress also intensifies local stress concentrations at particle contacts, making calcareous sand particles more susceptible to corner breakage, localized fragmentation, and particle rearrangement.
Overall, the shear stress ratio predominantly controls the driving force for direct shear creep, whereas normal stress influences the interparticle contact state, degree of particle breakage, and shear band structure. Therefore, the direct shear creep behavior of calcareous sand is governed not by a single stress component but by the coupled effects of shear driving force, normal constraint, particle breakage, and particle rearrangement.

3.1.2. Shear Strain Rate–Time Relationship

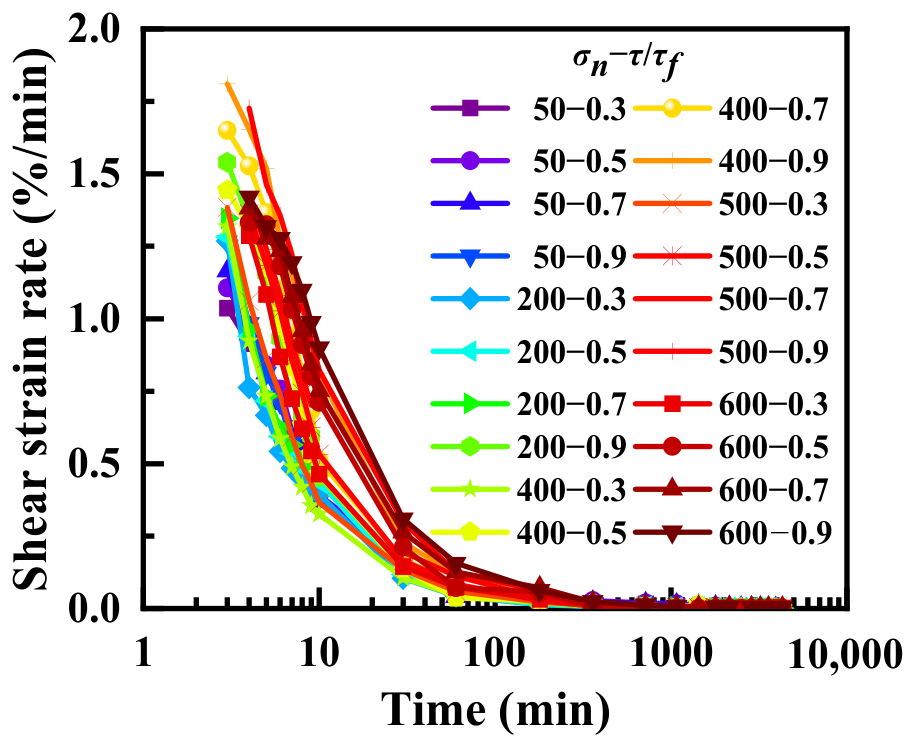
The shear strain rate–time curves were calculated using the shear strain–time data obtained from the direct shear creep tests, as defined by Equation (2). Figure 6 shows the shear strain rate–time curves for the calcareous sand specimens. Similar patterns of strain-rate decay were observed under different shear stress ratios. The shear strain rate decreased continuously with time, with a particularly sharp decline within the first 30 min, corresponding to the initial rapid deformation stage. Thereafter, the strain-rate decay gradually slowed, and the specimens entered the decelerating creep stage. This trend is consistent with the shear strain evolution shown in Figure 5.
V ( t ) = ε ( t ) ε ( t 1 ) Δ t
where V(t) is the shear strain rate at time t, %/min; ε(t) is the shear strain at time t, %; ε(t − 1) is the shear strain at time t − 1, %; and ∆t is the time interval between time t and time t − 1, min.
Under a constant normal stress, the shear strain rate increased systematically with the applied shear stress ratio. For example, at a normal stress of 600 kPa, the strain-rate curve at τ/τf = 0.9 was substantially higher than the corresponding curves at τ/τf = 0.3, 0.5, and 0.7. A higher shear stress ratio resulted in both a larger initial shear strain rate and a higher strain rate during the later stage, indicating that an increased shear stress ratio promotes creep deformation of calcareous sand. An increase in normal stress substantially enhanced the shear strain rate. At τ/τf = 0.9, the curve under a normal stress of 600 kPa was markedly higher than the corresponding curves under normal stresses of 50 kPa, 200 kPa, 400 kPa, and 500 kPa. This trend suggests that normal stress also contributes to the development of creep deformation. Although elevated normal stress strengthens interparticle contact and interlocking, thereby partially restricting particle sliding, the high crushability of calcareous sand promotes particle breakage under elevated normal stress.
The variation in shear strain rate with normal stress and shear stress ratio indicates that the direct shear creep behavior of calcareous sand is characterized by pronounced coupling between the two stress components. Shear stress predominantly controls the driving force for creep deformation, whereas normal stress influences particle sliding, rotation, and breakage by modifying interparticle contacts, interlocking, and local stress concentrations. Therefore, the decay in shear strain rate is governed not only by the time-dependent creep response but also by the combined effects of normal constraint, shear driving force, particle breakage, and particle rearrangement.

3.1.3. Relationship Between Shear Stress Ratio and Particle Breakage Ratio

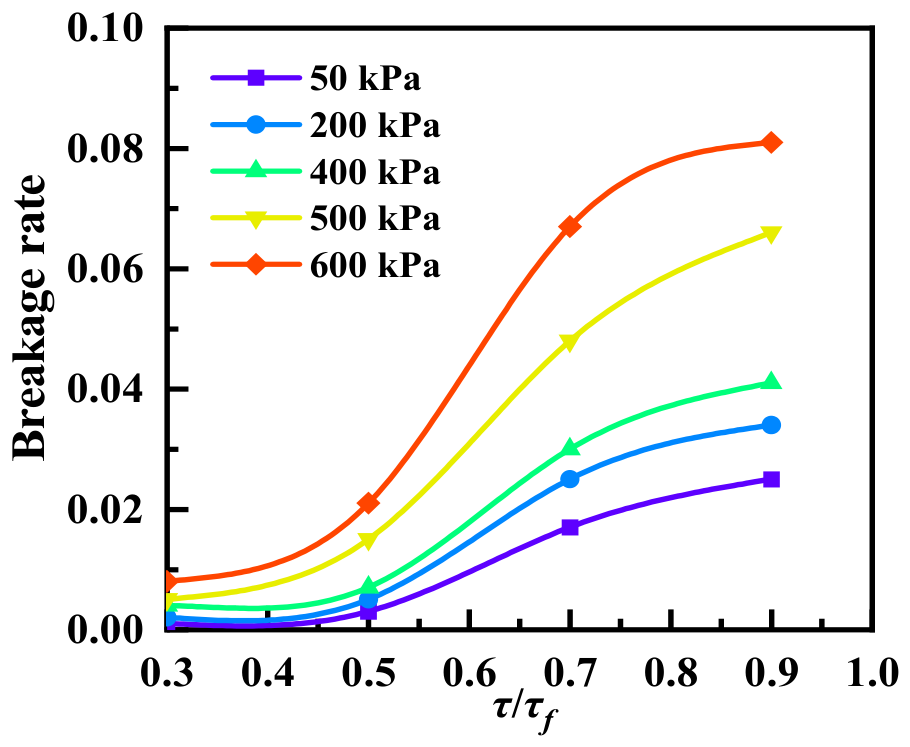
Replicate tests were performed to assess the reliability of the results. After each test, sieve analysis was conducted on specimens subjected to different shear stress ratios and normal stresses. The results of the two replicate tests differed by less than 0.5%. The relative breakage index proposed by Hardin [27], referred to here as the particle breakage ratio, was used to quantify particle breakage. The relationship between the shear stress ratio and the particle breakage ratio is shown in Figure 7.
Within the normal stress range of 50–600 kPa, the particle breakage ratio increased markedly with the shear stress ratio. At a normal stress of 50 kPa, it increased from 0.001 at τ/τf = 0.3 to 0.025 at τ/τf = 0.9, with the latter value being 25 times the former. At 400 kPa, it increased from 0.004 to 0.041 over the same τ/τf range, with the latter value being approximately ten times the former. These results indicate that an increased shear stress ratio enhances tangential interparticle sliding, rolling, and local stress concentrations within the shear band, thereby intensifying particle breakage.
Under a constant shear stress ratio, the particle breakage ratio generally increased with normal stress. At τ/τf = 0.3, the particle breakage ratio increased from 0.001 at 50 kPa to 0.008 at 600 kPa, with the final value being eight times the initial value. At τ/τf = 0.9, it increased from 0.025 to 0.081 over the same normal stress range, with the final value being approximately 3.2 times the initial value. This trend suggests that higher normal stress intensifies local compressive stresses at particle contacts, making calcareous sand particles more susceptible to corner breakage, pore-wall fracture, and localized fragmentation.
Moreover, the particle breakage ratio increased nonlinearly with the shear stress ratio, with distinct stages of development. At τ/τf = 0.3–0.5, the increase in the particle breakage ratio was limited, and deformation was predominantly governed by particle sliding, particle rearrangement, and void redistribution. At τ/τf = 0.5–0.7, the particle breakage ratio increased rapidly owing to intensified stress concentrations at particle contacts within the shear band, promoting corner breakage and localized fragmentation. When τ/τf increased further to 0.9, the particle breakage ratio continued to rise; however, its rate of increase declined under high normal stresses. This trend suggests that particle breakage, the filling of voids by finer fragments, and particle rearrangement increasingly contributed to the accommodation of shear deformation.

3.2. Microscopic Observations and Analysis

3.2.1. Particle Breakage Evolution of Calcareous Sand

Previous compression tests on calcareous sand have indicated that its creep behavior is primarily controlled by particle rearrangement, sliding, and breakage [28]. Several classification schemes have been proposed to describe particle breakage. Based on the observed morphological features, Guyon et al. [29] classified particle breakage into complete rupture, partial breakage, and surface abrasion. This classification has been widely adopted. Following this classification, the present study examines the evolution of calcareous sand particles during direct shear creep.
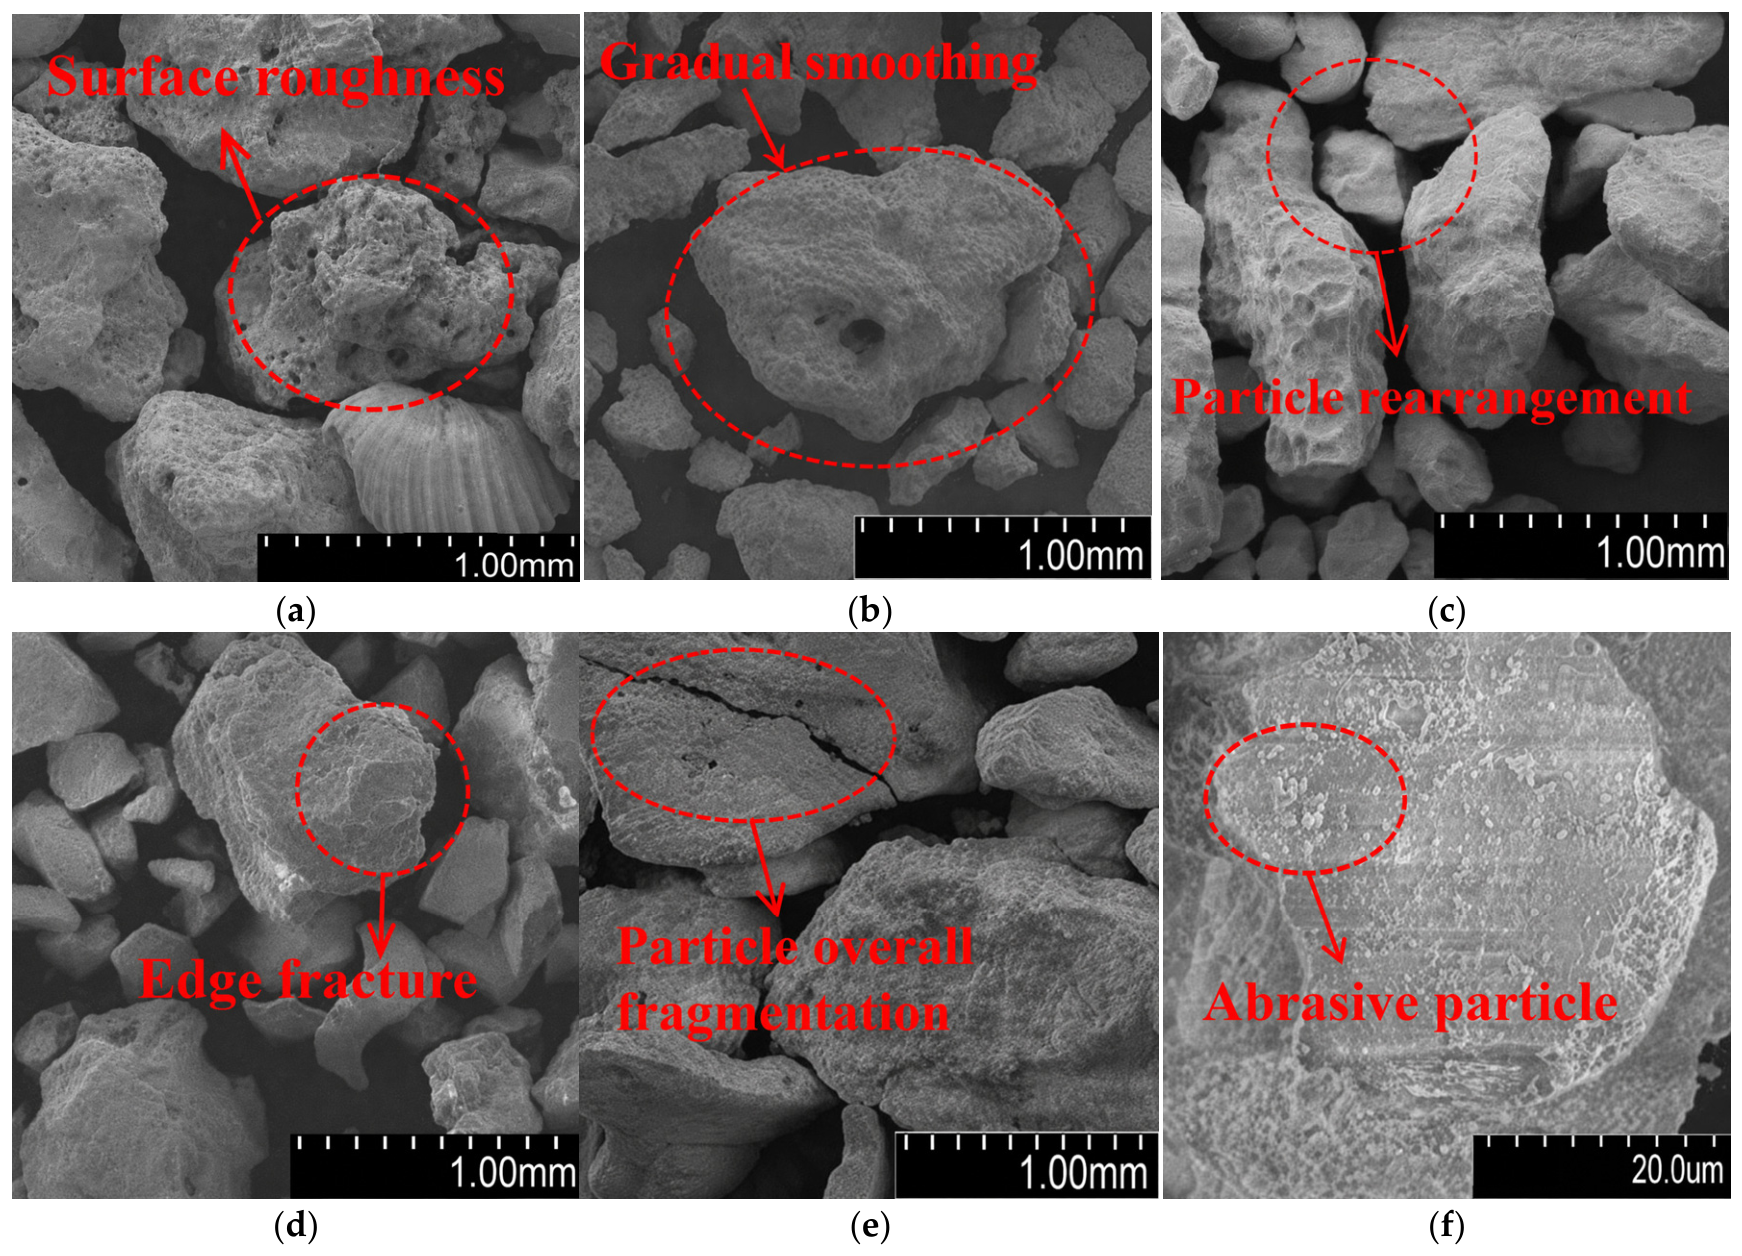
Figure 8 presents SEM images of calcareous sand particles before and after direct shear creep under different shear stress ratios at a normal stress of 600 kPa. Prior to testing, the particles exhibited irregular and predominantly elongated shapes, numerous surface pores, pronounced angularity, and rough surfaces, all of which reflect their typical biogenic origin (Figure 8a). Figure 8b–e show the post-creep particle morphologies at τ/τf = 0.3, 0.5, 0.7, and 0.9, respectively. At τ/τf = 0.3, minor asperities along the particle edges were largely smoothed by abrasion, while the overall particle outlines remained similar to their initial forms. This observation indicates that surface abrasion was the dominant damage mechanism at this stage and that extensive particle breakage had not yet occurred (Figure 8f). At τ/τf = 0.5, partial breakage became evident. Protruding angular features fractured under shear loading, newly formed fine fragments accumulated and rearranged around the original larger particles, and the newly exposed fracture surfaces were gradually smoothed by abrasion. At τ/τf = 0.7, particle evolution was predominantly controlled by partial breakage, with particle outlines differing markedly from their initial forms. Most angular features had broken off, and the particles became more rounded. At this stage, the remaining larger particles continued to form the principal load-bearing skeleton. At τ/τf = 0.9, the applied shear stress approached the corresponding shear strength, and particle breakage progressed from localized fragmentation to complete particle rupture. This progression indicates that particle damage near the shear plane intensified substantially as the shear stress approached the failure level.
Overall, the calcareous sand particles were initially irregular and highly angular. Under the combined effects of normal and shear stresses, interparticle compression, friction, and rotation induced pronounced particle breakage, causing the particles to become progressively more rounded. With increasing shear stress ratio and creep duration, the damage process exhibited a distinct staged progression: particle edges were first subjected to surface abrasion, followed by the breakage of angular projections and elongated particles, and finally the complete rupture of severely damaged particles. Owing to continuous friction and surface abrasion during shearing, the particle edges gradually became smoother, accompanied by the generation of fine fragments. The identification of surface abrasion, corner breakage, localized fragmentation, and complete particle rupture in Figure 8 was primarily based on particle contours, surface textures, and fracture features observed in the SEM images. These qualitative observations were further evaluated using quantitative analyses of the particle breakage ratio and particle morphology parameters.

3.2.2. Particle Morphology Evolution of Calcareous Sand

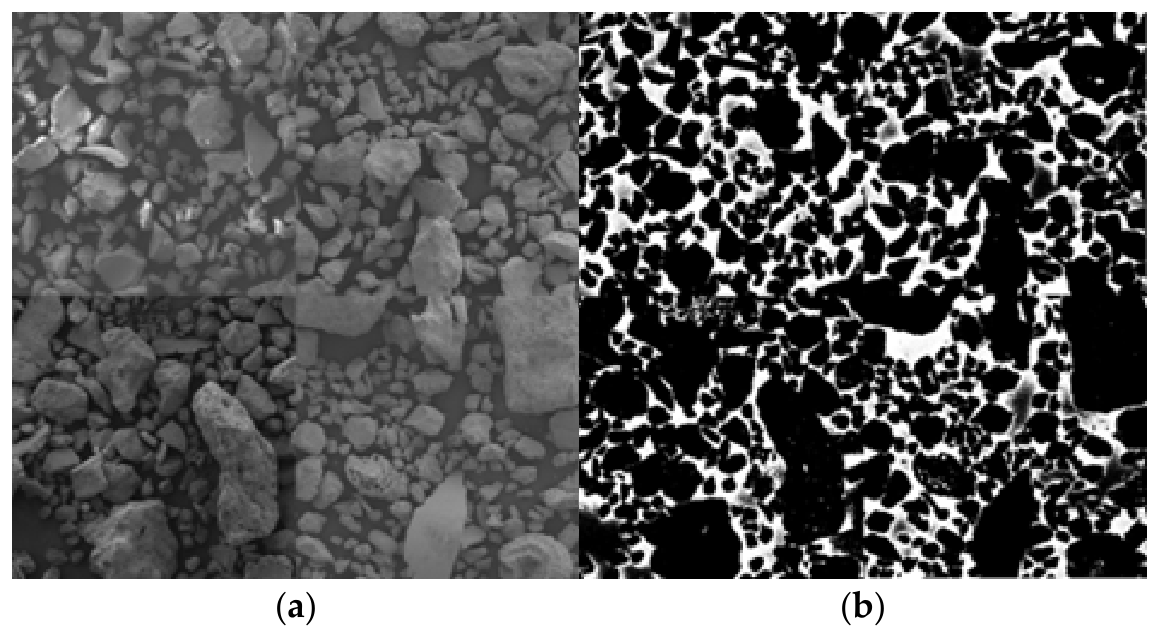
To quantify the observed changes in particle shape, the SEM images were analyzed in conjunction with the particle breakage ratio and particle morphology parameters. The SEM images obtained for each specimen group were processed using Image-Pro Plus 6.0 software. The images were binarized to segment and extract the particle contours, as shown in Figure 9, and the corresponding geometric parameters were then calculated.
During image processing and the calculation of geometric parameters such as area and length, image pixels were used as the basic unit. The original image resolution was 2560 × 1920 pixels, and the measured geometric parameters were expressed in pixel units by default. The pixel dimensions were converted into physical units by calibrating the images against the SEM scale bar.
After the microscopic images were imported into the software, contour extraction and segmentation were performed for the selected target particles. To ensure the accuracy of the measurements, overlapping or touching particles were manually separated where possible or excluded from the analysis. In the software measurement module, parameters including particle area, perimeter, and equivalent diameter were obtained. The software then automatically calculated the relevant geometric indices from the segmented irregular particle contours and recorded the total number of particles in each image. This procedure provided the contour-based geometric characteristics required to compare particle morphology before and after shear creep. To reduce the influence of image-processing parameters on the results, the same image resolution, scale calibration method, thresholding procedure, binarization process, and particle selection criteria were applied to all SEM images.
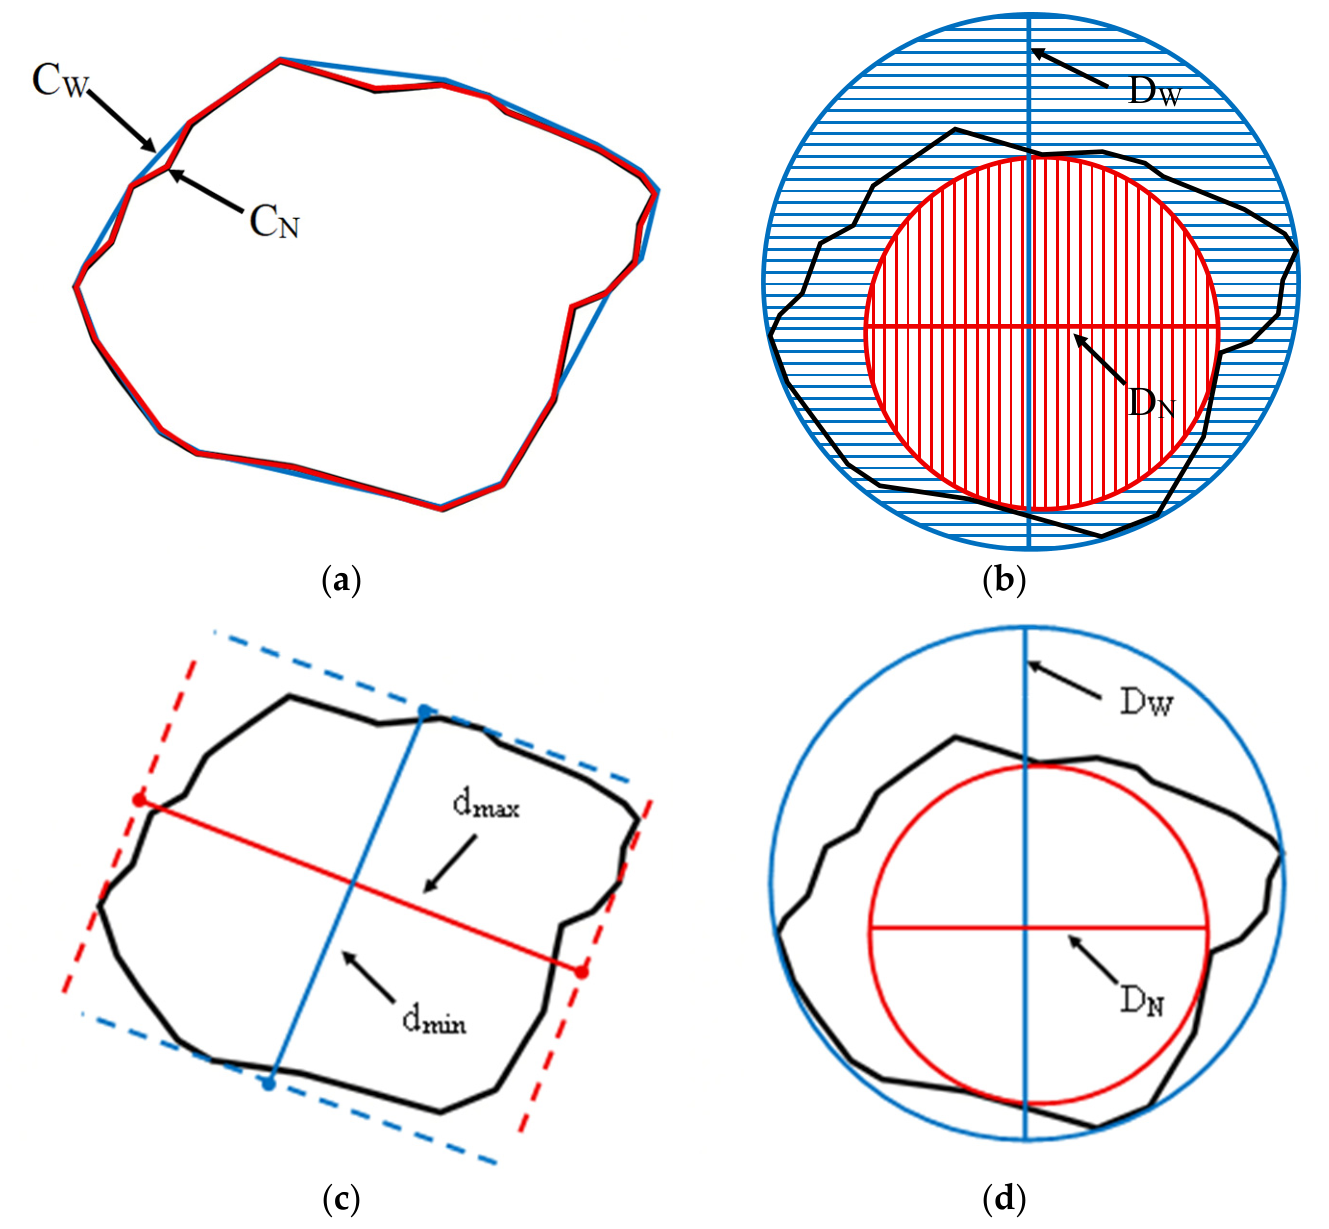
Roughness, angularity, aspect ratio, and roundness were used to characterize changes in the morphology of calcareous sand particles and assess particle abrasion, fracture, and breakage during direct shear creep. Figure 10 illustrates the definitions of these morphological parameters [30,31,32,33]. Roughness (S) is defined as the ratio of the particle contour perimeter to the perimeter of its circumscribed polygon, whereas angularity (Ag) is defined as the ratio of the area of the maximum inscribed circle to that of the minimum circumscribed circle. These parameters were calculated using Equations (3) and (4), respectively. Aspect ratio (AR) is defined as the ratio of the major-axis length to the minor-axis length, whereas roundness (Rd) is defined as the ratio of the diameter of the maximum inscribed circle to that of the minimum circumscribed circle. These parameters were calculated using Equations (5) and (6), respectively.
S = C N C W
A g = ( D N / 2 ) 2 ( D W / 2 ) 2
A R = d max d min
R d = D N D W
where CN is the particle contour perimeter; CW is the perimeter of the circumscribed polygon of the particle; DN is the diameter of the maximum inscribed circle; DW is the diameter of the minimum circumscribed circle; dmax is the particle major-axis length; and dmin is the particle minor-axis length.
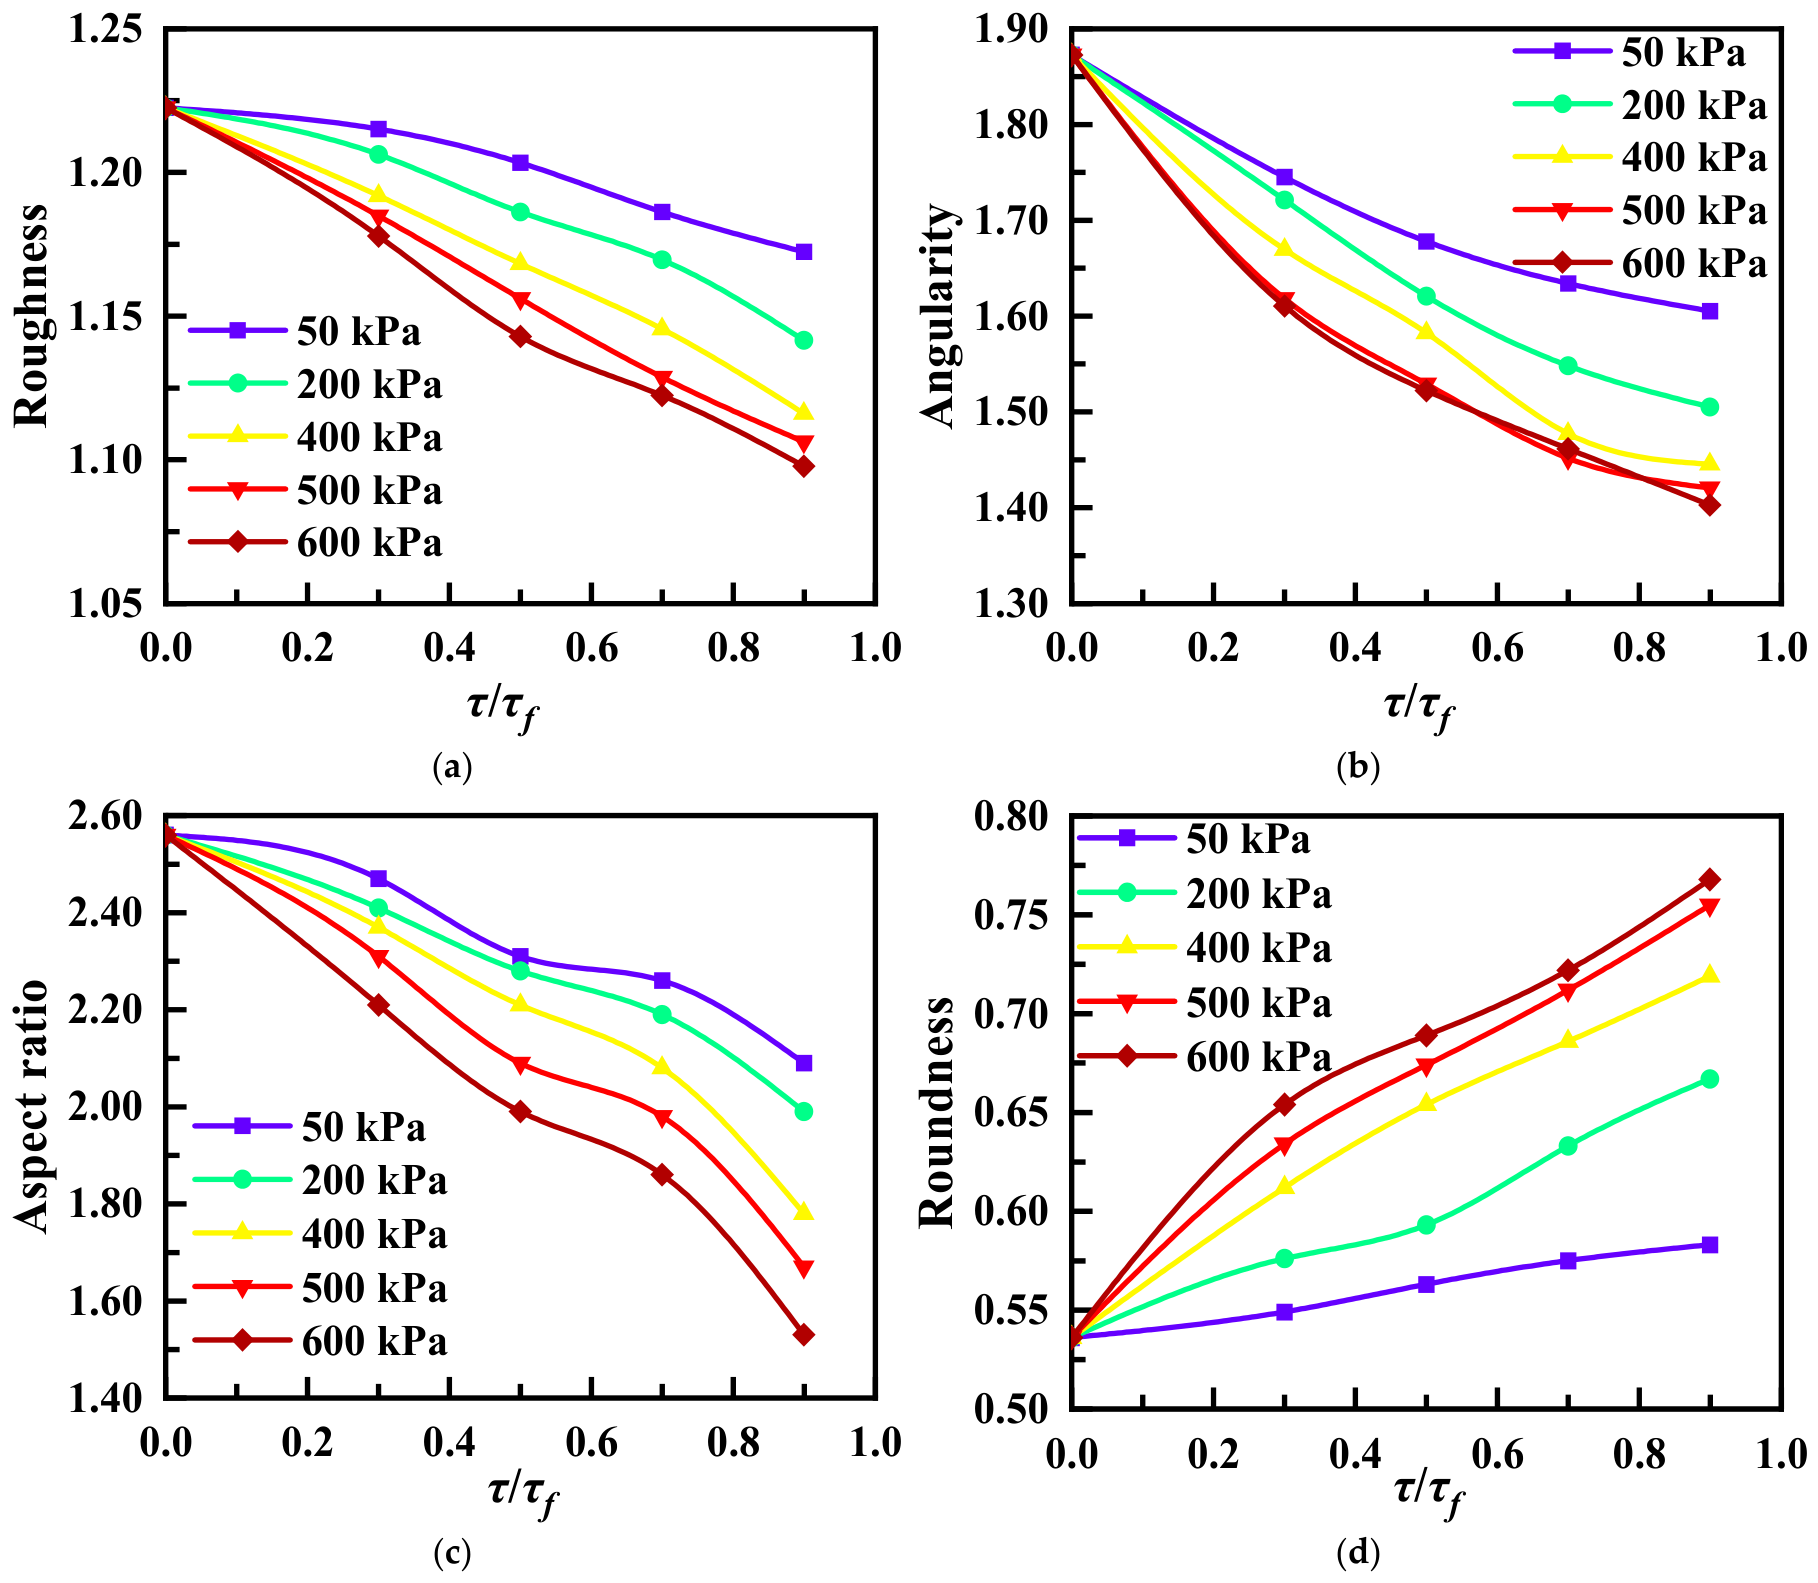
Figure 11 shows the relationships between the shear stress ratio and the particle morphology parameters under different normal stresses. These relationships illustrate the morphological evolution of calcareous sand particles during direct shear creep. Following direct shear creep, particle roughness and aspect ratio decreased markedly, indicating that the particle surfaces became smoother and that the particles became less elongated. The observed trends further suggest that higher normal stress strengthens interparticle contacts and intensifies local stress concentrations at particle contacts, thereby promoting more extensive particle abrasion and breakage. These processes result in smoother and more regular particle outlines.
Roughness quantifies particle surface irregularity. With increasing shear stress ratio, protruding surface structures on calcareous sand particles undergo progressive wear and abrasion during creep, leading to a pronounced decrease in roughness. Under higher normal stresses, tighter interparticle contacts increase the sensitivity of particle roughness to the shear stress ratio. At a normal stress of 600 kPa, particle roughness was 1.18 at τ/τf = 0.3 but decreased to 1.10 at τ/τf = 0.9.
Angularity characterizes the prominence of sharp edges and corners. Once shear stress becomes sufficient to fracture most angular features, further increases in the shear stress ratio produce only a limited additional reduction in angularity. Accordingly, in Figure 11b, when τ/τf exceeds 0.5, the angularity values at normal stresses of 500 and 600 kPa differ by only 0.01, indicating that angularity becomes less sensitive to further increases in stress.
Aspect ratio and roundness characterize particle elongation and overall shape regularity, respectively. In the later stages of creep, particle rearrangement and partial breakage within the calcareous sand specimens gradually diminished, and the remaining larger particles formed the principal load-bearing skeleton. Under sustained shear loading, local damage accumulated at particle contacts, causing elongated particles to fracture more readily along weak planes. As a result, the aspect ratio decreased to 1.53, whereas the newly generated small fragments became more rounded, and roundness increased to 0.77.
Overall, the aspect ratio decreased continuously, whereas roundness increased progressively. In compression tests, broken particles can rearrange, re-establish contacts, and contribute to the resistance against axial loading. By contrast, during shear creep, calcareous sand particles are simultaneously subjected to normal and shear stresses, resulting in more pronounced interparticle compression, friction, and rotation. Consequently, direct shear creep may promote sustained particle breakage and more pronounced morphological changes than those observed under compression-dominated loading.

3.2.3. Relationship Between Particle Breakage Ratio and Particle Morphology

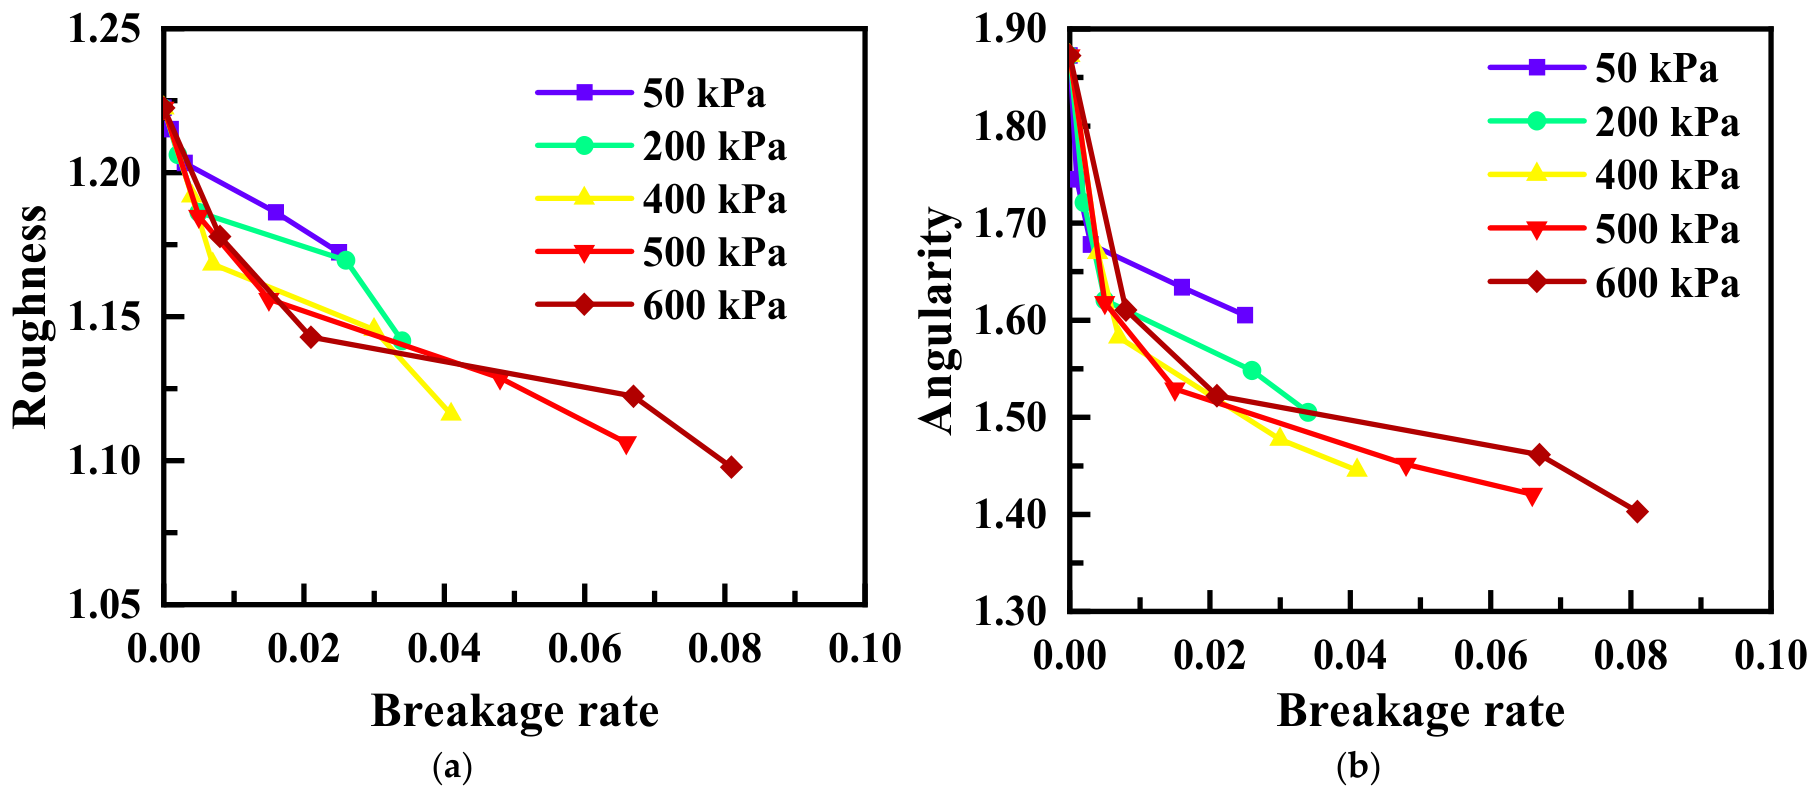
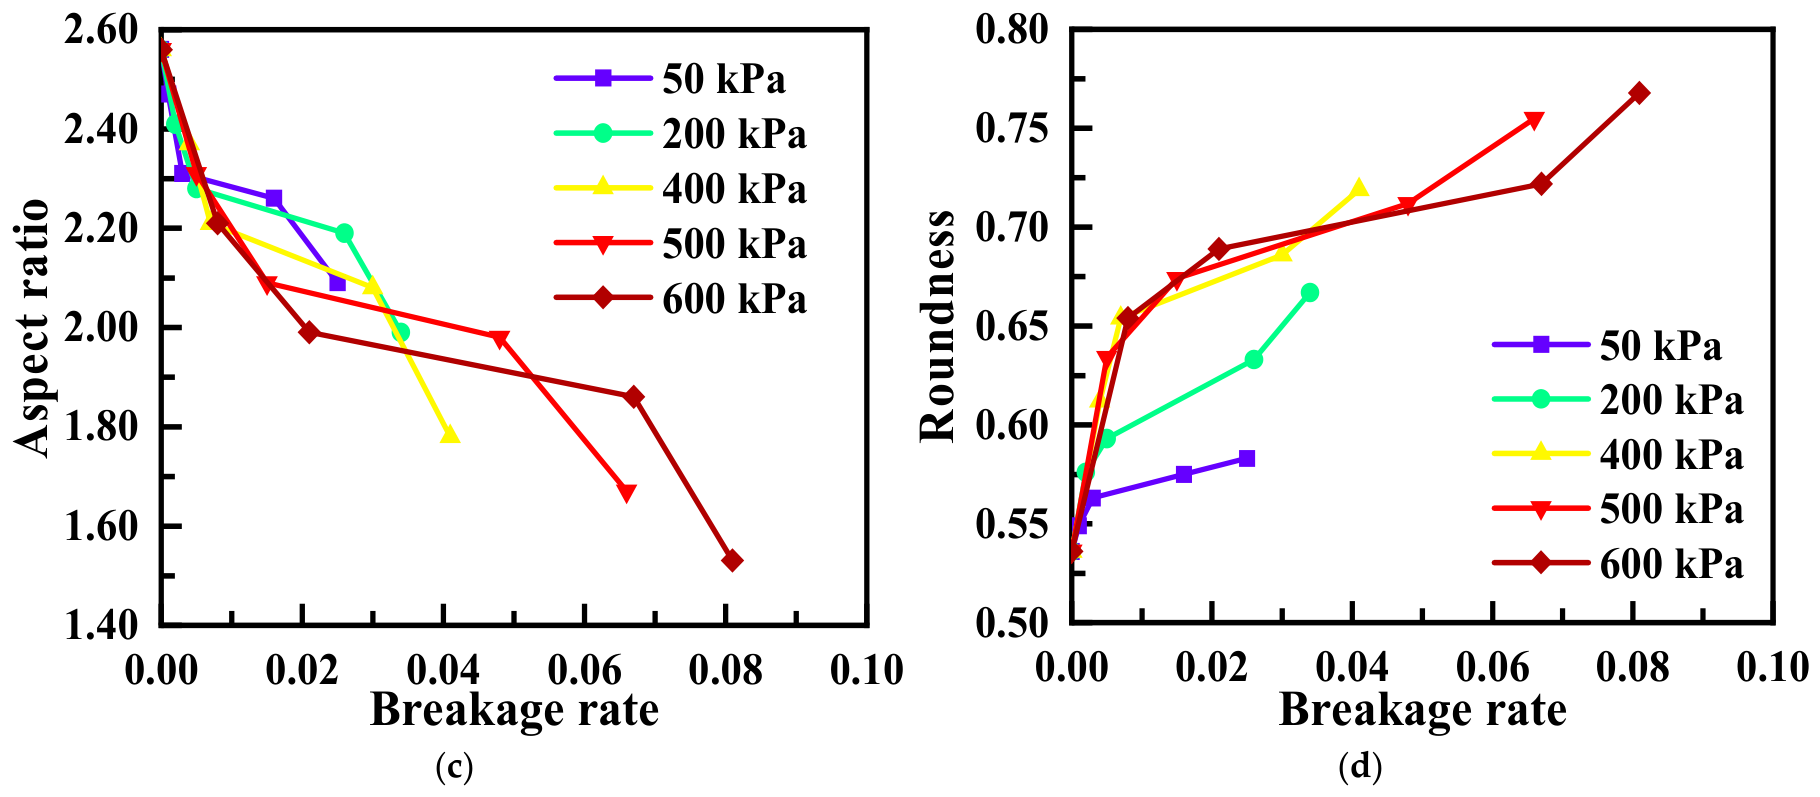
Figure 12 shows the relationships between the particle breakage ratio and particle morphology parameters. As the particle breakage ratio increased, roughness, angularity, and aspect ratio generally decreased, whereas roundness increased progressively. This trend indicates that calcareous sand particles evolved from rough, angular, and irregular shapes toward smoother and more rounded morphologies during long-term direct shear creep. The reduction in roughness reflects the gradual abrasion and breakage of microscopic surface protrusions. The decrease in angularity indicates the progressive weakening and fracture of sharp particle edges under local stress concentrations. The decline in aspect ratio suggests that elongated and irregular particles became more equiaxed, whereas the increase in roundness reflects the overall rounding of the particles.
Under low shear stress ratios, interparticle behavior is dominated by particle rearrangement and surface abrasion, with only limited corner breakage occurring at mechanically weak edges. As the shear stress ratio increases, the fracture of particle corners and projections becomes dominant. Because calcareous sand particles are highly angular and susceptible to crushing, the particle breakage ratio rises rapidly. Some particles, particularly weak and elongated particles, undergo complete rupture, resulting in a marked decrease in aspect ratio. Under high shear stress ratios, most angular features have already been damaged, leaving fewer weak features susceptible to further abrasion or corner breakage. Meanwhile, fine fragments fill the interparticle voids and participate in particle rearrangement, allowing the particle contact network to evolve toward a new stable configuration. As a result, the particle breakage ratio continues to increase, but its rate of increase gradually declines.
In summary, particle breakage in calcareous sand is manifested not only by particle size reduction but also by systematic changes in particle morphology, including surface abrasion, corner breakage, and progressive particle rounding. Accordingly, the direct shear creep behavior of calcareous sand is jointly governed by macroscopic stress effects and microscopic particle-scale damage.

3.3. Relationship Between Particle Morphology Evolution and Macroscopic Creep Deformation

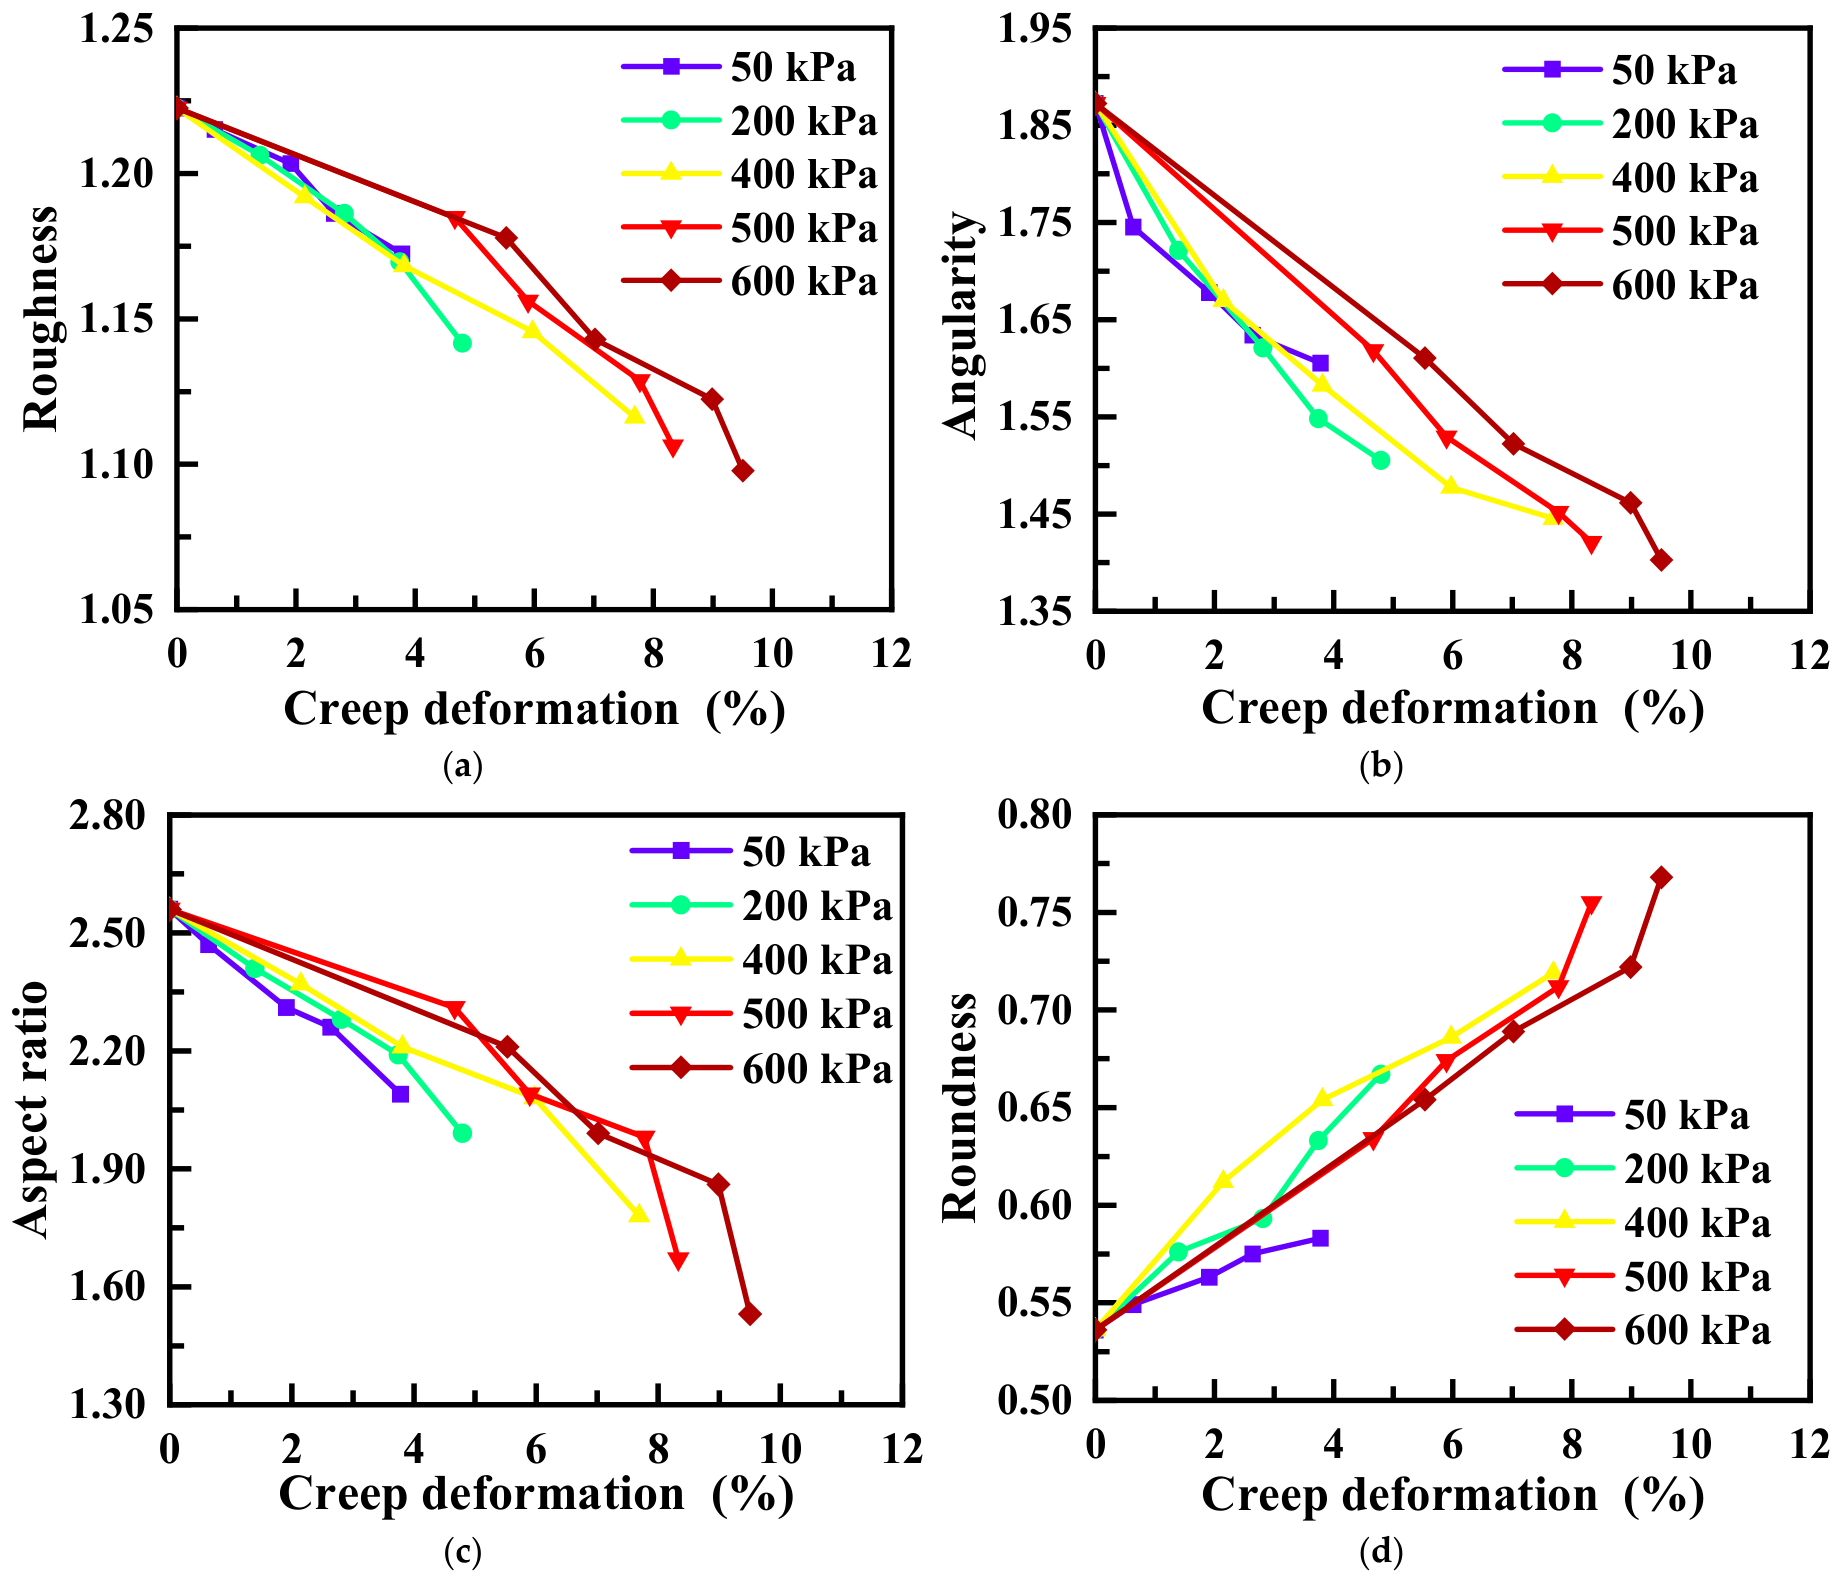
To further elucidate the relationship between particle morphology evolution and macroscopic creep deformation, Figure 13 shows the variations in roughness, angularity, aspect ratio, and roundness with shear strain under different normal stresses. Overall, creep deformation increased as the particle morphology became smoother, less angular, and more rounded. With increasing shear stress ratio, roughness, angularity, and aspect ratio generally decreased, whereas roundness progressively increased. This trend indicates that, throughout direct shear creep, calcareous sand particles gradually evolved from rough, angular, and irregular shapes into smoother, more rounded, and more regular forms. This process is consistent with the surface abrasion, corner breakage, localized fragmentation, and particle rearrangement observed in the preceding SEM analysis.
Under the same normal stress, a higher τ/τf resulted in greater final creep deformation and more pronounced changes in the particle morphology parameters. When τ/τf was relatively low, the shear driving force was limited, and the particles primarily underwent slight surface abrasion and local rearrangement at particle contacts. Consequently, roughness, angularity, and aspect ratio decreased only marginally, whereas the increase in roundness was limited. At this stage, creep deformation was predominantly characterized by a brief decelerating stage, and the overall particle fabric remained relatively stable. With increasing τ/τf, interparticle tangential sliding, rolling, and friction intensified, and local stress concentrations within the shear band became more pronounced. As a result, surface asperities were continuously worn down, sharp edges and corners were progressively damaged, and elongated particles became more prone to fracture and localized fragmentation. Therefore, under high τ/τf conditions, shear strain increased more substantially, roughness, angularity, and aspect ratio decreased more markedly, and roundness increased to a greater extent.
At a constant τ/τf, creep deformation generally increased with normal stress, accompanied by more pronounced changes in particle morphology. Higher normal stress enhanced interparticle contact forces and interlocking, thereby restricting particle sliding and rotation to some extent. However, because calcareous sand particles are porous, highly angular, and susceptible to crushing, high normal stress also significantly increased local compressive stresses at particle contacts, making particles more susceptible to surface abrasion, corner breakage, and localized fragmentation. Therefore, under high normal stresses of 500 kPa and 600 kPa, the variations in particle morphology parameters with shear strain were generally greater than those under lower normal stresses. This behavior was reflected in larger decreases in roughness, angularity, and aspect ratio, together with a greater increase in roundness.
The accumulation of creep deformation was accompanied by interparticle rearrangement. Particles with high angularity and large aspect ratios were more susceptible to rotation, fracture, and rearrangement. By contrast, the smaller and more rounded fragments generated by particle breakage could more readily fill interparticle voids and participate in the reorganization of the contact network. Under sustained shear stress, the particle system gradually rearranged toward a more stable configuration. The increased presence of rounded particles and fine fragments may have promoted more uniform contact-force transmission and reduced localized stress concentrations. With increasing creep deformation, irregular particles underwent breakage, sliding, and rearrangement, leading to an increased proportion of rounded particles and a corresponding increase in the measured roundness. Meanwhile, fine fragments filled interparticle voids and modified the particle-size distribution and contact configuration, further promoting the development of smoother and more regular particle morphologies. The combined effects of particle rearrangement and particle breakage therefore play a critical role in the creep behavior of calcareous sand.

3.4. Direct Shear Creep Model

3.4.1. Discussion of the Singh–Mitchell Creep Model

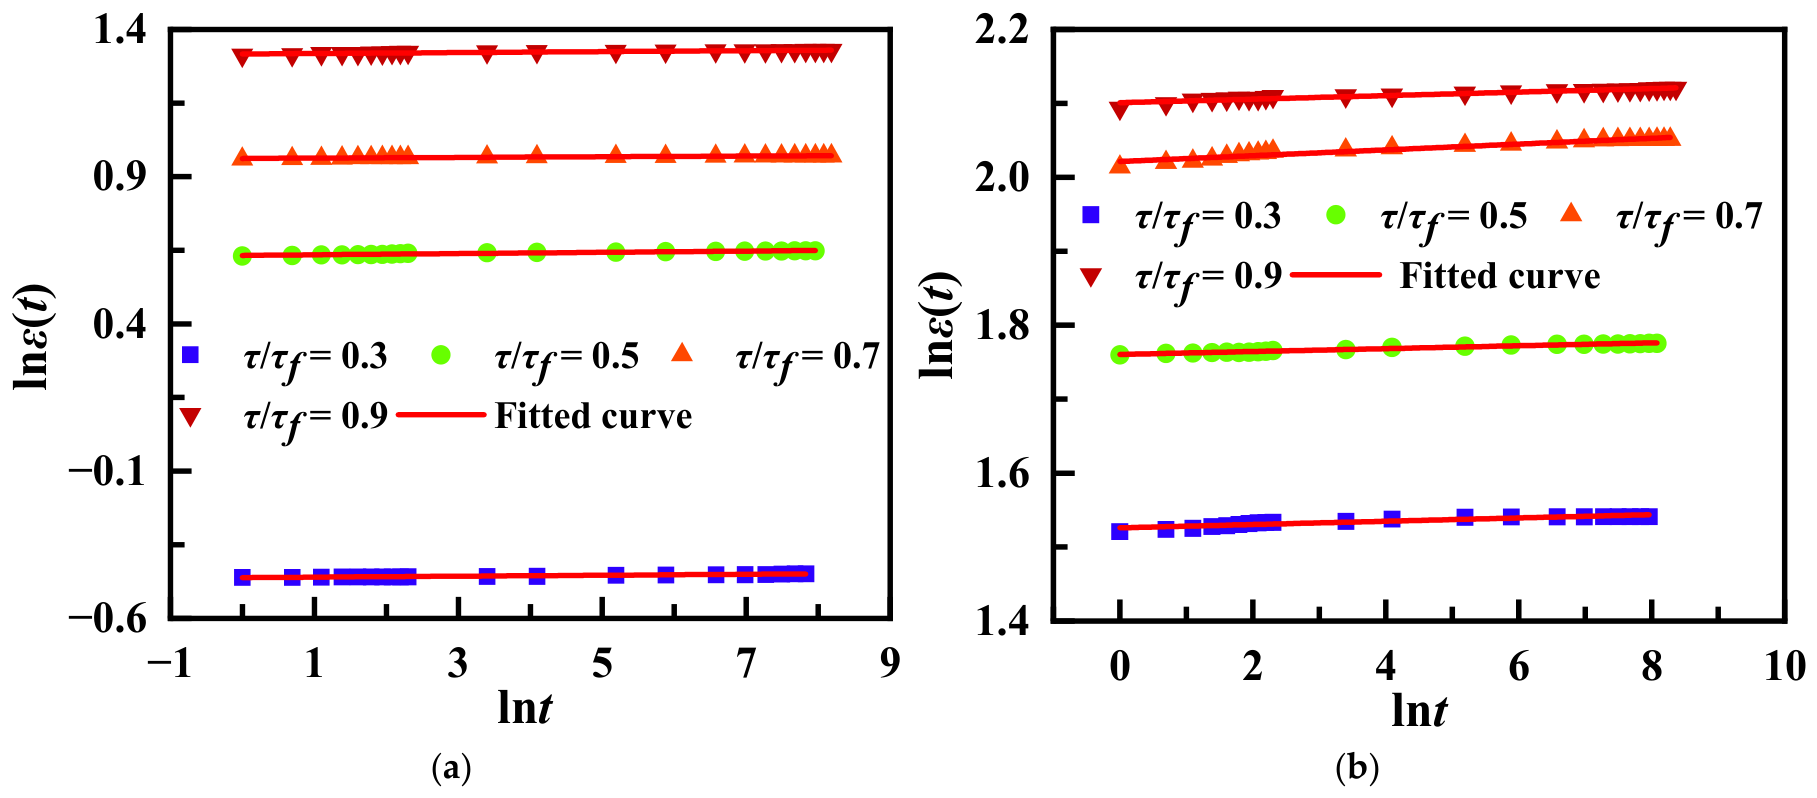
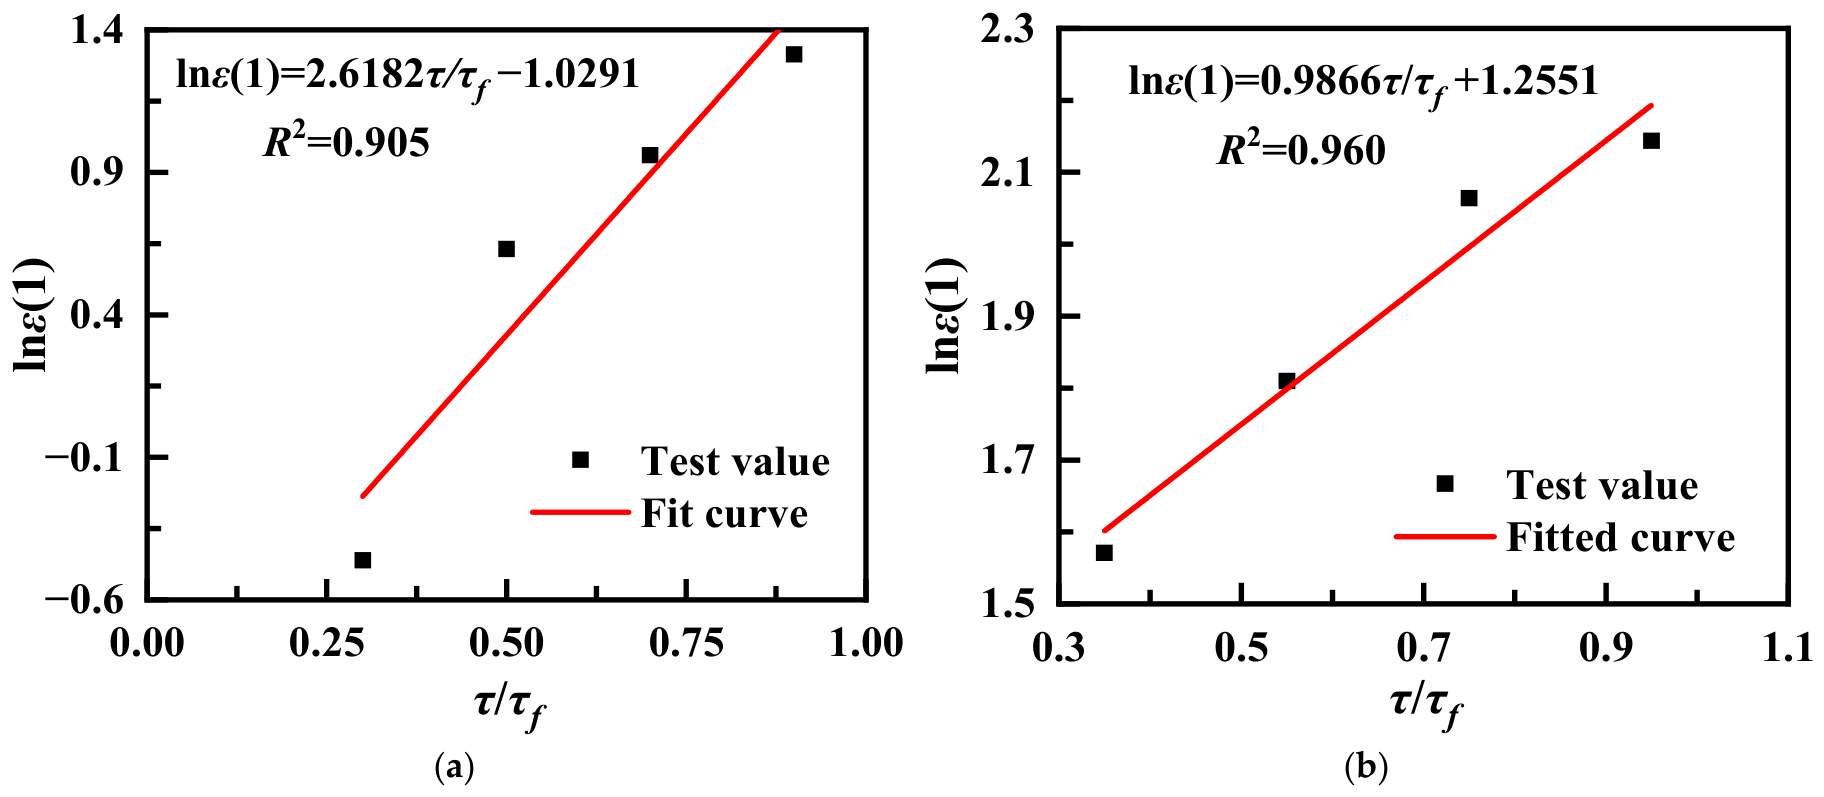
Among the empirical models developed to describe soil creep behavior, the Singh–Mitchell model has been widely applied. Its original form is given in Equation (7). Equation (7) can be rewritten as Equation (8). Defining B = A/(1 − m) and β = 1 − m, and taking the natural logarithm of both sides yields Equation (9). According to Equation (9), β represents the slope of the lnε(t)–lnt relationship. When t = 1, α represents the slope of the lnε(1)–τ/τf curve, whereas ln B represents the intercept of the lnε(1)–τ/τf curve.
ε ( t ) = ε 0 + A 1 m e α D ¯ t 1 m
ε t = A 1 m e α τ τ f t 1 m
ln ε ( t ) = ln B + α τ τ f + β ln t
where ε(t) is the shear strain at time t, %; ε0 is the initial shear strain, %; D ¯ = (σ1σ3)/(σ1σ3)f is the deviatoric stress level; t is the creep time, min; and A, α, and m are model parameters to be determined.
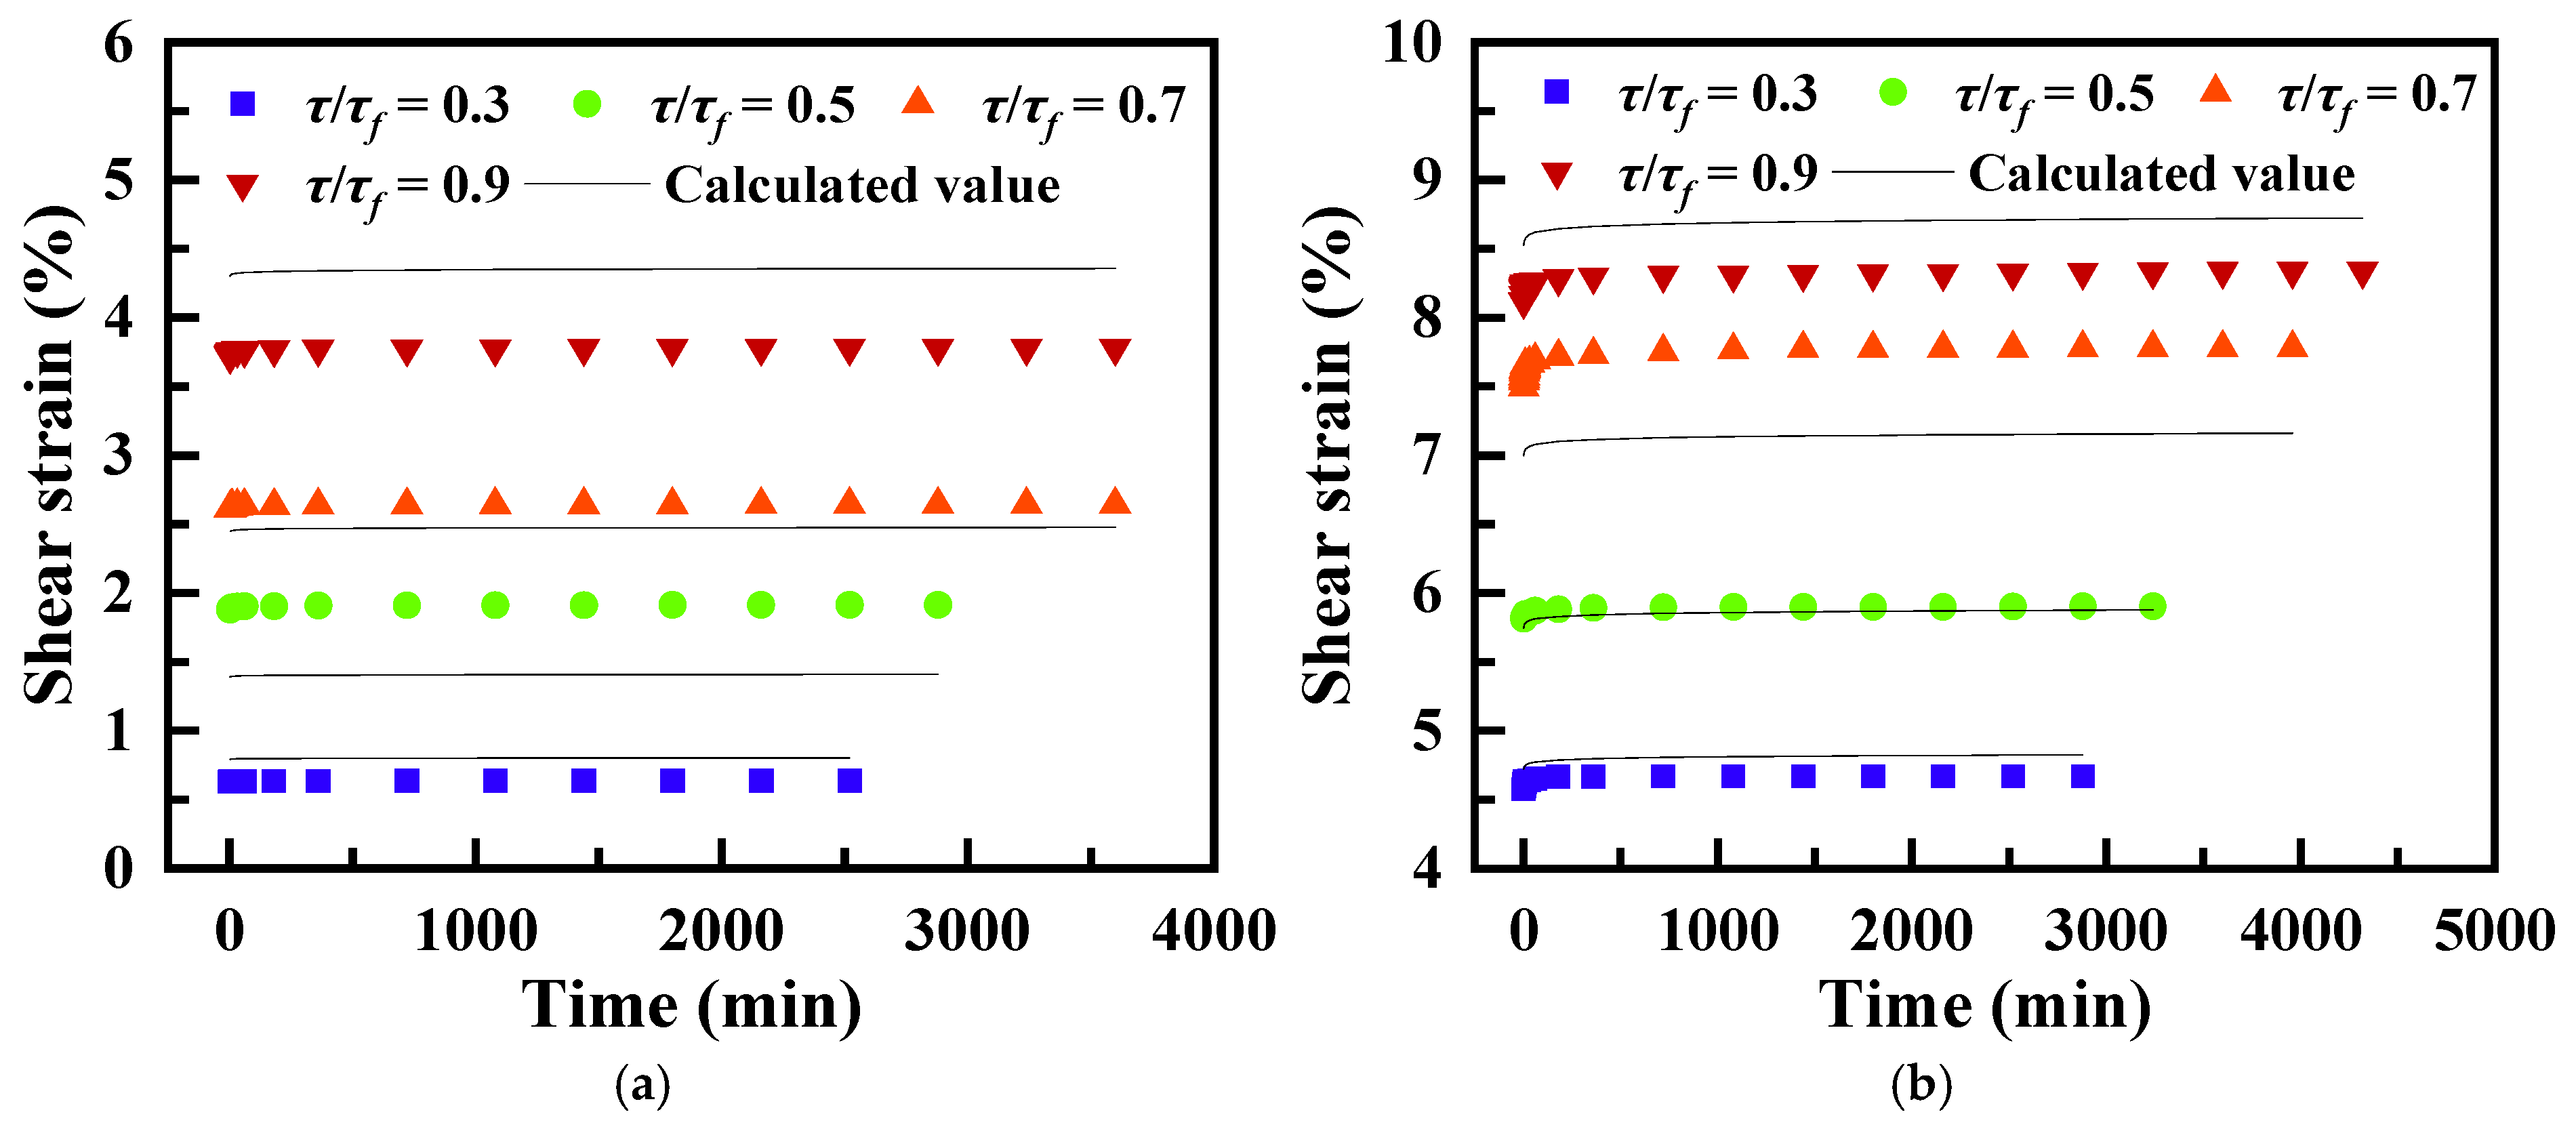
Using the normal stress conditions of 50 kPa and 500 kPa as examples, Figure 14 shows the fitted lnε(t)–lnt relationships, whereas Figure 15 shows the fitted lnε(1)–τ/τf relationships. The parameter β was obtained by averaging the slopes of the lnε(t)–lnt curves in Figure 14. The Singh–Mitchell model predictions were then calculated using Equations (10) and (11) and compared with the experimental results in Figure 16.
As shown in Figure 16, the Singh–Mitchell model exhibits different patterns of deviation under different τ/τf conditions. When τ/τf = 0.3, the calculated values were higher than the experimental values. This discrepancy may be attributed to the fact that the particle skeleton remained relatively stable under the low shear stress ratio, while particle breakage and rearrangement were limited. Consequently, the actual creep deformation was small, whereas the model continued to predict deformation based primarily on its time-dependent component. At τ/τf = 0.5, the calculated values were lower than the experimental values, indicating that particle breakage, particle sliding, contact rearrangement, and local corner abrasion produce additional deformation under an intermediate shear stress ratio. However, the conventional Singh–Mitchell model does not fully account for these particle-scale structural adjustment processes. At τ/τf = 0.9, the calculated values were again higher than the experimental values. This overestimation may occur because the model amplifies the effect of a high shear stress ratio on creep deformation, while neglecting the restraining effects of fine-fragment filling, local skeleton rearrangement, and shear-band stabilization on later-stage deformation development after particle breakage [34,35,36].
Tang et al. [13] introduced the particle breakage ratio as a correction factor to reduce model underestimation, as shown in Equation (12). However, this correction is less effective when the model overestimates the experimental results. Therefore, building on the power-function formulation, the present study develops a semi-empirical direct shear creep model for calcareous sand that incorporates the effects of macroscopic stress, particle breakage, and particle morphology evolution.
ε ( t ) = 0.0011 e 2.6812 τ τ f ( t ) 0.0016
ε ( t ) = 3.5083 e 0.9866 τ τ f ( t ) 0.0027
ε t = A 1 m e α τ τ f t 1 m + β α B r
where βα is the slope of the shear creep strain–particle breakage ratio relationship, and Br is the particle breakage ratio.

3.4.2. Model Calibration and Fit Assessment

During direct shear creep, normal stress controls the normal contact forces, degree of interlocking, and local stress concentrations at particle contacts, whereas the shear stress ratio reflects the magnitude of the applied shear stress relative to the shear strength under the corresponding normal stress. Accordingly, a macroscopic stress-driven factor, Ψ, is introduced. As shown in Equation (13), a multiplicative formulation is adopted to represent the combined effects of normal constraint and shear driving force on the direct shear creep behavior of calcareous sand.
Conventional creep models may exhibit relatively large prediction errors under high shear stress ratios because they do not explicitly account for particle breakage. Considering that particle breakage during the creep of calcareous sand is accompanied by changes in particle morphology, this study further introduces roughness, angularity, aspect ratio, and roundness to construct a particle morphology evolution index, Im. The selection of these morphology parameters was based on previous studies on the quantitative characterization of particle morphology and the breakage evolution of calcareous sand [30,31,32,33,37]. For simplicity, the particle morphology evolution index is calculated using an equal-weight averaging method, as shown in Equation (14). The particle breakage ratio, Br, and particle morphology evolution index, Im, are then combined to define the microscopic damage factor, Ω, as expressed in Equation (15).
Ψ = σ n σ ref τ τ f
where Ψ is the macroscopic stress-driven factor; σn is the normal stress, kPa; σref is the reference stress, taken as 100 kPa in this study; τ is the shear stress, kPa; and τf is the shear strength under the corresponding normal stress, kPa.
I m = ω 1 S 0 S S 0 + ω 2 A g 0 A g A g 0 + ω 3 A R 0 A R A R 0 + ω 4 R d R d 0 R d 0
Ω = B r + I m
where S, Ag, AR, and Rd are the particle roughness, angularity, aspect ratio, and roundness, respectively; S0, Ag0, AR0, and Rd0 are their corresponding pre-test values; and ω1, ω2, ω3, and ω4 are weighting coefficients satisfying 0 ≤ ωi ≤ 1 and ∑ωi = 1. In the proposed model, ω1 = ω2 = ω3 = ω4 = 0.25.
To provide a consistent representation of time-dependent creep behavior under different stress conditions, a normalized time-dependent function T(t) was introduced. The macroscopic stress-driven factor and microscopic damage factor were then incorporated into a direct shear creep model for calcareous sand, as expressed in Equation (16).
ε ( t ) = ε 1 + ( a Ψ + b Ω ) T ( t ) = ε 1 + ( a Ψ + b Ω ) ( t / t 0 ) q 1 ( t ref / t 0 ) q 1
where ε(t) is the shear strain at time t, %; ε1 is the shear strain at the initial loading time of 1 min, %; t is the creep time, min; t0 is the initial reference time, taken as 1 min in this study; tref is the unified reference time, taken as 5000 min according to the experimental observation period; and a, b, and q are fitting parameters. Among them, a reflects the influence of the macroscopic stress-driven factor on creep deformation; b reflects the influence of the microscopic damage factor on creep deformation; and q characterizes the degree to which the shear strain growth rate gradually decreases with time during shear creep.
Because Im is incorporated into the microscopic damage factor, its value depends on the weighting strategy adopted for the morphology parameters. Different weighting strategies would therefore alter the calculated value of the particle morphology evolution index, thereby affecting the magnitude of the microscopic damage factor, the fitted model parameters, and the predicted creep deformation. For example, increasing the weight assigned to angularity would emphasize the effects of particle corner breakage and weakened interparticle interlocking; increasing the weight assigned to aspect ratio would highlight the influence of particle elongation and fracture; increasing the weight of roughness would emphasize particle surface abrasion. Increasing the weight assigned to roundness would strengthen the contribution of edge smoothing and particle rounding to the creep damage model. Therefore, the equal-weight method is adopted in the proposed model as a practical simplification.
The direct shear creep test results were fitted using Equation (16), and the resulting model parameters for the different normal stresses are summarized in Table 3. The fitted parameters vary among the different stress conditions for several reasons. First, the direct shear creep behavior of calcareous sand is jointly controlled by normal stress, shear stress, particle breakage, particle morphology evolution, and particle rearrangement; therefore, a single parameter may reflect the combined effects of multiple mechanisms. Second, the particle breakage ratio and particle morphology parameters may evolve continuously with time during the direct shear creep process, whereas these parameters were measured only after each test in this study. Third, a, b, and q are semi-empirical fitting parameters rather than strictly independent material constants. Their fitted values may therefore be affected by the microstructural characteristics that govern the macroscopic mechanical and deformation behavior of the material [38,39].
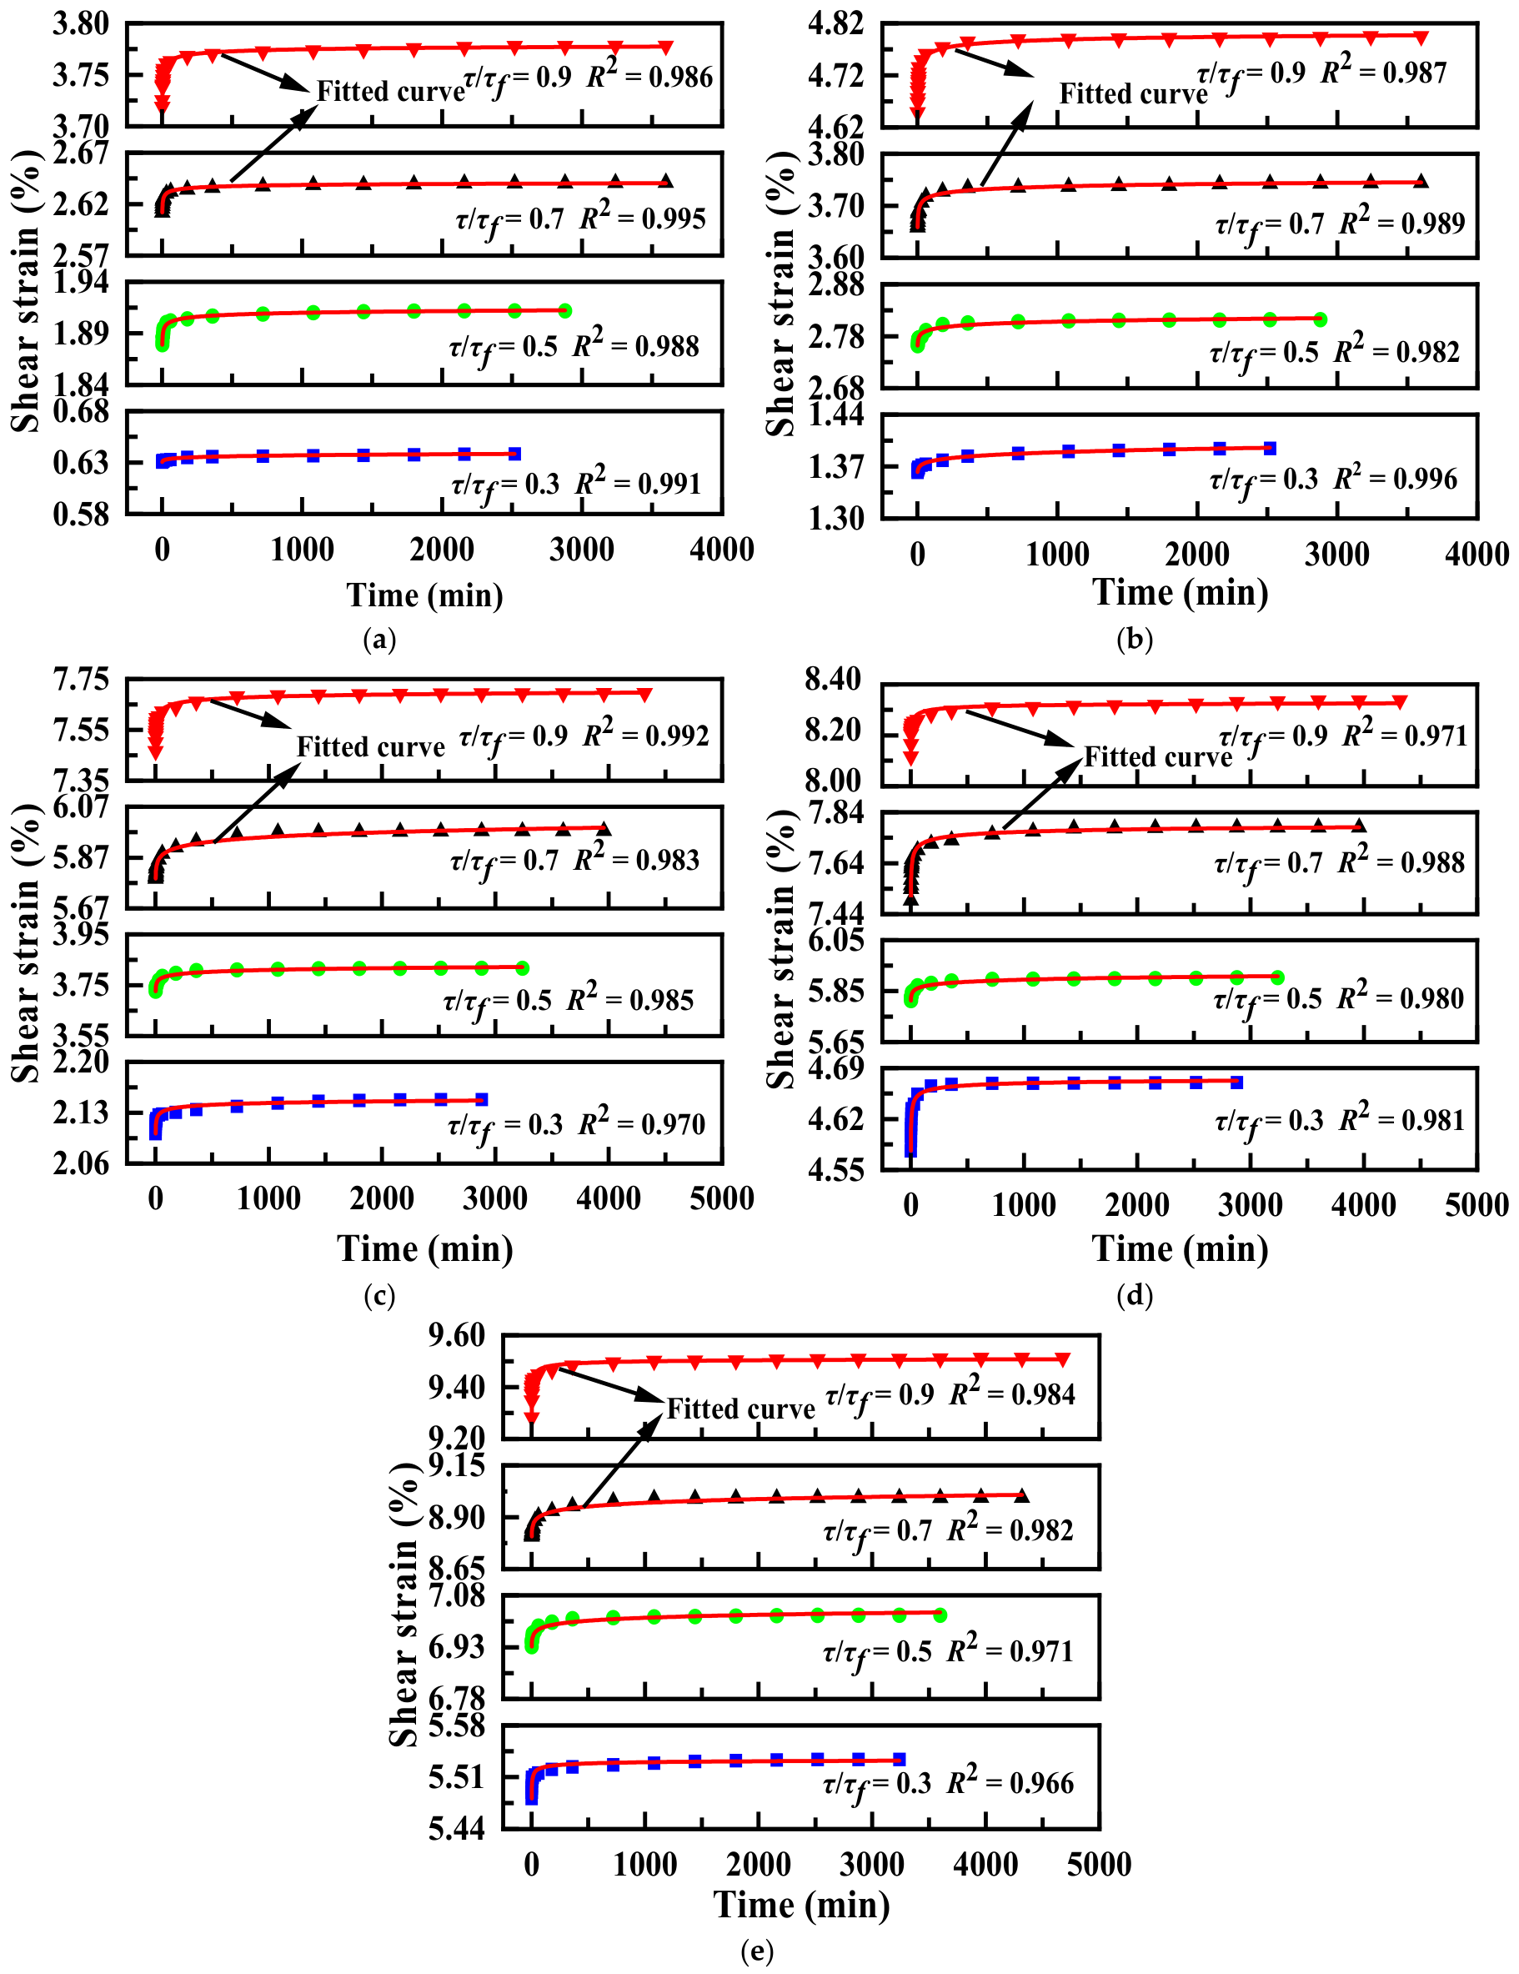
As shown in Figure 17, the established direct shear creep model effectively describes the shear strain–time relationship of calcareous sand under different normal stresses and shear stresses. All test curves exhibit nonlinear decelerating creep behavior, characterized by a rapid increase in shear strain during the initial loading stage, followed by a gradual reduction in the strain growth rate and eventual stabilization. The coefficients of determination (R2) exceed 0.966 for all curves. However, it should be noted that the model parameters were calibrated and evaluated using the same experimental dataset obtained in this study. Therefore, the current applicability of the proposed model is primarily limited to the tested calcareous sand and stress range. Its applicability to calcareous sands from other sources and under different relative densities, particle gradations, saturation states, and field-scale conditions requires further validation against independent laboratory tests and field data.

4. Conclusions

This study investigated the direct shear creep behavior of calcareous sand under various normal stresses and shear stress ratios through a series of laboratory tests. Direct shear creep tests were used to characterize macroscopic deformation, whereas sieve analysis, scanning electron microscopy (SEM), and image analysis were used to evaluate particle breakage and morphology evolution. A direct shear creep model incorporating a macroscopic stress-driven factor and a microscopic damage factor was then developed. The main conclusions are as follows:
(1)
The direct shear creep curves of calcareous sand exhibit pronounced nonlinear decelerating behavior, comprising three distinct stages: instantaneous deformation, decelerating creep, and steady-state creep. No accelerated creep stage was observed within the tested stress range, and the time required to reach the stabilization criterion ranged from approximately 2000 to 5000 min.
(2)
During direct shear creep, particle breakage in calcareous sand exhibits a distinct staged progression. Under low shear stress ratios, particle damage is predominantly characterized by surface abrasion and localized corner wear. As the shear stress ratio increases, the breakage mode progressively transitions to corner fracture, localized fragmentation, and the rupture of elongated particles. Under high shear stress ratios, complete particle rupture becomes increasingly evident.
(3)
Particle morphology parameters effectively characterize the microscopic damage evolution of calcareous sand during direct shear creep. With increasing shear stress ratio and particle breakage ratio, roughness, angularity, and aspect ratio decrease, whereas roundness increases. These changes indicate that the particles progressively evolve toward smoother, more rounded, and more equiaxed shapes.
(4)
Particle morphology parameters exhibit systematic relationships with macroscopic creep deformation. As creep deformation increases, roughness, angularity, and aspect ratio progressively decrease, whereas roundness increases. These trends provide particle-scale evidence for interpreting the macroscopic creep response of calcareous sand.
(5)
The proposed direct shear creep model accurately reproduces the shear strain–time curves within the tested range, with coefficients of determination R2 greater than 0.966 for all test conditions. The model provides a semi-empirical framework for describing the direct shear creep behavior of calcareous sand by accounting for macroscopic stress effects, particle breakage, and particle morphology evolution. However, because its parameters were calibrated using the present experimental dataset, further validation using independent tests, other calcareous sands, and broader stress and environmental conditions is required.

5. Limitations and Future Work

(1)
This study was limited to a single calcareous sand source, one particle size distribution, and one relative density, within normal stresses ranging from 50 to 600 kPa and shear stress ratios ranging from 0.3 to 0.9 (τ/τf). Future research should investigate the effects of different relative densities, saturation conditions, particle size distributions, material sources, and wider stress ranges to assess the general applicability of the findings.
(2)
The particle morphology parameters in this study were derived primarily from mean measurements of particles identified in SEM images, whereas standard deviations, coefficients of variation, and confidence intervals were not systematically reported. Future work should include a larger number of particles in the statistical analysis, report measures of variability and uncertainty, and evaluate the sensitivity of the results to image-processing procedures.
(3)
The particle morphology evolution index was constructed by assigning equal weights to roughness, angularity, aspect ratio, and roundness. However, these morphology parameters may have different effects on creep deformation. Future studies should quantify their relative contributions and determine more appropriate weighting coefficients using sensitivity analysis, principal component analysis, and regression analysis [40,41].
(4)
The model parameters in this study were primarily determined by fitting the experimental data obtained in the present tests, and independent validation using external datasets was not performed. Some parameters may also be sensitive to specific testing conditions and local features of the creep curves. Future work should examine the stability and transferability of the model parameters across different calcareous sand sources and loading conditions. Independent laboratory datasets, field observations, and engineering case studies should also be used to further evaluate the predictive capability and reliability of the model.

Author Contributions

Conceptualization, B.T. and P.Q.; methodology, J.H.; validation, P.Q., J.H., and X.H.; resources, B.T.; data curation, X.H.; writing—original draft preparation, P.Q.; writing—review and editing, X.H.; supervision, J.H.; funding acquisition, B.T. All authors have read and agreed to the published version of the manuscript.

Funding

This project was financially supported by the National Natural Science Foundation of China (No. 42367020).

Data Availability Statement

The data presented in this study are available on request from the corresponding author.

Conflicts of Interest

The authors declare no conflicts of interest.

References

  1. Wu, Y.; Li, N.; Hyodo, M.; Cui, J.; Spencer, B.F.; Yamamoto, H. Experimental investigation on mechanical behavior and particle crushing of calcareous sand retrieved from South China Sea. Eng. Geol. 2021, 280, 105932. [Google Scholar] [CrossRef]
  2. Wang, G.; Wang, Z.; Ye, Q.; Wei, X. Particle breakage and deformation behavior of carbonate sand under drained and undrained triaxial compression. Int. J. Geomech. 2020, 20, 04020012. [Google Scholar] [CrossRef]
  3. Wang, Y.; Ma, L.; Wang, M.; Lv, Y.; Dong, L.; Fan, P. A creep constitutive model incorporating deformation mechanisms for crushable calcareous sand. Arab. J. Geosci. 2018, 11, 623. [Google Scholar] [CrossRef]
  4. Shen, J.; Chen, X.; Wang, X.; Wang, X.; Qin, Y.; Wu, H. Compression responses and particle breakage of calcareous granular material in reclaimed islands. Powder Technol. 2023, 418, 118277. [Google Scholar] [CrossRef]
  5. Zeng, K.F.; Liu, H.B. Experimental study on the time-dependent oedometric compression behavior of calcareous sand. J. Geotech. Geoenviron. Eng. 2023, 149, 04023025. [Google Scholar] [CrossRef]
  6. Zeng, K.F.; Liu, H.B. Time-dependent characteristics of coral sand under triaxial stress states. J. Geotech. Geoenviron. Eng. 2025, 151, 04024168. [Google Scholar] [CrossRef]
  7. Yu, F. Particle breakage in triaxial shear of a coral sand. Soils Found. 2018, 58, 866–880. [Google Scholar] [CrossRef]
  8. Lv, Y.; Li, F.; Liu, Y.W.; Wang, M.Y. Comparative study of coral sand and silica sand in creep under general stress states. Can. Geotech. J. 2017, 54, 1601–1611. [Google Scholar] [CrossRef]
  9. Ye, J.H.; Haiyilati, Y.; Cao, M.; Zuo, D.J.; Chai, X.W. Creep characteristics of calcareous coral sand in the South China Sea. Acta Geotech. 2022, 17, 5133–5155. [Google Scholar] [CrossRef]
  10. Gao, Y.; Shi, T.; Yuan, Q.; Sun, K. The creep characteristics and related evolution of particle morphology for calcareous sand. Powder Technol. 2024, 431, 119077. [Google Scholar] [CrossRef]
  11. Wei, H.; Li, X.; Zhang, S.; Zhao, T.; Yin, M.; Meng, Q. Influence of particle breakage on drained shear strength of calcareous sands. Int. J. Geomech. 2021, 21, 04021118. [Google Scholar] [CrossRef]
  12. Wei, H.; Liu, H.; Zhao, T.; Zhang, S.; Ma, L.; Yin, M.; Meng, Q. Particle breakage and morphology changes of calcareous sands under one-dimensional compression loading. Mar. Geophys. Res. 2022, 43, 45. [Google Scholar] [CrossRef]
  13. Tang, B.; Huang, X.; Zhong, W. Study on shear creep model of calcareous sand in China South Sea. Front. Earth Sci. 2025, 12, 1525037. [Google Scholar] [CrossRef]
  14. Choo, H.; Kwon, M.; Touiti, L.; Jung, Y.-H. Creep of calcareous sand in Tunisia: Effect of particle breakage at low stress level. Int. J. Geo-Eng. 2020, 11, 16. [Google Scholar] [CrossRef]
  15. Zhang, Y.; Zhang, R.; Yu, C.; Luo, H.; Deng, Z. Study on shear characteristics of calcareous sand with different particle size distribution. Front. Earth Sci. 2023, 11, 1163930. [Google Scholar] [CrossRef]
  16. Feng, Z.; Xu, W.; Meng, Q. Mechanical behaviors of interaction between coral sand and structure surface. J. Cent. South Univ. 2020, 27, 3436–3449. [Google Scholar] [CrossRef]
  17. Wang, T.; Cui, Y.; Liu, Z.; Bao, X. Experimental study on particle breakage in calcareous sand during large-displacement shear at soil–structure interfaces. Eng. Geol. 2025, 357, 108358. [Google Scholar] [CrossRef]
  18. Li, Z.; Zhang, Z.; Tai, P.; Shen, P.; Li, J. Investigation of morphological effects on crushing characteristics of calcareous sand particle by 3D image analysis with spherical harmonics. Powder Technol. 2024, 433, 119204. [Google Scholar] [CrossRef]
  19. Wei, H.; Zhao, T.; Meng, Q.; Wang, X.; Zhang, B. Quantifying the morphology of calcareous sands by dynamic image analysis. Int. J. Geomech. 2020, 20, 04020020. [Google Scholar] [CrossRef]
  20. Shi, D.; Cao, D.; Xue, J.; Deng, Y.; Liang, Y. DEM studies on the effect of particle breakage on the critical state behaviours of granular soils under undrained shear conditions. Acta Geotech. 2022, 17, 4865–4885. [Google Scholar] [CrossRef]
  21. Xiao, Y.; Sun, Y.; Zhou, W.; Shi, J.; Desai, C.S. Evolution of particle shape produced by sand breakage. Int. J. Geomech. 2022, 22, 04022003. [Google Scholar] [CrossRef]
  22. Wei, H.; Zhao, T.; He, J.; Meng, Q.; Wang, X. Evolution of particle breakage for calcareous sands during ring shear tests. Int. J. Geomech. 2018, 18, 04017153. [Google Scholar] [CrossRef]
  23. Ye, Q.; Yin, H.; Wang, Z.; Wang, G. Particle breakage model for coral sand under triaxial compression stress paths. Acta Geotech. 2021, 16, 2463–2480. [Google Scholar]
  24. Sun, S.; Tang, H.; An, P.; Gong, Q.; Tang, C.; Zhang, Y. Creep behavior and microstructural evolution of sliding zone soil in slow-moving landslides in the Three-Gorges Reservoir area. Sci. Rep. 2026, 16, 18224. [Google Scholar] [CrossRef] [PubMed]
  25. He, J.; Li, X.; Yang, W.; Liu, L.; Yang, H. Creep characteristics of composite geomembrane based on viscoelastic models. J. Mater. Civ. Eng. 2024, 36, 05024002. [Google Scholar] [CrossRef]
  26. Zhong, H.; Tang, B.; Wang, Y. Study on long-term direct shear effects on the particle breakage characteristics of calcium sand. Hydro-Sci. Eng. 2024, 4, 118–126. [Google Scholar]
  27. Hardin, B.O. Crushing of soil particles. J. Geotech. Eng. 1985, 111, 1177–1192. [Google Scholar] [CrossRef]
  28. Chen, B.; Deng, J.; Hu, J.M.; Zhang, J.L.; Zhang, T. Macroscopic and microscopic experimental study on fractal fragmentation characteristics of calcareous sand during one-dimensional compression creep. Rock Soil Mech. 2022, 43, 1781–1790. [Google Scholar]
  29. Guyon, E.; Troadec, J.P. Du Sac de Billes Au Tas de Sable; Odile Jacob: Paris, France, 1994. [Google Scholar]
  30. Touiti, L.; Kim, T.; Jung, Y.H. Analysis of calcareous sand particle shape using Fourier descriptor analysis. Int. J. Geo-Eng. 2020, 11, 15. [Google Scholar] [CrossRef]
  31. Wei, H.; Yin, M.; Zhao, T.; Yan, K.; Shen, J.; Meng, Q.; Wang, X.; He, J. Effect of particle breakage on the shear strength of calcareous sands. Mar. Geophys. Res. 2021, 42, 23. [Google Scholar] [CrossRef]
  32. Sun, Y.; Xiao, Y.; Zhou, W.; Liu, H.L. Particle breakage and shape evolution of calcareous and quartz sands under compression. Chin. J. Geotech. Eng. 2022, 44, 1061–1068. [Google Scholar]
  33. Wei, X.; Lu, Y.; Liu, X.; Zhang, B.; Luo, M.; Zhong, L. Particle shape analysis of calcareous sand based on digital images. Sci. Rep. 2024, 14, 18465. [Google Scholar] [CrossRef] [PubMed]
  34. Xue, P.; Zhou, X.Q.; Cai, Y.Y.; Ma, L.J.; Liao, R.G.; Yu, J. Triaxial creep characteristics and empirical model for saturated coral sand. Chin. J. Geotech. Eng. 2020, 42, 255–260. [Google Scholar]
  35. Wang, C.; Zhan, C.N.; He, P.; Li, L. Creep and particle breakage behavior of rockfill in triaxial compression testing. J. Civ. Archit. Environ. Eng. 2011, 33, 57–62. [Google Scholar]
  36. Cao, M.; Ye, J.H. Creep-stress-time four parameters mathematical model of calcareous sand in South China Sea. Rock Soil Mech. 2019, 40, 1771–1777. [Google Scholar]
  37. Chen, B.; Hu, J.-M. Fractal behavior of coral sand during creep. Front. Earth Sci. 2020, 8, 134. [Google Scholar] [CrossRef]
  38. Imoh, U.U.; Habashneh, M.; Kaine, S.C.; Babafemi, A.J.; Hassan, R.; Movahedi Rad, M. Metakaolin-enhanced laterite rock aggregate concrete: Strength optimization and sustainable cement replacement. Buildings 2025, 15, 4553. [Google Scholar] [CrossRef]
  39. Imoh, U.U.; Apata, A.C.; Bolorunduro, A.M.; Movahedi Rad, M. Mechanistic and comparative laboratory assessment of lime dosage and uniaxial geogrid on the strength and durability of classified lateritic subgrade. Sci. Rep. 2025, 15, 42901. [Google Scholar] [CrossRef] [PubMed]
  40. Imoh, U.U.; Nagy, R.; Movahedi Rad, M. Micro-mechanical characterization of polymer-modified asphalt mixtures using discrete element modelling with soft-bond and linear contact bond models. Constr. Build. Mater. 2025, 501, 144325. [Google Scholar] [CrossRef]
  41. Imoh, U.U.; Alalade, S.; Awoyera, P.O.; Qin, X. Constitutive modelling of recycled PET-modified asphalt concrete using CBM–PBM within a discrete element framework. Case Stud. Constr. Mater. 2026, 25, e06225. [Google Scholar] [CrossRef]
Figure 1. Particle size distribution of calcareous sand.
Buildings 16 02856 g001
Figure 2. ZLB-1 triple rheological direct shear testing apparatus. (a) Top view; (b) A–A sectional view.
Buildings 16 02856 g002
Figure 3. Calcareous sand specimens.
Buildings 16 02856 g003
Figure 4. S-4800 field-emission scanning electron microscope.
Buildings 16 02856 g004
Figure 5. Shear strain–time curves. (a) 50 kPa; (b) 200 kPa; (c) 400 kPa; (d) 500 kPa; (e) 600 kPa.
Buildings 16 02856 g005aBuildings 16 02856 g005b
Figure 6. Shear strain rate–time curves.
Buildings 16 02856 g006
Figure 7. Relationship between the shear stress ratio and particle breakage ratio.
Buildings 16 02856 g007
Figure 8. SEM images of calcareous sand before and after direct shear creep at different shear stress ratios under a normal stress of 600 kPa. (a) Before testing; (b) τ/τf = 0.3; (c) τ/τf = 0.5; (d) τ/τf = 0.7; (e) τ/τf = 0.9; (f) Surface abrasion features.
Buildings 16 02856 g008
Figure 9. SEM image and corresponding binary image of calcareous sand particles: (a) SEM image; (b) binary image.
Buildings 16 02856 g009
Figure 10. Definitions of the particle morphology parameters of calcareous sand. (a) Roughness; (b) Angularity; (c) Aspect ratio; (d) Roundness.
Buildings 16 02856 g010
Figure 11. Relationships between the shear stress ratio and particle morphology parameters. (a) Roughness; (b) Angularity; (c) Aspect ratio; (d) Roundness.
Buildings 16 02856 g011
Figure 12. Relationships between the particle breakage ratio and particle morphology parameters. (a) Roughness; (b) Angularity; (c) Aspect ratio; (d) Roundness.
Buildings 16 02856 g012aBuildings 16 02856 g012b
Figure 13. Relationships between particle morphology parameters and creep deformation. (a) Roughness; (b) Angularity; (c) Aspect ratio; (d) Roundness.
Buildings 16 02856 g013
Figure 14. Fitted lnε(t)–lnt relationships. (a) 50 kPa; (b) 500 kPa.
Buildings 16 02856 g014
Figure 15. Fitted lnε(1)–τ/τf relationships. (a) 50 kPa; (b) 500 kPa.
Buildings 16 02856 g015
Figure 16. Comparison between the Singh–Mitchell model calculations and the experimental results. (a) 50 kPa; (b) 500 kPa.
Buildings 16 02856 g016
Figure 17. Fitted curves of the direct shear creep model of calcareous sand under various normal stresses. (a) 50 kPa; (b) 200 kPa; (c) 400 kPa; (d) 500 kPa; (e) 600 kPa.
Buildings 16 02856 g017
Table 1. Physical properties of calcareous sand.
Gsρmax (g/cm3)ρmin (g/cm3)ω (%)CuCc
2.751.4391.2390.0195.131.12
Table 2. Direct shear creep test loading scheme.
Test No.σn (kPa)τf (kPa)τ (kPa)
0.3τf0.5τf0.7τf0.9τf
Group 15058.617.629.341.052.7
Group 2200226.567.9113.3158.6203.9
Group 3400457.7137.3228.9320.4411.9
Group 4500563.2170.0281.7394.3507.0
Group 5600652.4195.7326.2456.7587.2
Table 3. Model parameters of calcareous sand under direct shear creep.
σn (kPa)τ (kPa)Model ParametersRMSEMAE
abq
500.3τf0.04040.08380.12740.00030.0002
0.5τf0.13810.0016−0.15850.00120.0009
0.7τf0.06500.0584−0.23950.00060.0005
0.9τf0.13140.2658−0.29560.00210.0016
2000.3τf0.06290.01130.14100.00070.0005
0.5τf0.01730.6019−0.22900.00270.0018
0.7τf0.06050.0224−0.13580.00300.0021
0.9τf0.00320.6687−0.24110.00530.0036
4000.3τf0.02350.2039−0.15710.00250.0019
0.5τf0.03270.2330−0.05270.00400.0031
0.7τf0.07380.69410.02840.00930.0076
0.9τf0.01720.6019−0.22900.00630.0043
5000.3τf0.05210.1668−0.30900.00410.0033
0.5τf0.04450.0118−0.06330.00320.0027
0.7τf0.04460.6254−0.24330.00980.0079
0.9τf0.04670.2341−0.33490.01010.0083
6000.3τf0.02850.0013−0.30060.00270.0023
0.5τf0.03240.0116−0.09150.00540.0043
0.7τf0.04750.01630.02730.00970.0080
0.9τf0.03040.1606−0.36330.00790.0058
Disclaimer/Publisher’s Note: The statements, opinions and data contained in all publications are solely those of the individual author(s) and contributor(s) and not of MDPI and/or the editor(s). MDPI and/or the editor(s) disclaim responsibility for any injury to people or property resulting from any ideas, methods, instructions or products referred to in the content.