Article

Theoretical Prediction Model for the Cracking Moment of RC Beams with Openings Based on the Plane Section Assumption

1
State Key Laboratory of Geohazard Prevention and Geoenvironment Protection, Chengdu University of Technology, Chengdu 610059, China
2
School of Intelligent Construction and Engineering Technology, Neijiang Vocational and Technical College, Neijiang 641100, China
*
Author to whom correspondence should be addressed.
Buildings 2026, 16(14), 2833; https://doi.org/10.3390/buildings16142833
Submission received: 16 June 2026 / Revised: 10 July 2026 / Accepted: 13 July 2026 / Published: 16 July 2026
(This article belongs to the Section Building Structures)

Abstract

Accurate prediction of the cracking moment in RC beams with openings is crucial for structural safety assessment. This study systematically establishes, for the first time, theoretical prediction models for the cracking moment of six categories of beams with openings and their corresponding applicability criteria. The reliability of the models was validated via ABAQUS finite element analysis, comparing GB 50010-2010 and ACI 318-19 codes. The results indicate that the theoretical model predictions align well with numerical simulation results, exhibiting low dispersion (central openings: Mean = 0.9903, CV = 0.0295; eccentric openings: Mean = 1.0078, CV = 0.032). Model predictions also show high consistency with calculations from the GB 50010-2010 code formulas (central openings: Mean = 1.0157, CV = 0.0471; eccentric openings: Mean = 1.0026, CV = 0.0563). However, agreement with ACI 318-19 code formula calculations is lower and dispersion is greater (central openings: Mean = 1.1858, CV = 0.1068; eccentric openings: Mean = 1.174, CV = 0.1009), primarily attributable to the conservative nature of the ACI 318-19 code. The study reveals that the theoretical models for the cracking moment of beams with central and eccentric openings are not unique and dynamically switch based on changes in material parameters and opening parameters. For beams with central openings, the opening ratio threshold was identified as 30%, and a maximum opening ratio not exceeding 48% is recommended. For beams with eccentric openings, the optimal eccentricity for different opening ratios was determined to be 8%. This research provides a theoretical basis and technical support for the universal prediction of cracking performance in beams with openings.

1. Introduction

Openings in reinforced concrete (RC) beams are increasingly introduced in renovation and decoration projects to accommodate pipelines and maximize headroom (Figure 1). Characterized by the opening ratio (d0/h) and eccentricity (e/h), these discontinuities disrupt internal force flow. However, improper opening design (in terms of location, size, or shape) can cause stress concentrations, premature cracking, reduce durability, and even induce splitting or shear failure. These failures compromise safety and lead to significant economic losses. Among serviceability indicators, the cracking moment (the load at which the first visible tensile crack forms) is particularly critical, as it governs crack initiation, and the early deformation response, directly affecting the long-term safety and service life of RC structures. Therefore, establishing a reliable prediction model for the cracking moment of beams with openings is therefore of high theoretical and engineering importance. This advancement would ensure structural service safety, optimize opening design, and enable a shift from empirical to performance-based engineering practice.
Over the past three decades, a substantial body of research has investigated the structural performance of RC beams with openings from experimental, analytical, and numerical perspectives. These studies can be grouped into three major themes: (1) the effect of openings on shear resistance and ultimate load capacity, (2) strengthening strategies and their implications for cracking behavior, and (3) responses under special conditions such as high temperature, impact, and fatigue.
Shear resistance and ultimate load capacity. Extensive research has confirmed that web openings weaken RC beam capacity, with the degree of reduction highly dependent on location, size, and shape. Yin et al. [1] proposed analytical models for beams with circular openings, while Xu et al. [2] experimentally showed that openings in the shear-flexure zone notably decrease the ultimate load capacity. Zhang et al. [3] reported that mid-span openings weaken both shear and flexural capacities, while rectangular openings can be partially compensated by stirrups or diagonal reinforcement [4], and Zhang et al. [5] experimentally revealed that circular openings in the flexural zone do not affect normal section capacity but reduce crack resistance, While Cai et al. [6] found that prestressing only slightly improved the shear stiffness of beams with openings, it effectively suppressed the propagation of diagonal cracks. Hemzah et al. [7] further observed in self-compacting concrete hollow beams that cracking load increased by 44.1% at 0.25 h and 48.5% at 0.35 h, but dropped drastically to only 9.38% at 0.45 h, revealing a critical thresh-old. Other studies confirmed this trend: Amin et al. [8] found that the failure load of exposed beam-column connections significantly decreases as openings approach columns and rectangular openings widen, Ali et al. [9] reported almost linear shear strength reductions of 2–53% with size growth, and Elsayed et al. [10] measured a 33.7% shear loss in ultra-high-performance concrete beams. Al-Mahbashi et al. [11] measured that in continuous deep beams, circular openings cause a 41% reduction in failure load, while rectangular openings result in a 45% decrease, while Shoeib et al. [12] indicated that the presence of openings reduces the shear capacity of RC beams. Özkılıç et al. [13] demonstrated that when stirrup reinforcement is insufficient, an increase in opening diameter leads to a more pronounced reduction in the load-bearing capacity of the member. Collectively, these studies illustrate how openings redistribute stresses and diminish global capacity, but only a minority [5,7] included data directly related to cracking load initiation.
Strengthening techniques and performance enhancement. A large number of investigations have explored reinforcement and repair techniques to mitigate opening effects. FRP-based methods are among the most widely studied: Zhao et al. [14] found that CFRP effectiveness grows with opening size, while Elansary et al. [15] measured shear increases of 21–28%, Kumari et al. [16] demonstrated that the shear strength of web-opening beams reinforced with EBGFRP fabrics and GAF increased by 64% compared to unreinforced deep beams. Other innovate approaches include PET fibers [17], which raised ultimate load by 4.1–5.8% openings up to 0.35 h, but decreased strength by 9.6% at 0.45 h, indicating limited applicability. Mai et al. [18] emphasized rational reinforcement arrangements, while Sun et al. [19] proposed confinement strategies in plastic hinge zones. Kim et al. [20] found that small circular openings (d0 < 0.3 h) in hinge zones, when strengthened, had little impact on strength or cracking behavior. Some strengthening systems directly targeted cracking loads. Ghalla et al. [21] showed that the anchored EBR-SSS scheme raised initial cracking load by 59%, ultimate load by 65%, stiffness by over 100%. Fayed et al. [22] pointed out that increasing web steel plate height ratio from 0.4 to 1.0 improved load capacity by 141%. Other material innovations included ECC and bamboo reinforcement [23], welded internal steel plates [24] raising ultimate load by 116%, and SHCC with steel wire mesh [25] which increased ultimate load by 35–47% depending on reinforcement layers. Erfan et al. [26] showed that two 12 mm BFRP bars increased failure load by 34% and ductility by 20.3%, while Fan et al. [27] highlighted that web reinforcement combined with hybrid fibers enhanced shear capacity synergistically. Despite these promising results, systematic evaluation of their impact on cracking initiation remains scarce, with [20,21] being notable exceptions.
Special conditions and complex behavior. Research has also extended to nonstandard conditions. Jin et al. [28] investigated high-temperature effects, showing the flexural capacity of solid beams decreased by 9.6–12.5% after exposure to 100–500 °C, whereas openings and their sizes had less influence. Furthermore, Miao et al. [29] found that temperature had a slightly greater impact on cracking load than on ultimate load, with significant high-temperature effects. In addition, Shabanlou et al. [30] found that fire increased beam brittleness, and capacity losses were smaller when openings were located away from critical load paths. Impact and fatigue behaviors have been studied by Liu et al. [31] and Chen et al. [32], the latter proposing a prediction method for fatigue deformation with errors below 7%. Zhang et al. [33] found that web openings shift beam-column joint failure modes from column to beam ends. Kartal et al. [34] indicated that the strut inclination angle largely determines ductility in beams with multiple parallelogram openings. Daniel et al. [35] found that increasing opening length affects crack behavior and flexural strength, while Fu et al. [36] demonstrated that multiple small openings (d ≈ 0.1 h) can enhance shear performance when no web reinforcement is present. Saleh et al. [37] confirmed the capability of artificial intelligence models to predict shear capacity with good accuracy. Among these works, only [29] specifically examined cracking load degradation, reinforcing the observation that crack initiation remains underexplored in special condition studies.
Synthesizing the three major themes above, the existing literature has significantly advanced the understanding of RC beams with openings, particularly concerning the mechanisms of ultimate strength reduction, strengthening techniques, and responses under specific loading conditions. However, most research has focused on global failure modes, while crack initiation and the corresponding cracking moment remain insufficiently investigated. Only a limited number of studies [5,7,20,21,29] have directly addressed the crack initiation threshold, and these results are scattered across different beam types, reinforcement schemes, and loading conditions. Currently, there is no universal model capable of incorporating the opening ratio, eccentricity, material strengths, and reinforcement ratio into a framework for predicting the cracking moment. Furthermore, engineering practice requires quantitative threshold values for the opening ratio and eccentricity, yet such data remains lacking in the literature.
To address these research gaps, this study, based on the plane section assumption, aims to establish a theoretical framework for predicting the cracking moment of RC beams with openings. The following innovative research is conducted: (1) Establishment of a universal theoretical framework for cracking moment prediction. Through theoretical analysis, a model framework for six types of opening scenarios is developed, achieving for the first time a coupled analytical solution incorporating the opening ratio, eccentricity, and material parameters. (2) Multi-dimensional validation of model reliability. The reliability of the theoretical prediction models is verified based on ABAQUS finite element analysis, combined with the Chinese code GB 50010-2010 [38] and the American code ACI 318-19 [39]. (3) Revelation of the dynamic switching mechanism of the models. Verification results from numerical simulations and the Chinese/American codes reveal the dynamic switching mechanism governing the theoretical prediction models for the cracking moment of beams with openings. This mechanism is jointly driven by multiple factors including the opening ratio, eccentricity, concrete strength grade, and reinforcement ratio. (4) Identification of critical thresholds and optimal eccentricity. Discussion of the numerical simulation and code verification results reveals a critical opening ratio threshold of 30% for beams with concentric openings and a suggested maximum opening ratio of 48%, as well as an optimal eccentricity of 8.0% for beams with eccentric openings. These findings provide quantitative design boundaries for mitigating cracking risks.

2. Model Establishment

When the tensile strain at the extreme tension fiber of a RC beam section attains the ultimate tensile strain of concrete (i.e., ε t b = εtu), the section reaches the critical state immediately preceding cracking. The corresponding bending moment at this state is defined as the cracking moment, Mcr [40]. The development of the theoretical prediction model for the cracking moment of RC beams with openings in this study is described as follows.

2.1. Plane Section Assumption and Material Constitutive Models

2.1.1. Plane Section Assumption

Prior to cracking in the tension zone under load, the strain distribution across the section of an ordinary RC beam conforms to the plane section assumption. This implies that the strain at any point within the section is proportional to its distance from the neutral axis, and the strains in the steel reinforcement and the surrounding concrete are identical [41]. This assumption is also applied to the section within the opening region of the RC beams with openings investigated in this study.

2.1.2. Material Constitutive Models

(1)
Compressive stress–strain constitutive model for concrete
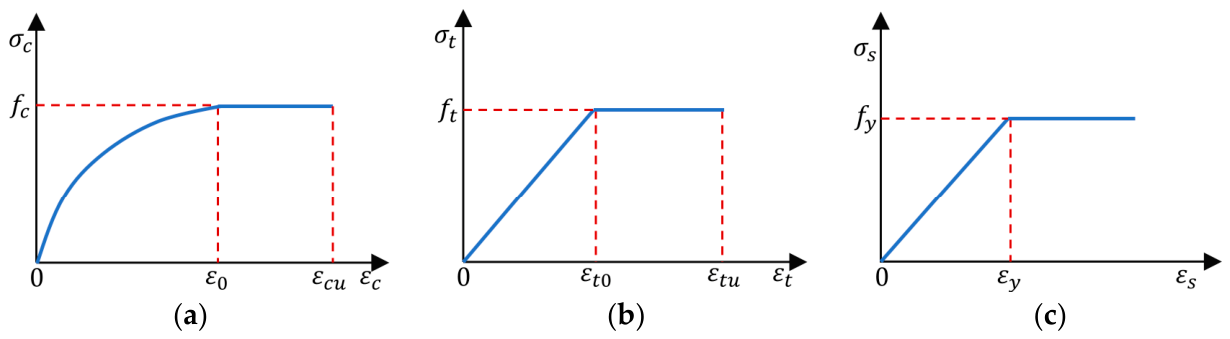
The constitutive relationship for concrete under compressive stress–strain was adopted in accordance with the Code for Design of Concrete Structures GB 50010-2010 [38]. The corresponding stress–strain curve is as shown in Figure 2a, and the constitutive relationship is given in Equation (1).
σ c = f c 1 1 ε c ε 0 n         ε c ε 0 σ c = f c ε 0 < ε c ε c u
where:
n = 2 1 60 f c u , k 50
ε 0 = 0.002 + 0.5 f c u , k 50 × 10 5
ε c u = 0.0033 f c u , k 50 × 10 5
where: σc is the concrete compressive stress at strain εc (MPa); fc is the axial compressive strength of concrete (MPa); ε0 is the strain peak stress, minimum 0.002; εcu is the ultimate compressive strain, capped at 0.0033; fcu,k is the characteristic cube compressive strength (MPa); n is the coefficient, capped at 2.0.
(2)
Tensile stress–strain constitutive model of concrete
The tensile stress–strain constitutive model of concrete is adopted according to the reference [42]. The corresponding stress–strain curve is as shown in Figure 2b, and the constitutive relationship is given in Equation (5).
σ t = E c ε t           0 ε t ε t 0 σ t = f t                 ε t 0 < ε t ε t u
where: σt is the tensile stress at tensile strain εt; ft is the concrete tensile strength; εt0 is the tensile strain at peak tensile stress; εtu is the ultimate tensile strain, typically taken as εtu = 2εt0.
(3)
Tensile stress–strain constitutive model of reinforcement
An ideal elastic-plastic model is adopted for steel reinforcement with a distinct yield plateau [43]. For flexural members of concrete, the deformation of tensile reinforcement beyond the yield plateau into the hardening stage is limited to a small range. Therefore, the hardening segment can be neglected in the tensile stress–strain constitutive model of steel reinforcement [44]. The corresponding stress–strain curve is as shown in Figure 2c, and the constitutive relationship is given in Equation (6).
σ s = E s ε s           ε s ε y σ s = f y                   ε s > ε y
where: σs is the tensile stress in steel at tensile strain εs; Es is the elastic modulus of steel reinforcement; εy is the yield strain, εy = fy/Es; fy is the yield stress.

2.2. Model Classification

The calculation of the cracking moment at the opening section of RC beams with openings is rather complex. The complexity mainly arises from the dual forms of the neutral axis at the opening section: a real axis located in the top or bottom chord outside the opening, or a virtual axis lying within the opening region. This mechanical behavior is dominated by key parameters, including opening ratio, eccentricity, concrete strength, and reinforcement ratio. Therefore, the theoretical prediction model for the cracking moment of beams with openings should be developed according to specific opening configurations.
Based on the neutral axis type (neutral axis lying within the opening or neutral axis lying outside the opening) and the tensile stress distribution pattern at the opening section, six theoretical prediction models (MK–1 to MK–6) are proposed and classified in this study:
  • MK-1: Neutral axis lying within the opening, tensile stress distribution in the tension zone is rectangular plus trapezoidal.
  • MK-2: Neutral axis lying within the opening, tensile stress distribution in the tension zone is rectangular.
  • MK-3: Neutral axis lying outside the opening (below openings), tension zone remains unweakened.
  • MK-4: Neutral axis lying outside the opening (above openings), tensile stress distribution in the tension zone is rectangular plus triangular.
  • MK-5: Neutral axis lying outside the opening (above openings), tensile stress distribution in the tension zone is rectangular plus trapezoidal plus triangular.
  • MK-6: Neutral axis lying outside the opening (above openings), tensile stress distribution in the tension zone is two rectangular distributions plus one triangular distribution.
Taking MK-1 as a typical case, this paper elaborates the modeling procedure for the cracking moment of RC beams with openings. The modeling derivations for the other five models (MK-2 to MK-6) follow the same framework and are presented in Appendix A.

2.3. Modeling Process for Theoretical Model MK-1

2.3.1. Computational Schematic of the Model

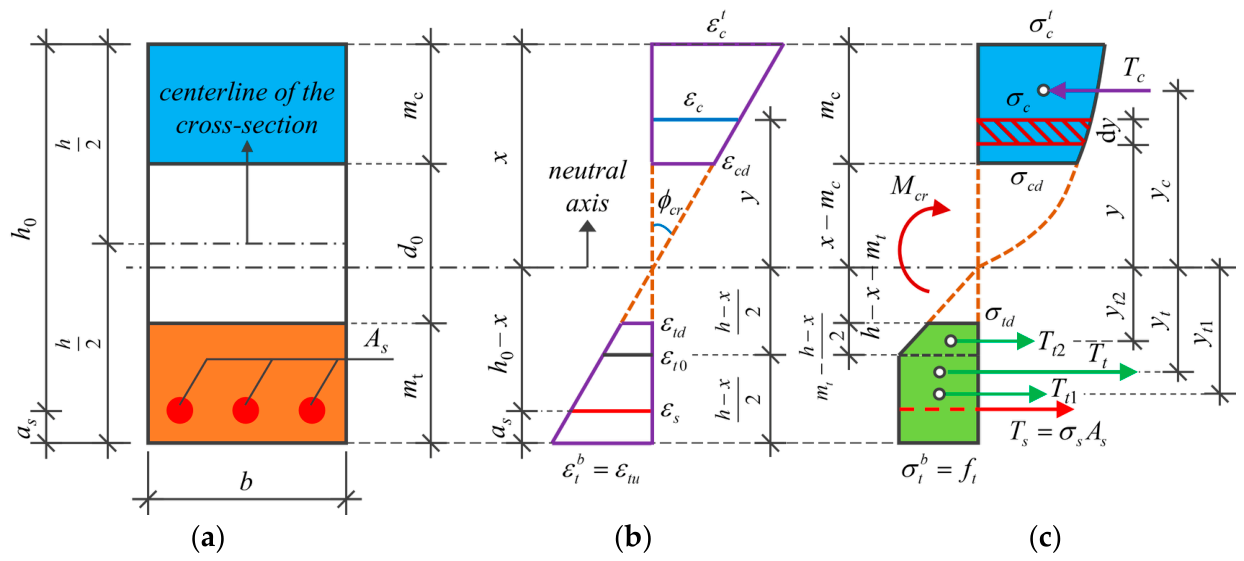
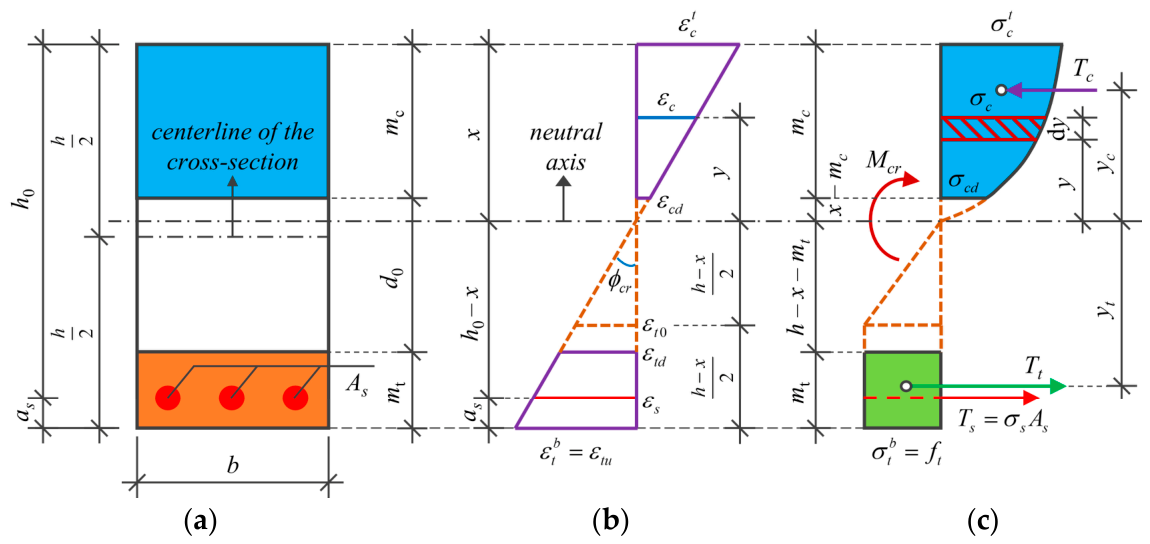
Under the condition of RC beams with openings exhibiting no eccentricity, upward eccentricity, or downward eccentricity, if the neutral axis is a virtual axis and the tensile stress in the tension zone follows a rectangular plus trapezoidal distribution, the schematic for calculating the cracking moment is as shown in Figure 3.

2.3.2. Internal Force and Centroid Computational Model

(1)
Compressive resultant force Tc and centroid position yc
As shown in Figure 3, for this opening pattern, the neutral axis is a virtual axis, and the entire lower portion of the compression zone is weakened. The compressive resultant force Tc and its centroid position yc can be calculated as follows:
T c = x m c x σ c b d y = x m c x f c 1 1 ε c ε 0 n b d y
y c = x m c x σ c b y d y T c = x m c x f c 1 1 ε c ε 0 n b y d y T c
where: mc is the upper chord height of opening, for openings without eccentricity: mc = (hd0)/2, for upwardly eccentric openings: mc = (hd0)/2 − ec, for downwardly eccentric openings: mc = (hd0)/2 + et, d0 is the opening diameter of the RC beam with openings, ec is the upward deviation distance of the opening’s centerline from the centroidal axis of the solid section, et is the downward deviation distance of the opening’s centerline from the centroidal axis of the solid section. σc is calculated using Equation (1) (εcε0); εc is determined by Equation (9) below:
ε c = ε t b y h x = ε t u y h x = 2 ε t 0 y h x
When the concrete strength grade is ≤C50, parameter n in Equations (7) and (8) is a constant integer of 2, as calculated by Equation (2). Substituting this value into Equations (7) and (8) yields the computational formulas for Tc and yc under concrete strength grades ≤ C50, as follows:
T c = 2 f c b m c ε t 0 ε 0 ( h x ) 2 x m c 2 ε t 0 ε 0 ( h x ) x 2 m c x + 1 3 m c 2
y c = 2 x 2 2 m c x + 2 3 m c 2 2 ε t 0 ε 0 h x ( x 3 3 2 m c x 2 + m c 2 x + 1 4 m c 3 ) 2 x m c 2 ε t 0 ε 0 ( h x ) x 2 m c x + 1 3 m c 2
(2)
Tensile force resultant Tt and centroid position yt
As shown in Figure 3, for this opening pattern, the neutral axis is virtual. The top of the elastic tension zone (triangular distribution region) is weakened, resulting in a tensile stress distribution consisting of a rectangle plus a trapezoid. The expressions for calculating the corresponding tensile force resultant Tt and its centroid position yt are as follows:
T t = T t 1 + T t 2 = f t b h x 3 4 h x m t h x 2
y t = T t 1 y t 1 + T t 2 y t 2 T t = h x 11 24 2 3 h x m t h x 3 3 4 h x m t h x 2
where: mt is the lower chord height of opening, for openings without eccentricity: mt = (hd0)/2, for upwardly eccentric openings: mt = (hd0)/2 + ec, for downwardly eccentric openings: mt = (hd0)/2 − et.
(3)
Resultant force of tensile reinforcement Ts
At the cracking of the RC beams with openings, the tensile reinforcement has not yielded and is in the linear elastic stage. At this stage, the stress in the tensile reinforcement is proportional to its strain (as shown in Figure 2c). Therefore, its tensile force Ts is calculated as follows:
T s = σ s A s = 2 E s ε t 0 A s h 0 x h x
where: σs is calculated using Equation (6) (εsεy), and εs is calculated as follows:
ε s = ε t u h 0 x h x = 2 ε t 0 h 0 x h x

2.3.3. Equilibrium Equations and Formula for Compression Zone Depth x

At the cracking of the RC beam with openings, the stress distribution on the cross-section is as shown in Figure 3c. The compression zone depth x can be determined by establishing an equilibrium equation based on the force equilibrium condition (∑FX = 0), as given below:
T s + T t T c = 0
When the concrete strength grade is ≤C50, substituting the expressions for Ts, Tt, and Tc into Equation (16) above yields the computational formula for the compression zone depth x of the beams with openings (MK-1) after simplification, as follows:
1 4 f t b x 3 + 2 E s ε t 0 A s + f t b 2 m t 3 4 h + 4 f c b m c ε t 0 ε 0 1 + ε t 0 ε 0 x 2 2 E s ε t 0 A s h 0 + h + f t b 4 h m t m t 2 3 4 h 2 + 2 f c b ε t 0 ε 0 2 h m c + m c 2 + 4 f c b ε t 0 2 ε 0 2 m c 2 x + 2 E s ε t 0 A s h 0 h + f t b 2 h 2 m t h m t 2 1 4 h 3 + 2 f c b ε t 0 ε 0 h m c 2 + 4 3 f c b ε t 0 2 ε 0 2 m c 3 = 0

2.3.4. Computational Formula for Cracking Moment Mcr

The cracking moment Mcr can be solved using the moment equation ∑M(F) = 0 based on the equilibrium condition of a general coplanar force system. Depending on the selected point of moment, the cracking moment for RC beams with openings may be calculated using any of the following three equations:
  • Taking moments about the neutral axis;
M c r = T c y c + T t y t + T s h 0 x
  • Taking moments about the centroid of the resultant tensile reinforcement forces;
M c r = T c y c + h 0 x + T t h 0 x y t
  • Taking moments about the point of action of the resultant compressive force.
M c r = T s y c + h 0 x + T t y t + y c

2.4. Model Selection Criterion and Computational Procedure

2.4.1. Model Selection Criterion

In calculating the cracking moment of RC beams with openings, the computational model may be preliminarily selected based on the opening ratio and eccentricity ratio for trial calculations, targeting a model approximating the opening configuration. The trial results are then substituted into the corresponding discriminant of the selected model to verify its validity. If the results satisfy the discriminant conditions, the model is deemed appropriate; otherwise, an alternative model must be adopted. Should the initially selected model fail to meet the discriminant criteria, the discriminant outcome should guide the selection of a compliant model for recalculation. This iterative process may continue until a model satisfying all discriminant conditions is identified, thereby ensuring the accuracy of the cracking moment calculation. The corresponding criteria of the theoretical prediction models are summarized in Table 1.

2.4.2. Computational Procedure

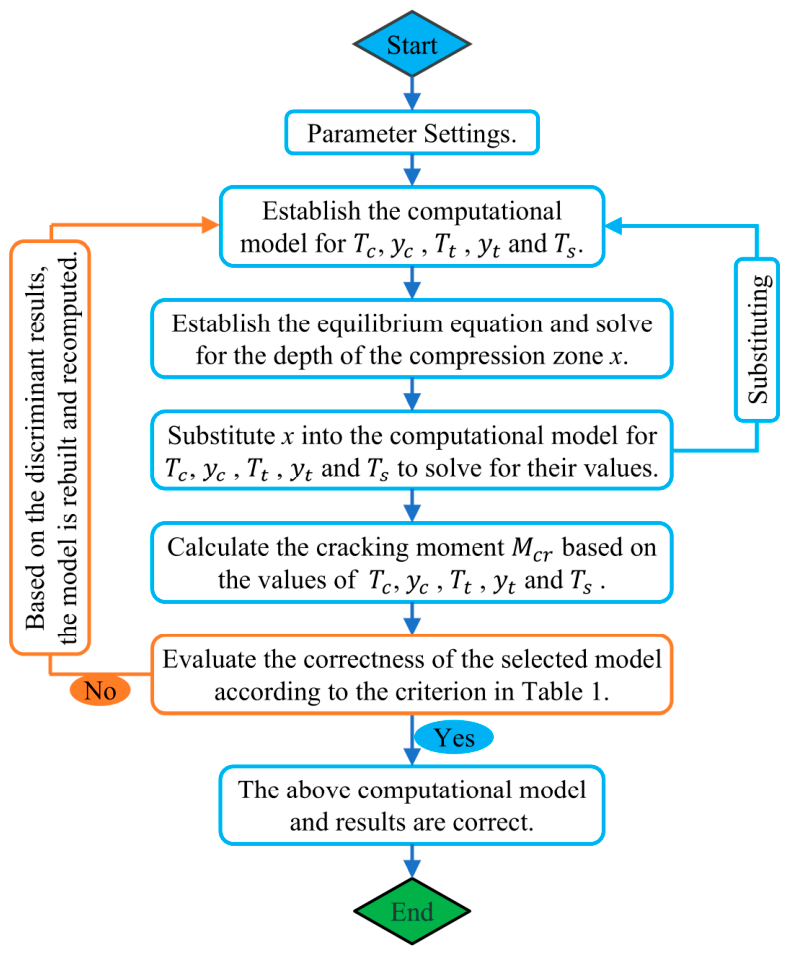
The cracking moment and related indicators for RC beams with openings can be determined by selecting an appropriate computational model based on the specific opening pattern. The computational procedure is as follows: (1) Based on the material parameters and opening parameters of the beam, preliminarily select a computational model that closely approximates the actual opening configuration; (2) substitute the relevant parameters into the formula for calculating the depth of the compression zone (x) within the selected model; (3) substitute the obtained x value into the corresponding validation criterion in Table 1 to assess the applicability of the selected model. If the validation fails, replace the computational model according to the result and recalculate until a valid model satisfying the criterion is selected; (4) substitute the validated x value into the expressions for internal forces and centroid position computation within the chosen model to compute the magnitude of internal forces and the location of their centroid; (5) substitute the aforementioned results into the computational formulas for the cracking moment and related indicators within the model to obtain the required cracking moment and other performance parameters. This procedure can be implemented through programming using mathematical modeling software, and its specific computational flow is as shown in Figure 4.

3. Results and Validation

3.1. Numerical Simulation Validation Results

3.1.1. Design of Validation Specimens

To validate the reliability of the theoretical model for the cracking moment of beams with openings, this study employed the finite element software ABAQUS 2023 to conduct numerical simulations on 3 solid beams, 27 beams with central openings, and 18 beams with eccentric openings. All specimens had a cross-section of 200 mm × 400 mm and a span of 3600 mm. The simulation results were compared with predictions from corresponding theoretical models. Detailed validation specimens are as shown in Table 2.

3.1.2. Material Properties

The reinforcement in the numerical simulations adopted the idealized elastoplastic model specified in this study [43]. Grade III steel was used for tensile reinforcement and distribution bars, with yield strength fyk = 400 N/mm2 and elastic modulus Es = 2 × 10⁵ N/mm2. Grade I steel was employed for stirrups, with fyk = 300 N/mm2 and Es = 2.1 × 10⁵ N/mm2. Concrete utilized the built-in Concrete Damaged Plasticity (CDP) model in ABAQUS. The C30, C40, and C50 concrete grades exhibited the following properties [38]:
  • Tensile strength ftk: 2.01 N/mm2, 2.39 N/mm2, and 2.64 N/mm2.
  • Compressive strength fck: 20.1 N/mm2, 26.8 N/mm2, and 32.5 N/mm2.
  • Elastic modulus Ec: 3 × 10⁴ N/mm2, 3.25 × 10⁴ N/mm2, and 3.45 × 10⁴ N/mm2.

3.1.3. CDP Model Parameters

(1)
Concrete stress, Inelastic strain, and Plastic damage factors
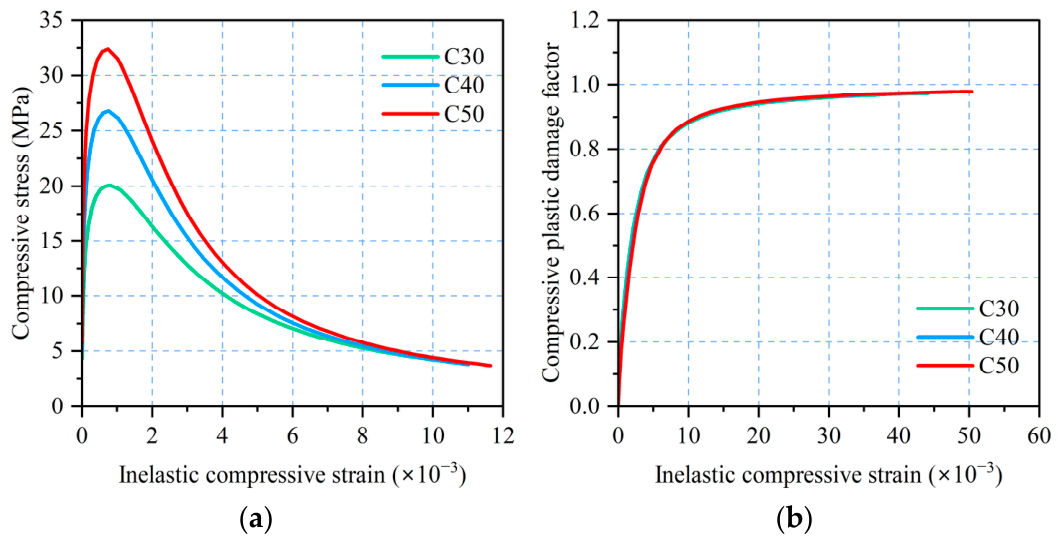
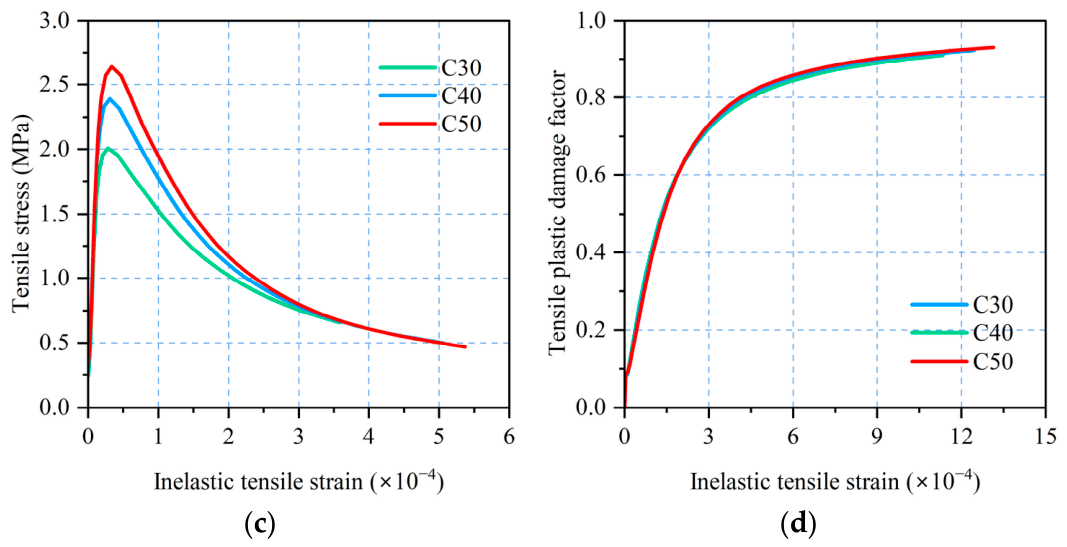
Input parameters for concrete stress and inelastic strain in the CDP model were calculated according to GB 50010-2010: Code for Design of Concrete Structures [38]. Plastic damage factors were determined using the computational method proposed by Guo et al. [45], with detailed procedures provided in the Appendix B. The relationship curves for CDP model parameters corresponding to concrete grades C30, C40, and C50, derived through these methods, are as shown in Figure 5.
(2)
Other parameters of the CDP model
The remaining parameters of the CDP model may be adopted in accordance with the specifications by Jin et al. [46], Guo et al. [45], and Ali et al. [47] as shown in Table 3.

3.1.4. Establishment of the Finite Element Model

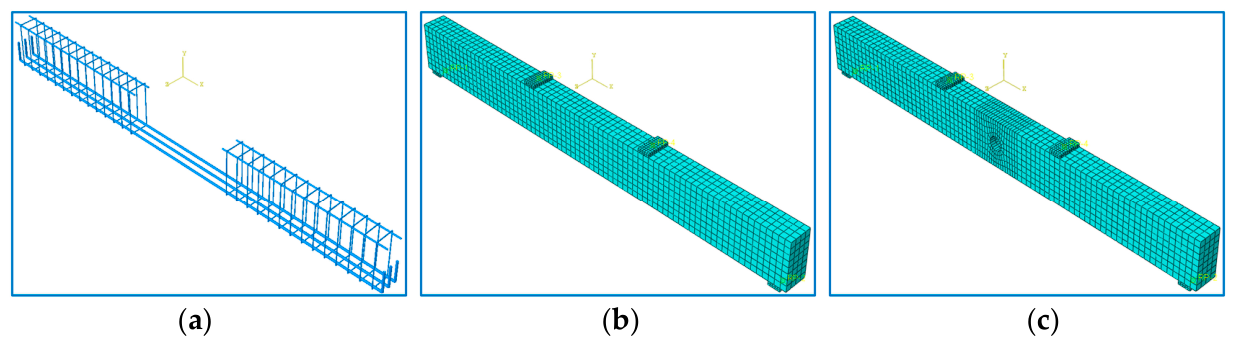
In the ABAQUS finite element model, concrete was modeled using 8-node linear brick elements (C3D8R), while reinforcement was simulated with 2-node truss elements (T3D2) [28]. The mesh size for the concrete beam was set to 50 mm but could be adjusted during computation based on precision requirements. The reinforcement cage mesh size adopted the software’s default automatic partitioning. The assembled reinforcement cage was embedded within the concrete using the embedded constraint method.
Numerical simulations employed third-point loading. To replicate realistic loading conditions, four steel bearing blocks (100 mm × 200 mm × 30 mm) were positioned at the supports and loading points. A tie constraint [28] was applied between the steel blocks and the concrete beam. Reference points (RP-1 and RP-2) were defined on the left and right support blocks, respectively, while RP-3 and RP-4 were assigned to the loading point blocks. Coupling constraints connected these reference points to their corresponding blocks.
The numerical simulation employed simply supported RC beams. A fixed hinge support was applied at the left end, constraining Degrees of Freedom (DOF) U1, U2, U3, UR1, and UR2 at Reference Point 1 (RP-1) while releasing UR3 (permitting rotation about the Z-axis). A movable roller support was implemented at the right end, constraining DOF U2, U3, UR1, and UR2 at Reference Point 2 (RP-2) while releasing U1 and UR3 (permitting translation along the X-axis and rotation about the Z-axis). A static, general analysis procedure was adopted. Vertical displacement loads were applied independently at Reference Point 3 (RP-3) and Reference Point 4 (RP-4). Each loading point was constrained in DOF U1, U2, U3, UR1, and UR2 but released in UR3 (enabling rotation about the Z-axis). The assembled reinforcement cage and the finite element models of the solid beams and beams with openings are as shown in Figure 6.

3.1.5. Result Analysis

(1)
Calculation and determination of cracking moment
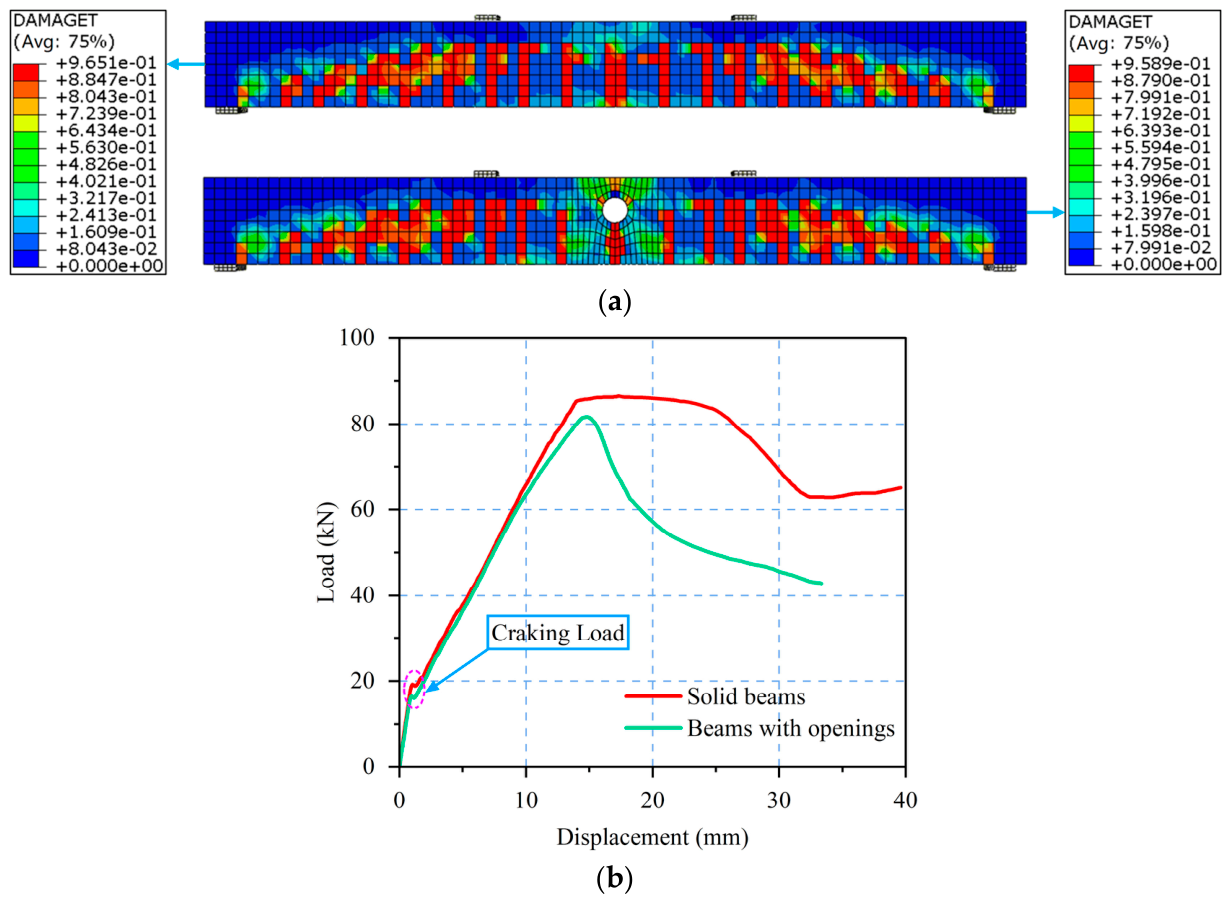
The tensile damage contours and corresponding load-displacement curves obtained from the finite element simulations of both solid RC beams and beams with openings are as shown in Figure 7. In the computational results, the load corresponding to the first turning point on the load-displacement curve is designated as the cracking load, as shown in Figure 7b. Once the cracking load of the simulated members is determined, the cracking moment can be calculated by multiplying this load by the corresponding lever arm.
(2)
Validation of key phenomena
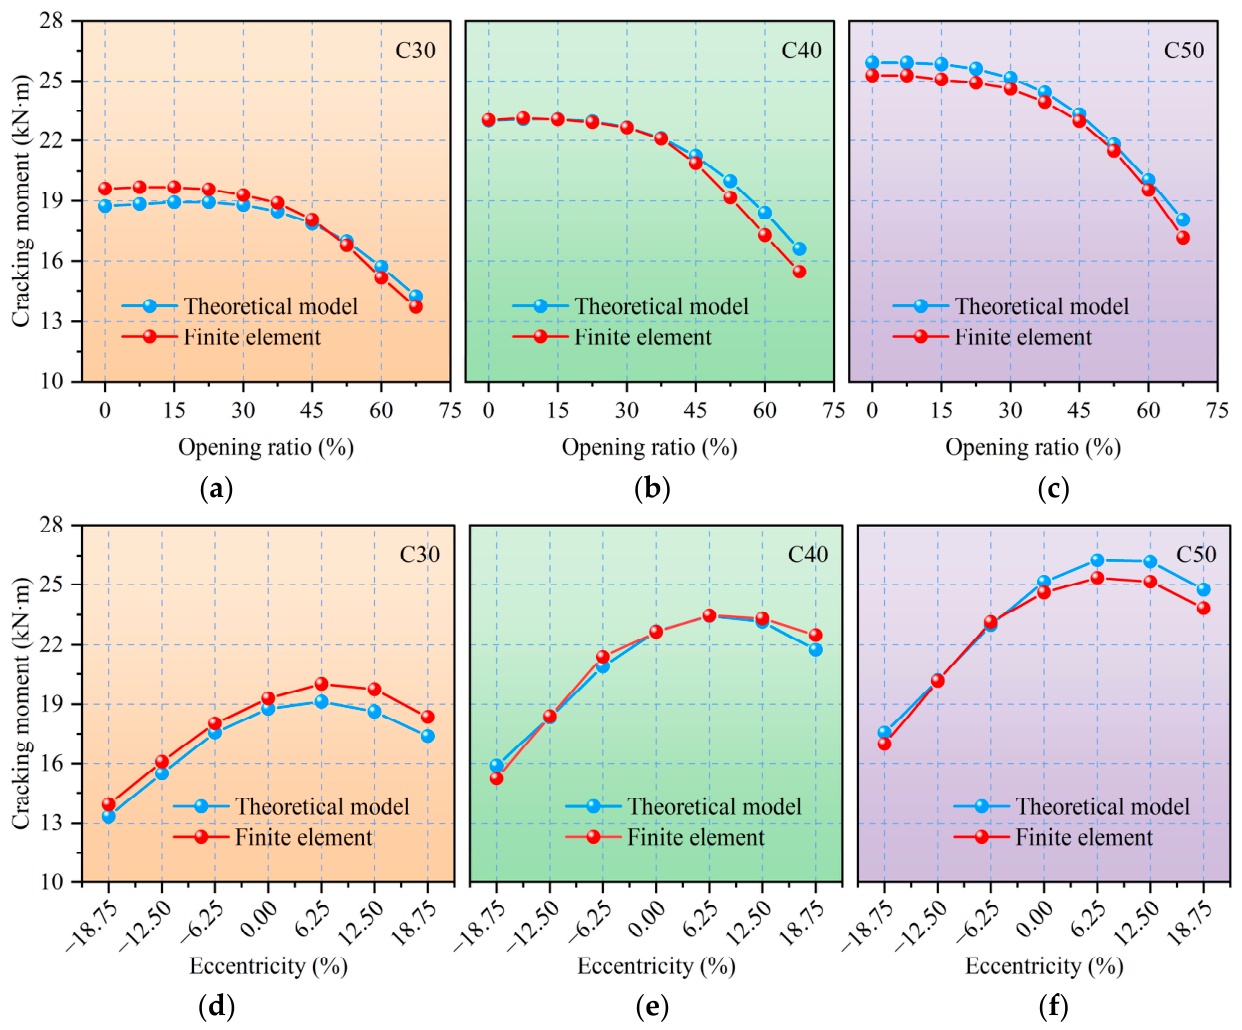
Comparative analyses between numerical simulation results and theoretical model predictions for the cracking moment of RC beams with central openings and beams with eccentric openings are as shown in Figure 8. These analyses illustrate the variation in cracking moment with respect to opening ratio and eccentricity ratio under different concrete strength grades (C30, C40, C50).
As observed in Figure 8a–c, the numerical simulations and theoretical models exhibit consistent trends in predicting the variation of cracking moment with opening ratio for beams with central openings. Specifically, when the opening ratio ≤ 30%, the openings exert minimal influence on the cracking moment. At a 30% opening ratio, the average reduction in cracking moment for beams with central openings compared to solid beams is 2.0% across concrete grades C30, C40, and C50, closely aligning with the theoretical prediction of 1.32%. Beyond 30% opening ratio, the influence progressively intensifies. Numerical results indicate average reductions of 4.36%, 8.8%, 15.38%, 23.47%, and 31.7% at opening ratios of 37.5%, 45%, 52.5%, 60%, and 67.5%, respectively. Corresponding theoretical predictions are 3.65%, 7.36%, 12.74%, 19.57%, and 27.39%.
Figure 8d–f demonstrates similar consistency for beams with eccentric openings. When openings shift downward from the central position (0% eccentricity), the cracking moment gradually decreases, with the reduction stabilizing as eccentricity increases. At downward eccentricities of −6.25%, −12.5%, and −18.75%, numerical simulations show average reductions of 6.01%, 17.79%, and 30.5% relative to the central position across C30–C50 concrete. Theoretical predictions are 7.67%, 18.78%, and 29.68%. Conversely, upward eccentricity initially increases the cracking moment to a peak before gradual reduction. At upward eccentricities of 6.25%, 12.5%, and 18.75%, numerical results yield average variation rates of +3.45%, +2.52%, and −2.9%, while theoretical models predict +3.2%, +1.82%, and −4.39%.
(3)
Prediction accuracy analysis
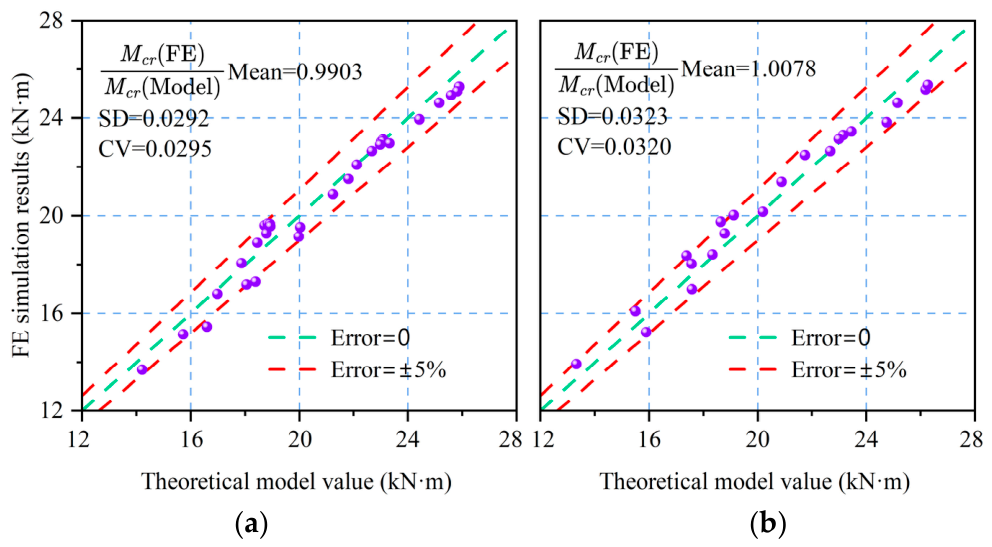
To evaluate the agreement and reliability between numerical simulations and theoretical predictions for cracking moments of beams with central/eccentric openings, comparative analyses are as shown in Figure 9.
As quantitatively evaluated in Figure 9, the consistency between the numerical simulation results and theoretical model predictions for the cracking moment of beams with openings is demonstrated. For beams with central openings (Figure 9a): 93.33% of the data points fall within the ±5% error band, while the errors of the remaining data points only marginally exceed this range; the mean value (FE/theoretical) of the ratio is 0.9925, with a standard deviation (SD) of 0.0311 and a coefficient of variation (CV) of 0.0313 (< 0.05), collectively indicating a high degree of agreement. Similarly, high consistency is observed for beams with eccentric openings (Figure 9b): 90.48% of the data points are within the ±5% error band, with errors of the remaining points also slightly exceeding this range; the mean value of the ratio is 1.009, accompanied by a SD of 0.0329 and a CV of 0.0327 (<0.05). These statistical metrics collectively demonstrate excellent agreement and low dispersion between the numerical simulation results and the proposed theoretical model predictions for predicting the cracking moment of both centrally and eccentrically opened beams, thereby validating the high reliability and satisfactory predictive capability of the theoretical model.

3.2. Comparison and Verification of Chinese and American Design Codes

3.2.1. Design of Computational Cases

To further validate the applicability and reliability of the theoretical model for predicting the cracking moment of beams with openings under diverse parametric conditions, the validation scope was expanded to 279 components building upon the numerically simulated specimens. The cracking moments predicted by the theoretical model were comparatively analyzed against values calculated using formulas from the Chinese Code for Design of Concrete Structures (GB 50010-2010) [38] and the American Concrete Institute Building Code (ACI 318-19) [39]. Key computational cases are summarized in Table 4.

3.2.2. Cracking Moment Computational Formulas in Chinese and American Codes

(1)
Chinese code: GB 50010-2010
The computational formula for the cracking moment of RC beams in the Chinese Code for Design of Concrete Structures (GB 50010-2010) [38] is given as follows:
M c r = γ f t k W 0
γ = 0.7 + 120 h γ m
W 0 = I 0 y 0
where: γ is the plastic influence coefficient of the section modulus for concrete members, when the section height h is less than 400 mm, h is taken as 400 mm; when h exceeds 1600 mm, h is taken as 1600 mm. γm is the basic value of the plastic influence coefficient of the section modulus for concrete members; for solid rectangular beams, γm is taken as 1.55; for beams with openings, γm is approximately taken as 1.6–0.24r1/r, where r1 is the diameter of the opening and r is the actual height of the section. ftk is the standard value of concrete tensile strength. W0 is the elastic modulus of the transformed section at the tensile edge. I0 is the moment of inertia of the transformed section. y0 is the distance from the centroid of the transformed section to the tensile edge.
(2)
American code: ACI 318-19
The computational formula for the cracking moment of RC beams in the American Concrete Institute Building Code (ACI 318-19) [39] is given as follows:
M c r = f r I g y t
f r = 0.62 λ f c
where: Ig is the moment of inertia of the gross concrete section about its centroidal axis, disregarding reinforcement. yt is the distance from the centroidal axis of the gross section (disregarding reinforcement) to the tension face. fr is the modulus of rupture of concrete. λ is a modification factor reflecting the reduction in mechanical properties of lightweight concrete relative to normal-weight concrete of the same compressive strength. For normal-weight concrete, λ shall be taken as 1.0 is the specified compressive strength of concrete. Its value corresponds to the standard value of concrete cube compressive strength fcu,k in the Chinese code GB 50010-2010 [38] and the conversion can be performed using the formula provided in Ref. [48], and the conversion formula is given by Equation (26).
f c u , k = 1.25 × 1 1.645 δ f c u 1 1.28 δ f c u f c
where: δ f c u is approximately taken as 0.12.

3.2.3. Comparative Analysis of Theoretical Model vs. Chinese and American Codes

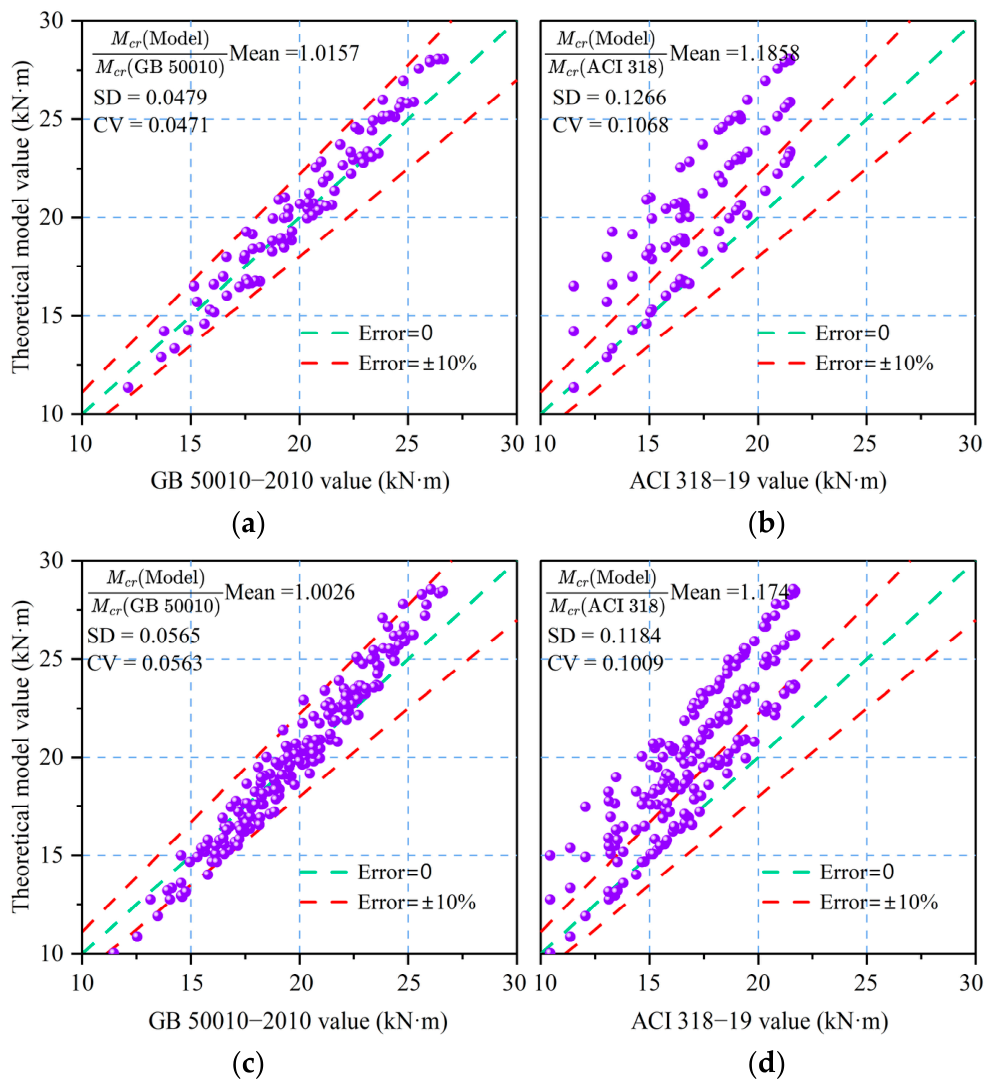
Comparative results between the cracking moments calculated by the theoretical model and code-based formulas are as shown in Figure 10.
For beams with central openings (Figure 10a,b), all data points of the model-to-GB50010-2010 ratio fall within the ±10% error band. The mean value (model/code) is 1.0157, with a standard deviation (SD) of 0.0479 and a coefficient of variation (CV) of 0.0471, indicating high consistency and minimal dispersion. In contrast, only 33.33% of the model-to-ACI 318-19 ratios lie within the ±10% error band, while 66.67% significantly exceed this range. Here, the mean value is 1.1858, with a SD of 0.1266 and a CV of 0.1068, reflecting poor agreement and relatively high dispersion.
For beams with eccentric openings (Figure 10c,d), 92.59% of the model-to-GB50010-2010 ratios reside within the ±10% error band, with 7.41% marginally exceeding yet remaining close to the boundary. The mean value (1.0026) approximates the ideal value of 1.0, while the low SD (0.0565) and CV (0.0563) reaffirm strong agreement and limited dispersion. Conversely, only 31.22% of the model-to-ACI 318-19 ratios fall within the ±10% error band, with 68.78% substantially exceeding it. The higher mean value (1.174), SD (0.1184), and CV (0.1009) demonstrate significant discrepancies and greater scatter.
In summary, for both centrally and eccentrically opened beams, the theoretical model exhibits high consistency and low dispersion with the GB 50010-2010 code calculations. However, systematic deviations (model values consistently approximately 17–18% higher) and significantly larger dispersion are observed when compared to the ACI 318-19 code predictions.

4. Discussion

4.1. Dynamic Switching Mechanism of Theoretical Models

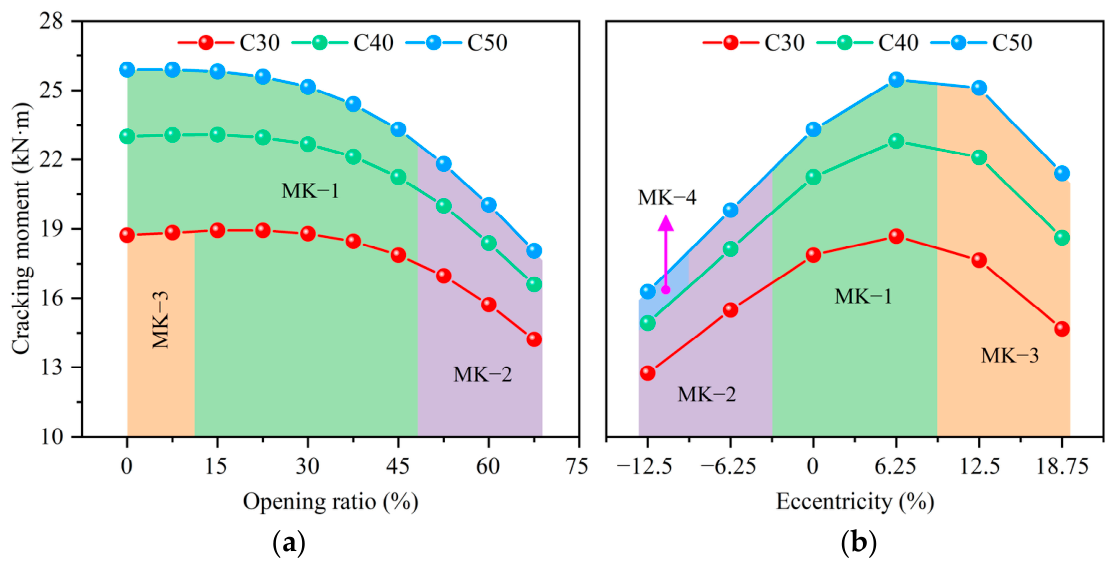
As validated by numerical simulations and comparative analyses with Chinese and American codes, the theoretical model for predicting the cracking moment of beams with openings is not static. As shown in Figure 11, the selection of models exhibits a dynamic switching pattern dependent on opening parameters (opening ratio, eccentricity ratio) and material properties (concrete strength grade, reinforcement ratio).
Figure 11a illustrates the model switching pattern for beams with central openings under varying concrete strength grades and opening ratios at a reinforcement ratio ρ = 0.9543%. For C30 concrete, the model is segmented into three phases: model MK-3 applies at a hole ratio of 7.5%; model MK-1 governs for opening ratios ranging from 15% to 45%; and model MK-2 is applicable for opening ratios between 52.5% and 67.5%. When the concrete strength grade increases to C40 or C50, the computational model simplifies to two phases: model MK-1 covers opening ratios from 7.5% to 45%, while model MK-2 applies to opening ratios between 52.5% and 67.5%. Figure 11b presents the model switching behavior for beams with openings with eccentricity at ρ = 0.9543% and a fixed opening ratio of 45%. For C30 and C40 concrete, the model divides into three segments: model MK-2 governs at eccentricities of −12.5% to −6.25%; model MK-1 applies for eccentricities between 0% and 6.25%; and model MK-3 is valid at eccentricities of 12.5% to 18.75%. In contrast, for C50 concrete, the model exhibits finer segmentation into four phases: model MK-4 applies at −12.5% eccentricity; model MK-2 governs at −6.25% eccentricity; model MK-1 covers eccentricities from 0% to 6.25%; and model MK-3 applies at eccentricities of 12.5% to 18.75%.
The dynamic switching characteristics of these models primarily stem from the sensitivity of the mechanical behavior of beams with openings to the coupling effects of multiple parameters (opening ratio, eccentricity, concrete strength, and reinforcement ratio). The opening ratio and eccentricity directly influence stress distribution around openings and the degree of cross-sectional weakening. Concurrently, the concrete strength grade determines material crack resistance, while the reinforcement ratio affects the overall flexural capacity and crack control performance of the section. Therefore, variations in the combinations of these parameters will alter the potential cracking modes and mechanical mechanisms of beams, resulting in dynamic switching of theoretical models on the same correlation curve, as well as discrepancies among different correlation curves.
In summary, this study reveals the dynamic switching mechanism of theoretical prediction models for the cracking moment in beams with openings, highlighting its co-dependence on multiple factors including opening ratio, eccentricity, concrete strength grade, and reinforcement ratio. This finding indicates that employing a single fixed model to predict the cracking moment of beams with openings under different parameter combinations in engineering practice may lead to compromised accuracy or biased results. Therefore, to ensure rational and precise cracking moment calculations, it is essential to accurately identify and select the corresponding dynamic theoretical prediction model based on specific material properties (concrete strength, reinforcement ratio) and opening geometric parameters (opening ratio, eccentricity). This approach provides a critical theoretical basis for the refined analysis and design of beams with openings.

4.2. Analysis of Threshold Opening Ratio and Optimal Eccentricity

4.2.1. Threshold Opening Ratio

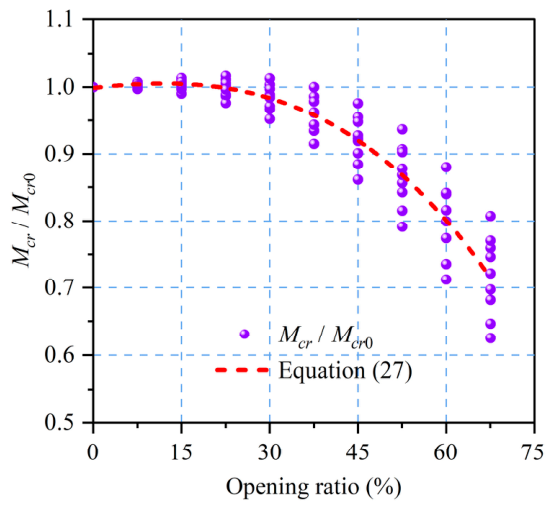
To investigate the critical threshold of the opening ratio for cracking moments in beams with central openings, the theoretical model predictions of cracking moments shown in Figure 10a were normalized (i.e., the cracking moment at each opening ratio divided by the cracking moment of the corresponding solid beam). The normalized results were fitted using the least squares method, with the fitted curve presented in Figure 12. The fitting equation is given by Equation (27).
The fitting equation for the cracking moment of beams with central openings is given below:
M c r M c r 0 = 0.7164 ( d 0 h ) 3 0.2882 ( d 0 h ) 2 + 0.1007 ( d 0 h ) + 0.9985 R 2 = 0.9012
where: Mcr is the cracking moment of the beam with openings (kN·m); Mcr0 is the cracking moment of the solid beam (kN·m).
Based on the computational results of fitting Equation (27): When Mcr/Mcr0 = 1 (i.e., no reduction in cracking moment), the corresponding opening ratio d0/h = 21.26%; When Mcr/Mcr0 = 0.9 (i.e., 10% reduction in cracking moment), the corresponding opening ratio d0/h = 48.18%; at an opening ratio d0/h = 30%, Mcr/Mcr0 = 0.9834, corresponding to a 1.66% reduction in cracking moment. Therefore, based on the above analysis, the critical threshold opening ratio for beams with central openings is determined to be 30%. At this opening ratio, the model-predicted reduction in cracking moment can be controlled at approximately 2%. Meanwhile, the maximum opening ratio is recommended not to exceed 48%, at which the model-predicted cracking moment reduction is approximately 10%.
Further analysis of the data in Figure 12 reveals the following. When Mcr/Mcr0 = 0.9, the opening ratios corresponding to beams with central opening are 52.86%, 47.96%, and 44.53% for concrete strength grades C30, C40, and C50, respectively. For reinforcement ratios of ρ = 0.4241%, ρ = 0.9543%, and ρ = 1.4255%, the corresponding opening ratios are 43.06%, 48.92%, and 53.38%, respectively. When the opening ratio is fixed at d0/h = 30%, the Mcr/Mcr ratios are 1.0009, 0.9818, and 0.9675 for concrete strength grades C30, C40, and C50, respectively, and 0.9673, 0.9857, and 0.9972 for reinforcement ratios of ρ = 0.4241%, ρ = 0.9543%, and ρ = 1.4255%, respectively. Based on the analysis of these typical and commonly used parameter scenarios, the maximum opening ratio of 48% recommended in this study varies within a band of ±5.5%, and the overall fluctuation of Mcr/Mcr0 corresponding to the recommended opening threshold of 30% is approximately ±0.0175 (±1.75%). Overall, the variations of both indicators remain limited under conventional engineering design parameters, confirming that the proposed maximum opening limit of 48% and the opening control threshold of 30% possess satisfactory stability.

4.2.2. Optimal Eccentricity

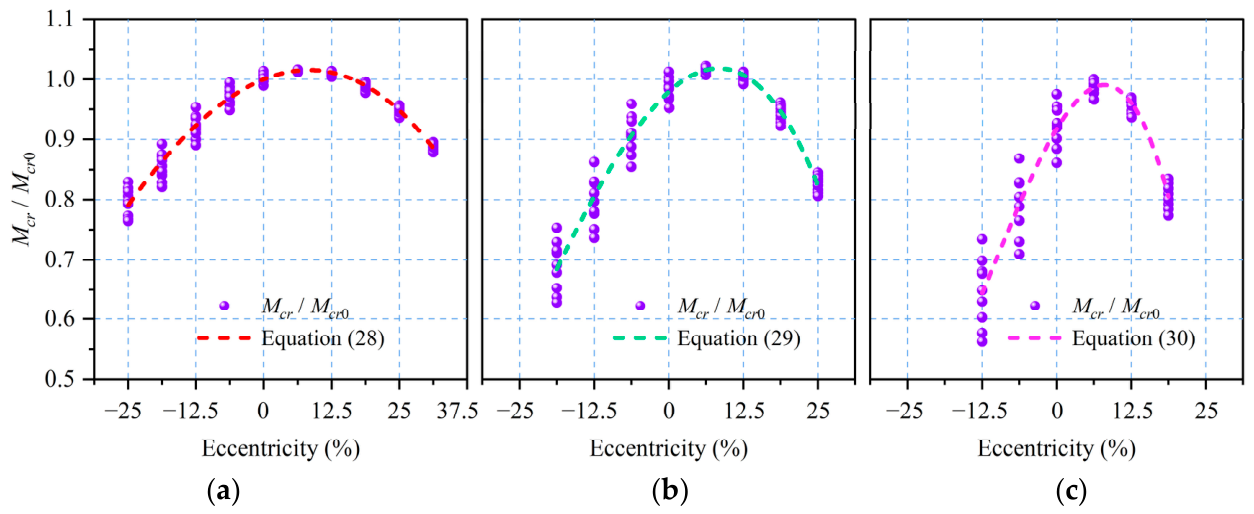
To determine the optimal eccentricity position for beams with eccentric openings, the cracking moments at different opening ratios (15%, 30%, and 45%) in Figure 10c were normalized (i.e., the cracking moment at each eccentricity divided by the cracking moment of the corresponding solid beam). The normalized results were fitted using the least squares method, with fitted curves shown in Figure 13a–c. The fitting equations are given by Equations (28)–(30).
  • For an opening ratio of 15%, the fitting equation for the cracking moment of beams with eccentric openings is:
M c r M c r 0 = 0.7799 ( e h ) 3 2.0873 ( e h ) 2 + 0.3632 ( e h ) + 1 R 2 = 0.9618
  • For an opening ratio of 30%, the fitting equation for the cracking moment of beams with eccentric openings is:
M c r M c r 0 = 5.5996 ( e h ) 3 4.6544 ( e h ) 2 + 0.8944 ( e h ) + 0.9791 R 2 = 0.9509
  • For an opening ratio of 45%, the fitting equation for the cracking moment of beams with eccentric openings is:
M c r M c r 0 = 24.655 ( e h ) 3 7.3973 ( e h ) 2 + 1.6517 ( e h ) + 0.9181 R 2 = 0.9222
where: e is the distance from the opening centerline to the solid section centroid (positive upward, negative downward).
Equations (28)–(30) are all cubic functions where eccentricity (e/h) serves as the independent variable and the ratio of cracking moments (Mcr/Mcr0) as the dependent variable. By determining the maxima of these fitting functions, the optimal eccentricities corresponding to opening ratios of 15%, 30%, and 45% were calculated as 8.3%, 8.4%, and 8.0%, respectively. The results demonstrate remarkable consistency in optimal eccentricity across different opening ratios, with a mean value of 8.2%. The maximum absolute deviation from the mean is 0.23%, and the maximum relative deviation is less than 2.8%. Given this high degree of consistency, the optimal eccentricity for beams with eccentric openings can be uniformly adopted as 8.0% to simplify practical engineering applications.
Further analysis of the data in Figure 13 reveals that, for concrete strength grades C30, C40, and C50, the optimal eccentricities for beams with eccentric openings are 6.3%, 8.6%, and 10.0% at an opening ratio of d0/h = 15%; 6.5%, 8.5%, and 9.7% at d0/h = 30%; and 6.6%, 8.1%, and 9.0% at d0/h = 45%, respectively. For reinforcement ratios of ρ = 0.4241%, ρ = 0.9543%, and ρ = 1.4255%, the optimal eccentricities for beams with eccentric openings are 9.6%, 8.2%, and 7.1% at d0/h = 15%; 9.4%, 8.2%, and 7.1% at d0/h = 30%; and 9.0%, 7.8%, and 6.9% at d0/h = 45%, respectively. Based on the analysis of these typical and commonly used parameter scenarios, the optimal eccentricity of 8.0% recommended in this study fluctuates within a range of approximately ±2.0%, exhibiting low parametric sensitivity, which further validates the reliability of the proposed 8.0% optimal eccentricity.

4.3. Discussion on Sources of Discrepancies Between Chinese and American Codes

The discrepancies between the theoretical model developed in this study and the computational results based on the Chinese and American codes primarily stem from differences in their theoretical foundations:
(1)
For the Chinese code GB 50010-2010 [38], its cracking moment computational formulae (Equations (21)–(23)), although based on elastic theory, adopt the concept of the transformed section and incorporate the plastic section modulus influence coefficient λ. This modeling approach bears similarity to the theoretical model proposed herein (established based on the plane section assumption, deformation compatibility, internal force equilibrium, and considering the nonlinear stress distribution in the compression zone and the elastoplastic stress distribution in the tension zone). Consequently, the cracking moments calculated according to this code generally exhibit a high degree of agreement and relatively minor errors compared to the predictions of the present theoretical model.
(2)
For the American code ACI 318-19 [39], its cracking moment computational formulae (Equations (24) and (25)) are solely based on elastic theory and do not account for the influence of reinforcement or the plastic resistance of the section, resulting in a relatively conservative design approach. Therefore, the cracking moments calculated according to this code generally exhibit a lower degree of agreement and larger errors relative to the predictions of the present theoretical model. This deviation becomes particularly significant under high reinforcement ratios. This observed difference further validates the reliability and predictive accuracy of the theoretical model proposed herein.

4.4. Applicability Verification of the Plane Section Assumption

The theoretical prediction model for the cracking moment of beams with openings established in this study is founded upon the plane section assumption. The applicability of this assumption for modeling the cracking moment of RC beams with openings is justified as follows:
(1)
Whether for solid beams or beams with openings, the calculation of cracking moment falls within the realm of small-deformation mechanics and must satisfy the conditions of internal force equilibrium and deformation compatibility.
(2)
Jin et al. [28], through experimental investigations (involving 4 solid beams and 6 beams with openings), confirmed that the distribution of concrete strain along the section height, both for sections with and without openings, conforms to the plane section assumption.
(3)
Comparisons between the predicted values from the present theoretical model and numerical simulation results (for central openings: Mean = 0.9903, CV = 0.0295; for eccentric openings: Mean = 1.0078, CV = 0.032), as well as comparisons with calculation results based on the GB 50010-2010 code (for beams with central openings: Mean = 1.0157, CV = 0.0471; for beams with eccentric openings: Mean = 1.0026, CV = 0.0563), consistently demonstrate the high reliability of the model.
In summary, supported by the theoretical premise and experimental verification of the plane section assumption, the established theoretical prediction model for the cracking moment of beams with openings is rational and feasible.

4.5. Advantages and Universality of the Proposed Theoretical Model

This study establishes, for the first time, a comprehensive theoretical prediction model system for the cracking moment of RC beams with openings. Its advantages are manifested in the following aspects:
(1)
The model system covers cracking moment predictions for six different combinations of opening parameters.
(2)
The model can predict the cracking moment of both RC solid beams (achieved by replacing the upper chord height of the opening mc with the compression zone depth x, and the lower chord height mt with hx in the formulae of model MK-1) and beams with openings with high computational accuracy. Validation results show good agreement with both numerical simulations and code formula calculations, providing a reliable theoretical basis and technical support for similar engineering applications.
(3)
The model is applicable for predicting the cracking moment of RC beams under any combination of material parameters (concrete strength grade, reinforcement ratio) and opening parameters (opening ratio and eccentricity ratio).

4.6. Limitations of the Present Study

This study establishes a theoretical predictive system for the cracking moment of RC beams with circular openings, enabling high-precision and efficient solutions. However, the research still presents the following limitations:
(1)
The formulae for calculating the resultant force Tc in the compression zone, the centroid position yc, and the compression zone depth x within the present theoretical model are derived based on concrete strength grades ≤ C50. When the concrete strength grade exceeds C50, the parameter n in the compressive stress expression σc (Equation (1)) is no longer a fixed integer of 2 but varies dynamically with increasing concrete strength. Consequently, the original analytical integration formulae (e.g., Equations (10), (11) and (17)) become inapplicable. Therefore, for beams with openings and concrete strength grades above C50, the solution can be obtained by referring to the computational flowchart presented in Figure 4 of this paper and utilizing mathematical software programming.
(2)
In practical engineering, constrained by on-site opening techniques, RC beams predominantly employ circular openings; irregularly shaped openings are rarely used. Therefore, the theoretical model developed herein is specifically derived and established for RC beams with circular openings.
(3)
After beam perforation, stress concentration effects inevitably occur around the opening edges. Although cracking moment analysis belongs to the domain of small-deformation mechanics, existing theoretical frameworks currently lack the capability to quantitatively characterize the influence of stress concentration on the cracking moment. This issue warrants further in-depth investigation in subsequent research.
(4)
Currently, there is a lack of publicly available, matched, and modern dedicated experimental data, and the existing experimental data reported in the literature do not meet the requirements for quantitative analysis. Meanwhile, constrained by limitations in funding, project timelines, and experimental conditions, original physical experiments could not be conducted at this stage. In future work, dedicated experimental investigations will be carried out, and model calibration and optimization will be performed using measured data from a sufficient number of specimens. The experimental validation will be further refined in subsequent publications.
(5)
The present model should be applied only to initial cracking under monotonic static loading. It is not directly applicable to cyclic loading, seismic actions, fatigue loading, creep, shrinkage, or other time-dependent service conditions without additional damage or time-dependent constitutive modules.
(6)
The proposed sectional-equilibrium framework has conceptual potential for extension, but the formulas developed in this paper cannot be directly applied to multiple openings, irregular openings, FRP-strengthened beams, or steel-plate-strengthened beams. Therefore, these complex cases require separate equilibrium equations, modified switching criteria, and independent experimental or numerical validation.
(7)
In this study, the maximum opening ratio of 48% and the optimal eccentricity of approximately 8% are theoretical reference values within the investigated parameter range, rather than universal design limits applicable to all beams with openings. Moreover, these parameter thresholds can only be used for preliminary assessments aimed at serviceability performance and require further calibration and refinement based on systematic experimental data.

5. Conclusions

This study firstly establishes a systematic theoretical prediction model and a dynamic selection criterion for the cracking moment of RC beams with openings, providing a reliable theoretical basis and practical tool for accurate prediction of the cracking moment of such members. The reliability of the proposed model is validated through ABAQUS numerical simulation and comparative analysis with Chinese and American design codes (GB 50010-2010 [38] and ACI 318-19 [39]). The main conclusions are summarized as follows:
(1)
Reliability validation of the theoretical model. The predicted cracking moments from the proposed model agree well with ABAQUS simulation results with low dispersion. For beams with central openings, the mean value is 0.9903 and the coefficient of variation (CV) is 0.0295; for beams with eccentric openings, the mean value is 1.0078 and CV is 0.032. Satisfactory consistency is also observed between model predictions and GB 50010-2010 calculations (central opening: Mean = 1.0157, CV = 0.0471; eccentric opening: Mean = 1.0026, CV = 0.0563). By contrast, relatively lower agreement and larger dispersion are found compared with ACI 318-19 predictions (central opening: Mean = 1.1858, CV = 0.1068; eccentric opening: Mean = 1.1740, CV = 0.1009), which is mainly attributed to the more conservative design philosophy adopted in the cracking moment calculation of ACI 318-19.
(2)
Dynamic switching mechanism of theoretical models. For both central and eccentric beams with openings, multiple theoretical models may be applicable to the cracking moment prediction on the same relational curve, and the applicable models vary among different curves. Model selection is comprehensively affected by opening ratio, opening eccentricity, concrete strength grade, and reinforcement ratio, presenting an obvious dynamic switching characteristic. In practical engineering, appropriate theoretical models should be selected according to actual material properties and opening parameters to ensure the accuracy and rationality of cracking moment calculation.
(3)
Threshold of opening ratio and optimal eccentricity. For beams with central openings, the critical opening ratio threshold is determined as 30% (corresponding to approximately 2% reduction in cracking moment), and the maximum recommended opening ratio is 48% (corresponding to approximately 10% reduction in cracking moment). For beams with eccentric openings, the optimal eccentricity can be uniformly taken as 8.0% under various opening ratios. The determined threshold parameters can provide direct reference for the structural design of RC beams with openings.

Author Contributions

Conceptualization, Z.S. and W.Z.; Investigation, Z.S. and W.Z.; Methodology, Z.S.; Writing—original draft, Z.S.; Writing—review and editing, W.Z.; Funding acquisition, W.Z. All authors have read and agreed to the published version of the manuscript.

Funding

This research was funded by the National Natural Science Foundation of China (Grant No.: U23A2044).

Data Availability Statement

The original contributions presented in the study are included in the article; further inquiries can be directed to the corresponding author.

Conflicts of Interest

The authors declare no conflicts of interest.

Appendix A. Modeling Process of Other Theoretical Prediction Models for Beams with Openings (MK-2–MK-6)

Appendix A.1. Neutral Axis Lying Within the Opening, Tensile Stress Distribution in the Tension Zone Is Rectangular Plus Trapezoidal (MK-2)

Appendix A.1.1. Computational Schematic of the Model

When a RC beam contains a large opening that is either centrally located or has a small upward eccentricity, or the opening has a large downward eccentricity, the neutral axis of the cross-section may be imaginary, and the tensile stress distribution in the tensile zone becomes rectangular. The model computational schematic for calculating the cracking moment in this case is as shown in Figure A1.
Figure A1. Computational schematic of the model MK-2: (a) cross-section; (b) strain distribution; (c) stress distribution.
Buildings 16 02833 g0a1

Appendix A.1.2. Internal Force and Centroid Computational Model

(1)
Compressive resultant force Tc and centroid position yc
As shown in Figure A1, the stress distribution in the compression zone is identical to that in Figure 3. Thus, the resultant force Tc is calculated by Equation (7) or Equation (10), the centroid position yc by Equation (8) or Equation (11).
(2)
Tensile force resultant Tt and centroid position yt
T t = f t b m t
y t = h x m t 2
(3)
Resultant force of tensile reinforcement Ts
The resultant force of tensile reinforcement Ts may be calculated using Equation (14) in Model MK-1.

Appendix A.1.3. Equation for the Compression Zone Depth x

When the concrete strength grade is ≤C50, substituting the expressions for Ts, Tt, and Tc into Equation (16) yields the computational formula for the compression zone depth x of the beams with openings (MK-2) after simplification, as follows:
2 E s ε t 0 A s + f t b m t + 4 f c b m c ε t 0 ε 0 1 + ε t 0 ε 0 x 2 2 E s ε t 0 A s h 0 + h + 2 f t b h m t + 4 f c b h m c ε t 0 ε 0 + 2 f c b m c 2 ε t 0 ε 0 1 + 2 ε t 0 ε 0 x + 2 E s ε t 0 A s h 0 h + f t b h 2 m t + 2 f c b h m c 2 ε t 0 ε 0 + 4 3 f c b m c 3 ε t 0 2 ε 0 2 = 0

Appendix A.2. Neutral Axis Lying Outside the Opening (Below Openings), Tension Zone Remains Unweakened (MK-3)

Appendix A.2.1. Computational Schematic of the Model

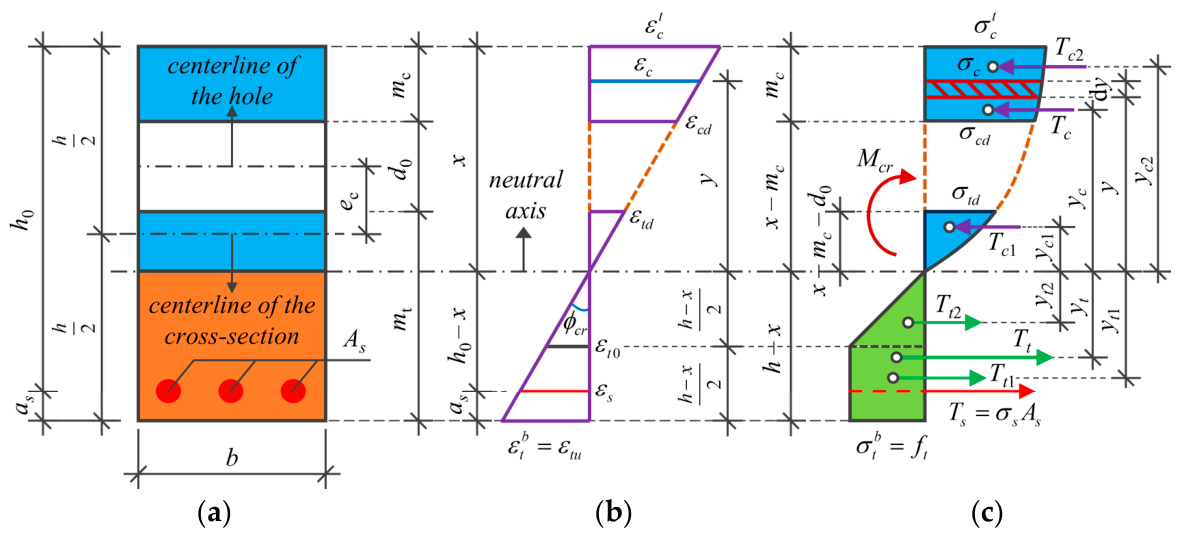
When openings are small, with high eccentricity or a large reinforcement ratio, the neutral axis shifts downward into the bottom chord of the opening, becoming real. The opening traverses the compression zone, dividing it into two parts. The model computational schematic is as shown in Figure A2.
Figure A2. Computational schematic of the model MK-3: (a) cross-section; (b) strain distribution; (c) stress distribution.
Buildings 16 02833 g0a2

Appendix A.2.2. Internal Force and Centroid Computational Model

(1)
Compressive resultant force Tc and centroid position yc
With the neutral axis in the bottom chord, the compression zone is split into two parts. The resultant force Tc and centroid position yc are calculated as follows:
T c = T c 1 + T c 2 = 0 x m c d 0 σ c b d y + x m c x σ c b d y = 0 x m c d 0 f c 1 1 ε c ε 0 n b d y + x m c x f c 1 1 ε c ε 0 n b d y
y c = T c 1 y c 1 + T c 2 y c 2 T c = 0 x m c d 0 σ c b y d y + x m c x σ c b y d y T c = 0 x m c d 0 f c 1 1 ε c ε 0 n b y d y + x m c x f c 1 1 ε c ε 0 n b y d y T c
When the concrete strength grade is ≤C50, parameter n in Equations (7) and (8) is a constant integer of 2, as calculated by Equation (2). Substituting this value into Equations (7) and (8) yields the computational formulas for Tc and yc under concrete strength grades ≤ C50, as follows:
T c = 2 f c b x m c d 0 2 ε t 0 ε 0 h x 1 2 3 ε t 0 x m c d 0 ε 0 h x + 2 f c b m c ε t 0 ε 0 h x 2 x m c 2 ε t 0 ε 0 h x x 2 m c x + 1 3 m c 2
  y c = x m c d 0 3 2 3 1 2 ε t 0 x m c d 0 ε 0 h x + m c 2 x 2 2 m c x + 2 3 m c 2 2 ε t 0 ε 0 h x x 3 3 2 m c x 2 + x m c 2 1 4 m c 3 x m c d 0 2 1 2 3 ε t 0 x m c d 0 ε 0 h x + m c 2 x m c 2 ε t 0 ε 0 h x x 2 m c x + 1 3 m c 2
(2)
Tensile force resultant Tt and centroid position yt
For the opening pattern shown in Figure A2, the tensile zone of the cross-section is not weakened by the opening. Thus, the expressions for Tt and yt can be determined by substituting (hx) for mt in Equations (12) and (13).
(3)
Resultant force of tensile reinforcement Ts
The resultant force of tensile reinforcement Ts may be calculated using Equation (14) in Model MK-1.

Appendix A.2.3. Equation for the Compression Zone Depth x

When the concrete strength grade is ≤C50, substituting the expressions for Ts, Tt, and Tc into Equation (16) yields the computational formula for the compression zone depth x of the beams with openings (MK-3) after simplification, as follows:
3 4 f t b + f c b ε t 0 ε 0 2 + 4 3 f c b ε t 0 ε 0 x 3 + 2 E s ε t 0 A s + 9 4 f t b h 2 f c b ε t 0 ε 0 h + 2 d 0 4 f c b d 0 ε t 0 2 ε 0 2 x 2 + 2 E s ε t 0 A s h 0 + h 9 4 f t b h 2 + 2 f c b d 0 ε t 0 ε 0 2 h + 2 m c + d 0 + 4 f c b d 0 ε t 0 2 ε 0 2 2 m c + d 0 x + 2 E s ε t 0 A s h 0 h + 3 4 f t b h 3 2 f c b h d 0 ε t 0 ε 0 2 m c + d 0 4 3 f c b d 0 ε t 0 2 ε 0 2 3 m c 2 + 3 m c d 0 + d 0 2 = 0

Appendix A.3. Neutral Axis Lying Outside the Opening (Above Openings), Tensile Stress Distribution in the Tension Zone Is Rectangular Plus Triangular (MK-4)

Appendix A.3.1. Computational Schematic of the Model
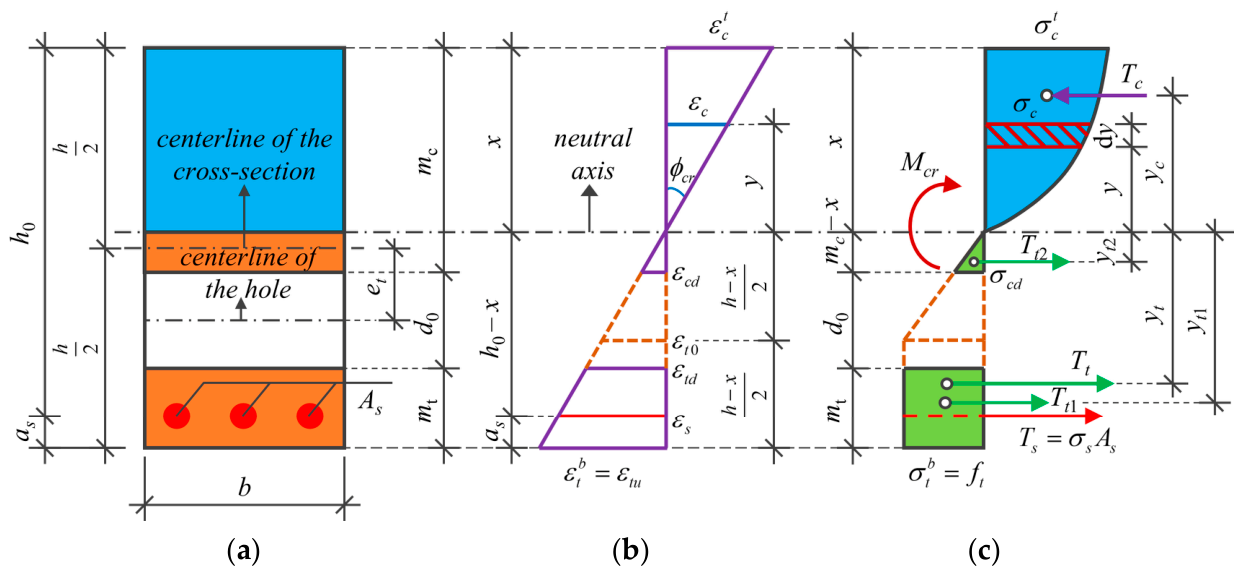
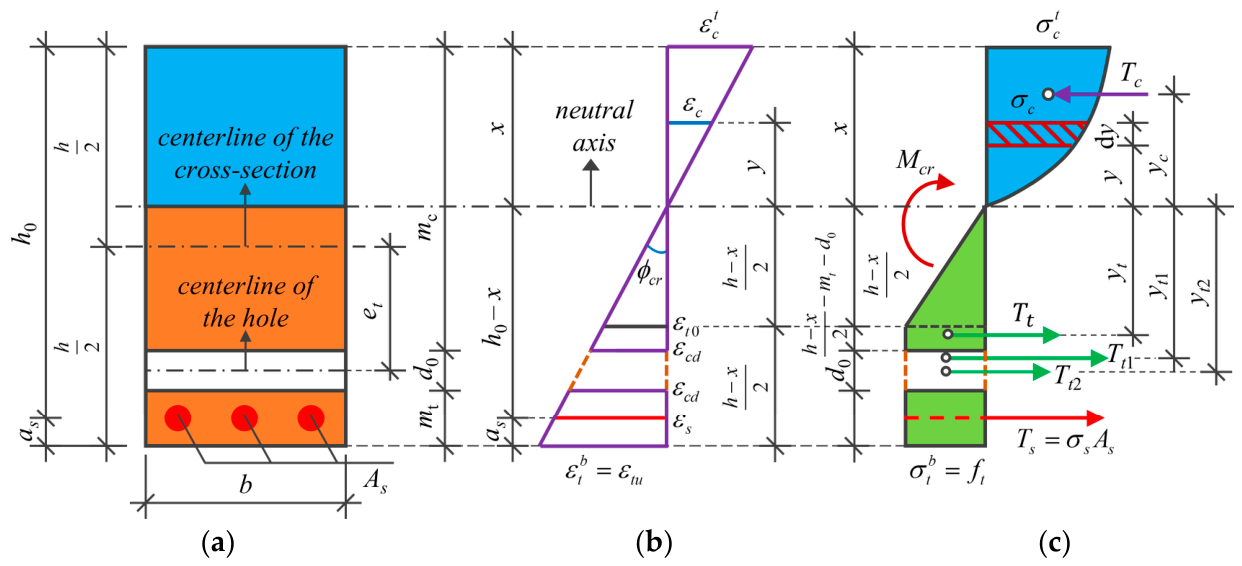
When the opening in the RC beam is downwardly eccentric and simultaneously traverses both the elastic and plastic tension zones, the neutral axis shifts upward into the range of the top chord mc of the opening, becoming a solid axis. As both the elastic and plastic tension zones are weakened by the opening, the tensile stress distribution in the tensile zone will be rectangular plus triangular. The model computational schematic for calculating the cracking moment under this opening pattern is shown in Figure A3.
Figure A3. Computational schematic of the model MK-4: (a) cross-section; (b) strain distribution; (c) stress distribution.
Buildings 16 02833 g0a3

Appendix A.3.2. Internal Force and Centroid Computational Model

(1)
Compressive resultant force Tc and centroid position yc
For the opening pattern shown in Figure A3, the compression zone of the cross-section is not weakened by the opening. Thus, the expressions for Tc and yc can be determined by substituting x for mc in Equations (7) and (8) or Equations (10) and (11).
(2)
Tensile force resultant Tt and centroid position yt
As shown in Figure A3, for this opening pattern, the tensile stress in the tension zone consists of a rectangular distribution in the plastic tension zone plus a triangular distribution in the elastic tension zone. The resultant force Tt and centroid position yt of the tension zone are calculated as follows:
T t = T t 1 + T t 2 = f t b m t + m c x 2 h x
y t = T t 1 y t 1 + T t 2 y t 2 T t = m t h x m t 2 + 2 3 m c x 3 h x m t + m c x 2 h x
(3)
Resultant force of tensile reinforcement Ts
The resultant force of tensile reinforcement Ts may be calculated using Equation (14) in Model MK-1.

Appendix A.3.3. Equation for the Compression Zone Depth x

When the concrete strength grade is ≤C50, substituting the expressions for Ts, Tt, and Tc into Equation (16) yields the computational formula for the compression zone depth x of the beams with openings (MK-4) after simplification, as follows:
f t b + 2 f c b ε t 0 ε 0 + 4 3 f c b ε t 0 2 ε 0 2 x 3 + 2 E s ε t 0 A s + f t b m t + h + 2 m c 2 f c b h ε t 0 ε 0 x 2 2 E s ε t 0 A s h 0 + h + f t b 2 h m t + 2 h m c + m c 2 x + 2 E s ε t 0 A s h 0 h + f t b h h m t + m c 2 = 0

Appendix A.4. Neutral Axis Lying Outside the Opening (Above Openings), Tensile Stress Distribution in the Tension Zone Is Rectangular Plus Trapezoidal Plus Triangular (MK-5)

Appendix A.4.1. Computational Schematic of the Model
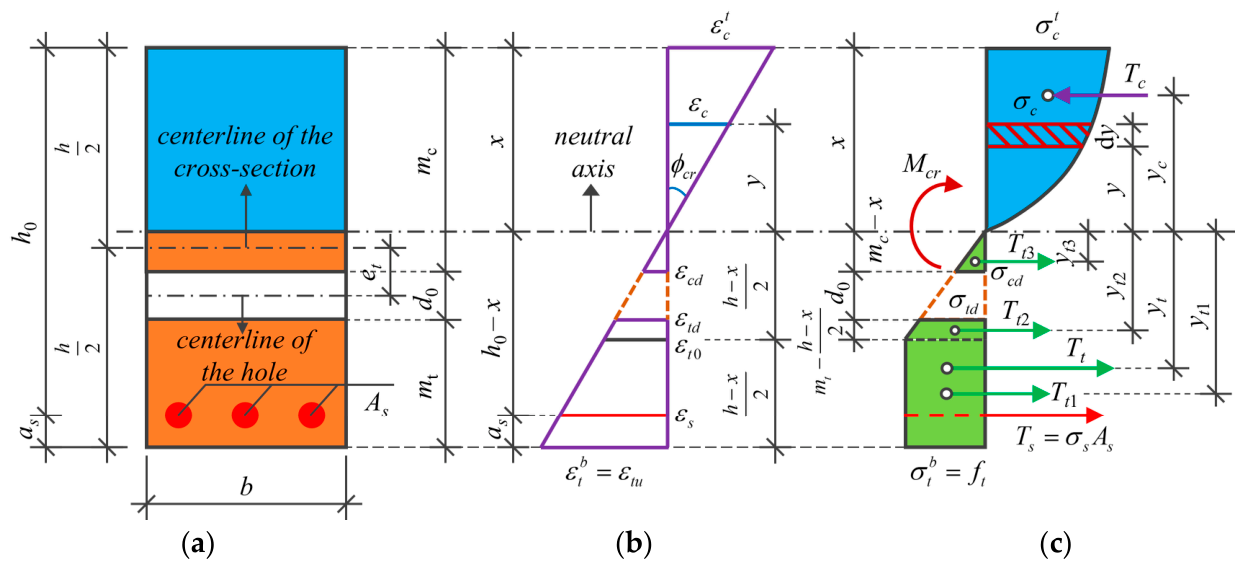
When the opening in the RC beam is small and downwardly eccentric, and the opening traverses the elastic tension zone, the neutral axis shifts upward into the range of the top chord mc of the opening, becoming a solid axis. As the elastic tension zone is weakened and divided into two parts by the opening, the tensile stress distribution in the tensile zone will be rectangular plus trapezoidal plus triangular. The model computational schematic for calculating the cracking moment under this opening pattern is as shown in Figure A4.
Figure A4. Computational schematic of the model MK-5: (a) cross-section; (b) strain distribution; (c) stress distribution.
Buildings 16 02833 g0a4

Appendix A.4.2. Internal Force and Centroid Computational Model

(1)
Compressive resultant force Tc and centroid position yc
For the opening pattern shown in Figure A4, the compression zone of the cross-section is not weakened by the opening. Thus, the expressions for Tc and yc can be determined by substituting x for mc in Equations (7) and (8) or Equations (10) and (11).
(2)
Tensile force resultant Tt and centroid position yt
As shown in Figure A4, under this opening pattern, the tensile stress in the tension zone consists of a rectangular distribution in the plastic tension zone (which remains uncompromised) plus trapezoidal and triangular distributions in the elastic tension zone. The resultant force Tt and centroid position yt of the tension zone are calculated as follows:
T t = T t 1 + T t 2 + T t 3 = f t b h x 3 4 h x m t h x 2 + m c x h x 2
y t = T t 1 y t 1 + T t 2 y t 2 + T t 3 y t 3 T t = h x 11 24 2 3 h x m t h x 3 + 2 3 m c x h x 3 3 4 h x m t h x 2 + m c x h x 2
(3)
Resultant force of tensile reinforcement Ts
The resultant force of tensile reinforcement Ts may be calculated using Equation (14) in Model MK-1.

Appendix A.4.3. Equation for the Compression Zone Depth x

When the concrete strength grade is ≤C50, substituting the expressions for Ts, Tt, and Tc into Equation (16) yields the computational formula for the compression zone depth x of the beams with openings (MK-5) after simplification, as follows:
3 4 f t b + 2 f c b ε t 0 ε 0 + 4 3 f c b ε t 0 2 ε 0 2 x 3 + 2 E s ε t 0 A s + f t b 1 4 h + 2 m t + 2 m c 2 f c b h ε t 0 ε 0 x 2 + 2 E s ε t 0 A s h 0 + h + f t b 3 4 h 2 + + 4 h m t + m c 2 f t b 2 h m c + m c 2 x + 2 E s ε t 0 A s h 0 h + f t b h m c 2 1 4 h 2 + 2 h m t m c 2 = 0

Appendix A.5. Neutral Axis Lying Outside the Opening (Above Openings), Tensile Stress Distribution in the Tension Zone Is Two Rectangular Distributions Plus One Triangular Distribution (MK-6)

Appendix A.5.1. Computational Schematic of the Model

When the opening in the RC beam is small and with large downward eccentricity, the opening may traverse the plastic tension zone, dividing it into two parts. As the elastic tension zone is not weakened and the neutral axis is located within the range of the top chord mc, becoming a real axis, the tensile stress distribution in the tensile zone will be two rectangles plus a triangle. The model computational schematic for calculating the cracking moment under this opening pattern is as shown in Figure A5.
Figure A5. Computational schematic of the model MK-6: (a) cross-section; (b) strain distribution; (c) stress distribution.
Buildings 16 02833 g0a5

Appendix A.5.2. Internal Force and Centroid Computational Model

(1)
Compressive resultant force Tc and centroid position yc
For the opening pattern shown in Figure A5, the compression zone of the cross-section is not weakened by the opening. Thus, the expressions for Tc and yc can be determined by substituting x for mc in Equations (7) and (8) or Equations (10) and (11).
(2)
Tensile force resultant Tt and centroid position yt
As shown in Figure A5, under this opening pattern, the tensile stress in the tension zone consists of two rectangular distributions in the plastic tension zone plus one triangular distribution in the elastic tension zone, which remains uncompromised. The resultant force Tt and centroid position yt of the tension zone are calculated as follows:
T t = T t 1 T t 2 = f t b 3 4 h x d 0
y t = T t 1 y t 1 T t 2 y t 2 T t = 11 24 h x 2 d 0 h x m t d 0 2 3 4 h x d 0
where: Tt1 shall be calculated in accordance with the computational method for Tt specified in Appendix A.2.2; yt1 is the distance from the centroid of the resultant tensile force in the solid beam to the neutral axis; Tt2 is the resultant force of tensile stresses within the opening region, calculated as ft·b·d0; yt2 is the distance from the center of the hole to the neutral axis.
(3)
Resultant force of tensile reinforcement Ts
The resultant force of tensile reinforcement Ts may be calculated using Equation (14) in Model MK-1.

Appendix A.5.3. Equation for the Compression Zone Depth x

When the concrete strength grade is ≤C50, substituting the expressions for Ts, Tt, and Tc into Equation (16) yields the computational formula for the compression zone depth x of the beams with openings (MK-6) after simplification, as follows:
3 4 f t b + 2 f c b ε t 0 ε 0 + 4 3 f c b ε t 0 2 ε 0 2 x 3 + 2 E s ε t 0 A s + f t b 9 4 h d 0 2 f c b h ε t 0 ε 0 x 2 + 2 E s ε t 0 A s h 0 + h + f t b h 2 d 0 9 4 h x + 2 E s ε t 0 A s h 0 h + f t b h 2 3 4 h d 0 = 0

Appendix B. Calculation Method for CDP Model Parameters

The concrete stress and inelastic strain input into the CDP model were calculated according to the specifications in the Code for Design of Concrete Structures GB 50010-2010 [38].

Appendix B.1. The Calculation Formulas for the Concrete Stress σc and Inelastic Compressive Strain ε c i n Under Uniaxial Compression

σ c = ( 1 d c ) E c ε c
ε c i n = ε c σ c E c = d c ε c
where: σc is the uniaxial compressive stress of concrete; Ec is the elastic modulus of concrete; εc is the total compressive strain of concrete under uniaxial compression; dc is the concrete damage evolution parameter under uniaxial compression, calculated as follows:
d c = 1 ρ c n n 1 + x n 1 ρ c α c ( x 1 ) 2 + x   x 1   x > 1
ρ c = f c , r E c ε c , r
n = E c ε c , r E c ε c , r f c , r
x = ε c ε c , r
where: αc is the descending branch parameter of the concrete uniaxial compressive stress–strain curve, which may be adopted from Table A1; fc,r is the representative value of concrete uniaxial compressive strength, whose value can be taken as fc, fck, or fcm based on the requirements of the structural analysis; εc,r denotes the peak compressive strain of concrete corresponding to the uniaxial compressive strength fc,r, which may be adopted from Table A1.
Table A1. Parameter values of the uniaxial compressive stress–strain curve of concrete [38].
fc,r (MPa)εc,r (10−6)αcεcu/εc,r
2014700.743
2515601.062.6
3016401.362.3
3517201.652.1
4017901.942.0
4518502.211.9
5019202.481.9
The intermediate values of each parameter in the table are obtained by linear interpolation.

Appendix B.2. The Calculation Formulas for the Concrete Stress σt and Inelastic Compressive Strain ε t i n Under Uniaxial Compression

σ t = ( 1 d t ) E c ε t
ε t i n = ε t σ t E c = d t ε t
where: σt is the uniaxial tensile stress of concrete; εt is the total tensile strain of concrete under uniaxial tension; dt is the concrete damage evolution parameter under uniaxial tension, calculated as follows:
d t = 1 ρ t 1.2 0.2 x 5 1 ρ t α t ( x 1 ) 1.7 + x x 1   x > 1
ρ t = f t , r E c ε t , r
x = ε t ε t , r
where: αt is the descending branch parameter of the concrete uniaxial tensile stress–strain curve, which may be adopted from Table A2; ft,r is the representative value of concrete uniaxial compressive strength, whose value can be taken as ft, ftk, or fm based on the requirements of the structural analysis; εt,r is the peak compressive strain of concrete corresponding to the uniaxial compressive strength ft,r, which may be adopted from Table A2.
Table A2. Parameter values of the uniaxial tensile stress–strain curve of concrete [38].
ft,r (MPa)εt,r (10−6)αt
1.0650.31
1.5810.70
2.0951.25
2.51071.95
3.01182.81
3.51283.82
4.01375.00
The intermediate values of each parameter in the table are obtained by linear interpolation.

Appendix B.3. Plastic Damage Factor D of Concrete

The plastic damage factor D in the CDP model can be calculated according to the method proposed by Guo et al. [45], as follows.
(1)
Compressive plastic damage factor Dc
D c = 1 ρ c n n 1 + x n 1 ρ c α c ( x 1 ) 2 + x   x 1   x > 1
(2)
Tensile plastic damage factor Dt
D t = 1 ρ t 1.2 0.2 x 5           x 1   1 ρ t α t ( x 1 ) 1.7 + x       x > 1    

References

  1. Yin, Z.L. Seismic behavior and design method of reinforced concrete beams with circular holes. J. Build. Struct. 1995, 2, 18–32. (In Chinese) [Google Scholar] [CrossRef]
  2. Xu, Z.S.; Yuan, G.L.; Nie, M.; Qiu, H. Experimental study and theoretical analysis on bearing capacity of RC beams with openings. Build. Sci. 2016, 32, 1–8. (In Chinese) [Google Scholar] [CrossRef]
  3. Zhang, S.Y.; Wu, Y.H.; Zheng, B.L.; He, P.F. Experimental study on mechanical behavior of simply supported RC beams with small openings. Chin. Q. Mech. 2013, 34, 101–113. (In Chinese) [Google Scholar] [CrossRef]
  4. Huang, T.Y.; Cai, J. Experimental study on simply supported RC beams with rectangular openings in web. Chin. Civ. Eng. J. 2009, 42, 36–45. (In Chinese) [Google Scholar]
  5. Zhang, B.H.; Xu, H.; Zhang, D.J. Experimental study on flexural behavior of reinforced concrete beams with openings. Eng. Mech. 1993, 10, 442–447. (In Chinese) [Google Scholar]
  6. Cai, J.; Ye, J.B.; Zuo, Z.L.; Huang, T.Y.; Chen, Q.J. Experimental study on shear behavior of pre-stressed concrete simply supported beams with rectangular web openings. J. Build. Struct. 2019, 40, 100–107. (In Chinese) [Google Scholar] [CrossRef]
  7. Hemzah, S.A.; Alyhya, W.S.; Hassan, S.A. Experimental investigation for structural behaviour of self-compacting reinforced concrete hollow beams with in-place circular openings strengthened with CFRP laminates. Structures 2020, 24, 99–106. [Google Scholar] [CrossRef]
  8. Amin, S.; Elwan, S.K.; Elzeiny, S.; Hamad, M.; Deifalla, A. Numerical modeling the effect of an opening on the behavior of exterior beam-column connections under cyclic loading. J. Build. Eng. 2021, 40, 102742. [Google Scholar] [CrossRef]
  9. Ali, S.R.M.; Saeed, J.A. Shear capacity and behavior of high-strength concrete beams with openings. Eng. Struct. 2022, 264, 114431. [Google Scholar] [CrossRef]
  10. Elsayed, M.; Badawy, S.; Tayeh, B.A.; Elymany, M.; Salem, M.; ElGawady, M. Shear behaviour of ultra-high performance concrete beams with openings. Structures 2022, 43, 546–558. [Google Scholar] [CrossRef]
  11. Al-Mahbashi, M.; Elsanadedy, H.; Abbas, H.; Abadel, A.; Al-Salloum, Y. Experimental and numerical study of high strength reinforced concrete continuous deep beams with circular and rectangular openings. J. Build. Eng. 2023, 79, 107868. [Google Scholar] [CrossRef]
  12. Shoeib, A.E.; Sedawy, A.E. Shear strength reduction due to introduced opening in loaded RC beams. J. Build. Eng. 2017, 13, 28–40. [Google Scholar] [CrossRef]
  13. Özkılıç, Y.O.; Aksoylu, C.; Hakeem, I.Y.; Özdöner, N.; Kalkan, İ.; Karalar, M.; Stel’makh, S.A.; Shcherban’, E.M.; Beskopylny, A.N. Shear and Bending Performances of Reinforced Concrete Beams with Different Sizes of Circular Openings. Buildings 2023, 13, 1989. [Google Scholar] [CrossRef]
  14. Zhao, M.; Huang, J.Q.; Zhong, X.; Chang, Y. Mechanical behavior of RC beams with openings strengthened with CFRP under different rectangular opening sizes. Build. Struct. 2025, 55, 82–88+81. (In Chinese) [Google Scholar] [CrossRef]
  15. Elansary, A.A.; Abdel Aty, A.A.; Abdalla, H.A.; Zawam, M. Shear behavior of reinforced concrete beams with web opening near supports. Structures 2022, 37, 1033–1041. [Google Scholar] [CrossRef]
  16. Kumari, A.; Nayak, A.N. An experimental approach for strengthening of RC deep beams with web openings using GFRP fabrics and gas actuated fasteners. J. Build. Eng. 2021, 35, 102027. [Google Scholar] [CrossRef]
  17. Mwonga, M.M.; Kabubo, C.; Gathimba, N. Effect of polyethylene terephthalate fibres on the structural performance of reinforced concrete beams with openings in the shear region. Constr. Build. Mater. 2023, 369, 130539. [Google Scholar] [CrossRef]
  18. Mai, J.E.; Lu, X.Z.; He, G.H.; Pei, X.K. Experimental and numerical analysis on bearing performance of beams with openings in a metro station. Struct. Eng. 2021, 37, 167–173. (In Chinese) [Google Scholar] [CrossRef]
  19. Sun, L.C.; Lin, X.C. Mechanical behavior and engineering application of beams with openings in plastic hinge zone. Spec. Struct. 2021, 38, 8–13. (In Chinese) [Google Scholar] [CrossRef]
  20. Kim, H.G.; Lee, Y.J.; Kim, K.H. Cyclic flexural performance of RC beams with small circular openings in plastic hinge region. Constr. Build. Mater. 2022, 321, 126339. [Google Scholar] [CrossRef]
  21. Ghalla, M.; Shaaban, I.G.; Elsamak, G.; Badawi, M.; Alshammari, E.; Yehia, S.A. Restoration of shear capacity in RC beams with cut circular web openings using stainless steel, aluminium sheets, and GFRP bars. Eng. Struct. 2025, 334, 120215. [Google Scholar] [CrossRef]
  22. Fayed, S.; el-din, A.B.; El-Naqeeb, M.H. Shear behavior of multiple openings-RC beams having no shear reinforcement internally reinforced with web steel plates. Eng. Struct. 2025, 322, 119184. [Google Scholar] [CrossRef]
  23. Amin, F.; Ali, I.; Husnain, A.; Javed, M.F.; Alabduljabbar, H.; Junaid, A. Sustainable strengthening of concrete deep beams with openings using ECC and Bamboo: An equation and data-driven approach through abaqus modeling and GEP. Results Eng. 2025, 26, 104813. [Google Scholar] [CrossRef]
  24. Hakeem, I.Y.; Mansour, W.; Li, W.; Badawi, M. Analyze the potential for employing internally welded steel plates to improve the shear response of high-strength self-compacting concrete-encased steel beams with large web openings. Eng. Struct. 2024, 304, 117636. [Google Scholar] [CrossRef]
  25. Li, W.; el-din, A.B.; Mansour, W.; Fayed, S. Improving shear performance of regular web openings concrete beams using steel mesh reinforced strain hardening cementitious composites: An experimental and numerical study. Eng. Struct. 2024, 314, 118344. [Google Scholar] [CrossRef]
  26. Erfan, A.M.; Hafez, R.; Badawy, M.M. Behavior of High Strength Concrete Deep Beams Reinforced with Basalt Fiber Reinforced Polymer Bars with and without Openings. Structures 2024, 69, 107397. [Google Scholar] [CrossRef]
  27. Fan, S.X.; Du, P.W.; Tan, K.H. Synergistic effects of web reinforcement and hybrid fibres on shear performance of continuous deep beams with unsymmetrical web openings. Eng. Struct. 2024, 300, 117129. [Google Scholar] [CrossRef]
  28. Jin, X.H.; Xu, Y.Y.; Luo, Y.; Yin, C.S. Experimental study on mechanical properties of concrete beams with circular holes after high temperature. J. Build. Struct. 2023, 44, 235–246. (In Chinese) [Google Scholar] [CrossRef]
  29. Miao, S.L.; He, C.; Shen, Q.Y.; Lai, B.B.; Yang, C.; Lin, J.H. Experiment on mechanical properties of RC beams with openings in shear-bending zone after high temperature. Fire Sci. Technol. 2019, 38, 1204–1206+1210. (In Chinese) [Google Scholar]
  30. Shabanlou, M.; Meghdadi, Z.; Ghaffar, S.H. Experimental and analytical study of the residual performance of reinforced concrete deep beams with circular web openings. Results Eng. 2025, 25, 104229. [Google Scholar] [CrossRef]
  31. Liu, J.; Lu, S.; Wei, J.; Xu, S.C. Dynamic behaviour of ultra-high performance concrete beams with rectangular openings subjected to impact loads. Structures 2024, 69, 107362. [Google Scholar] [CrossRef]
  32. Chen, Z.P.; Xu, R.T.; Ban, M.G.; Feng, J.M.; Ling, Z.Y.; Cheng, H.L.; Liang, Y. Behavior evolution and deformation prediction of RC beams with double openings under fatigue loading. Structures 2023, 58, 105543. [Google Scholar] [CrossRef]
  33. Zhang, S.S.; Zhang, D.D.; Nie, X.F. Behavior of RC interior beam-to-column joints with FRP-strengthened beam web openings under cyclic loading. Eng. Struct. 2025, 324, 119373. [Google Scholar] [CrossRef]
  34. Kartal, S. Flexural behavior of RC beams with multiple parallelogram openings. Structures 2024, 61, 106041. [Google Scholar] [CrossRef]
  35. Daniel, J.J. Experimental and numerical study on the cracking behavior and flexural strength of RC shallow beams with rectangular opening and varying length. Structures 2022, 40, 460–468. [Google Scholar] [CrossRef]
  36. Fu, L.; Wang, H.; Nakamura, H.; Wang, D.F. Mechanism of improvement in the shear performance of RC beams due to multiple small transverse openings. Structures 2022, 45, 758–772. [Google Scholar] [CrossRef]
  37. Saleh, M.; AlHamaydeh, M.; Zakaria, M. Finite element analysis of reinforced concrete deep beams with square web openings using damage plasticity model. Eng. Struct. 2023, 278, 115496. [Google Scholar] [CrossRef]
  38. GB 50010-2010; Code for Design of Concrete Structures. China Architecture & Building Press: Beijing, China, 2015. (In Chinese)
  39. ACI 318-19; Building Code Requirements for Structural Concrete (ACI 318-19) and Commentary. American Concrete Institute (ACI): Farmington Hills, MI, USA, 2019.
  40. Ye, L.P. Concrete Structures, 2nd ed.; Tsinghua University Press: Beijing, China, 2005; Volume 1. (In Chinese) [Google Scholar]
  41. Zeng, X.T.; Ren, Z.H.; Sun, J.B. Stiffness study of wide-notch concrete beams reinforced with embedded CFRP bars based on quasi-plane assumption. J. Nat. Disasters 2019, 28, 96–103. (In Chinese) [Google Scholar] [CrossRef]
  42. Jiang, C.; Ding, H.; Gu, X.L.; Zhang, W.P. Simplified calculation method for flexural failure mode and bearing capacity of corroded RC beams. J. Build. Struct. 2022, 43, 1–10. (In Chinese) [Google Scholar] [CrossRef]
  43. Mostoffnejad, D.; Abdoli, M. Compatibility analysis of FRP-strengthened exterior RC beam-column joints: An advanced analytical model. Dev. Built Environ. 2025, 21, 100634. [Google Scholar] [CrossRef]
  44. Gu, X.L. Fundamental Principles of Concrete Structures, 3rd ed.; Tongji University Press: Shanghai, China, 2015. (In Chinese) [Google Scholar]
  45. Guo, J.W.; Xu, B. Study on the value and application of damage factors in concrete damage plasticity model. J. Gansu Sci. 2019, 31, 88–92. (In Chinese) [Google Scholar] [CrossRef]
  46. Jin, X.H.; Xu, Y.Y.; Zhu, W.J.; Zhang, D. Fire Resistance of Reinforced Concrete T-Beams with Circular Web Openings. Buildings 2023, 13, 436. [Google Scholar] [CrossRef]
  47. Ali, T.; Kim, R.E.; Kim, K.S.; Park, K.T. Nonlinear Finite Element Modeling and Parametric Analysis for the Design Implication of Expanded Rib Steel Bars in RC Beams. Dev. Built Environ. 2023, 16, 100242. [Google Scholar] [CrossRef]
  48. Gong, J.X.; Wei, W.W.; Hu, J.S. Design of Concrete Structures: Chinese, American and European; China Architecture & Building Press: Beijing, China, 2007. (In Chinese) [Google Scholar]
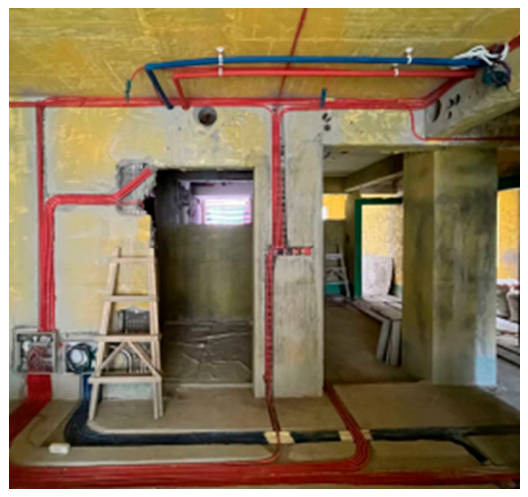
Figure 1. Field opening in the beams.
Buildings 16 02833 g001
Figure 2. Constitutive relationship of material stress–strain: (a) stress–strain relationship of concrete under compression; (b) stress–strain relationship of concrete under tension; (c) stress–strain relationship of reinforced steel under tension.
Buildings 16 02833 g002
Figure 3. Computational schematic of the model MK-1: (a) cross-section; (b) strain distribution; (c) stress distribution.
Buildings 16 02833 g003
Figure 4. Computational procedure.
Buildings 16 02833 g004
Figure 5. Parameters required for the concrete damage-plasticity (CDP) model in ABAQUS finite element analysis: (a,c) compressive/tensile stress—inelastic strain relationship curve; (b,d) compressive/tensile plastic damage factor—inelastic strain relationship curve.
Buildings 16 02833 g005aBuildings 16 02833 g005b
Figure 6. Finite element models: (a) reinforcement cage; (b) solid beams; (c) beams with openings.
Buildings 16 02833 g006
Figure 7. Tensile damage contours and corresponding load-displacement curves: (a) tensile damage contours; (b) load-displacement curves.
Buildings 16 02833 g007
Figure 8. Comparison of cracking moment—relationship curves from numerical simulation and theoretical modeling: (ac) beams with central openings; (df) beams with eccentric openings.
Buildings 16 02833 g008
Figure 9. Comparison of cracking moment values predicted by numerical simulation and theoretical modeling: (a) beams with central openings; (b) beams with eccentric openings.
Buildings 16 02833 g009
Figure 10. Comparison of theoretical model values and code formula values: (a,b) beams with central openings; (c,d) beams with eccentric openings.
Buildings 16 02833 g010
Figure 11. Schematic of dynamic switching of cracking moment theoretical prediction models for beams with openings: (a) beams with central openings; (b) beams with eccentric openings.
Buildings 16 02833 g011
Figure 12. Fitting curve for the cracking moment of beams with central openings.
Buildings 16 02833 g012
Figure 13. Fitting curves for the cracking moment of beams with eccentric openings: (a) ρ0 = 15%; (b) ρ0 = 30%; (c) ρ0 = 45%.
Buildings 16 02833 g013
Table 1. Criteria for theoretical prediction models of cracking moment in beams with openings.
ModelCriterion for Neutral Axis Position P1Criterion for Neutral Axis Position P2Schematic of Tensile Stress Distribution
MK-1: Neutral axis lying within the opening, tensile stress distribution in the tension zone is rectangular plus trapezoidal. P 1 = x m c > 0
and
P 1 = x m c d 0 < 0
(Virtual axis)
P 2 = h x 2 m t < 0
Rectangular plus trapezoidal
Buildings 16 02833 i001
MK-2: Neutral axis lying within the opening, tensile stress distribution in the tension zone is rectangular. P 1 = x m c > 0
and
P 1 = x m c d 0 < 0
(Virtual axis)
P 2 = h x 2 m t > 0
Rectangular
Buildings 16 02833 i002
MK-3: Neutral axis lying outside the opening (below openings), tension zone remains unweakened. P 1 = x m c d 0 > 0
or
P 1 = h x m t < 0
(Real axis)
Half tensile zone with triangular distribution plus half tensile zone with rectangular distributionBuildings 16 02833 i003
MK-4: Neutral axis lying outside the opening (above openings), tensile stress distribution in the tension zone is rectangular plus triangular. P 1 = x m c < 0
(Real axis)
P 2 = h x 2 m t > 0
and
P 2 = h x 2 m t d 0 < 0
Rectangular plus triangular
Buildings 16 02833 i004
MK-5: Neutral axis lying outside the opening (above openings), tensile stress distribution in the tension zone is rectangular plus trapezoidal plus triangular. P 1 = x m c < 0
(Real axis)
P 2 = h x 2 m t < 0
Rectangular plus trapezoidal plus triangular
Buildings 16 02833 i005
MK-6: Neutral axis lying outside the opening (above openings), tensile stress distribution in the tension zone is two rectangular distributions plus one triangular distribution. P 1 = x m c < 0
(Real axis)
P 2 = h x 2 m t d 0 > 0
Two rectangular plus one triangular
Buildings 16 02833 i006
In the table, “neutral axis lying within the opening” means that the neutral axis of the opening section passes through the opening region, whereas “neutral axis lying outside the opening” means that the neutral axis lies in the upper or lower chord outside the opening.
Table 2. Summary of working cases for numerical simulation.
CategoryOpening Ratio (%)Eccentricity Ratio (%)Concrete Strength
Grade
Reinforcement Ratio (%)Quantity
Solid beams--C30/C40/C500.95433
Beams with central openings7.5, 15, 22.5, 30, 37.5, 45, 52.5, 60, 67.5-27
Beams with eccentric openings30±6.25, ±12.5, ±18.7518
The eccentricity is measured relative to the midline of the beam height; positive values indicate the opening is above the midline, while negative values indicate it is below.
Table 3. Other parameters of the CDP model.
Expansion Angle (°)Eccentricityfb0/fc0KViscous Parameter
350.11.160.6670.0005
Table 4. Summary of computational cases for comparative analysis of codes.
CategoryOpening Ratio (%)Eccentricity Ratio (%)Concrete Strength
Grade
Reinforcement Ratio (%)Quantity
Solid beam--C30/C40/C500.4241/0.9543/1.42559
Beams with central openings7.5, 15, 22.5, 30, 37.5, 45, 52.5, 60, 67.5-81
Beams with eccentric openings15±6.25, ±12.5, ±18.75, ±25, 31.2581
30±6.25, ±12.5, ±18.75, 2563
45±6.25, ±12.5, 18.7545
The eccentricity is measured relative to the midline of the beam height; positive values indicate the opening is above the midline, while negative values indicate it is below.
Disclaimer/Publisher’s Note: The statements, opinions and data contained in all publications are solely those of the individual author(s) and contributor(s) and not of MDPI and/or the editor(s). MDPI and/or the editor(s) disclaim responsibility for any injury to people or property resulting from any ideas, methods, instructions or products referred to in the content.