Article

Numerical Case-Study Investigation of the Implementation of Various External Bioclimatic Measures in an Atrium Space of a Restaurant Building in Kragujevac, Serbia: Thermal Comfort and Energy Performance Analysis


by
Aleksandar Nešović
1 and
Robert Kowalik
2,*
1
Institute for Information Technologies, University of Kragujevac, Liceja Kneževine 1A, 34000 Kragujevac, Serbia
2
Faculty of Environmental Engineering, Geodesy and Renewable Energy, Kielce University of Technology, Tysiaclecia P.P. 7, 25-314 Kielce, Poland
*
Author to whom correspondence should be addressed.
Buildings 2026, 16(14), 2758; https://doi.org/10.3390/buildings16142758
Submission received: 30 April 2026 / Revised: 5 July 2026 / Accepted: 6 July 2026 / Published: 11 July 2026

Abstract

Restaurants are a category of commercial buildings highly sensitive to dynamic changes in ambient parameters, such as thermal, internal air quality, luminous, and acoustic conditions. These fluctuations in environmental comfort yield distinct energy, ecological, and economic implications, posing a significant challenge to understanding building behavior, particularly during the cooling season. The subject of this case study is a restaurant building featuring an atrium space located in Kragujevac (Central Serbia). Its unique architectural form, which aligns with national energy efficiency principles, combined with favorable local parameters characteristic of a moderate continental climate, enables the implementation of bioclimatic measures for the passive reduction of final energy consumption during the cooling season. Therefore, using Google SketchUp 8 and EnergyPlus 7.1 software, eight bioclimatic measures, classified into three groups, were investigated: horizontal overhangs, horizontal pergolas, and deciduous plants. The numerical simulations show that using V. coignetiae as a roof covering for restaurant buildings is optimal across all the criteria. It achieves a one-season payback period, with seasonal specific metrics of 58.2 kWh/(m2season) for total final energy consumption, 145.5 kWh/(m2season) for total primary energy consumption, and 77.11 kg/(m2season) for total CO2 emissions. In addition, a moderate continental climate suits green architecture and passive solar systems. This study confirms that the bioclimatic measures achieve energy, ecological, and economic justification solely through an integrated approach and a detailed analysis. Integrating these measures during architectural design maximizes their positive effects, ensuring optimal building performance throughout its entire operational life.

1. Introduction

Restaurant buildings (RBs) [1] are commercial and hospitality places where food and drinks are prepared and served, and then delivered to guests, with the main goal of satisfying their needs. According to the current Decree on the classification of activities of the Republic of Serbia [2], RBs belong to sector I—accommodation and catering services, and more precisely to group 56.10—activities of restaurant buildings and mobile catering facilities. Depending on the type, level, and method of service, i.e., on the applied concept, the following types of RBs are distinguished [1,2,3]: classic, luxury, casual, family, fast food, takeaway, self-service, themed, and integrated (within other units such as hotels, bars, cafes, etc.).
The Rulebook on Energy Efficiency of Buildings [4] defines the criteria that existing and new buildings intended for hospitality and tourism (including RBs) must satisfy within the territory of the Republic of Serbia to be classified as energy class C. These criteria encompass the annual specific final energy consumption for space heating eheat [kWh/(m2a)], the annual specific final energy consumption for electric equipment eeq [kWh/(m2a)], and the annual specific final energy consumption for water heating ewh [kWh/(m2a)]. For existing RBs, the limit values are eheat = 100 kWh/(m2a), eeq = 30 kWh/(m2a), and ewh = 60 kWh/(m2a), whereas for new RBs, the prescribed values are eheat = 90 kWh/(m2a), eeq = 30 kWh/(m2a), and ewh = 60 kWh/(m2a). Based on the mentioned values, it can be concluded that the cumulative upper limit eheat + eeq + ewh amounts to 180 kWh/(m2a) and 190 kWh/(m2a)—depending on the date of construction. In practice, the annual specific total final energy consumption etot [kWh/(m2a)] is significantly higher because RBs are frequently equipped with additional thermo-technical systems (such as air conditioning ecool [kWh/(m2a)], mechanical ventilation emv [kWh/(m2a)], artificial lighting eal [kWh/(m2a)], etc.), as indicated by numerous European examples: between 300–400 kWh/(m2a) [5] (302.1 kWh/(m2a)—Malta example, 314.3 kWh/(m2a)—UK example, 391 kWh/(m2a)—France example, and 396.8 kWh/(m2a)—Greek example), between 650–1140 kWh/(m2a) [6,7,8], and even above 2000 kWh/(m2a) [9]. In the percentage structure of the etot, the sum of eheat + ecool + emv + eal is usually in second place (25–33% [10,11] in the EU), but in some cases, it can be in the first place (50%—Serbian Rulebook example [4]).
To reduce the mentioned sum in the first place, as well as etot, various active and passive energy efficiency measures are implemented in RBs. Their positive effects have been verified in the scientific literature and widely accepted as a standard of efficient practice; some of them are presented below.
  • Active measures (temperature monitoring [12], responsive use of equipment [13], waste heat recovery in the ventilation systems [14], integration of photovoltaic (PV) systems for self-production of electricity [15], and implementation of advanced ventilation strategies [16], etc.);
  • Passive measures (optimizing the thermo-physical characteristics of the building envelope [17,18], natural ventilation strategies [19], implementation of external elements for shading glass surfaces [20], integration of green roofs [21], maximization of the contribution of natural lighting [22], etc.).
The implementation of passive energy efficiency measures in RBs is inextricably linked to the architectural design of the interior and exterior, which frequently presents a major design challenge due to prevailing aesthetic requirements. Overcoming the potential conflicts between functionality and aesthetics is found in bioclimatic design—an integral concept that serves as a platform for the synergy of different disciplines: architecture, urbanism, construction, engineering and design. This holistic approach makes it possible to find the optimal compromise through a multidisciplinary view of the problem, where the common denominator is the maximum exploitation of the microlocation parameters. Considering that RBs by their very nature represent “polygons for a high degree of creative expression”, the space for innovative solutions is huge.
However, the concept of bioclimatic design for the purpose of space cooling in RBs, although globally recognized and supported, as evidenced by the extensive scientific literature investigating various passive cooling measures (shading systems [23,24,25,26,27], deciduous vegetation [28,29,30], optimal building orientation [31], innovative insulation materials [32], window-to-wall ratio WW [33], atrium spaces [34,35,36], etc.), has not been sufficiently implemented in the practice of the Republic of Serbia due to serious legislative, professional, and methodological barriers. The first and basic barrier is represented by the current Rulebook [4], which determines the building energy class based on eheat, while ecool remains outside the scope of this categorization. This rigid legislative framework directly disincentivizes the application of passive cooling measures because it ignores the fact that due to global climate change and prolonged summer heat waves, ecool is progressively increasing and slowly approaching eheat [37]. Consequently, due to the lack of official guidelines and instruments for reference comparison (benchmarking) of energy performance during the summer season, the awareness of the real benefits of this concept remains at a very low level. The second key obstacle lies in the chronic deficit of scientific studies and quantitative data regarding the energy aspects of passive cooling measures within the domestic hospitality and tourism sector. In practice, only isolated cases of the application of passive cooling measures are recorded; these are observed and implemented solely through an aesthetic lens, rather than as components of an integrated bioclimatic system capable of delivering measurable energy savings. Finally, the absence of comprehensive research linking the architectural and engineering aspects, the passive cooling measures, the microclimatic location parameters, the specific characteristics of hospitality facilities, and the national regulatory framework prevents the creation of precise and applicable design models.
Overcoming these barriers through scientific grounding and the quantification of bioclimatic design effects at the national level represents a critical step forward. This would bridge the gap between theory and practice, provide a sustainable framework for the design of hospitality facilities, and substantially align the domestic construction sector with the contemporary European standards of green and sustainable architecture.
Based on the parameters discussed above, this paper numerically investigates the aspects of implementing bioclimatic design for space cooling within atrium-type RBs in the Serbian moderate continental climate zone. In the first phase, a reference model of a single-story RB located in Kragujevac (Central Serbia) was developed in compliance with the current national energy efficiency standards [4]. Simulations were conducted for the heating season (from 15 October to 15 April) utilizing both the national software package (NSP), i.e., URSA 1.0-0.50 [38] and EnergyPlus 7.1, with the primary objective of validating the EnergyPlus model by verifying the energy class and the heating energy indicator eheat. In the second phase, the numerical investigation was expanded to systematically evaluate and quantify the energy, ecological, and economic performance of eight specific passive cooling strategies operating during the cooling season (from 15 April to 15 October). Unlike previous studies, these bioclimatic measures (systematized as horizontal overhangs, horizontal pergolas, and deciduous plants) were implemented directly within the central open atrium. The geometric boundary conditions were defined using Google SketchUp 8, ensuring full compatibility with the EnergyPlus simulation environment.
By investigating (numerically in this case) bioclimatic design for space cooling using various passive cooling measures, this study aims to enhance the national reference framework for future scientific and professional research in the field of building energy efficiency (encompassing both residential and non-residential buildings) through systemic integration during the cooling season. Consequently, this will support the scientific and professional community in more effectively addressing emerging challenges within the building sector.

2. Materials and Methods

2.1. Research Subject

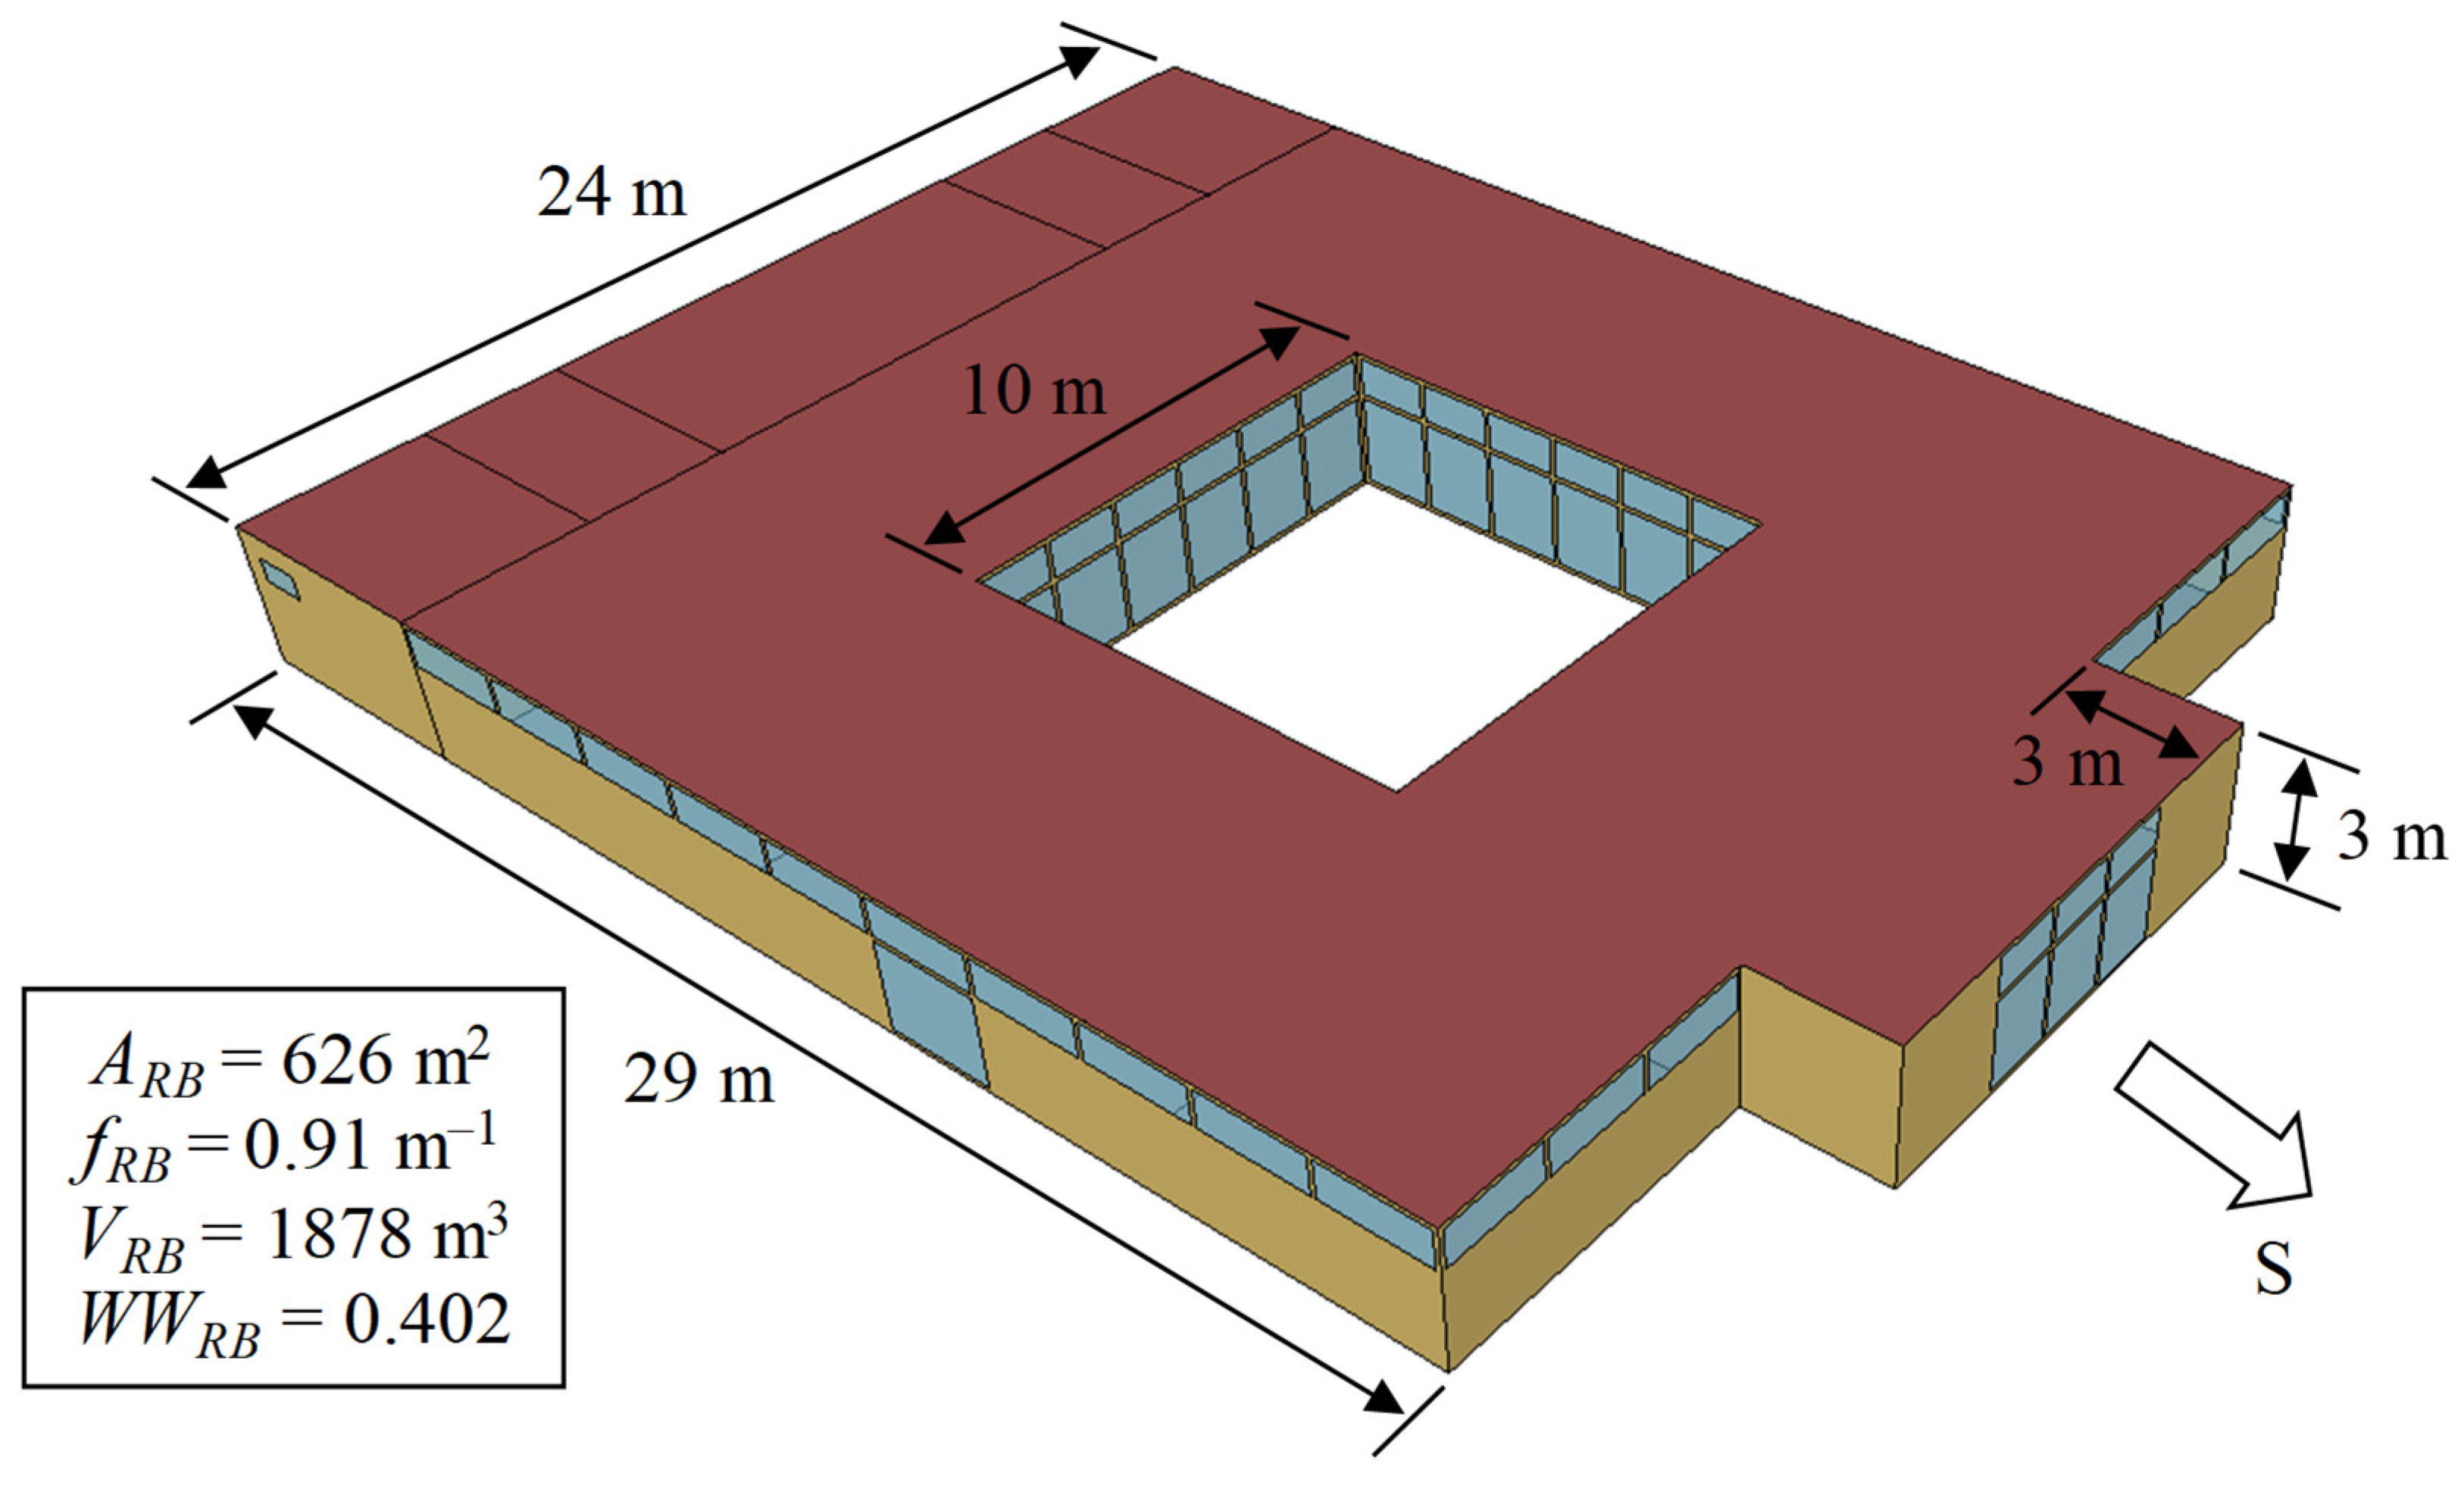
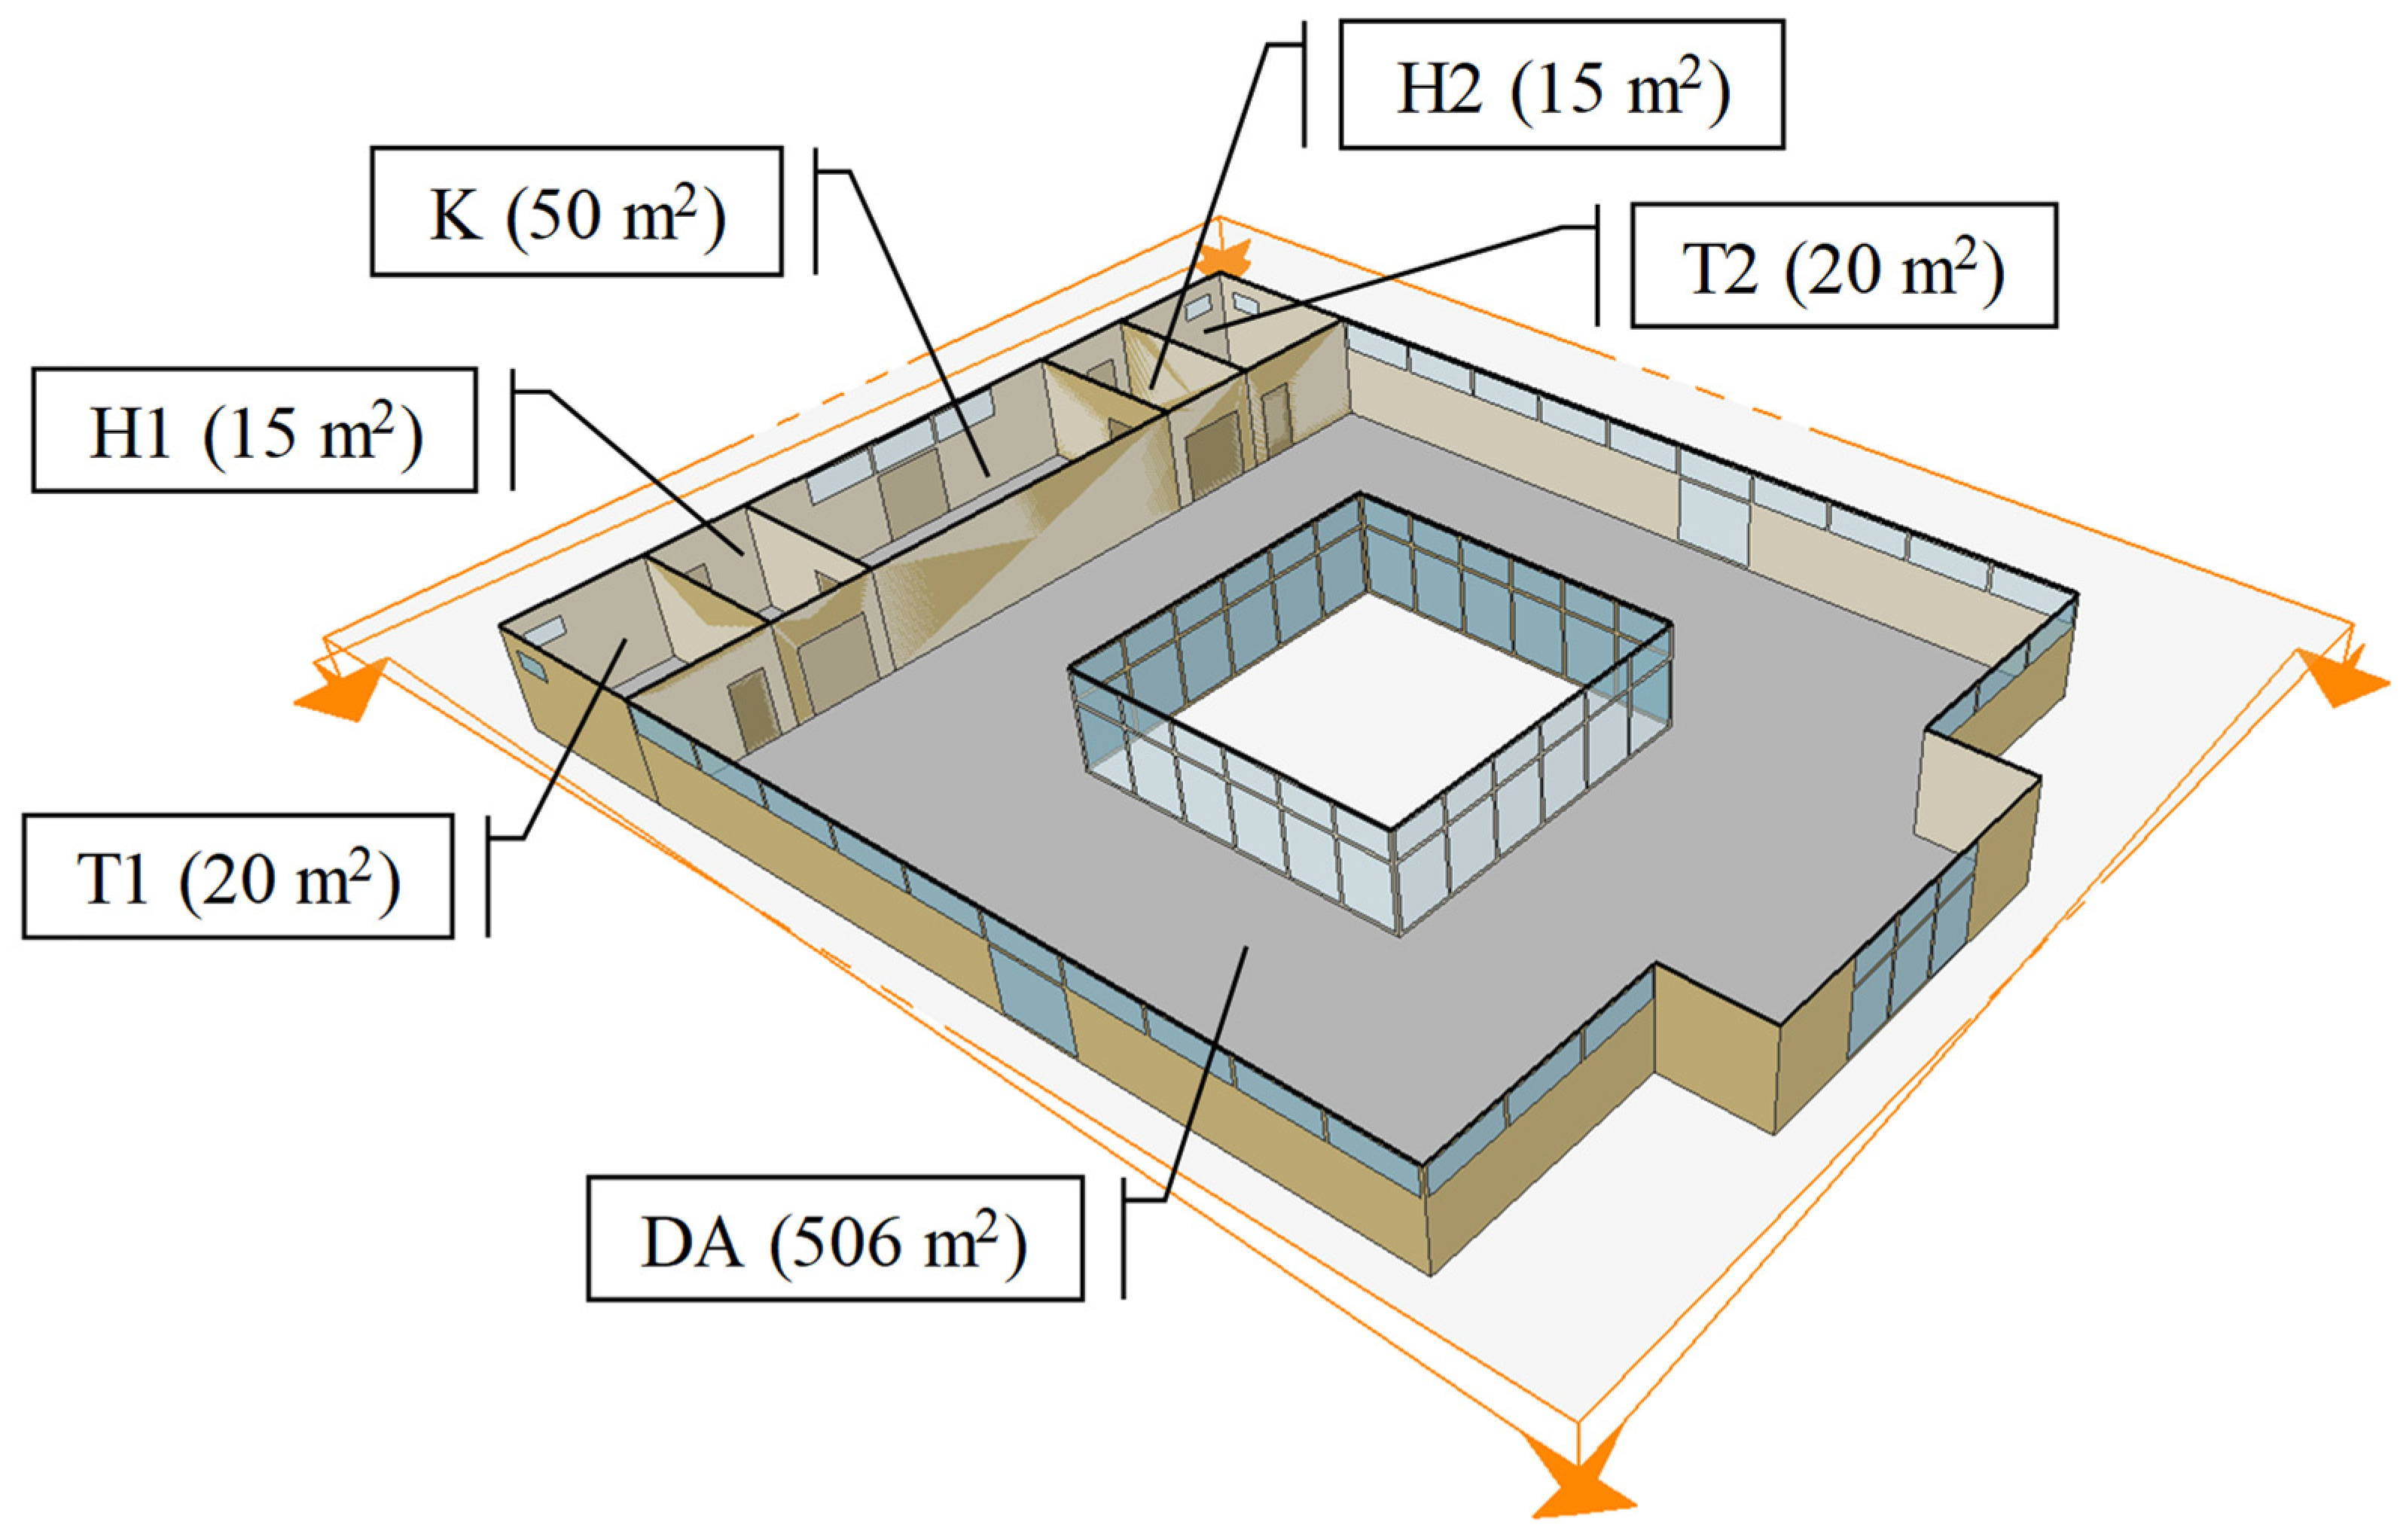
A 3D view of the analyzed non-residential building (with characteristic dimensions) is presented in Figure 1. A cross-sectional view of the same building (with room layouts and an appropriate description) is shown in Figure 2.
From Figure 1 and Figure 2, it can be easily concluded that the RB is an atrium-type building characterized by a rectangular base, an open core (courtyard) in the central part in a square shape, and an exposed south facade wall with an entrance door. The atrium space, as an architectural concept, combines aesthetic value and functionality through the optimal use of daylight (through the depth of the building), as well as natural ventilation (chimney effect), while at the same time providing a temperature buffer, acoustic peace (by separation from the environment), a feeling of warmth, and a spacious connection with the interior and exterior.

2.2. Boundary Conditions

The external construction elements of the RB (external walls, external floors, flat roofs, external windows, external door, Figure 1 and Figure 2) are synchronized with the Serbian Rulebook on Energy Efficiency of New Buildings [4]. This means that the values of the heat transfer coefficient U [W/(m2K)] for all the mentioned building elements are within the permitted limits (Table 1).
The Rulebook from [4], among other things, defines the maximum permissible values of internal heat gains for all building types. Accordingly, the following Table (Table 2) shows the limit values for RBs. Based on these parameters, the number of people, the technical characteristics of the internal lighting, the electric equipment, and the water heating for all zones are presented in Table 3, while the hourly usage schedules are presented in Table 4.
To provide internal artificial lighting, all zones are equipped with luminous and louvered ceiling lighting [40,41]: the fraction radiant is FR = 0.37, the fraction visible is FV = 0.18, the return air fraction is RAF = 0, and the convective heat gain is CHG = 0.45. Due to the existence of the atrium space, the RB from Figure 1 is also equipped with external lighting with a total power of Qal,ex = 40 W. Its engagement is time-controlled in accordance with the time of day, i.e., by the intensity of daylight.
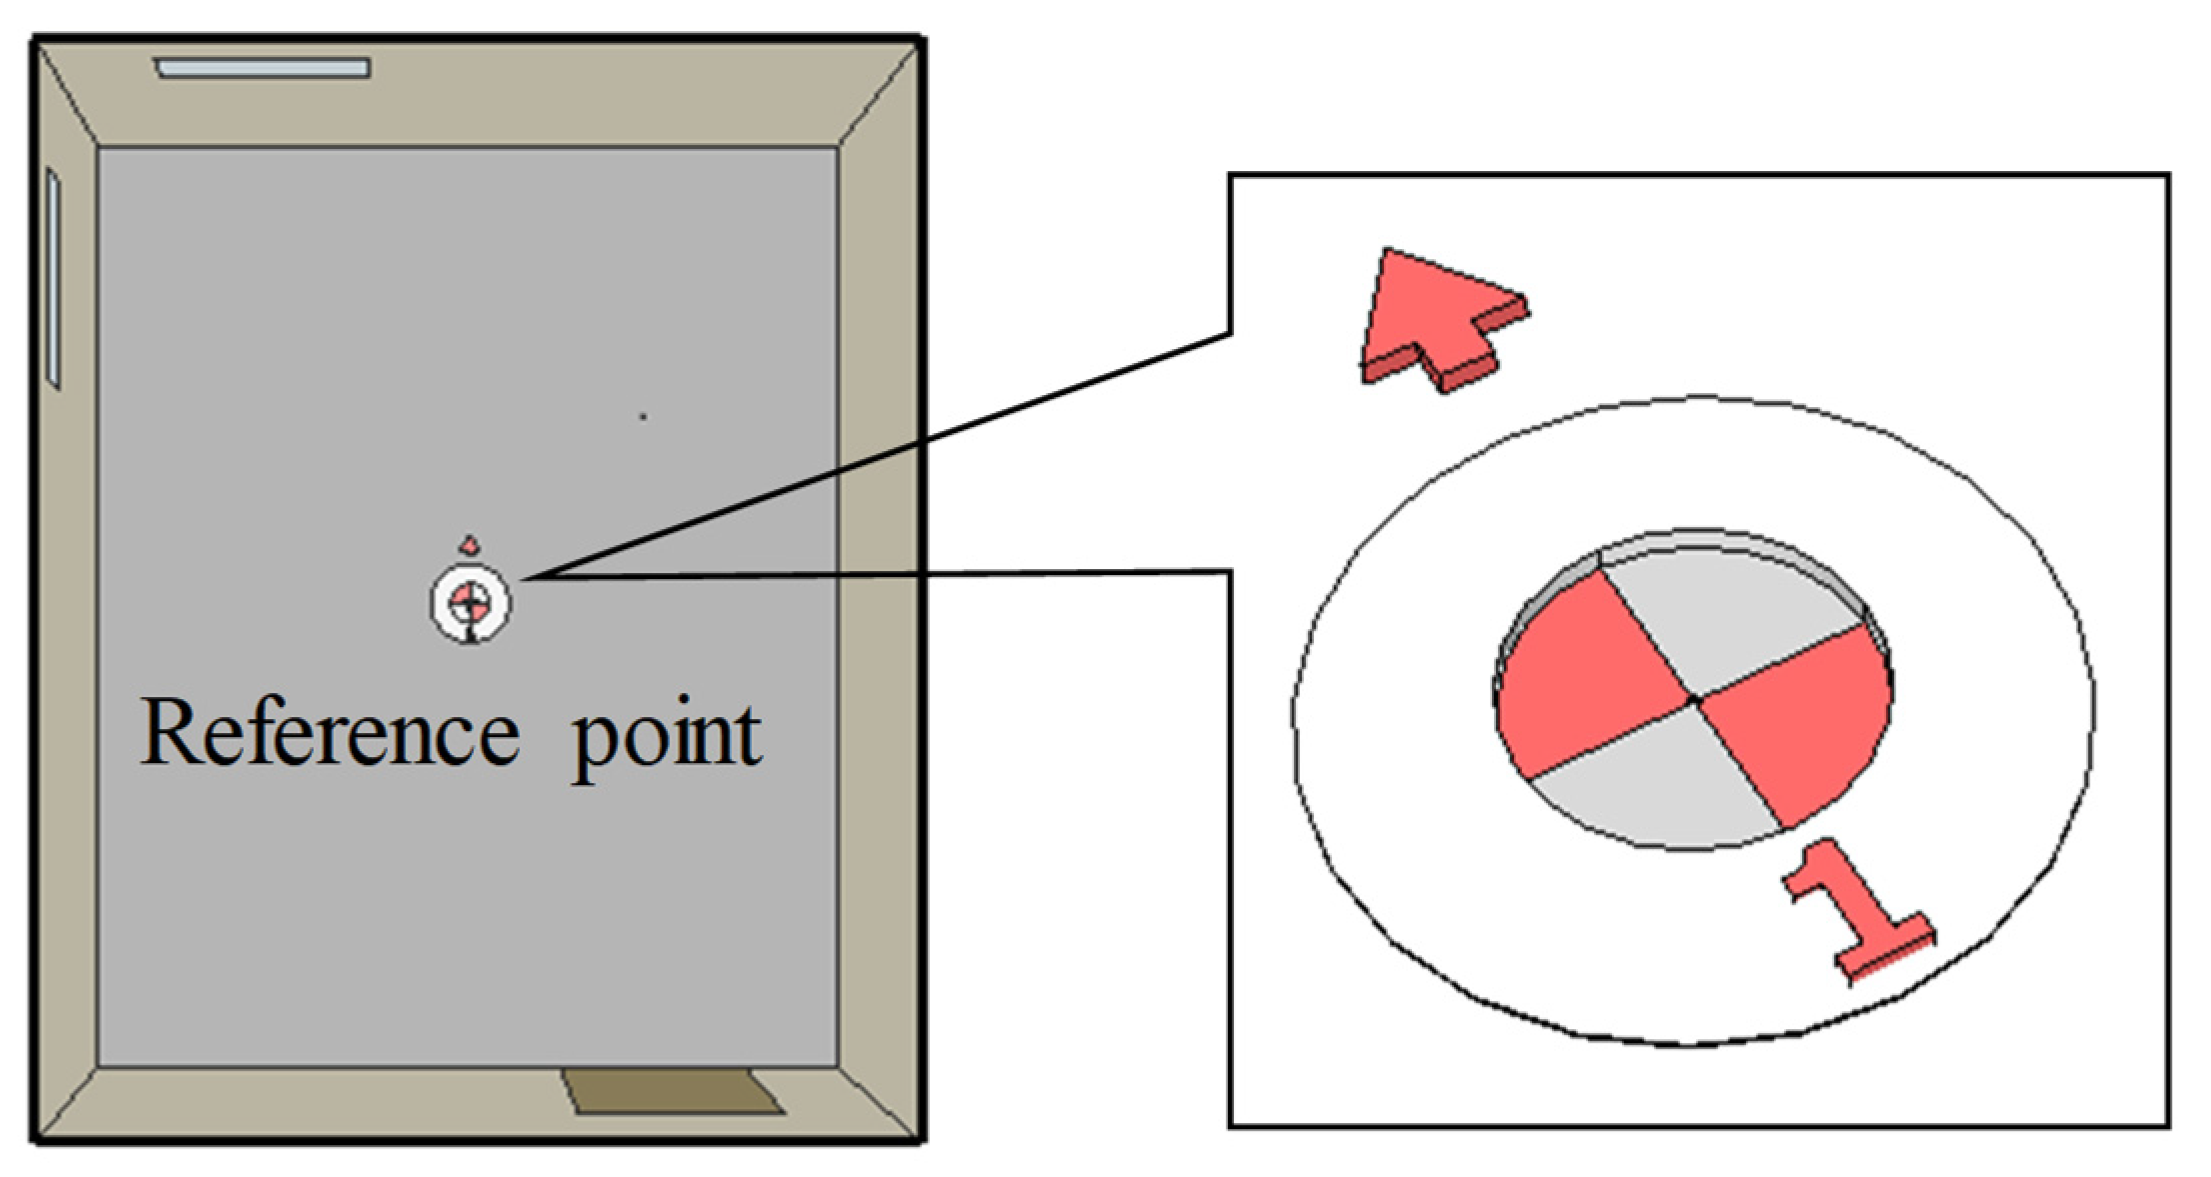
The reference points (Figure 3) for measuring the intensity of internal daylight (based on which the percentage engagement of the luminous and louvered ceiling lighting in the RB is estimated) are located at a height of 0.8 m from the middle of the floor in each zone. Only the DA zone is equipped with two internal daylight sensors, due to its specific shape. Within the defined working framework (Table 4), if the intensity of internal daylight is lower than the Lal,in values (Table 3), it is supplemented by engaging internal artificial lighting.

2.3. Space Cooling System

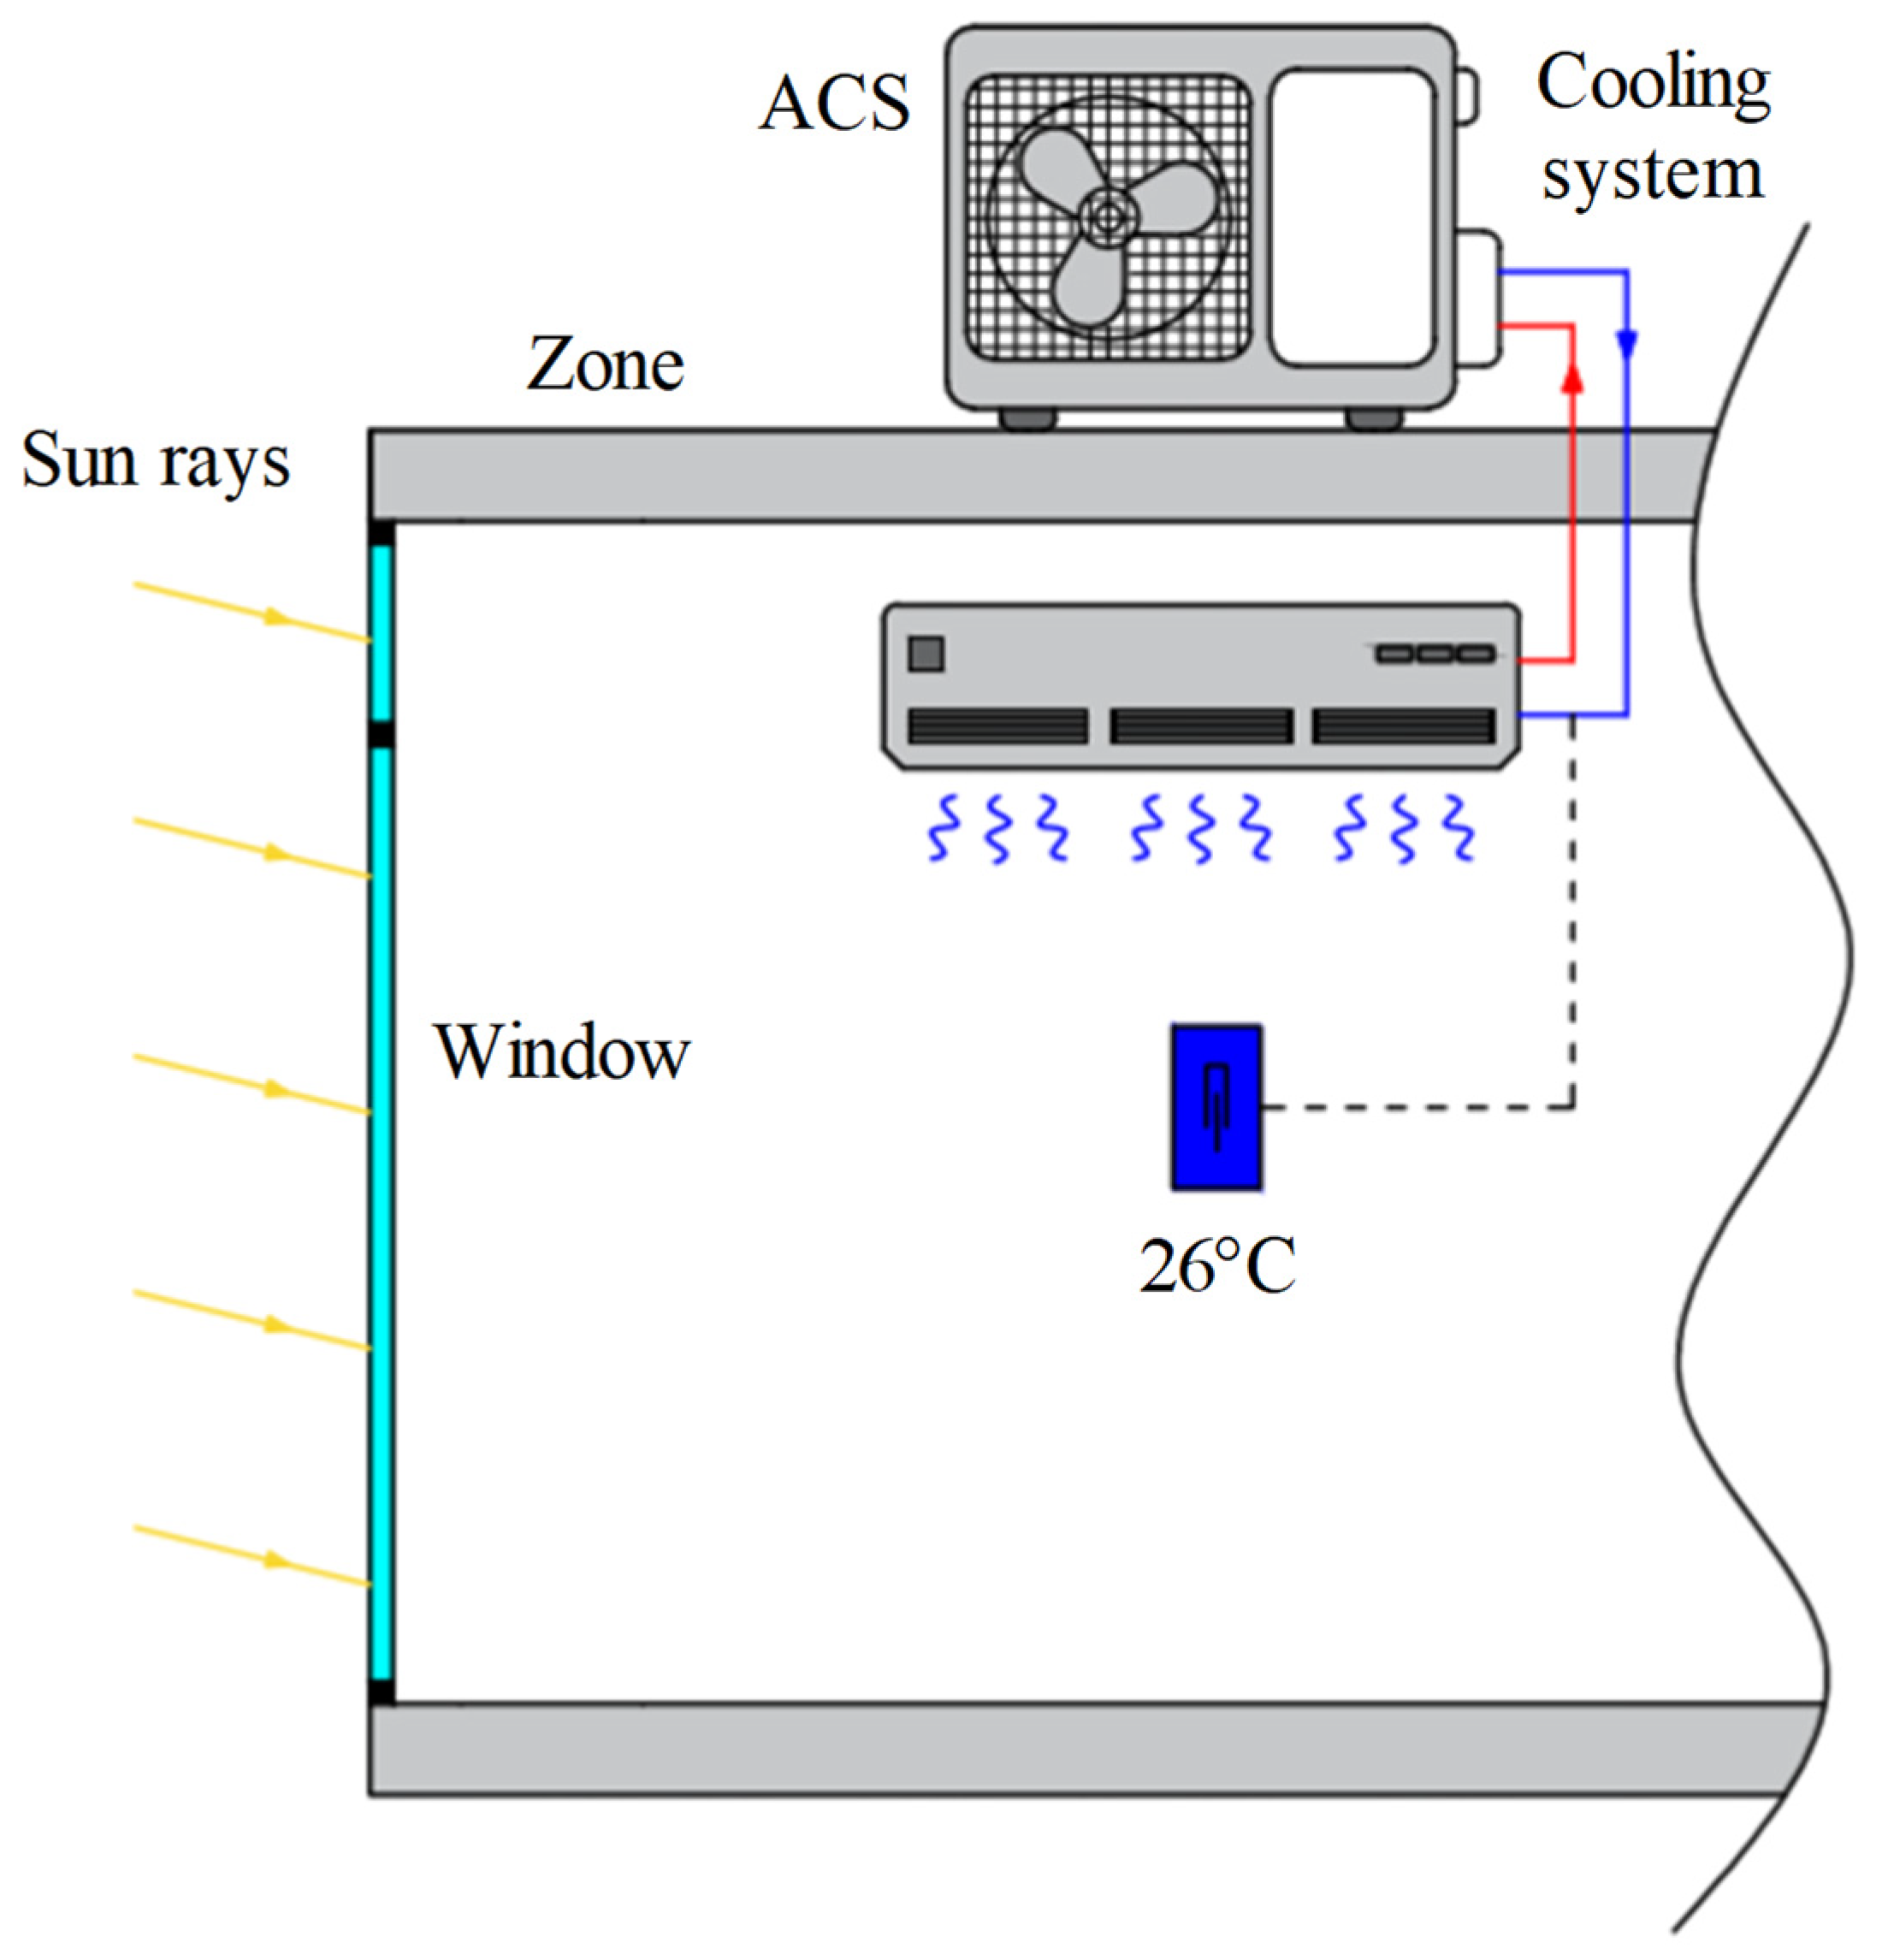
The space cooling system does not allow the temperature in the RB to be tcool > 26 °C (tcool = 26 °C is the cooling set value, Table 2). Each zone is equipped with its own air-conditioning system (ACS). The ACSs are used to maintain thermal comfort during the cooling season (from 15 April to 15 October). The technical characteristics of the selected space cooling system in the RB are described in Table 5, and the operation scheme is shown graphically in Figure 4.

2.4. Location Parameters

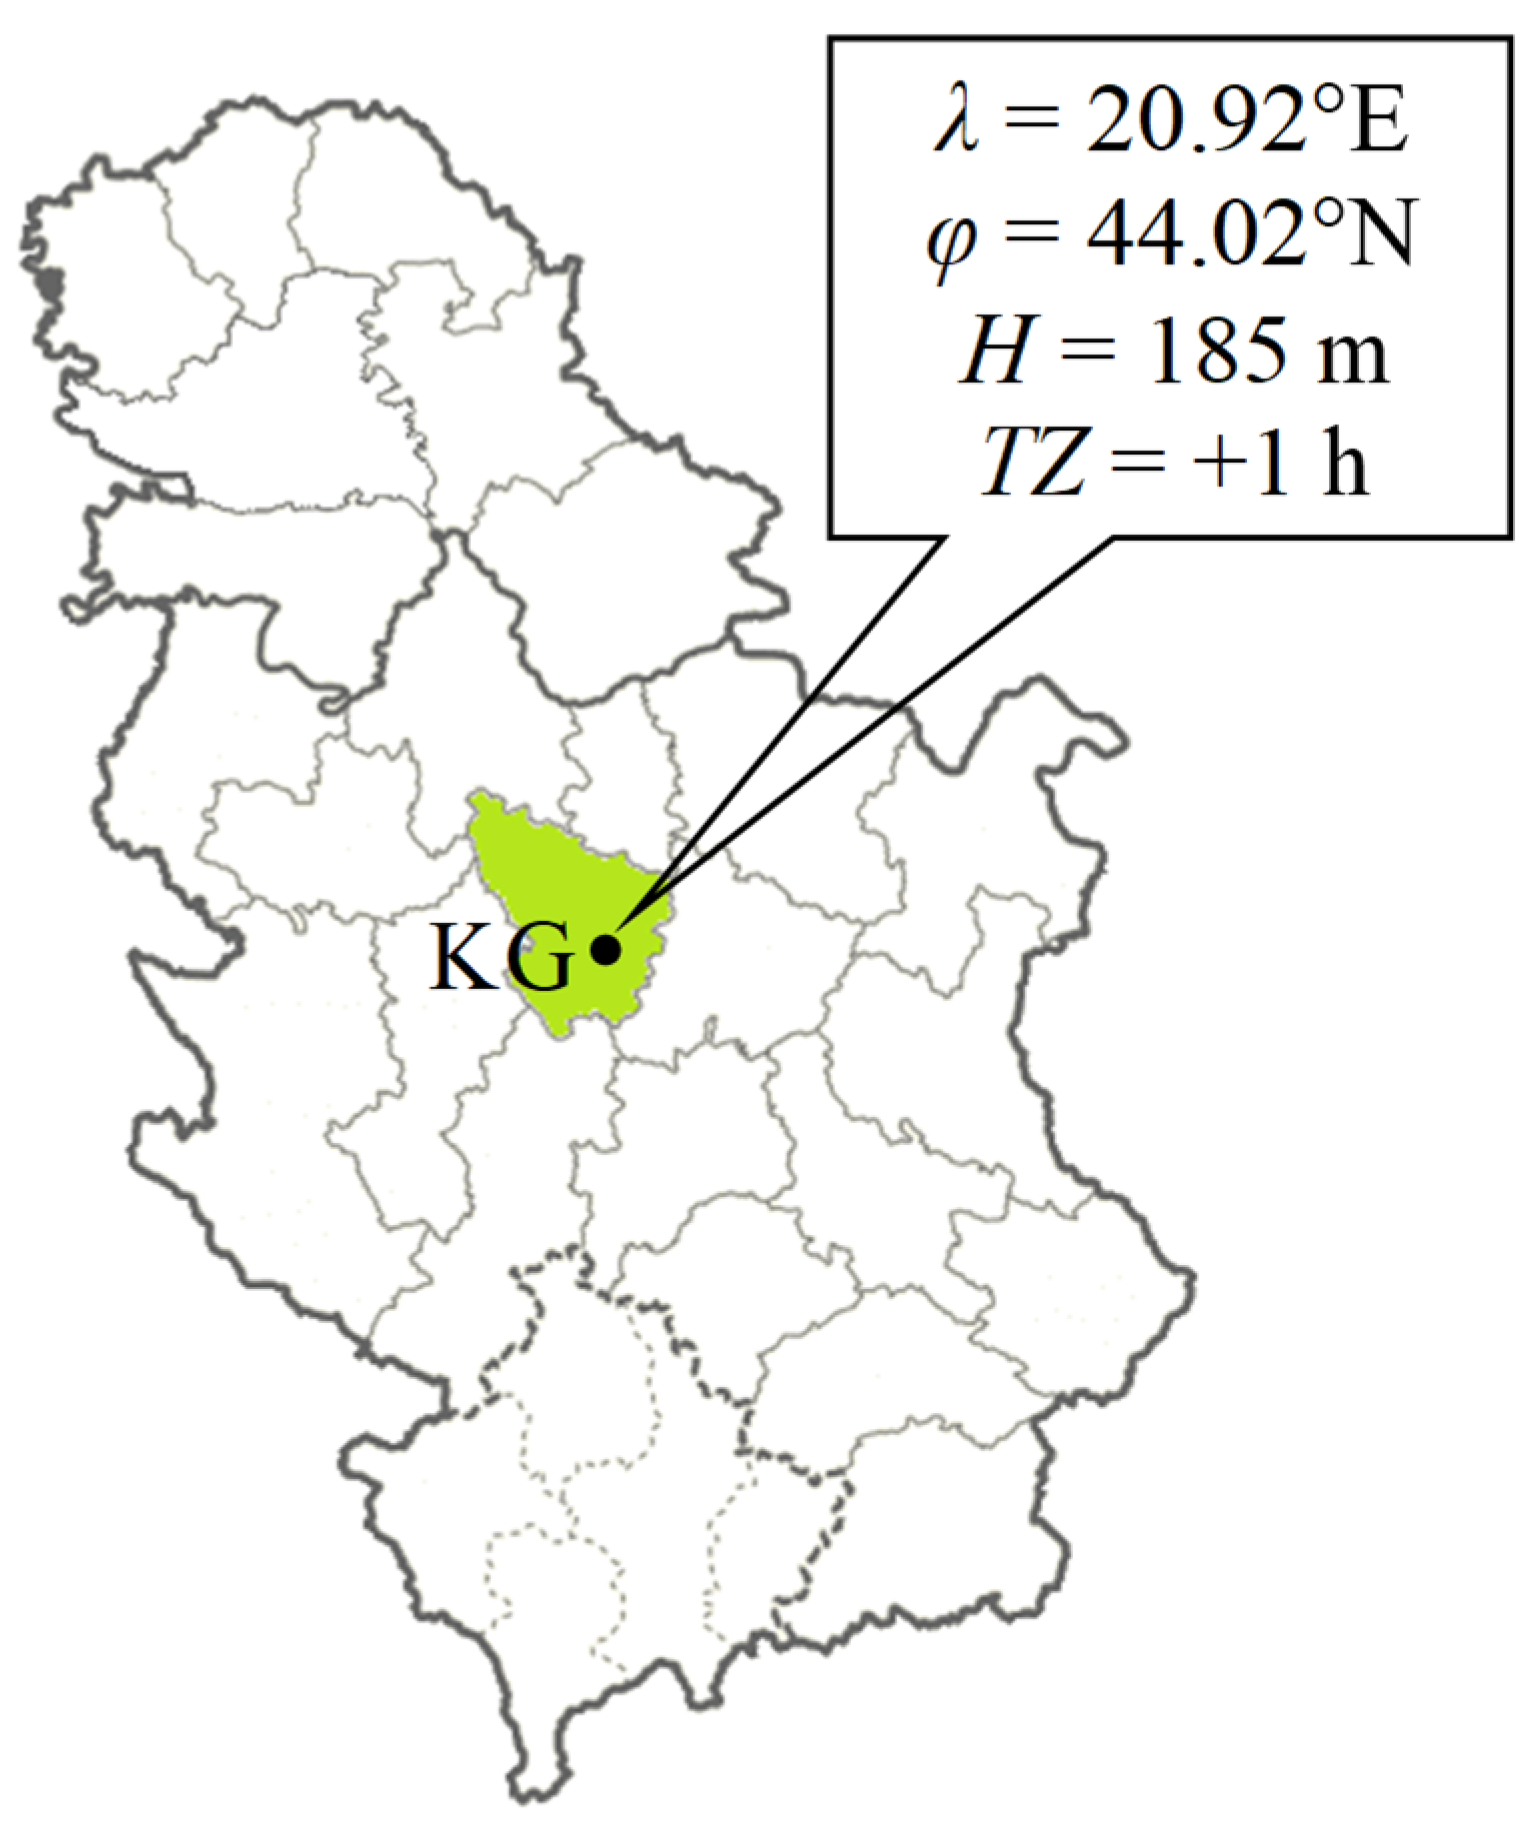
The city of Kragujevac is the economic, administrative, educational, health, cultural and sports center of the Šumadija administrative district (Figure 5). It is located at the intersection of the main state roads and highways, right next to the railway and road corridor 10 that connects Kragujevac with the rest of Serbia.
Kragujevac is 140 km south of Belgrade and 150 km north of Niš. It covers an area of 835 km2. It was built on the banks of Lepenica, in the Kragujevac basin, where it touches the extreme branches of the Šumadija mountains: Rudnik, Crni Vrh, and Gledić. The climate is moderate continental (Table 6).
The summer season in a moderate continental climate is clearly defined (Table 6). Summers are hot, with temperatures exceeding tair = 35 °C on some days (for example, 9 August). Solar radiation is the most intense during June, July, and August (average monthly values of the Ibeam are higher than 240 W/m2).

2.5. Mathematical Model

2.5.1. Energy Indicators

The main energy indicators for analyzing energy flow in the RB during the summer (cooling) season are the seasonal final Efin [kWh/season] Equation (1) and the primary Epry [kWh/season] Equation (2) energy consumptions:
E f i n = E a l , i n + E a l , e x + E c o o l + E e q + E w h
E p r y = R e l E f i n
where Eal,in [kWh/season] is the seasonal final energy consumption for internal artificial lighting in the restaurant building; Eal,ex [kWh/season] is the seasonal final energy consumption for external artificial lighting in the restaurant building; Ecool [kWh/season] is the seasonal final energy consumption for space cooling in the restaurant building; Eeq [kWh/season] is the seasonal final energy consumption for electric equipment in the restaurant building; Ewh [kWh/season] is the seasonal final energy consumption for water heating in the restaurant building; and Rel [–] is the primary conversion factor for electricity (Rel = 2.5 [4]).

2.5.2. Ecological Indicators

The main ecological indicator, in this case, is CO2 emissions at the seasonal level, MCO2 [kg/season]. This indicator can be determined using Equation (3):
M C O 2 = g C O 2 E p r y
where gCO2 [kg/kWh] is the specific emissions of greenhouse gases in the restaurant building (gCO2 = 0.53 kg/kWh [4]).

2.5.3. Economic Indicators

Payback period PB [season] is present as Equation (4):
P B = 1.5 Y B M + Y o p Y e l , b e f Y e l , a f t
where YBM [€/season] is the total cost of the bioclimatic measure installation in the restaurant building; Yop [€/season] is the seasonal bioclimatic measure maintenance costs in the restaurant building (it is assumed that they represent 25% of the YBM value); Yel,bef [€/season] is the seasonal electricity cost before implementation of the bioclimatic measure in the restaurant building; Yel,aft [€/season] is the seasonal electricity cost after implementation of the bioclimatic measure in the restaurant building.
Seasonal electricity costs before (Yel,bef [€/season]) and after (Yel,aft [€/season]) the installation of the bioclimatic measures were determined based on monthly bills (Yel,mth [€/month]) using the official application [43] of the Electro Distribution Serbia, and which can be mathematically described by Equations (5) and (6):
Y e l = 1 7 Y e l , m t h
Y e l , m t h = E e l , h t y e l , h t + E e l , l t p e l , l t + E e l , t x
where Eel,ht [kWh/month] is the monthly electricity consumption in higher energy tariff for the restaurant building; yel,ht [€/kWh] is the monthly specific electricity price in higher energy tariff for the restaurant building (yel,ht = 0.115 €/kWh [43]); Eel,lt [kWh/month] is the monthly electricity consumption in lower energy tariff for the restaurant building; yel,lt [€/kWh] is the monthly specific electricity price in lower energy tariff for the restaurant building (yel,lt = 0.038 €/kWh [43]); and Eel,tx [€/month] is the monthly fees for the restaurant building.
Considering the adopted operating mode of the observed RB, as well as the accompanying profiles of equipment use and internal heat gains (Table 4), the entire Efin in Equation (1) during the analyzed period (from 15 April to 15 October) is consumed exclusively during the higher daily energy tariff period, which, for the geographical zone of Central Serbia (also applies to Kragujevac), lasts from 06:00 h to 22:00 h. Consequently, the share of consumption in the lower daily energy tariff is zero, allowing further simplification of Equation (6).
From the economic aspect, fixed and variable fees within the tariff system (Eel,tx [€/month], Equation (6)) depend on the approved (engaged) power of the building, as well as on its purpose and voltage level. Since the RB belongs to the service sector (non-residential/commercial buildings), it is classified in the power system as a commercial low-voltage customer. This categorization directly conditions the application of specific tariff rates for engaged power and the calculation of energy, which was taken into account in detail during the formation of an economic model for evaluating the justification of the application of passive cooling measures.

3. Bioclimatic Measures

To improve the energy performance of the RB (Figure 1 and Figure 2), this paper considered eight bioclimatic measures, classified into three basic categories: horizontal overhangs (Table 7), horizontal pergolas (Table 8), and deciduous vegetation (Table 9).
All the considered measures were created by the combined application of architectural, urban planning, construction, and engineering techniques on the external side of the building, more precisely in the atrium space. The main goal was to passively use the local climate conditions, i.e., the microlocation parameters (such as the Sun, wind, and vegetation), so that during the summer season, i.e., the cooling season (from 15 April to 15 October) final and primary energy consumption for space cooling would be reduced, as well as CO2 emissions, while maintaining optimal conditions for comfort and convenience.
In accordance with the principles of sustainable and green architecture, horizontal overhangs and pergolas are made of wooden boards. The thickness, density, and specific price of this construction material are [46] δBM = 0.024 m, ρBM = 400 kg/m3, and yBM ≈ 328 €/(m3season).
All modified RBs equipped with bioclimatic measures were compared with the initial RB model (Figure 1 and Figure 2). The initial model was not equipped with any bioclimatic measure, so it represents the reference sample (simulation scenario S0).

4. Results

4.1. Verification of the Initial Numerical Model

The verification of the EnergyPlus numerical model of the RB using the NSP [38] can be carried out through a comparative analysis of the eheat [kWh/(m2a)] calculation and the building’s energy class. The similarity lies in the fact that both software use the same input data (Table 10) and an official methodology for calculating eheat [kWh/(m2a)]. Based on this, the building is assigned an energy class (from A+ to G), according to the Rulebook on Energy Efficiency of Buildings [4] (Table 11).
On the other side, EnergyPlus and the NSP differ in their approach. Namely, the NSP is a stationary or quasi-stationary monthly tool intended for legal certification and energy passporting, while EnergyPlus is a dynamic software that simulates a building’s thermal behavior on an hourly basis, accounting for complex internal gains, thermal inertia, and transient regimes.
When the similarities and differences between the EnergyPlus and the NSP software are taken into account (Table 10 and Table 11), based on the obtained results, it can be concluded that they are mutually complementary and compatible, as well as equally applicable in practice. The NSP can be used to quickly determine the base state and the legal energy class, while EnergyPlus is used for more detailed calculations, optimization, and testing of complex thermo-technical systems.

4.2. Energy Consumption and Greenhouse Emissions

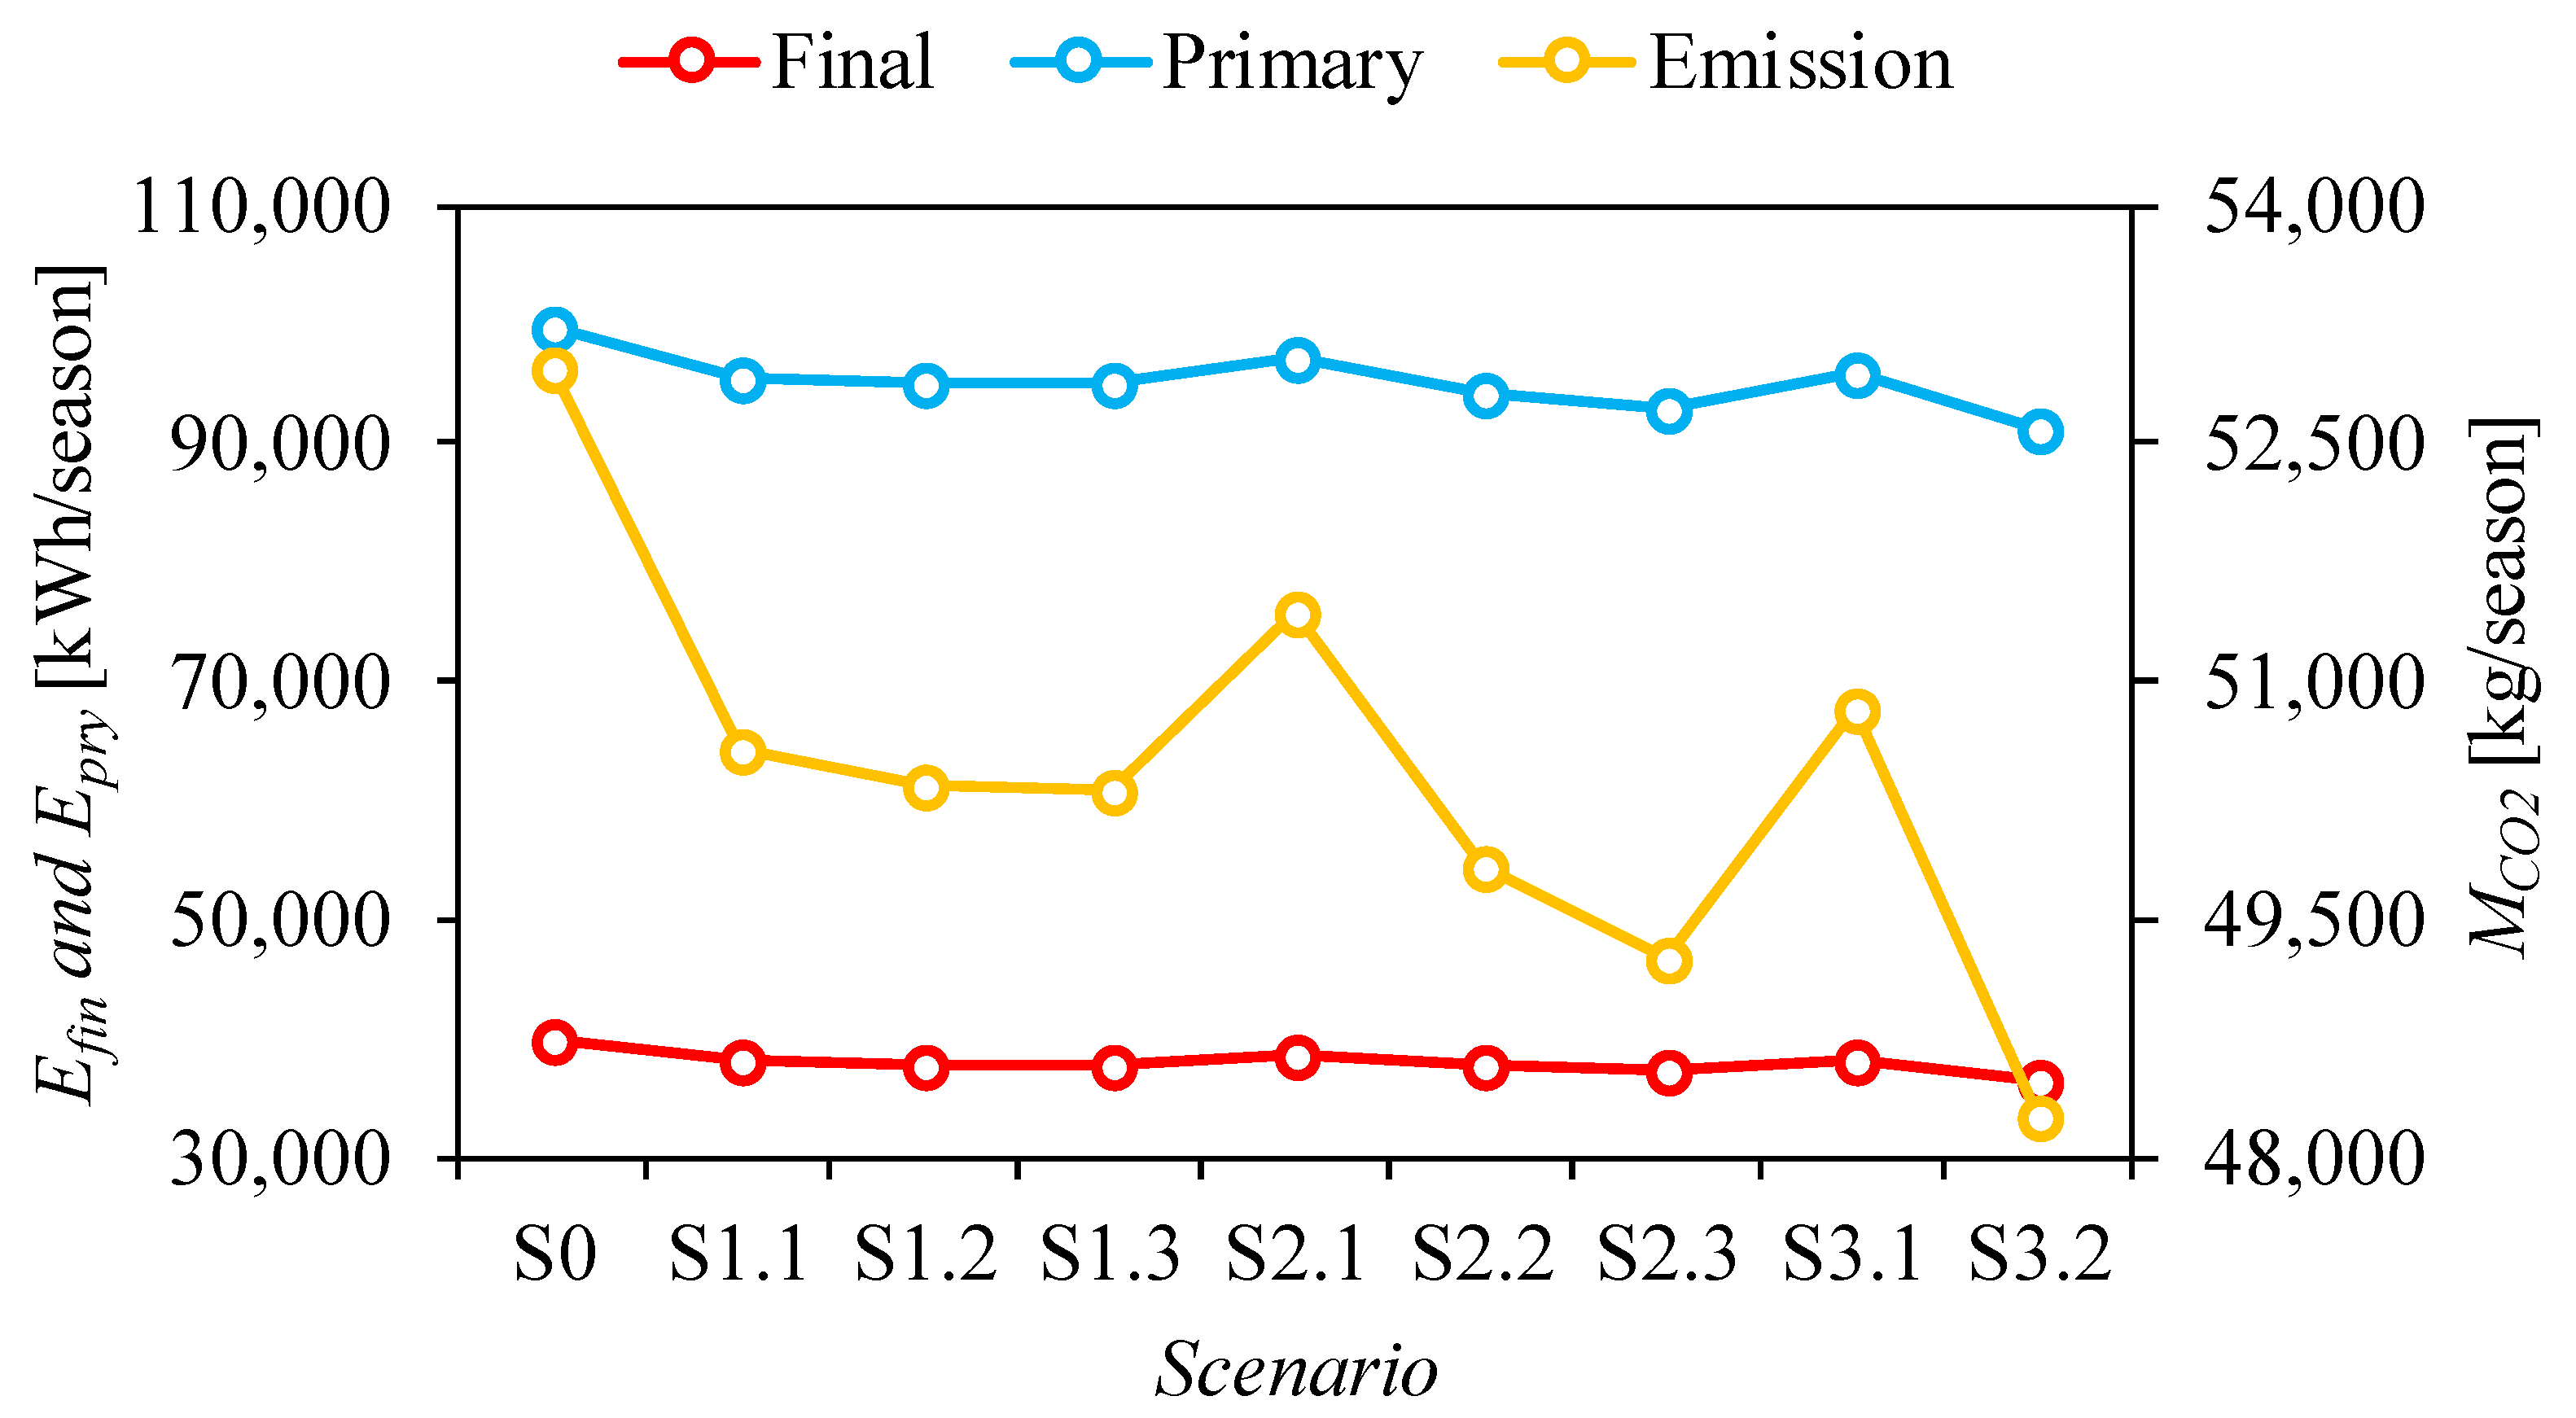
The diagram in Figure 6 shows the seasonal final and primary energy consumption, as well as the CO2 emissions, in the RB, depending on the simulation scenarios, i.e., the implemented bioclimatic measures classified into three groups, as described in detail in Table 7, Table 8 and Table 9.
At the beginning, in the case of the reference building model (scenario S0, Figure 6), the seasonal final energy consumption (for all needs Equation (1)) is Efin = 39,985.12 kWh/season (efin = 63.87 kWh/(m2season)), the seasonal primary energy consumption is Epry = 99,962.8 kWh/season (epry = 159.68 kWh/(m2season)), and the seasonal CO2 emissions are mCO2 = 52,980.28 kg/season (84.63 kg/(m2season)).
In the first group of bioclimatic measures (horizontal overhangs, Table 7, Figure 6), the Efin consumption ranged between 37,985.21 kWh/season (for type 2 of the checkerboard facade, scenario S1.3) and 38,168.78 kWh/season (for the full-around facade, scenario S1.1), with another type of the checkerboard facade (scenario S1.2) not deviating much from the best result from this group (37,990.53 kWh/season). In accordance with the above results, the remaining indicators (Epry = 94,963.03 kWh/season and mCO2 = 50,330.4 kg/season) are on the side of scenario S1.3.
The numerical analysis shows that there is no space for improvisation when installing horizontal pergolas. Given that the RB has a specific atrium shape, the wrong orientation of these bioclimatic elements can significantly disrupt the energy balance and the internal thermal comfort (Table 8, Figure 6). In the EW direction, Efin = 38,833.16 kWh/season, Epry = 97,082.9 kWh/season, and mCO2 = 51,453.94 kg/season; in the NS direction, Efin = 37,616.73 kWh/season, Epry = 94,041.83 kWh/season, and mCO2 = 49,842.17 kg/season; and in the combined NS + EW directions, Efin = 37,185.61 kWh/season, Epry = 92,964.03 kWh/season, and mCO2 = 49,270.93 kg/season. In other words, in comparison with the first group of bioclimatic measures, the energy and ecological indicators from scenario S2.1 achieve lower results, and scenarios S2.2 and S2.3 achieve better results.
In the case of the third group of bioclimatic measures (deciduous vegetation, Table 9, Figure 6), the same situation is present in comparison with the first group. If an oak tree were planted in the atrium space, with its full development, the seasonal final energy consumption during the cooling season (from 15 April to 15 October) would be reduced to Efin = 38,366.39 kWh/season, which is more than the consumption in scenarios S1.1, S1.2, and S1.3. In the case of using V. coignetiae, a deciduous climber, the atrium space could be completely covered. This would create a shadow that would reduce the yield of solar radiation (primarily beam solar radiation, Table 6) on the transparent RB elements that form the atrium space, tending to achieve the best results in comparison with all the analyzed cases (Figure 6): Efin = 36,432.64 kWh/season, Epry = 91,081.6 kWh/season, and mCO2 = 48,273.25 kg/season.
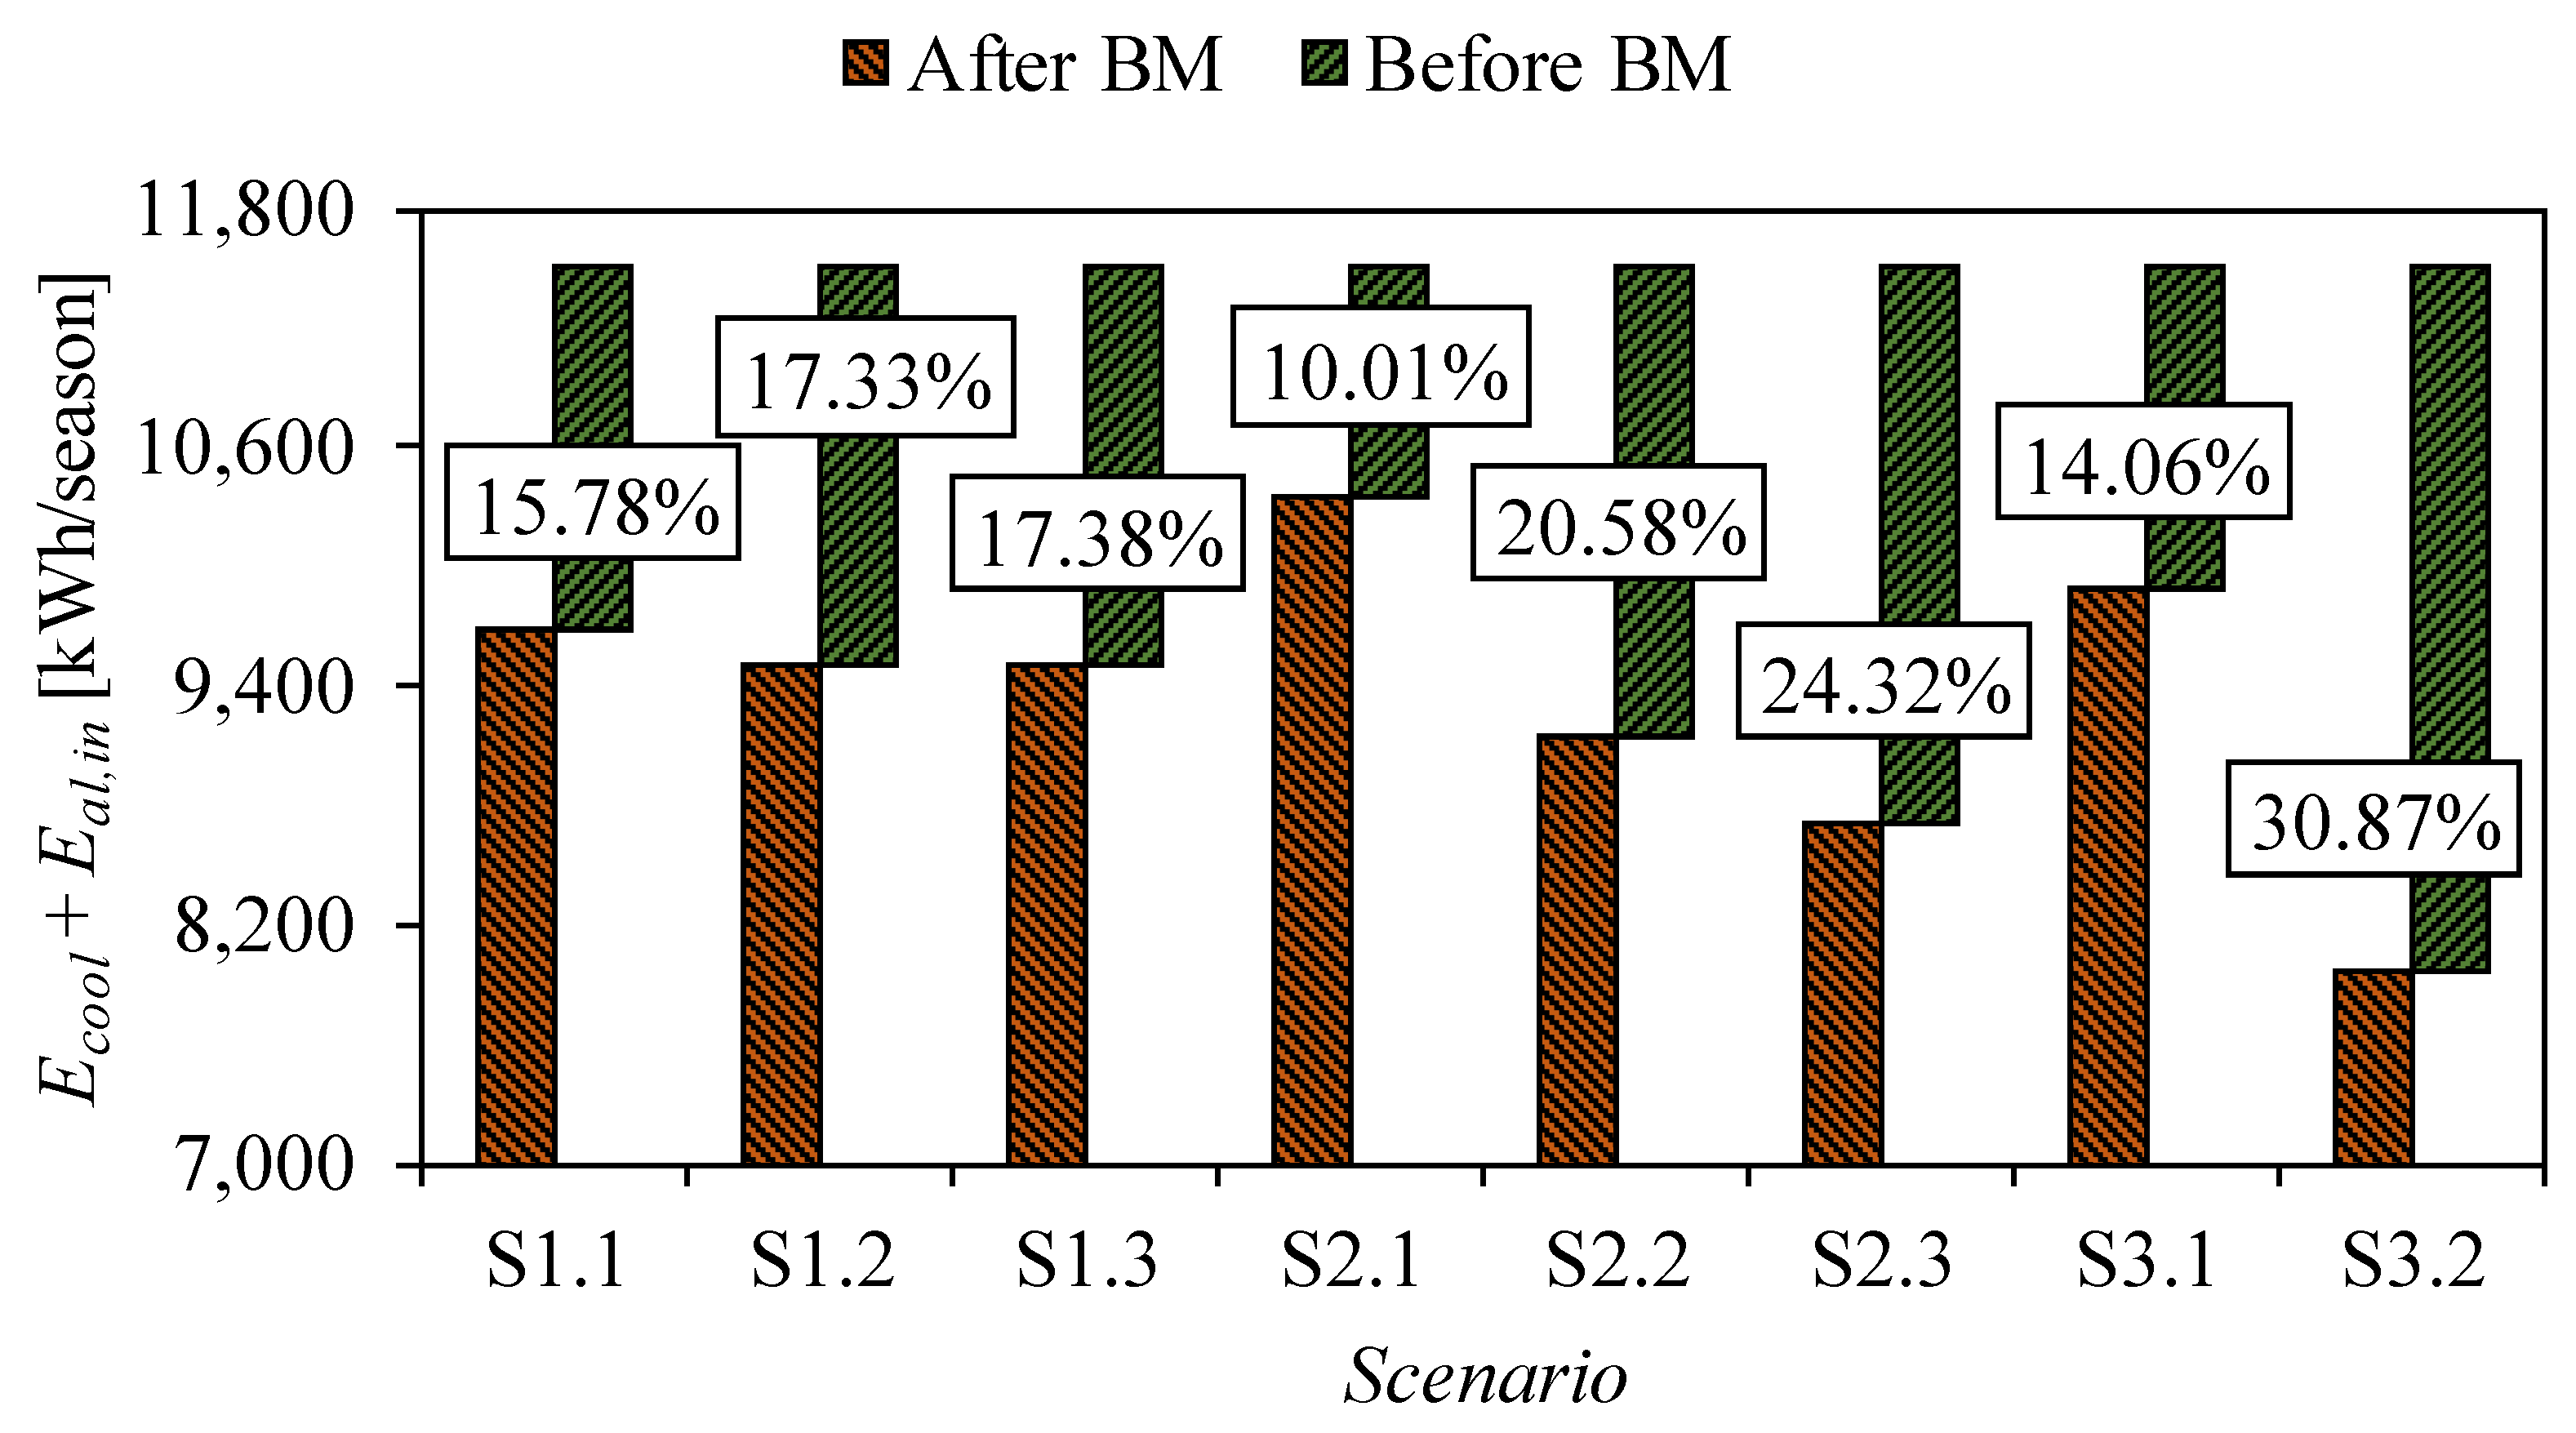
The seasonal balance of the final energy consumption (defined in Equation (1)) affects several indicators, divided into two groups (fixed (Eal,ex, Eeq, and Ewh) and variable (Eal,in and Ecool) parameters). Due to the nature of the investigation, the following diagram (Figure 7) shows the seasonal final energy consumption for space cooling and interior lighting (Ecool + Eal,in) for the eight analyzed cases that are directly compared with the reference model of the RB.
Namely, the parameters Eal,ex, Eeq, and Ewh are omitted from the graphic analysis (Figure 7) because they retain constant values throughout all the simulation scenarios (their influence is of reactive origin). Their immutability stems from the fact that they are defined based on the capacity of the RB and the recommendations from the Rulebook [4]—not based on the weather data and the influence of shading effects. By removing these fixed values, a clearer representation of the actual contribution of the bioclimatic measures is achieved, which is particularly important for this type of analysis in the commercial (non-residential) sector.
Taking into account all of the above, a savings of less than 15% is achieved in scenarios S2.1 (horizontal pergolas in EW direction) and S3.1 (oak as deciduous vegetation). Savings between 15 and 20% are achieved in scenarios from the (whole) first groups: S1.1 (full-around facade horizontal overhangs), S1.2 (NE + SW horizontal overhangs), and S1.3 (NW + SE horizontal overhangs). Savings between 20 and 25% are achieved in the S2.2 (20.28%) and S2.3 (24.32%) scenarios. Savings greater than 25% are achieved only in scenario S3.2 (V. coignetiae as deciduous climber), which means that it is also the best option (30.87%) in terms of energy (Figure 6 and Figure 7).

4.3. Economic Analysis

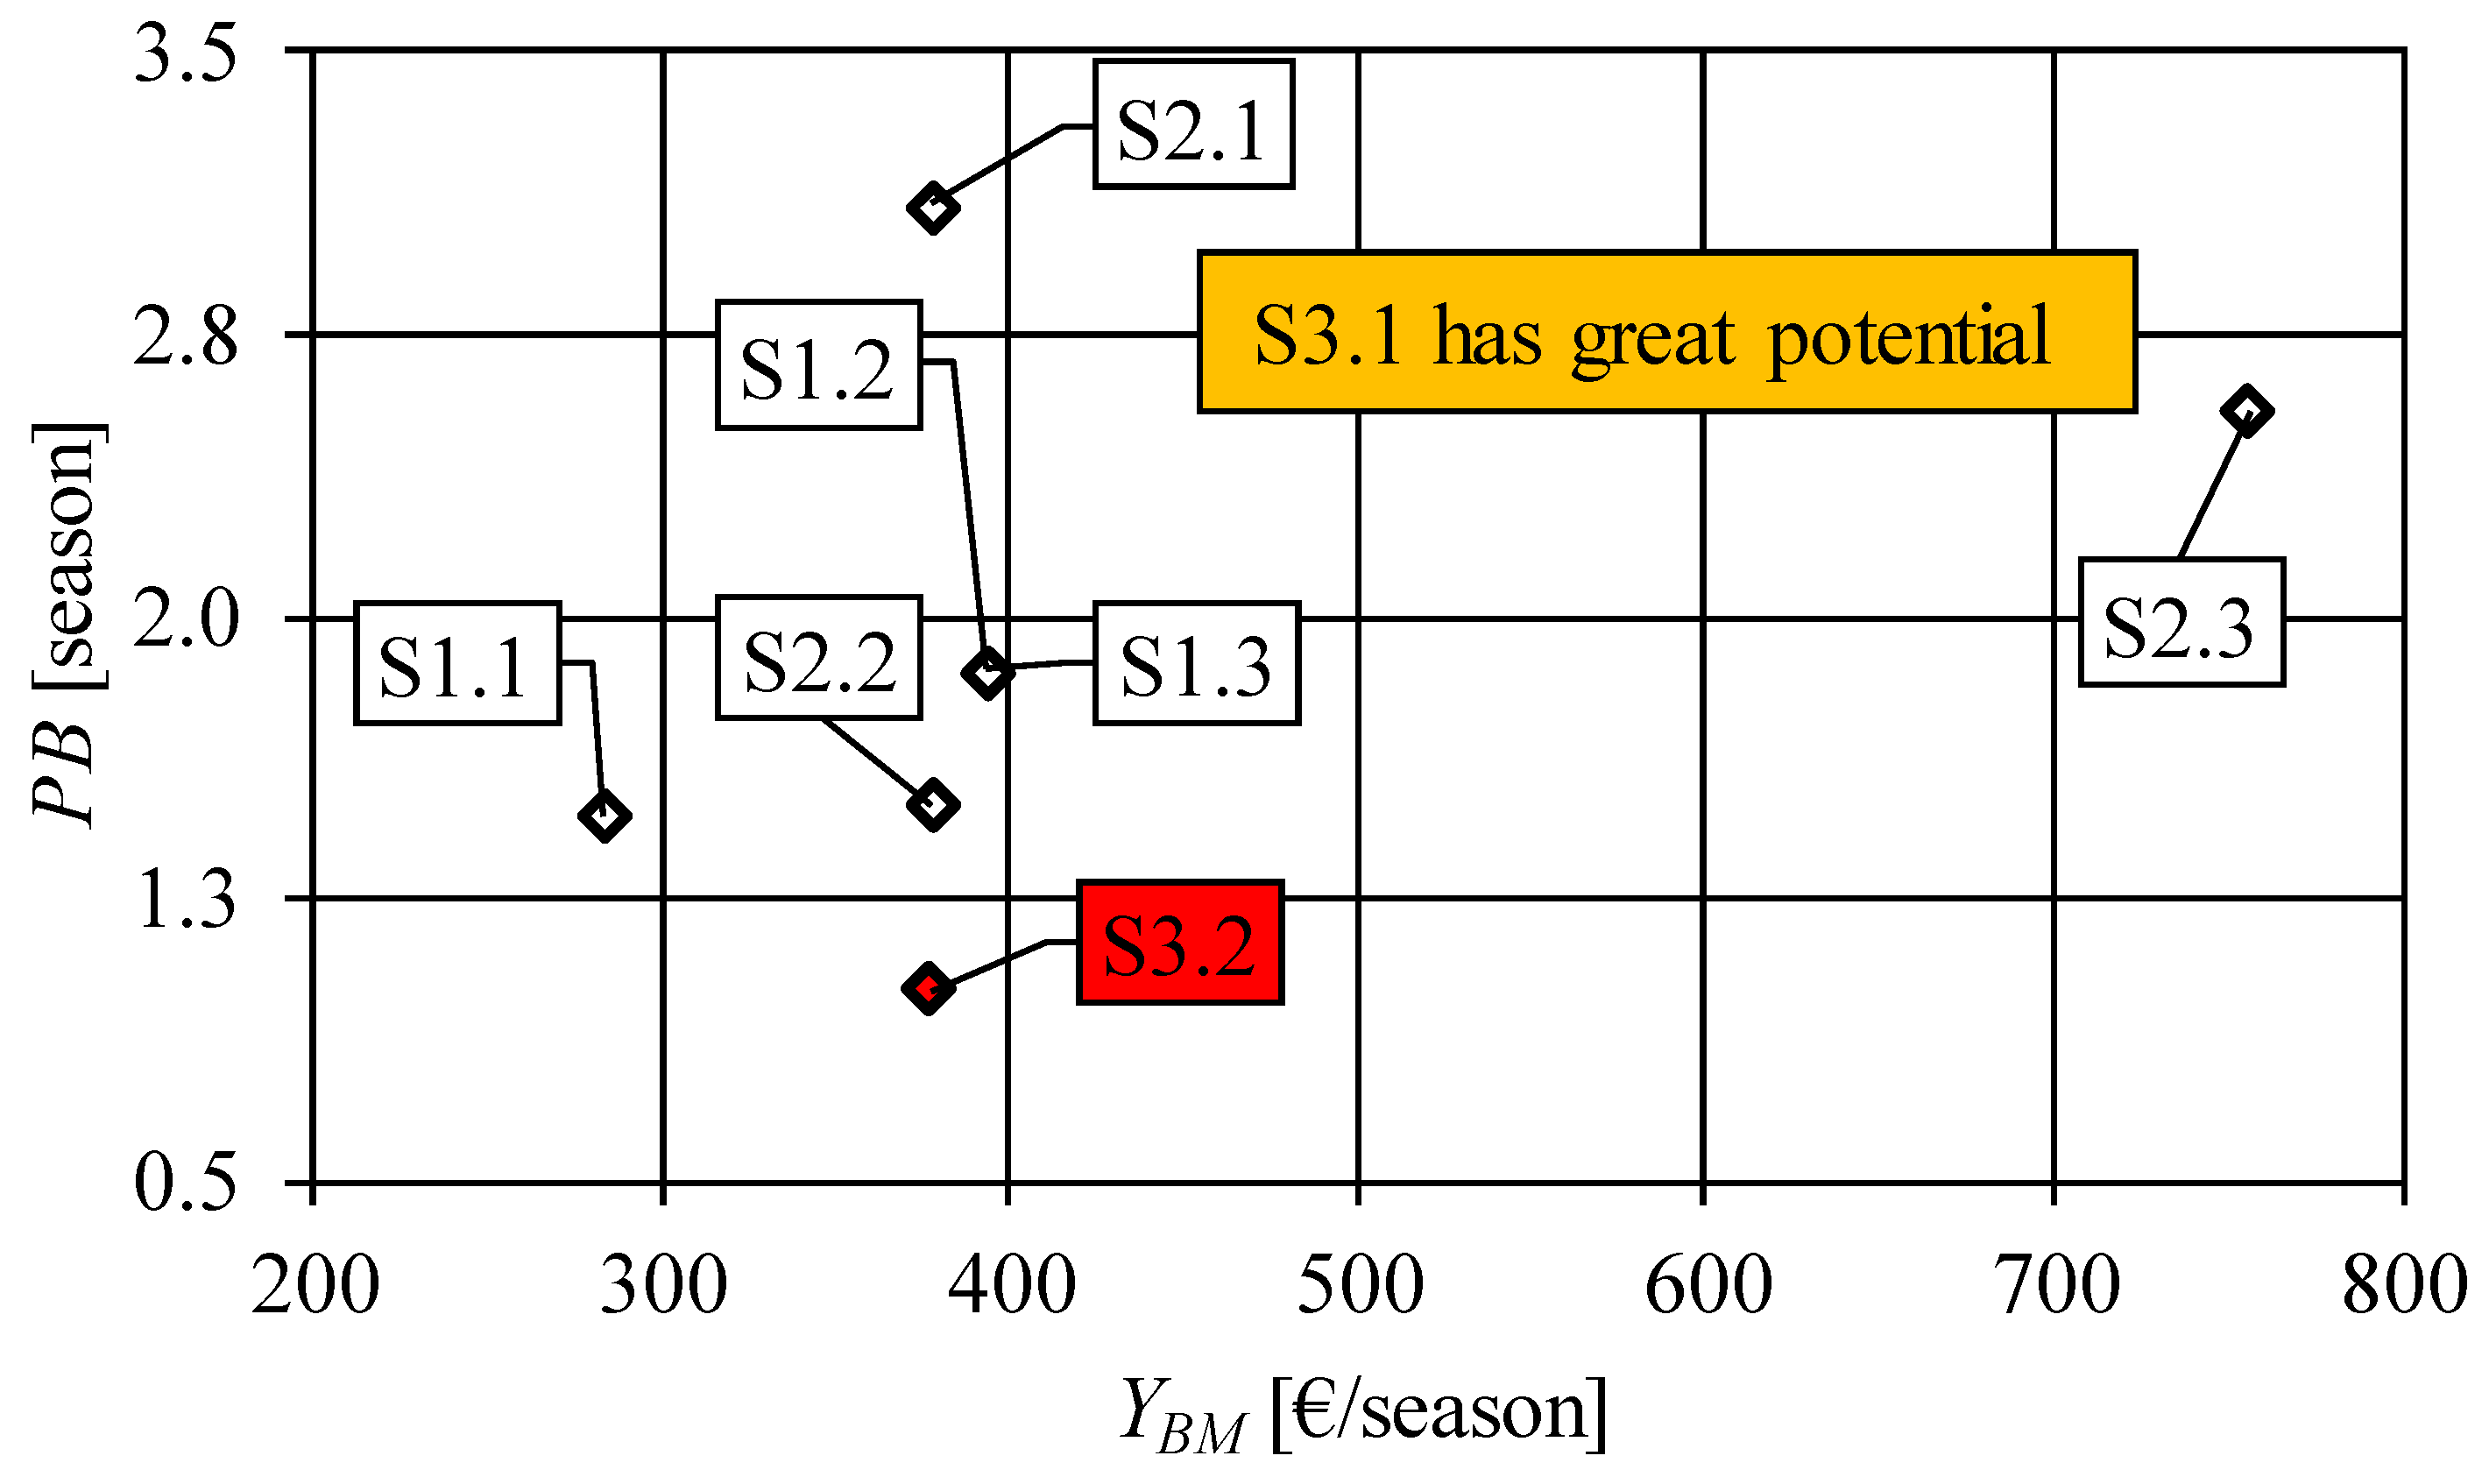
The diagram presented in Figure 8 shows the total cost of the materials YBM [€/season] with installation, seasonal electricity costs (Yel,bef [€/season] and Yel,aft [€/season]), and seasonal maintenance costs Yop [€/season] sublimated in the PB indicator in Equation (4) for implementing the bioclimatic measures in the RB.
Taking into account the specificities of costs from Table 7, Table 8 and Table 9, as well as Equation (4), the economic analysis shows that the measure proposed in scenario S3.2 has a tendency to pay off the fastest (PB = one season). For example, the bioclimatic measure from scenario S2.1 needs more than 3.09 summer seasons to achieve the same effect.
Generally speaking, the payback period of the invested funds, even in the worst case (scenario S2.1), is not long considering the purpose of the building. It should be noted here that there are almost no direct financial investments due to the planting of oak (scenario S3.1) or V. coignetiae (scenario S3.3). Direct funds in the case of deciduous climbers exist because of the need to install supports in order for the adopted type of plant to develop smoothly (Table 9). If this is taken into account, deciduous vegetation is certainly one of the bioclimatic measures with the greatest application potential, in terms of energy, ecology, and economy.

4.4. Thermal Comfort

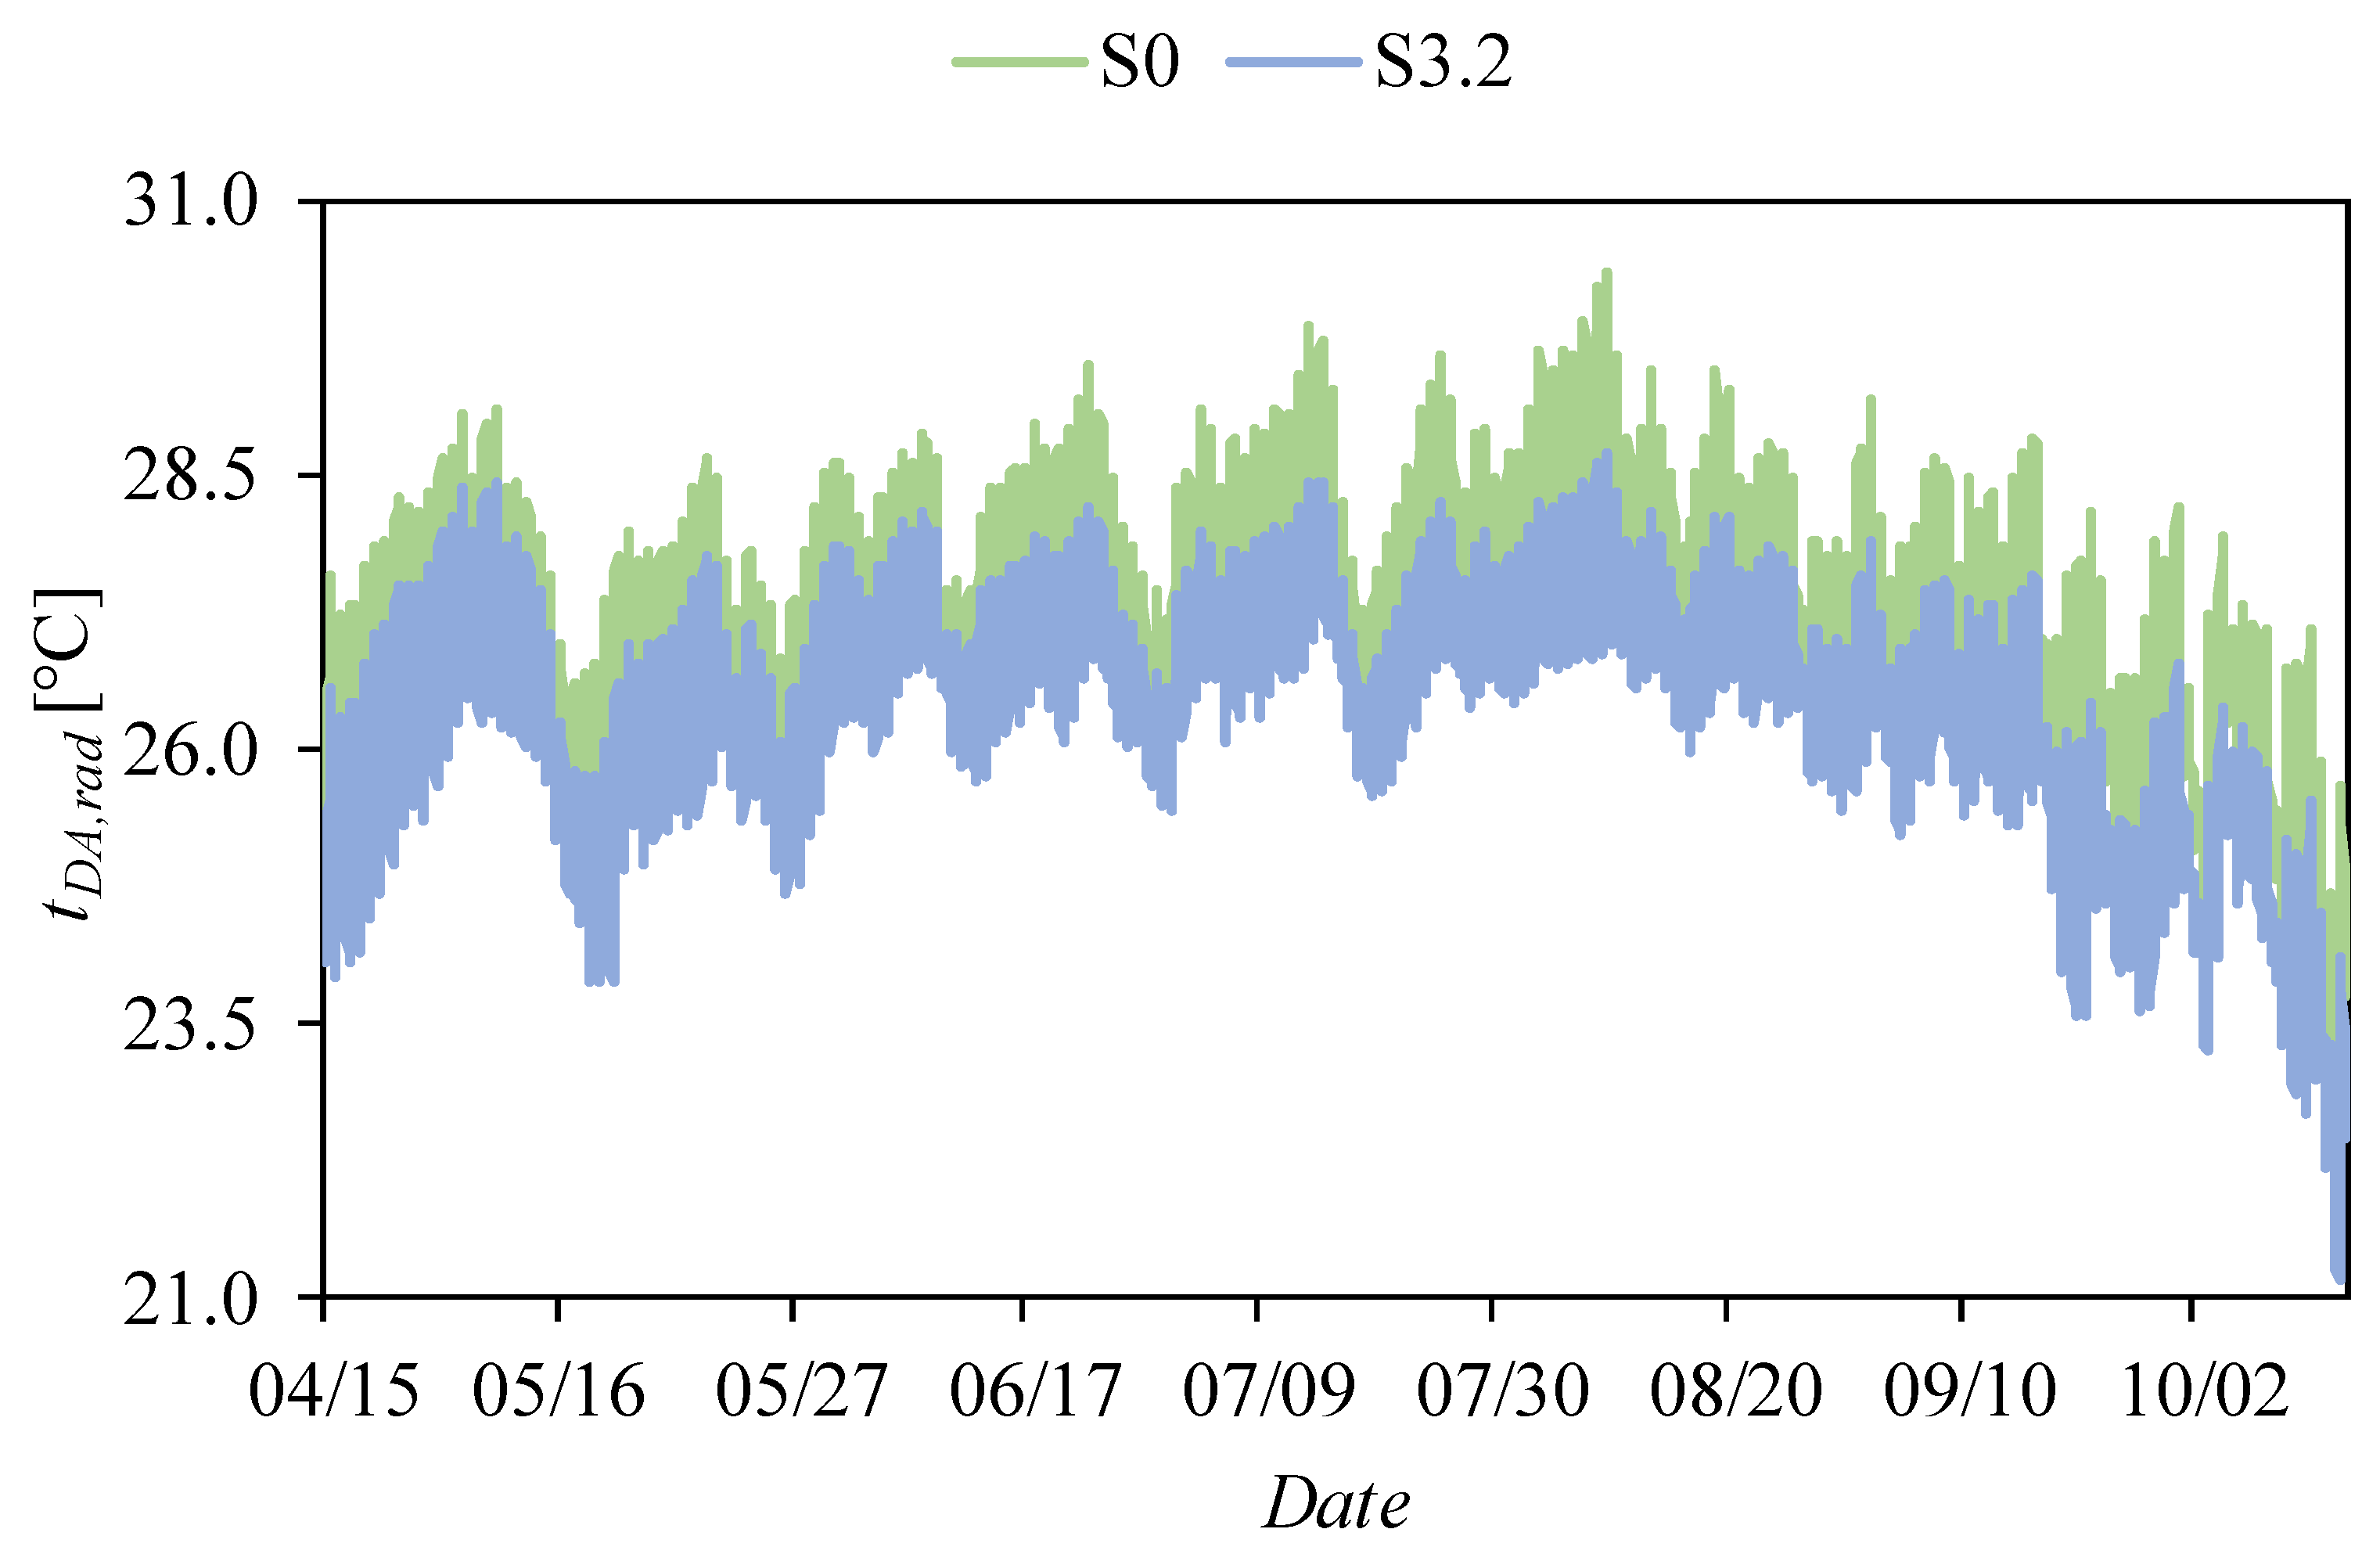
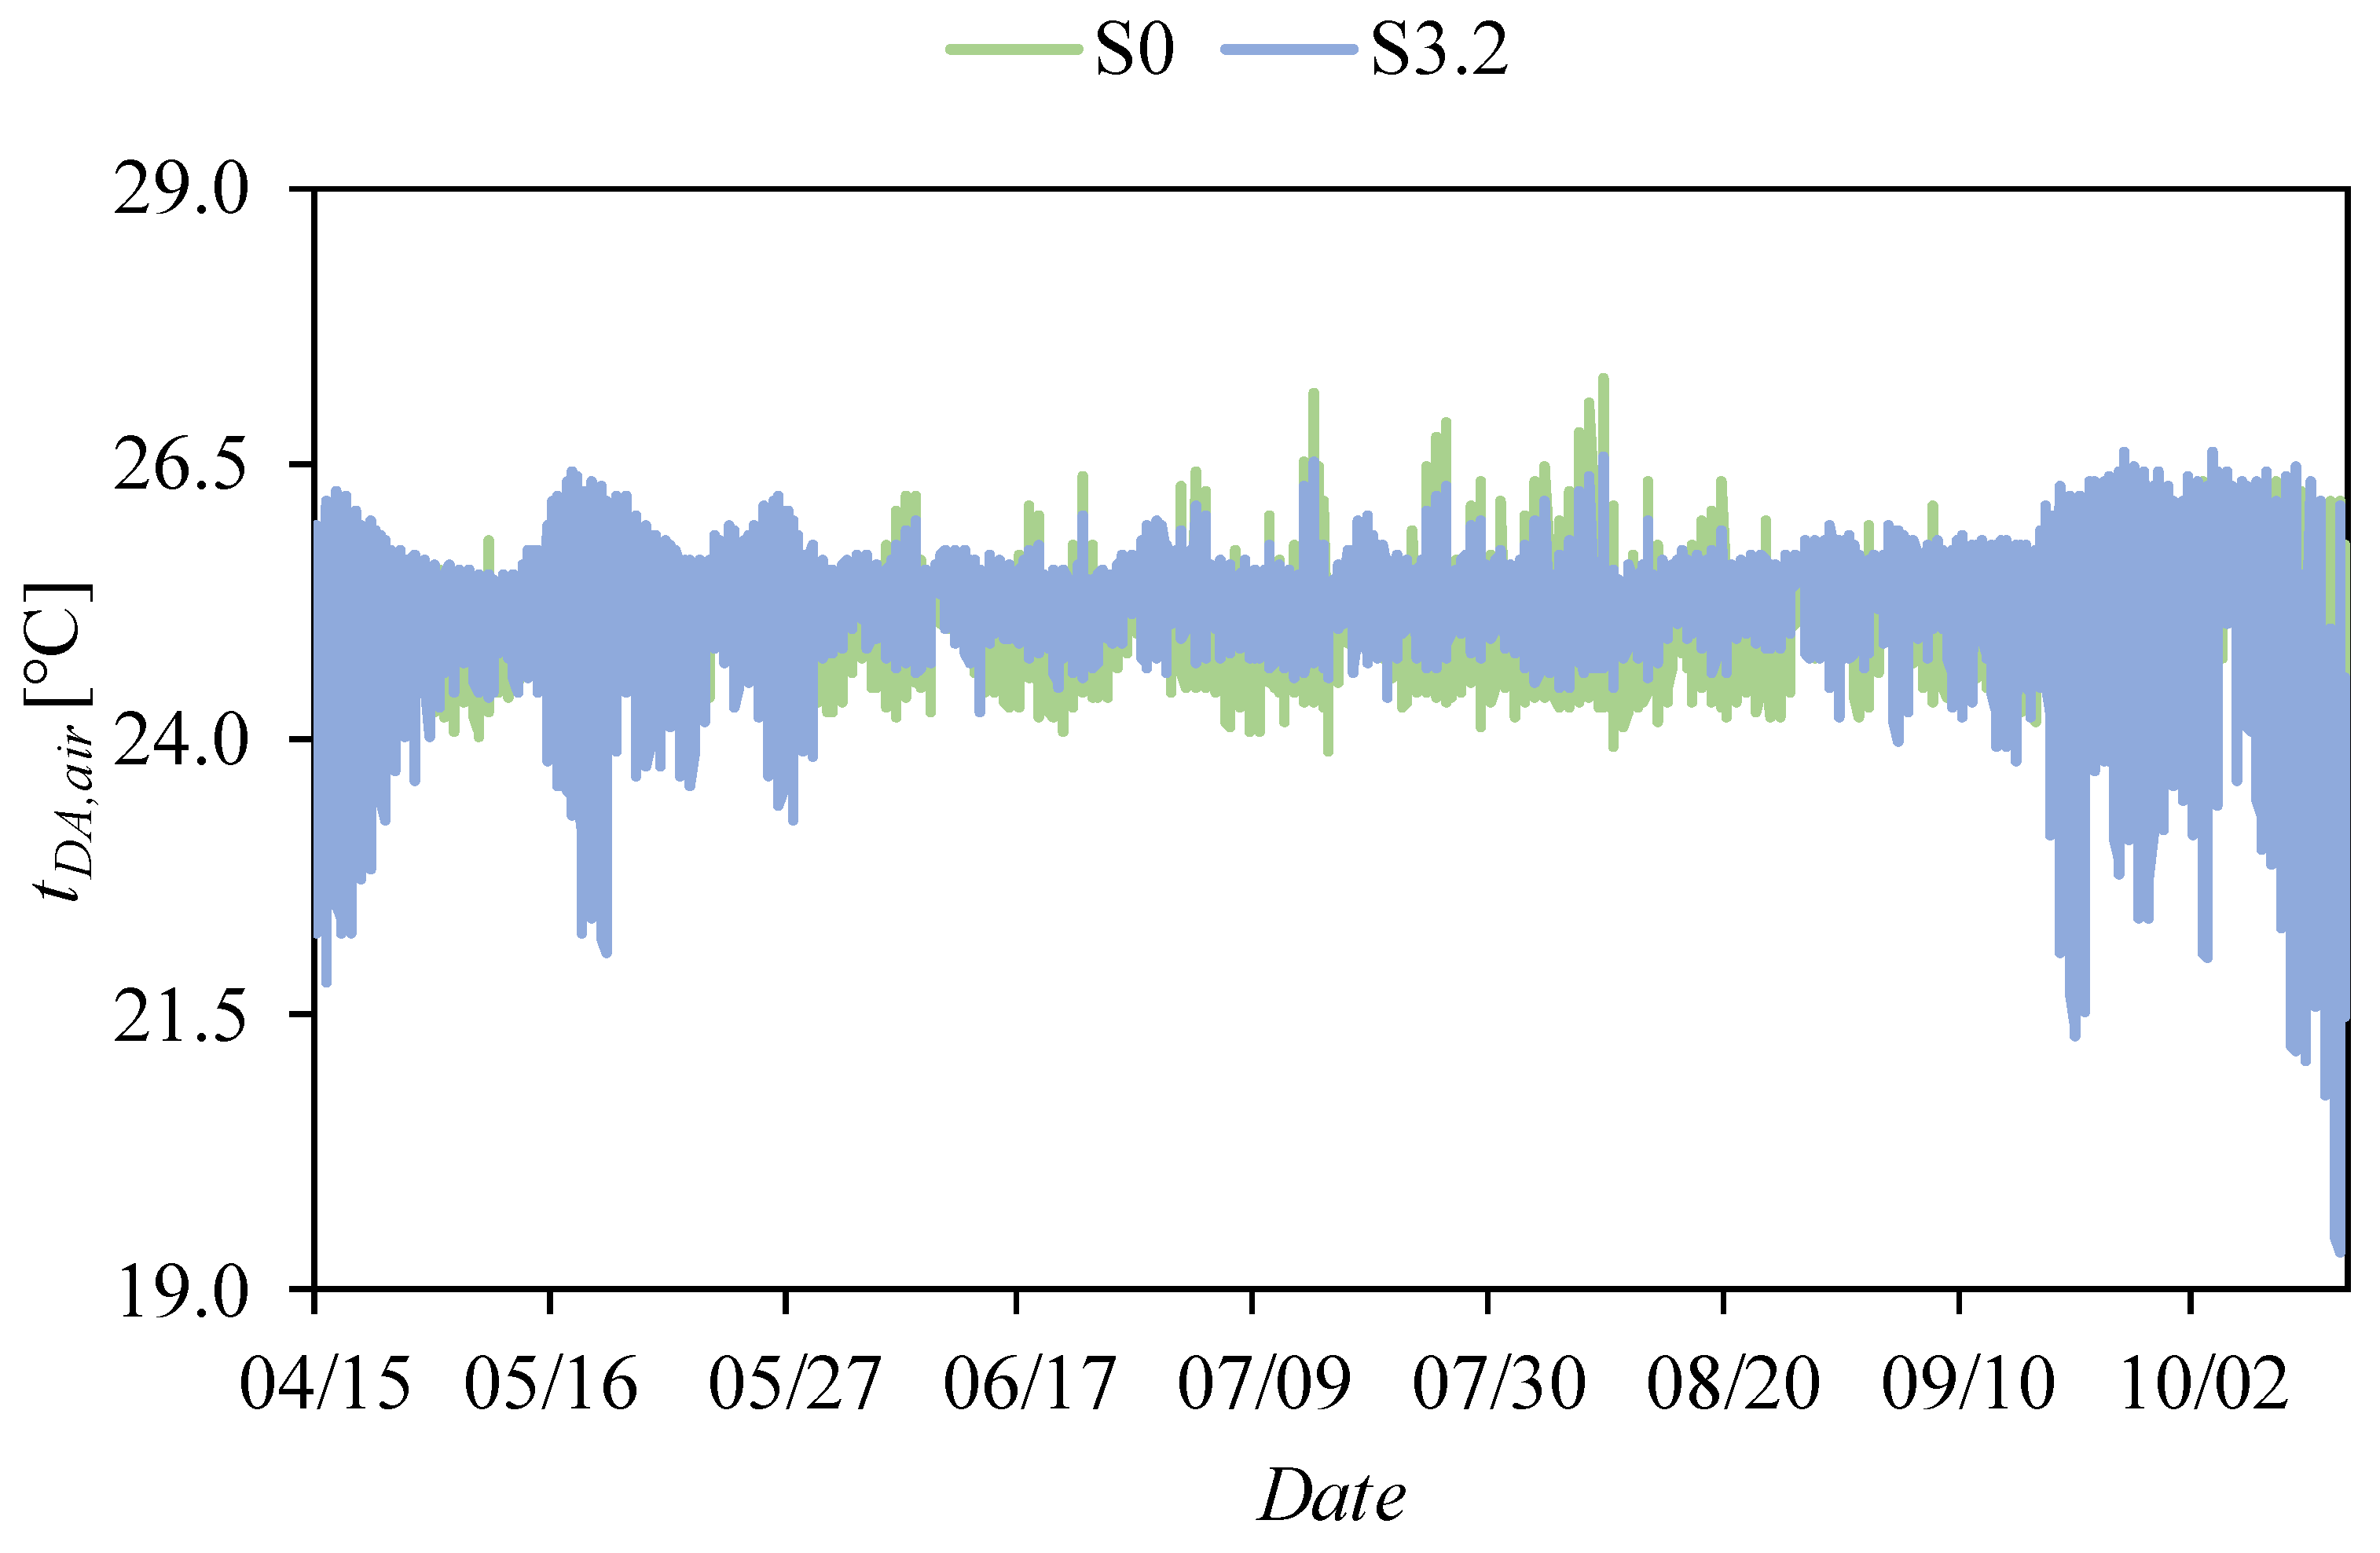
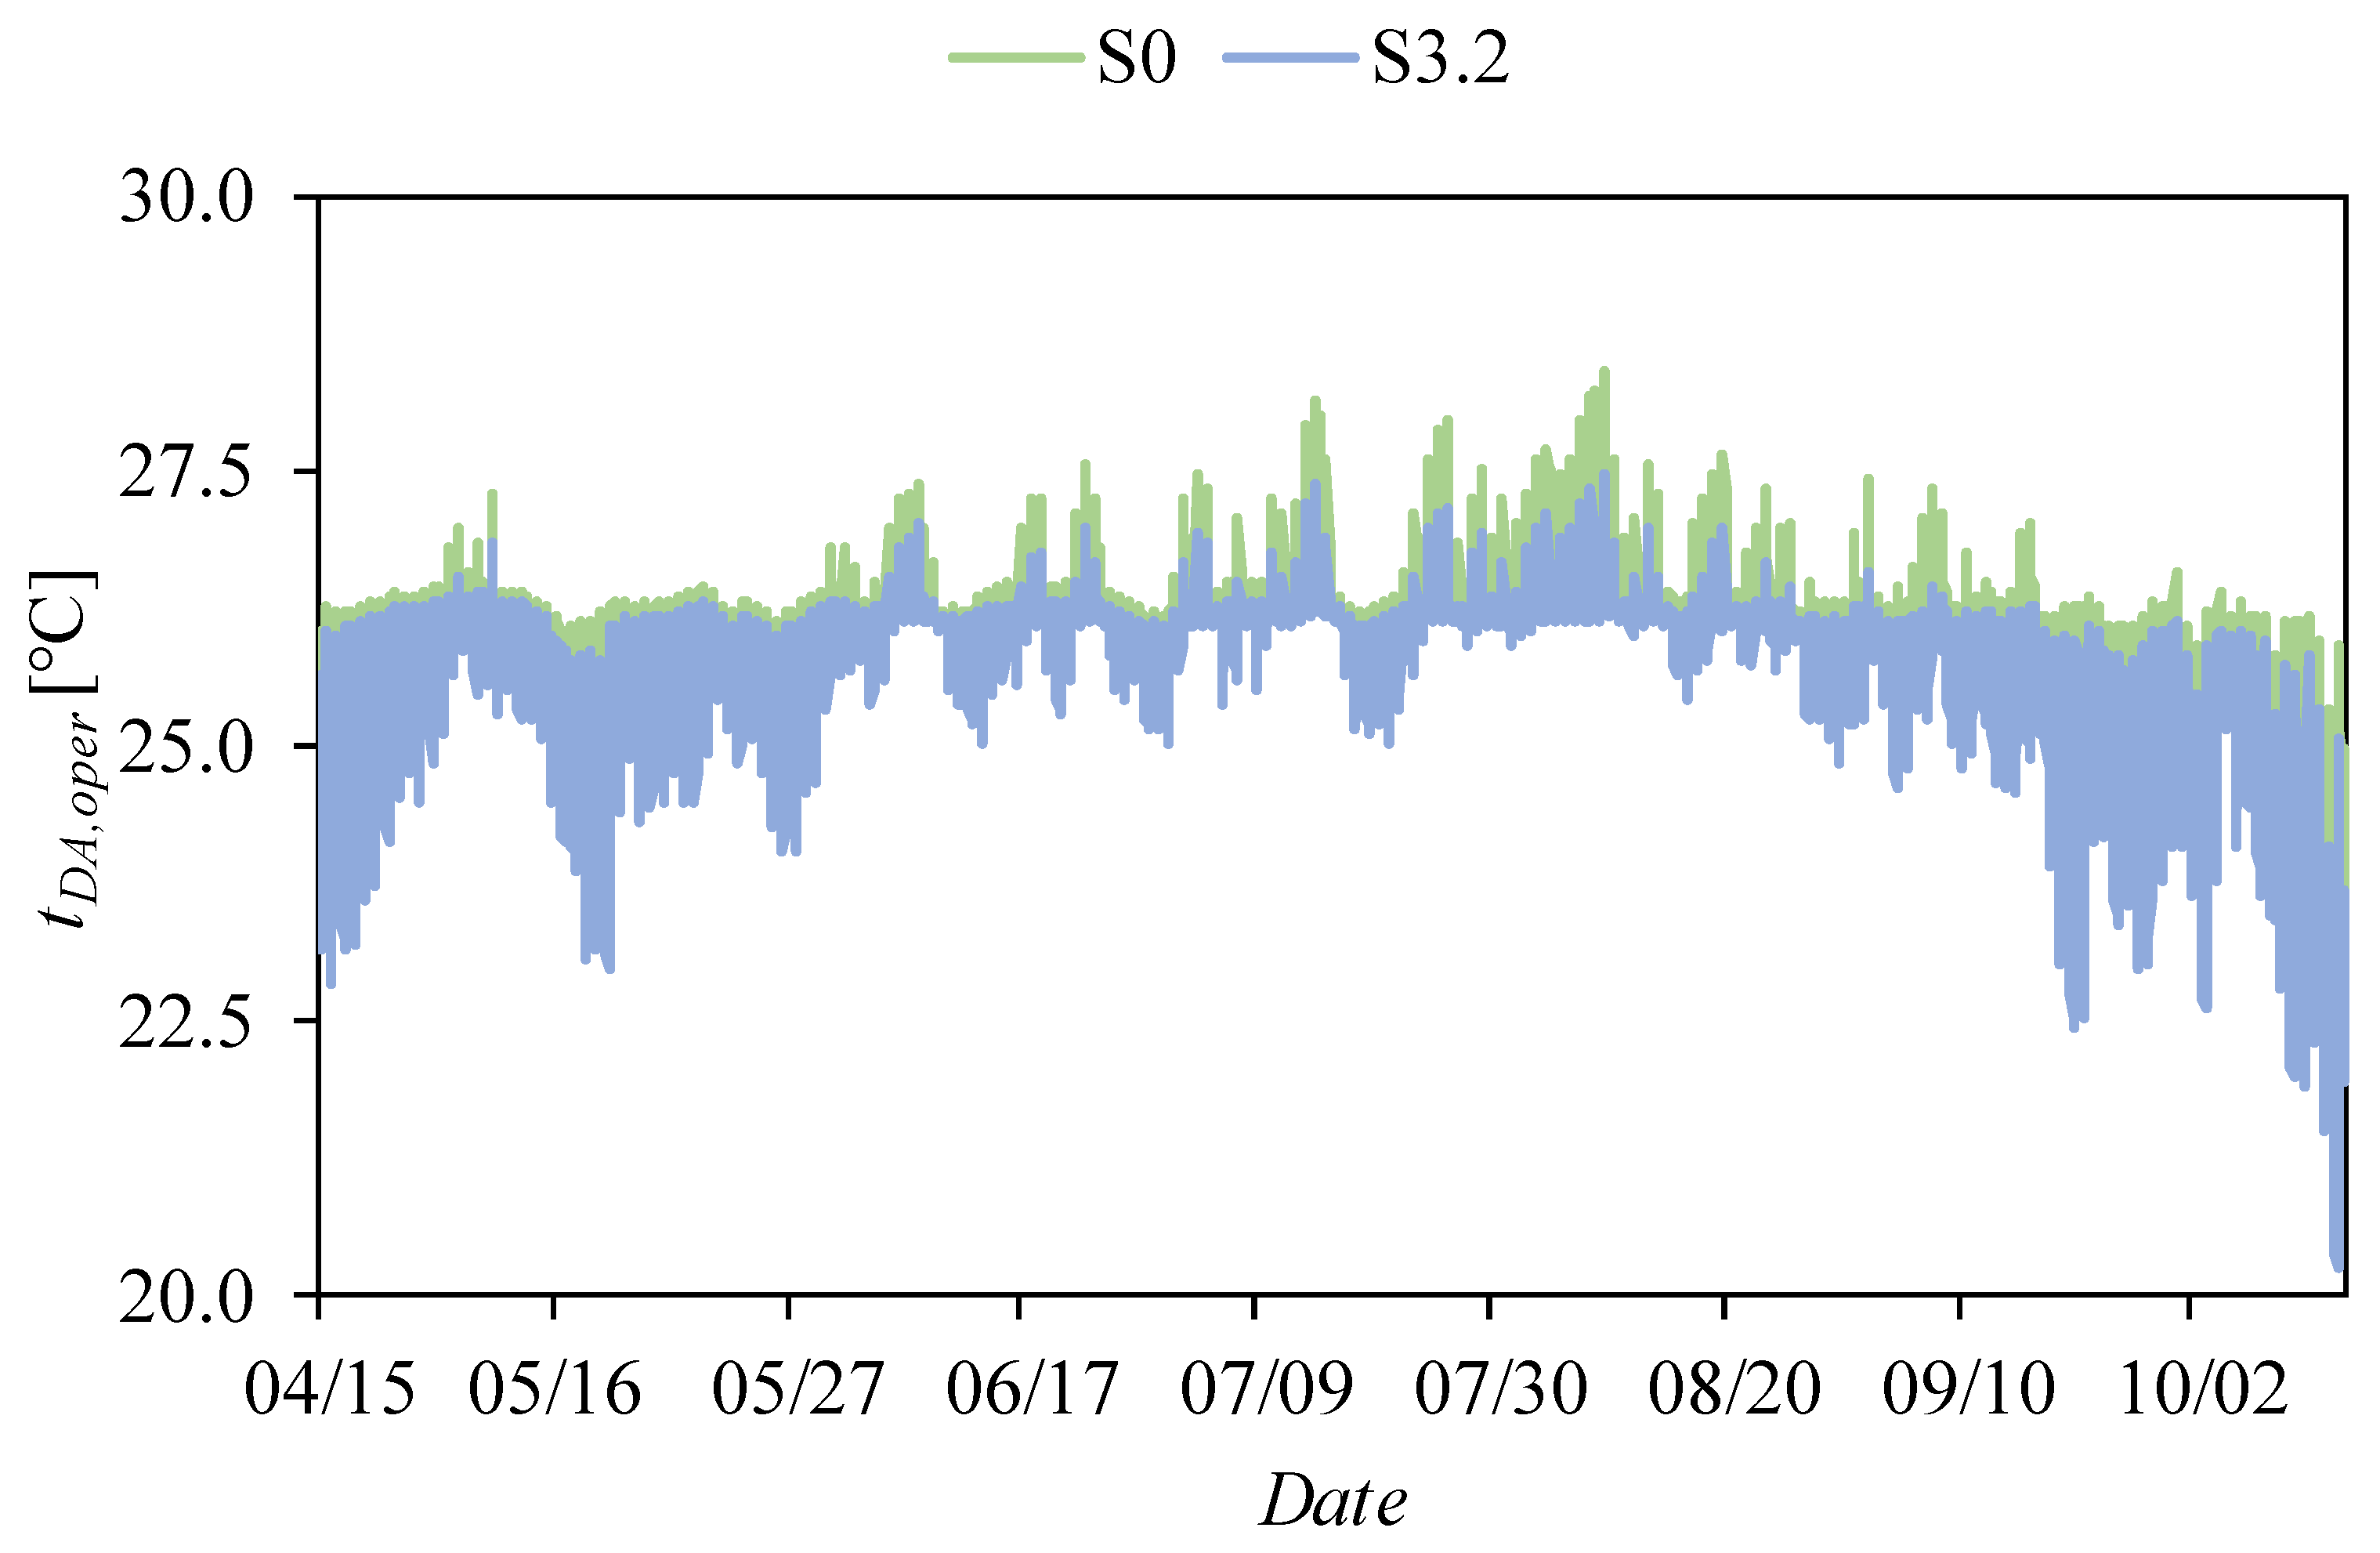
The thermal comfort achieved in the central zone of the RB was taken into consideration. Accordingly, the last figures show the hourly mean radiant tDA,rad [°C] (Figure 9), the mean air tDA,air [°C] (Figure 10), and the operative tDA,oper [°C] (Figure 11) temperatures in the dining area (DA, Figure 2) for the whole season (summer period) and for two critical cases: the first case is the reference building model—scenario S0, and the second case is the building with deciduous climbers—scenario S3.2.
From the attachment (Figure 9, Figure 10 and Figure 11), it can be clearly seen that the bioclimatic measures (in this particular case, deciduous climbers) contribute to the improvement of temperature comfort in the dining area, especially by narrowing the discontinuous area of tDA,rad, tDA,air, and tDA,oper. Better control of the internal temperature is best observed based on the parameter tDA,air.
In both cases, lower ambient temperatures (Figure 9, Figure 10 and Figure 11) are characteristic of two sub-periods. The first one is the beginning of the summer season (the second half of April), and the second one is the end of the summer season (the second half of September and the first half of October). It should be emphasized that the thermal comfort in these sub-periods remains within the acceptable limits, as it does not drop below 19 °C, so the engagement of the heating system in this case is not mandatory.
The average seasonal values of the characteristic temperatures for scenario S0 are as follows (Figure 9, Figure 10 and Figure 11): tDA,rad = 27.19 °C, tDA,air = 24.92 °C, and tDA,oper = 26.05 °C. For the same time frame, the characteristic temperature parameters in scenario S3.2 are (Figure 9, Figure 10 and Figure 11) tDA,rad = 26.39 °C, tDA,air = 24.87 °C, and tDA,oper = 25.63 °C. At the height of the cooling season, in the RB without bioclimatic measures, there are moments when tDA,rad = 30.34 °C, tDA,air = 28.42 °C, and tDA,oper = 29.03 °C, which deciduous climbers can significantly improve, in accordance with the measured (calculated) values tDA,rad = 28.81 °C, tDA,air = 27.84 °C, and tDA,oper = 28.21 °C.
These are direct indicators that with the application of bioclimatic measures, the microclimatic conditions inside the building, and also in its immediate surroundings, are significantly improved, especially in the form of lowering the mean radiant temperature by more than 1.5 °C. It should be emphasized that the buildings are thus protected from both structural and mechanical defects, such as thermal stress, which increases their working capacity, i.e., service life.

5. Discussion and Study Limitations

The basic idea of this paper is the affirmation of the commercial application of bioclimatic design in the Serbian climate zone—a concept that is currently most often viewed in the literature exclusively through an aesthetic prism, despite its enormous energy potential. This paper focuses on the application of bioclimatic measures within an atrium space as a strategic zone to improve the energy, ecological, and economic efficiency of commercial buildings. At the same time, it is important to note that extending these measures to the rest of the building’s outer shell would yield even more significant positive effects. In addition to energy savings, the justification of this design is reflected in the direct contribution to the fight against climate change; the use of vegetation for the purpose of passive cooling enables the efficient absorption of CO2, which significantly reduces the total carbon footprint of a building. When it comes to economic sustainability, this case study analyzes the investment return period through the prism of the summer season, which is an approach based on a realistic model of seasonal restaurant business in the climatic conditions of Serbia. With RBs operating all year round, the fixed shading elements could increase heating costs in the winter to some extent and thus extend the PB. However, using mobile (tracking) of the bioclimatic elements, which allows for seasonal installation and removal, the PB remains optimized and identical to that of the scenario focused solely on the cooling season.
Due to the specific nature of the investigation itself and the complexity of numerically defining bioclimatic factors, detailed explanations regarding the applied constraints and set parameters are not only a formal framework but also a key element for the proper understanding and interpretation of the obtained results. Therefore, the following list defines the key constraints used in creating the methodology, with clear explanations that provide a solid basis for the analysis of energy flows. It also serves as a reference starting point for future investigations in the field of sustainable architecture within the hospitality and tourism sector.
  • Load and capacity regime—In accordance with the recommendations in Table 2, it was assumed that the RB works at full capacity for three hours a day, divided into three equal intervals covering breakfast, lunch, and dinner. Although real scenarios in catering practice often imply much longer periods of maximum occupancy, this averaged approximation was necessary for the standardization of the numerical simulation. It is important to emphasize that extended operation at full capacity would result in greater internal heat gains, which would directly require a greater installed capacity of cooling systems and affect their more intense engagement during the cooling season.
  • Operational time frame—Although the recommendation for a three-hour operating mode (Table 4) has been followed, in practice it shows that the schedule of using this framework significantly affects energy consumption in the RB. From the point of view of energy efficiency, the effect is not the same when the three hours of operation are evenly distributed (one hour for each meal) or when the system for space heating/cooling is used continuously for three hours (for example, during the period of the most intense solar radiation or in the evening hours). Given that the NSP does not have the ability to conduct such dynamic analyses, the use of the EnergyPlus software in these situations proves to be necessary and extremely useful for obtaining accurate results.
  • Ventilation and air comfort—The occupancy patterns directly dictate the need for fresh air to maintain optimal air comfort. In this paper, the value nair = 0.5 h−1 was applied throughout the day, strictly following the current Regulation [4] for new RBs. However, this constant value did not follow the dynamic changes in restaurant occupancy, which is a significant limitation. In practical engineering and design, the nair value must simultaneously satisfy several different criteria (maximum number of people, total room volume, and maximum permissible pollutant concentrations in the space), with the highest value being adopted. The inability of the current regulations to flexibly adapt to these daily variations poses a major methodological challenge, as the actual ventilation needs in commercial spaces differ significantly in practice compared to the rigid assumptions of the Regulation.
  • Energetics and infrastructure—It was assumed that the facility meets all its energy needs exclusively through electricity, which is fully harmonized with the current Rulebook [4]. However, it should be borne in mind that in reality, RBs in Serbia often rely on alternative sources (such as natural gas, wood, pellets, etc.) to achieve a specific gastronomic concept. In a realistic scenario, the introduction of several different energy sources would further complicate the energy and economic balance of the building.
  • Waste management and economic impacts—The issue of solid waste and food scraps, which represents a significant item in the economic operations of every catering establishment, is left out of the scope of this paper. Although waste emissions have a direct impact on the financial sustainability and ecological footprint of RBs, the focus of this study remained primarily on the analysis of energy flows and bioclimatic measures in the atrium space.
  • Shading effect—In the context of the presented RB, the NSP defines building shading through static, predefined reduction coefficients, which represent an extremely rough approximation of reality. Conversely, EnergyPlus overcomes these limitations by utilizing dynamic geometric modeling. However, since this numerical analysis applies strictly to Kragujevac (Central Serbia), the benefits of the simulated bioclimatic features are highly climate-dependent. Selecting shading solutions requires careful optimization, as a vast number of available options yield significantly different energetic effects depending on the local microclimate.
  • Deciduous vegetation—Integrating deciduous vegetation, such as oak trees and V. coignetiae, into restaurant exteriors presents specific operational and safety challenges. Dense greenery naturally attracts insects, potentially compromising hospitality hygiene standards and guest comfort on outdoor terraces. Furthermore, deciduous climbers demand continuous maintenance to prevent structural damage, while oaks require decades to mature (a limitation only bypassed by selecting sites with pre-existing trees). Additionally, dense vegetation complicates moisture management, as deciduous climbers trap humidity against walls while tree roots can disrupt foundation stability. Finally, mature trees near the facility pose significant hazards during severe weather, particularly from lightning strikes or falling branches. Nonetheless, these challenges are not insurmountable obstacles that justify abandoning bioclimatic measures; rather, they emphasize the need for rigorous, context-specific engineering and maintenance planning to fully harness their ecological benefits.

6. Conclusions

RBs represent highly dynamic energy systems within the non-residential/commercial sector, characterized by fluctuating occupancy profiles and rigorous internal environmental comfort requirements. Modern building regulations, such as the Serbian Rulebook on Energy Efficiency of Buildings, establish rigid benchmarking criteria based almost exclusively on the seasonal heating energy indicator eheat, while completely omitting the progressively increasing cooling demands, ecool, induced by global climate change. This legislative and methodological gap creates a severe mismatch between regulatory class compliance and real-world operational energy profiles. In architectural practice, this limitation often disincentivizes the integration of passive solar solutions, leaving the growing cooling loads to be managed by energy-intensive active thermo-technical systems.
To overcome these limitations and establish an improved national reference framework that also accounts for the ecool parameter, this study applied an integrated, multidisciplinary numerical approach. A reference model of a single-story RB with a central open atrium in Kragujevac (Central Serbia) was geometrically defined in Google SketchUp. Internal heat gains (from people, electrical equipment, and artificial lighting), air infiltration, systems for space heating and cooling, and climatic data for the selected location were defined using the EnergyPlus software. The complete investigation is structured in two distinct phases: (1) comparative validation for the heating season (from 15 October to 15 April) to align the EnergyPlus parameters with the NSP, and (2) dynamic parametric analysis for the cooling season (from 15 April to 15 October) to assess the energy, environmental, economic and thermal impacts of eight specific passive cooling strategies implemented directly within the central atrium zone.
The numerical simulations demonstrated a clear hierarchy among the proposed interventions compared to the unshaded baseline (scenario S0), which exhibited a seasonal final energy consumption of Efin = 39,985.12 kWh/season (efin = 63.87 kWh/(m2season)). While checkerboard overhangs (scenario S1.3) and combined NS + EW pergolas (scenario S2.3) provided moderate reductions, the deciduous climber V. coignetiae (scenario S3.2) emerged as the absolute optimal solution. By completely shading the open atrium, it achieved a peak energy savings of 30.87%, optimizing the seasonal metrics to efin = 58.2 kWh/(m2season), epry = 145.5 kWh/(m2season), and mCO2 = 77.11 kg/(m2season). Economically, scenario S3.2 demonstrated the fastest financial return, achieving a payback period of just one summer season (PB = one season), whereas the least efficient pergola layout (scenario S2.1) required more than 3.09 seasons to achieve amortization. Furthermore, the thermal microclimate analysis confirmed that scenario S3.2 lowered the average seasonal radiant temperature by over 1.5 °C, successfully suppressing the peak summer radiant extremes from 30.34 °C down to a comfortable 28.81 °C.
A critical synthesis of these thermodynamic and financial results highlights the multifaceted benefits of microclimate-responsive architecture. Isolating fixed, reactive electrical loads (electric equipment and water heating) from weather-dependent indicators reveals that biological shading drastically reduces zone internal temperatures. This reduction not only elevates internal air comfort but also fundamentally shields the building envelope from structural and mechanical defects induced by thermal stress, thereby extending its service life. Crucially, while structural installations demand noticeable capital expenditures, deciduous vegetation minimizes upfront investments. Planting an oak tree involves virtually zero direct financial deployment, while the costs for V. coignetiae are strictly limited to installing wire supports. These practical advantages must be balanced against operational realities, such as long-term risks from storms, moisture retention along structural walls, root interference with foundations, or insect attraction that threatens dining hygiene. However, these factors merely underscore that biological shading must be accompanied by precise maintenance and intentional site optimization (such as building around pre-existing trees or using mobile, trackable bioclimatic elements to prevent winter heating penalties) to fully unlock its triple-bottom-line benefits.
Building upon the insights gained from this case study, future investigation trajectories should focus on expanding the scope of dynamic building energy modeling within the domestic non-residential/commercial sector. First, upcoming studies must replace rigid, fixed ventilation assumptions with dynamic, demand-controlled ventilation models driven by real-time CO2 sensors and variable occupancy schedules in EnergyPlus. Second, the single-location analysis should be scaled into a multiclimatic micro-regional matrix to evaluate how these specific shading configurations behave under different localized climate zones across the Balkan Peninsula. Finally, the boundaries of this research should expand to investigate the overall outer building shell and integrate comprehensive solid food waste management systems and automated tracking elements into the broader microclimatic balance.
Ultimately, this investigation confirms that incorporating an integrated bioclimatic design during the initial architectural phase provides a highly justifiable, economically viable, and ecologically sustainable path toward achieving true decarbonization in non-residential/commercial architecture.

Author Contributions

Conceptualization, A.N. and R.K.; methodology, A.N.; software, A.N.; validation, A.N. and R.K.; formal analysis, A.N.; investigation, A.N. and R.K.; resources, A.N.; data curation, A.N.; writing—original draft preparation, A.N.; writing—review and editing, A.N. and R.K.; project administration, A.N. and R.K. All authors have read and agreed to the published version of the manuscript.

Funding

This research received no external funding.

Data Availability Statement

The original contributions presented in this study are included in the article; further inquiries can be directed to the corresponding author.

Conflicts of Interest

The authors declare no conflicts of interest.

Nomenclature

AArea, [m2]
aSpecific area, [m2/per]
cSpeed, [m/s]
CHGConvective heat gain, [-]
COPCoefficient of performance, [-]
DCharacteristic dimension, [m]
dDirection, [°]
EEnergy consumption, [kWh/a] or [kWh/season]
eSpecific energy, [kWh/m2] or [kWh/(m2a)]
FFraction, [-]
fForm factor, [-]
FRFraction radiant, [-]
FVFraction visible, [-]
gSpecific emission, [kg/kWh]
HElevation, [m]
HDHeating days, [days]
HDDHeating degree days, [°Cdays]
ISolar irradiance on a horizontal plane, [W/m2]
LIllumination level, [lux]
lDistance, [m]
MEmission, [kg/a] or [kg/season]
mMass, [kg]
NNumber, [per]
nNumber of air changes, [h−1]
pAtmospheric pressure, [Pa]
PBPayback period, [a] or [season]
QPower, [W] or [W/season]
qSpecific power, [W/per] or [W/m2]
RPrimary conversion factor, [-]
RAFReturn air fraction, [-]
SHGCSolar heat gain coefficient, [-]
tTemperature, [°C]
trTransmittance, [-]
TZTime zone, [h]
UHeat transfer coefficient, [W/(m2K)]
VVolume, [m3]
WWWindow–wall ratio, [-]
YCost, [€/a] or [€/season]
ySpecific cost, [€/(m3season)] or [€/kWh]
Greek letters
λLongitude, [°E]
δThickness, [m]
ρDensity, [kg/m3]
τTime, [h]
φLatitude, [°N]
ψRelative humidity, [%]
Subscripts
airExternal air or zone mean air temperature
aftAfter
alArtificial lighting
beamBeam
befBefore
BMBioclimatic measure
coolCooling
diffDiffuse
elElectricity
eqElectric equipment
exExternal
finFinal
heatHeating
htHigher energy tariff
inInternal
ltLower energy tariff
maxMaximum
mvMechanical ventilation
mthMonthly
opOperative
operZone operative temperature
plPeople
pryPrimary
radZone mean radiant temperature
totTotal
txFees
wdWind
whWater heating
Abbreviations
ACSAir-conditioning system
CO2Greenhouse gas
DADining area
HHall
KKitchen
NSPNational software package
PVPhotovoltaic
RBRestaurant building
TToilet

References

  1. Wilson, E.R.; Meiser, E.T. Restaurants. In Oxford Bibliographies in Food Studies; Oxford University Press: Oxford, UK, 2025. [Google Scholar] [CrossRef]
  2. Regulation on the Classification of Activities of the Republic of Serbia. Official Gazette of the Republic of Serbia. Issue 22/2015. Available online: https://www.paragraf.rs/propisi/uredba_o_klasifikaciji_delatnosti.html (accessed on 1 February 2026).
  3. Line, N.D.; Runyan, R.C.; Costen, W.; Frash, R. Where Everybody Knows Your Name: Homophily in Restaurant Atmospherics. J. Hosp. Mark. Manag. 2012, 21, 1–19. [Google Scholar] [CrossRef]
  4. The Rulebook on Energy Efficiency of Buildings. Official Gazette of the Republic of Serbia. Issue 61/2011. Available online: https://www.paragraf.rs/propisi/pravilnik_o_energetskoj_efikasnosti_zgrada.html (accessed on 3 February 2026).
  5. Balaras, C.A.; Dascalaki, E.G.; Droutsa, K.G.; Micha, M.; Kontoyiannidis, S.; Argiriou, A.A. Energy use intensities for non-residential buildings. In Proceedings of the 48th International Congress and Exhibition on Heating, Refrigeration and Air-Conditioning, Belgrade, Serbia, 6–8 December 2017; pp. 369–389. [Google Scholar]
  6. Gunasegaran, M.K.; Hasanuzzaman, M.; Tan, C.; Bakar, A.H.A.; Ponniah, V. Energy Consumption, Energy Analysis, and Solar Energy Integration for Commercial Building Restaurants. Energies 2023, 16, 7145. [Google Scholar] [CrossRef]
  7. Barbara, F.N.; Gatt, D.; Yousif, C. Prioritising energy efficiency measures in Maltese restaurants. In Proceedings of the SBE19 Malta International Conference, Qawra, Malta, 21–22 November 2019. [Google Scholar]
  8. Mudie, S.A.; Essah, E.; Grandison, A.; Felgate, R. Benchmarking energy use in licensed restaurants and pubs. In Proceedings of the CIBSE Technical Symposium, Liverpool, UK, 11–12 April 2013. [Google Scholar]
  9. GOV. UK—The Best Place to Find Government Services and Information. Available online: https://www.gov.uk/ (accessed on 30 April 2026).
  10. ODYSSEE-MURE. Energy Efficiency Trends & Policies. Available online: https://www.odyssee-mure.eu/ (accessed on 10 March 2026).
  11. Green Margin™. Nature Restoration for UK Retailers & Brands. Available online: https://greenmargin.io/ (accessed on 30 April 2026).
  12. Simone, A.; Olesen, B.W.; Stoops, J.L.; Watkins, A.W. Thermal comfort in commercial kitchens (RP-1469): Procedure and physical measurements (Part 1). HVAC R Res. 2013, 19, 1001–1015. [Google Scholar] [CrossRef]
  13. Eid, E.; Foster, A.; Alvarez, G.; Campbell, R.; Evans, J. Assessment of Energy Consumption and Greenhouse Gas Emissions in a UK Quick-Service Restaurant Using EnergyPlus. Energies 2025, 18, 1377. [Google Scholar] [CrossRef]
  14. Onyango, J.; McGeough, C.; Obonyo, E.A. Waste to worth: Evaluation of potential waste heat recovery system within commercial kitchens in Northern Ireland. J. Green Build. 2012, 7, 62–69. [Google Scholar] [CrossRef]
  15. Aneva, S.; Minovski, D.; Sarac, V.; Citkuseva Dimitrovska, B. Techno-economic analysis and cost-effectiveness of photovoltaic systems for restaurants in Macedonia. Nat. Resour. Technol. 2025, 19, 17–28. [Google Scholar] [CrossRef]
  16. Ningrum, A.L.; Islam, H.D. Sustainable Opening to Maximize Natural Lighting and Ventilation in Restaurant. IOP Conf. Ser. Earth Environ. Sci. 2025, 1564, 012069. [Google Scholar] [CrossRef]
  17. Xie, Y.; Ding, Z.; Ma, J.; Zheng, X.; Liu, F.; Ding, Y.; Qian, H. The assessment of personal exposure in restaurants considering heat sources and ventilation strategies. Energy Built Environ. 2024, 5, 657–664. [Google Scholar] [CrossRef]
  18. Ahwidi, O.; Azzain, G. Simulation of Thermal Load of a Restaurant’s Building at Sebha City to Which Simple Passive Techniques Were Applied. J. Pure Appl. Sci. 2020, 19, 13–17. [Google Scholar] [CrossRef]
  19. Šekularac, N.; Ivanović-Šekularac, J.; Petrovski, A.; Macut, N.; Radojević, M. Restoration of a historic building in order to improve energy efficiency and energy saving—Case study—The dining room within the Žiča Monastery Property. Sustainability 2020, 12, 6271. [Google Scholar] [CrossRef]
  20. Fitzgerald, S.D.; Woods, A.W. Energy efficiency with natural ventilation: A case study. Proc. Inst. Civ. Eng. Energy 2007, 160, 9–14. [Google Scholar] [CrossRef]
  21. Uriarte, U.; Irulegi, O.; Hernández, R.J. Assessment of Shading Systems with Advanced Windows at Restaurants Under Sunny Climates in Spain. Buildings 2025, 15, 1173. [Google Scholar] [CrossRef]
  22. Zheng, Y.; Weng, Q. Modeling the Effect of Green Roof Systems and Photovoltaic Panels for Building Energy Savings to Mitigate Climate Change. Remote Sens. 2020, 12, 2402. [Google Scholar] [CrossRef]
  23. Baghdadi, A.; Abuhussain, M. In-depth analysis of photovoltaic-integrated shading systems’ performance in residential buildings: A prospective of numerical techniques toward net-zero energy buildings. Buildings 2025, 15, 222. [Google Scholar] [CrossRef]
  24. Oh, S.; Choi, G.S.; Kim, H. Climate-adaptive building envelope controls: Assessing the impact on building performance. Sustainability 2024, 16, 288. [Google Scholar] [CrossRef]
  25. Krstić-Furundžić, A.; Vujošević, M.; Petrovski, A. Energy and environmental performance of the office building facade scenarios. Energy 2019, 183, 437–447. [Google Scholar] [CrossRef]
  26. Mohammed, A. Study of shading device parameters of the mixed-mode ventilation on energy performance of an office building: Simulation analysis for evaluating energy performance in Egypt. In Proceedings of the International Conference on Advances in Architecture, Engineering and Technology, Cham, Switzerland, 23–25 September 2022; pp. 285–297. [Google Scholar]
  27. Wang, M.; Jia, Z.; Tao, L.; Wang, W.; Xiang, C. Optimizing the tilt angle of kinetic photovoltaic shading devices considering energy consumption and power Generation—Hong Kong case. Energy Build. 2025, 326, 115072. [Google Scholar] [CrossRef]
  28. Campiotti, C.A.; Gatti, L.; Campiotti, A.; Consorti, L.; De Rossi, P.; Bibbiani, C.; Muleo, R.; Latini, A. Vertical Greenery as Natural Tool for Improving Energy Efficiency of Buildings. Horticulturae 2022, 8, 526. [Google Scholar] [CrossRef]
  29. Nešović, A.; Kowalik, R. Implementation of a Novel Bioclimatic-Passive Architecture Concept in Serbian and Polish Residential Building Sectors. Buildings 2025, 15, 2877. [Google Scholar] [CrossRef]
  30. Ip, K.; Lam, M.; Miller, A. Shading performance of a vertical deciduous climbing plant canopy. Build. Environ. 2010, 45, 81–88. [Google Scholar] [CrossRef]
  31. Habibi, S. The effect of building orientation on energy efficiency. Clean Technol. Environ. Policy 2024, 26, 1315–1330. [Google Scholar] [CrossRef]
  32. Al-Homoud, M.S. The effectiveness of thermal insulation in different types of buildings in hot climates. J. Therm. Envel. Bldg. Sci. 2004, 27, 235–247. [Google Scholar] [CrossRef]
  33. Loh, D.Z.T.; Zhang, L.; Zhang, Y. Dynamic simulation and experimental analysis of vertical greening systems on building energy efficiency. Energy Build. 2025, 343, 115925. [Google Scholar] [CrossRef]
  34. Aldawoud, A. The influence of the atrium geometry on the building energy performance. Energy Build. 2013, 57, 1–5. [Google Scholar] [CrossRef]
  35. Tabesh, T.; Sertyesilisik, B. Focus on Atrium Spaces Aspects on the Energy Performance. In Proceedings of the International Conference on Chemical, Civil and Environmental Engineering (CCEE-2015), Istanbul, Turkey, 5–6 June 2015; pp. 58–61. [Google Scholar]
  36. Wang, L.; Huang, Q.; Zhang, Q.; Xu, H.; Yuen, R.K. Role of atrium geometry in building energy consumption: The case of a fully air-conditioned enclosed atrium in cold climates, China. Energy Build. 2017, 151, 228–241. [Google Scholar] [CrossRef]
  37. Janković, A.; Podraščanin, Z.; Djurdjevic, V. Future climate change impacts on residential heating and cooling degree days in Serbia. Időjárás 2019, 123, 351–370. [Google Scholar] [CrossRef]
  38. URSA Građevinska Fizika 2—Program za Izradu Elaborata Energetske Efikasnosti Objekata u Zgradarstvu. Available online: https://www.ursa.rs/sr-latn-rs/alati-i-usluge/gradevinska-fizika/ (accessed on 5 June 2026).
  39. Chen, E. Bring Magic to Your Dining Room Lighting: A Precise Guide to Choosing Wattage and Fixture Size for the Perfect Dining Atmosphere. Available online: https://www.coohom.com/article/choosing-the-right-wattage-and-proportion-for-your-dining-room-lighting (accessed on 30 April 2026).
  40. U.S. Department of Energy. EnergyPlus—Input-Output Reference. Available online: https://bigladdersoftware.com/epx/docs/24-1/input-output-reference/ (accessed on 19 March 2026).
  41. U.S. Department of Energy. EnergyPlus—Engineering Reference. Available online: https://bigladdersoftware.com/epx/docs/24-1/engineering-reference/ (accessed on 19 March 2026).
  42. Lawrie, L.K.; Crawley, D.B. Climate.OneBuilding.Org—Repository of Building Simulation Climate Data. Available online: https://climate.onebuilding.org/ (accessed on 20 January 2026).
  43. Electric Power Industry of Serbia. EPS Calculator. Available online: https://kalkulator.eps.rs/ (accessed on 25 February 2026).
  44. Poiss, M.; Briefer, A.; Scharf, B.; Spörl, P.; Stangl, R. Vertical greenery as natural shading of glass facades: Bioshading coefficients for 4 climbing plant species for assessment of shading performance. Build. Environ. 2025, 283, 113399. [Google Scholar] [CrossRef]
  45. Baštovanka. Hrast—Sadnja, Gajenje, Održavanje. Available online: https://www.bastovanka.rs/hrast/ (accessed on 23 January 2026).
  46. Velog, D.O.O. Sale of Building Materials: Sawn Board. Available online: https://mgming.velog.rs/pdf/daska/prizmirana_daska__24mm_x_25cm__4m__00240m3-14711 (accessed on 23 January 2026).
Figure 1. Isometric view of the restaurant building. Legend: ARB [m2] is the total floor area of the restaurant building; fRB [m−1] is the form factor of the restaurant building; VRB [m3] is the total volume of the restaurant building; WWRB [-] is the window–wall ratio of the restaurant building.
Buildings 16 02758 g001
Figure 2. Cross-sectional view of the restaurant building. Legend: DA is the dining area; H1 is the hall 1; H2 is the hall 2; K is the kitchen; T1 is the toilet 1; T2 is the toilet 2.
Buildings 16 02758 g002
Figure 3. Position of reference points in toilet 2 for measuring the intensity of internal daylight in the restaurant building.
Buildings 16 02758 g003
Figure 4. Operation scheme of the space cooling system in the restaurant building.
Buildings 16 02758 g004
Figure 5. City of Kragujevac. Legend: λ [°E] is the longitude; φ [°N] is the latitude; H [m] is the elevation; ΤΖ [h] is the time zone.
Buildings 16 02758 g005
Figure 6. Seasonal energy and ecological indicators for the restaurant building, depending on the simulation scenario.
Buildings 16 02758 g006
Figure 7. Seasonal final energy consumption for space cooling, interior lighting, and percentage energy savings in the restaurant building, depending on the simulation scenario.
Buildings 16 02758 g007
Figure 8. Seasonal economic indicators for the restaurant building, depending on the simulation scenario.
Buildings 16 02758 g008
Figure 9. Hourly mean radiant temperature in the dining area during the summer season for the restaurant building without and with deciduous climbers.
Buildings 16 02758 g009
Figure 10. Hourly mean air temperature in the dining area during the summer season for the restaurant building without and with deciduous climbers.
Buildings 16 02758 g010
Figure 11. Hourly operative temperature in the dining area during the summer season for the restaurant building without and with deciduous climbers.
Buildings 16 02758 g011
Table 1. Heat transfer coefficients of the restaurant building thermal envelope [4].
External Building ElementDescriptionU
[W/(m2K)]
Umax 
[W/(m2K)]
External wallsExpanded polystyrene 12 cm0.270.3
External floorsExtruded polystyrene 10 cm0.266
Flat roofsCotton 25 cm0.1471.15
External windowsSHGC = 0.61.51.5
External doorsBalcony
Transparent1.61.6
Non-transparent
Legend: Umax [W/(m2K)] is the maximum allowed value of the heat transfer coefficient; SHGC [–] is the solar heat gain coefficient.
Table 2. Limit values of the internal heat gains for restaurant buildings [4].
ParameterValue
tcool [°C]26
apl [m2/per]5
qpl [W/per]100
τpl [h]3
eeq [kWh/(m2a)]30
nair [h−1]0.5
ewh [kWh/(m2a)]60
Legend: tcool [°C] is the cooling set temperature in the restaurant building; apl [m2/per] is the specific people occupancy in the restaurant building; qpl [W/per] is the specific heat gain from one person in the restaurant building; τpl [h] is the people occupancy during the day in the restaurant building; eeq [kWh/(m2a)] is the annual specific final energy consumption for electric equipment in the restaurant building; nair [h−1] is the characteristic number of air changes in the restaurant building; ewh [kWh/(m2a)] is the annual specific final energy consumption for water heating in the restaurant building.
Table 3. Energy performances of the restaurant building zones [4,39].
IndicatorParameterDAH1H2KT1T2
PeopleNpl,max [per]1013104
Internal artificial lightingqal,in [W/m2]2
Lal,in [lux] (Figure 3)150100500200
Electric equipmentqeq [W/m2]27.398
Water heatingQwh [W] 45002000
Legend: Npl,max [per] is the maximum number of the people in the restaurant building; qal,in [W/m2] is the specific power of the internal artificial lighting in the restaurant building; Lal,in [lux] is the internal desired level of illumination in the restaurant building; qeq [W/m2] is the specific power of the electric equipment in the restaurant building; Qwh [W] is the power of the water heating in the restaurant building.
Table 4. Hourly usage schedules of the restaurant building.
τ [h]Fpl [–]Fal,in [–]Feq [–]Fwh [–]Fair [–]
00:00–08:0001
08:00–09:001
09:00–14:000
14:00–15:001
15:00–20:000
20:00–21:001
21:00–24:000
Legend: Fpl [–] is the fraction of the people occupancy in the restaurant building; Fal,in [–] is the fraction of the internal artificial lighting used in the restaurant building; Feq [–] is the fraction of the electric equipment used in the restaurant building; Fair [–] is the fraction of the fresh air changes used in the restaurant building; Fwh [–] is the fraction of the water heating used in the restaurant building.
Table 5. Technical characteristics of the space cooling system in the restaurant building [4].
ParameterDAH1H2KT1T2
Qcool [W]25,080.71744.972483.24993.3
COPACS [–]3.52.6
Legend: Qcool [W] is the heat load of the restaurant building during the cooling season; COPACS [–] is the coefficient of performance of the air-conditioning system.
Table 6. Meteorological data for the city of Kragujevac [42].
Monthcwd [m/s]dwd [°]Ibeam [W/m2]Idiff [W/m2]pair [bar]tair [°C]ψair [%]
April1.09177.11314.3363.390.997716.6955
May1.73211.34213.8884.290.993816.6472.95
June2.18232.16241.8385.070.993520.8166.44
July1.68215.98266.7777.380.994122.8366.8
August1.73205.57257.5665.90.994223.1959.35
September1.91204.22196.9559.220.996918.4664.8
October2.38207.29112.552.60.991315.3776.49
Legend: cwd [m/s] is the wind speed; dwd [°] is the wind direction; Ibeam [W/m2] is the beam solar irradiance on a horizontal plane; Idiff [W/m2] is the diffuse solar irradiance on a horizontal plane; pair [bar] is the external atmospheric pressure; tair [°C] is the external air temperature; ψair [%] is the external relative humidity.
Table 7. Simulation scenario of installing wooden horizontal overhangs in the atrium space of the restaurant building.
Simulation
Scenario
Bioclimatic
Measure
Graphical
Description
Performance
S1.1Full-around
facade
Buildings 16 02758 i001Orientation: N + E + S + W
DBM = 1 m
NBM = 4
ABM = 36 m2
mBM = 345.6 kg
VBM = 0.864 m3
YBM = 283.392 €/season
S1.2Checkerboard
facade
(type 1)
Buildings 16 02758 i002Orientation: NE + SW
DBM = 5 m
NBM = 2
ABM = 50 m2
mBM = 480 kg
VBM = 1.2 m3
YBM = 393.6 €/season
S1.3Checkerboard
Facade
(type 2)
Buildings 16 02758 i003Orientation: NW + SE
DBM = 5 m
NBM = 2
ABM = 50 m2
mBM = 480 kg
VBM = 1.2 m3
YBM = 393.6 €/season
Legend: DBM [m] is the characteristic dimension (deep for overhangs, width for pergolas, and height for trees) of the implemented bioclimatic measure in the restaurant building; NBM [–] is the number of elements used in the bioclimatic measure in the restaurant building; ABM [m2] is the area of the implemented bioclimatic measure in the restaurant building; mBM [kg] is the mass of the implemented bioclimatic measure in the restaurant building; VBM [m3] is the volume of the implemented bioclimatic measure in the restaurant building.
Table 8. Simulation scenario of installing wooden horizontal pergolas in the atrium space of the restaurant building.
Simulation
Scenario
Bioclimatic
Measure
Graphical
Description
Performance
S2.1One-directional
(type 1)
Buildings 16 02758 i004Orientation: EW
DBM = 0.2 m
lBM = 0.4 m
NBM = 24
ABM = 48 m2
mBM = 460.8 kg
VBM = 1.152 m3
YBM = 377.856 €/season
S2.2One-directional
(type 2)
Buildings 16 02758 i005Orientation: NS
DBM = 0.2 m
lBM = 0.4 m
NBM = 24
ABM = 48 m2
mBM = 460.8 kg
VBM = 1.152 m3
YBM = 377.856 €/season
S2.3Egg crateBuildings 16 02758 i006Orientation: NS + EW
DBM = 0.2 m
lBM = 0.4 m
NBM = 48
ABM = 96 m2
mBM = 921.6 kg
VBM = 2.304 m3
YBM = 755.712 €/season
Legend: lBM [m] is the distance between the wooden boards in the construction of the pergolas in the restaurant building.
Table 9. Simulation scenario of installing deciduous vegetation in the atrium space of the restaurant building.
Simulation
Scenario
Bioclimatic
Measure
Graphical
Description
Performance [44,45]
S3.1OakBuildings 16 02758 i007DBM = 10.21 m
trBM = 0.69 (April)
trBM = 0.31 (May)
trBM = 0.19 (June)
trBM = 0.14 (July)
trBM = 0.09 (August)
trBM = 0.21 (September)
trBM = 0.49 (October)
YBM = N/A
S3.2V. coignetiaeBuildings 16 02758 i008ABM = 100 m2
trBM = 0.57 (April)
trBM = 0.39 (May)
trBM = 0.16 (June)
trBM = 0.12 (July)
trBM = 0.13 (August)
trBM = 0.14 (September)
trBM = 0.5 (October)
YBM = 377.856 €/season *
Legend: trBM [-] is the transmittance coefficient of the implemented deciduous vegetation in the restaurant building. * If one-directional wooden horizontal pergolas from Table 8 were used.
Table 10. Boundary conditions for the restaurant building.
Input DataParameterEnergyPlusNSP
Building
geometry
ARB [m2]626
fBR [m−1]0.91
WBR [m3]1878
WWBR [–]0.402
U-values
of the
thermal
envelope [W/(m2K)]
External walls0.270.626
External floors0.2660.271
Flat roofs0.147
External windows1.5
Balcony door
Transparent external door1.6
Non-transparent external door
Internal
heat gains
qpl [W/per]100
eeq [kWh/a]30
ewh [kWh/a]60
Meteorological dataLocationKragujevac
Run periodHeating season
HD [°Cdays]180
HDD [°Cdays]25952610
Space ventilation systemnair [h−1]0.5
Space heating
system
RadiatorsElectric
Legend: HD [days] is the heating days for Kragujevac; HDD [°Cdays] is the heating degree days for Kragujevac.
Table 11. Verification of the EnergyPlus model of the restaurant building [4].
Input DataParameterEnergyPlusNSP
Internal heat
gains
Epl [kWh/season]67506760.8
Eeq [kWh/season]9261.37
Ewh [kWh/season]18,522.74
eheat [kWh/(m2a)]With shading34.93 *36.13
Without shading33.57
Building
energy class
From A+ to GB
Legend: Epl [kWh/season] is the seasonal internal heat gain from people in the restaurant building; * EnergyPlus software communicates directly with Google SketchUp (via the OpenStudio plug-in), thanks to which the influence of surrounding shading is automatically and precisely integrated into the simulation model itself.
Disclaimer/Publisher’s Note: The statements, opinions and data contained in all publications are solely those of the individual author(s) and contributor(s) and not of MDPI and/or the editor(s). MDPI and/or the editor(s) disclaim responsibility for any injury to people or property resulting from any ideas, methods, instructions or products referred to in the content.