Article

A Study on the Application of Parametric Geometry in the Morphology of Qing Dynasty Multi-Storey Pavilion-Style Pagoda in Northeast Sichuan

School of Civil Engineering and Architecture, Southwest University of Science and Technology, Mianyang 621000, China
*
Author to whom correspondence should be addressed.
Buildings 2026, 16(14), 2749; https://doi.org/10.3390/buildings16142749
Submission received: 8 June 2026 / Revised: 29 June 2026 / Accepted: 1 July 2026 / Published: 10 July 2026

Abstract

Fengshui pagodas are one of the predominant types of ancient Chinese pagodas, possessing architectural, cultural, educational, and folkloric research value; their form serves as a central vehicle for the study of cultural relics and architectural styles. Currently, academic research relies solely on architectural proportions to deduce structural components, and there is a lack of research into the implicit mathematical logic underlying the pagoda’s structure; both research methods and mathematical analysis have shortcomings. This study abstracts the standard geometric forms of the Pagoda body, constructs a system of mathematical equations using parametric geometry, and verifies the effectiveness of this method through cross-validation experiments on samples. All data sources consist of precise, field-surveyed architectural measurements. The results indicate that the parametric geometry method is suitable for the quantitative study of feng shui pagodas in northeastern Sichuan, offering greater precision than traditional methods and clarifying the mathematical relationships underlying their architectural forms. This study innovates the mathematical modeling of ancient pagoda forms, breaking through traditional approaches to feng shui pagoda research, and provides a scientific framework for tracing the origins of Qing Dynasty pavilion-style feng shui pagodas and for mathematical research on similar ancient structures.

1. Introduction

In the preface to *Chinese Pagodas*, Ernst Borschmann highlights the important role pagodas played in the development of ancient Chinese urban culture [1]. In the introduction to Volume 1 of *An Anthology of Ancient Chinese Pagodas*, Zhang, Y proposes that ancient Chinese pagodas can be divided into two types: Buddhist pagodas and feng shui pagodas [2]. According to incomplete statistics, as of now, there are more than 2000 feng shui Pagodas built during the Qing Dynasty nationwide. This figure can be cross-verified through authoritative sources such as *The Complete Catalog of Ancient Chinese Pagodas* (by Chen, Z) [3], *A History of Chinese Buddhist Pagodas* (by Zhang, Y) [4], and data from the Third National Cultural Relics Census [5]. Currently, the academic community is conducting textual research and value assessments on multi-story brick-and-stone Multi-storey Pavilion-style Pagoda. Scholars have developed new methodologies to examine the temporal and spatial distribution, structural performance, and evolutionary patterns of these pagodas. Jiang, H utilized field surveys combined with historical records to reconstruct the spatial distribution of Qing Dynasty feng shui storeys in Sichuan [6]. Yan, J’s team employed GIS technology to identify distinct patterns in both the temporal and spatial distribution of feng shui storeys in Hunan [7]. Chen, M published a paper revealing the seismic vulnerabilities of Ming Dynasty stone-masonry Pagodas in the Jiangnan region [8]. Although the academic community has conducted extensive research on Fengshui Pagodas, there remains a gap in the field of morphology. Morphological research on historical architectural heritage has always been a priority supported by relevant policies both domestically and internationally. The 1964 Venice Charter stipulates that restoration must respect original materials, and that new and old parts must remain distinguishable [9]. China first proposed this requirement in the 1961 “Interim Regulations on the Protection and Management of Cultural Relics,” mandating adherence to the principle of “restoring to the original state or preserving the current state” during repairs [10]. The 1982 “Law of the People’s Republic of China on the Protection of Cultural Relics” further established the core principle of “not altering the original state of cultural relics.” [11]. Chapter 2, Article 9 of the 2015 edition of the *Guidelines for the Protection of Cultural Relics and Historic Sites in China* explicitly stipulates that maintaining the original state is the essence of the protection of cultural relics and historic sites [12]. This fully demonstrates that research on the form of historic heritage buildings is of great significance to their authenticity and integrity.
Morphological studies of historic heritage architecture can be traced back to the *Yingzao Fashi* (Treatise on Building Methods) of the Northern Song Dynasty, which classified building materials into eight grades based on the scale of structures, thereby establishing a modular system tailored to different architectural levels [13]. The *Gongcheng Fazhu* (Engineering Practices), an official architectural code of the Qing Dynasty, continued this tradition of modular design [14]. The *Yingzao Fayan* (Principles of Building Construction), a treatise on vernacular architecture, provided practical proportional references [15]. In her 1934 work *Principles of Architectural Construction* (*Yingzao Zelei*), Lin, H specifically emphasized the core value of architectural proportions [16]. German scholar Boerschmann, E argued that the “Doukou System”—which simplified the modular unit to the “doukou” and established a fixed ratio (approximately √2) between the height of a single timber and the doukou—marked the maturation of the modular system in ancient Chinese architecture [17]. French scholar Pelliot, P discovered that the pagodas depicted in murals also follow the design principle of “the ratio of the pagoda’s height to the circumference of its first pagoda.” [18]. Hua, W proposed a method for identifying similarities among grotto Buddhist statues based on a similarity index [19]. Francisco Salguero-Andújar, F ’s team revealed the hidden architectural proportions and true nature of Seokguram Grotto in Gyeongju, South Korea, a National Treasure of South Korea [20]. Zhao, S’s team discovered that the column capital plan and the beam span of the Shakyamuni Hall employed two different construction scales from distinct eras: 302 mm and 312 mm, respectively [21]. Li, Z and Zhao, S proposed that the column height, clear width, and clear height of the Puxian Pavilion form clear multiple and proportional relationships [22]. Cha, J.-H and Kim, Y.-J were the first to use the XYZ coordinate system to demonstrate that the width of the door frame serves as a standard modular unit, maintaining integer proportional relationships with the building’s facade and height [23].
We have found that pagoda-type structures also follow this pattern, primarily employing a modular reverse-engineering method to derive the proportions of individual components from completed pagoda structures based on empirical ratios. Through a series of studies, including his 1989 paper “A Discussion on the Proportional Patterns of story Plans and Elevations in Single-Eave Wooden Structures of the Tang and Song Dynasties” [24] and “An Analysis of the Proportions of Single-Eave Wooden Structures of the Tang and Song Dynasties,” Wang, G confirmed that the key dimensions in single-eave wooden structures of the Tang and Song dynasties generally exhibit a √2 proportional relationship [25]. In his 1966 book *The Yingxian Wooden Pagoda*, Chen, M was the first to point out that the 8.83 m frontage of each side of the third pagoda of the Yingxian Wooden Pagoda constituted a key modular unit in the Pagoda’s design [26]. Liu, D, Fu, X, and others further verified that this dimension conformed to the Liao Dynasty’s “three zhang” measurement standard [27]. Shi, L’s research team used 3D laser scanning and drone surveying to collect data on the Yingxian Wooden Pagoda, determining that the construction unit was 292 mm [28]. Fu, X’s 1992 study found that five-story pagodas from Japan’s Asuka and Nara periods typically stood 7 times the height of a single-story column (7H1), while three-story pagodas stood 5 times the height of a single-story column (5H1) [29]. Wang, H’s 1992 book *The East and West Pagodas of Quanzhou* also confirms that the total heights of the East and West Pagodas at Kaiyuan Temple in Quanzhou closely match the measured circumferences of their first stories, further supporting the hypothesis that “pagoda height is in a fixed ratio to the circumference of the first story.” [30]. Wang, N, in the 2018–2019 work *Rectangles and Circles, Myriad Pagodas: An Analysis of Compositional Proportions in Ancient Chinese Buddhist Pagodas, Part I* [31] and *Rules and Circles: Myriad Pagodas—An Analysis of Compositional Proportions in Ancient Chinese Buddhist Pagodas, Part II* (2018–2019), Wang, N systematically demonstrated—through geometric constructions and analyses of measured data from 41 Buddhist pagodas across six major types—that the √2 compositional ratio was widely applied in the plan, elevation, and sectional designs of Buddhist pagodas throughout Chinese history [32]. A comprehensive analysis reveals that, due to the limitations of early surveying techniques, the universality of this method is questionable, and it also has shortcomings in terms of precision.
Another approach adopted in existing research is a comparative analysis method based on modern technology, which involves conducting various analyses after accurately surveying the Pagoda structures using 3D point clouds and drone aerial surveying technology. Chan, T.O proposed a new method for analyzing the rotational and reflective symmetry of Eastern polygonal Pagodas based on 3D point clouds [33]. Liu, Y summarized the visual morphological characteristics of the ancient Pagodas in Zhengding [34]. Liu, H, Xiao, C.; Chen, F’s research summarized the unique mathematical principles governing the compositional proportions of ancient pagodas in central Hunan [35]. Through a comparative study of the story plans and first-story forms of multi-story brick and stone pagodas in the Beijing area dating from the 11th to the 17th centuries, Yang, Y divided their stylistic evolution into four periods and eleven phases, which generally correspond to the historical divisions of the Liao, Jin, Mongol-Yuan, and Ming dynasties [36]. In 2020, Wang, S’s team used 3D scanning and drone aerial photography to acquire digital data on samples, confirming the application of square-circle patterns and dimensional modularity in the design of Tang Dynasty multi-story brick Pagodas. They also employed mathematical models to explain the fundamental design principles and methods governing Pagoda morphological variables [37]. This approach, while leveraging modern technology to shift from traditional modular thinking to parametric quantification, has to some extent established preliminary mathematical research frameworks; however, it remains confined to the research paradigm of modular reverse engineering.
Given the developmental shortcomings and evolutionary trends of existing research, this paper takes Qing Dynasty folk-style Pagodas in northeastern Sichuan as its subject and introduces parametric geometry to conduct a specialized analysis. Building upon existing research, this study moves beyond the conventional approach of refining proportions based on the Pagoda’s form. Instead, it decomposes the Pagoda body into mathematical figures composed of line segments, employs parametric geometry to model these decomposed figures, and conducts cross-analysis of the resulting models to thoroughly verify the universality of the mathematical model. This research method differs from previous modular reverse-engineering approaches; rather than focusing on identifying modular units and proportions, it directly derives equations and formulas from data. This study selected six Qing Dynasty feng shui pagodas from northeastern Sichuan as empirical samples to analyze the mathematical relationships among their internal parameters. The findings can fill a research gap in the field of feng shui pagoda morphology and provide valuable insights for future studies on multi-story brick-and-stone pagoda-style feng shui pagodas from the Qing Dynasty in China.

2. Materials (Shenzhen DJI Innovation Technology Co., Ltd., Shenzhen, China; DJI Terra (3.0.1)) and Methods

2.1. Sample Selection

To ensure the authenticity, accuracy, and rigor of this study, a scientific methodology was employed to select samples of Multi-storey Pavilion-style Pagoda from the Qing Dynasty in the Sichuan region. Currently, there are 34 surviving Qing Dynasty Multi-storey Pavilion-style Pagoda in northeastern Sichuan [6]. This study conducted a preliminary screening of feng shui story samples based on historical period and morphological characteristics. Referencing the authoritative literature on feng shui pagodas, *Chinese Feng Shui pagodas* (Zhang, Y, 2011) [2], and the latest edition of the Sichuan Provincial Municipal-Level Inventory, six well-preserved Qing Dynasty Multi-storey Pavilion-style Pagoda in Sichuan Province were ultimately identified (Table 1).
Subsequently, we conducted systematic surveying and analysis of six Qing Dynasty multi-storey pavilion-style pagoda in Sichuan Province and found that: (1) all six pagodas exhibit varying degrees of tapering; (2) the radius of each level decreases progressively; (3) the number of levels in these six pagodas—9, 11, and 13—corresponds to common configurations for feng shui pagodas, indicating their universal significance; (4) All six pagodas are designated as cultural heritage sites at the county level or higher, ensuring their authority; we have sequentially numbered them as No. I, No. II, No. III, No. IV, No. V, and No. VI (Table 2).
To verify the representativeness of the samples, this study employed the Bootstrap resampling test to conduct a statistical test of the consistency in distribution between the six selected representative samples and the 34 population samples, thereby verifying the representativeness of the samples relative to the population. First, the test hypotheses were defined: the null hypothesis H0 states that the sample under test and the population sample come from the same probability distribution, and the sample is statistically representative; the alternative hypothesis H1 states that there is a significant difference between the distributions of the sample under test and the population sample, and the sample is not representative. During the test, for the six numerical variables—time, number of corners, number of stories, height, longitude, and latitude—the core statistical measures (mean, median, and standard deviation) were calculated separately for both the population and the sample under test. For the two categorical variables—style and building material—the frequency and count of each category were calculated, thereby determining the differences in observed statistics between the sample under test and the population. Subsequently, a random resampling method with replacement was employed to repeatedly draw 6 samples from the 34 population samples, completing a total of 10,000 resampling processes. For each resampling, the differences in statistical measures between the sample and the population were calculated to construct an empirical distribution of the difference indices. Based on this empirical distribution, the two-tailed p-value corresponding to the observed difference was calculated. A significance level of α = 0.05 was used as the test threshold: if the p-value was ≥0.05, the null hypothesis was not rejected, and the sample was considered representative in that dimension; if the p-value was <0.05, the null hypothesis was rejected, and the sample was considered non-representative in that dimension [38].
The results (Table 3 and Table 4) of the sample analysis show that all statistical measures for the eight variables—time, number of corners, longitude, latitude, architectural style, number of stories, height, and building materials—passed the Bootstrap resampling test, indicating no statistically significant differences from the population distribution; all p-values were greater than the 0.05 significance level. These results indicate that the six samples closely align with the distribution characteristics of the population sample across all dimensions—including construction time, number of corners, longitude, latitude, architectural style, number of stories, height, and building materials—and possess good statistical representativeness. They can therefore serve as valid representatives of the population sample for subsequent relevant analyses and research.
Consequently, the Feiying Pagoda, Huilong Pagoda, Dazhu White Pagoda, Buyue Pagoda, Lingyun Pagoda, and Sanbei North Pagoda were ultimately selected as research samples. These six multi-storey pavilion-style pagoda in northeastern Sichuan authentically reflect the architectural style of the Qing Dynasty; this study focuses specifically on analyzing the morphological and structural characteristics of these six feng shui pagodas.

2.2. Experimental Data

Obtaining surveying data and precise drawings of the Feng Shui Pagoda’s structure is a fundamental step in conducting this research. The El-Diasty, M team investigated the use of low-cost unmanned aerial vehicles (UAVs) equipped with LiDAR systems for urban surveying and modeling. Through a case study at Sultan Qaboos University in Oman, they validated the system’s effectiveness in acquiring high-precision 3D point cloud data and generating detailed urban models in complex urban environments [39].
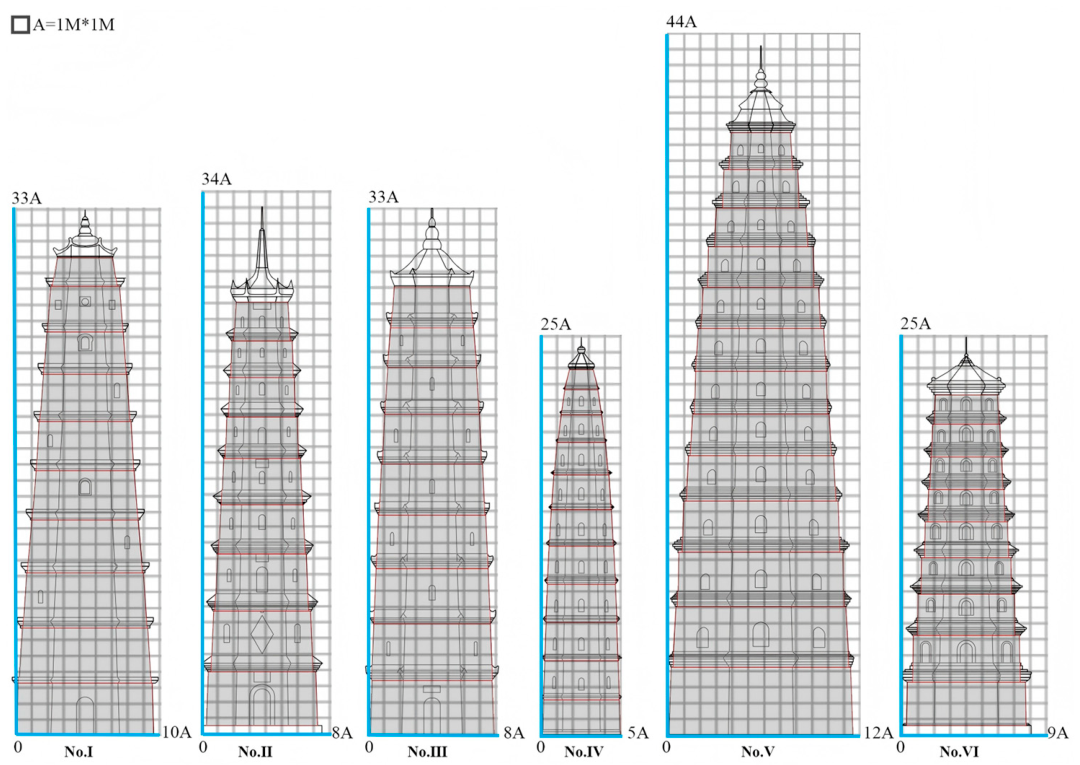
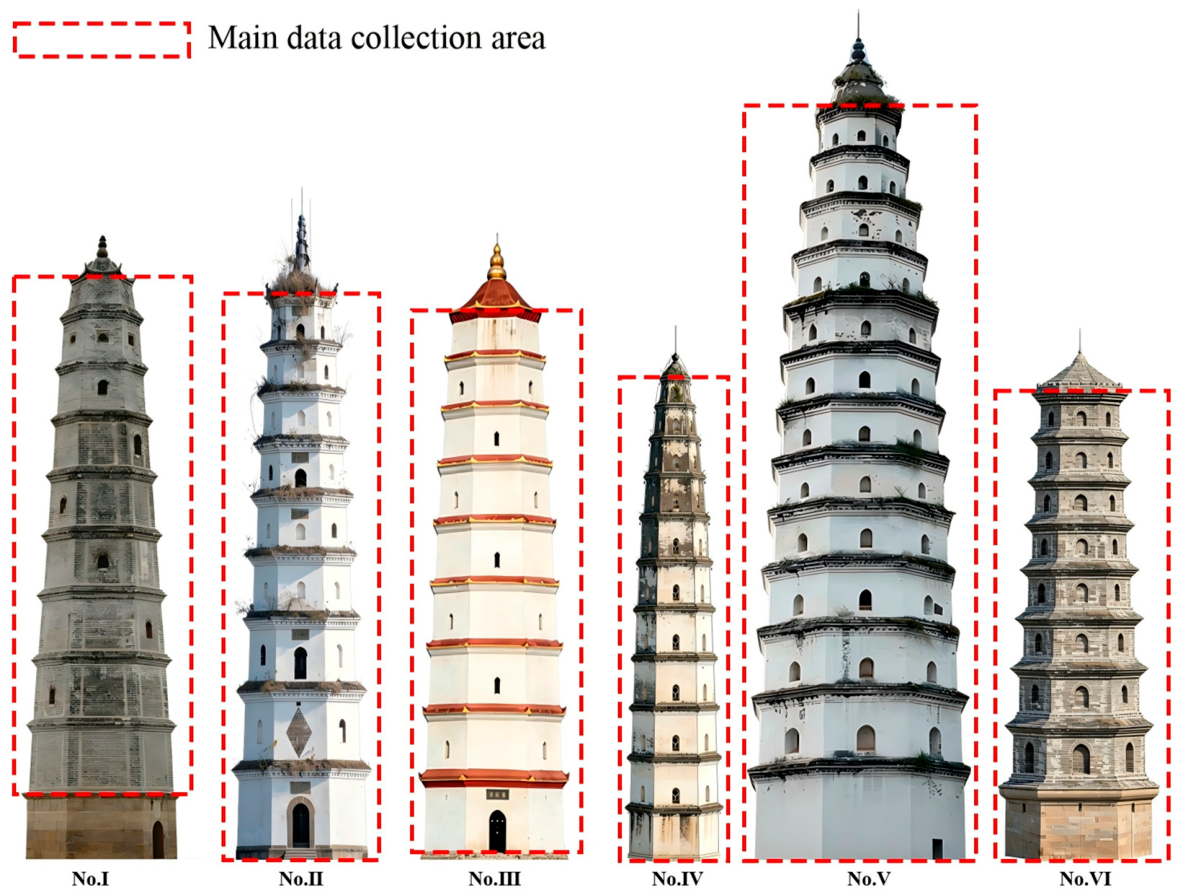
The primary method used in this study was multi-view image-based dense matching 3D point cloud imaging technology. The equipment used was the DJI MATRICE 4E (Shenzhen DJI Innovation Technology Co., Ltd., Shenzhen, China; DJI Terra (3.0.1)), a drone equipped with a high-precision LiDAR system, ensuring the authenticity of the surveying and mapping data. Specific UAV flight quality parameters are provided in Appendix A. The raw RTK positioning accuracy error for POS was in the millimeter range, the RMS error for reprojection was less than 1.5 px, and the feature point density was high, indicating excellent UAV aerial survey quality. By analyzing the measurement data and generating data tables and an outer contour map along the pagoda’s diameter, the objectivity and authenticity of the data used in this study were ensured (Figure 1).

2.3. Methods

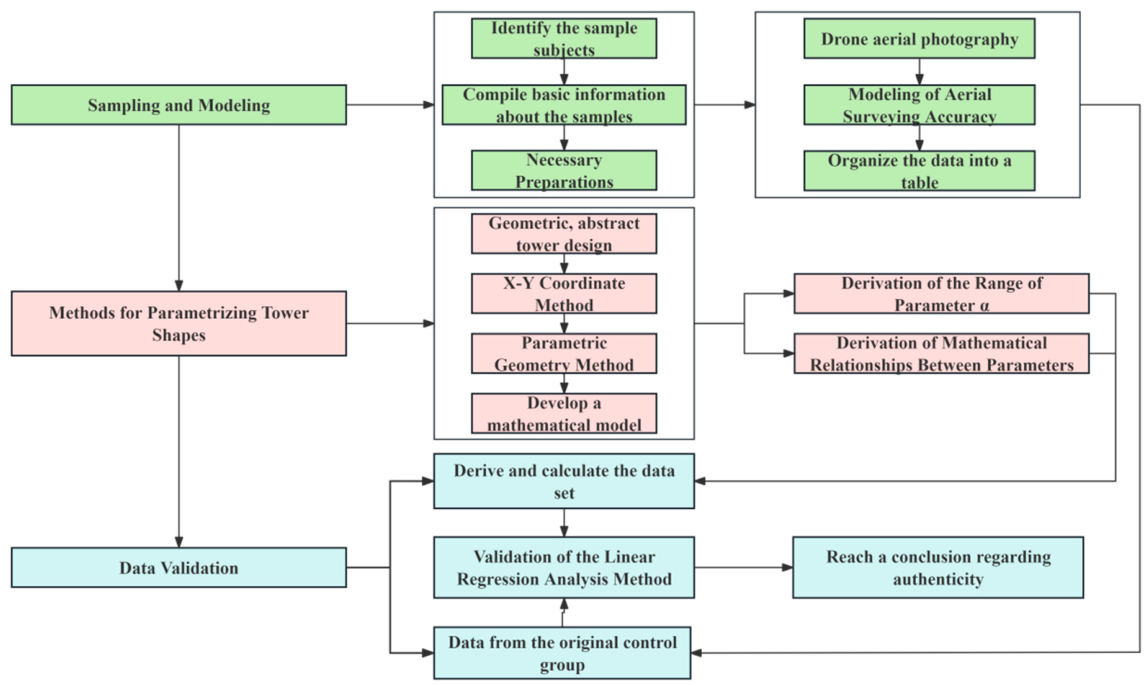
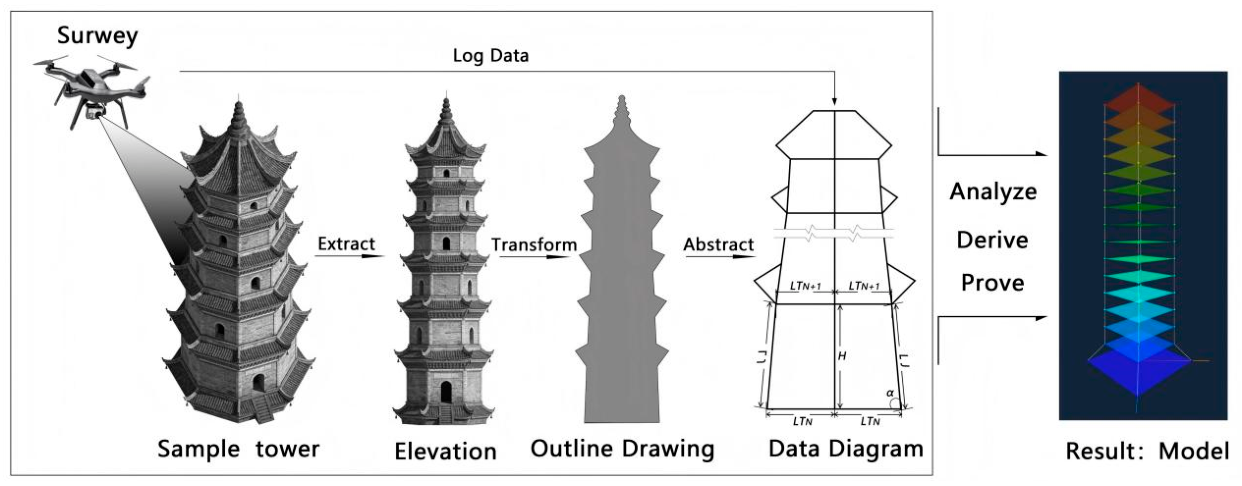
In ancient Chinese multi-story architecture, designers and builders often employed modular principles in the design and construction of buildings. Following this approach, we have adopted parametric geometry to identify the mathematical models underlying the multi-storey pavilion-style pagoda found in Sichuan during the Qing Dynasty. The overall process is shown in Figure 2. First, we used drones to scan the pagoda to obtain structural data and survey photographs. After surveying, we extracted the pagoda’s elevations and contours based on the acquired data and photographs. Finally, we abstracted the extracted contours into geometric shapes, fixed five mathematical parameters, and matched the survey data with the mathematical models to generate an intuitive data model diagram. By employing two types of parametric equations—linear and circular—and utilizing their intersection properties, mathematical relationships between the parameters are identified. The formulas are validated through comparative experiments; if there is no significant error between the control group and the experimental group, the formulas are deemed scientifically sound.

2.4. The ξ Equation

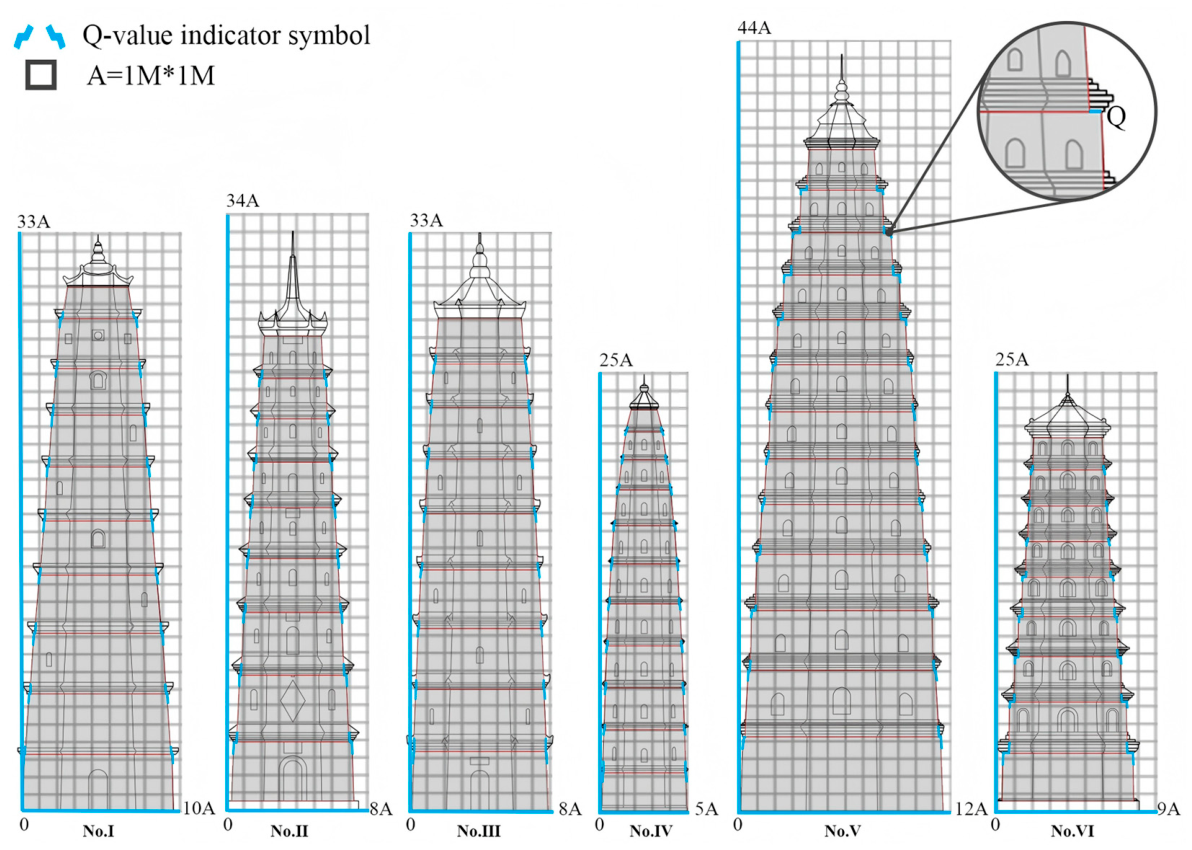
To accurately depict the Pagoda’s geometric shape and its geometric height and width, we quantified these dimensions using 1 m × 1 m grids and traced the geometric shape of a single story of the Pagoda along the outline of the exterior facade, as shown in Figure 3.
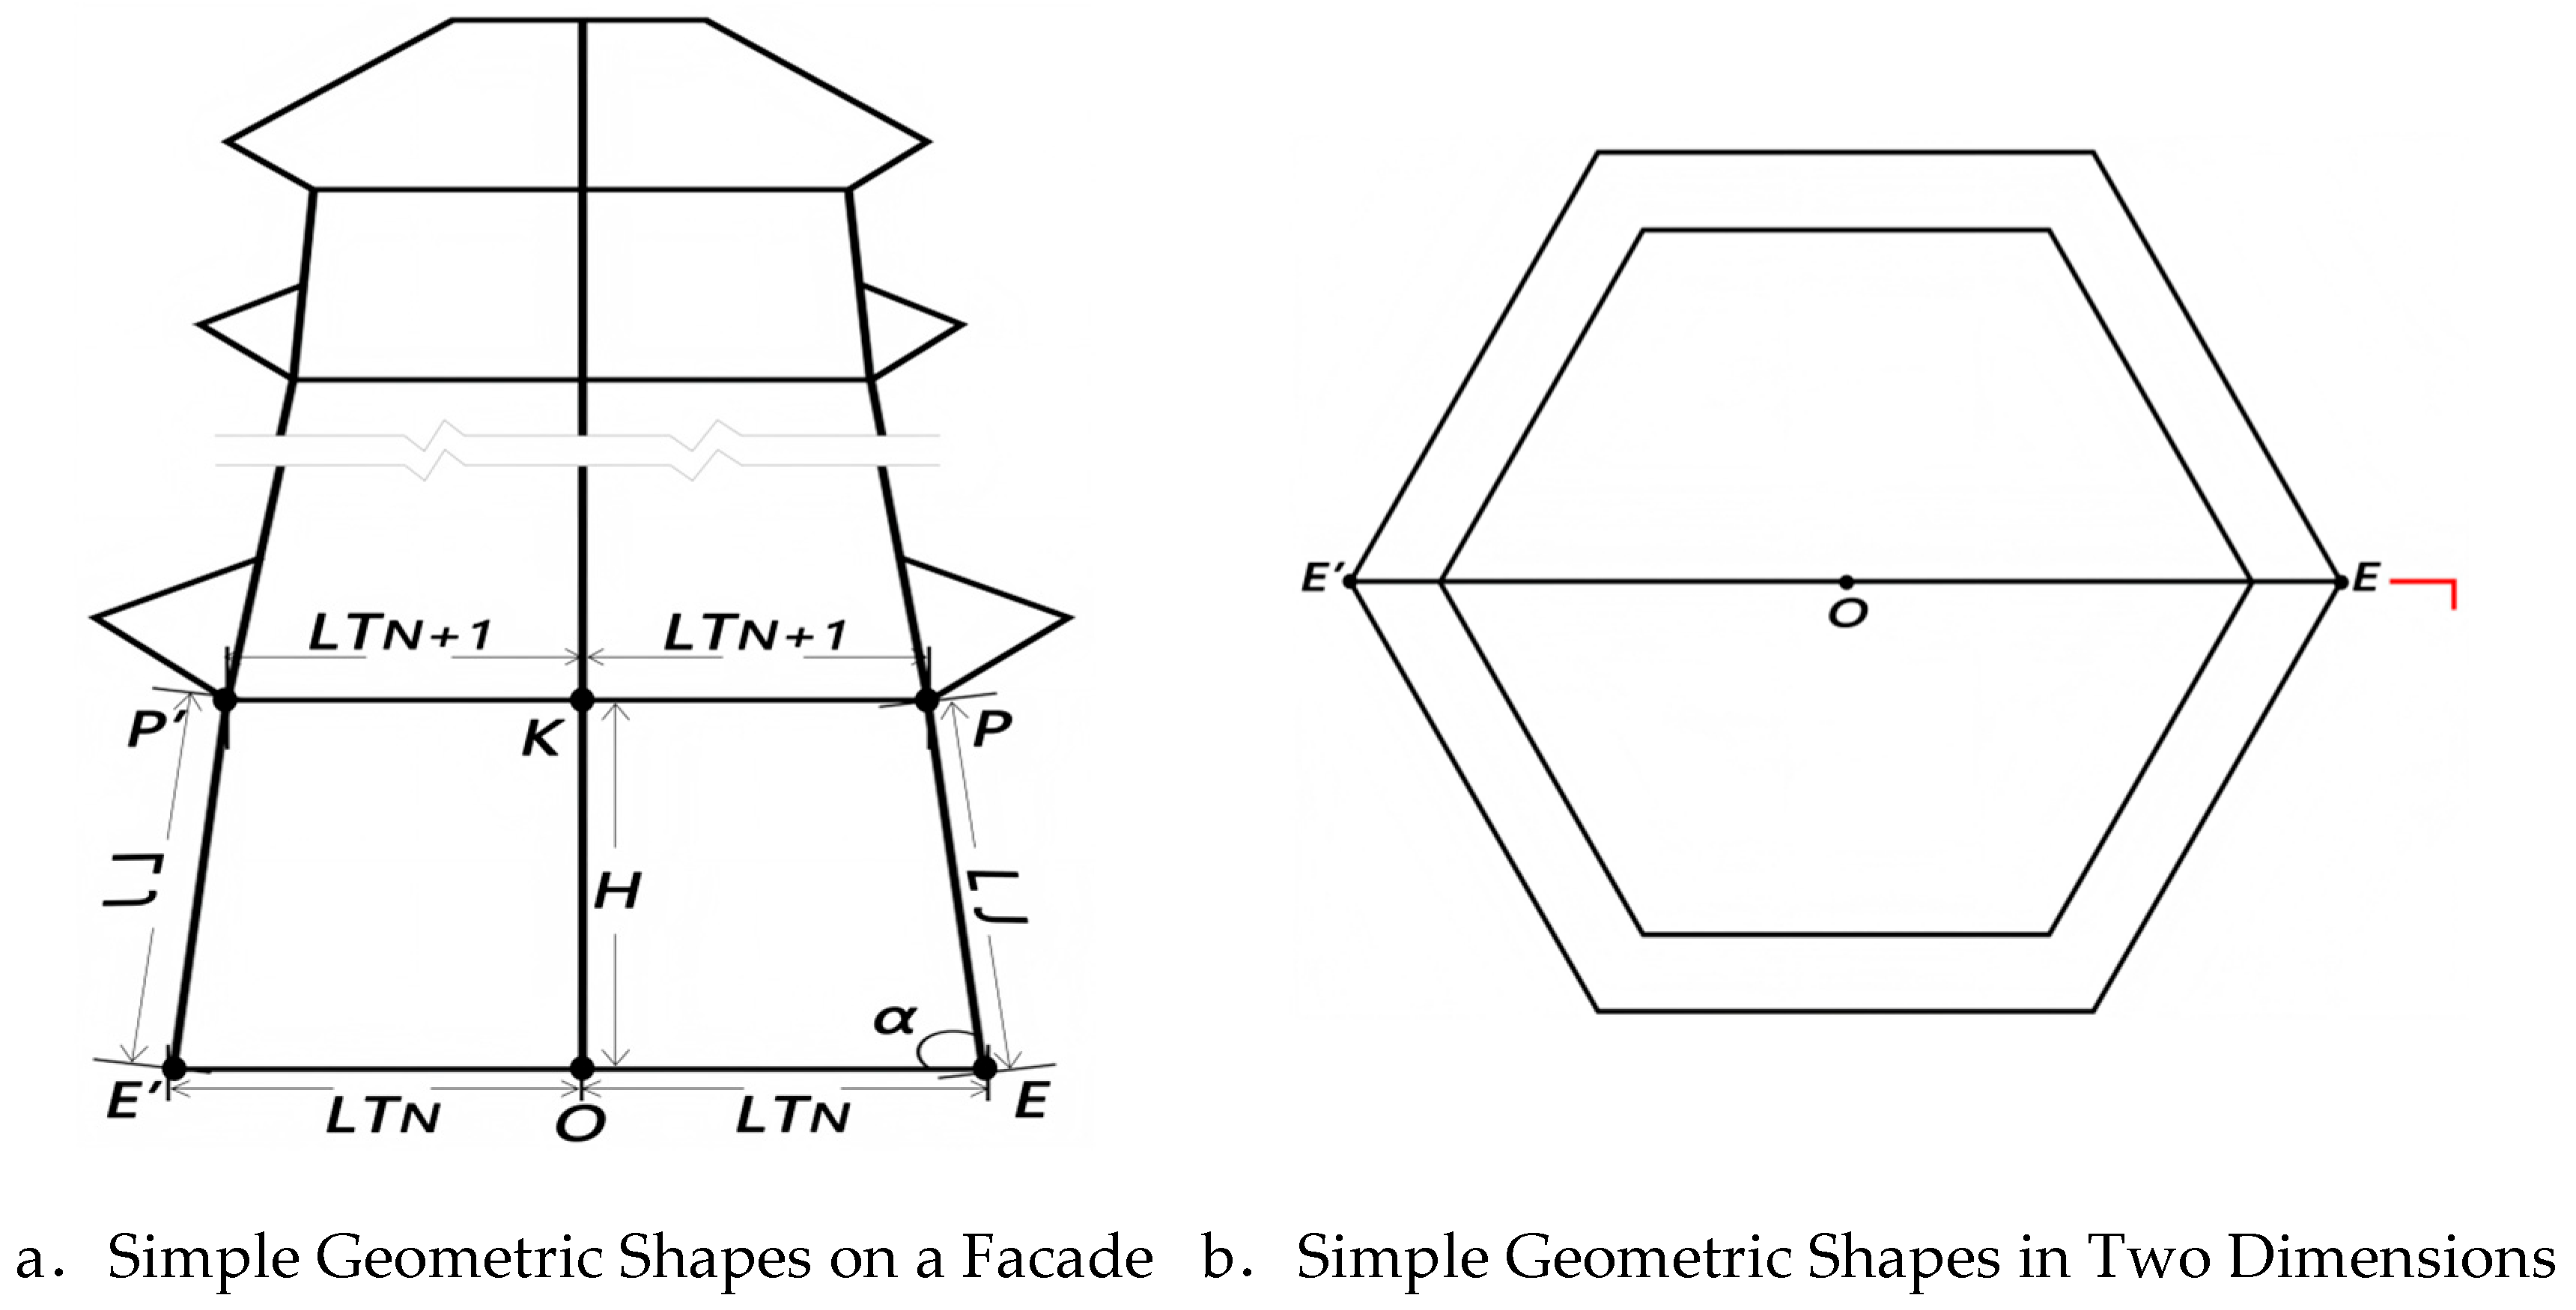
We therefore abstracted it into a simplified trapezoidal shape for analysis, performed mathematical modeling using parametric geometry, and then conducted cross-validation (Figure 3).
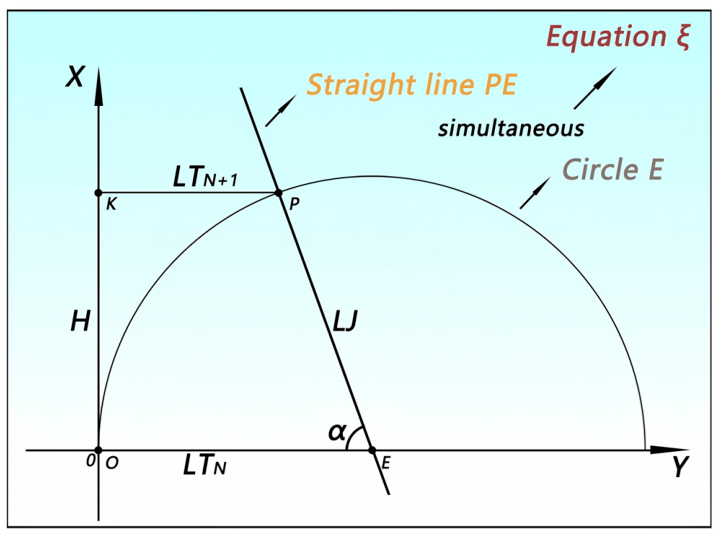
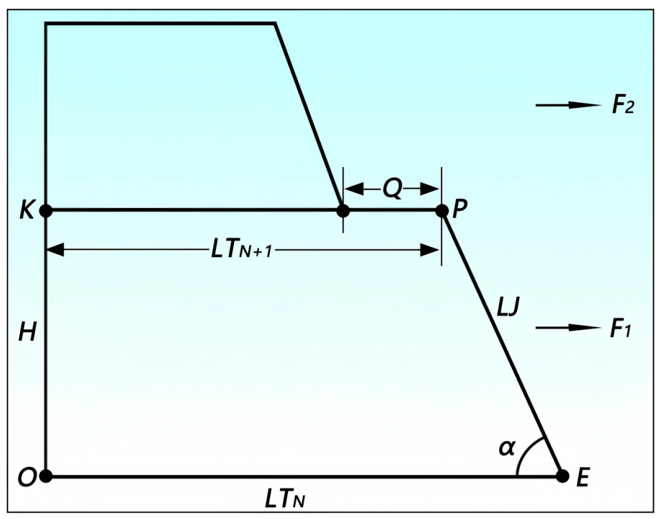
Upon examining the data and configurations, it was found that within the same contour line, the outer endpoint of LTN intersects with the lower endpoint of LJ at point E; the outer endpoint of LTN+1 intersects with the upper endpoint of LJ at point P; and the inner endpoint of LTN intersects with the lower endpoint of H at point O. and the inner endpoint of LTN+1 intersects with the upper endpoint of H at point K. All Pagoda sections belonging to the same level of a single Pagoda can follow this pattern to form right-angled trapezoids. Therefore, for each level of the Pagoda, one corner point is selected for connection, and the rest can be determined by the same principle; simultaneously, the magnitude of the α value determines the degree of inward tapering for each level of the Pagoda, and the physical significance of α is the tapering angle of the Pagoda section (Scheme 1). It was also found that the following five parameters—the height of a single pagoda section (H), the radius of the base plane of the lower pagoda section (LTN), the radius of the base plane of the upper pagoda section (LTN+1), the diagonal of a single pagoda section (LJ), and the taper angle (α)—are the key effective parameters that constitute the pagoda section and determine its form. Therefore, this study focuses primarily on these five core parameters.
We establish a Cartesian coordinate system with point O as the origin, the line containing OK as the Y-axis, and the line containing OE as the X-axis. We define the parametric equation of the circle with center E and radius EP; we also define the equation of the line containing EP. We can clearly see that point P is the point of intersection between the line EP and the circle E, and its coordinates are (LTN+1, H) (Figure 4). Therefore, it can be proven that the two parameters, LTN+1 and H, are calculated using the system of equations formed by the line EP and the circle E. The line EP passes through point E (0, LTN) and point P (LTN+1, H), and its slope is tan(Π-α). Therefore, we can write the equation of the line as:
Y = tan Π α X L T N
The coordinates of the center of the circle, E, are (0, LTN), and its radius is LJ. Based on this, we can write the equation of the circle as:
X L T N 2 + Y 2 = L J 2
From the above, we can see that point P is the point of intersection of the two equations. Therefore, we can determine that LTN+1 and H are calculated values, while LTN, LJ, and α are known values. The calculated values are the dependent variables, and the known values are the independent variables. By observing the data and the changes in the graph, we can see that regardless of how the line EP and the circle E change, point P always lies within the first quadrant of the coordinate axes.
As shown in Table 5, analysis of data from a total of 60 storeys across 6 pagodas reveals that, if a coordinate system is established with point O as the origin, the trajectory of point P (LTN+1,H) always lies within the set of intersection points in the first quadrant of the coordinate system between a circle centered at point E with radius LJ and a straight line passing through point E with slope tan(Π-α). Furthermore, this set of trajectories should form a semicircle. Based on this, the system of equations for the trajectory of point P, ξ, can be written as follows:
ξ =   X L T N 2 + Y 2 = L J 2 Y = tan Π α X L T N
In this set of relationships, for ease of observation and application, a constant i is introduced so that the LJ value is expressed in terms of LTN. Let LJ = LTN + i. Therefore, the above equation can also be expressed as:
ξ =   X L T N 2 + Y 2 = ( L T N + i ) 2 Y = tan Π α ( X L T N )
This study will analyze five core parameters of Qing Dynasty multi-storey pavilion-style pagoda in Sichuan Province: the height of a single pagoda story (H), the radius of the base plane of the lower pagoda story (LTN), the radius of the base plane of the upper pagoda story (LTN+1), the diagonal length of a single pagoda story (LJ), and the angle formed between the diagonal length of a single pagoda story and the diagonal of the base plane of that story (α).
Five parameters determine the form and appearance of a single-story pagoda, and there is an interdependent relationship among these five core parameters. In terms of geometric form, the single-story elevation of Qing Dynasty fengshui pagodas in northeastern Sichuan can be simplified to a right-angled trapezoid, with a plan view as a regular polygon. Only these five parameters—height, upper and lower story radii, diagonal, and taper angle—can fully define the pagoda’s two-dimensional and three-dimensional forms. From a mathematical and computational perspective, the system of simultaneous equations developed in this study relies solely on these five parameters to establish the correspondence between dimensional variables, enabling the quantitative determination of the upper-level radius and the height of a single story. All other pagoda dimensions can be derived from these five parameters without the need for additional independent variables. This five-parameter system also clearly defines the valid range of taper angles and the computational thresholds. Given its geometric completeness, mathematical independence, and practicality for field measurements, this study selected only these five core parameters for modeling (Table 6).

3. Results

3.1. Validation of the ξ Equation

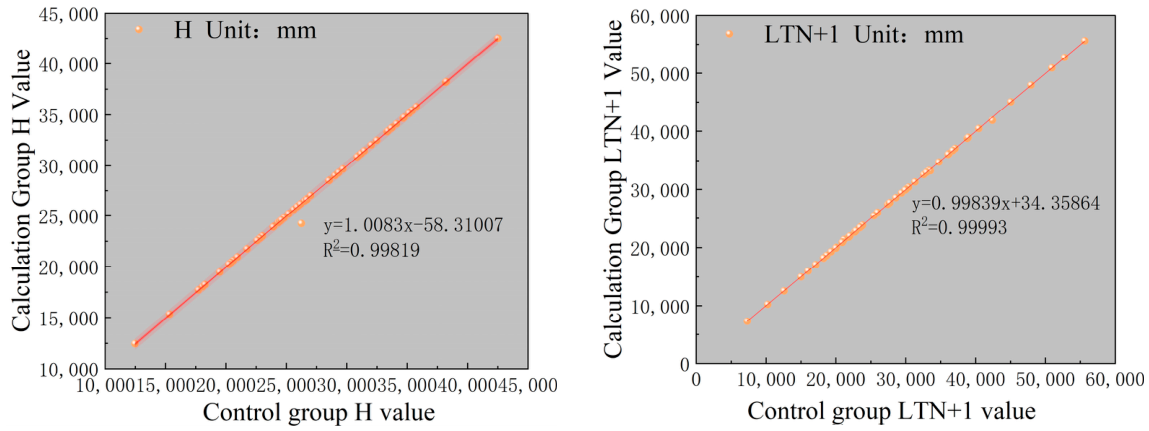
To further verify the correctness and validity of the system of equations, we designed a controlled experimental analysis. First, we set the necessary parameter values—LTN, LJ, and α—in the formula to known conditions, assigned the unknown values of H and LTN+1 to the simulation group, and assigned the originally measured values of H and LTN+1 to the control group; Second, we used the formula to calculate the simulated group and performed a linear regression analysis comparing the simulated group with the control group.
As shown in Scheme 2, a comparative experiment conducted on data from a total of 60 stories across six Qing Dynasty multi-storey pavilion-style pagoda revealed that the R2 value for the goodness-of-fit assessment of the H-value regression in the simulation group was 0.99819, while the R2 value for the goodness-of-fit assessment of the LTN+1-value regression in the control group was 0.99993. To ensure the validity of the results, based on the fitting analysis, we further employed leave-one-out cross-validation to evaluate the predictive performance of the model for H values and LTN+1 values.
The results show that the equation exhibits excellent overall predictive performance, with a Mean Absolute Error (MAE) of 102.4365, a Root Mean Square Error (RMSE) of 210.8207, and a Mean Absolute Percentage Error (MAPE) of only 0.5062%. This indicates that the equation has minimal bias in fitting the training set as a whole and demonstrates stable generalization ability; Looking at the parameters for each target, the equation performs well in predicting H, with an MAE of only 8.0877, an RMSE of 10.7934, and a MAPE as low as 0.04%, indicating virtually no systematic bias; For LTN+1, the MAE is 196.7852, the RMSE is 297.9501, and the MAPE is 0.98%. Although its predictive accuracy for H is not as high as that of the equation for H, its performance is still respectable. Therefore, the equation system ξ is both valid and correct (Table 7).

3.2. Limits of the α Value

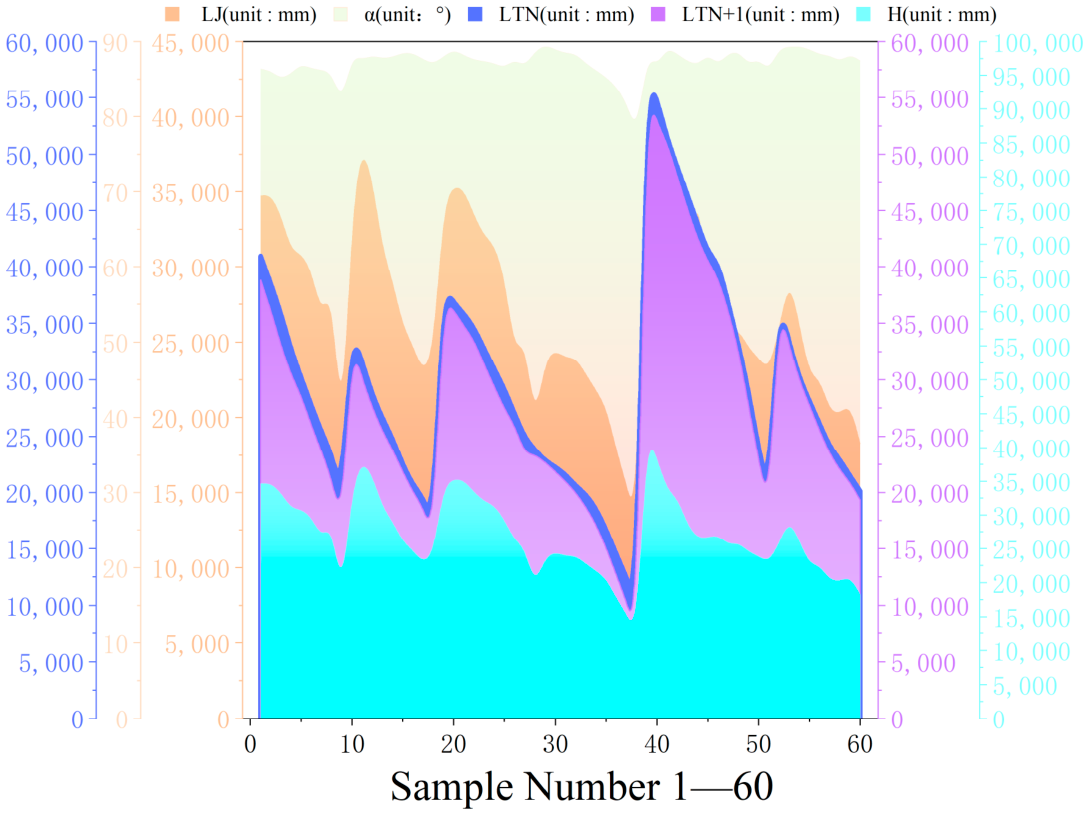
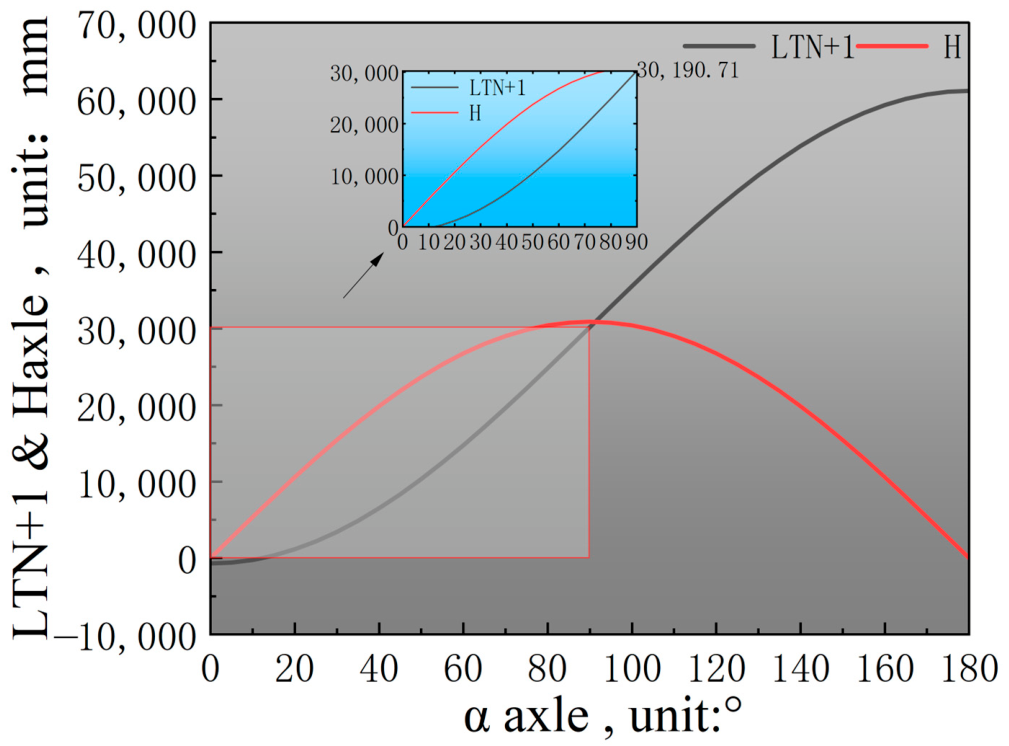
As shown in Figure 5, observation and analysis of data from a total of 60 storeys across six pagodas revealed that, although the α and LJ values fluctuate, point P (LTN+1, H) always follows the trajectory defined by equation ξ, shifting in response to changes in α and LJ. This indicates that point P is a moving point. Furthermore, the data in the figure clearly show that the blue region is always located above the purple region, and both regions lie above the x-axis, where x = 0. Therefore, the LTN+1 value is always less than or equal to the LTN value, and both are consistently greater than 0.
According to equation ξ, the determination of point P (LTN+1, H) primarily depends on the intersection of the line containing LJ and circle E in the first quadrant of the coordinate system. hence the intersection point of the line containing LJ and circle E in the first quadrant of the coordinate system is determined by the slope tanγ, where γ = Π − α; thus, the value of α intuitively determines the position of point P, and the range of variation of α intuitively determines the trajectory of point P—that is, the taper angle of the single-layer Pagoda body. Therefore, determining the range of variation of α allows us to determine the range of point P’s trajectory. Consequently, to satisfy the conditions for forming the Pagoda body, the value of LTN+1 must always be less than or equal to the value of LTN, and both must always be greater than 0. By fixing the LTN and LJ values for a total of 60 single-layer samples from the six Pagodas and slicing their α values in the range [0°, 180°] in 5° intervals, and using the ξ equation to calculate their H and LTN+1 values, we observed the behavior of the LTN+1 values. We found that under the two conditions—where LJ is greater than LTN and where LJ is less than LTN—LTN+1 exhibits different behaviors as α varies, which directly determines the valid range of α values.

3.2.1. Determining the Range of α Values When LJ Is Less than LTN

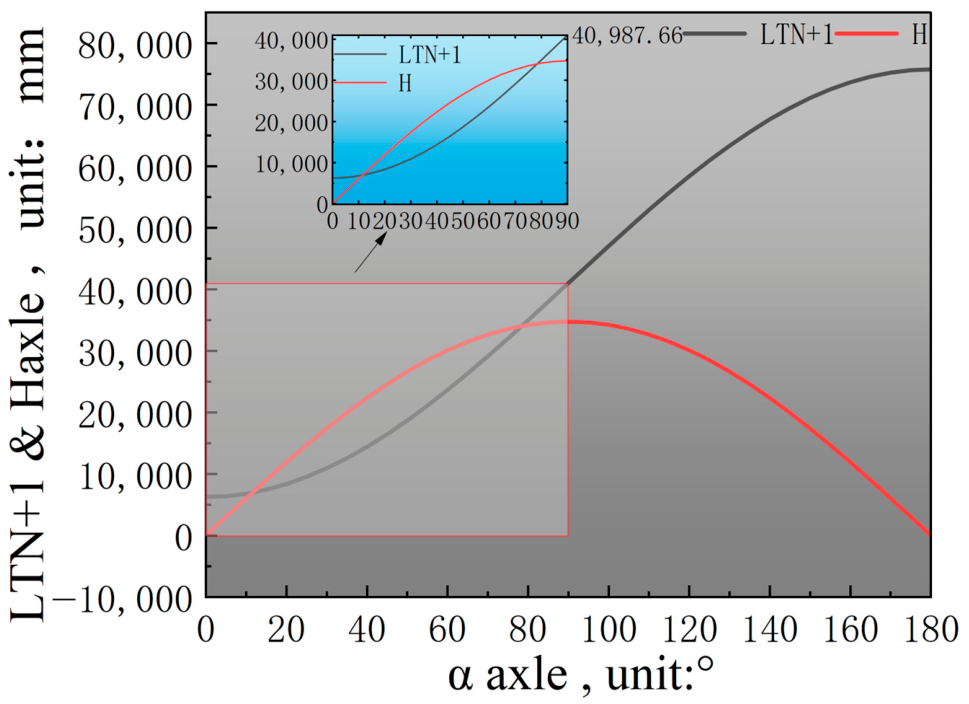
Among the 60 selected units, 27 fall into the category where LJ is less than LTN. The trends and patterns in the data across each layer are highly consistent, demonstrating good repeatability; therefore, a representative set of data from this group has been selected for presentation and analysis (Figure 6).
Examination of this schematic diagram reveals that, under the conditions where the LTN+1 value is always less than the LTN value and both are greater than 0, the range of α values is (0°, 90°]. Therefore, analysis of the 27 data sets demonstrates that when the LJ value is greater than the LTN value, the range of α values for which a story Pagoda can be formed is (0°, 90°].

3.2.2. Determining the Range of α Values When LJ Is Greater than LTN

Among the 60 selected cells, 33 fall into the category where LJ is greater than LTN. The trends and patterns in the data across each layer are highly consistent, demonstrating good reproducibility; therefore, a representative set of data from this group has been selected for presentation and analysis.
As can be seen from Figure 7, when α is 12.26°, the value of LTN+1 is 0; when α remains less than 12.26°, the value of LTN+1 is less than 0; when α is 90°, the value of LTN+1 is equal to the value of LTN; and when α exceeds 90°, the value of LTN+1 is greater than the value of LTN. Therefore, the range of α values that satisfies the condition “ensuring that the LTN+1 value is always less than or equal to the LTN value while also ensuring that it is always greater than 0” is (12.26°, 90]. This indicates that the minimum value of α is:
lim α 12.26 °   α = 12.26 °
At this point, the coordinates of the moving point P are (0, 6560.16). Therefore, it can be proven that when the moving point P of equation ξ moves to the Y-axis, α attains its minimum value:
lim α 12.26 °   α = 12.26 °
It is also proven that α attains its minimum value only when the moving point P of equation ξ moves to the Y-axis. Following this line of reasoning, we can derive an expression for the minimum value of α. Let the coordinates of point P be (0, Y1) when the moving point P of equation ξ moves to the Y-axis. Substituting the coordinates of point P into the linear equation of equation ξ yields:
tan γ = ( Y 1 ÷ L T N )
Using the tangent value tanγ and the inverse tangent function, we obtain:
γ = tan 1 [ ( Y 1 ÷ L T N ) ] ( 180 ÷ Π )
Since γ = Π − α, we have α = Π − γ, so we obtain:
lim α Π tan 1 [ ( Y 1 ÷ LT N ) ] ( 180 ÷ Π ) α = Π tan 1 [ ( Y 1 ÷ L T N ) ] ( 180 ÷ Π )
Also, since LJ = LTN + i, we obtain the following from the Pythagorean theorem:
Y 1 = H = i ( i + 2 L T N )
The minimum value of α is:
lim α Π tan 1 [ ( i ( i + 2 LT N ) ÷ LT N ) ] ( 180 ÷ Π ) α = Π tan 1 [ ( i ( i + 2 L T N ) ÷ L T N ) ] ( 180 ÷ Π )
Moreover:
α m i n ϵ [ 0 , Π ]
As the core parameter determining the position of the moving point P and the rationality of the pagoda parameters, the range of values for α has been clearly defined as a fixed interval through theoretical derivation and experimental verification. From a theoretical perspective, the position of point P is determined by the intersection of the line containing LJ and circle E in the first quadrant; this intersection point is controlled by the slope tanγ, where γ = π − α. Therefore, the value of α directly determines the trajectory of point P, and its range is critical for the pagoda body to satisfy structural conditions. Through specialized experimental verification (using a sample of 33 data sets, with fixed LTN and LJ values, and slicing the α value at 5° intervals within the [0°, 180°] range to calculate H and LTN+1 values using the equation ξ), a clear conclusion was reached: when the α value is less than 12.26°, the LTN+1 value is less than 0, which does not meet the structural requirements for the pagoda body; when α equals 90°, LTN+1 equals LTN, reaching a critical equilibrium state for the pagoda parameters; when α exceeds 90°, LTN+1 exceeds LTN, violating the structural logic of the pagoda’s tapering design. Therefore, the fixed range of α values that satisfies the pagoda design conditions is [12.26°, 90°].
Using the values of LTN and LJ = LTN + i, we substitute them into αmin to perform a reverse calculation, yielding:
α m i n = lim α 12.2598 °   α = 12.2598 °
It differs from 12.26° by only 0.0002°. Therefore, it can be shown that the range of values for α is:
α ϵ ( Π tan 1 [ ( i ( i + 2 L T N ) ÷ L T N ) ] ( 180 ÷ Π ) , 90 ° )

3.3. Design Criteria for Single-Story Towers

Our analysis of five core parameters across a total of 60 single-story pagoda sections from six sample pagodas revealed that the ξ equation has a fundamental prerequisite for parameter calculation. First, among the five core parameters, there must be a clear quantitative distinction between the number of known and unknown variables. Second, among the five core parameters, there are one or two key parameters. To verify these two findings, we designed two sets of experiments: an experiment to derive the minimum effective number of core parameters and an experiment to perform linear fitting analysis on the key parameters.

3.3.1. Experimental Derivation of the Minimum Effective Quantity for Key Parameters

Our primary approach is as follows: First, based on the five core parameters, we set the number of known variables M to 1, 2, 3, and 4, respectively, with corresponding numbers of unknown variables of 4, 3, 2, and 1. Next, we use the formula for the number of combinations to calculate the number of combinations corresponding to each number of known variables; Third, based on the calculated number of combinations, we perform further calculations using the formula to determine whether a successful result can be obtained; Finally, based on the minimum number of known variables in the obtained result, we determine the minimum number of parameters required for the ξ system of equations. The number of combinations obtained using the formula for the number of combinations and the specific permutations and combinations are shown in Table 8.
Based on the permutations and combinations of the known variables, the values for the 60 single-layer pagoda configurations were substituted into the system of equations ξ to calculate the corresponding values. The results are summarized in Table 9.
An examination of Table 5 reveal that when M < 3, the ξ system of equations does not yield valid solutions; when M ≥ 3, the ξ system of equations yields valid solutions. This clearly demonstrates that the minimum number of effective core parameters is 3.

3.3.2. Experimental Analysis of Linear Fitting for Key Parameters

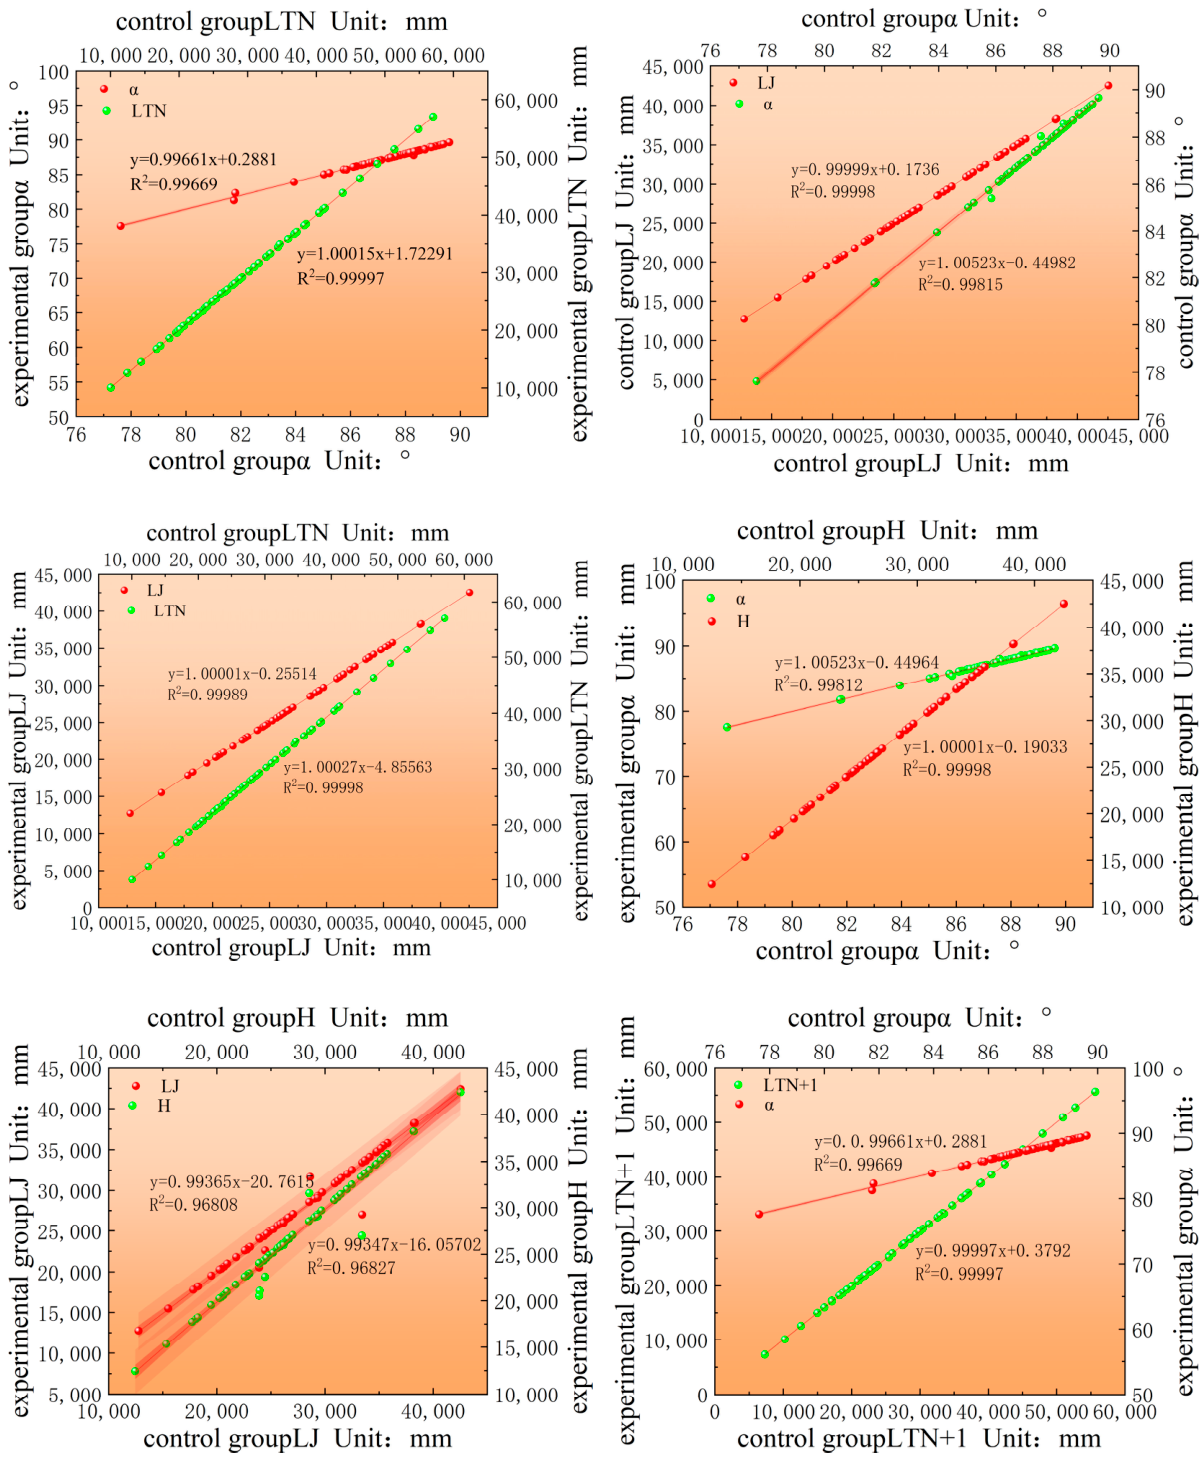
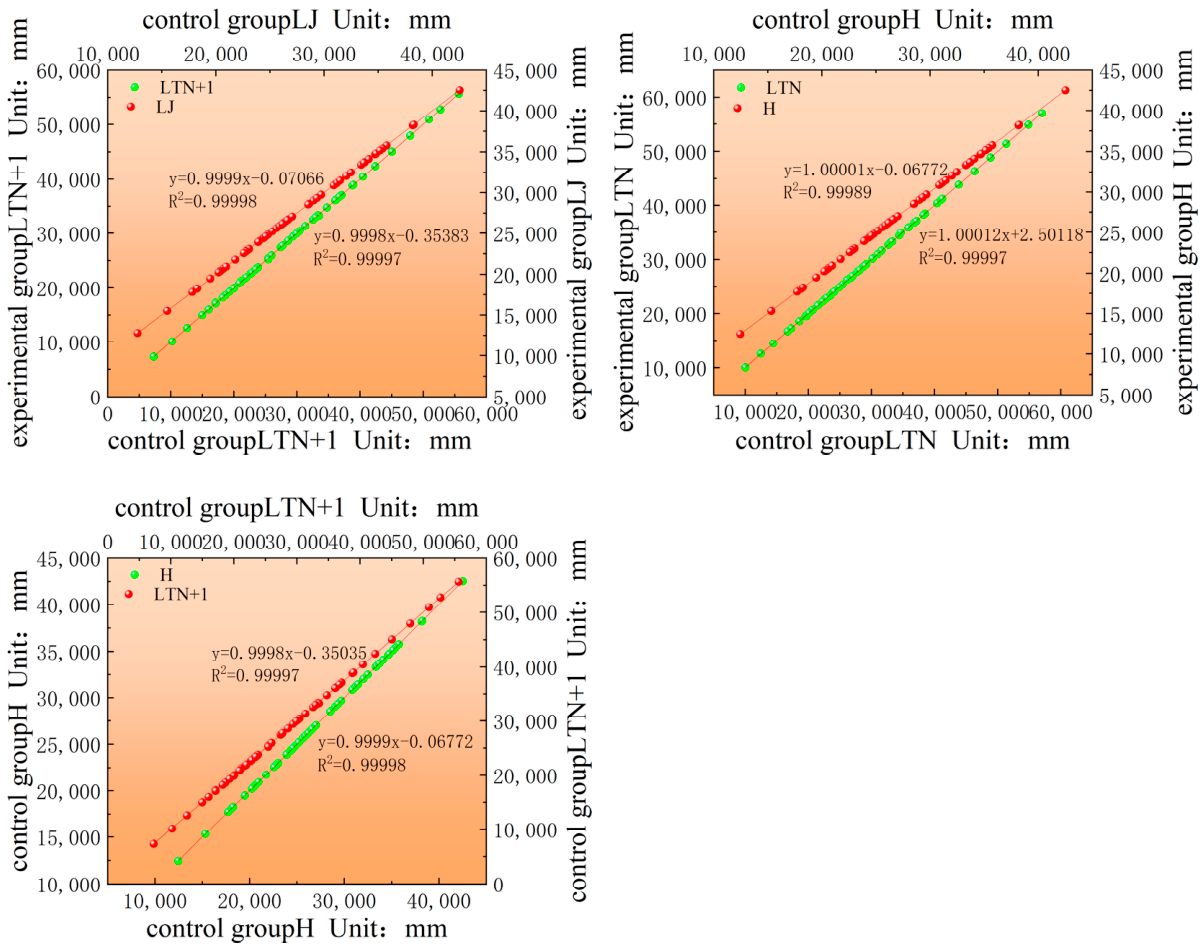
The minimum effective number f core parameters, M = 3, has been determined. To verify the authenticity and accuracy of the core parameter calculation results when M = 3, we designed a linear fitting analysis using a controlled experiment based on a total of 60 sets of single-layer data from the six selected sample pagodas. First, using the permutation formula, we identified all possible combinations of the five core parameters when M = 3. Second, we identified the known parameter terms and evaluated the remaining unknowns, defining the calculated values as the observation group; the original survey values of the unknown terms were defined as the control group. Finally, we set the standard for the regression goodness-of-fit evaluation R2 to 0.9. If the result of the linear fit is R2 > 0.9, it indicates that the result has excellent explanatory power for the observed group; if the result is R2 = 0.9, it indicates that the result has moderate explanatory power for the observed group; if the result is R2 < 0.9, it indicates that the result lacks explanatory power for the observed group.
Using the formula for combinations, C(5, 3), the permutations and combinations are calculated as shown in Table 10.
Based on permutations and combinations, a linear regression analysis was performed on the experimental and control groups, yielding Scheme 3.
Table 11 was compiled based on the results of the linear regression analysis. For detailed information on the data, please refer to Supplementary Materials.
After comparing the calculated values with the original values for each data set, we found the following: First, among the ten data sets, nine had an R2 value greater than 0.9. Second, during the calculation of the 10th data set, it was discovered that the values of the remaining two parameters were unrestricted, making it impossible to obtain valid results; Third, among the nine sets of permutations and combinations that yielded valid results, the value of LTN appeared alone 3 times, the value of LTN+1 appeared alone 3 times, and the combination of LTN and LTN+1 appeared 3 times.
To ensure the validity of the results, based on the fitting analysis, we continued to use leave-one-out cross-validation to evaluate the model’s predictive performance for the unknown parameters across the nine permutations: We iterated through all measured Pagoda samples, excluding a single sample at a time as the validation sample, and used all remaining samples to build a predictive model with the known terms from the nine permutations as inputs. We then made predictions for the excluded sample and recorded the errors; Once all samples have undergone a single round of validation, we aggregated all error sequences and calculated the overall MAE, RMSE, and MAPE to quantitatively characterize the model’s generalization and prediction capabilities. This method makes full use of the limited measured data, avoids the variability in results caused by random division of the dataset, and yields stable and reproducible evaluation results.
In this study, “leave-one-out” cross-validation with “3 known variables and 2 unknown variables” was conducted on 60 sets of single-layer pagoda body samples (60 sequence samples divided into 9 groups, covering core fields such as LJ, H, and LTN, with a wide range of numerical values and generally stable α values). A total of 9 sets of validation metrics were obtained, which collectively exhibit the characteristic of “stable performance in most subgroups with significant variations in a few”: the average MAE across the 9 subgroups was 124.15, the average RMSE was 289.58, and an average MAPE of 4.20%. Among these, Group ② demonstrated the best validation performance, with an MAE of only 8.04, an RMSE of 17.51, and a MAPE of 0.32%; all metrics were far below the overall average, showcasing the model’s extremely high predictive accuracy. Group ⑤ performed the worst, with an MAE as high as 331.49, RMSE as high as 1106.09, with a significant increase in absolute error directly related to the high numerical magnitude of the samples in this group; the validation results for the remaining 7 groups were generally at a moderate level, with MAE values concentrated in the 102–197 range and MAPE all below 1%. The model demonstrated excellent prediction stability and relative error control across most groups, and the overall leave-one-out cross-validation results indicate that the model possesses good generalization ability (Table 12).
Based on this, the computational eligibility criteria for a single-story pagoda body can be established: the number of known design parameters for the pagoda body, M, is ≥3, and among the three parameters, at least one of LTN and LTN+1 is known.

4. Discussion

This study formulates hypotheses and verifies the mathematical patterns in the design of multi-storey pavilion-style pagoda in northeastern Sichuan Province. The primary method employed involves abstracting the actual pagoda forms into mathematical figures and then using parametric geometry tools to calculate and verify these mathematical patterns. It is worth noting that the forms of these Feng Shui pagodas, constructed during the Qing Dynasty, generally align with the mathematical patterns of parametric geometry. This opens the door to computational approaches for studying the morphology of such multi-story, brick-and-stone pagoda-style Feng Shui pagodas from the Qing Dynasty. Furthermore, these findings have prompted us to delve deeper into several key issues.
First, this study established a parametric geometric framework to quantify the morphological design logic of Qing Dynasty multi-storey pavilion-style pagoda in northeastern Sichuan and systematically verified the stability and applicability of the derived mathematical models. The research findings reveal the mathematical rules underlying the morphology of Qing Dynasty multi-storey pavilion-style pagoda in this region, providing a method of universal significance for the study of ancient multi-story architecture.
As shown in Figure 8, the primary method employed simplifies the main body of the Feng Shui Pagoda into a right-angled trapezoid and establishes a system of ξ equations, using parametric geometry tools to calculate and verify mathematical patterns. This establishes stable mathematical relationships among the five core parameters: story height, lower base radius, upper base radius, diagonal length, and angle α. The results confirm a high degree of correspondence between the morphological structure of Feng Shui pagodas and parametric geometry. Unlike previous studies that focused on component dimensions or modular proportions, this study directly decomposes the pagoda body into mathematical figures composed of line segments for verification and analysis, thereby providing a more comprehensive explanation of the design logic behind Feng Shui pagodas. The results of this high-precision geometric fitting show that core spatial parameters of Qing Dynasty ancient pagodas within the scope of this study—including plan layout, story height ratios, and tapering curves—exhibit a very high degree of geometric consistency. Their overall forms can be accurately fitted by a unified parametric mathematical model, reflecting a stable and precise intrinsic geometric order in the construction of ancient pagodas during this period. It should be noted that the mathematical and geometric patterns objectively manifested in architectural remains do not equate to ancient craftsmen possessing a proactive and conscious intent for parametric design from a modern engineering perspective. Based on the Qing dynasty’s *Regulations and Examples for Engineering Practices of the Ministry of Works* and historical records of traditional construction, such precise geometric forms primarily stem from the mature modular system of official architecture, fixed construction paradigms, and standardized construction expertise passed down through generations of craftsmen. They represent the objective outcome of a highly standardized traditional empirical construction system, rather than forward-looking designs actively developed by craftsmen using parametric mathematical logic. Unlike previous studies that focused on component dimensions or modular proportions, this research directly simulates the evolution of the Fengshui Pagoda’s overall silhouette, providing a more comprehensive interpretation of its design logic.
The defined effective range of the angle α and its minimal calculation formula provide strict geometric constraints for the pagoda’s form. Experimental verification indicates that, under actual structural conditions, the effective range of α is strictly correlated with the difference between LJ and LTN: when the difference between LJ and LTN is negative, the effective range of α is (0°, 90°]; when the difference between LJ and LTN is positive, the effective range of α is:
α ϵ ( Π tan 1 [ ( i ( i + 2 L T N ) ÷ L T N ) ] ( 180 ÷ Π ) ,   90 ° )
This ensures that the pagoda tapers continuously inward and that the radius of the upper section remains positive. This range was not arbitrarily determined but was derived from the geometric constraints resulting from the intersection of circular trajectories and linear gradients, reflecting the ancient engineers’ profound understanding of trigonometric relationships. The minimum value obtained from theoretical calculations exhibits an extremely high coefficient of determination (R2 > 0.96) compared to measured values, further validating the reliability of this geometric model. These quantifiable boundary conditions fill a critical gap in previous research on Fengshui pagodas—where proportional constraints were often based on empirical observations rather than mathematical derivations.
Furthermore, during the course of our research, we identified a phenomenon: in addition to the five core parameters already discovered, there exists a constant Q, which primarily represents the indentation distance of each pagoda level.
Second, during our research, we observed a phenomenon: in addition to the five core parameters already identified, there is a constant Q. As shown in Figure 9, its primary physical significance is the inward indentation distance of the single-layer pagoda body (LTN). The positions of the constant Q within the pagoda bodies of the six sample pagodas are shown in the figure.
As shown in Table 13, data from six sample pagodas have been selected here for presentation and analysis:
We calculated the sum of F2LT1 and F2Q for each layer starting from the second layer of the six sample pagodas and found that the sum of F2LT1 and F2Q matched the F1LT2 values 100% of the time. Based on this, we can derive a consistent rule for interlayer radial shrinkage:
F N L T N + 1 = F N + 1 L T N + F N + 1 Q
This reveals the mechanism governing vertical sequencing in the design of Fengshui pagodas. The contraction distance Q serves as a stabilizing adjustment parameter connecting adjacent layers, ensuring the smooth continuity of the overall silhouette. This finding indicates that the construction of Fengshui pagodas follows a continuous parametric strategy—either top-down or bottom-up—rather than independent layer-by-layer construction. This generative design mechanism embodies the logic of prefabrication and assembly at higher levels found in traditional stone and brick masonry structures, echoing research on the modular systems of wooden Buddhist pagodas and official architecture (Figure 10).
Third, we have verified and identified the admission criteria for parametric calculations: the number of known design parameters M for the pagoda body must be ≥3, and among these three parameters, at least one of LTN and LTN+1 must be a known value. This establishes a standardized workflow for the parametric reconstruction of Fengshui pagoda forms. This criterion also ensures the determinism and physical feasibility of the computational results. The study confirmed that when the number of known design parameters M = 3, there are 10 parameter combinations. Among these, one combination yielded no valid solution due to the exclusion of radial parameters, while the remaining nine yielded valid solutions. This highlights the dominant role of radial dimensions in controlling vertical profiles. This finding supports the modular design theory of ancient Chinese architecture, namely that horizontal dimensions serve as the core regulatory parameters for vertical proportions. This standard also enhances the practical value of parametric models in heritage restoration, enabling reliable prediction of missing parameters even with limited measurement data.
In summary, we proposed and validated a reliable mathematical model for single-story pagoda bodies and identified the indentation distance value Q between them. To verify the model’s universality, we primarily conducted our analysis on six typical Qing Dynasty pagodas of the pavilion-style design located in northeastern Sichuan. The core research method we validated involves abstracting the geometric form of the pagoda body, establishing a Cartesian coordinate system, and introducing parametric equations of straight lines and circles to construct a mathematical model. Using this model as the core, we reveal the morphological patterns inherent in single-story multi-storey pavilion-style pagoda. Therefore, within the framework of this core methodology, our work confirms the practical value and suitability of parametric geometry for studying the morphology of Qing Dynasty multi-storey pavilion-style pagoda in northeastern Sichuan. Theoretically, this parametric geometric research method can be extended to polygonal, multi-story brick and stone Pagodas from other dynasties that exhibit distinct geometric characteristics. The representativeness of the sample has been confirmed through statistical methods; however, regional variations in proportional systems may exist across other dynasties and architectural types. When applying this method, modeling, verification, and analysis should be conducted using different parametric geometric equations tailored to the specific geometric forms of the Pagodas. This will facilitate the transition of research on traditional architectural forms from qualitative descriptions to precise quantitative analysis.


5. Conclusions

From the perspective of parametric geometry, this study focuses on Qing Dynasty multi-storey pavilion-style pagoda in northeastern Sichuan, aiming to investigate the suitability of parametric geometry methods for researching these structures. The study employed two sets of parametric equations and analyzed six Qing Dynasty multi-storey pavilion-style pagoda from northeastern Sichuan with different key parameters. The main conclusions are as follows:
  • Parametric geometry demonstrates a high degree of suitability for studying the morphology of Qing Dynasty feng shui Pagodas in northeastern Sichuan. The simulation results from the parametric equations matched the original field data with 99% accuracy, and the MAPE values from leave-one-out cross-validation were all below 1%.
  • The range of values for the key parameter α in Qing Dynasty multi-storey pavilion-style pagoda in northeastern Sichuan is influenced by the difference between the parameter values LJ and LTN. When this difference is greater than 0, the range of α values is:
    α ϵ ( Π tan 1 [ ( i ( i + 2 L T N ) ÷ L T N ) ] ( 180 ÷ Π ) ,   90 °   ]
    When the difference is <0, the range of α values is (0, 90°). The verification results for the minimum range of the parametric equations differ from the original results by only 0.0002°.
  • The valid computational criteria for the single-stage pagoda parameter equation are as follows: the number of known design parameters M must be ≥3, and at least one of the three parameters—LTN and LTN+1—must be known. The study found that when M ≥ 3, the linear fit between the simulation data from the parameter equation and the original data was 99%, and the MAPE from leave-one-out cross-validation was consistently below 1.2%.
This study confirms that the morphological parameters of Qing Dynasty feng shui pagodas in Sichuan, which feature a pavilion-style design, follow quantifiable and derivable mathematical patterns. This discovery fills a gap in research on mathematical models of Qing Dynasty feng shui pagodas in Southwest China. The parametric equations derived using parametric geometry provide a scientific, quantitative tool for the morphological study of Qing Dynasty feng shui pagodas. This research is of significant value to the field of feng shui pagoda design and also offers valuable insights for the study of ancient Chinese multi-story architecture.

Supplementary Materials

The following supporting information can be downloaded at: https://www.mdpi.com/article/10.3390/buildings16142749/s1.

Author Contributions

Conceptualization, G.Q.; Methodology, G.Q.; Validation, G.Q.; Formal analysis, G.Q.; Investigation, G.Q.; Resources, B.C.; Writing—original draft, G.Q.; Writing—review & editing, B.C.; Visualization, G.Q.; Supervision, B.C.; Funding acquisition, G.Q. All authors have read and agreed to the published version of the manuscript.

Funding

This research received no external funding.

Data Availability Statement

The raw data supporting the conclusions of this article will be made available by the authors on request.

Acknowledgments

DeepL (26.5.1) was utilized for language translation during the preparation of this manuscript. The authors have reviewed and edited the output and take full responsibility for the content of this publication.

Conflicts of Interest

The authors declare no conflicts of interest.

Abbreviations

The following abbreviations are used in this manuscript:
HSingle-story tower height
LTNBase radius
LTN+1Upper plane radius
LJCorner radius
αConvergence angle
iConstant, Represents the difference between LJ and LTN
QIndentation Value

Appendix A

Table A1. Basic Surveying Data for the Sample Tower Structure.
NumberLJHLT1LT2Qα
NO. I34,736.5634,667.7140,987.6638,801.82086.39
34,822.9134,742.3138,510.6936,142.75291.1386.1
33,451.6233,325.7935,925.3433,026.66217.4185.03
31,066.1930,980.6632,706.3630,402.76320.3185.75
30,895.2230,853.2530,190.7128,580.86212.0587.01
29,739.9729,682.1427,775.1325,921.26805.7386.43
26,732.0426,673.9925,404.6223,643.84516.6486.22
28,631.2828,552.0423,464.1521,335.61179.6985.85
18,234.8418,072.7319,705.8517,104.331629.7181.80
NO. II33,773.2533,755.1734,422.9933,317.88088.12
38,215.3238,183.1731,620.3830,053.181697.50 87.65
35,785.6735,766.5828,682.6127,513.841370.5788.13
31,210.9531,188.00 26,645.6325,448.94868.2187.80
29,041.1829,022.6624,856.9723,820.02591.9787.95
26,048.1826,039.5822,487.5321,818.091332.4988.53
24,820.9124,812.0220,725.00 20,064.161093.0988.47
22,935.1622,915.7919,559.7618,615.28504.40 87.64
24,363.7524,330.6117,284.1716,013.90 1331.1187.01
NO. III34,134.6834,114.3138,253.2737,074.15088.02
35,426.2235,420.0236,847.6436,184.74226.5188.93
35,169.0535,151.50 35,859.2234,748.09325.5288.19
33,439.0233,409.2434,662.8333,251.8685.2687.58
32,062.2432,029.2932,773.3331,320.19478.5387.40
31,493.80 31,453.9130,978.2229,393.76341.9787.12
29,348.2729,293.8829,204.5927,418.71189.1786.51
26,264.8126,242.9427,027.5325,956.06391.1887.66
25,238.7125,196.4324,925.7523,465.531030.3186.68
NO. IV19,492.0219,486.923,837.7923,390.76088.69
23,913.4123,912.9722,839.30 22,695.52551.4689.60
24,465.0724,461.2222,287.8721,853.63407.6588.90
23,965.7123,957.2421,608.6320,890.3724588.48
23,968.9723,959.2820,610.0420,009.24280.3388.37
22,859.9622,830.5819,850.60 18,692.03158.6487.09
21,793.9821,744.4518,580.2417,111.74111.7986.14
20,680.2420,608.7416,717.7414,999.5639485.23
17,823.8917,724.314,463.2212,581.71536.3483.94
15,509.2515,330.8112,456.40 10,232.79125.3181.75
12,766.812,470.0910,039.837303.42192.9677.62
NO. V42,544.6342,521.6157,040.0755,640.60 088.11
38,301.2638,241.354,885.7952,743.53 754.8186.79
33,687.0333,683.8251,391.4850,926.31 1352.0589.21
32,497.432,483.7348,891.5447,949.20 2034.7788.34
28,542.3628,512.4546,356.60 45,050.27 1592.687.38
26,499.5326,460.4243,847.4642,358.31 1202.8186.89
26,606.226,594.641,245.1940,459.38 1113.1288.31
27,055.9927,016.5640,408.0138,947.94 51.3786.91
25,619.3525,609.4536,777.3536,065.06 2170.5988.41
25,883.4725,875.8433,160.80 32,532.53 2904.2688.71
24,621.6124,586.8828,963.7627,656.53 3568.7786.96
23,930.1123,910.2223,852.0822,876.65 3804.4587.66
23,077.9223,024.6219,798.7318,231.063077.9286.10
NO. VI25,888.8125,885.5637,139.5836,727.28089.09
29,334.8129,332.70 33,308.2732,9583419.0189.31
26,171.7726,170.3130,194.4929,917.962763.5189.39
22,800.3222,796.6628,134.4127,725.721783.5588.97
22,596.3222,579.7326,126.4425,455.261599.2888.30
20,416.00 20,405.5124,111.6523,457.131343.6188.16
20,261.50 20,240.0822,921.7121,990.26535.4287.37
20,954.2420,945.1821,510.0920,893.95480.1788.32
18,278.5818,260.8320,125.2219,319.81768.7387.47
Table A2. Drone Flight Quality Data Sheet.
NumberAverage Flight AltitudeRMSMean Error in RTK Level PositioningAverage Error of RTK Elevation Positioning
I35.91 m1.026 px0.411 cm0.615 cm
II45.77 m1.052 px0.402 cm0.787 cm
III39.97 m1.059 px0.351 cm0.671 cm
IV27.55 m1.229 px0.338 cm0.64 cm
V56.29 m0.96 px0.362 cm0.686 cm
VI27.9 m1.011 px0.368 cm0.756 cm
NumberGround Resolution GSDMaximum Horizontal Positioning Error of RTKMaximum Elevation Positioning Error of RTKTotal Valid Connection Points
I0.132 cm/px0.768 cm1.126 cm71,1737
II0.566 cm/px0.705 cm1.443 cm26,1120
III1.177 cm/px0.38 cm0.791 cm20,2861
IV1.266 cm/px0.555 cm1.187 cm16,9100
V1.288 cm/px0.481 cm0.846 cm27,3605
VI0.348 cm/px0.53 cm1.061 cm26,7855
NumberTotal Number of Connection Point ProjectionsMinimum Horizontal Positioning Error of RTKRTK Minimum Height Positioning ErrorGeometric Registration Root Mean Square Error
I6,019,4930.33 cm0.453 cm0.016 m
II1,566,1300.248 cm0.446 cm0.05 m
III1,552,1580.328 cm0.611 cm0.023 m
IV1,393,3090.212 cm0.368 cm0.042 m
V2,754,7330.313 cm0.585 cm0.121 m
VI2,009,2170.31 cm0.621 cm0.013 m

References

  1. Zhang, Y.; Dai, R. The Magic Lantern: Chinese Pagodas (Chinese Translation); Beijing Daily Press: Beijing, China, 2022; pp. 4–5. [Google Scholar]
  2. Zhang, Y. A Collection of Ancient Chinese Pagodas; Beijing Science Press: Beijing, China, 1988; p. 1. [Google Scholar]
  3. Chen, Z. Comprehensive Catalog of Ancient Chinese Pagodas; Guangdong People’s Publishing House: Guangzhou, China, 2023; pp. 580–950. [Google Scholar]
  4. Zhang, Y. A History of Chinese Buddhist Pagodas; Beijing Science Press: Beijing, China, 2006; pp. 252–278. [Google Scholar]
  5. Office of the Leading Group for the Third National Cultural Relics Census. Data from the Third National Cultural Relics Census; Office of the Leading Group for the Third National Cultural Relics Census: Beijing, China, 2011. [Google Scholar]
  6. Jiang, H. A Study on the Spatiotemporal Distribution of Fengshui Towers in Sichuan During the Qing Dynasty. Master’s Thesis, Southwest University, Chongqing, China, 2013. [Google Scholar]
  7. Yan, J.; Qin, J.; Wang, D.; Huang, Y. A GIS-Based Study on the Spatiotemporal Distribution Patterns of Fengshui Towers in Hunan. Chin. Foreign Archit. 2023, 126–130. [Google Scholar] [CrossRef]
  8. Chen, M.; Wu, Z.; Dong, J. Dynamic Performance and Seismic Response Analysis of Ming Dynasty Masonry Pagodas in the Jiangnan Region: A Case Study of the Great Wenfeng Pagoda. Buildings 2025, 15, 3994. [Google Scholar] [CrossRef]
  9. International Council on Monuments and Sites (ICOMOS). Venice Charter; ICOMOS: Charenton-le-Pont, France, 1964. [Google Scholar]
  10. State Council of the People’s Republic of China. Provisional Regulations on the Administration of Cultural Relics Protection; State Council of the People’s Republic of China: Beijing, China, 1961.
  11. Standing Committee of the National People’s Congress of the People’s Republic of China. Law of the People’s Republic of China on the Protection of Cultural Relics; Standing Committee of the National People’s Congress of the People’s Republic of China: Beijing, China, 1982.
  12. National Cultural Heritage Administration. Guidelines for the Protection of Cultural Relics and Historic Sites in China (2015 Edition); National Cultural Heritage Administration: Beijing, China, 2015.
  13. Li, J. Yingzao Fashi; Northern Song Court: Kaifeng, China, 1103; Volume 4.
  14. Yunli. Engineering Practices; Qing Officials: Beijing, China, 1734; Volume 28.
  15. Yao, C. Yingzao Fayan; Zhang, Z., Liu, D., Eds.; China Architecture & Building Press: Beijing, China, 1986; p. 85. [Google Scholar]
  16. Liang, S.; Lin, H. Yingzao Zeli; Chinese Society of Architectural History: Beijing, China, 1934; pp. 1–2. [Google Scholar]
  17. Boerschmann, E. Chinesische Architektur; Verlag Ernst Wasmuth: Berlin, Germany, 1925; pp. 52–61. [Google Scholar]
  18. Pelliot, P. Les Grottes de Touen-Houang; Librairie Paul Geuthner: Paris, France, 1924; p. 211. [Google Scholar]
  19. Hua, W.; Hou, M.; Qiao, Y.; Zhao, X.; Xu, S.; Li, S. Similarity Index Based Approach for Identifying Similar Grotto Statues to Support Virtual Restoration. Remote Sens. 2021, 13, 1201. [Google Scholar] [CrossRef]
  20. Salguero-Andújar, F.; Prat-Hurtado, F.; Rodriguez-Cunill, I.; Cabeza-Lainez, J. Architectural Significance of the Seokguram Buddhist Grotto in Gyeongju (Korea). Buildings 2022, 12, 3. [Google Scholar] [CrossRef]
  21. Zhao, S.; Liu, C.; Jiang, Z. An Analysis of the Dimensions of the Timber Framework and the Early Construction History of the Shakyamuni Hall at Chongshou Temple in Jincheng. J. Archit. Hist. 2023, 4, 43–59. [Google Scholar]
  22. Li, Z.; Zhao, S. An Analysis of the Dimensions of the Artistic Forms in Puxian Pavilion. Art Obs. 2024, 12, 77–82. [Google Scholar]
  23. Cha, J.-H.; Kim, Y.-J. Reassessing the Proportional System of Joseon Era Wooden Architecture: The Bracket Arm Length and Width as a Standard Modular Method. Buildings 2023, 13, 2069. [Google Scholar] [CrossRef]
  24. Wang, G. Preliminary Discussions on the Proportions of Single-Eave Wooden Structures in the Tang and Song Dynasties. J. Archit. Hist. 2002, 50–64, 258–259. [Google Scholar]
  25. Wang, G. An Analysis of the Proportions of Single-Eave Wooden Structures in the Tang and Song Dynasties. In Proceedings of the Selected Papers from the First International Symposium on Chinese Architectural History, Beijing, China, 18–21 August 1998. [Google Scholar]
  26. Chen, M. The Yingxian Wooden Pagoda; Zhejiang Photography Publishing House: Hangzhou, China, 2024; p. 37. [Google Scholar]
  27. Liu, D. The Complete Works of Liu Dunzhen; China Architecture & Building Press: Beijing, China, 2007; Volume 10, p. 230. [Google Scholar]
  28. Shi, L.; Chen, X.; Xu, Y.; Gao, X.; Lai, J.; Wang, S. Towards an Effective Architectural Form: The Composition of Squareness and Roundness Based on Scale Proportion—Evidence from the Yingxian Wooden Pagoda. Buildings 2024, 14, 1472. [Google Scholar] [CrossRef]
  29. Fu, X. Architectural Characteristics of China’s Northern and Southern Dynasties and Sui-Tang Periods Reflected in Japanese Architecture of the Asuka and Nara Periods. Cult. Relics 1992, 28–50. [Google Scholar] [CrossRef]
  30. Wang, H. The East and West Pagodas of Quanzhou; Fujian People’s Publishing House: Fuzhou, China, 1992; pp. 86–88. [Google Scholar]
  31. Wang, N. Rectangular and Circular, Countless Pagodas: An Analysis of the Compositional Proportions of Ancient Chinese Buddhist Pagodas (Part I). J. Chin. Archit. Hist. Theory 2017, 2, 216–256. [Google Scholar]
  32. Wang, N. Rectangular and Circular, Countless Pagodas: An Analysis of Compositional Proportions in Ancient Chinese Buddhist Pagodas (Part II). J. Chin. Archit. Hist. Theory 2018, 1, 241–277. [Google Scholar]
  33. Chan, T.O.; Xia, L.; Chen, Y.; Lang, W.; Chen, T.; Sun, Y.; Wang, J.; Li, Q.; Du, R. Symmetry Analysis of Oriental Polygonal Pagodas Using 3D Point Clouds for Cultural Heritage. Sensors 2021, 21, 1228. [Google Scholar] [CrossRef] [PubMed]
  34. Liu, Y. A Study on the Visual Form of Ancient Pagodas in Zhengding. Master’s Thesis, Beijing Institute of Graphic Communication, Beijing, China, 2022. [Google Scholar]
  35. Liu, H.; Xiao, C.; Chen, F. A Study on the Mathematical Principles of Architectural Proportions in Qing Dynasty Pagodas in Central Hunan. Inter. Des. Decor. 2024, 11, 120–122. [Google Scholar] [CrossRef]
  36. Yang, Y.; Xu, Y. A Study on the Chronological Stages of Architectural Forms of Multi-story Brick and Stone Pagodas in the Beijing Area from the 11th to the 17th Century. J. Palace Mus. 2024, 8, 20–35+155. [Google Scholar]
  37. Wang, S.; Chen, X.; Xu, Y.; Wang, K.; Lai, J.; Shi, L. Morphological Study on Multi-storied Brick Pagodas of the Tang Dynasty: An Analysis Method Based on Historical Patterns and Mathematical Models. Int. J. Archit. Herit. 2021, 15, 1655–1670. [Google Scholar] [CrossRef]
  38. García-González, E.; Saura-Gómez, P.; Pérez-Sánchez, V.R. Geometry in 18th Century Bell Towers in Bajo Segura, Spain. Buildings 2022, 12, 256. [Google Scholar] [CrossRef]
  39. El-Diasty, M.; Al-Hashim, A.; Abdalla, R. An Efficient UAV-Based LIDAR System for Urban Mapping and Modeling Applications. In Geospatial Innovation: Igniting Smart Cities, Eco-Synergy, and Urban Resurgence; Springer: Cham, Switzerland, 2026; pp. 155–171. [Google Scholar] [CrossRef]
Figure 1. Schematic Map of the Study Area.
Buildings 16 02749 g001
Figure 2. Workflow Diagram.
Buildings 16 02749 g002
Figure 3. Sample Dimension Drawing.
Buildings 16 02749 g003
Scheme 1. Schematic Diagram of the Geometric Shape of the Feng Shui Pagoda.
Buildings 16 02749 sch001
Figure 4. Schematic diagram of the ξ equation.
Buildings 16 02749 g004
Scheme 2. Validation Study of the ξ Equation.
Buildings 16 02749 sch002
Figure 5. Schematic Diagram Showing Changes in Single-Story pagoda Parameters.
Buildings 16 02749 g005
Figure 6. Schematic diagram of typical data where the LJ value is less than the LTN value.
Buildings 16 02749 g006
Figure 7. Schematic diagram of typical data where the LJ value is greater than the LTN value.
Buildings 16 02749 g007
Scheme 3. Linear Fitting Analysis of Key Parameters.
Buildings 16 02749 sch003aBuildings 16 02749 sch003b
Figure 8. Schematic Diagram of the Research Methodology.
Buildings 16 02749 g008
Figure 9. Schematic diagram of the indentation distance Q.
Buildings 16 02749 g009
Figure 10. Schematic diagram of the mean value of Q in the Pagoda body.
Buildings 16 02749 g010
Table 1. Sample Basic Information Form.
NumberTower NameYear BuiltHeight (M)TypeLocationGrade of Cultural Heritage Site
IFeiying Pagoda183833.00Pavilion-styleJiangyou CityProvincial
IIHuilong Pagoda182433.20Pavilion-styleYingshan CountyMunicipal
IIIWhite Pagoda188333.10Pavilion-styleOhtake CountyCounty-level
IVBuyue Pagoda190025.00Pavilion-styleBazhong CityProvincial
VLingyun Pagoda183043.33Pavilion-styleBazhong CityProvincial
VINorth Pagoda181325.00Pavilion-styleSantai CountyProvincial
Table 2. Current Status Numbering Table for Sample pagodas.
Buildings 16 02749 i001Buildings 16 02749 i002Buildings 16 02749 i003Buildings 16 02749 i004Buildings 16 02749 i005Buildings 16 02749 i006
No. INo. IINo. IIINo. IVNo. VNo. VI
Feiying PagodaHuilong PagodaWhite PagodaBuyue PagodaLingyun PagodaNorth Pagoda
Table 3. Results of the Bootstrap Substitution Test for Numeric Variables.
VariableStatisticsOverall Statistical ValuesSample Statistic ValuesObservation Differencesp
TimeMean1850.94121848−2.94120.8082
Median18531834−190.424
Standard Deviation35.935935.0828−0.85320.7798
Number of cornersMean6.35296.66670.31370.569
Median6601.8528
Standard Deviation0.77391.03280.25890.567
Number of storeysMean9.82359.3333−0.49020.7015
Median9900.6741
Standard Deviation2.26262.633−0.62960.3242
HeightMean29.328828.2−1.12880.8274
Median28.4529.40.950.8749
Standard Deviation22.531320.11−2.42130.1054
Longitude (E)Mean106.2032106.1842−0.0190.9502
Median106.5312106.6350.10390.703
Standard Deviation1.09480.9858−0.10890.5676
Latitude (N)Mean31.528731.4271−0.10150.5758
Median31.560131.4764−0.08370.4416
Standard Deviation0.46850.50840.03990.6272
Table 4. Details on the Distribution of the Categorical Variable in the Population and Sample.
VariableCategoryTotalPercentageSample sizeSample PercentageDifferencesObserved Chi-Square Valuep
DesignA34161001
MaterialsS110.323520.33330.00980.0181
Z60.176510.1667−0.0098
ZS170.530.50
Notes: 1. The physical meaning of Form A is a multi-story structure. 2. The physical meaning of Material S is a stone building. 3. The physical meaning of Material Z is a brick building. 4. The physical meaning of Material ZS is a brick-and-stone building.
Table 5. Sixty sets of single-layer numbering tables.
NumberTotal Number of StoreysSingle-Level Numbering
No. I9123456789\\\\
No. II9101112131415161718\\\\
No. III9192021222324252627\\\\
No. IV112829303132333435363738\\
No. V1339404142434445464748495051
No. VI9525354555657585960\\\\
Notes: 1. The numbering sequence runs from the bottom layer to the top layer; for example, in No. I, the bottom layer is 1 and the top layer is 9. 2. The subsequent 60 research samples will all be numbered according to this table.
Table 6. Detailed List of Parameter Symbol Definitions.
NameSingle-Story Pagoda HeightBase RadiusUpper Plane RadiusCorner RadiusConvergence Angle
Parameter symbolsHLTNLTN+1LJα
Unitmmmmmmmm°
Table 7. Evaluation Metrics for Leave-One-Out Cross-Validation 1.
MAERMSEMAPE
Overall Prediction Performance Metrics102.4365210.82070.51%
Detailed Metrics for Target Parameter H8.087710.79340.04%
Target Parameters: Detailed Metrics for LTN+1196.7852297.95010.98%
Table 8. Parameter Combination Chart.
Known TermCombination NumberPermutation and Combination
15LTNLTN+1LJαH
210(LTN,LTN+1)(LTN,LJ)(LTN,α)(LTN,H)(LTN+1,LJ)
(LTN+1,α)(LTN+1,H)(LJ,α)(LJ,H)(α,H)
310(H,LTN+1,LJ)(H,LTN+1,LTN)(H,LTN+1,α)(LTN+1,LJ,LTN)(LTN+1,LTN,α)
(H,LJ,LTN)(H,LTN,α)(LTN+1,LJ,α)(LJ,LTN,α)(H,LJ,α)
45(LTN,LTN+1,LJ,α)(LTN,LTN+1,LJ,H)(LTN,LTN+1,α,H)(LTN,LJ,α,H)(LTN+1,LJ,α,H)
Table 9. Table of Calculated Values.
Known TermsNumber of PermutationsNumber of SuccessesNumber of FailuresSuccess Rate
15050
2100100
310910.9
45501
Table 10. Permutations and combinations of parameters when M = 3.
① (H,LTN+1,LJ)② (H,LTN+1,LTN)③ (H,LTN+1,α)④ (LTN+1,LJ,LTN)⑤ (LTN+1,LTN,α)
⑥ (H,LJ,LTN)⑦ (H,LTN,α)⑧ (LTN+1,LJ,α)⑨ (LJ,LTN,α)⑩ (H,LJ,α)
Table 11. Analysis and Summary of Linear Fitting Results.
NumberR2R2 > 0.9R2 = 0.9R2 < 0.9
0.99998, 0.99815100
0.99669, 0.99997100
0.99989, 0.99998100
0.99812, 0.99998100
0.96808, 0.96827100
0.99669, 0.99997100
0.99998, 0.99997100
0.99989, 0.99997100
0.99997, 0.99998100
FALSE000
Table 12. Leave-One-Out Cross-Validation Evaluation Results.
MAERMSEMAPE
132.8632267.47260.78%
8.035217.50890.3234
102.16209.950.44%
8.04517.55160.32%
331.491106.091.20%
133.5269.250.88%
102.3177210.66130.51%
196.462296.94730.84%
102.4365210.82070.51%
Table 13. Sample pagoda Parameters Table.
Pagoda No. I Specifications Table
Story NumberLTN (mm)Q (mm)LTN+1 (mm)
F140,987.66038,801.82
F238,510.69291.1336,142.75
F335,925.34217.4133,026.66
F432,706.36320.3130,402.76
F530,190.71212.0528,580.86
F627,775.13805.7325,921.26
F725,404.62516.6423,643.84
F823,464.15179.6921,335.61
F919,705.851684.3117,104.33
Pagoda No. II Specifications Table
Story NumberLTN (mm)Q (mm)LTN+1 (mm)
F134,422.99033,317.88
F231,620.381697.50 30,053.18
F328,682.611370.5727,513.84
F426,645.63868.2125,448.93
F524,856.97591.9723,820.02
F622,487.531332.4921,818.09
F720,725.00 1093.0920,060.43
F819,559.76504.40 18,615.28
F917,284.171331.1116,013.90
Pagoda No. III Specifications Table
Story NumberLTN (mm)Q (mm)LTN+1 (mm)
F138,253.27037,074.15
F236,847.64226.5136,184.74
F335,859.22325.5234,748.09
F434,662.8385.2633,251.86
F532,773.33478.5331,320.19
F630,978.22341.9729,393.76
F729,204.59189.1727,418.71
F827,027.53391.1825,956.06
F924,925.751030.3123,465.53
Pagoda No. IV Specifications Table
Story NumberLTN (mm)Q (mm)LTN+1 (mm)
F123,837.79023,390.76
F222,839.30 551.4622,695.52
F322,287.87407.6521,853.63
F421,608.6324520,890.37
F520,610.04280.3320,009.24
F619,850.60 158.6418,692.03
F718,580.24111.7917,111.74
F816,717.7439414,999.56
F914,463.22536.3412,581.71
F1012,456.40 125.3110,232.79
F1110,039.83192.967303.42
Pagoda No. V Specifications Table
Story NumberLTN (mm)Q (mm)LTN+1 (mm)
F157,040.07055,640.60
F254,885.79754.8152,743.53
F351,391.481352.0550,926.31
F448,891.542034.7747,949.20
F546,356.60 1592.645,050.27
F643,847.461202.8142,358.31
F741,245.191113.1240,459.38
F840,408.0151.3738,947.94
F936,777.352170.5936,065.06
F1033,160.80 2904.2632,532.53
F1128,963.763568.7727,656.53
F1223,852.083804.4522,876.65
F1319,798.733077.9218,231.06
Pagoda No. VI Specifications Table
Story NumberLTN (mm)Q (mm)LTN+1 (mm)
F137,139.58036,727.28
F233,308.273419.0132,958
F330,194.492763.5129,917.96
F428,134.411783.5527,725.72
F526,126.441599.2825,455.26
F624,111.651343.6123,457.13
F722,921.71535.4221,990.26
F821,510.09480.1720,893.95
F920,125.22768.7319,319.81
Disclaimer/Publisher’s Note: The statements, opinions and data contained in all publications are solely those of the individual author(s) and contributor(s) and not of MDPI and/or the editor(s). MDPI and/or the editor(s) disclaim responsibility for any injury to people or property resulting from any ideas, methods, instructions or products referred to in the content.