Article

Building Performance Simulation and Climate-Adaptive Green Retrofit of Jingzu Jiashu, a Historic Chaoshan Residence in Lingnan Under Hot–Humid and Disaster-Prone Weather Conditions


1
Faculty of Humanities and Social Sciences, Macao Polytechnic University, Macao 999078, China
2
College of Engineering, Shantou University, Shantou 515063, China
*
Author to whom correspondence should be addressed.
Buildings 2026, 16(14), 2743; https://doi.org/10.3390/buildings16142743
Submission received: 14 June 2026 / Revised: 6 July 2026 / Accepted: 8 July 2026 / Published: 10 July 2026

Abstract

Historic residential buildings in Lingnan are affected by hot–humid and disaster-prone weather conditions, including high temperature, high humidity, intense solar radiation, monsoon winds, and typhoon-related climate stress, which challenge indoor thermal comfort, daylighting, natural ventilation, and adaptive reuse. Taking Jingzu Jiashu, a historic Chaoshan residence associated with overseas remittance culture, as a case study, this study develops a simulation workflow for climate-adaptive green retrofit. Digital documentation, architectural survey, material investigation, and climate data were integrated to establish a baseline model. PMV, DA300, and ACH/ACR were used to evaluate thermal comfort, daylighting, and natural ventilation. The baseline results show summer overheating, insufficient daylighting in deep rooms, and inadequate ventilation in representative rooms. Comfortable hours accounted for only 7.29–7.78%, thermally uncomfortable hours reached 42.84–51.53%, and the maximum PMV reached 4.65 in the rear hall and 3.54–3.65 in representative rooms. The effective daylight areas of the front and rear rooms were approximately 40% and 31%, while baseline ACH values ranged from 1.06 to 1.89 h−1. An integrated retrofit strategy was proposed, including functional reorganization, envelope optimization, opening adjustment, ventilation-path organization, and courtyard/transitional-space improvement. After retrofit, comfortable hours increased to 32.00–42.45%, thermally uncomfortable hours decreased to 17.25–21.28%, maximum PMV values decreased to 1.82–1.86, daylight areas increased to 81% and 74%, and ACH values rose to 2.97–4.49 h−1. The results indicate that building performance simulation can provide quantitative support for climate-adaptive green retrofit of historic Chaoshan residences in Lingnan, offering a methodological reference for healthier, lower-carbon, and more resilient reuse of similar historic dwellings.

1. Introduction

1.1. Research Background

Global climate change has increased the frequency of extreme heat, heavy precipitation, humidity-related stress, and other climate-related hazards, making climate adaptation an important issue in architectural research and design practice [1,2,3]. As buildings are closely related to energy consumption, carbon emissions, indoor environmental quality, and public health, green building design has shifted from energy efficiency alone to broader concerns with health, comfort, resilience, and human settlement optimization [4,5,6]. This shift is especially important in humid coastal regions, where buildings must respond simultaneously to overheating, high humidity, solar radiation, rainfall-related moisture, ventilation demand, and climate uncertainty [7,8,9]. For existing and historic buildings, sustainable renewal should therefore not be limited to physical conservation or functional reuse, but should also involve the diagnosis and improvement of environmental performance under changing climatic conditions [10,11,12]. For traditional residential heritage in coastal regions exposed to extreme weather, adaptive reuse needs to integrate cultural continuity with thermal comfort, natural ventilation, daylight performance, and climate resilience under extreme heat, high humidity, heavy rainfall, and typhoon-season wind conditions [1,7,13].
The Lingnan region of South China provides a representative context for this issue. Its hot–humid climate, strong solar radiation, abundant rainfall, monsoon winds, and typhoon-related weather exposure create compound environmental pressures for historic dwellings. Traditional Chaoshan residences have developed spatial strategies such as courtyards, air wells, corridors, cold lanes, thick walls, shaded transitional spaces, and controlled openings in response to this environment [9,14,15]. These elements should not be interpreted only as cultural or formal features; they may also function as passive environmental mechanisms for solar control, air movement, thermal buffering, and microclimate regulation. However, existing studies on Chaoshan overseas Chinese residences and traditional dwellings have mainly emphasized historical evolution, overseas Chinese culture, architectural form, decorative features, and heritage value. Relatively less attention has been paid to the quantitative relationship between traditional spatial organization and indoor environmental performance under present-day humid coastal climate exposure. In particular, the effects of courtyards, deep rooms, thick envelopes, controlled openings, and semi-open transitional spaces on thermal comfort, daylighting, and natural ventilation remain insufficiently evaluated through building performance simulation.
Building performance simulation provides a useful method for addressing this gap. It allows researchers to evaluate thermal comfort, daylighting, ventilation, and environmental performance before physical intervention [16,17,18]. EnergyPlus-based simulation can assess indoor thermal conditions, Radiance-based methods can evaluate daylight autonomy, and CFD-based methods can reveal airflow paths, stagnant zones, and air exchange efficiency [19,20,21]. Parametric platforms such as Ladybug and Honeybee further support the integration of weather data, architectural geometry, material parameters, and visualized environmental analysis [16,19,22].
This study takes Jingzu Jiashu, a historic Chaoshan residence in Chenghai District, Shantou, as a case study. Rather than treating its adaptive reuse as a purely spatial or esthetic design task, this study frames it as an environmental retrofit problem requiring measurable performance diagnosis and evidence-based design optimization. The objective is to establish a building performance simulation workflow for diagnosing and improving the indoor environmental performance of a historic residence under the compound climatic stress of coastal Lingnan.

1.2. Research Questions and Objectives

The purpose of this study is to construct a simulation-based workflow for the conservation-oriented green retrofit of Jingzu Jiashu. Specifically, this study aims to: (1) build a baseline performance model using UAV photogrammetry, field measurement, architectural survey, material investigation, and climate data; (2) evaluate thermal comfort, daylighting, and natural ventilation using PMV, DA300, and ACH/ACR indicators; (3) identify the main environmental deficiencies of the building; (4) propose retrofit strategies involving functional reconfiguration, envelope improvement, opening adjustment, ventilation-path organization, and courtyard/transitional-space optimization; and (5) compare the baseline and post-retrofit performance under consistent simulation assumptions.
This study addresses three research questions: (1) how can building performance simulation support the diagnosis of indoor environmental problems in Jingzu Jiashu; (2) what thermal, daylighting, and ventilation problems are most evident under local humid coastal climate conditions; and (3) to what extent can a conservation-oriented green retrofit improve PMV, DA300, and ACH/ACR performance?
The contribution of this study lies in combining digital documentation, building performance simulation, and heritage-sensitive retrofit design. It provides a quantitative basis for improving the indoor environmental quality of Jingzu Jiashu and offers a methodological reference for the adaptive reuse of similar historic Chaoshan residences. This study focuses on thermal comfort, daylighting, and natural ventilation, rather than structural typhoon resistance, flood-risk mitigation, or complete disaster prevention.
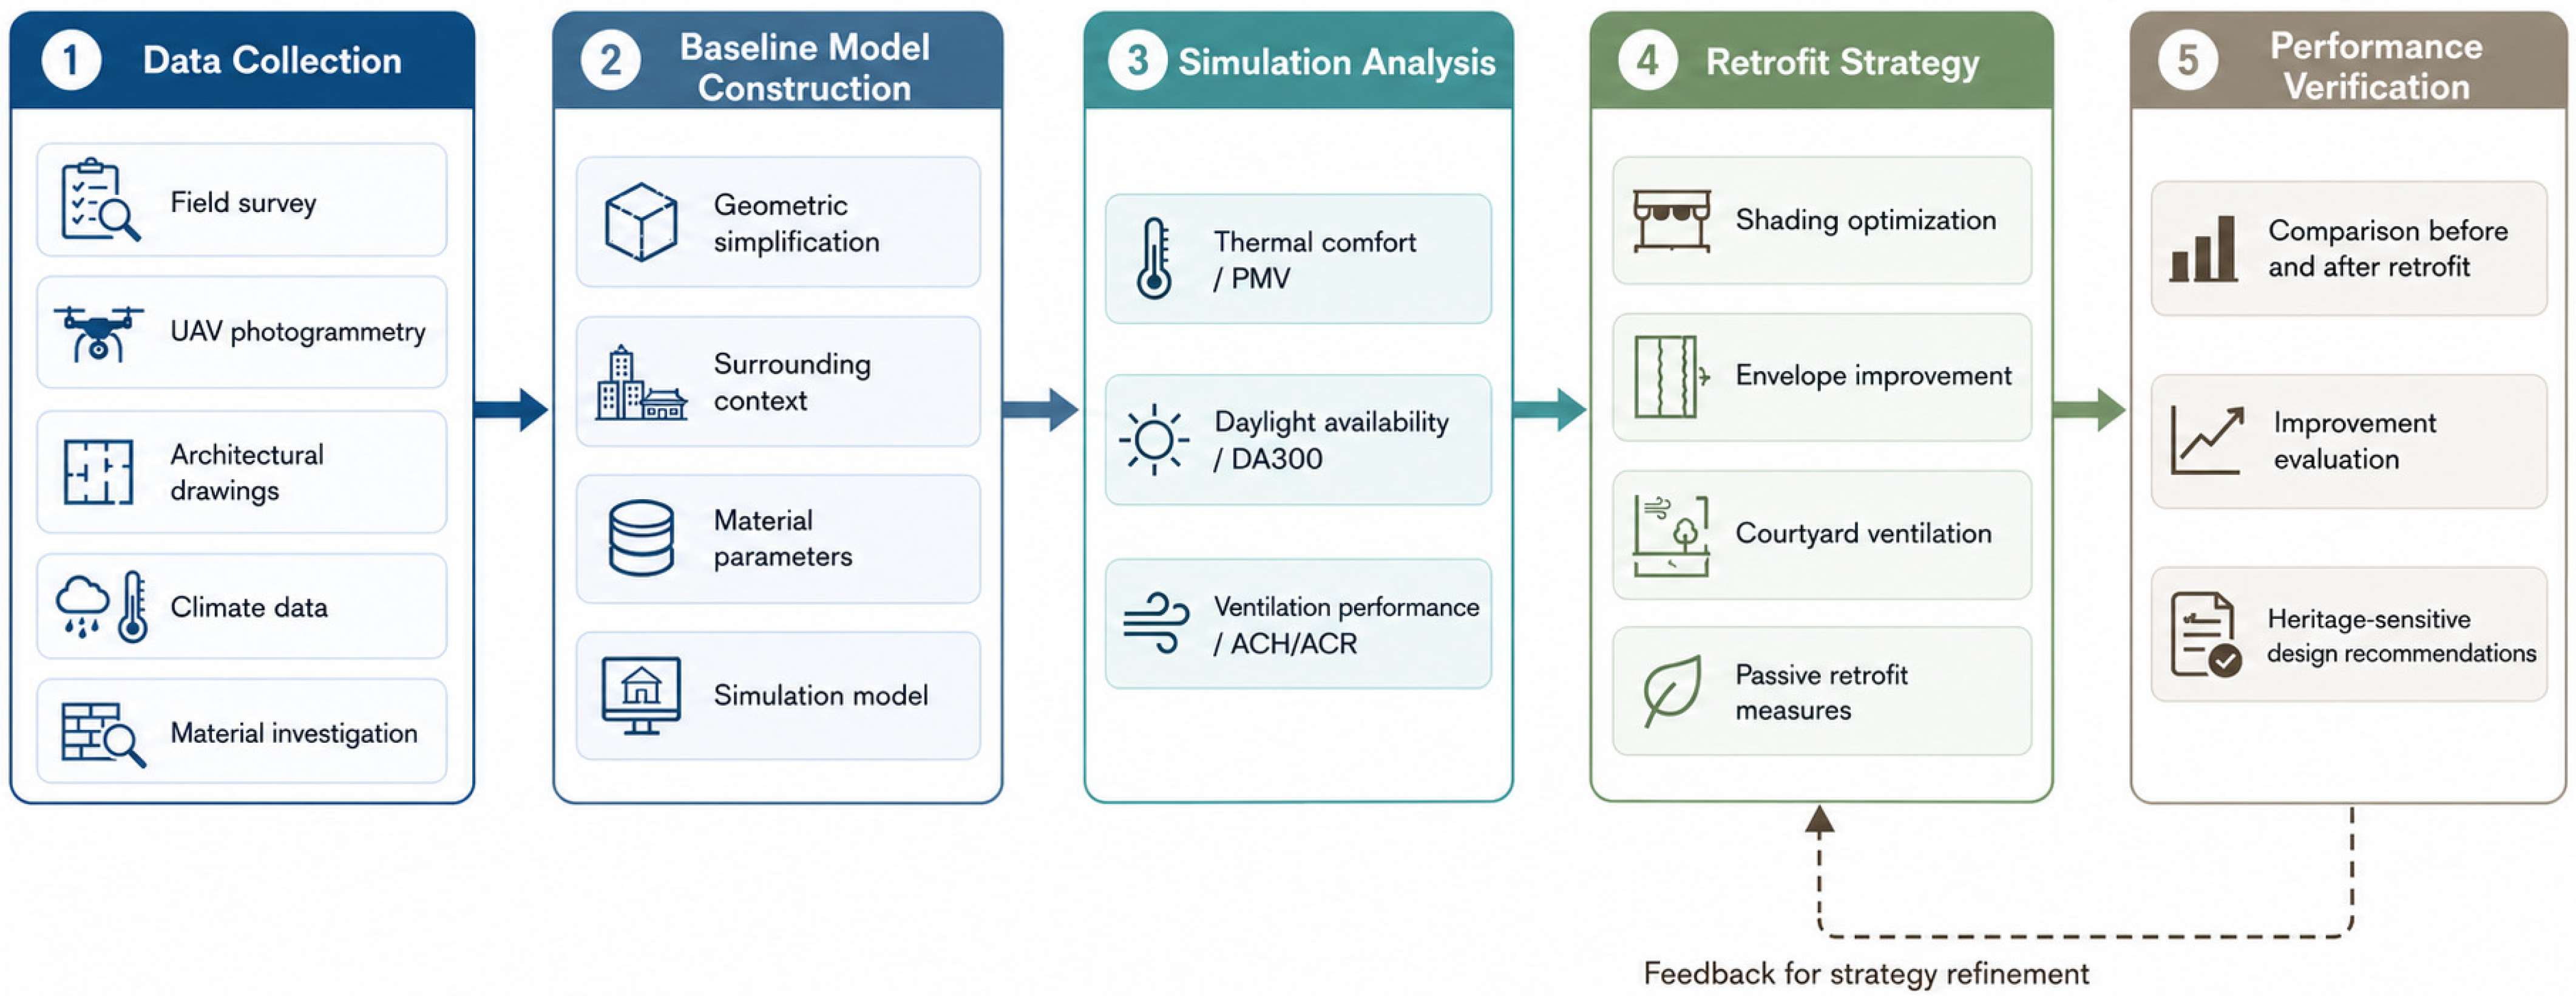
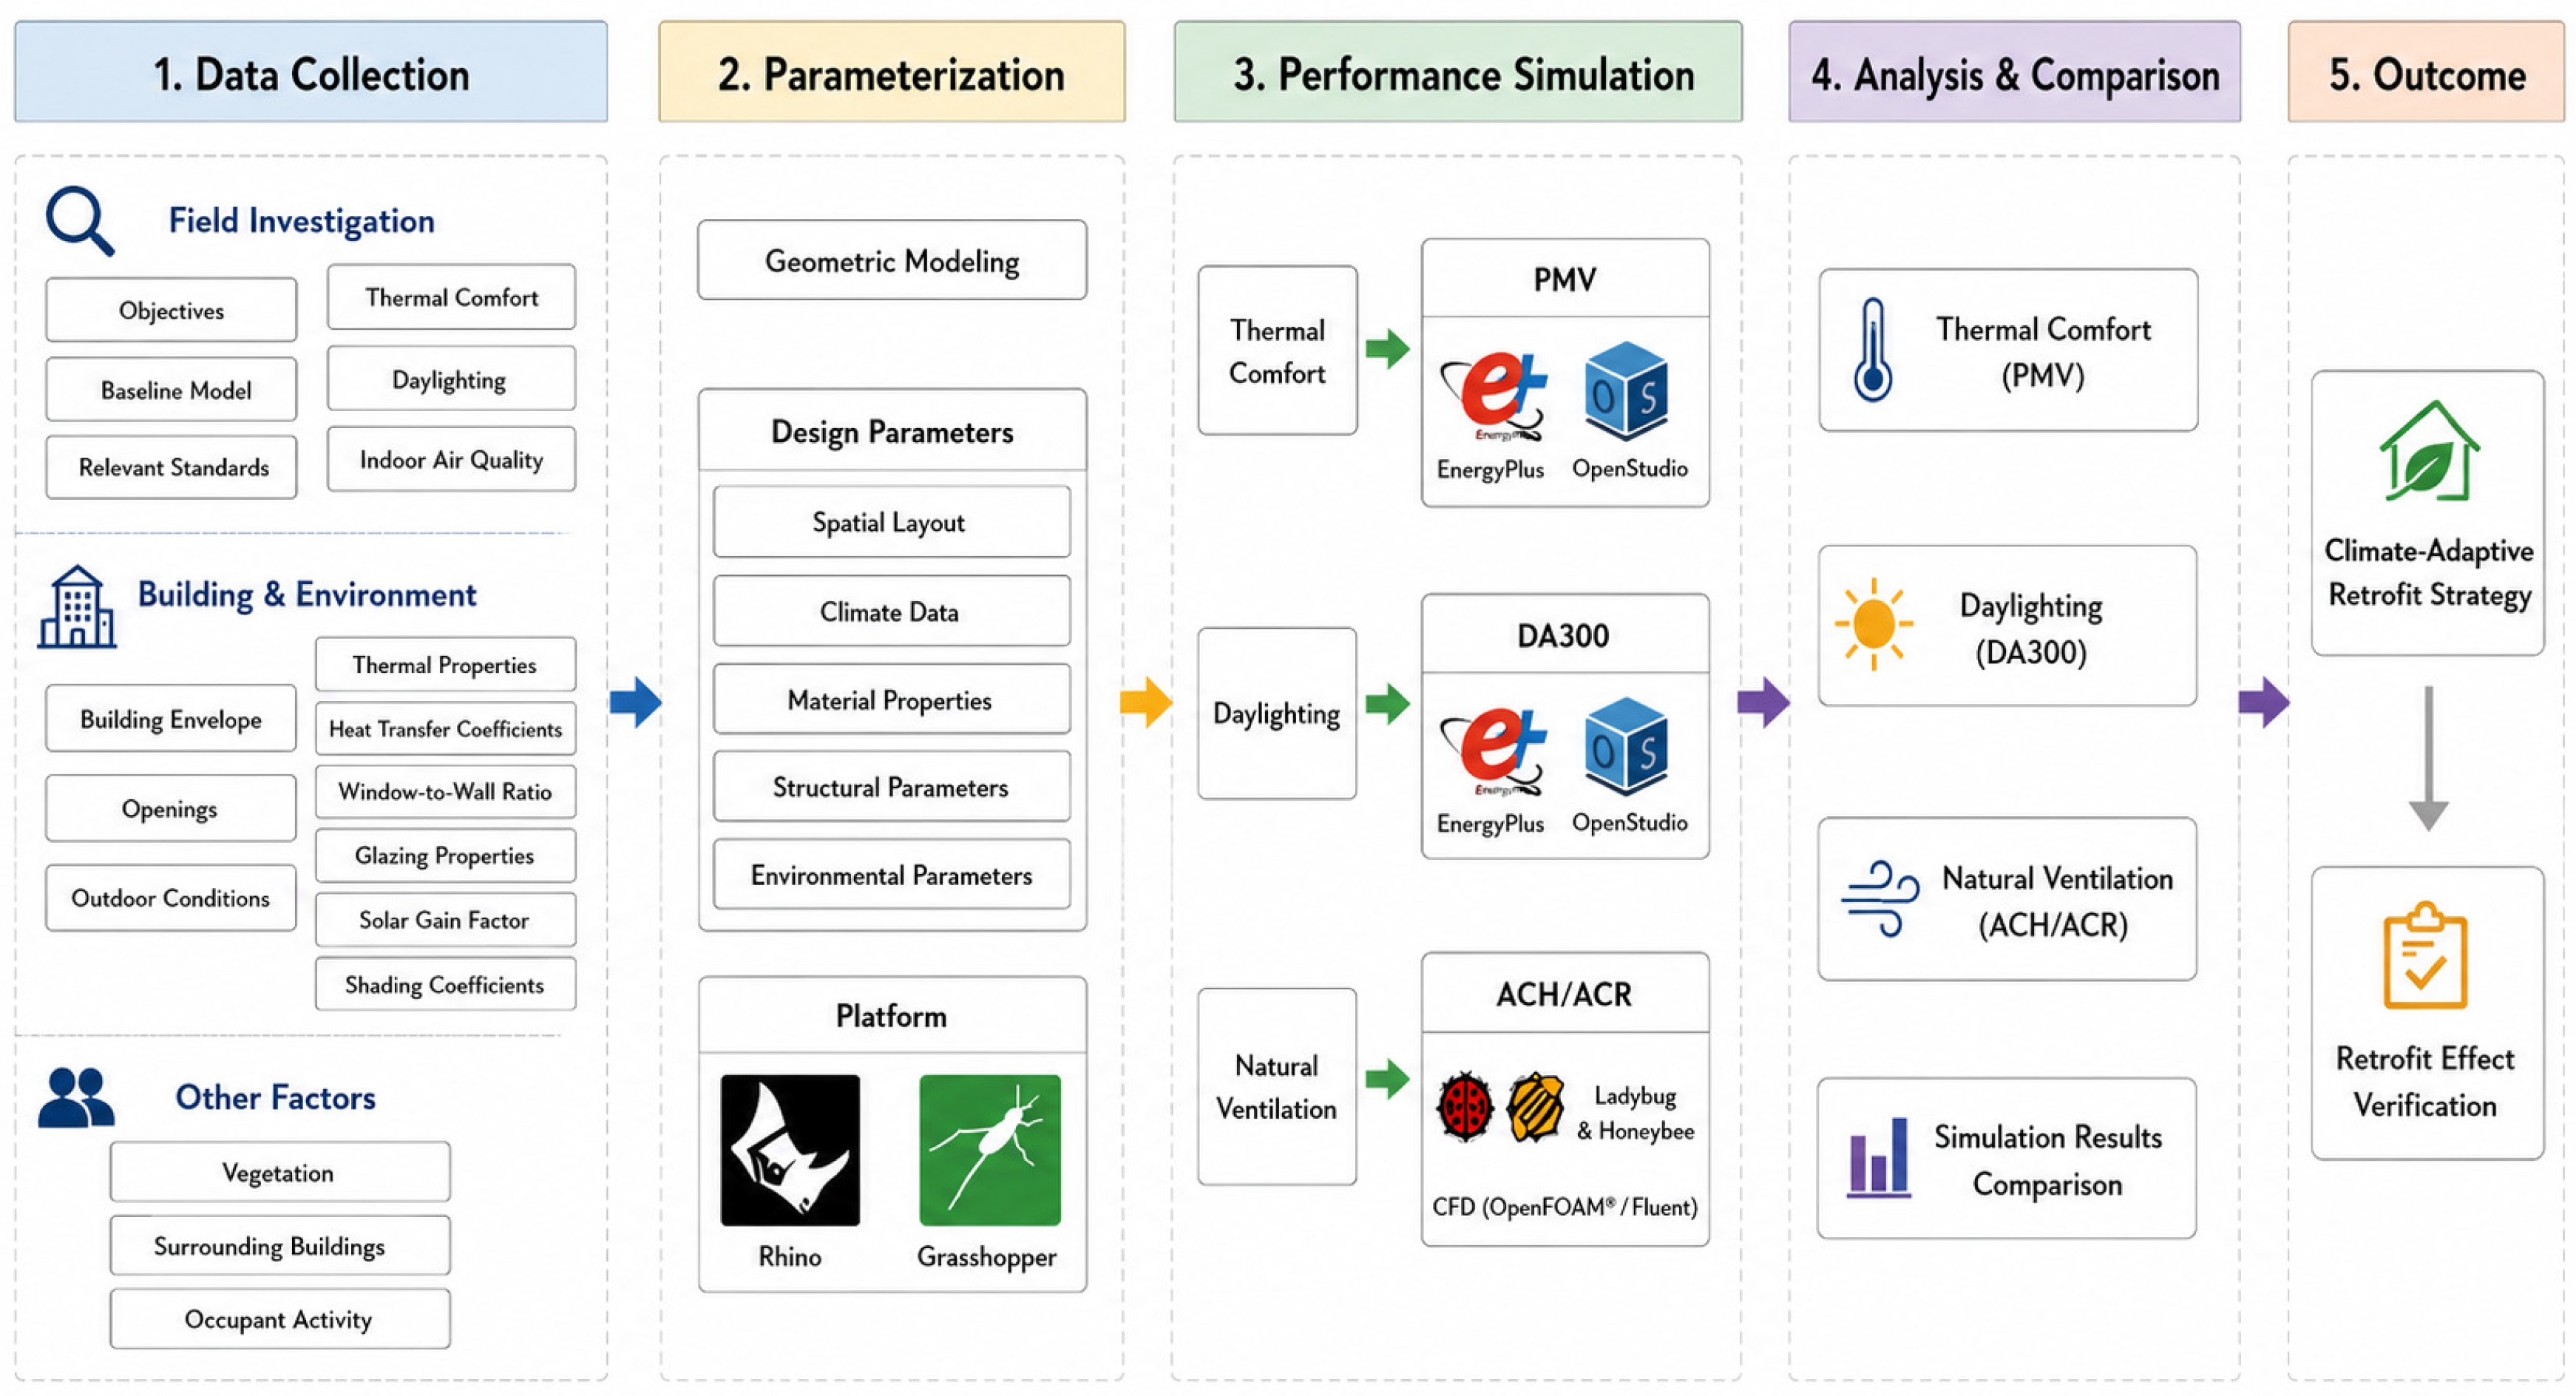
The overall research framework of this study is shown in Figure 1.

2. Theoretical Background

2.1. Climate Adaptation of Vernacular Dwellings

Vernacular dwellings have long been understood as climate-responsive architecture because their spatial organization, construction materials, envelope forms, and semi-open spaces are often shaped by long-term adaptation to local climatic conditions [23,24,25]. In hot–humid regions, passive strategies such as courtyards, air wells, deep eaves, shaded transitional spaces, and controlled openings can contribute to natural ventilation, solar control, and thermal regulation [9,14,15]. Studies on traditional dwellings in Southeast Asia and other warm or humid regions have shown that vernacular spatial forms can reduce dependence on mechanical cooling by improving airflow paths, moderating indoor temperature fluctuation, and enhancing occupants’ adaptive comfort [8,9,25].
However, the existence of passive climatic strategies does not necessarily mean that traditional buildings can fully meet contemporary requirements for indoor environmental quality, especially under intensified heat, humidity, and changing patterns of use [4,26,27]. This is particularly important for naturally ventilated historic dwellings, where thermal comfort, ventilation efficiency, daylight availability, and air quality are strongly affected by room depth, opening configuration, envelope performance, and seasonal climatic variation [8,17,28]. Therefore, the climate-adaptive value of traditional dwellings should be reassessed through quantitative indicators rather than only through descriptive interpretations of spatial form and cultural meaning [17,26,29].

2.2. Adaptive Reuse and Green Retrofit of Historic Buildings

Adaptive reuse and green retrofit provide another important research perspective for historic buildings [11,30,31]. Existing studies have emphasized that the reuse of heritage buildings can contribute to low-carbon development by extending building life cycles, preserving embodied cultural and material value, and reducing the environmental costs associated with demolition and new construction [10,11,30]. At the same time, retrofit interventions in historic buildings must remain conservation-compatible, because inappropriate insulation, ventilation, shading, or equipment strategies may damage heritage fabric or alter architectural character [11,12,32].
Accordingly, the sustainable renewal of historic buildings requires a balance between environmental performance improvement, cultural continuity, material conservation, and functional adaptation [10,12,30]. For historic Chaoshan residences such as Jingzu Jiashu, retrofit strategies need to respond to thermal discomfort, insufficient daylighting, and weak natural ventilation, while avoiding excessive alteration of the traditional spatial sequence, courtyard organization, envelope materiality, and façade character. Therefore, green retrofit should not be understood as the simple addition of new technical systems, but as an integrated process linking performance diagnosis, conservation principles, and spatial decision-making.

2.3. Building Performance Simulation for Heritage Environmental Diagnosis

Building performance simulation has become a useful method for supporting environmental diagnosis and retrofit decision-making in historic buildings, as it allows researchers to evaluate thermal comfort, daylighting, ventilation, and microclimatic performance before physical intervention [16,17,18]. EnergyPlus has been widely used for whole-building thermal simulation and indoor environmental analysis, including heat-balance calculation, indoor air temperature, operative temperature, humidity, and comfort-related outputs [19]. Radiance has also been widely applied in architectural daylighting studies; for example, Reinhart and Walkenhorst validated a dynamic Radiance-based daylight simulation method by comparing measured and simulated illuminance data in a full-scale test office [33]. Computational fluid dynamics has been widely used to assess wind environment, airflow distribution, ventilation paths, and air-exchange performance in and around buildings [18,21].
Parametric environmental simulation platforms such as Ladybug and Honeybee further strengthen the connection between architectural modeling and environmental performance analysis. These tools allow climate data, geometric models, material parameters, thermal simulation, daylighting simulation, and visualized environmental feedback to be integrated within a unified workflow [16,19,22]. For historic buildings, this integration is particularly useful because environmental performance needs to be evaluated together with spatial configuration, material constraints, conservation requirements, and adaptive reuse demands.
Nevertheless, existing research remains relatively fragmented. Studies on vernacular climate adaptation often emphasize passive design principles; studies on heritage retrofit tend to focus on energy efficiency or conservation compatibility; and simulation studies frequently evaluate thermal, daylighting, or ventilation performance as separate issues [11,18,23]. For traditional residential heritage in disaster-prone humid coastal regions, especially Chaoshan residences exposed to extreme heat, persistent humidity, rainfall-related moisture, and typhoon-season wind conditions, there remains a lack of integrated workflows that connect digital documentation, multi-dimensional environmental performance diagnosis, and conservation-oriented retrofit strategies [2,10,12].
Based on these gaps, this study establishes a research path of “digital documentation—baseline model construction—building performance simulation workflow—baseline performance diagnosis—integrated retrofit strategy—post-retrofit simulation verification”. It aims to provide a methodological reference for the conservation-compatible green retrofit of historic Chaoshan residences and similar historic dwellings in Lingnan and other humid coastal regions.

3. Materials and Methods

3.1. Case Study: Jingzu Jiashu as a Historic Chaoshan Residence

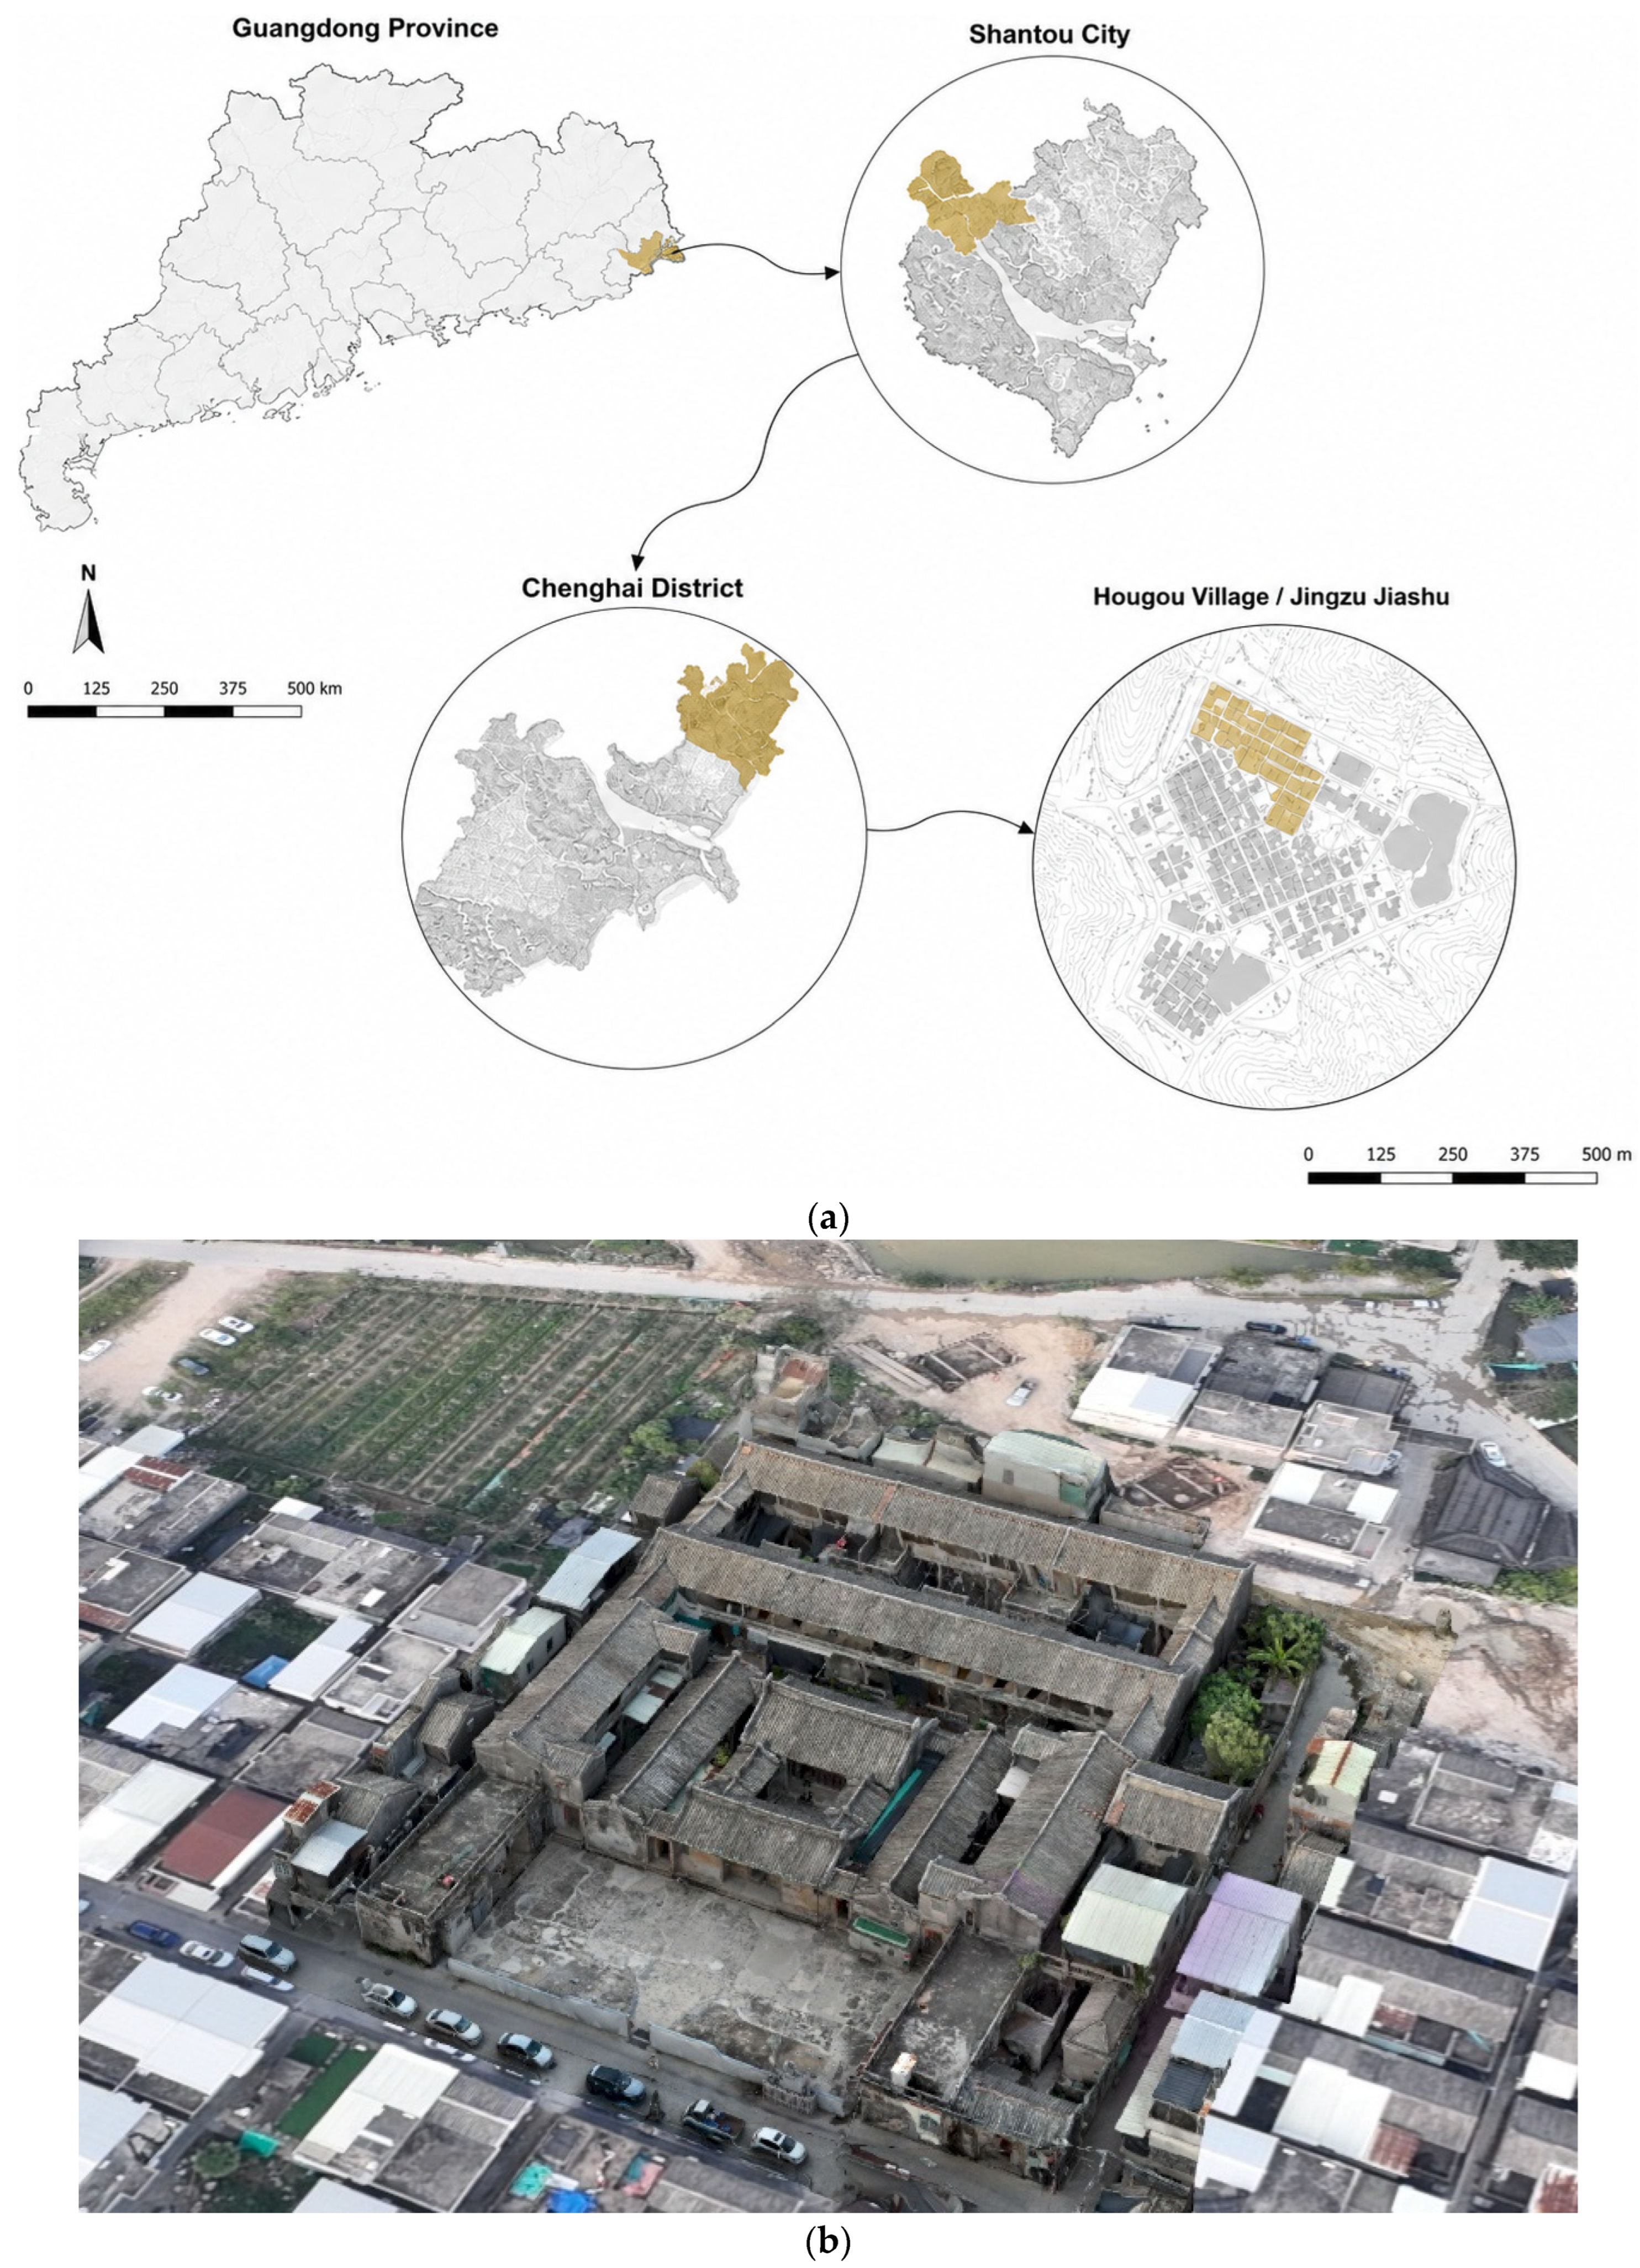
Jingzu Jiashu is located in Hougou Village, Longdu Town, Chenghai District, Shantou, Guangdong Province. It is situated within the Chaoshan coastal area of the Lingnan region, where hot–humid climate, strong solar radiation, heavy rainfall, monsoon winds, and typhoon-related weather conditions form a complex environmental background [34,35,36]. According to local historical records, the main building of Jingzu Jiashu was constructed in 1909 and is associated with the Xu family of the Wanxingchang remittance house [36]. As a residential and educational building embedded in a Chaoshan village settlement, Jingzu Jiashu reflects the spatial organization, lineage culture, overseas Chinese influence, and construction traditions of regional residential heritage [15,34,36]. From a spatial perspective, Jingzu Jiashu can be understood as an overseas-Chinese variant of the traditional Chaoshan “Si Dian Jin” dwelling type. Its spatial organization includes front and rear halls, front and rear rooms, courtyard spaces, corridors, side bays, thick walls, pitched roofs, and small or controlled openings. The inward-facing courtyard layout, air-well system, thick envelope, and limited openings indicate that the building form is closely related to passive adaptation to the hot–humid Lingnan climate [7,23,25].
Jingzu Jiashu was selected as the case study because it combines representative historical value, regional architectural characteristics, and clearly observable environmental-performance problems [34,36]. As a historic Chaoshan residence associated with overseas remittance culture, it reflects the lineage culture, overseas-remittance background, and traditional spatial organization of the region. Its courtyard layout, corridors, cold lanes, deep rooms, thick walls, and controlled openings also make it a suitable case for examining the environmental role of traditional climate-responsive elements. Field investigation further showed that the building faces summer overheating, insufficient daylighting in deep rooms, weak natural ventilation, and a mismatch between existing spatial functions and contemporary adaptive reuse demands [15,23,37].
Therefore, Jingzu Jiashu is treated in this study not only as a cultural heritage object, but also as a performance diagnosis object. The purpose is to examine how its existing spatial, material, and environmental conditions influence indoor thermal comfort, daylighting performance, and natural ventilation efficiency, and how building performance simulation can support heritage-sensitive green retrofit. The location and architectural context of Jingzu Jiashu are shown in Figure 2.

3.2. Field Investigation, Digital Documentation, and Baseline Model Construction

The baseline simulation model of Jingzu Jiashu was constructed by integrating UAV-based photogrammetry, field measurement, architectural survey, material investigation, supplementary thermal-humidity measurement, and climatic boundary conditions. The purpose of this process was to transform the existing heritage building from a surveyed architectural object into a simplified but performance-relevant digital model for subsequent thermal, daylighting, and ventilation simulations. In this study, digital documentation was not used merely for visual recording, but as a data acquisition procedure for capturing the building geometry, spatial enclosure, surrounding built context, and physical characteristics required for environmental performance simulation. In parallel with UAV-based digital documentation, field measurements were conducted to obtain architectural dimensions and material information that could not be fully extracted from the photogrammetric model. A combination of tape measurement and laser distance measurement was used to record the bay width and depth of rooms, eave and ridge heights, ground-level differences, door and window dimensions, opening heights, and wall or opening thicknesses. These measured data provided the geometric basis for correcting the digital documentation results and constructing the simplified baseline model.
In addition, a handheld thermo-hygrometer (Tashi 4G temperature and humidity recorder, Tashi, Jinhua, China) was used to conduct supplementary thermal-humidity measurements in representative indoor and outdoor spaces during the hot–humid season. The measurement points included the front open space, the central courtyard, the rear hall, and a deeper interior room. The measured air temperature ranged from 32.6 °C to 35.2 °C, while the relative humidity ranged from 68.4% to 82.7%, as summarized in Table 1. The highest air temperature was recorded in the front open space, reaching 35.2 °C with a relative humidity of 68.4%, indicating strong outdoor heat exposure. The central courtyard recorded an air temperature of 33.8 °C and a relative humidity of 74.6%, suggesting that the open courtyard could reduce air temperature to some extent but remained affected by the hot–humid coastal climate. By contrast, the rear hall and the deeper interior room had relatively lower air temperatures of 32.9 °C and 32.6 °C, respectively, but their relative humidity levels were higher, reaching 79.8% and 82.7%. This indicates that more enclosed spatial forms and limited openings may weaken air exchange and moisture dissipation in deeper indoor spaces.
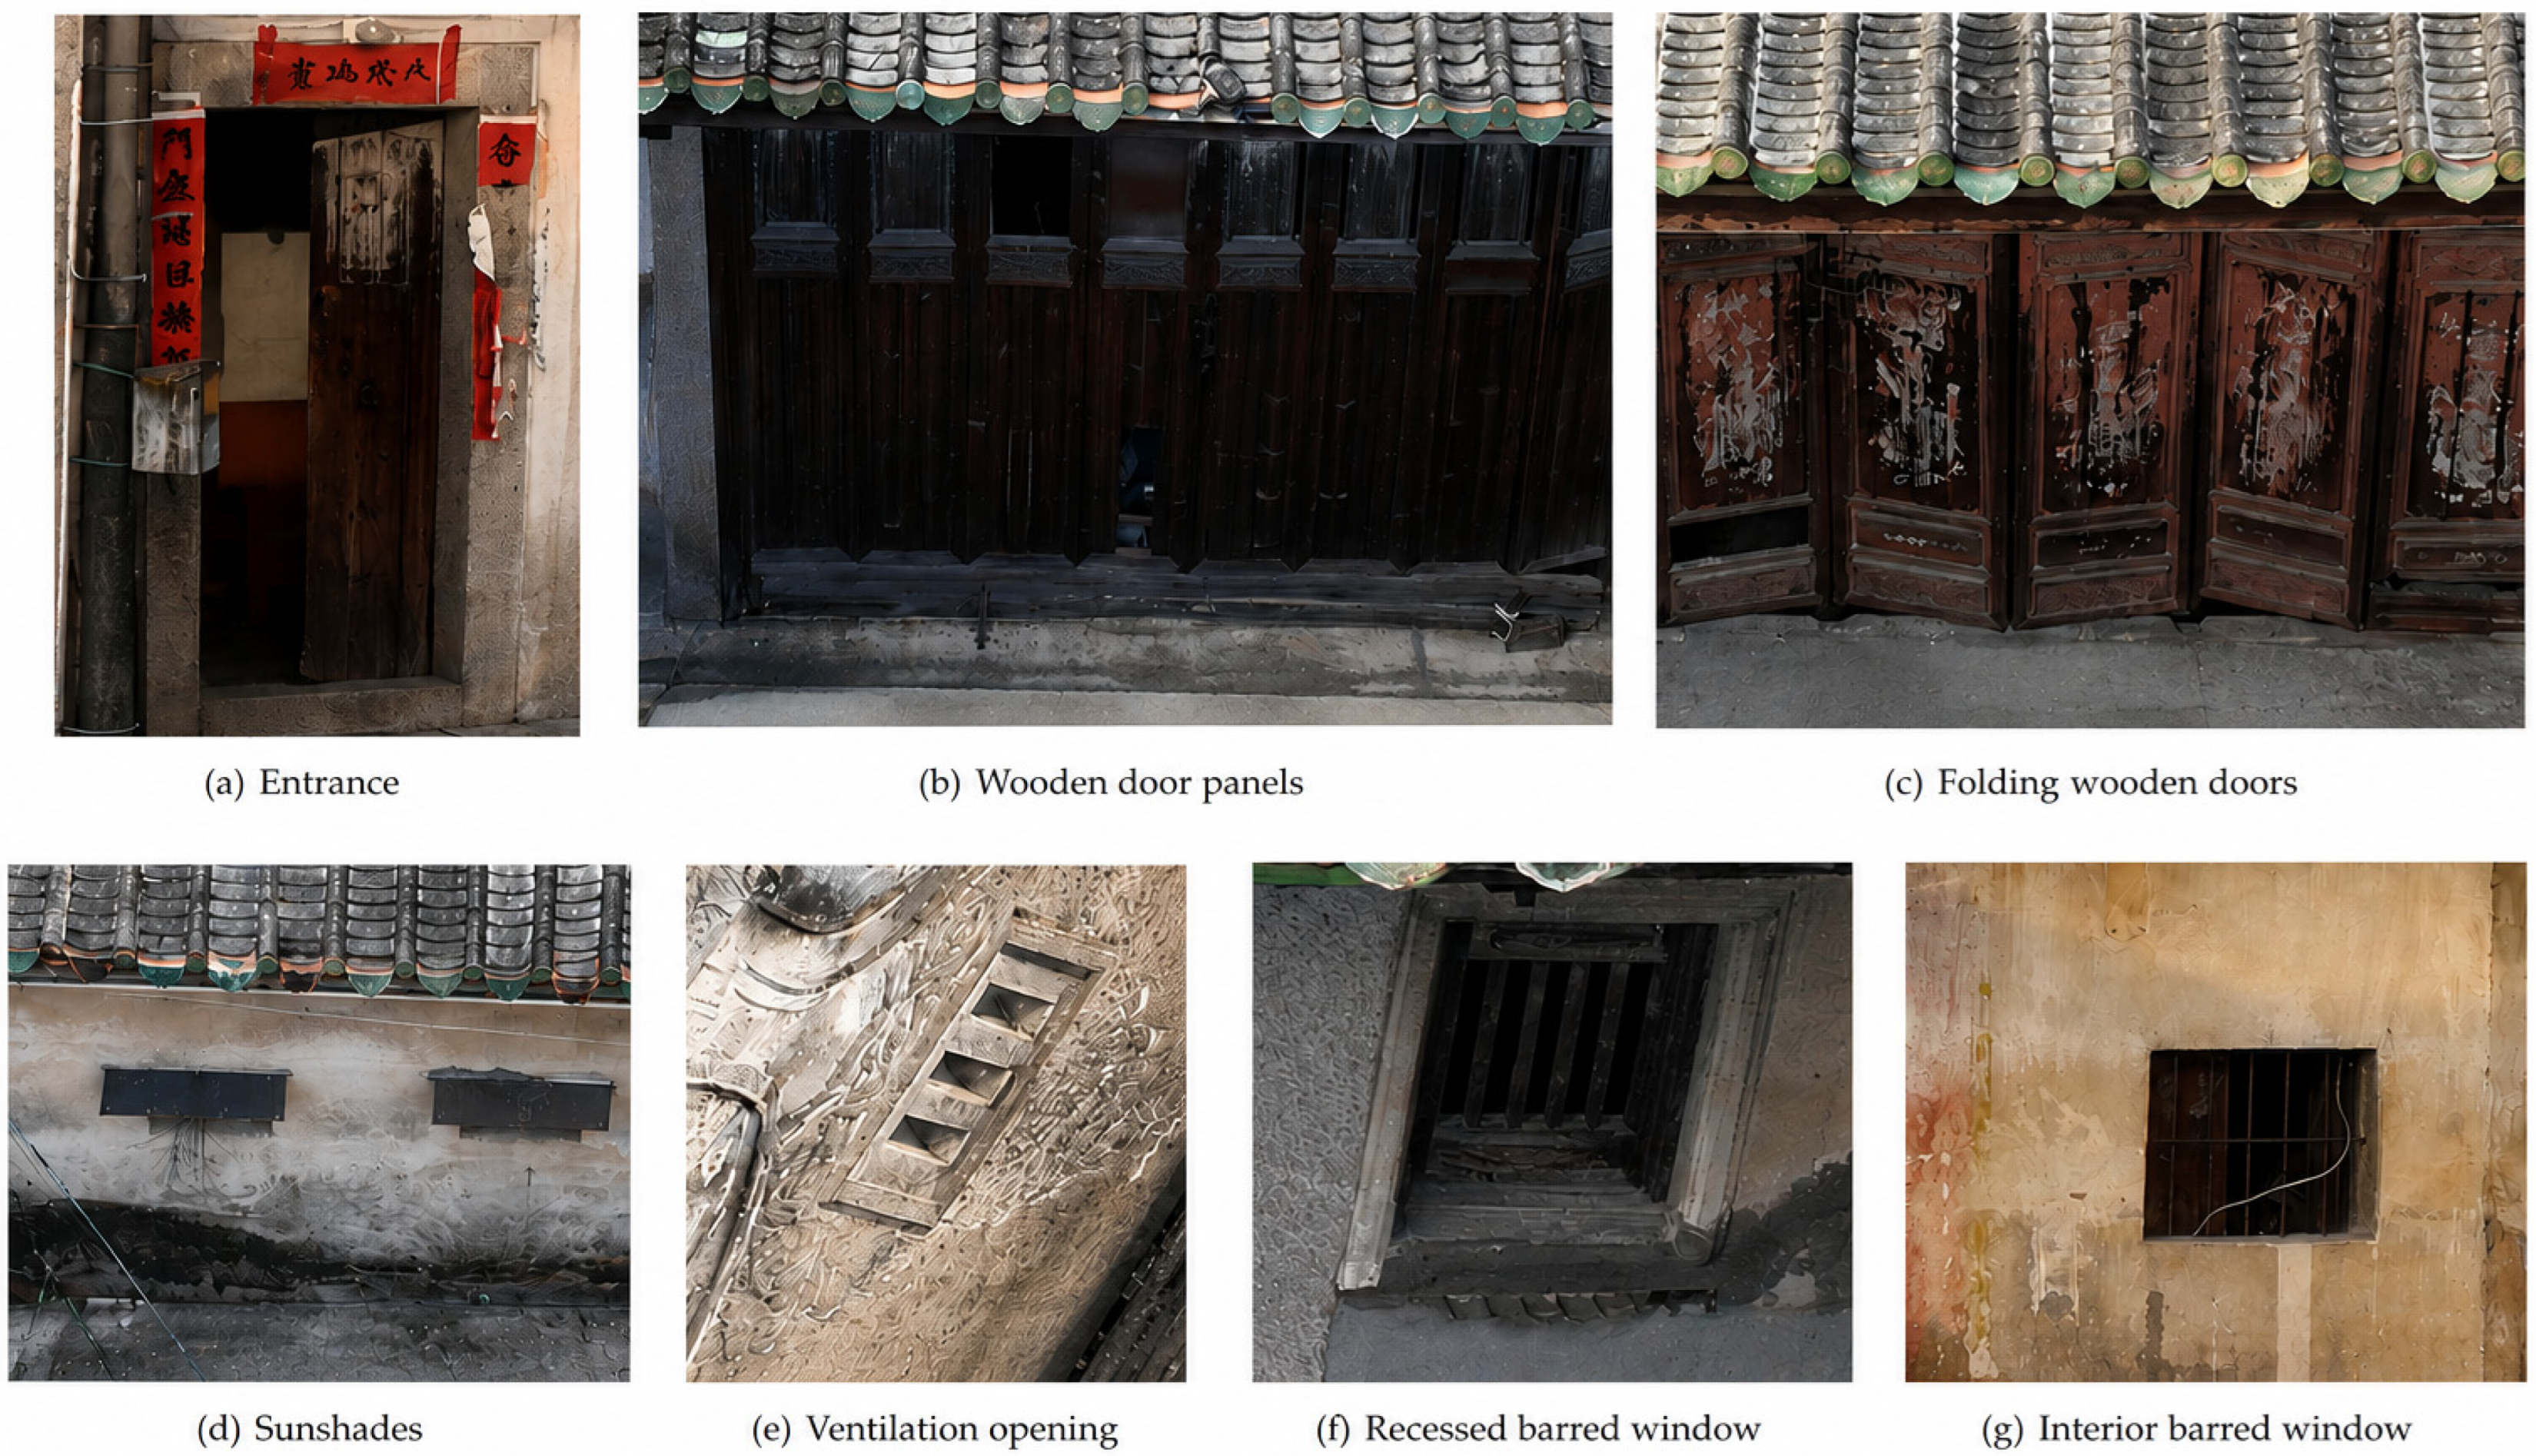
The field investigation further revealed several spatial and environmental problems. Although the central courtyard functions as an open air well and can provide a certain degree of air movement, the rear hall and deeper rooms have relatively fewer window openings and limited cross-ventilation organization. As a result, some indoor spaces exhibited weak perceived air movement, insufficient heat-dissipation potential, and a relatively stagnant indoor environment. In addition, the main building area and deeper rooms were observed to be relatively dim, suggesting insufficient daylight availability caused by large room depth, strong spatial enclosure, and limited opening area. Under summer conditions characterized by high temperature, high humidity, intense solar radiation, and unstable wind environments during the typhoon season, these spatial characteristics may further intensify indoor thermal discomfort, moisture accumulation, and uneven environmental quality distribution. Material types and construction conditions were also recorded through on-site observation and photographic documentation. The field investigation photographs are shown in Figure 3.
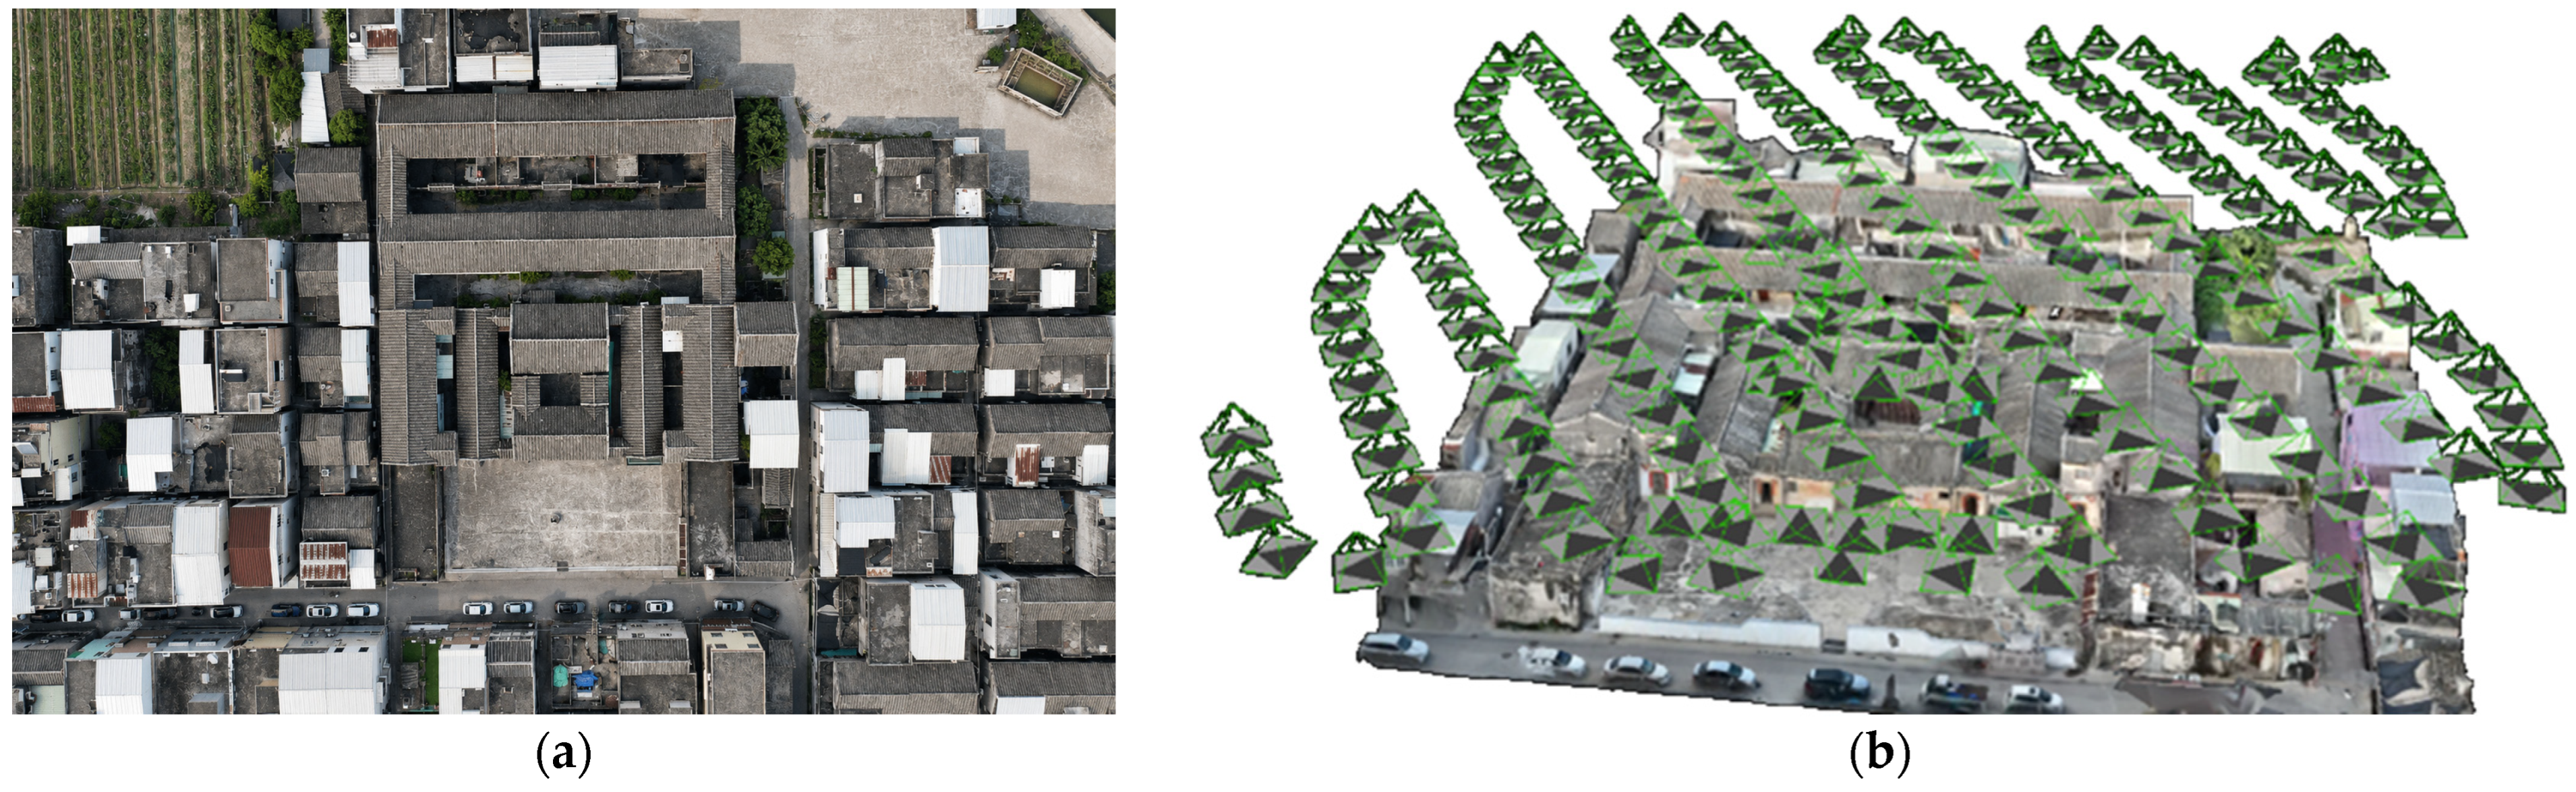
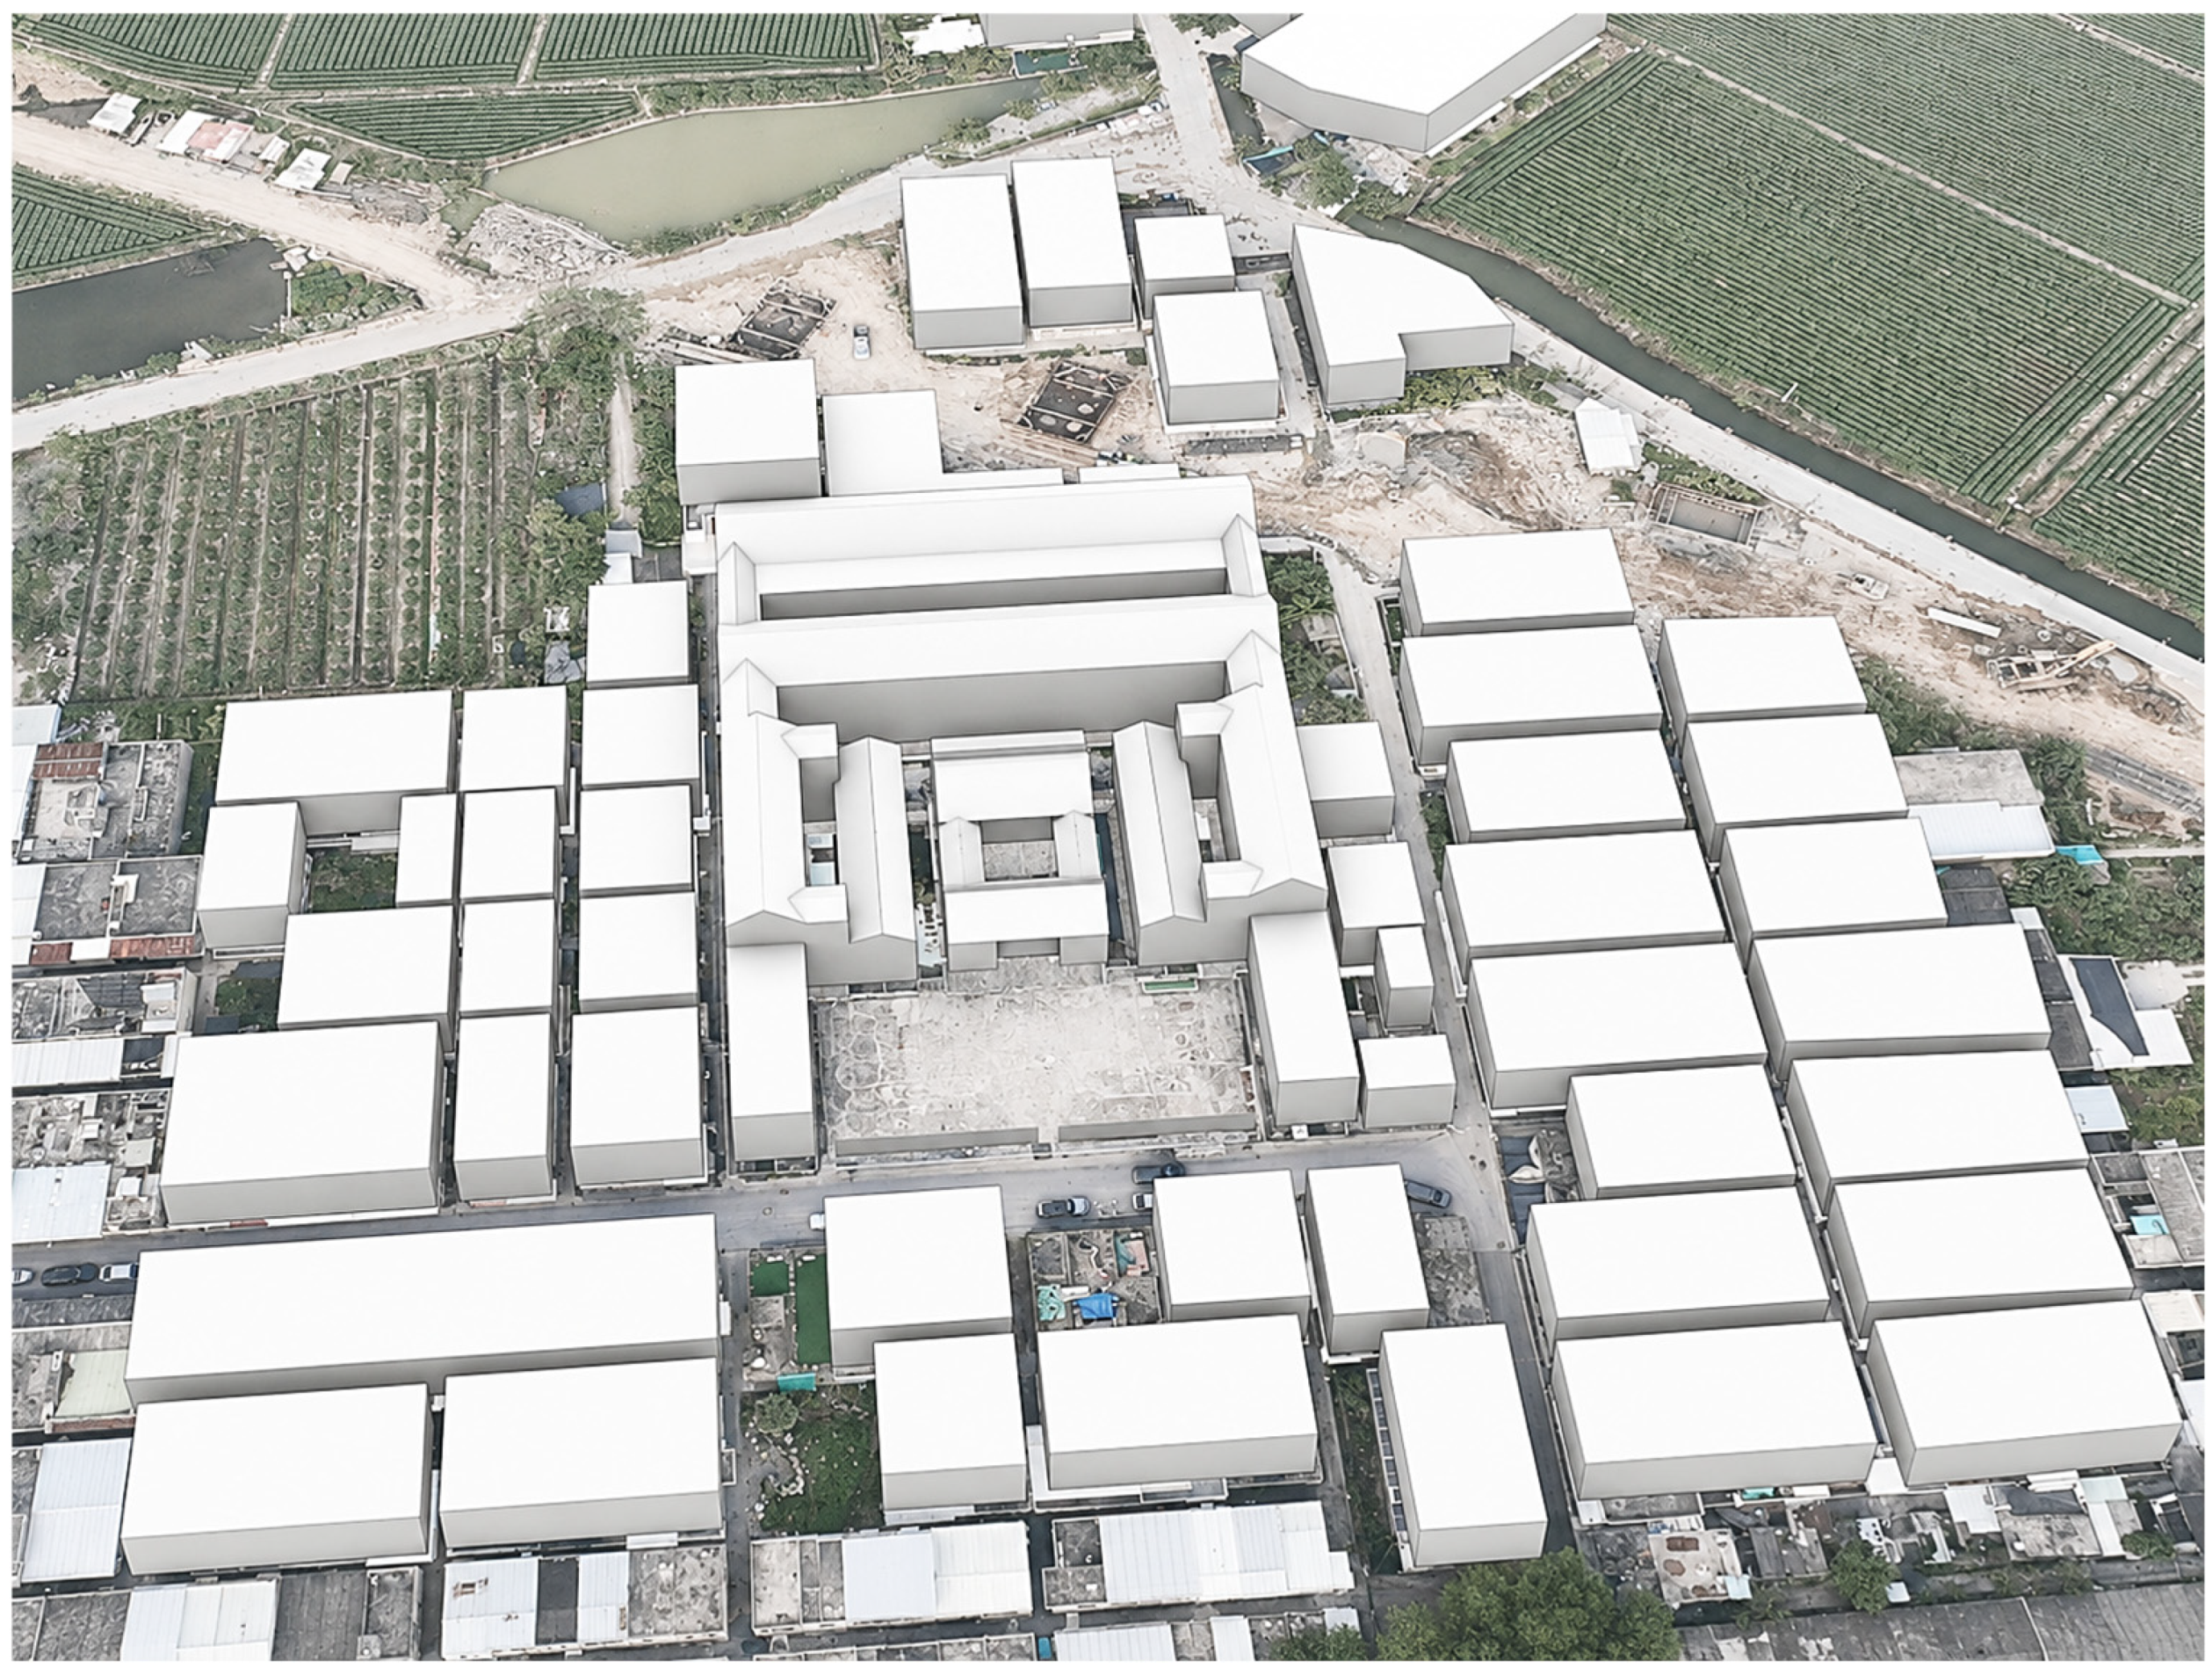
Outdoor geometric information was obtained through UAV oblique photogrammetry to support the construction of the baseline simulation model. A DJI Mavic 3E UAV (SZ DJI Technology Co., Ltd., Shenzhen, China) equipped with a DJI_M3E_WideCamera_12.29 camera was used to record Jingzu Jiashu and its surrounding built environment. The image resolution was 5280 × 3956 pixels, and the survey area covered approximately 100 m around the main building. The image acquisition process included both planned-route photography and additional manual façade photography. During the planned-route flight, 188 images with POS information were captured at an approximate height of 30 m, and 27 additional façade images were collected manually. In total, 215 photographs were used for the outdoor three-dimensional reconstruction of Jingzu Jiashu. These images were processed in DJI Terra 3.8 to generate a visible-light three-dimensional reconstruction, including aerial triangulation, camera-position calculation, photogrammetric coverage analysis, mesh generation, and point-cloud output. The aerial orthophoto and camera-position distribution were used to verify the overall site layout, surrounding building context, courtyard configuration, roof form, and spatial enclosure of Jingzu Jiashu. These outputs provided the geometric basis for subsequent model correction, simplification, and baseline performance simulation. The UAV photogrammetry process and site orthophoto are shown in Figure 4.
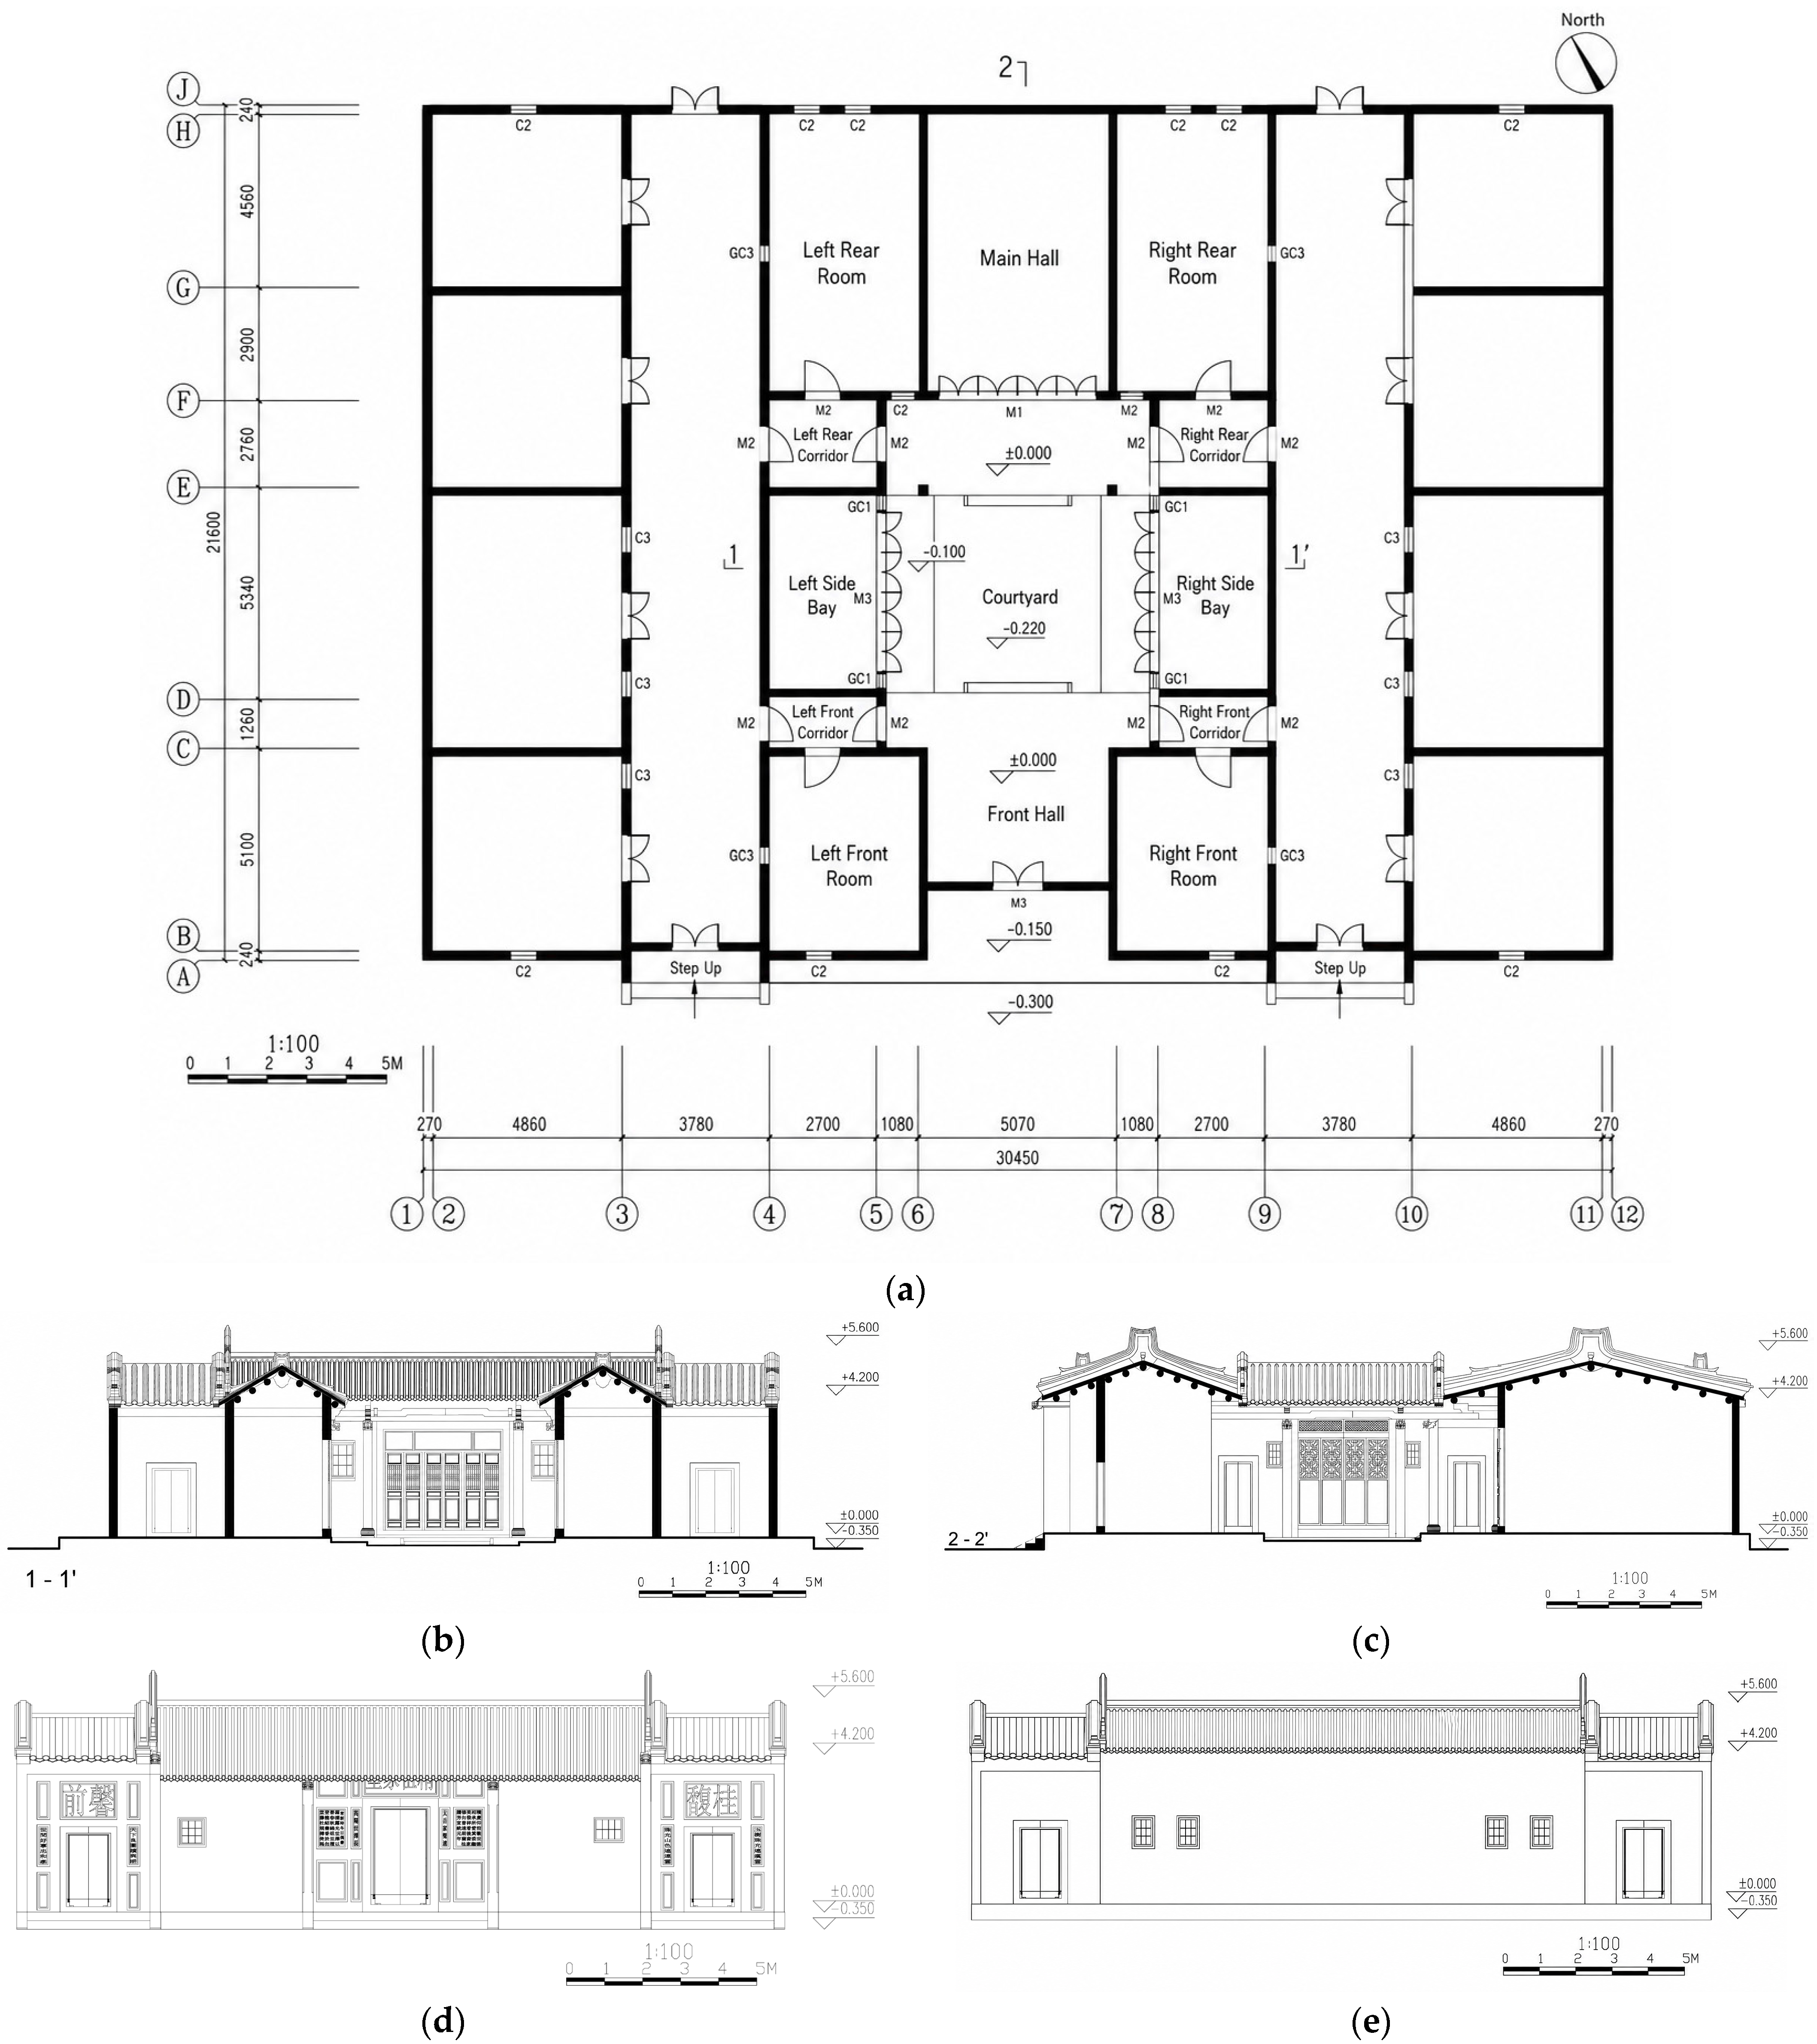
Based on the UAV photogrammetry results and field-measured architectural dimensions, architectural survey drawings were prepared to verify the spatial layout, room dimensions, elevations, sections, opening positions, and envelope thicknesses before constructing the simplified baseline simulation model. These drawings provided the geometric reference for model correction and are presented in Figure 5.
The baseline model was then constructed by combining the UAV-based three-dimensional reconstruction, field-measured dimensions, architectural drawings, material records, and climatic boundary conditions. For simulation purposes, the model was simplified to retain the main performance-relevant features, including the overall spatial layout, halls, rooms, courtyard spaces, corridors, wall thicknesses, roof form, door and window openings, and the surrounding built context. Decorative details and small components that had limited influence on thermal, daylighting, or ventilation calculations were omitted to improve computational efficiency and model stability. This simplification followed the principle that building performance simulation should capture the dominant spatial and physical characteristics affecting indoor environmental performance, rather than reproduce every architectural detail [16,18,19]. The simplified baseline simulation model integrated with the surrounding built context is shown in Figure 6.
Material and optical parameters were assigned according to field investigation, national standards, and literature-based values for comparable traditional building materials. The main components considered in the model included rammed-earth walls, tiled roofs, traditional ground surfaces, and timber doors. For each component, parameters such as thickness, thermal resistance, thermal inertia index, exterior solar absorptance, and interior visible reflectance were recorded or converted into simulation inputs. These parameters linked the physical characteristics of the historic building envelope with thermal comfort and daylighting performance assessment [35,38,39].
The material and optical parameters used in the baseline simulation model are summarized in Table 2.
The resulting baseline model served as the common reference model for all subsequent simulations. Thermal comfort analysis, daylighting assessment, and CFD-based ventilation simulation were conducted under the baseline condition before retrofit interventions were introduced. This ensured that the environmental deficiencies of Jingzu Jiashu could be diagnosed under a consistent geometric and material basis, and that the effectiveness of later climate-adaptive retrofit scenarios could be evaluated through before–after comparison [12,18,19].

3.3. Climate and Disaster-Prone Weather Exposure in Shantou

Shantou is located in the eastern coastal area of Guangdong Province and belongs to the hot-summer and warm-winter climate zone of South China [35,37]. This regional climate is characterized by long hot and humid periods, abundant rainfall, strong solar radiation, and seasonal wind conditions influenced by both monsoon circulation and typhoon activity [1,7,35]. For historic residential buildings such as Jingzu Jiashu, these climatic factors constitute compound environmental stress rather than a single thermal or ventilation problem [2,3,10]. Therefore, this study interprets the extreme-weather exposure of Shantou from four aspects: air temperature, solar radiation, relative humidity, and wind environment [16,35,39]. Hourly climatic data processed through Ladybug were used to characterize the local environmental boundary conditions for subsequent thermal, daylighting, and ventilation simulations.
The temperature profile shows a clear summer overheating risk [7,26,35]. As shown in Table 3, the monthly mean temperature reaches 28.3 °C in June, 29.9 °C in July, 29.2 °C in August, and 28.6 °C in September, while the monthly mean maximum air temperature reaches 38.0 °C in July [35]. Such high-temperature conditions increase the risk of indoor overheating, especially in rooms with limited openings, deep plans, or insufficient air movement [4,8,26]. Solar radiation is another important climatic factor affecting the thermal and daylighting performance of Jingzu Jiashu [17,20,38]. Because Shantou is located at a low latitude near the Tropic of Cancer, solar altitude is high in summer, and solar radiation is concentrated during July and August [35]. This condition may intensify solar-radiation-driven overheating of roofs, walls, courtyards, and semi-open transitional spaces, while also influencing the spatial distribution of indoor daylight availability [4,17,38].
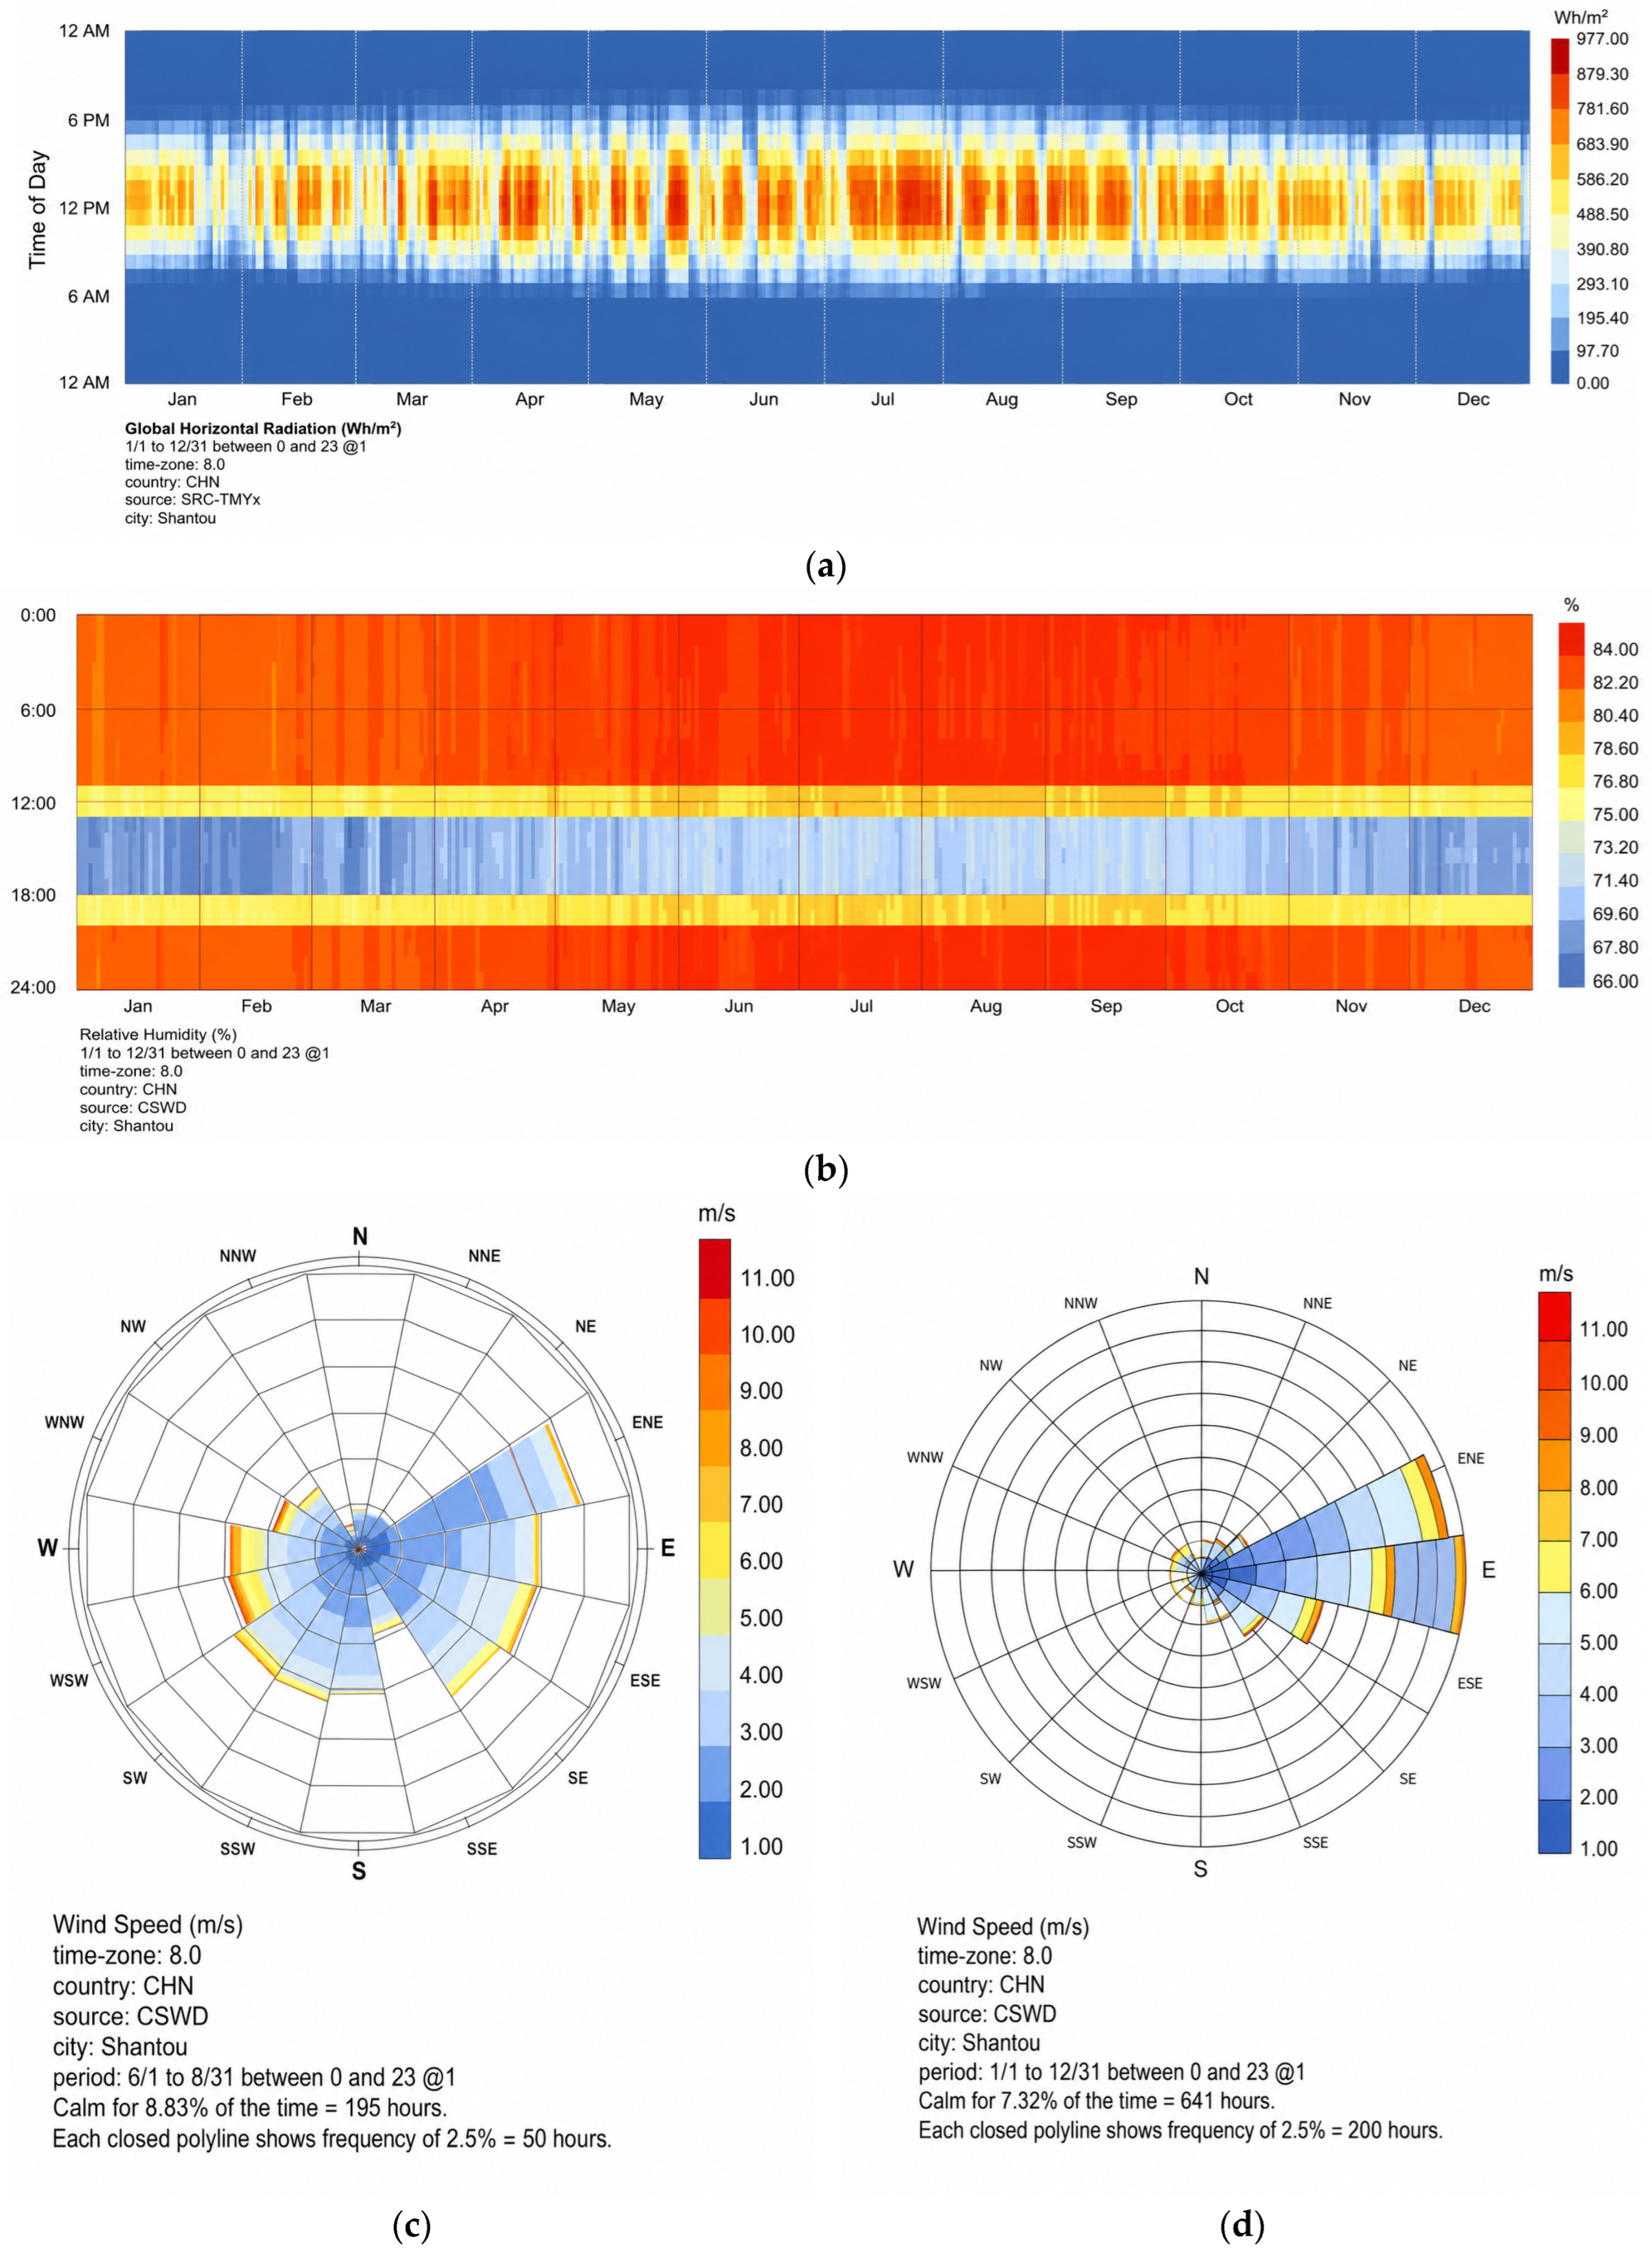
Relative humidity further increases the complexity of environmental performance in Shantou [2,4,40]. Based on the Ladybug-processed climate data used in this study, the local climate is marked by abundant rainfall and a distinct wet season, with most precipitation concentrated from March to September; the annual mean relative humidity is approximately 82%, and humidity may reach 100% during the “Hui-nan-tian” period and typhoon-season humid periods, as shown in Figure 7b [35,37]. During many nighttime and early-morning periods, relative humidity remains above 90%, which may increase condensation risk, perceived stuffiness, and moisture-related material deterioration [2,40].
The wind environment of Shantou is affected by both monsoon and typhoon systems, making ventilation design an important component of climate-adaptive reuse [7,18,21]. According to the Ladybug-processed wind data shown in Figure 7c,d, the annual mean wind speed is approximately 2.8 m/s, with easterly winds as the dominant annual wind condition, while the summer wind environment is mainly characterized by southeasterly winds. Under typhoon-season wind influence in the processed dataset, the maximum wind speed reaches approximately 8 m/s, and the summer mean wind speed is about 3.2 m/s. These wind conditions provide both an opportunity and a constraint: prevailing summer winds can support natural ventilation, but surrounding buildings, enclosed rooms, and limited openings may reduce actual airflow efficiency within historic residences [18,21,27].
In this study, climate and extreme-weather exposure is treated as a set of environmental boundary conditions affecting thermal comfort, daylighting, humidity control, and natural ventilation, rather than as a structural typhoon-resistance or flood-risk problem. The solar radiation, relative humidity, annual wind environment, and summer/typhoon-season wind conditions of Shantou are shown in Figure 7.

3.4. Building Performance Simulation Workflow Construction

3.4.1. Simulation Platform and Software Tools

The building performance simulation workflow was established using an integrated digital modeling and environmental simulation platform. The simulation tools were selected according to their established use in building performance simulation and their correspondence with the three environmental indicators examined in this study. Detailed information on the software tools used in this study is provided in Appendix A. EnergyPlus/Honeybee was used for thermal simulation because EnergyPlus is widely applied to whole-building heat-balance calculation and indoor thermal-condition analysis [19]. Radiance was used for annual daylighting simulation because it is a physically based lighting simulation system commonly used in architectural daylight analysis and dynamic daylight metrics [17,20]. Butterfly/OpenFOAM was used for natural ventilation analysis because CFD methods are suitable for evaluating airflow paths, wind-speed distribution, and ventilation performance in and around buildings [18,21]. Ladybug Tools and Honeybee provided the parametric interface linking climate data, Rhino/Grasshopper geometry, simulation engines, and visualized performance feedback [22].
In the workflow, UAV images were first processed in DJI Terra 3.8 to generate the visible-light three-dimensional reconstruction and site model. The architectural geometry was then corrected, simplified, and reconstructed in Rhinoceros 7.0 with Grasshopper. Within Grasshopper, Ladybug Tools 1.8 and Honeybee were used to process weather data, construct the analytical building model, assign material and boundary conditions, and organize the thermal and daylighting simulation workflows. EnergyPlus 23.2 calculated hourly indoor air temperature, operative temperature, mean radiant temperature, relative humidity, indoor air speed, and PMV-related outputs; Radiance 5.4 calculated annual daylight autonomy at 300 lx (DA300); and Butterfly/OpenFOAM v10 simulated wind-speed distribution, airflow paths, and room-level air exchange potential. The calculated volumetric airflow rates were converted into ACH values and compared with the required ACR values under the assumed occupancy conditions. Microsoft Excel 2021 and Grasshopper visualization components for Rhinoceros 7.0 were used for data processing, statistical comparison, and result visualization.
As shown in Figure 8, the overall workflow includes five connected stages: data collection, parameterization, performance simulation, analysis and comparison, and retrofit effect verification. Field investigation, UAV photogrammetry, architectural survey, material investigation, climate data, and environmental observations provided the basis for the baseline model. The architectural geometry and key parameters were then reconstructed in Rhinoceros and Grasshopper, followed by thermal comfort, daylighting, and natural ventilation simulations using Ladybug Tools, Honeybee, EnergyPlus, Radiance, and Butterfly/OpenFOAM. Finally, PMV, DA300, and ACH/ACR were used to compare baseline and post-retrofit performance and to support the environmental retrofit strategy.

3.4.2. Simulation Indicators: PMV, DA300, and ACH/ACR

To evaluate the baseline environmental performance of Jingzu Jiashu and compare the effectiveness of later retrofit interventions, this study selected three groups of indicators corresponding to thermal comfort, daylighting performance, and natural ventilation efficiency. These indicators were selected according to the main environmental problems identified through field investigation and climate analysis, namely indoor overheating, uneven daylight distribution, and weak air movement. The selected simulation indicators and evaluation criteria are summarized in Table 4 [17,20,38].
Thermal comfort was evaluated using the Predicted Mean Vote (PMV) index. PMV predicts the mean thermal sensation of occupants on a seven-point scale from cold to hot by considering environmental parameters such as air temperature, mean radiant temperature, relative humidity, and air speed, together with personal parameters such as metabolic rate and clothing insulation. In this study, PMV was used to compare the thermal comfort condition of different rooms under the baseline and retrofit scenarios, with values closer to 0 indicating more neutral thermal sensation. The range of −0.5 ≤ PMV ≤ +0.5 was used as the strict thermal comfort range. Considering that Jingzu Jiashu is a naturally ventilated historic dwelling in a hot–humid coastal region, −1 < PMV < +1 was also used as an extended acceptable range to support the interpretation of adaptive comfort. PMV was not used to claim absolute occupant satisfaction, but to provide a consistent comparative basis for identifying overheating risk and evaluating retrofit effects [26,28,41].
Daylighting performance was evaluated using daylight autonomy at 300 lx (DA300). Daylight autonomy is a dynamic daylight metric that measures the percentage of occupied time during which indoor illuminance at a sensor point meets or exceeds a specified threshold [17,20,22]. In this study, DA was calculated using a Radiance-based annual daylight simulation through the Honeybee/Ladybug workflow [17,20,22]. A working-plane height of 0.75 m was used for sensor-grid placement, and DA300 was calculated as the percentage of occupied daytime hours in which the illuminance at each sensor point reached at least 300 lx [22,38]. Areas with DA300 ≥ 50% were interpreted as having effective daylight availability for general indoor activities [17,38].
Natural ventilation efficiency was evaluated using air changes per hour (ACH) and the required air change rate (ACR) [18,21,27]. ACH describes the number of times the air volume of a room is replaced per hour and was calculated as follows:
ACH = (Q × 3600)/V
where Q is the volumetric airflow rate through the room (m3/s), and V is the room volume (m3) [18,27]. The airflow rate was obtained from the CFD-based ventilation simulation, which was used to examine airflow paths, stagnant zones, and ventilation differences among rooms [18,21].
To provide a benchmark for judging whether the simulated ventilation level was sufficient under assumed occupancy conditions, the required air change rate was calculated as follows:
ACRreq = (qp × N × 3.6)/V
where qp is the required outdoor airflow rate per person, N is the number of occupants, and V is the room volume [27]. The ratio between simulated ACH and required ACR was used to assess whether each room had sufficient air exchange potential under the assumed use condition. In this study, ACH/ACR was not treated as a direct measure of indoor air quality, but as an airflow-based indicator for comparing the ventilation performance of the baseline and retrofit scenarios [6,27].

3.4.3. Thermal Environment Simulation Workflow

To ensure the comparability of thermal, daylighting, and ventilation simulation results, this study established the three simulation workflows on the same building geometry, regional weather file, and basic parameter assumptions. The overall workflow included geometric model preparation, surrounding-context simplification, material and boundary-condition assignment, occupancy and activity-parameter setting, simulation calculation, indicator extraction, and result visualization. This workflow corresponds to the research logic of “data acquisition—performance simulation—quantitative diagnosis—retrofit optimization—effect verification”. Thermal simulation was developed on the Rhino/Grasshopper platform, with Honeybee used to call the EnergyPlus engine for annual thermal-balance calculation. First, a simplified geometric model of Jingzu Jiashu and its surrounding context was established based on UAV photogrammetry, field measurement, and architectural survey drawings. During model simplification, spatial boundaries, roofs, walls, openings, courtyards, corridors, cold lanes, and surrounding building obstructions that significantly affect indoor thermal performance were retained, while decorative components and small-scale elements with limited influence on simulation results were simplified.
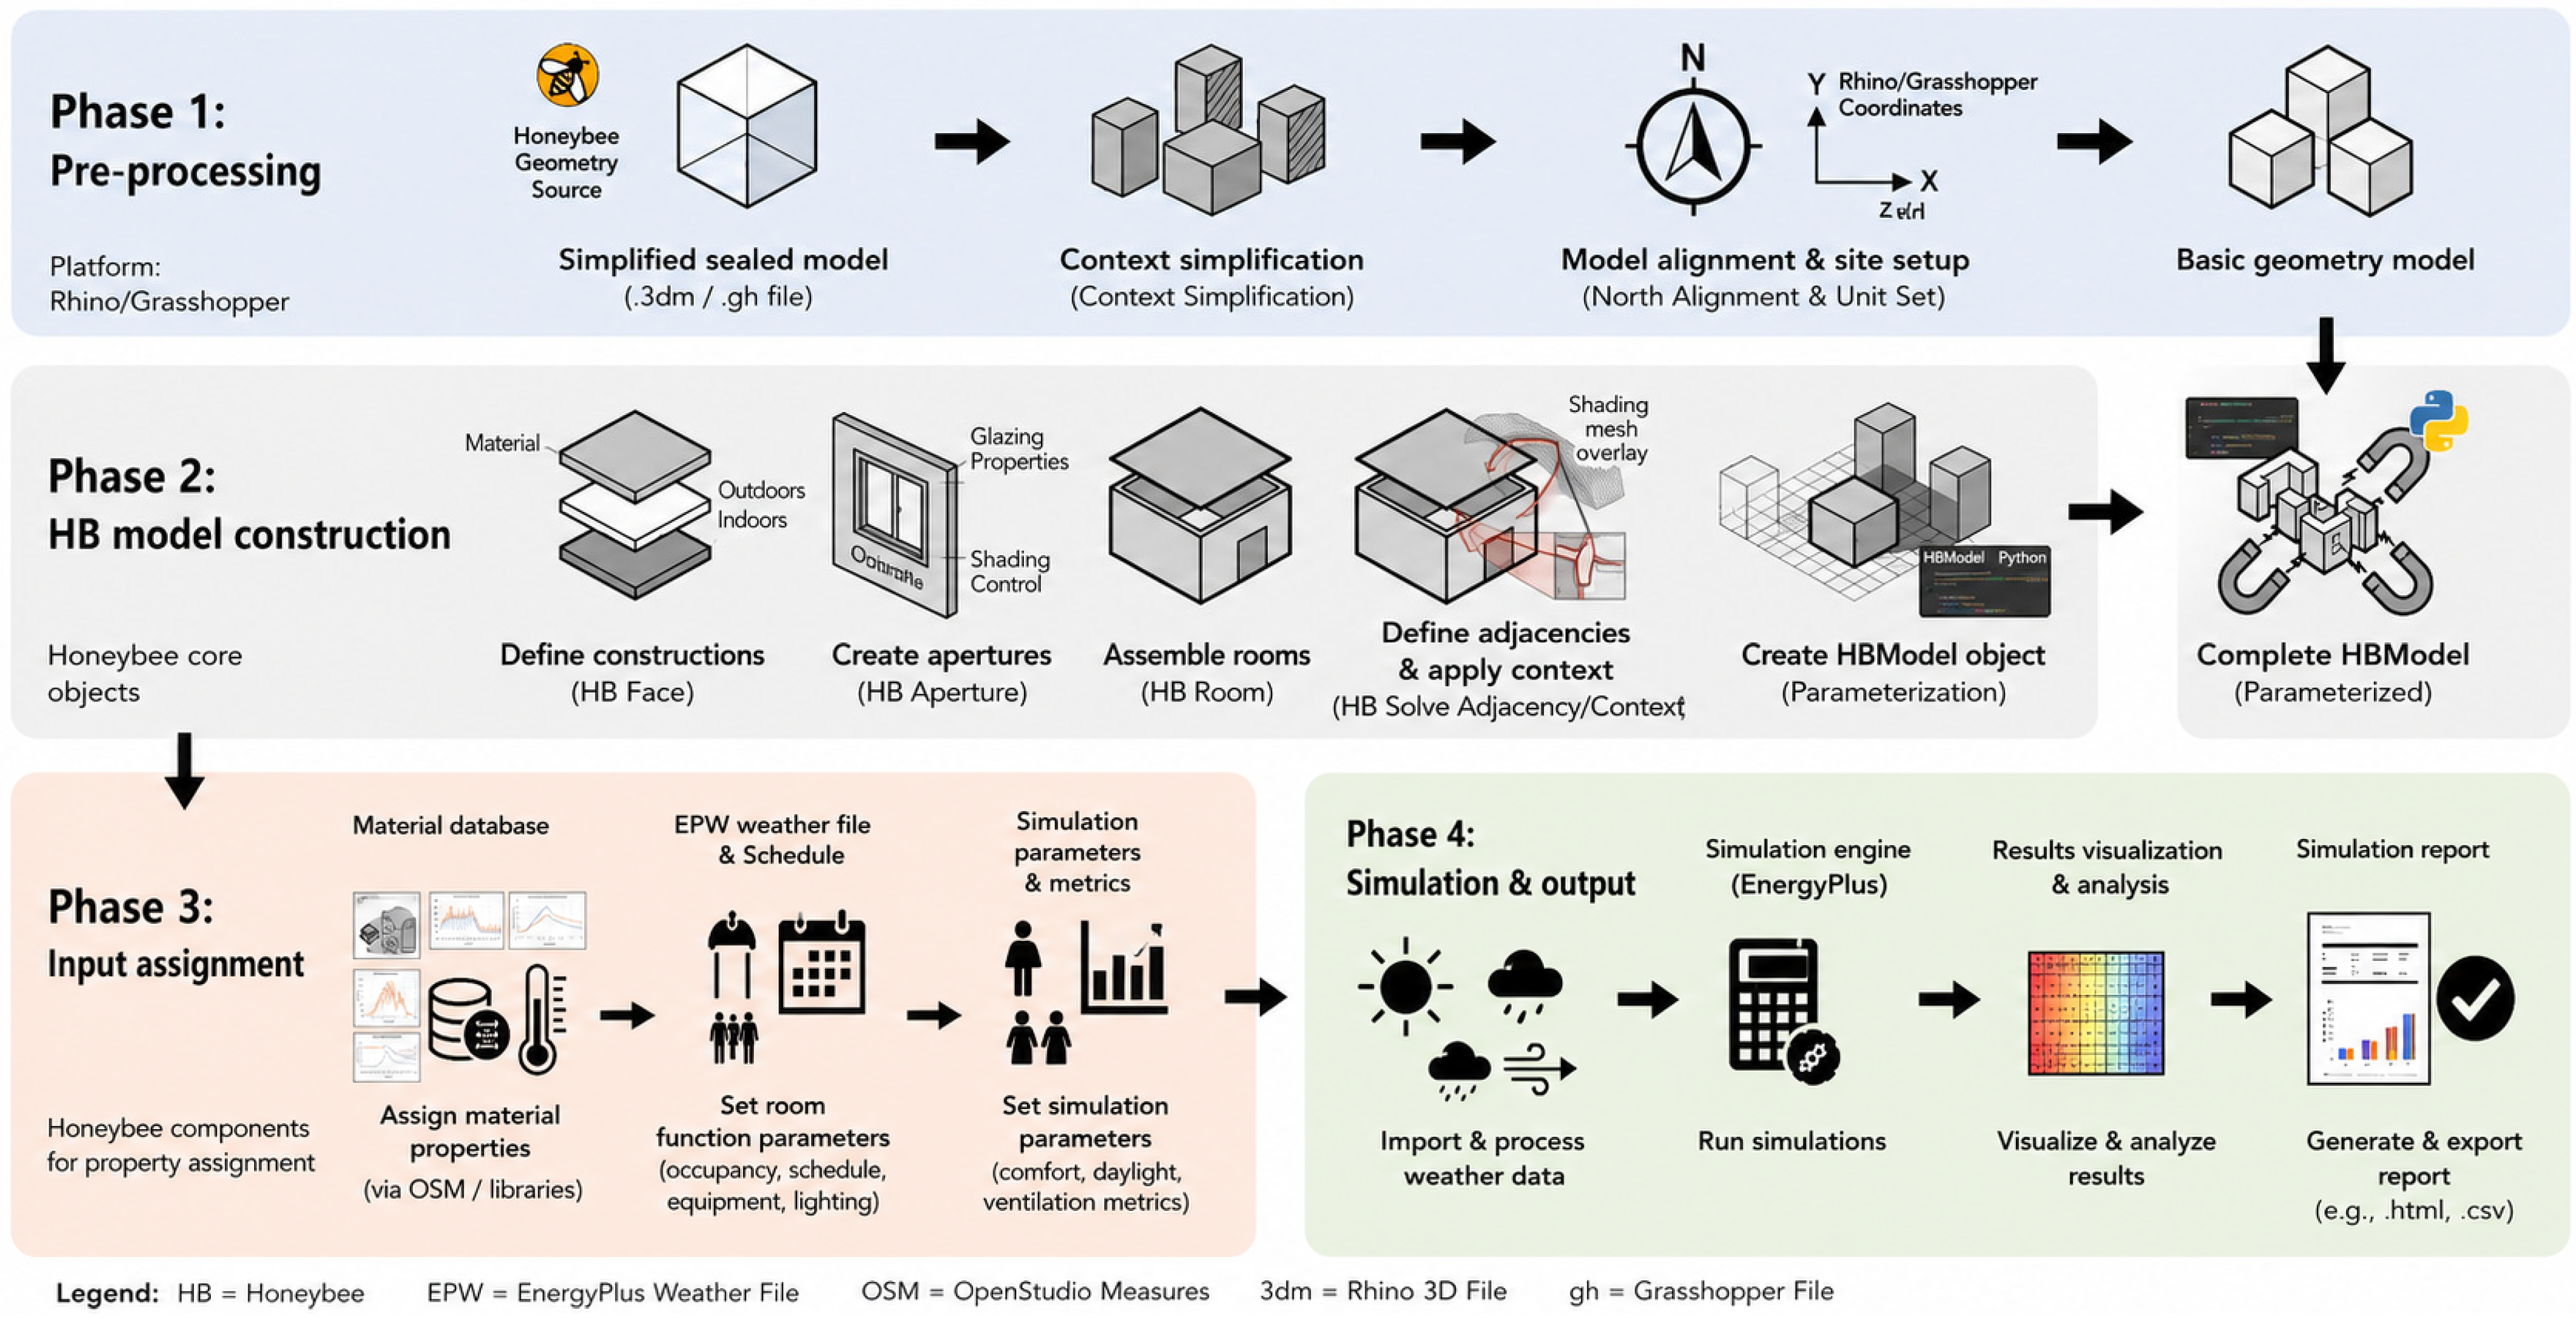
When importing the model into Honeybee, different building components were assigned corresponding boundary conditions and construction types. Exterior walls were defined with an “Outdoors” boundary condition, internal adjacent walls were defined with an “Indoors” boundary condition, floors were defined with a “Ground” boundary condition, and roofs were defined with an “Outdoors” boundary condition. Windows were imported as HB Apertures, and their operability was set to true to represent naturally ventilated conditions. In EnergyPlus, window operability was controlled by room-function-based schedules rather than by temperature-based or pressure-based triggers. Surrounding buildings and shading elements were imported as HB Shades to reflect the influence of surrounding obstructions on solar radiation and building thermal performance. At the room-model level, each space was organized as an HB Room, and HB Solve Adjacency was used to process the boundary relationships between adjacent rooms. Window opening conditions were then assigned to simulate thermal performance under naturally ventilated conditions. Finally, rooms, envelopes, openings, shading elements, and the surrounding context were integrated into a complete HB Model and converted into an EnergyPlus-compatible model.
The window-opening schedules were assigned according to the functional use logic of traditional Chaoshan residential spaces. Hall-type spaces were assumed to have higher daytime opening availability because they mainly support sitting, staying, communication, and reception activities. Bedroom-type rooms were mainly associated with resting and sleeping, and their opening availability was therefore assigned to early-morning and night-time periods. Side-bay spaces, which may support cooking, work, or short-term higher-intensity activities, were assigned short-term opening availability during typical activity periods. This room-function-based scheduling approach follows previous parametric research on Chaoshan and Hakka vernacular dwellings, in which occupancy and internal-load assumptions were differentiated by traditional space types, including halls, rooms, courtyards, and side rooms [42].
The same window-opening schedule logic was applied to both the baseline and retrofit models to ensure before–after comparability. The EnergyPlus thermal simulation and the Butterfly/OpenFOAM ventilation simulation were not dynamically coupled. Instead, they were used as complementary analyses under consistent geometric and opening assumptions: EnergyPlus evaluated annual thermal performance under scheduled natural-ventilation availability, while CFD was used to identify airflow paths, wind-speed distribution, and room-level ACH under a representative wind condition. Therefore, the PMV and ACH results are interpreted as comparative performance indicators under consistent simulation assumptions, rather than as evidence of a calibrated real-time operational window-control model. Thermal simulation outputs included hourly indoor air temperature, operative temperature, mean radiant temperature, relative humidity, indoor air speed, and PMV. The analysis focused on summer overheating periods, and PMV values, comfortable-hour ratios, thermally uncomfortable-hour ratios, and maximum PMV values were used to compare thermal comfort before and after retrofit.
The thermal simulation workflow and Honeybee model construction process are shown in Figure 9.

3.4.4. Occupancy, Activity, and Thermal Comfort Parameter Settings

PMV calculation is affected not only by environmental parameters such as air temperature, mean radiant temperature, relative humidity, and air speed, but also by personal parameters such as activity intensity, metabolic rate, clothing insulation, and occupancy schedule. Therefore, this study classified occupancy and activity parameters according to the functional characteristics of different spaces in Jingzu Jiashu. For bedroom-type rooms, which were mainly associated with resting, sleeping, or low-intensity stay, the occupant density was set to 0.08 person/m2, the activity intensity was set to 72 W, and the metabolic rate was set to 0.7 met. For hall-type spaces, which mainly supported sitting, staying, communication, and social activities, the occupant density was set to 0.12 person/m2, the activity intensity was set to 108 W, and the metabolic rate was set to 1.0 met. For side-bay spaces, which could support cooking, work, or short-term higher-intensity activities, the occupant density was set to 0.04 person/m2, the activity intensity was set to 207 W, and the metabolic rate was set to 1.8 met.
Occupancy schedules were assigned according to the daily use logic of traditional residential spaces. Halls were mainly used during the daytime, rooms were mainly used at night and early morning, and side bays were set as short-term use spaces in the morning, noon, and evening. Specifically, halls were set as occupied from 5:00 to 19:00; rooms were set as occupied from 1:00 to 4:00 and from 20:00 to 24:00; side bays were set as occupied at 5:00, 11:00, and 17:00. These assumptions were adapted from previous parametric research on Chaoshan and Hakka vernacular dwellings, in which occupancy and activity settings were differentiated according to traditional space functions, including halls, rooms, courtyards, and side rooms [42]. The occupancy, activity, and thermal comfort parameters used in the simulation are listed in Table 5.
These schedules should be interpreted as representative occupancy assumptions rather than measured occupant-behavior records. They were used to keep the before-after comparison internally consistent; uncertainty associated with actual future use is addressed in the limitations.

3.4.5. Daylighting Simulation Workflow

The daylighting simulation model used the same HB Model as the thermal simulation model to ensure consistency in geometric boundaries across thermal, daylighting, and ventilation analyses. Daylighting simulation was conducted by using Honeybee to call the Radiance engine for annual dynamic daylight assessment. In each HB Room, a sensor grid was generated at a working-plane height of 0.75 m, corresponding to a typical indoor working plane. The sensor-grid density was set to 0.1 m2. The HB Model and weather file were then connected to the HB Annual Daylight component to calculate annual daylight performance.
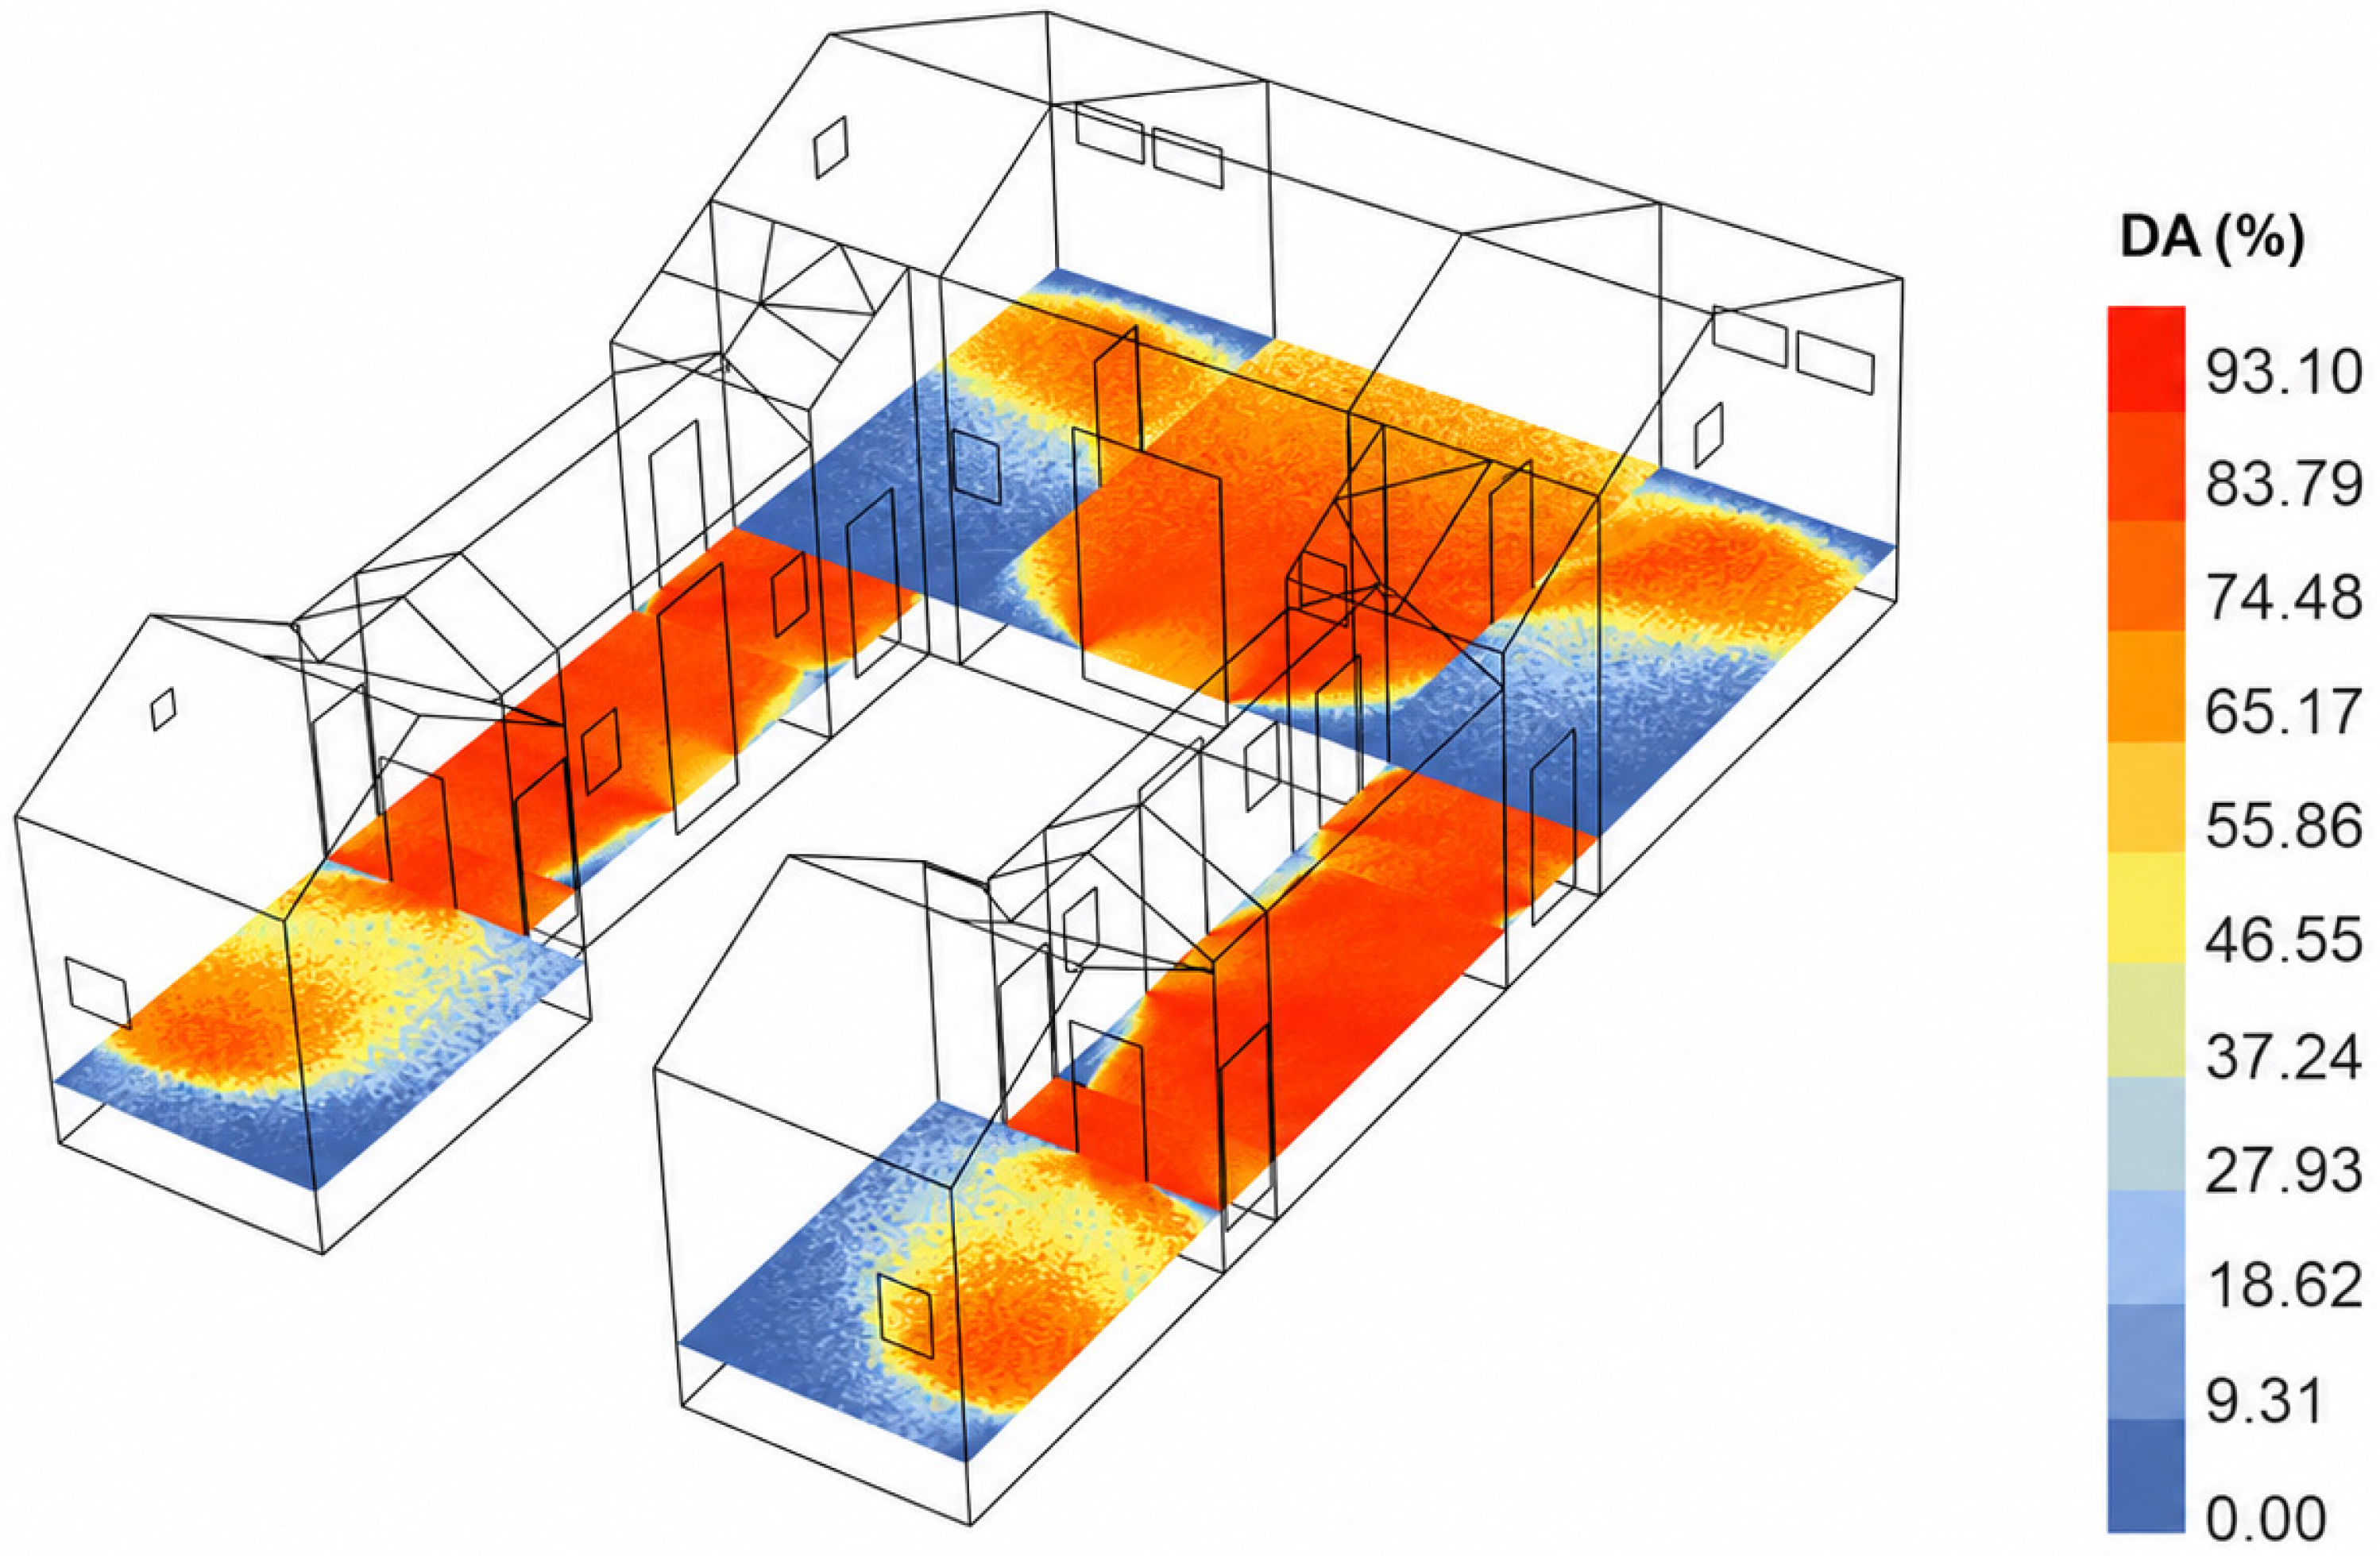
DA300 was used as the primary daylighting indicator. The calculation process included generating indoor sensor grids, conducting annual Radiance-based ray-tracing simulation, reading hourly illuminance results, filtering illuminance values equal to or higher than 300 lx, calculating the percentage of occupied daytime hours meeting this threshold, and outputting DA distribution maps. Areas with DA300 ≥ 50% were defined as effective daylight areas. This indicator was used to identify daylight deficiency in deep spaces such as the front and rear rooms and to evaluate the effect of opening optimization, courtyard daylight guidance, and functional reconfiguration after retrofit. The DA300 daylighting simulation workflow is shown in Figure 10.

3.4.6. Natural Ventilation Simulation Workflow

Ventilation simulation was used to evaluate airflow paths, wind-speed distribution, and room-level air exchange efficiency in and around Jingzu Jiashu. Butterfly/OpenFOAM was used for CFD-based wind environment simulation, and ACH/ACR was used to determine whether natural ventilation met the assumed use requirements. The building model was converted into CFD geometry, and boundary conditions including walls, ground, inlet, and outlet were assigned. The wind environment simulation referred to JGJ/T 449-2018 [39]. The simulation domain covered an area of approximately 160 m around the building, with local mesh refinement applied to the main building area and lower refinement levels applied to the surrounding context to balance calculation accuracy and computational efficiency.
The CFD simulation adopted a steady incompressible airflow approach. The computational domain was established using a wind-tunnel-type setting. The vertical distance from the top of the target building group to the upper boundary was set to 5H; the horizontal distance from the target building group to the lateral boundaries was set to 5H; the upstream distance was set to 5H; and the downstream distance was set to 10H, where H represents the height of the target building group. The ground condition was defined as a coastal terrain condition, with a gradient wind height of 300 m. A representative easterly inflow condition with an inlet wind speed of 10.5 m/s was used to identify airflow paths and compare the relative ventilation performance between the baseline and retrofit scenarios. This inlet condition was not used as the annual mean wind speed or as a typhoon-resistance design wind speed. Therefore, the CFD results should be interpreted as comparative airflow and ventilation indicators under the same boundary condition, rather than as annual natural-ventilation predictions.
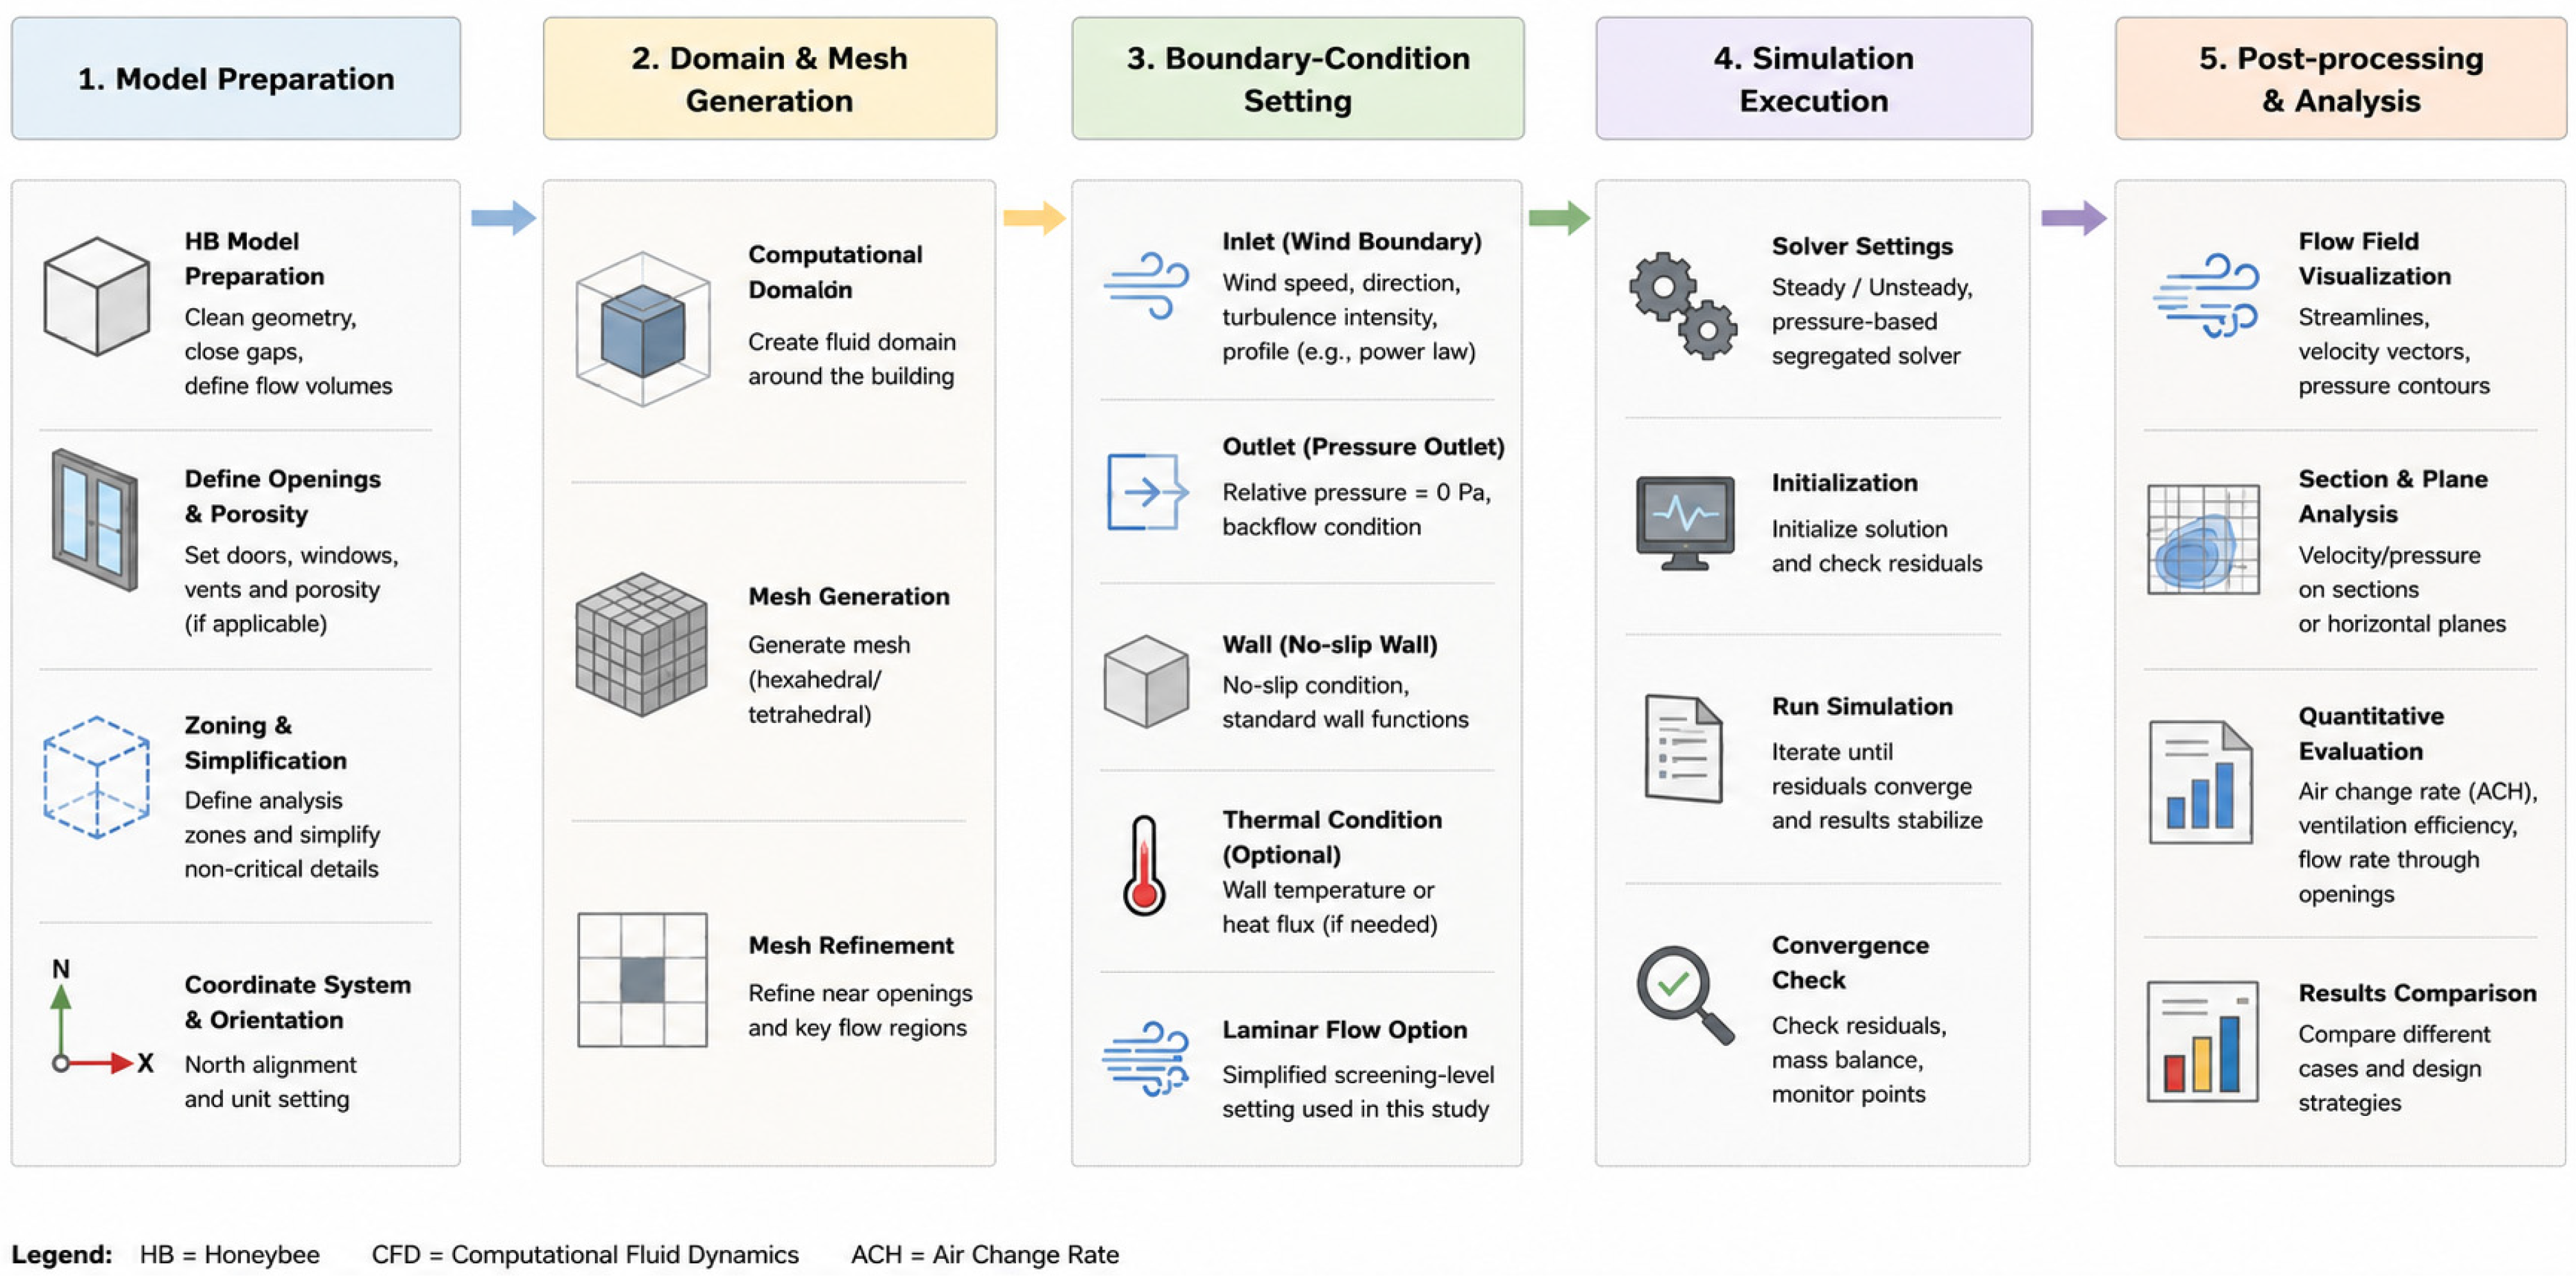
For the flow-model setting, the Butterfly/OpenFOAM definition used a laminar flow option. This setting was adopted as a simplified screening-level approach to compare airflow-path organization before and after retrofit, rather than as a fully calibrated urban wind simulation. This simplification does not capture the full turbulence characteristics of the urban wind environment, but it allows the baseline and retrofit scenarios to be compared under the same boundary and mesh-control assumptions. The computational mesh was generated using a base mesh with local refinement. The base cell size was set to 1 m, the cell-to-cell expansion ratio was set to 1.2, the surface feature refinement level was set to 3, and the global refinement level was set to 2–4. The final mesh sizes were approximately 4.73 million cells for the baseline scenario and 5.89 million cells for the post-retrofit scenario. The convergence criterion was defined as the reduction in the residuals of the main flow variables to the order of 1 × 10⁻⁴. The simulation was run for 300 iterations. After the airflow field became generally stable, wind-speed distributions were extracted at a height of 1.2 m above the floor level, and indoor wind speed and ACH values were calculated for the representative rooms.
The natural ventilation simulation workflow and CFD boundary-condition setting are shown in Figure 11.

3.5. Baseline/Retrofit Consistency, Model Validation, and Uncertainty Control

To ensure that before–after simulation results were comparable, the baseline and post-retrofit models used the same weather file, simulation period, basic material assumptions, occupancy parameters, sensor-grid height, ventilation computational domain, and evaluation indicators. The only differences between the two models were the components directly related to the retrofit strategy, including functional layout, envelope thermal improvement, opening adjustment, shading configuration, ventilation-path organization, and courtyard/transitional-space adjustment. This consistency control reduced interference from non-retrofit factors and made the changes in PMV, DA300, and ACH/ACR primarily reflect the effects of the retrofit strategy. In addition, the EnergyPlus thermal simulation and the Butterfly/OpenFOAM ventilation simulation were not dynamically coupled, and their results were interpreted as complementary indicators under consistent assumptions. In other words, the focus of this study was not to establish a fully calibrated digital twin, but to compare the indoor environmental performance of the baseline and retrofit models under the same simulation logic and assumptions.
The supplementary field measurements were used as limited field references for interpreting the existing environmental condition of Jingzu Jiashu, rather than as a full calibration dataset. Because the available measurements did not provide paired measured and simulated values for the same space, date, hour, occupancy condition, and window-opening state, quantitative calibration using RMSE or MBE was not conducted. Accordingly, the simulation results are interpreted primarily as comparative before—after performance indicators under consistent assumptions, rather than as fully calibrated predictions of actual operational performance. Future research should include long-term on-site monitoring and paired measured–simulated comparison to strengthen model calibration and validation.

4. Results

4.1. Baseline Environmental Performance Diagnosis

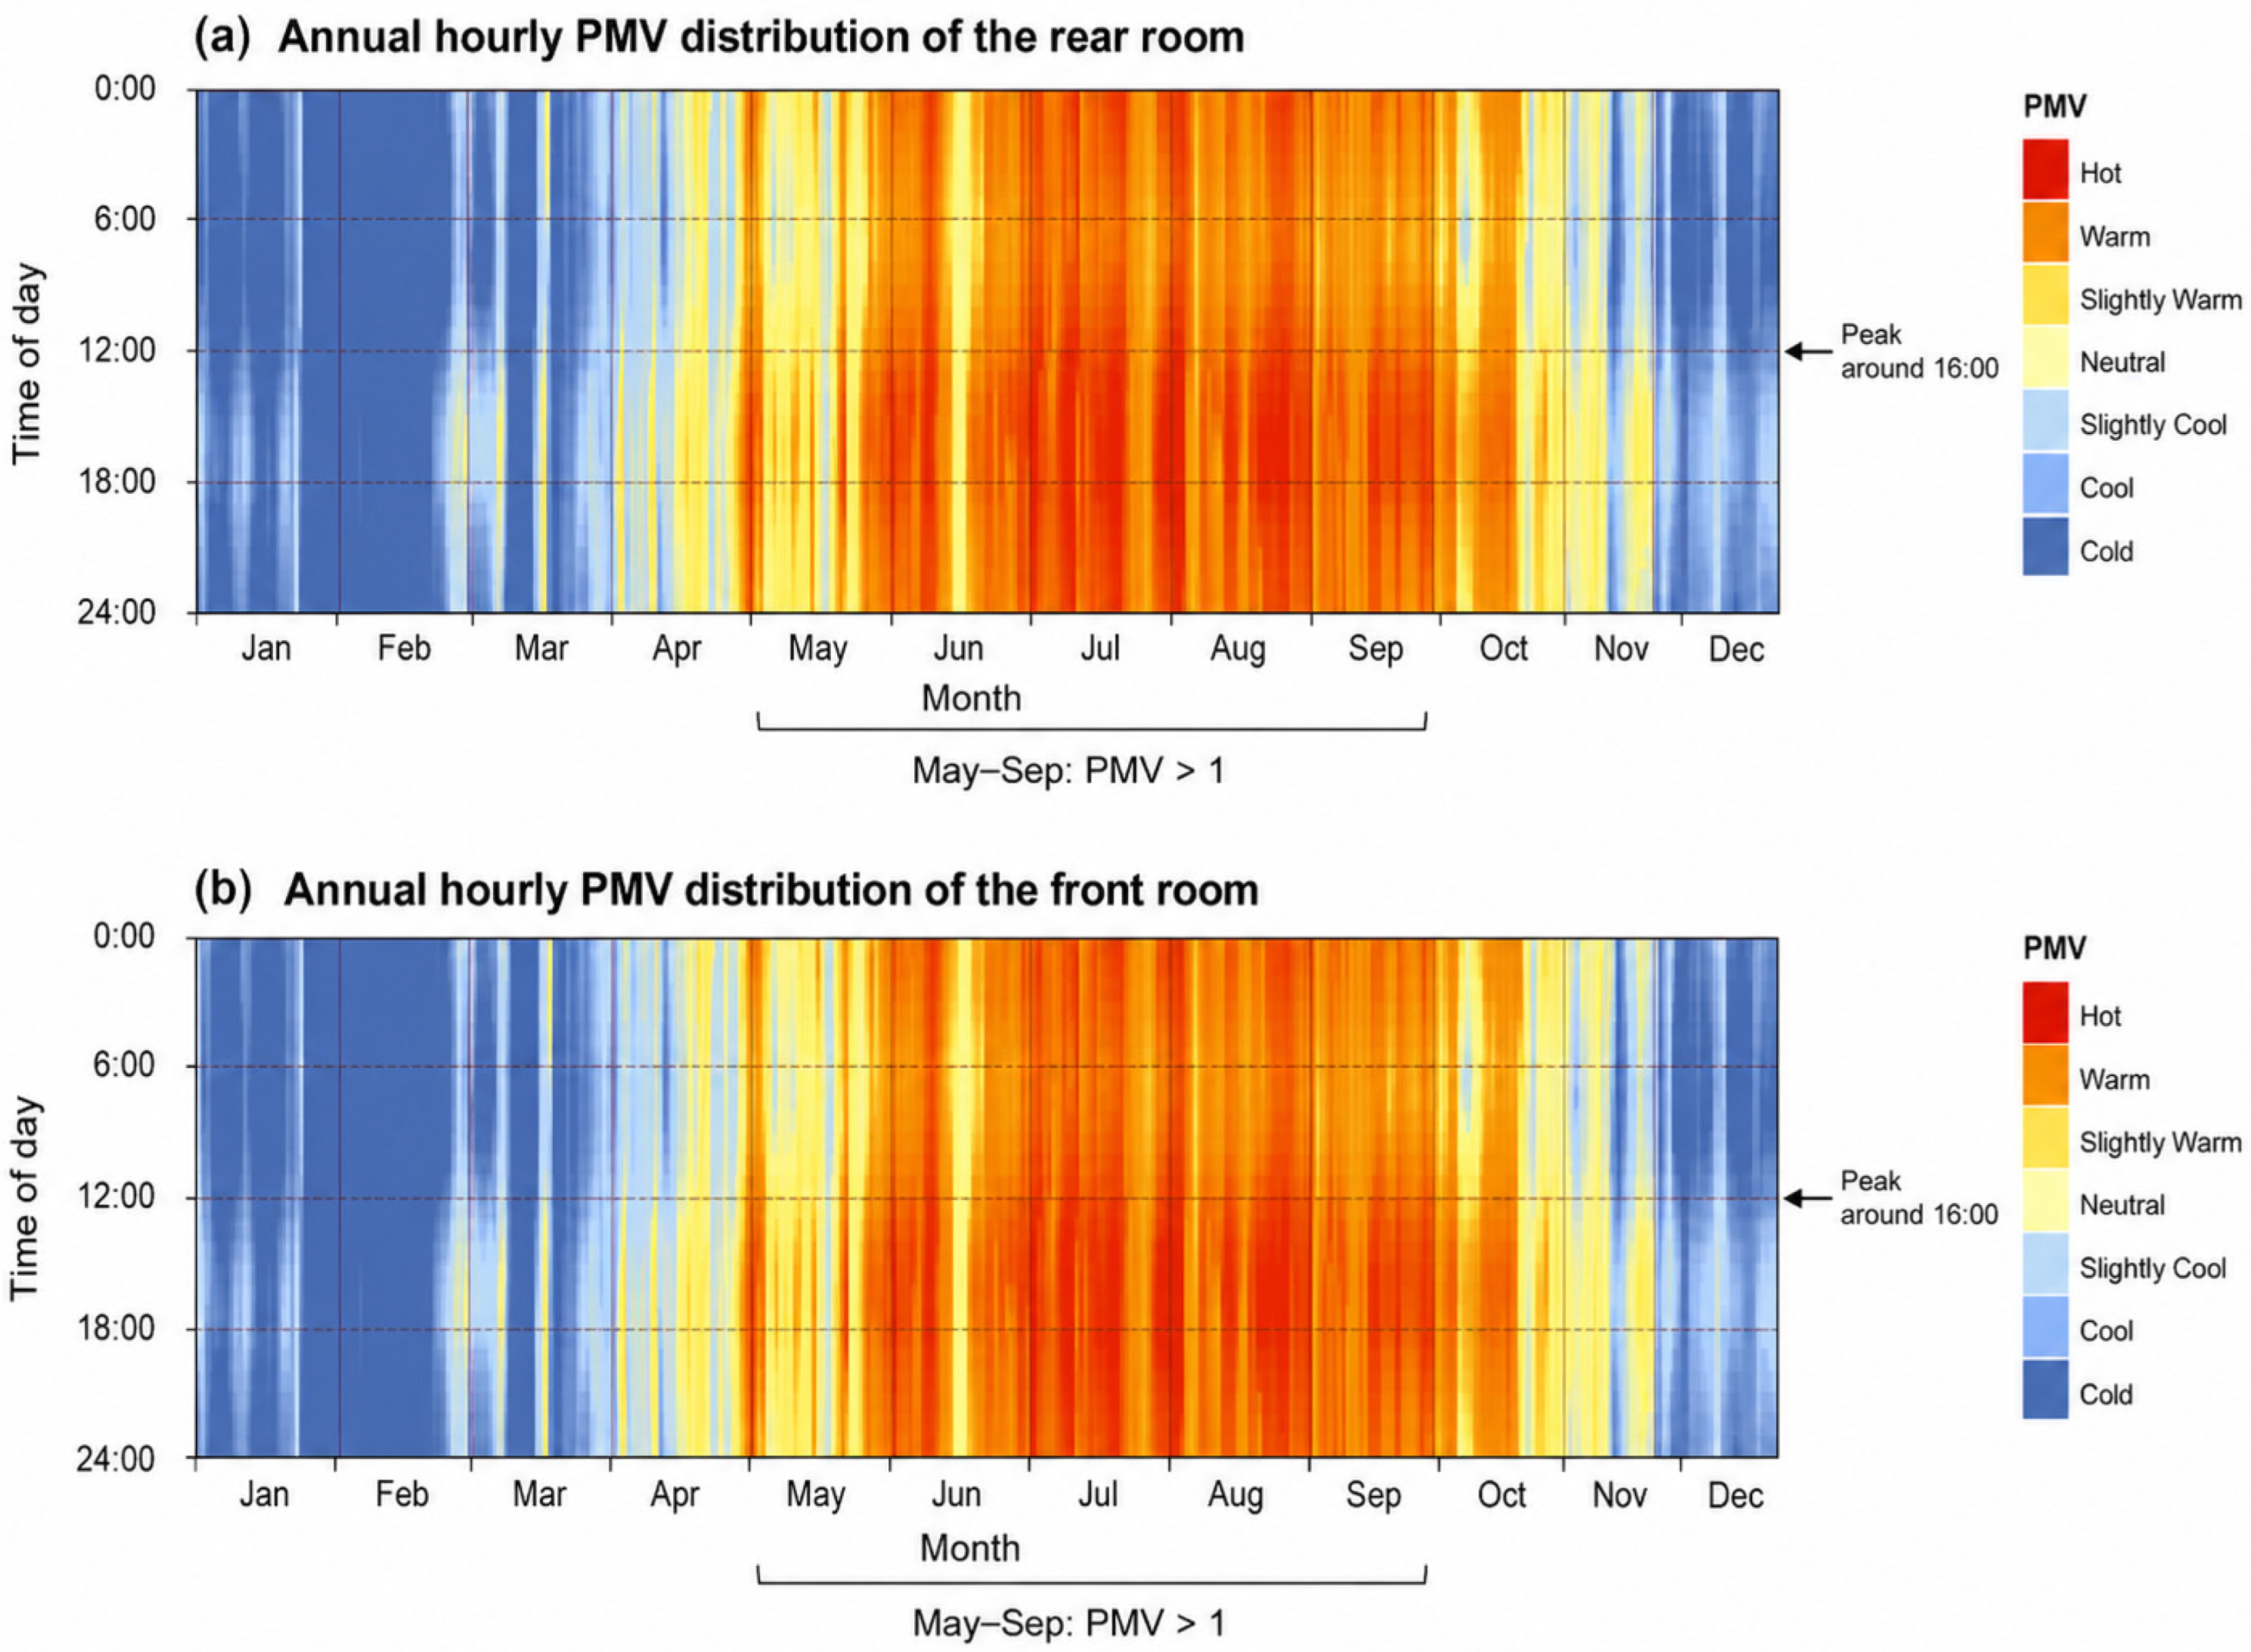
The PMV simulation showed that summer overheating was the dominant thermal comfort problem in Jingzu Jiashu under the baseline condition. As shown in Figure 12, the annual hourly PMV distributions of the representative rear and front rooms indicate that PMV values were generally higher than 1 from May to September, with the most severe overheating occurring from June to September. During summer days, PMV values were relatively lower in the early morning, approximately 2 at 6:00, but gradually increased during the day and reached the highest level around 16:00, often approaching or exceeding 3.5. The summer PMV statistics of representative spaces before retrofit are summarized in Table 6. The comfortable-hour ratio of the main rooms was very low, ranging from 7.29% to 7.92%, while the uncomfortable-hour ratio remained high, ranging from 42.84% to 51.53%. The maximum PMV values of most rooms exceeded 3.5, indicating severe summer overheating. These results suggest that the existing building envelope, limited air movement, and high outdoor heat and humidity together produced prolonged indoor thermal discomfort during the summer period. Table 6 further shows that the rear hall had the highest maximum PMV value of 4.65, while the maximum PMV values of the representative rooms ranged from 3.54 to 3.65.
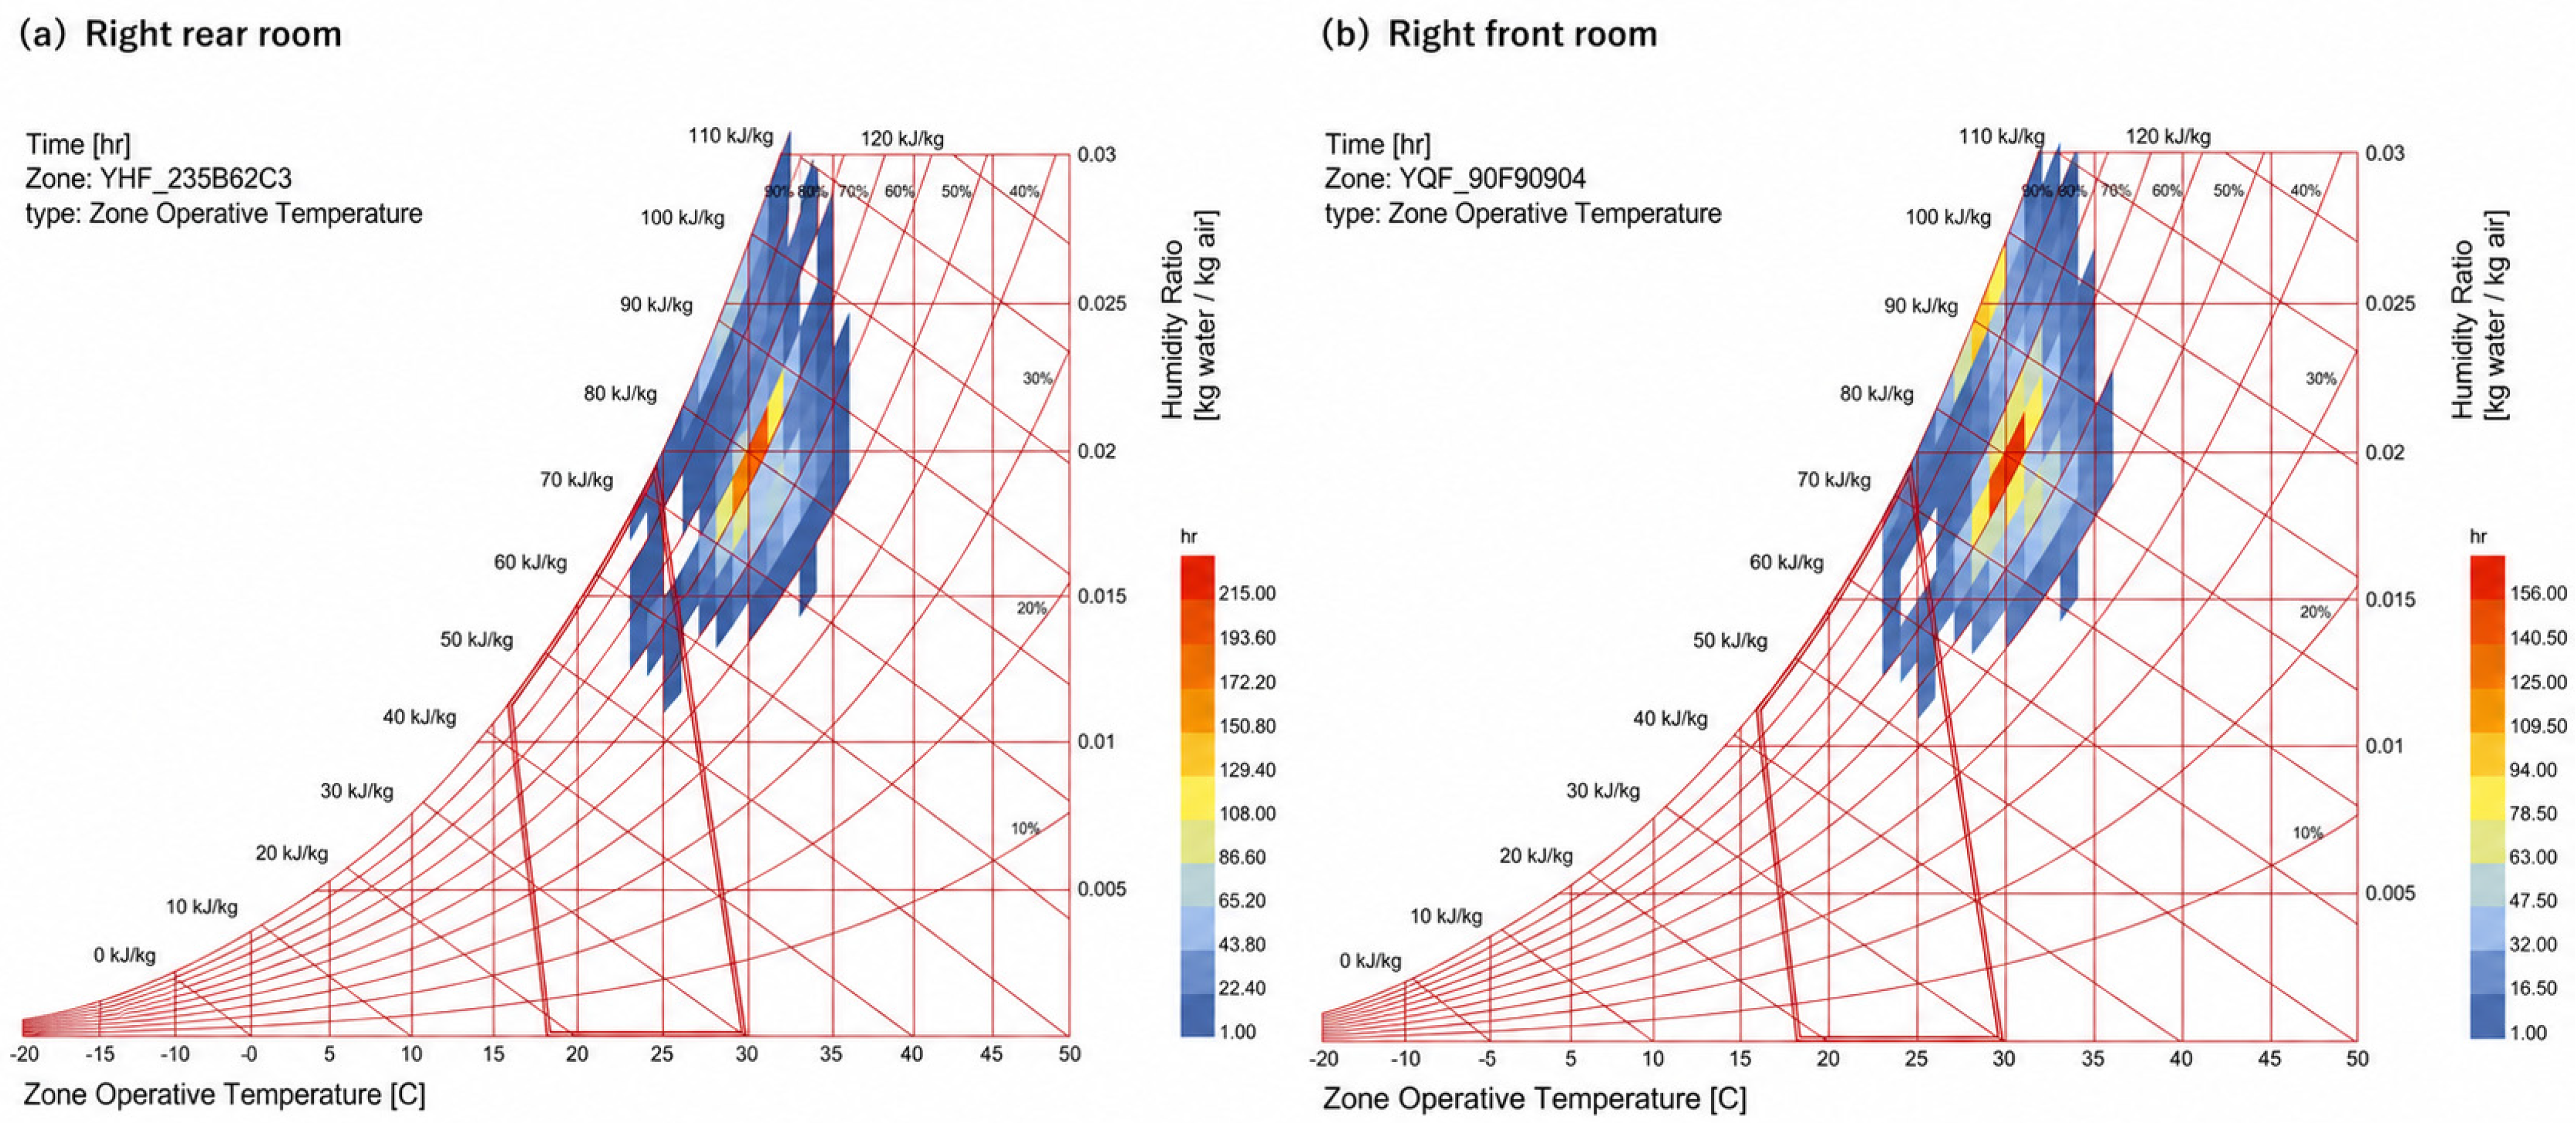
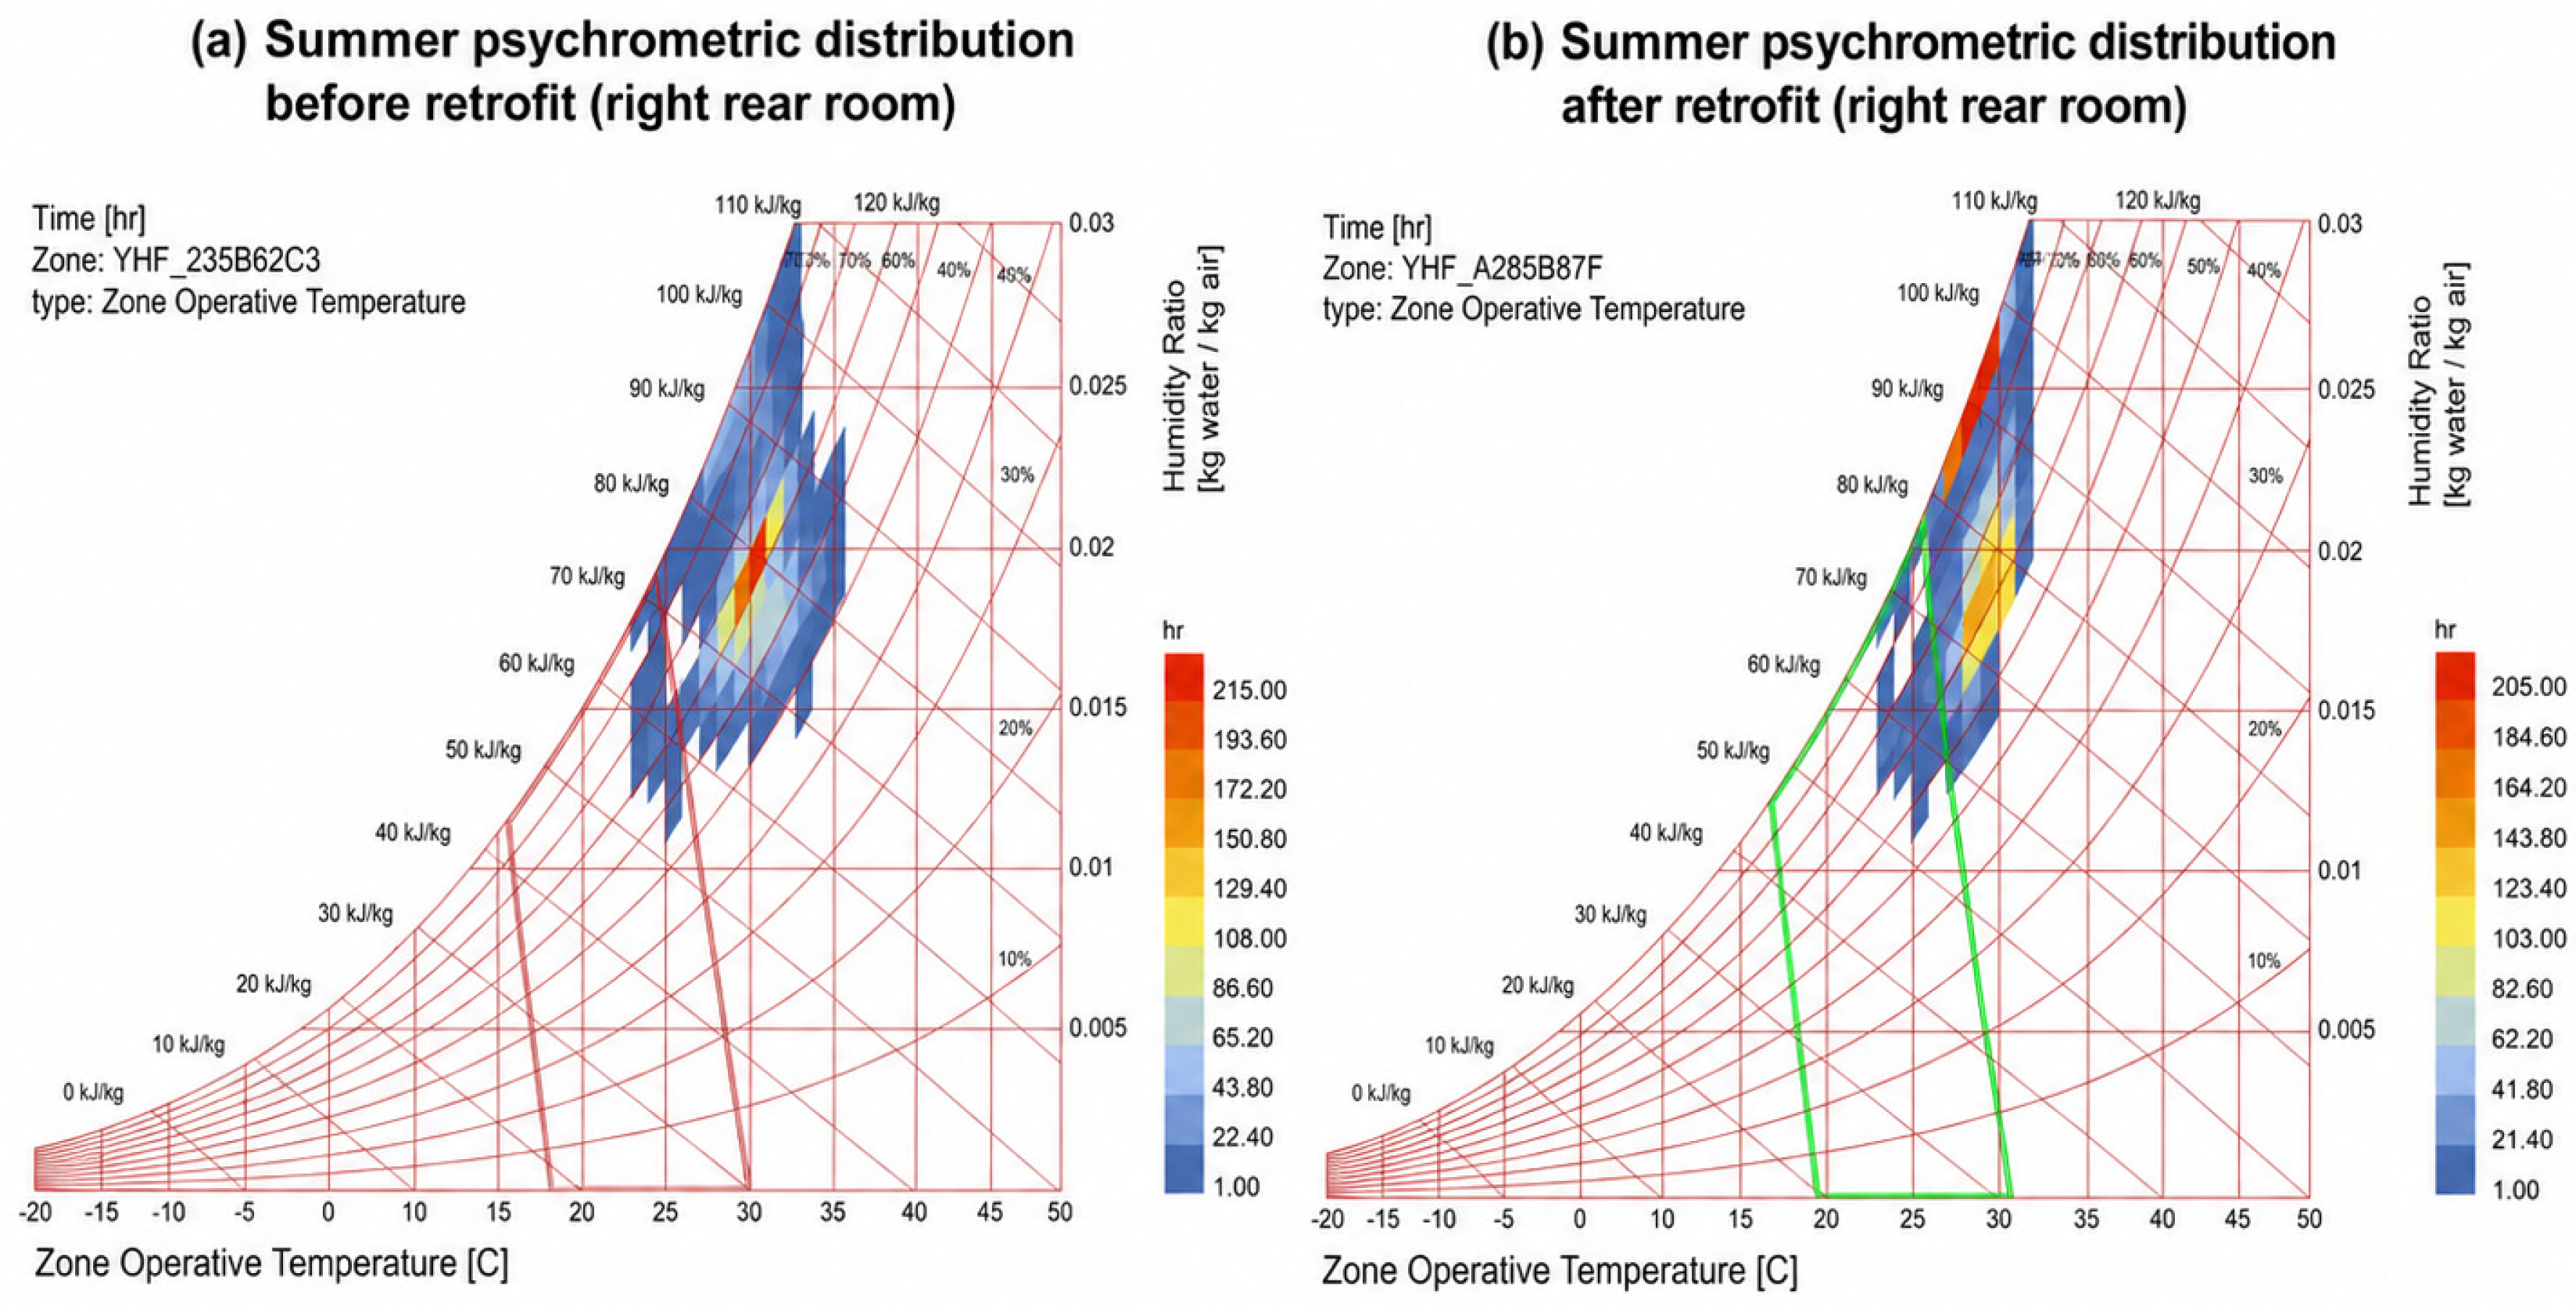
The indoor temperature–humidity distribution further confirmed the overheating and humidity stress. As shown in Figure 13, most summer hours were concentrated within the range of 27–33 °C, and more than half of the hours were above 30 °C. The most frequent condition was approximately 32 °C with relative humidity higher than 70%, while the maximum indoor temperature reached about 37 °C. Relative humidity was generally above 50%, mainly distributed between 60% and 80%, with some periods exceeding 95%. These results further indicate that Jingzu Jiashu experienced combined heat and humidity stress under the baseline condition, and that the traditional thick walls and courtyard spaces were insufficient to maintain a comfortable indoor thermal environment under intensified hot–humid summer conditions.
The daylighting simulation revealed strong spatial differences in the baseline model, as shown in Figure 14. The rear hall showed relatively favorable daylight availability, with the effective daylight area reaching approximately 96%. By contrast, the front and rear rooms performed poorly. Only approximately 40% of the front-room area and 31% of the rear-room area met the effective daylight criterion. The DA distribution indicates that daylight availability was mainly concentrated around the courtyard, corridors, and areas close to openings, while the deeper parts of enclosed rooms showed much lower daylight autonomy. In particular, the rear rooms were more affected by limited opening area, room depth, and north-facing daylight conditions, and the daylight level decreased significantly beyond approximately 2.5 m from the window. These results show that although the hall and courtyard-related spaces retained certain daylight advantages, the enclosed deep rooms could not fully meet contemporary daylighting requirements.
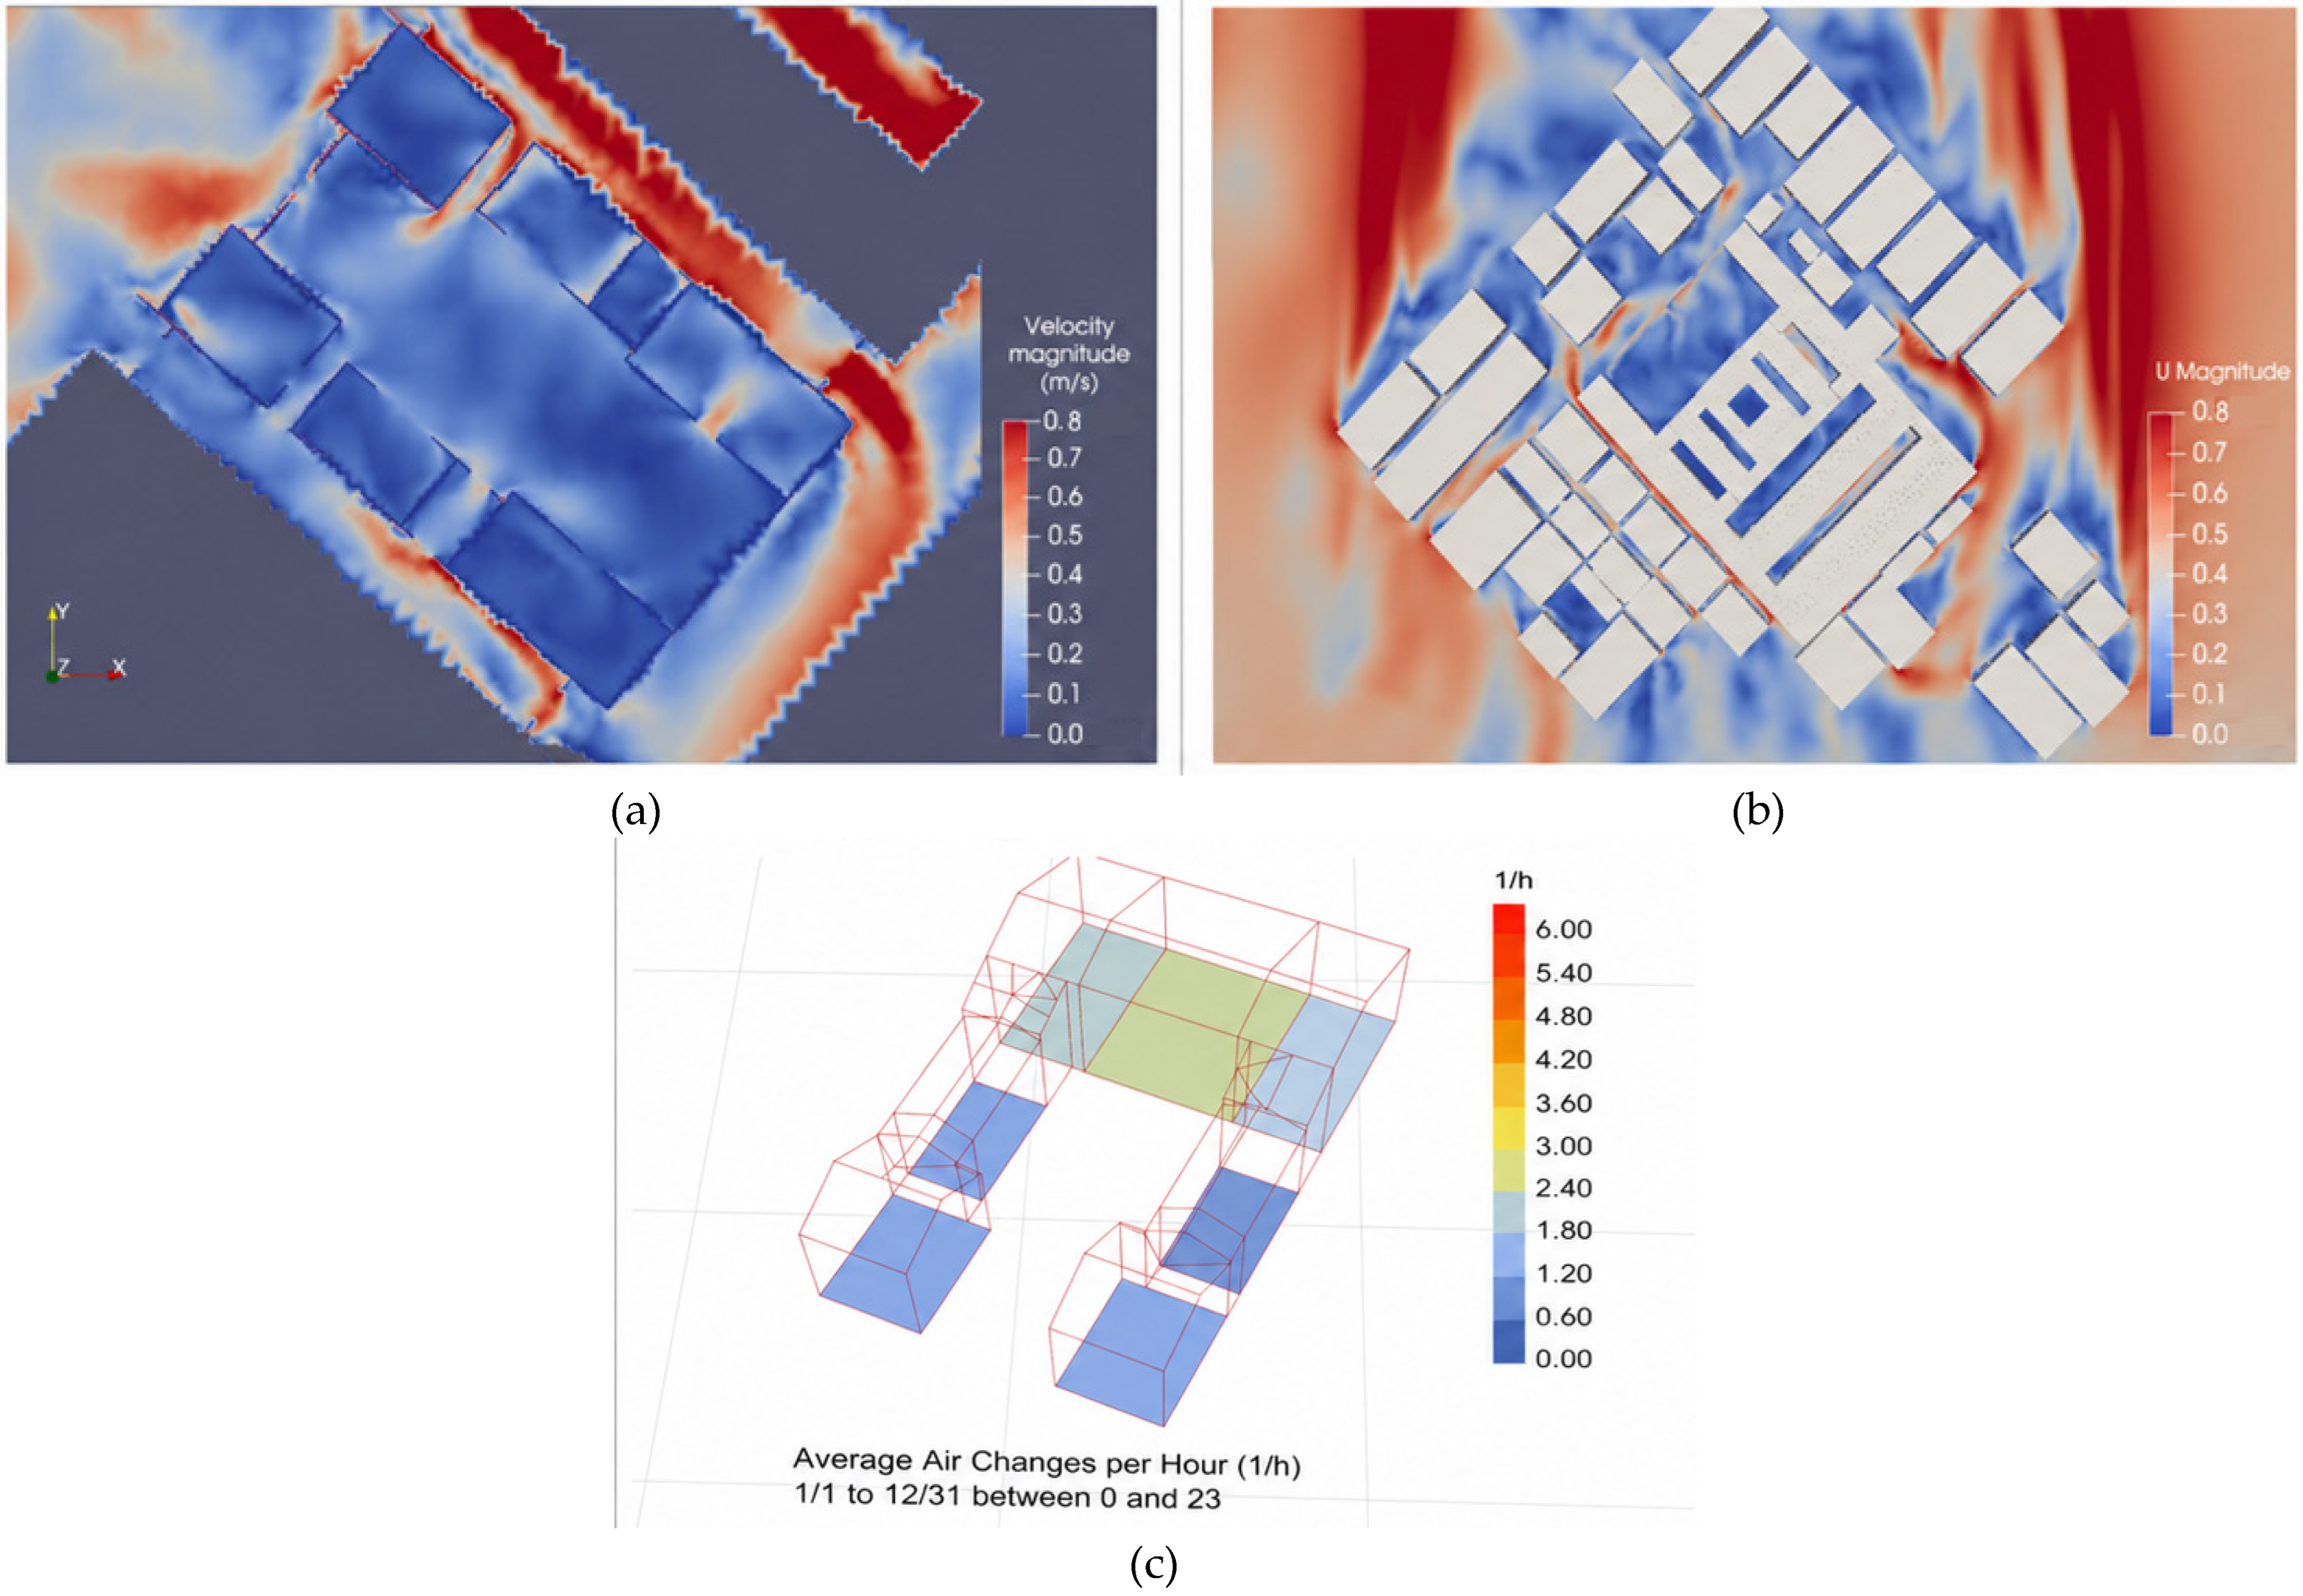
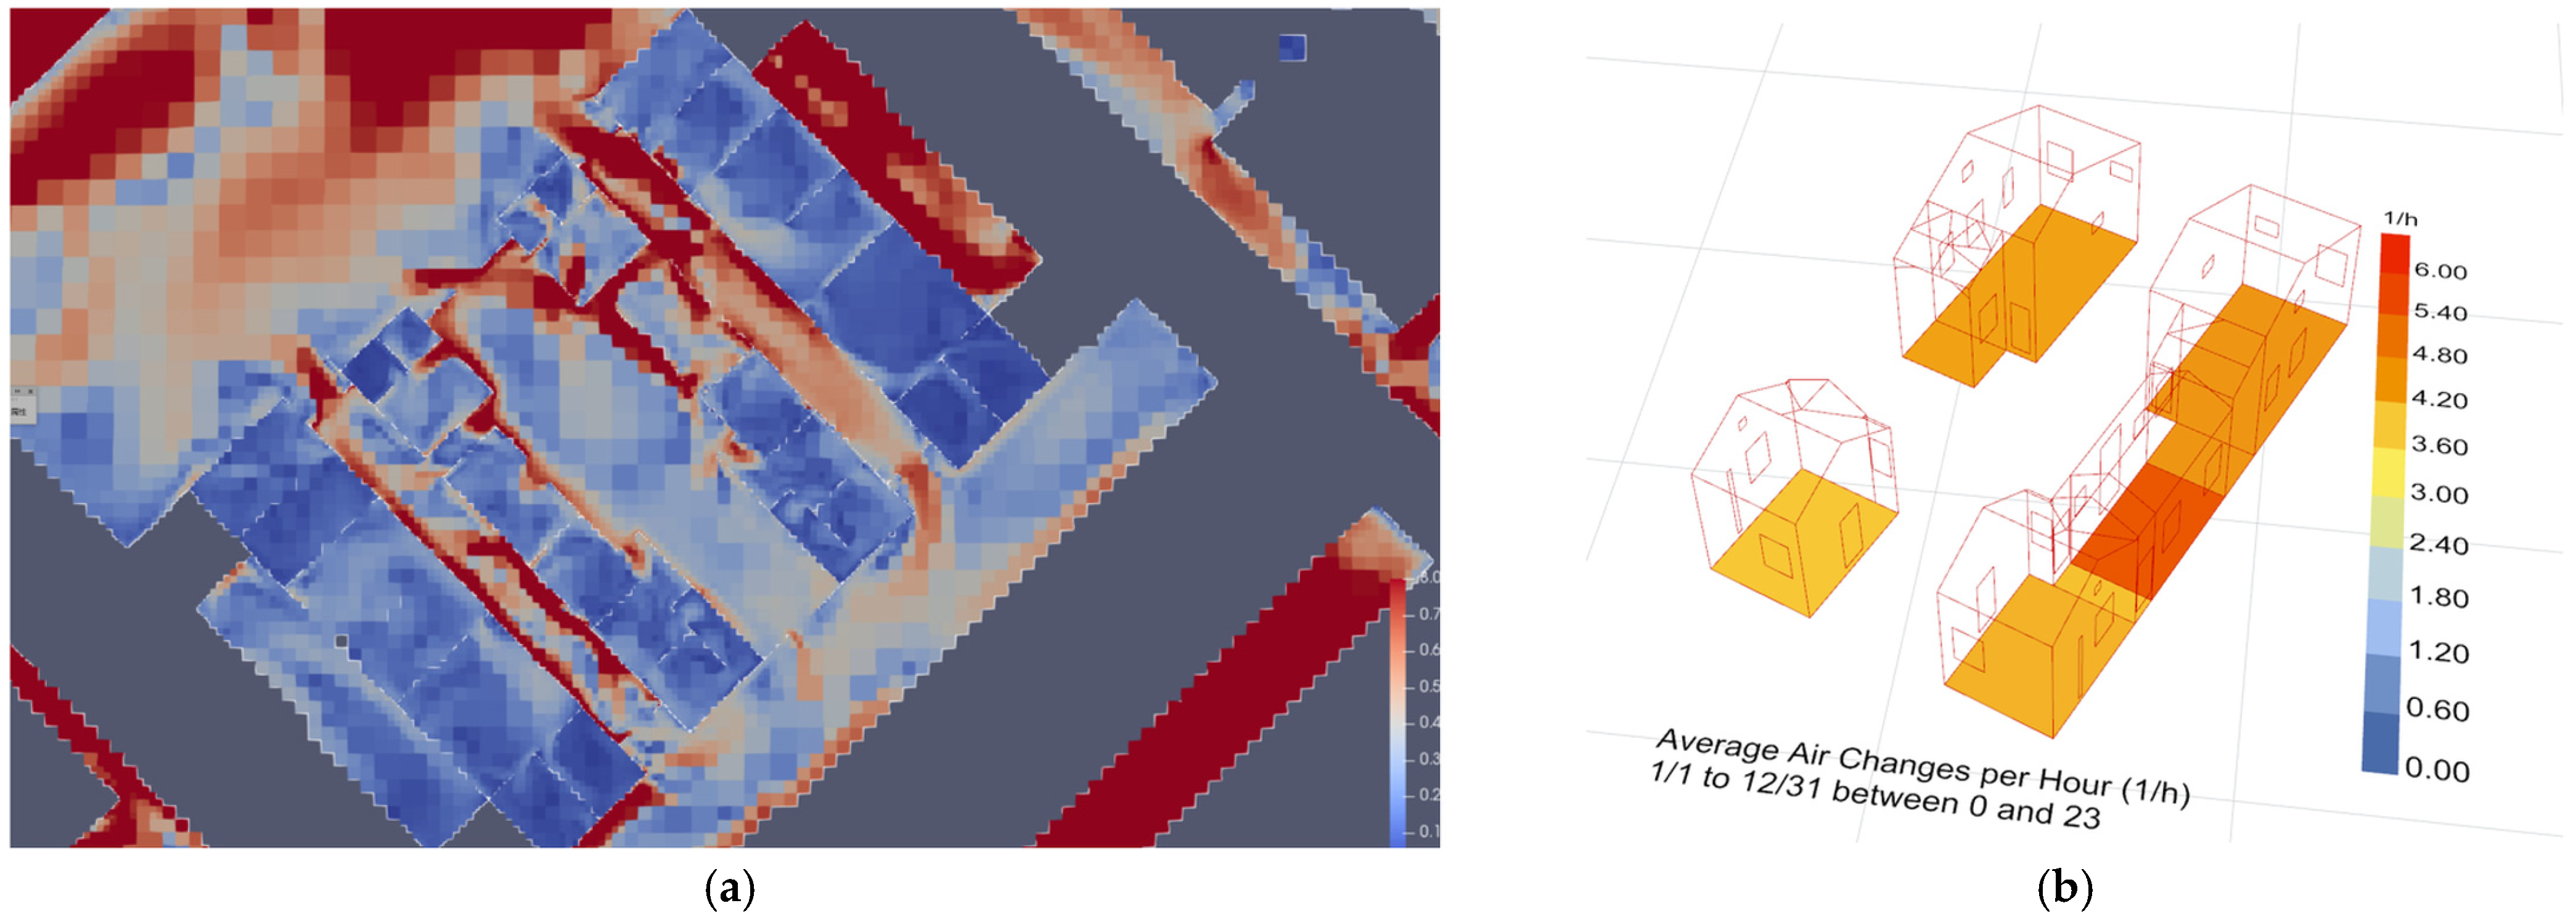
The ventilation simulation showed that the existing opening configuration and spatial enclosure limited air exchange in representative rooms. As shown in Figure 15, the site-scale wind environment indicates that the fire lane and cold lane had relatively higher wind speeds than the surrounding areas, confirming the guiding effect of traditional lane spaces on airflow. The left fire lane reached approximately 0.5 m/s, while the right cold lane reached approximately 0.7 m/s, suggesting spatial differences in wind capture that may be related to wind direction and surrounding obstructions. The indoor airflow distribution further shows that the courtyard and front hall had relatively higher wind speeds than the enclosed interior rooms, probably because the front and rear corridors introduced airflow from the cold lanes. However, several interior rooms had weak airflow, and the right side bay, right rear room, and left front room all showed indoor wind speeds lower than 0.1 m/s, while the left side bay, left rear room, and right front room reached only approximately 0.15–0.3 m/s. The ACH comparison is summarized in Table 7. The simulated air change rates of all representative spaces were lower than the corresponding required ACH values under the assumed occupancy condition. Specifically, the rear hall achieved 2.21 h−1 compared with the required 3.11 h−1; the right and left rear rooms reached 1.89 h−1 and 1.75 h−1, respectively, compared with the required 3.54 h−1; the right and left front rooms reached 1.07 h−1 and 1.14 h−1, respectively, compared with the required 2.64 h−1; and the right and left side bays reached 1.06 h−1 and 1.00 h−1, respectively, compared with the required 3.73 h−1. These results indicate that, although the traditional spatial system can introduce air movement at the settlement and semi-open-space levels, the existing opening configuration prevents sufficient airflow from reaching deeper enclosed rooms. Therefore, ventilation improvement should not simply increase opening size, but should organize coherent airflow paths between exterior spaces, semi-open spaces, and enclosed rooms.

4.2. Integrated Retrofit Scenario

Based on the baseline simulation diagnosis, the retrofit strategy for Jingzu Jiashu was developed as a heritage-sensitive and performance-driven intervention. The proposed approach prioritized the retention of the original spatial structure, façade character, roof form, and traditional material expression, while responding directly to the thermal, daylighting, and ventilation deficiencies identified through PMV, DA300, and ACH/ACR simulations. Instead of treating thermal comfort, daylighting, and natural ventilation as isolated technical problems, the strategy sought to improve them through the coordinated adjustment of functions, openings, envelope performance, ventilation paths, courtyards, corridors, cold lanes, and semi-open transitional spaces.
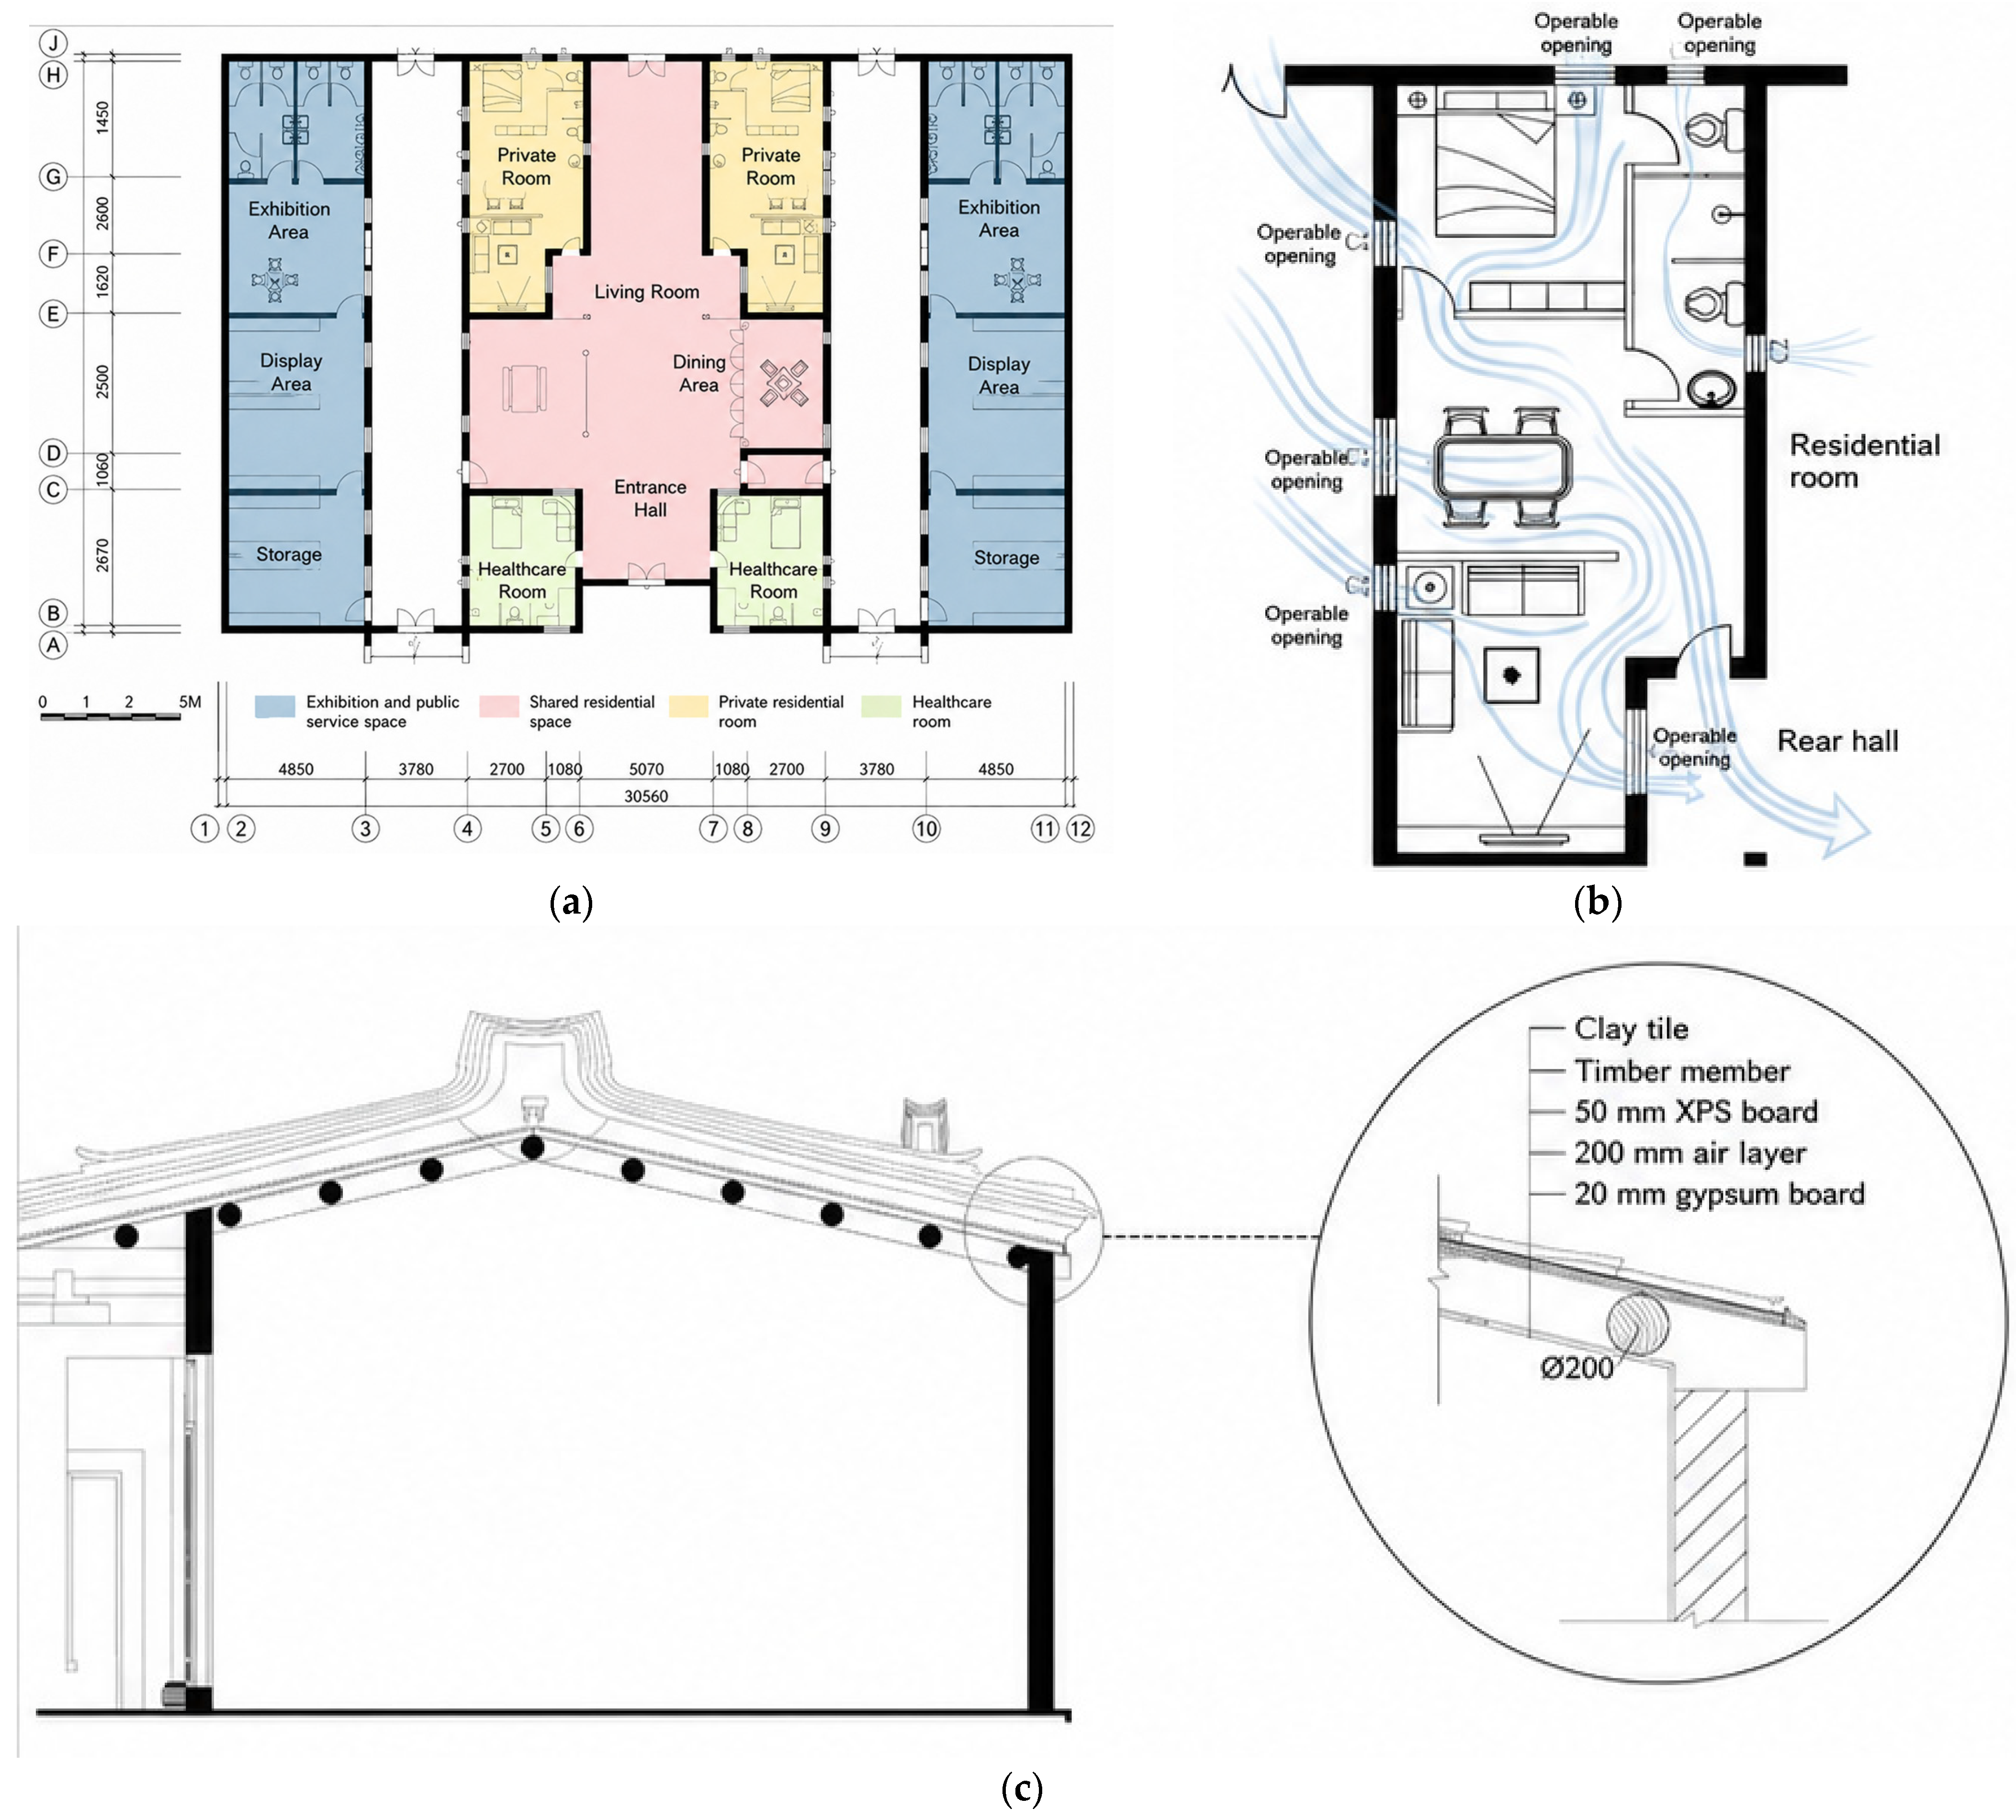
Based on the baseline performance diagnosis, heritage-conservation constraints, and the practical feasibility of intervention, an integrated climate-adaptive retrofit scenario was developed for Jingzu Jiashu, rather than a comparative optimization of multiple independent retrofit schemes. The proposed strategy combined functional reconfiguration, envelope improvement, opening optimization, ventilation-path organization, and courtyard/transitional-space adjustment. As shown in Figure 16, the post-retrofit design reorganized the building into exhibition and public service spaces, shared residential spaces, private residential rooms, and care-support rooms, thereby improving the match between spatial use and environmental suitability. At the room scale, airflow paths were reorganized through opening adjustment and internal ventilation guidance to enhance natural ventilation performance in representative residential units. In addition, the roof assembly was thermally upgraded while maintaining the original roof profile and the architectural character of the historic residence.
To improve the thermal performance of the envelope, the retrofit model adopted moderate internal and layered construction measures. For the roof, the retrofitted assembly consisted of 50 mm clay tiles, 100 mm timber members, 50 mm XPS board, a 200 mm air layer, and 20 mm gypsum board. The corresponding thermal resistance values of the main solid layers were 0.68, 0.71, 1.67, and 0.61 m2·K/W, respectively, while the thermal inertia indices were 0.42, 2.73, 0.90, and 3.22. For the external wall, an interior insulation strategy was adopted to avoid altering the historic façade. The wall assembly included the existing 0.27 m rammed-earth wall, a 0.02 m cement mortar layer, a 0.05 m EPS insulation board, and a 0.02 m gypsum board. Their thermal resistance values were 0.551, 0.02, 1.22, and 0.06 m2·K/W, respectively, with corresponding thermal inertia indices of 4.444, 0.25, 0.44, and 0.32. These envelope parameters were incorporated into the post-retrofit simulation model to evaluate the improvement of indoor thermal performance. The use of interior EPS insulation involves a trade-off between improving thermal resistance and maintaining the effective thermal buffering capacity of the original rammed-earth wall. Although the insulation layer can reduce conductive heat gain, it may partially decouple the indoor environment from the high thermal inertia of the massive wall, thereby weakening the wall’s ability to absorb, store, and release heat in response to daily temperature fluctuations. Therefore, the proposed interior insulation should be understood as a moderate and heritage-sensitive intervention, intended to improve envelope performance while avoiding alteration of the historic façade.
All retrofit components were finally integrated into one post-retrofit model. The baseline and post-retrofit models were compared under the same geometric, material, climatic, and simulation assumptions, so that the improvement effects could be attributed to the retrofit interventions rather than to changes in simulation settings [16,19]. The components of the integrated retrofit scenario and their corresponding performance objectives are summarized in Table 8.

4.3. Post-Retrofit Simulation Verification

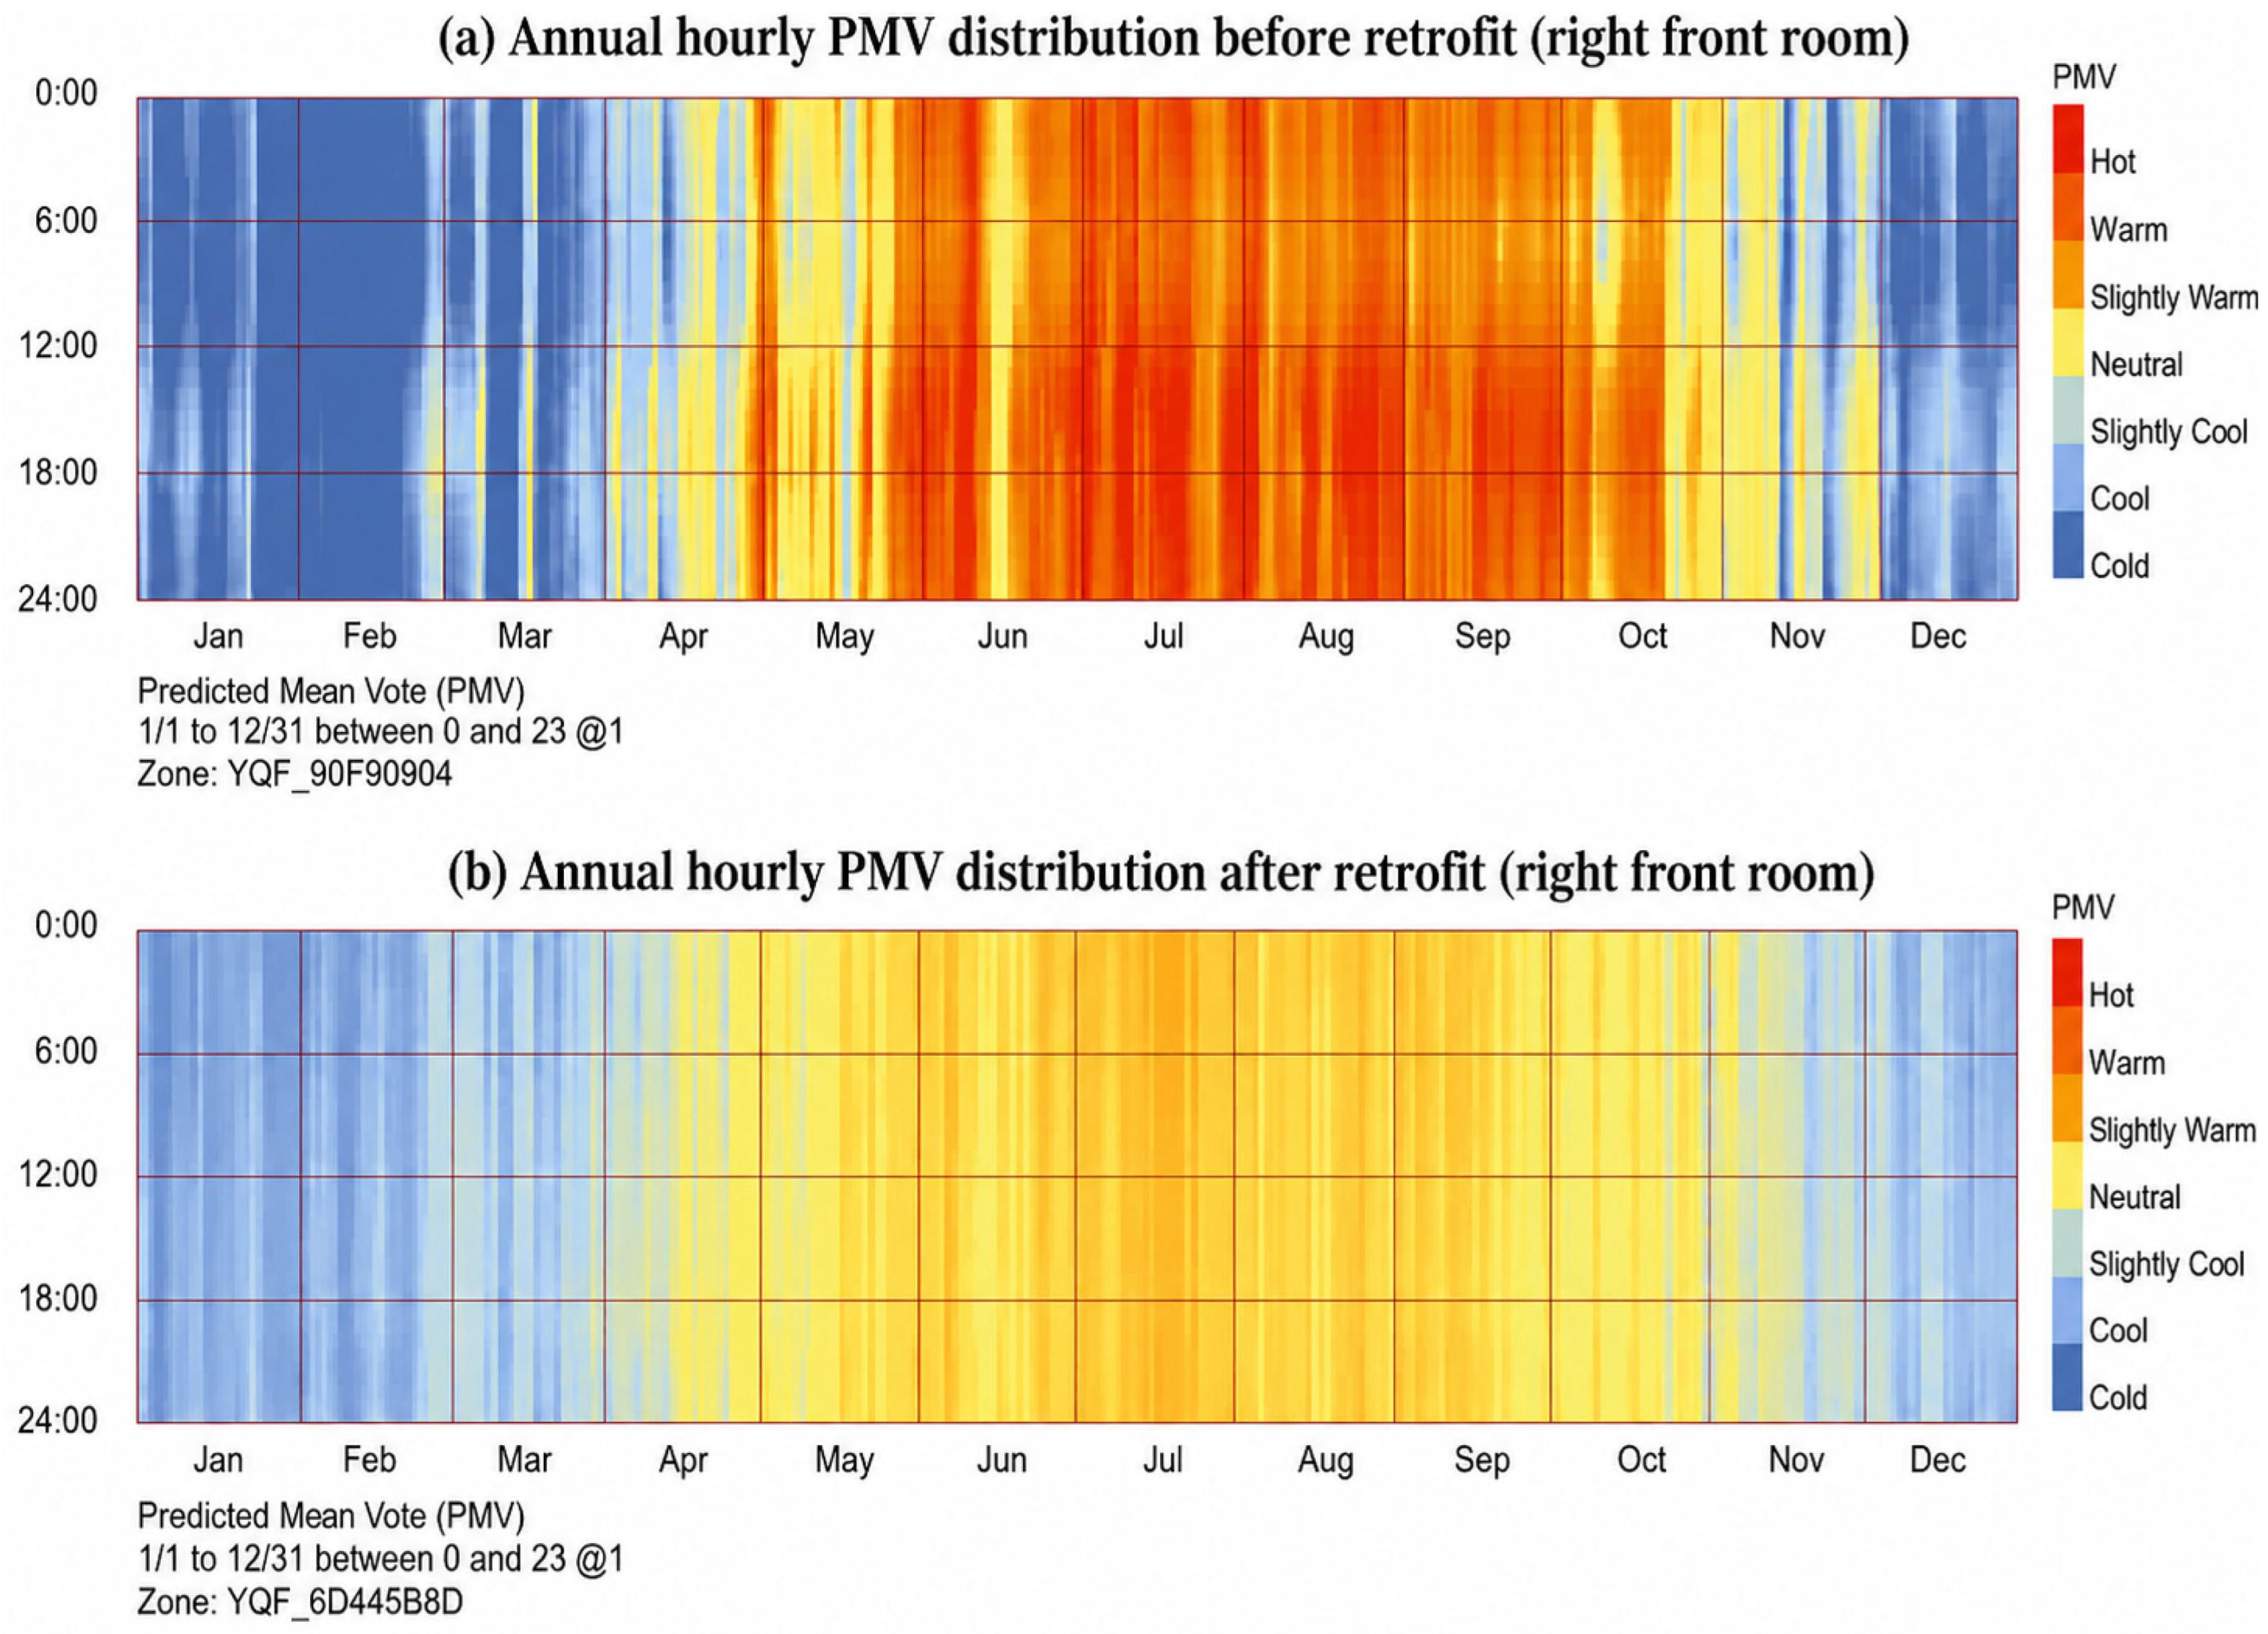
Thermal comfort improved after retrofit. The annual hourly PMV comparison of the representative right front room is shown in Figure 17. Before retrofit, high PMV values were concentrated from late spring to early autumn, especially from June to September. During summer afternoons, particularly between 12:00 and 18:00, the PMV values were frequently above 3, indicating strong or severe overheating. After retrofit, the high-PMV zones were visibly reduced, and many summer periods shifted from the hot range to the warm or slightly warm range. This indicates that the integrated retrofit strategy effectively reduced overheating intensity during the most critical summer periods.
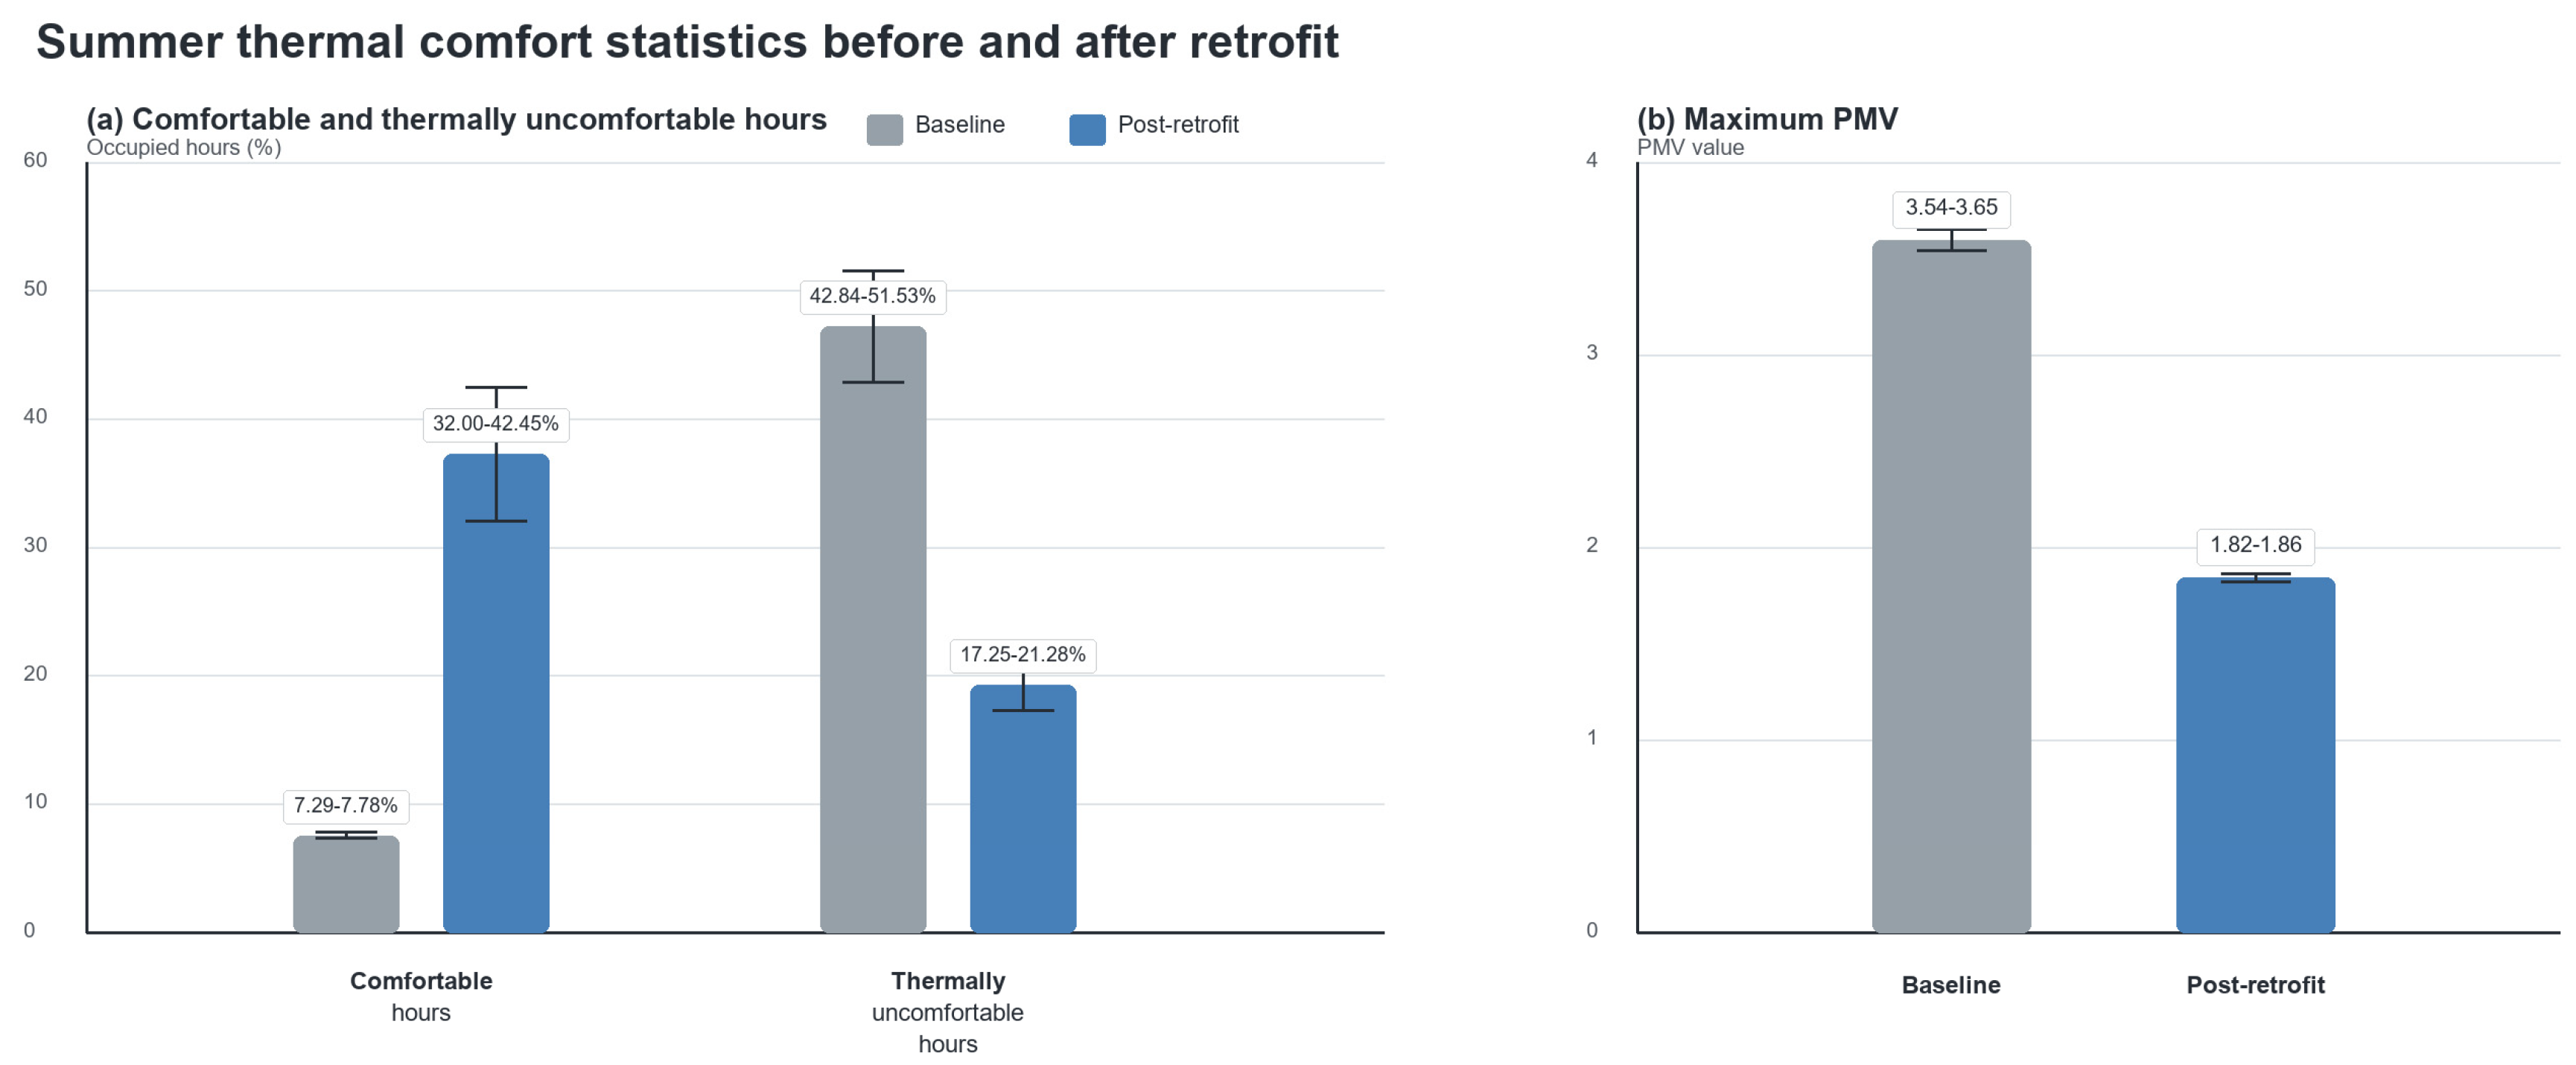
The statistical comparison further confirms the improvement in thermal comfort, as shown in Figure 18. The comfortable-hour ratio increased from approximately 7.29–7.78% before retrofit to 32.00–42.45% after retrofit, representing an average increase of about 29.7 percentage points. Meanwhile, the thermally uncomfortable-hour ratio decreased from 42.84 to 51.53% before retrofit to 17.25–21.28% after retrofit, with an average reduction of approximately 27.9 percentage points. For the representative rooms, the maximum PMV values also decreased from 3.54 to 3.65 to 1.82–1.86. These results indicate that the retrofit strategy significantly improved the thermal environment and reduced summer overheating intensity.
The psychrometric comparison further illustrates the improvement in indoor thermal-humidity conditions. As shown in Figure 19, before retrofit, most summer hours were concentrated within the range of 27–33 °C, and more than half of the hours exceeded 30 °C. The most frequent condition was approximately 32 °C with relative humidity higher than 70%, while the maximum indoor temperature reached about 37 °C. After retrofit, most summer hours shifted to the range of 27–30 °C, and the proportion of hours above 30 °C decreased to less than 25%. The maximum indoor temperature decreased to approximately 33 °C, with an average temperature reduction of about 3.7 °C. These results show that the retrofit strategy reduced both overheating intensity and heat-humidity stress in the representative room.
Overall, the post-retrofit thermal simulation results indicate that the combined effects of envelope improvement, opening optimization, ventilation-path organization, and functional reconfiguration effectively reduced summer overheating. However, because Jingzu Jiashu is located in a hot–humid coastal region and the retrofit intervention was constrained by heritage conservation requirements, the improved indoor environment should be understood as a significant mitigation of heat stress rather than the complete elimination of summer thermal discomfort.
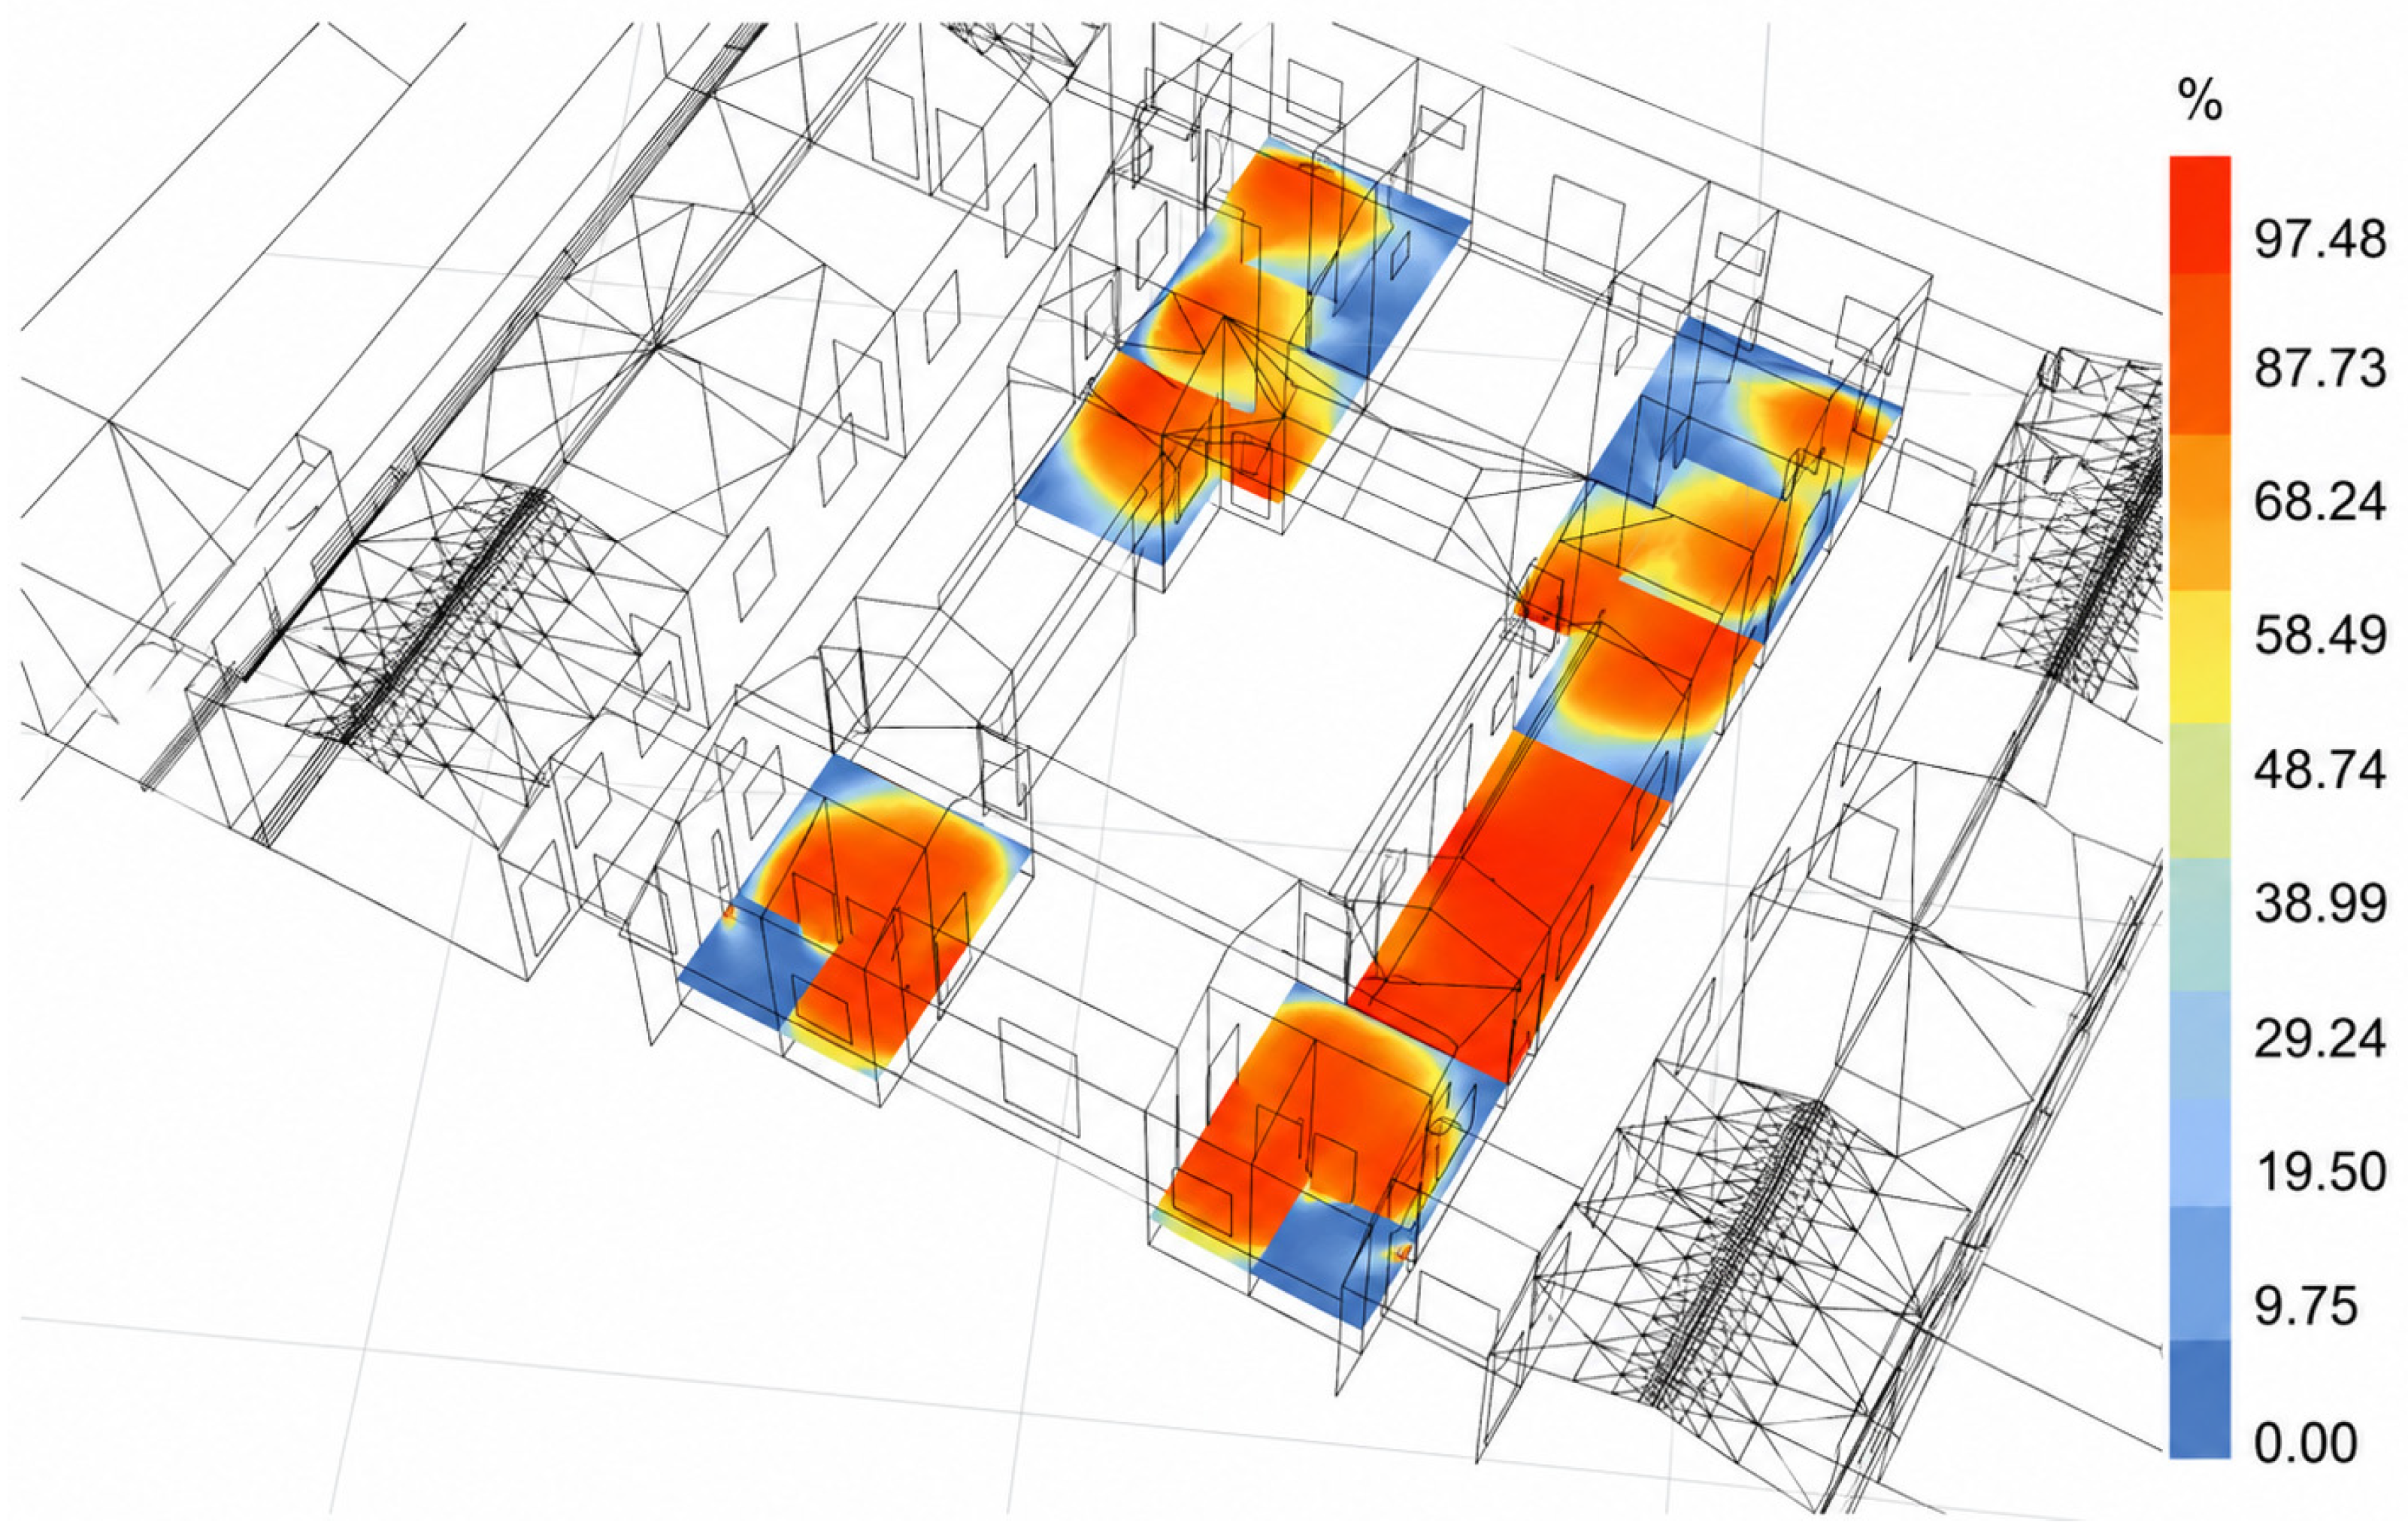
Daylighting performance also improved substantially in the post-retrofit model. In the baseline condition, the effective daylight areas of the front and rear rooms were only approximately 40% and 31%, respectively. After retrofit, the effective daylight area increased to approximately 81% in the front rooms and 74% in the rear rooms, indicating a clear expansion of usable daylight zones in the main occupied spaces. The post-retrofit DA300 distribution is shown in Figure 20.
The DA300 distribution indicates that the main activity areas of the front rooms achieved improved daylight availability. Compared with the baseline condition, the effective daylight area of the front rooms increased by approximately 41 percentage points. In the rear rooms, the main occupied zones also showed improved daylight performance, with the effective daylight area increasing by approximately 43 percentage points. These results suggest that opening optimization, courtyard-related daylight guidance, and functional reconfiguration enhanced daylight penetration into deeper interior spaces. The daylighting improvement also supports the adaptive reuse strategy of the building. Spaces with better daylight availability can accommodate longer-duration residential, exhibition, or shared activities, while areas with relatively weaker daylight can be assigned to auxiliary or short-stay functions. This indicates that daylighting optimization in historic dwellings does not necessarily require large-scale façade alteration; instead, moderate opening adjustment and spatial reorganization can improve indoor environmental quality while maintaining the historic character of the building.
Natural ventilation performance was improved through the integrated adjustment of openings, airflow paths, and semi-open spaces. As shown in Figure 21, the post-retrofit wind-speed distribution indicates that airflow delivery to the enclosed rooms was strengthened. The right rear room generally reached approximately 0.2 m/s, while the front rooms reached approximately 0.3 m/s. Compared with the baseline condition, the average indoor wind speed increased by approximately 0.18 m/s, indicating that the post-retrofit spatial and opening configuration improved airflow delivery to rooms that were poorly ventilated before retrofit.
The ACH comparison is summarized in Table 9. The simulated ACH values increased from 1.89 to 4.49 h−1 in the right rear room, from 1.75 to 4.24 h−1 in the left rear room, from 1.07 to 3.63 h−1 in the right front room, from 1.14 to 3.09 h−1 in the left front room, and from 1.06 to 2.97 h−1 in the right side bay. These values generally reached or approached the corresponding required air change rates under the assumed occupancy condition, while most main rooms exceeded the required values. The results indicate that ventilation improvement was not achieved by simply increasing opening size, but by organizing coherent airflow paths between exterior spaces, semi-open spaces, and enclosed rooms.

4.4. Overall Performance Comparison

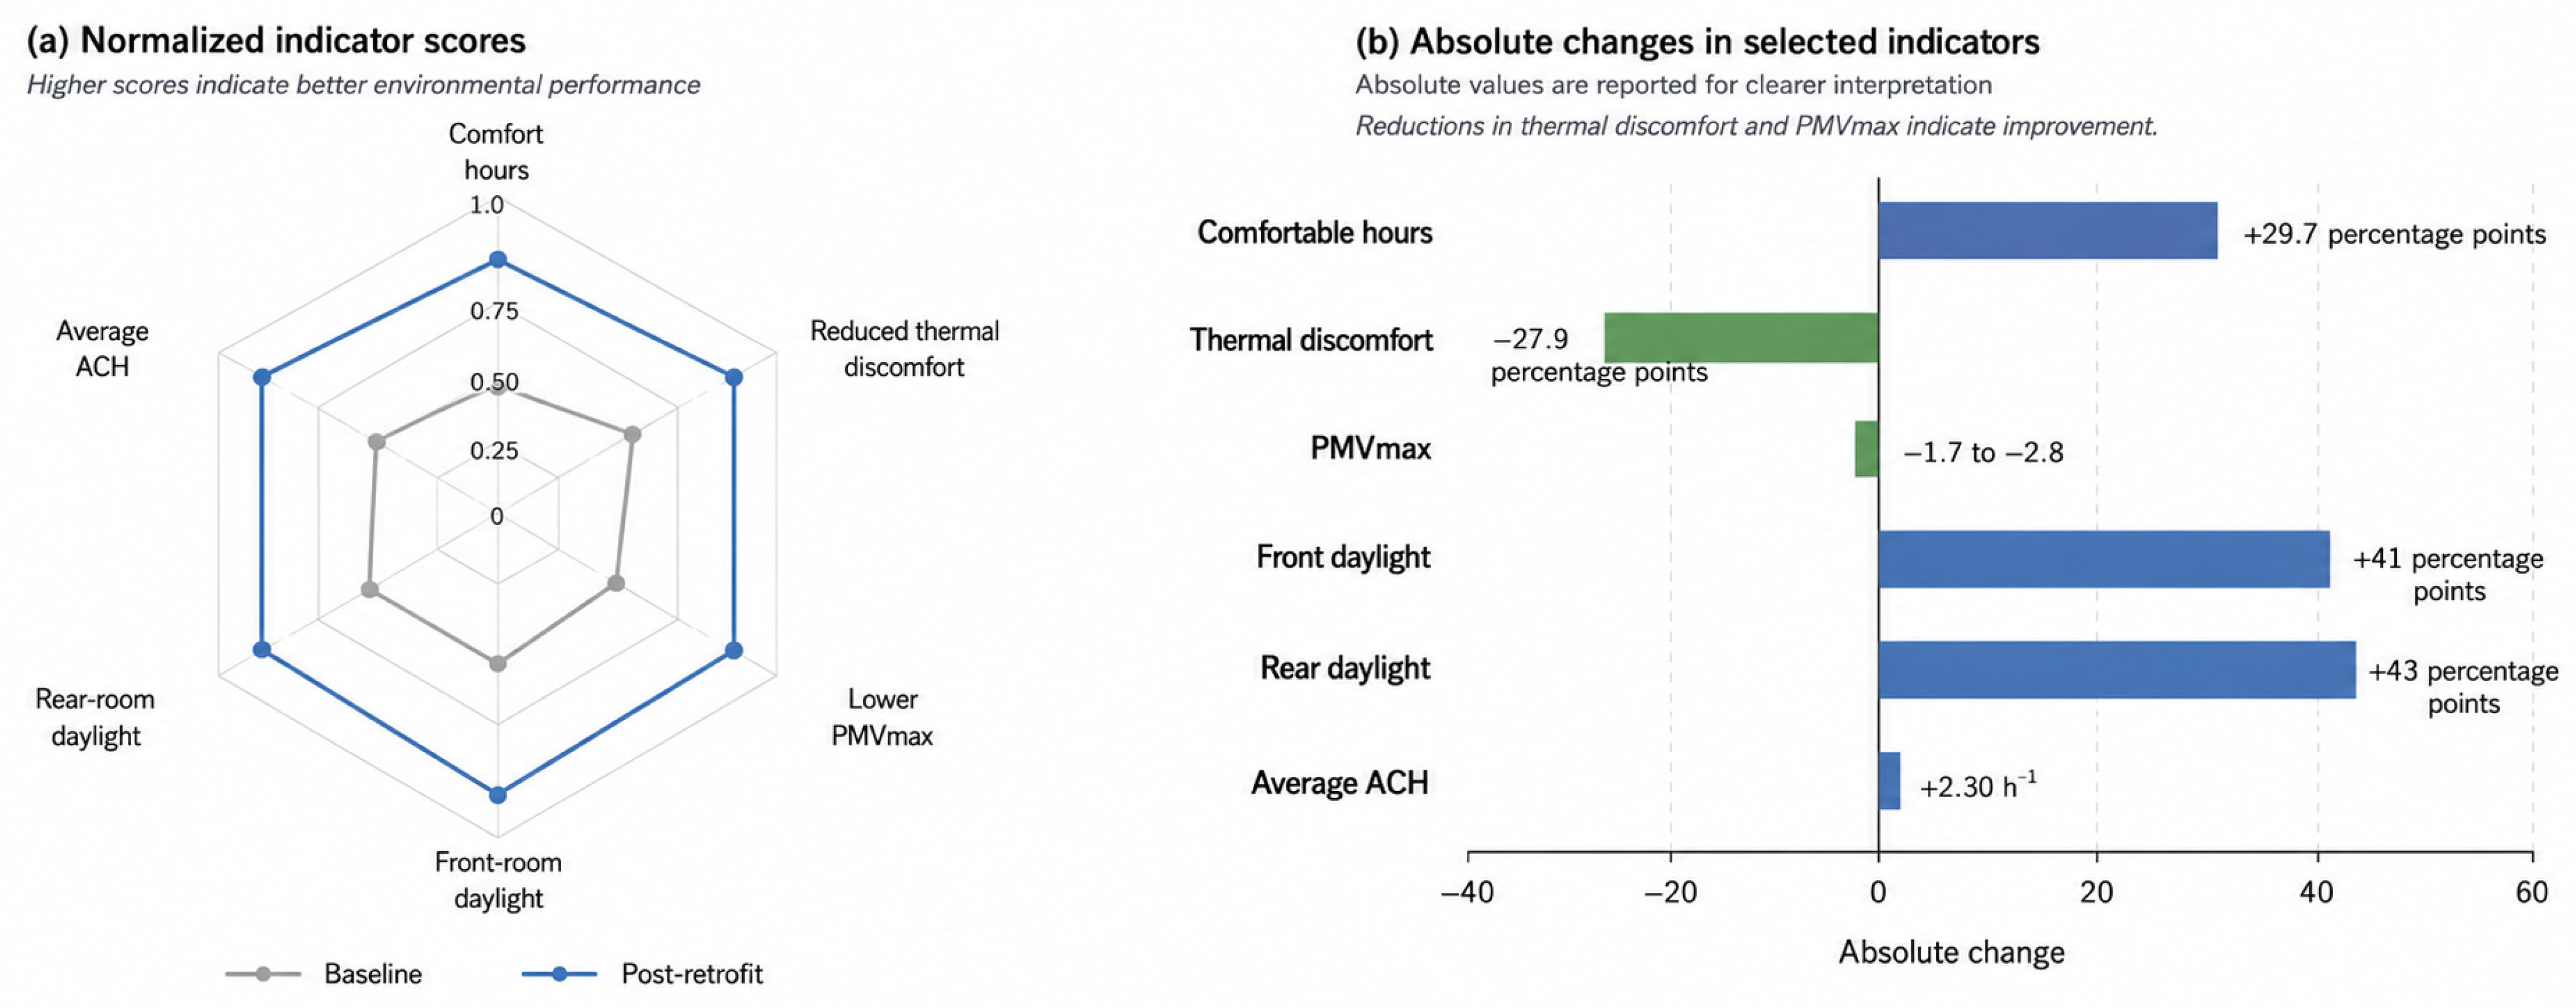
Overall, the integrated retrofit scenario improved the environmental performance of Jingzu Jiashu in a multi-dimensional way. To provide a more intuitive summary of the retrofit effectiveness, the main indoor environmental indicators were further compared using a normalized radar chart and an absolute-change chart, as shown in Figure 22. Thermal discomfort was reduced, daylight availability in deep rooms was substantially increased, and air exchange capacity in the representative rooms was clearly improved. These results demonstrate that the retrofit strategy did not rely on a single intervention, but on the combined effects of envelope improvement, opening optimization, ventilation-path organization, courtyard and transitional-space adjustment, and functional reconfiguration.
As shown in Figure 22a, the post-retrofit condition outperformed the baseline condition across all normalized performance indicators. For the radar chart, all indicators were normalized to a 0–1 scale, with higher scores representing better environmental performance. To make the indicators comparable, thermal discomfort and PMVmax were converted into positive-oriented indicators, namely reduced thermal discomfort and lower PMVmax. The radar chart shows that the most evident improvements occurred in daylighting and ventilation, while thermal comfort also improved noticeably. This pattern indicates that the retrofit strategy was particularly effective in improving environmental quality related to daylight penetration, airflow organization, and spatial-use adjustment, although the improvement of thermal comfort remained constrained by the hot–humid coastal climate and the conservation requirements of the historic building fabric.
Figure 22b further summarizes the absolute changes in selected indicators. The comfortable-hour ratio increased from 7.29 to 7.78% under the baseline condition to 32.00–42.45% after retrofit, corresponding to an average increase of about 29.7 percentage points. Thermally uncomfortable hours decreased from 42.84 to 51.53% to 17.25–21.28%, corresponding to an average reduction of about 27.9 percentage points. The maximum PMV value, including the rear hall, decreased from 3.54 to 4.65 under the baseline condition to 1.82–1.86 after retrofit, representing an absolute reduction of approximately 1.7–2.8 in PMV value. In terms of daylighting, the effective daylight area increased from approximately 40% to 81% in the front rooms and from approximately 31% to 74% in the rear rooms, corresponding to absolute increases of about 41 and 43 percentage points, respectively. For natural ventilation, the average ACH of the five representative rooms increased from 1.38 h−1 under the baseline condition to 3.68 h−1 after retrofit, corresponding to an absolute increase of 2.30 h−1. These absolute changes provide a clearer basis for interpreting the practical significance of the retrofit effects and avoid overstating improvements that originate from low baseline values.
The comparison of baseline and post-retrofit indoor environmental performance indicators is summarized in Table 10. Compared with the original detailed room-by-room results, this summary table emphasizes the main performance changes across thermal comfort, thermal environment, daylighting, and ventilation. Detailed room-level ventilation results are presented in Table 7 and Table 9 and Figure 15 and Figure 21.
The values summarized in Table 10 were derived from the room-level simulation results and figure/table-based results reported in the preceding sections. Specifically, the baseline thermal comfort indicators were derived from Table 6, the baseline ventilation indicators from Table 7 and Figure 15, the post-retrofit thermal comparison from Figure 18, the indoor temperature comparison from Figure 19, the daylighting indicators from Figure 14 and Figure 20, and the post-retrofit ventilation indicators from Figure 21 and Table 9.

5. Discussion

5.1. Building Performance Simulation as a Basis for Heritage-Sensitive Retrofit

The results demonstrate that building performance simulation can provide a quantitative basis for the climate-adaptive retrofit of historic residential heritage. In Jingzu Jiashu, the baseline simulation identified summer overheating, insufficient daylight in deep rooms, and weak natural ventilation in several enclosed spaces as the main environmental problems. These deficiencies were produced by the combined effects of the hot–humid climate, solar heat gain, limited openings, deep room layout, and discontinuous airflow paths, rather than by a single design factor. Compared with previous BPS studies, which often focus on thermal comfort, daylighting, or airflow separately, this study integrates PMV, DA300, and ACH/ACR within one baseline diagnosis and post-retrofit verification workflow [16,17,18,19,20,21,22]. For example, Reinhart and Walkenhorst demonstrated the reliability of Radiance-based daylight simulation through measured–simulated comparison [33], while other studies have shown the value of EnergyPlus, CFD, and Ladybug/Honeybee workflows for environmental performance analysis [16,17,18,19,20,21,22]. In this study, comfortable hours increased from 7.29 to 7.78% to 32.00–42.45%, effective daylight areas increased from approximately 40% and 31% to 81% and 74%, and ACH values increased from 1.06 to 1.89 h−1 to 2.97–4.49 h−1. These results suggest that a multi-indicator BPS workflow can provide useful quantitative support for the green retrofit of historic residences in hot–humid coastal regions. However, due to differences in climate, building type, and simulation assumptions, the results should be interpreted as case-specific before–after improvements rather than universal benchmark values.
Therefore, the retrofit strategy should not rely on one technical measure alone, but should integrate thermal comfort improvement, daylighting optimization, and ventilation-path organization within a heritage-sensitive design framework. In this sense, building performance simulation does not replace conservation judgment, but provides evidence-based support for connecting architectural documentation, environmental diagnosis, and retrofit decision-making.

5.2. Practical Applicability and Heritage-Sensitive Retrofit Strategy

The simulation results also help explain the environmental value of traditional Chaoshan overseas Chinese residences. Courtyards, corridors, cold lanes, thick walls, and controlled openings are not only cultural or spatial features, but also passive environmental elements that influence daylight, airflow, solar exposure, and thermal buffering. However, the baseline results show that these traditional spatial mechanisms were no longer sufficient under present humid coastal conditions. Airflow could not effectively reach deep enclosed rooms, daylight was limited in rear spaces, and summer overheating remained obvious. Therefore, the retrofit strategy should strengthen the original spatial logic rather than replace it. Functional reconfiguration, envelope improvement, opening optimization, ventilation-path organization, and courtyard/transitional-space adjustment were used to improve indoor environmental quality while maintaining the historic character of the building. This approach avoids both purely visual restoration and excessive technical modernization.
To contextualize the magnitude of the simulated improvements, the results were compared with recent BPS studies on historic buildings in hot–humid climates. Bay et al. evaluated natural ventilation strategies in a listed historic building using coupled energy and CFD simulations, and showed that natural ventilation can reduce mechanical-system operation in spring but is insufficient to achieve full summer thermal comfort on its own [43]. Iskandar et al. further simulated six natural ventilation strategies for a historic residential building in a hot–humid climate and found that cross ventilation was the most effective strategy, while opening size had a clear influence on thermal comfort [44]. These findings indicate that passive ventilation strategies in hot–humid historic buildings are generally effective for reducing overheating and improving airflow, but their capacity to ensure fully comfortable summer conditions remains limited.
Against this background, the present study shows a comparable but broader integrated improvement. The retrofit scenario increased the average comfortable-hour ratio by 29.7 percentage points, reduced thermally uncomfortable hours by 27.9 percentage points, lowered maximum PMV from 3.54 to 4.65 to 1.82–1.86, increased ACH from 1.38 to 3.68 h−1, and improved daylight availability by 41 percentage points in front rooms and 43 percentage points in rear rooms. These values suggest that the integrated strategy substantially alleviates overheating, poor daylight access, and weak ventilation in Jingzu Jiashu. However, the post-retrofit maximum PMV values also indicate that the strategy shifts the building from severe overheating toward slight thermal discomfort rather than achieving fully neutral thermal comfort. Therefore, the contribution of this study lies in demonstrating a heritage-sensitive, multi-indicator retrofit workflow for a humid coastal Chaoshan residence, rather than claiming complete summer comfort through passive measures alone [43].

5.3. Hygrothermal Risk and Practical Implementation

Although the proposed envelope improvement can reduce heat gain and improve indoor thermal comfort, its hygrothermal implications require careful consideration in the humid coastal climate of Shantou. Interior EPS insulation and roof insulation may alter the thermal buffering effect of the original rammed-earth walls and change vapor migration paths in a high-humidity environment. Without WUFI or another coupled hygrothermal simulation, this study cannot claim that condensation or long-term moisture risk has been fully resolved.
For the rammed-earth wall, the use of interior EPS insulation may reduce the direct thermal and moisture-buffering interaction between the indoor environment and the original massive wall. It may also shift the temperature gradient toward the historic wall and increase the risk of moisture accumulation or interstitial condensation at the interface between the original wall and the added insulation layer [45]. For the roof assembly, although the XPS layer and air cavity can improve thermal resistance, the hygrothermal performance of roof cavities is strongly affected by airflow conditions and cavity ventilation [42]. Poorly ventilated or discontinuous roof cavities may lead to trapped moisture, reduced drying potential, or local condensation around timber members and joints.
Therefore, the proposed envelope retrofit should be understood as a preliminary performance-oriented strategy rather than a final construction prescription. In practical implementation, vapor-permeable and reversible detailing, controlled ventilation of roof cavities, careful joint treatment, moisture-tolerant finishes, and long-term humidity monitoring should be considered. Further hygrothermal simulation or on-site monitoring is needed to assess seasonal condensation risk and drying performance before large-scale application.

5.4. Social Acceptance, Socio-Informational Context, and Smart-Governance Implications

The proposed retrofit also has social and governance implications. Because Jingzu Jiashu is a privately owned historic residence embedded in a local community, technical improvement alone is not sufficient for implementation. Community trust, owner acceptance, maintenance capacity, and clear communication of simulation results are needed to translate the proposed green retrofit strategy into practice. In this context, building performance simulation can play a communicative role beyond technical evaluation. Visualized PMV, DA300, and ACH/ACR results can help explain why certain interventions are necessary, what environmental problems they address, and how they can improve indoor environmental quality without excessive alteration of the historic fabric.
The acceptance of green modernization in historic buildings is also influenced by how technical evidence is communicated to owners, residents, designers, and local stakeholders. Transparent visualization and explanation of simulation results can help prevent green retrofit from being perceived as arbitrary modernization or damage to cultural authenticity. At the same time, the workflow used in this study may support future heritage management by translating the environmental condition of a historic residence into structured and visualized performance information. Such information can support communication among owners, designers, conservation professionals, local communities, and public authorities, and can provide an evidence base for future conservation decisions, maintenance planning, and policy coordination [46,47].
Therefore, the proposed retrofit should be understood not only as a building-scale environmental intervention, but also as a possible component of data-informed heritage governance. However, this discussion remains an implementation implication rather than an independent empirical analysis of community attitudes or smart-city management.

5.5. Limitations and Future Research

Several limitations should be acknowledged. First, this study is based on a single case study of Jingzu Jiashu. Although the building has representative spatial and climatic characteristics, the findings cannot be directly generalized to all Chaoshan traditional dwellings or overseas Chinese residences. Differences in building age, orientation, courtyard configuration, material condition, surrounding density, and reuse demand may lead to different environmental performance patterns.
Second, the simulation results are influenced by model simplification and input assumptions. For computational efficiency, the baseline and post-retrofit models retained the main spatial, material, and environmental features relevant to thermal, daylighting, and ventilation simulation, while some decorative details and small components were omitted. Material and optical parameters were assigned based on field investigation, national standards, and literature values for comparable traditional materials. These assumptions may introduce uncertainty into the absolute values of PMV, DA300, and ACH/ACR, although the before-after comparison remains useful for evaluating relative improvement under consistent assumptions [16,19,21].
Third, this research discusses humid coastal conditions mainly through indoor environmental performance. It does not directly assess structural safety under typhoon loads, flood risk, rainwater drainage capacity, or long-term hygrothermal deterioration under repeated wetting and drying. Therefore, the proposed retrofit strategy should not be interpreted as a complete disaster-risk mitigation solution.
Future research can extend this work in several directions. More Chaoshan overseas Chinese residences and traditional dwellings should be included to test the applicability of the diagnostic workflow across different building types and conservation conditions. Long-term on-site monitoring of temperature, humidity, illuminance, and indoor air movement should also be conducted to calibrate and validate the simulation models. In addition, future studies could incorporate climate-change scenarios, extreme-weather datasets, hygrothermal simulation, moisture-risk assessment, post-occupancy evaluation, user comfort surveys, cost assessment, and HBIM- or digital-twin-based management [2,3,48].

6. Conclusions

This study developed a building performance simulation workflow for climate-adaptive green retrofit and heritage-sensitive reuse of Jingzu Jiashu, a historic Chaoshan residence in Chenghai District, Shantou, eastern Guangdong. The workflow combined field investigation, UAV photogrammetry, architectural survey, material investigation, climate analysis, baseline model construction, thermal comfort simulation, daylighting simulation, natural ventilation simulation, retrofit strategy formulation, and post-retrofit performance verification. Three representative performance indicators were considered: PMV for thermal comfort, DA300 for daylight availability, and ACH/ACR for natural ventilation efficiency. By linking digital documentation with multi-indicator building performance simulation, this study provides an auxiliary approach for diagnosing indoor environmental deficiencies and supporting conservation-oriented green retrofit of historic residential heritage in hot–humid coastal Lingnan.
The baseline simulation showed that Jingzu Jiashu faced three main indoor environmental problems: summer overheating, insufficient daylight availability in deep rooms, and weak air exchange in several enclosed spaces. The baseline results indicated that comfortable hours accounted for only 7.29–7.78%, thermally uncomfortable hours reached 42.84–51.53%, and the maximum PMV reached 4.65 in the rear hall and 3.54–3.65 in representative rooms. The effective daylight areas of the front and rear rooms were approximately 40% and 31%, while baseline ACH values ranged from 1.06 to 1.89 h−1. These results suggest that the existing courtyard, thick envelope, controlled openings, and semi-open spaces still retain passive environmental value, but they are insufficient to fully respond to present-day humid coastal climate stress.
Based on the baseline diagnosis, an integrated retrofit scenario was proposed, including functional reconfiguration, envelope improvement, opening optimization, ventilation-path organization, and courtyard/transitional-space adjustment. Under consistent simulation assumptions, the post-retrofit results showed clear improvements. Comfortable hours increased to 32.00–42.45%, thermally uncomfortable hours decreased to 17.25–21.28%, maximum PMV values decreased to 1.82–1.86, effective daylight areas increased to 81% in the front rooms and 74% in the rear rooms, and representative-room ACH values increased to 2.97–4.49 h−1. These results indicate that the proposed workflow can support a structured comparison between baseline and post-retrofit performance and can provide quantitative evidence for balancing environmental improvement with heritage conservation constraints.
Overall, the proposed workflow demonstrates the potential of building performance simulation as an auxiliary tool for the adaptive reuse and green retrofit of historic residential heritage. The simulation outputs can support preliminary environmental diagnosis, retrofit strategy formulation, and performance-based decision-making. However, this workflow should not be regarded as a substitute for professional conservation assessment, structural safety evaluation, hygrothermal risk analysis, or long-term monitoring. Future research should further test and validate the workflow through additional case studies, long-term field measurements, measured–simulated comparison, and hygrothermal simulation.

Author Contributions

Conceptualization, T.W. and X.W.; methodology, T.W. and J.L.; software, T.W. and J.L.; validation, T.W., J.L. and Z.H.; formal analysis, T.W. and J.L.; investigation, T.W., J.L. and Z.H.; resources, T.W. and X.W.; data curation, T.W., J.L. and Z.H.; writing—original draft preparation, T.W.; writing—review and editing, T.W., J.L., Z.H. and X.W.; visualization, T.W., J.L. and Z.H.; supervision, X.W.; project administration, T.W. and X.W.; funding acquisition, X.W. All authors have read and agreed to the published version of the manuscript.

Funding

This research was funded by the research projects of Macao Polytechnic University, funding number: RP/FCHS-03/2022.

Data Availability Statement

The data presented in this study are available from the corresponding author upon reasonable request. The raw UAV images, field-survey photographs, architectural survey files, digital models, and simulation model files have not been deposited in a fully open public repository because they include site-specific documentation of a historic privately owned building and involve local access permission. The processed values supporting the reported results, including PMV, DA300, ACH/ACR, indoor temperature, humidity, radar-normalization results, and before-after performance comparison results, are summarized in the corresponding tables and figures in the manuscript.

Acknowledgments

The authors acknowledge the financial support from the Guangdong–Hong Kong–Macao Greater Bay Area disaster weather research project (Grant No. RP/FCHS-03/2022). The authors also thank the owners and local community of Jingzu Jiashu for supporting the field investigation, architectural survey, UAV documentation, and data collection. The authors are grateful to those who assisted with drawing preparation, environmental simulation, figure production, and manuscript revision.

Conflicts of Interest

The authors declare no conflicts of interest.

Abbreviations

The following abbreviations and symbols are used in this manuscript:
ACHAir Changes per Hour
ACRAir Change Rate
ACRreqRequired Air Change Rate
CFDComputational Fluid Dynamics
DADaylight Autonomy
DA300Daylight Autonomy at 300 lx
EPSExpanded Polystyrene
HBHoneybee
IEQIndoor Environmental Quality
PMVPredicted Mean Vote
UAVUnmanned Aerial Vehicle
XPSExtruded Polystyrene

Appendix A

The simulations were conducted on a laptop equipped with an NVIDIA GeForce RTX 3050 GPU, a 12th Gen Intel Core i5-12500H CPU, and 16 GB RAM. The simulations were conducted on a laptop equipped with an NVIDIA GeForce RTX 3050 GPU, a 12th Gen Intel Core i5-12500H CPU, and 16 GB RAM. The main software tools used in this study included DJI Terra 3.8 (SZ DJI Technology Co., Ltd., Shenzhen, China), Rhinoceros 7.0 with Grasshopper (Robert McNeel & Associates, Seattle, WA, USA), Ladybug Tools 1.8 and Honeybee (Ladybug Tools LLC, Atlanta, GA, USA), EnergyPlus 23.2 (U.S. Department of Energy, Washington, DC, USA), Radiance 5.4 (Lawrence Berkeley National Laboratory, Berkeley, CA, USA), Butterfly for Grasshopper and OpenFOAM v10 (OpenFOAM Foundation, London, UK), SketchUp (Trimble Inc., Westminster, CO, USA), AutoCAD (Autodesk, Inc., San Francisco, CA, USA), and Microsoft Excel (Microsoft Corporation, Redmond, WA, USA). These tools supported photogrammetry processing, architectural modeling, environmental simulation, data analysis, and figure visualization. These tools supported photogrammetry processing, architectural modeling, environmental simulation, data analysis, and figure visualization.

References

  1. Intergovernmental Panel On Climate Change (Ipcc). Climate Change 2022—Impacts, Adaptation and Vulnerability: Working Group II Contribution to the Sixth Assessment Report of the Intergovernmental Panel on Climate Change, 1st ed.; Cambridge University Press: Cambridge, UK, 2023. [Google Scholar]
  2. Sesana, E.; Gagnon, A.S.; Ciantelli, C.; Cassar, J.; Hughes, J.J. Climate Change Impacts on Cultural Heritage: A Literature Review. WIREs Clim. Change 2021, 12, e710. [Google Scholar] [CrossRef]
  3. Orr, S.A.; Richards, J.; Fatorić, S. Climate Change and Cultural Heritage: A Systematic Literature Review (2016–2020). Hist. Environ. Policy Pract. 2021, 12, 434–477. [Google Scholar] [CrossRef]
  4. Al Horr, Y.; Arif, M.; Katafygiotou, M.; Mazroei, A.; Kaushik, A.; Elsarrag, E. Impact of Indoor Environmental Quality on Occupant Well-Being and Comfort: A Review of the Literature. Int. J. Sustain. Built Environ. 2016, 5, 1–11. [Google Scholar] [CrossRef]
  5. Frontczak, M.; Wargocki, P. Literature Survey on How Different Factors Influence Human Comfort in Indoor Environments. Build. Environ. 2011, 46, 922–937. [Google Scholar] [CrossRef]
  6. Persily, A.K.; Emmerich, S.J. Indoor Air Quality in Sustainable, Energy Efficient Buildings. HVAC R Res. 2012, 18, 4–20. [Google Scholar] [CrossRef]
  7. Feng, W.; Zhang, Q.; Ji, H.; Wang, R.; Zhou, N.; Ye, Q.; Hao, B.; Li, Y.; Luo, D.; Lau, S.S.Y. A Review of Net Zero Energy Buildings in Hot and Humid Climates: Experience Learned from 34 Case Study Buildings. Renew. Sustain. Energy Rev. 2019, 114, 109303. [Google Scholar] [CrossRef]
  8. Nguyen, A.T.; Singh, M.K.; Reiter, S. An Adaptive Thermal Comfort Model for Hot Humid South-East Asia. Build. Environ. 2012, 56, 291–300. [Google Scholar] [CrossRef]
  9. Toe, D.H.C.; Kubota, T. Comparative Assessment of Vernacular Passive Cooling Techniques for Improving Indoor Thermal Comfort of Modern Terraced Houses in Hot–Humid Climate of Malaysia. Sol. Energy 2015, 114, 229–258. [Google Scholar] [CrossRef]
  10. ICOMOS Climate Change and Heritage Working Group. The Future of Our Pasts: Engaging Cultural Heritage in Climate Action; International Council on Monuments and Sites (ICOMOS): Paris, France, 2019. [Google Scholar]
  11. Webb, A.L. Energy Retrofits in Historic and Traditional Buildings: A Review of Problems and Methods. Renew. Sustain. Energy Rev. 2017, 77, 748–759. [Google Scholar] [CrossRef]
  12. Buda, A.; De Place Hansen, E.J.; Rieser, A.; Giancola, E.; Pracchi, V.N.; Mauri, S.; Marincioni, V.; Gori, V.; Fouseki, K.; Polo López, C.S.; et al. Conservation-Compatible Retrofit Solutions in Historic Buildings: An Integrated Approach. Sustainability 2021, 13, 2927. [Google Scholar] [CrossRef]
  13. Sesana, E.; Gagnon, A.S.; Bertolin, C.; Hughes, J. Adapting Cultural Heritage to Climate Change Risks: Perspectives of Cultural Heritage Experts in Europe. Geosciences 2018, 8, 305. [Google Scholar] [CrossRef]
  14. Gamage, W.; Lau, S.; Qin, H.; Gou, Z. Effectiveness of Air-Well Type Courtyards on Moderating Thermal Environments in Tropical Chinese Shophouse. Archit. Sci. Rev. 2017, 60, 493–506. [Google Scholar] [CrossRef]
  15. Safarzadeh, H.; Bahadori, M.N. Passive Cooling Effects of Courtyards. Build. Environ. 2005, 40, 89–104. [Google Scholar] [CrossRef]
  16. Hensen, J.L.M.; Lamberts, R. (Eds.) Building Performance Simulation for Design and Operation, 2nd ed.; Routledge: New York, NY, USA, 2019. [Google Scholar]
  17. Reinhart, C.F.; Mardaljevic, J.; Rogers, Z. Dynamic Daylight Performance Metrics for Sustainable Building Design. Leukos 2006, 3, 7–31. [Google Scholar] [CrossRef]
  18. Chen, Q. Ventilation Performance Prediction for Buildings: A Method Overview and Recent Applications. Build. Environ. 2009, 44, 848–858. [Google Scholar] [CrossRef]
  19. Crawley, D.B.; Lawrie, L.K.; Winkelmann, F.C.; Buhl, W.F.; Huang, Y.J.; Pedersen, C.O.; Strand, R.K.; Liesen, R.J.; Fisher, D.E.; Witte, M.J.; et al. EnergyPlus: Creating a New-Generation Building Energy Simulation Program. Energy Build. 2001, 33, 319–331. [Google Scholar] [CrossRef]
  20. Ward, G.J. The RADIANCE Lighting Simulation and Rendering System. In Proceedings of the 21st Annual Conference on Computer Graphics and Interactive Techniques—SIGGRAPH ’94; ACM Press: New York, NY, USA, 1994; pp. 459–472. [Google Scholar]
  21. Blocken, B. Computational Fluid Dynamics for Urban Physics: Importance, Scales, Possibilities, Limitations and Ten Tips and Tricks towards Accurate and Reliable Simulations. Build. Environ. 2015, 91, 219–245. [Google Scholar] [CrossRef]
  22. Sadeghipour Roudsari, M.; Pak, M.; Viola, A. Ladybug: A Parametric Environmental Plugin For Grasshopper To Help Designers Create An Environmentally-Conscious Design. In Proceedings of the 13th Conference of International Building Performance Simulation Association, Chambery, France, 26–28 August 2013. [Google Scholar]
  23. Chandel, S.S.; Sharma, V.; Marwah, B.M. Review of Energy Efficient Features in Vernacular Architecture for Improving Indoor Thermal Comfort Conditions. Renew. Sustain. Energy Rev. 2016, 65, 459–477. [Google Scholar] [CrossRef]
  24. Shanthi Priya, R.; Sundarraja, M.C.; Radhakrishnan, S.; Vijayalakshmi, L. Solar Passive Techniques in the Vernacular Buildings of Coastal Regions in Nagapattinam, TamilNadu-India—A Qualitative and Quantitative Analysis. Energy Build. 2012, 49, 50–61. [Google Scholar] [CrossRef]
  25. Nguyen, A.-T.; Tran, Q.-B.; Tran, D.-Q.; Reiter, S. An Investigation on Climate Responsive Design Strategies of Vernacular Housing in Vietnam. Build. Environ. 2011, 46, 2088–2106. [Google Scholar] [CrossRef]
  26. ANSI/ASHRAE Standard 55-2023; Thermal Environmental Conditions for Human Occupancy. ASHRAE: Peachtree Corners, GA, USA, 2023.
  27. ANSI/ASHRAE Standard 62.1-2025; Ventilation and Acceptable Indoor Air Quality. ASHRAE: Peachtree Corners, GA, USA, 2025.
  28. Brager, G.S.; De Dear, R.J. Thermal Adaptation in the Built Environment: A Literature Review. Energy Build. 1998, 27, 83–96. [Google Scholar] [CrossRef]
  29. ISO 7730:2005; Ergonomics of the Thermal Environment—Analytical Determination and Interpretation of Thermal Comfort Using Calculation of the PMV and PPD Indices and Local Thermal Comfort Criteria. International Organization for Standardization: Geneva, Switzerland, 2005.
  30. Bullen, P.A.; Love, P.E.D. Adaptive Reuse of Heritage Buildings. Struct. Surv. 2011, 29, 411–421. [Google Scholar] [CrossRef]
  31. Yung, E.H.K.; Chan, E.H.W. Implementation Challenges to the Adaptive Reuse of Heritage Buildings: Towards the Goals of Sustainable, Low Carbon Cities. Habitat Int. 2012, 36, 352–361. [Google Scholar] [CrossRef]
  32. Buda, A.; Gori, V.; Hansen, E.J.D.P.; López, C.S.P.; Marincioni, V.; Giancola, E.; Vernimme, N.; Egusquiza, A.; Haas, F.; Herrera-Avellanosa, D. Existing Tools Enabling the Implementation of EN 16883:2017 Standard to Integrate Conservation-Compatible Retrofit Solutions in Historic Buildings. J. Cult. Herit. 2022, 57, 34–52. [Google Scholar] [CrossRef]
  33. Reinhart, C.F.; Walkenhorst, O. Validation of Dynamic RADIANCE-Based Daylight Simulations for a Test Office with External Blinds. Energy Build. 2001, 33, 683–697. [Google Scholar] [CrossRef]
  34. Shantou Municipal People’s Congress Standing Committee. Regulations of Shantou Special Economic Zone on the Protection of Chaoshan Traditional Dwellings; Announcement No. 39 of the Standing Committee of the 15th Shantou Municipal People’s Congress; Shantou Municipal People’s Congress Standing Committee: Shantou, China, 2024. [Google Scholar]
  35. Ministry of Housing and Urban-Rural Development of the People’s Republic of China. Code for Thermal Design of Civil Buildings: GB 50176-2016; China Architecture & Building Press: Beijing, China, 2016.
  36. Xu, Y.; Lin, S. Jingzu Jiashu in Hougou Village, Chenghai: A Vivid Witness to the Prosperity of the Qiaopi Remittance Industry. Chaoshan Bus. 2022, 3, 66–69. (In Chinese) [Google Scholar] [CrossRef]
  37. Tang, G. Lingnan Hot-Humid Climate and Traditional Architecture; China Architecture & Building Press: Beijing, China, 2005. [Google Scholar]
  38. Nabil, A.; Mardaljevic, J. Useful Daylight Illuminances: A Replacement for Daylight Factors. Energy Build. 2006, 38, 905–913. [Google Scholar] [CrossRef]
  39. Ministry of Housing and Urban-Rural Development of the People’s Republic of China. Standard for Green Performance Calculation of Civil Buildings: JGJ/T 449-2018; China Architecture & Building Press: Beijing, China, 2018.
  40. Grossi, C.M.; Bonazza, A.; Brimblecombe, P.; Harris, I.; Sabbioni, C. Predicting Twenty-First Century Recession of Architectural Limestone in European Cities. Environ. Geol. 2008, 56, 455–461. [Google Scholar] [CrossRef]
  41. EN 16798-1:2019; Energy Performance of Buildings—Ventilation for Buildings—Part 1: Indoor Environmental Input Parameters for Design and Assessment of Energy Performance of Buildings Addressing Indoor Air Quality, Thermal Environment, Lighting and Acoustics—Module M1-6. European Committee for Standardization: Brussels, Belgium, 2019.
  42. Li, J. Parametric-Based Study on Climate Responsiveness of Chaoshan and Hakka Vernacular Typical Houses in Guangdong. Master’s Thesis, South China University of Technology, Guangzhou, China, 2022. [Google Scholar]
  43. Bay, E.; Martinez-Molina, A.; Dupont, W.A. Assessment of Natural Ventilation Strategies in Historical Buildings in a Hot and Humid Climate Using Energy and CFD Simulations. J. Build. Eng. 2022, 51, 104287. [Google Scholar] [CrossRef]
  44. Iskandar, L.; Bay-Sahin, E.; Martinez-Molina, A.; Toker Beeson, S. Evaluation of Passive Cooling through Natural Ventilation Strategies in Historic Residential Buildings Using CFD Simulations. Energy Build. 2024, 308, 114005. [Google Scholar] [CrossRef]
  45. Freimanis, R.; Vanaga, R.; Balodis, V.; Zundans, Z.; Blumberga, A. Hygrothermal Assessment of Insulation Systems for Internal Insulation of Solid Masonry Walls under Various Conditions. Buildings 2023, 13, 2511. [Google Scholar] [CrossRef]
  46. Ivančík, R.; Nečas, P.; Iľaščíková, L. Attention as a Commodity in the World of Disinformation and Social Media. J. Entrep. Sustain. Issues 2024, 12, 176–192. [Google Scholar] [CrossRef]
  47. Peráček, T.; Kaššaj, M. Strategic Management of Urban Services Using Artificial Intelligence in the Development of Sustainable Smart Cities—Managerial and Legal Challenges. Sustainability 2026, 18, 582. [Google Scholar] [CrossRef]
  48. Murphy, M.; McGovern, E.; Pavia, S. Historic Building Information Modelling—Adding Intelligence to Laser and Image Based Surveys of European Classical Architecture. ISPRS J. Photogramm. Remote Sens. 2013, 76, 89–102. [Google Scholar] [CrossRef]
Figure 1. Research framework of the study, including data collection, baseline model construction, simulation analysis, retrofit strategy formulation, and performance verification. The retrofit strategy was organized as an integrated scenario based on baseline performance diagnosis and heritage-sensitive design constraints. Colors indicate different workflow stages.
Buildings 16 02743 g001
Figure 2. Location and architectural context of Jingzu Jiashu. (a) Location of Hougou Village and Jingzu Jiashu; (b) Aerial view of the site.
Buildings 16 02743 g002
Figure 3. Field investigation photographs of Jingzu Jiashu: (a) entrance; (b) wooden door panels; (c) folding wooden doors; (d) sunshades; (e) ventilation opening; (f) recessed barred window; and (g) interior barred window. These photographs record representative spatial, material, opening, and environmental conditions used to support field interpretation and baseline model construction.
Buildings 16 02743 g003
Figure 4. UAV photogrammetry and site orthophoto of Jingzu Jiashu. (a) Aerial orthophoto of the survey site; (b) camera positions and photogrammetric coverage.
Buildings 16 02743 g004
Figure 5. Architectural survey drawings of Jingzu Jiashu used for geometric verification and baseline model construction. (a) First-floor plan; (b) Section 1–1′; (c) Section 2–2′; (d) south elevation; (e) north elevation. Letters and numbers in the drawings indicate original grid labels, section marks, elevation levels, and scale information.
Buildings 16 02743 g005
Figure 6. Simplified baseline simulation model of Jingzu Jiashu integrated with the surrounding context. The model covers the main building and its surrounding built environment within an approximate 100 m survey range. The model orientation follows the site orientation used in the UAV photogrammetry and architectural survey drawings.
Buildings 16 02743 g006
Figure 7. Climate background and seasonal weather exposure of Shantou. (a) Solar radiation exposure; (b) relative humidity distribution; (c) annual wind rose; (d) summer and monsoon-season wind rose.
Buildings 16 02743 g007
Figure 8. Overall building performance simulation workflow for the climate-adaptive retrofit of Jingzu Jiashu. Colors distinguish different workflow components, and arrows indicate the direction of process flow.
Buildings 16 02743 g008
Figure 9. Thermal simulation workflow and Honeybee model construction. Different colors indicate different components or stages of the simulation workflow.
Buildings 16 02743 g009
Figure 10. DA300 daylighting simulation workflow. Different colors indicate different components or stages shown in the figure.
Buildings 16 02743 g010
Figure 11. Natural ventilation simulation workflow and CFD boundary-condition setting, including the wind-tunnel-type computational domain, coastal terrain condition, inlet and outlet boundaries, laminar flow option, local mesh refinement, baseline/post-retrofit mesh sizes, residual control, iteration setting, and extraction of indoor wind-speed and ACH indicators.
Buildings 16 02743 g011
Figure 12. Annual hourly PMV distribution of representative rooms under the baseline condition: (a) rear room; (b) front room. The vertical axis follows a top-to-bottom chronological order, with 0:00 at the top and 24:00 at the bottom.
Buildings 16 02743 g012
Figure 13. Summer psychrometric distributions of representative rooms before retrofit: (a) right rear room; and (b) right front room. The horizontal axis represents zone operative temperature (°C), the vertical axis represents humidity ratio (kg water/kg dry air), and the color scale indicates the cumulative number of summer hours. The red psychrometric grid shows relative-humidity curves and enthalpy-related air-state isolines.
Buildings 16 02743 g013
Figure 14. Baseline daylight autonomy distribution of Jingzu Jiashu.
Buildings 16 02743 g014
Figure 15. Baseline wind environment and ventilation performance of Jingzu Jiashu: (a) site-scale wind environment; (b) indoor airflow distribution; and (c) average ACH distribution.
Buildings 16 02743 g015
Figure 16. Integrated climate-adaptive retrofit strategy of Jingzu Jiashu: (a) post-retrofit functional zoning plan; (b) airflow organization of a representative residential room; and (c) retrofitted roof assembly.
Buildings 16 02743 g016
Figure 17. Annual hourly PMV distribution of the right front room before and after retrofit: (a) before retrofit; and (b) after retrofit.
Buildings 16 02743 g017
Figure 18. Comparison of summer PMV statistics before and after retrofit.
Buildings 16 02743 g018
Figure 19. Summer psychrometric distribution of the right rear room before and after retrofit: (a) before retrofit; and (b) after retrofit.
Buildings 16 02743 g019
Figure 20. Post-retrofit DA300 distribution of Jingzu Jiashu.
Buildings 16 02743 g020
Figure 21. Post-retrofit natural ventilation performance of Jingzu Jiashu: (a) indoor wind-speed distribution after retrofit; and (b) average ACH distribution after retrofit.
Buildings 16 02743 g021
Figure 22. Overall comparison of baseline and post-retrofit indoor environmental performance: (a) normalized indicator scores; and (b) absolute changes in selected indicators.
Buildings 16 02743 g022
Table 1. Supplementary thermal-humidity measurements of representative spaces during the hot–humid season.
Measurement LocationAir TemperatureRelative HumidityEnvironmental Interpretation
Front open space35.2 °C68.4%Strong outdoor heat exposure
Central courtyard33.8 °C74.6%Some air movement, but still under hot–humid conditions
Rear hall32.9 °C79.8%Weak ventilation and a tendency toward moisture accumulation
Deeper interior room32.6 °C82.7%Air stagnation and weak moisture dissipation capacity
Table 2. Material and optical parameters used in the baseline simulation model.
Building ComponentMaterial TypeThickness
(m)
Thermal
Resistance (m2·K/W)
Thermal
Inertia
Index
Exterior
Solar
Absorptance
Interior
Visible
Reflectance
WallRammed-earth wall0.270.5514.4440.680.32
RoofFour-layer tiled roof0.150.1430.5790.520.14
FloorTraditional ground surface0.180.3292.5760.19
DoorTimber door0.080.3803.7100.600.40
Note: Material types and thicknesses were determined based on field investigation and architectural survey. Thermal and optical parameters were assigned according to the field-identified material types, national standards, and literature-based values for comparable traditional building materials. “—” indicates that the parameter was not applied in the simulation setting.
Table 3. Monthly air temperature conditions in Shantou based on Ladybug-processed climate data.
Temperature IndicatorJan.Feb.Mar.Apr.MayJun.Jul.Aug.Sep.Oct.Nov.Dec.
Mean temperature (°C)15.515.618.923.125.628.329.929.228.625.222.417.5
Mean maximum air
temperature (°C)
26.027.032.033.336.035.038.037.032.833.032.028.0
Mean minimum air
temperature (°C)
5.07.08.013.019.722.023.024.024.018.013.08.0
Table 4. Simulation indicators and evaluation criteria.
Performance
Dimension
IndicatorSimulation BasisEvaluation Criterion
Thermal
comfort
PMVEnergyPlus/Honeybee thermal simulationCloser to 0 indicates better thermal neutrality; −0.5 ≤ PMV ≤ +0.5 was used as the comfort range
Daylighting
performance
DA300/DA300, 50%Radiance-based annual daylight simulationDA300 ≥ 50% was interpreted as
effective daylight availability
Natural
ventilation
efficiency
ACH/ACRreqCFD-based airflow simulationACH ≥ ACRreq indicates sufficient air exchange potential under the
assumed occupancy condition
Table 5. Occupancy and thermal comfort parameter settings.
Space TypeMain ActivityOccupant DensityActivity IntensityMetabolic RateMain Occupancy Schedule
RoomsResting and sleeping0.08 person/m272 W0.7 met1:00–4:00; 20:00–24:00
HallsSitting, staying, communication0.12 person/m2108 W1.0 met5:00–19:00
Side baysWork, cooking, short-term activity0.04 person/m2207 W1.8 met5:00; 11:00; 17:00
Table 6. Summer PMV statistics of representative spaces before retrofit.
MetricRear HallRight Rear RoomRight Front RoomLeft Rear RoomLeft Front Room
Comfortable hours (%)7.927.297.787.567.78
Slightly uncomfortable hours (%)44.6141.1642.6142.4842.98
Uncomfortable hours (%)47.4651.5342.8446.5549.23
PMV max4.653.653.603.543.59
PMV min−0.54−0.38−0.42−0.39−0.42
Table 7. Required and simulated ACH values of representative spaces under the baseline condition.
MetricRear
Hall
Right
Rear
Room
Left
Rear
Room
Right
Front
Room
Left
Front
Room
Right
Side
Bay
Left
Side
Bay
Required
ACH (1/h)
3.113.543.542.642.643.733.73
Simulated
ACH (1/h)
2.211.891.751.071.141.061.00
Table 8. Components of the integrated retrofit scenario and corresponding performance objectives.
Evaluation IndicatorInterventionTarget ProblemRetrofit
Component
PMV, DA, ACH/ACRReorganize living, service, exhibition, and
transitional spaces
Spatial-use mismatchFunctional
reconfiguration
PMVImprove envelope thermal behavior with
internal measures
OverheatingEnvelope
improvement
DA, ACH/ACRAdjust selected openings and
airflow connections
Insufficient daylight and airflowOpening
optimization
ACH/ACRStrengthen airflow paths between rooms, courtyards, and corridorsLow air exchangeVentilation
organization
PMV, DA, ACH/ACRUse courtyards and corridors as daylight,
airflow, and activity buffers
Limited semi-open space useCourtyard and transitional-space adjustment
PMV, DA, ACH/ACRIntegrate all components for before–after comparisonCombined deficienciesIntegrated post-retrofit model
Table 9. Required and simulated ACH values before and after retrofit.
MetricRight Rear
Room
Left Rear
Room
Right Front RoomLeft Front
Room
Right Side
Bay
Required ACH
(h−1)
3.543.542.642.643.73
Simulated ACH before retrofit
(h−1)
1.891.751.071.141.06
Simulated ACH after retrofit
(h−1)
4.494.243.633.092.97
Table 10. Comparison of baseline and post-retrofit indoor environmental performance indicators.
DimensionIndicatorBaselinePost-RetrofitImprovement
Thermal comfortComfortable hours7.29–7.78%32.00–42.45%Increased by approximately 24.2–35.2 percentage points
Thermal comfortThermally uncomfortable hours42.84–51.53%17.25–21.28%Reduced by approximately 26–30 percentage points
Thermal comfortMaximum PMV3.54–4.651.82–1.86Reduced by approximately 1.7–2.8 in absolute PMV value
Thermal environmentIndoor air temperatureMore than 50% of summer hours above 30 °CLess than 25% of summer hours above 30 °CAverage decrease of approximately 3.7 °C
DaylightingEffective daylight area of front roomsApproximately 40%Approximately 81%Increased by approximately 41 percentage points
DaylightingEffective daylight area of rear roomsApproximately 31%Approximately 74%Increased by approximately 43 percentage points
VentilationRepresentative room ACH1.06–1.89 h−12.97–4.49 h−1Air exchange capacity clearly improved
VentilationAverage indoor wind speedWeak airflow in several enclosed roomsIncreased by approximately 0.18 m/sIndoor airflow condition improved
Note: Table 10 summarizes the original simulation results reported in Table 6, Table 7 and Table 9 and Figure 14, Figure 15, Figure 18, Figure 19, Figure 20 and Figure 21; it does not introduce an independent dataset.
Disclaimer/Publisher’s Note: The statements, opinions and data contained in all publications are solely those of the individual author(s) and contributor(s) and not of MDPI and/or the editor(s). MDPI and/or the editor(s) disclaim responsibility for any injury to people or property resulting from any ideas, methods, instructions or products referred to in the content.