Article

Construction Risk Measurement and Driving Mechanisms in Old Residential Community Renovation Projects: A Combined Correlation–SEM Approach

School of Management Engineering, Shandong Jianzhu University, Jinan 250101, China
*
Author to whom correspondence should be addressed.
Buildings 2026, 16(14), 2740; https://doi.org/10.3390/buildings16142740
Submission received: 31 May 2026 / Revised: 23 June 2026 / Accepted: 1 July 2026 / Published: 10 July 2026
(This article belongs to the Section Construction Management, and Computers & Digitization)

Abstract

Old residential community renovation projects face intense socio-technical risks driven by complex construction environments, diverse stakeholders, and management frictions. To optimize risk governance, this study develops a systematic risk measurement framework by integrating correlation coefficient analysis and structural equation modeling (SEM). Based on multi-source empirical data, five critical risk dimensions are identified: personnel, materials and equipment, technology, management, and environment. Following indicator screening via correlation metrics, an SEM path analysis is performed using risk probability, consequence severity, control difficulty, and exposure degree as endogenous variables. The results demonstrate that the model achieves robust statistical goodness-of-fit, effectively uncovering a tripartite driving mechanism encompassing risk triggering, amplification, and constraint across varying dimensions. This study delivers a replicable quantitative tool and an actionable decision-making basis for the refined safety management and sustainable implementation of complex urban renewal projects.

1. Introduction

Urban renewal serves as a key path to reconstruct the value of existing assets and improve human settlement environments, which has become a core strategy in the new urbanization process of China [1]. Under this strategic framework, the large-scale renovation of old residential communities is listed as a top priority to systematically address deep-seated problems such as aging infrastructure, insufficient public services, and structural decision-making misalignments [2]. However, old residential community renovation projects are characterized by high systemic complexity. The upgrading of existing neighborhoods frequently triggers intricate socio-technical risks and resident dissatisfaction during the construction execution phase [3]. These uncertainties, if improperly managed, can easily escalate into severe decision-making conflicts and governance frictions among multi-party stakeholders [4,5].
The successful implementation of these renovation projects heavily depends on prospective risk identification, collaborative governance mechanisms, and structured risk propagation path measurement [6,7]. Therefore, the adoption of a rigorous quantitative and empirical paradigm is highly required. In methodological practice, identifying the complex driving paths of construction risks requires a systematic foundation. First, significant correlations among observed variables are screened through Pearson correlation analysis to establish an initial causal logic and streamline the network structure [8]. On this basis, multivariate statistical analysis and structural equation modeling (SEM) are widely recognized as the gold standard to handle relationships among latent variables, enabling multi-dimensional path verification for unobservable risk constructs [9,10]. This rigorous verification clarifies the underlying causal driving logic among construction risks and project constraints, which is vital for project managers to optimize resource allocation, enhance early stakeholder involvement, and proactively assess systemic vulnerabilities [11,12].
Existing studies have made prominent progress in identifying general barriers and specific social risks within urban regeneration [13]. However, a critical systematic review of the scientific literature reveals three fundamental research gaps that remain unaddressed. First, most existing literature regards technical site constraints and management interferences as isolated, independent risk sources, which fails to accurately quantify the dynamic coupling mechanisms and cascading risk transmission paths triggered by multi-dimensional factor interactions [14]. Second, traditional construction safety management frameworks are inherently optimized for standard greenfield paradigms, making them highly incompatible with the volatile conditions of old residential community renovations; these projects operate within high-density, “occupied brownfield” spaces where construction activities heavily collide with residents’ daily routines, inducing complex multi-party interest bargaining and severe spatial bottlenecks. Third, conventional quantitative risk models frequently introduce methodological noise and subjective biases due to semantic overlaps among closely interrelated engineering indicators, thereby compromising the explanatory robustness of latent variable path verifications.
To bridge these critical gaps, a coupled risk measurement framework based on an integrated Correlation–SEM approach is constructed in this study, utilizing empirical data from n = 350 validated expert questionnaires to achieve three distinct scientific contributions tailored toward our research objectives. As a major theoretical shift, this study moves away from fragmented risk listings to a systemic socio-technical perspective, conceptualizing the urban renewal renovation site as a dynamic human–environment–infrastructure ecosystem. Mechanistically, this framework empirically unveils a non-linear, tripartite driving mechanism across four risk characteristics (probability, severity, control difficulty, and exposure degree), precisely deconstructing risk triggering as personnel-driven, risk amplification as driven asymmetrically by management deficiencies, and boundary constraints as imposed by spatial and environmental bottlenecks. Methodologically, this research optimizes the evaluation paradigm by deploying Pearson Correlation Screening as a preliminary semantic filter to eliminate informational noise and streamline the network structure before executing structural equation modeling path validation. This integrated approach effectively overcomes the insufficient mining of factor interactions in traditional static evaluation methods, providing project managers with a rigorous quantitative tool and empirical decision-making benchmarks to proactively mitigate safety hazards and governance frictions, thereby ensuring the sustainable and smooth execution of old residential community renovations.

2. Literature Review

2.1. Background and Social Challenges of Old Residential Community Renovation

Existing literature indicates that old residential community renewal is not merely the reshaping of physical space, but rather a complex, multi-dimensional process of interest bargaining and dynamic stakeholder interaction [1,2]. Scholars point out that institutional bottlenecks, socio-technical barriers, and the lack of systemic interest coordination mechanisms are the primary drivers of project delays and resistance [13,14,15]. Therefore, a collaborative governance model based on community networks and multi-subject coordination is widely advocated to enhance public participation and streamline decision-making pathways [5,6]. Studies emphasize that the adaptive mechanisms of local residents, along with cognitive heterogeneity regarding renovation willingness, serve as core factors affecting regional renewal potential [3,16]. A low level of resident identification with renovation goals can easily induce serious management frictions, severe public dissatisfaction, and prolonged implementation gridlocks [17,18]. Recent studies further indicate that these multi-party interest patterns can be clarified through advanced evolutionary game analysis and optimal decision-making models [4,19], while the integration of transparent cost allocation and collaborative governance mechanisms can significantly optimize the performance of project participants and mitigate potential social instability [20,21]. In contrast to these established governance-centric perspectives that primarily treat social frictions as external institutional variables or descriptive background conditions, this manuscript contributes a critical paradigm shift. By conceptualizing the urban renewal site as a coupled socio-technical ecosystem, this study uniquely operationalizes interest bargaining and resident resistance into quantifiable management and environmental risk factors, enabling their direct interaction with physical construction safety pathways to be empirically measured.

2.2. Construction Risk Identification and Site Constraints

Apart from social and governance dimensions, the physical constraints and technical complexities of construction sites are critical sources of project uncertainty [22,23]. Studies indicate that the strategic involvement of early stakeholders during the project definition phase substantially helps managers predict spatial limitations, logistical difficulties, and localized structural risks, thereby avoiding severe bottleneck effects in subsequent execution phases [11,12]. Furthermore, the popularization of green development and sustainability concepts introduces higher technical complexity to contemporary retrofitting projects, posing stringent challenges to material selection, resource optimization, and environmental adaptability [7,13]. Risk perception, safety management, and response strategies during dynamic construction processes must be anchored on a robust, multi-dimensional safety risk assessment framework [24,25]. Empirical analyses and accident causation reviews of Chinese construction projects have systematically outlined the critical risk spectrum [26,27], which lays a solid methodological and empirical foundation for establishing a localized, multi-dimensional risk indicator system in urban renovation settings. While these existing studies successfully isolate individual physical barriers, they are predominantly optimized for standard greenfield projects with clear boundaries and fail to capture how technical schema deviations interact with human behaviors under severe spatial constraints. This manuscript directly addresses this limitation by introducing a tailored risk breakdown structure tailored for high-density “occupied brownfields,” providing clear empirical evidence of how technical platform intensification barriers and spatial bottlenecks establish powerful boundary constraints that restrict operational safety limits.

2.3. Methodological Evolution, Cross-Application, and Synthesis of SEM in Renovation Risks

Structural equation modeling (SEM) has become the gold standard for handling intricate relationships among latent, unobservable variables within the domain of engineering and construction management [10,28], successfully achieving the transition from qualitative risk listing to rigorous quantitative path measurement. Methodologically, SEM has been widely applied to analyze construction employees’ safety behaviors [28], evaluate measurement errors in structural models [29,30], and uncover structural drivers or critical success criteria in complex project networks [6,31]. Scholars traditionally evaluate convergent validity strictly based on composite reliability (CR) and average variance extracted (AVE) metrics [29,30], while increasingly adopting the heterotrait–monotrait (HTMT) ratio to rigorously test discriminant validity and eliminate common method biases [31,32]. Crucially, the ProCRiM (Project Complexity and Risk Management) framework demonstrates the absolute necessity of preliminary causal logic screening [8,33], utilizing a Pearson correlation matrix or correlation metrics before running full SEM paths to streamline indicator structures, avoid model over-fitting, and substantially enhance statistical parsimony [33,34].
This methodological rigor has propelled a significant increase in studies deploying SEM to evaluate behavioral intentions [35], critical success factors, and life-cycle risks of renovation projects [5,6]. Scholars have successfully measured the transmission paths of socio-technical resistance and institutional barriers through confirmatory factor analysis (CFA) and structural path verification [10,13]. SEM for strategic decision variables [4,20] and the application of correlation coefficient coupled models in uncertainty propagation analysis [10,34] prove the distinct advantages of this methodology in handling complex variable interactions and cascading risks. In addition, researchers have recently analyzed risk evolution mechanisms, stakeholder dynamics rooted in classic theoretical frameworks [36,37,38], risk control benchmarks under standardized management protocols [39,40,41], quantitative probabilistic safety risk analysis models [42], and systemic feedback through composite frameworks encompassing system dynamics, multi-source information fusion, and advanced network modeling [5,43,44,45]. A rigorous synthesis of these methodologies reveals that although composite frameworks capture macro-level system feedback, they often introduce significant mathematical noise and indicator over-fitting when dealing with highly correlated socio-technical risk variables [43,45]. To deconstruct the complex realities of urban renewal, an explicit comparative analysis with mainstream risk assessment methods in construction engineering is paramount. Traditional risk evaluation frameworks, such as the Analytic Hierarchy Process (AHP), Gray Relational Analysis, and Fuzzy Comprehensive Evaluation, rely heavily on static index weight rankings that implicitly assume linear independence among variables [34]. Consequently, they inherently fail to address the non-linear multi-factor coupling and cascading transmission characteristics—such as a frontline behavioral failure triggering an organizational crisis or a technical scheme mismatch rippling into tight physical environmental constraints—inherent in occupied brownfields. Conversely, while standalone Structural Equation Modeling (SEM) can theoretically map path dependencies, directly injecting a massive pool of localized variables into a single structural model frequently triggers severe multi-collinearity, over-parameterization, and model overfitting, which manifests as suppressed goodness-of-fit parameters like the Goodness-of-Fit Index [29,33]. Compared to these traditional linear methods or standalone, single-stage SEM frameworks, this manuscript delivers a distinct methodological optimization by implementing a two-stage hybrid paradigm that deploys Pearson Correlation Screening as a preliminary statistical and semantic filter. By screening out low-relevance informational noise and isolating variables with high bivariate covariance before structural estimation, this coupled framework safeguards model parsimony and framework applicability. This integrated analytical pathway uniquely enables the empirical unveiling of a tripartite driving mechanism—systematically distinguishing between personnel-driven risk triggering, asymmetric management-driven risk amplification, and environmental boundary constraints—thereby offering a superior, contextualized approach to capturing cascading risks in built environment transformations [42].

3. Theoretical Foundation

3.1. Structural Equation Modeling

Structural equation modeling (SEM) represents a powerful multivariate statistical modeling technique capable of analyzing complex systems of relationships by handling multiple dependent and independent variables simultaneously [9,10]. Distinct from traditional regression paradigms, SEM effectively incorporates measurement errors into both observed and unobservable variables, thereby providing a more rigorous and unbiased estimation of the structural path relationships among multiple latent constructs [29,46]. In the context of old residential community renovation projects, the construction execution phase is typically characterized by a highly volatile site environment and multi-party stakeholder dynamics, wherein diverse risk factors exhibit strong socio-technical coupling and cascading characteristics. Consequently, SEM is selected as the core analytical framework in this study. It quantifies the non-linear interaction logics and structural driving paths among various risk dimensions, transforming qualitative risk assumptions into highly validated empirical insights [6,46].

3.2. Identification of Construction Risk Indicators for Old Residential Communities

To ensure comprehensive and accurate risk identification, a multi-stage systematic literature review and indicator harvesting procedure are deployed in this study. The identification process is initiated by executing an exhaustive search across prominent academic databases, including Web of Science, Scopus, and CNKI, utilizing targeted combinations of core keywords such as “old residential community renovation”, “shantytown renovation”, “urban renewal”, and “risk management” [12,14]. To filter the initial raw literature pool, strict inclusion and exclusion criteria are enforced: candidate studies must focus explicitly on the construction execution or physical retrofitting phases, thereby systematically eliminating macro-level real estate investments or generic economic risk factors that lack direct operational relevance to on-site safety. Because different scholars inevitably manifest semantic variations and descriptive gaps when defining engineering risk nomenclatures, a standardized qualitative induction and thematic synthesis protocol is subsequently applied to group, integrate, and reconstruct factors with overlapping meanings. Through this rigorous filtering and semantic consolidation, 32 critical risk indicators uniquely reflective of the socio-technical friction, tight spatial boundaries, and occupied site constraints of existing neighborhoods are finalized and defined. These 32 indicators are classified into five dimensions based on risk source attributes, namely personnel risk, material and equipment risk, technical risk, management risk, and environmental risk, forming a systematic risk breakdown structure (RBS) to lay a robust foundation for subsequent empirical and quantitative verifications. The detailed classification, alongside the empirical and theoretical literature supporting the derivation of each indicator, is systematically mapped and structured in Table 1.
A mature indicator system must satisfy comprehensiveness and representativeness. It must also ensure that no overlap exists among indicators. The correlation coefficient method effectively identifies the degree of information overlap among indicators. This method also accurately reflects the importance of each indicator in the comprehensive evaluation. Therefore, the indicator system in Table 1 is further optimized and screened based on the correlation coefficient method in this study. This process lays a solid foundation for the subsequent in-depth analysis of the SEM. To establish a highly reliable initial data input for the correlation matrix, a purposive sampling strategy was deployed to convene a specialized panel of ten prominent experts in relevant engineering management fields to score the risk impact levels of the 32 preliminary indicators. The selection matrix for this expert panel was governed by three strict prerequisite qualification criteria: first, a minimum of 15 years of active professional tenure in construction safety management, urban renewal policy execution, or high-density structural retrofitting; second, the possession of a senior professional title, such as Senior Engineer or Full Professor; and third, direct, hands-on leadership experience in managing at least two large-scale old residential community renovation projects within Chinese high-density urban areas. Cultivating a highly balanced socio-technical perspective across the panel, the backgrounds of the selected ten experts encompass three senior professors specializing in urban resilience from national key universities, three project directors from public sector municipal development agencies, and four chief safety officers from top-tier construction contracting firms. The scores are formally set using a traditional five-point Likert scale as {1, 2, 3, 4, 5}, where the corresponding risk impact level is systematically operationalized as E = {very small, small, medium, large, very large}.
The restriction of the panel size to exactly ten experts is mathematically and methodologically justified within our two-stage paradigm. Unlike the subsequent structural equation modeling stage which necessitates a large empirical sample (n = 350) to ensure structural stability, the preliminary indicator screening stage utilizing the Pearson correlation coefficient matrix relies strictly on the depth of highly specialized consensus rather than broad statistical generalization. In engineering management research involving preliminary matrix-based factor pruning, small panels ranging from 8 to 12 top-tier experts are standard and optimal because they minimize informational dilution and prevent statistical noise that typically arises when scoring nuanced engineering indicators through a wider, less-specialized respondent base. Maintaining a compact panel of ten elite stakeholders ensures that each mathematical data cell within the initial data matrix represents a highly authoritative, deeply context-specific alignment of expert knowledge, directly suppressing random cognitive variances and ensuring the mathematical integrity of the subsequent covariance calculations. Subsequently, the indicator data are calculated using correlation coefficients. Indicators with high impact levels are screened to further optimize the risk characteristic system. The specific calculation steps are as follows:
  • Establishment of a data matrix;
An indicator data matrix is established based on the expert scoring data of each indicator. This matrix is presented as follows:
X =   x 11 x 12 x 1 n x 21 x 22 x 2 n x m 1 x m 2 x m n
2.
Calculation of indicator correlation coefficients;
The correlation coefficient of each indicator is calculated through the following formula. A correlation coefficient matrix is established based on the calculated results. The specific formula is as follows:
x i ¯ = 1 n a = 1 n x i a i = 1 , 2 , , m
S i i = 1 n a = 1 n x i a x i ¯ 2 i = 1 ,   2 , ,   m
S i j = 1 n a = 1 n x i a x i ¯ x j a x j ¯ i j ;   i ,   j = 1 ,   2 , ,   m
r i j = S i j S i i S i j i ,   j = 1 ,   2 , ,   m
R = r i j m × m = r 11 r 12 r 1 m r 21 r 22 r 2 m r m 1 r m 2 r m m
The mean is calculated through Equation (2). The variance is calculated through Equation (3). The covariance is calculated through Equation (4). The correlation coefficient is calculated through Equation (5). Finally, the final correlation coefficient matrix is obtained as Equation (6).
3.
Analysis of the correlation coefficient matrix.
Seven indicators under personnel risk A1 within the criterion-level indicators are taken as an example. Table 2 presents the scoring results of the impact levels of various indicators by ten experts, as shown below:
The scoring data are substituted into Equations (2)–(6). The correlation coefficient matrix is obtained as follows:
R =   1 0.826 0.791 0.853 0.764 0.712 0.128 0.826 1 0.804 0.837 0.789 0.745 0.096 0.791 0.804 1 0.812 0.758 0.703 0.105 0.853 0.837 0.837 1 0.841 0.776 0.089 0.764 0.789 0.789 0.841 1 0.792 0.112 0.712 0.745 0.745 0.776 0.792 1 0.074 0.128 0.096 0.096 0.089 0.112 0.074 1
The correlation coefficient matrix reveals that the absolute values of correlation coefficients among the six indicators A11 to A16 are all strictly above the established statistical threshold of 0.7, indicating a high linear correlation and substantial information redundancy among these variables. In multivariate modeling and structural path verification, maintaining indicators with an inter-correlation exceeding 0.7 within the same latent construct introduces a severe risk of multicollinearity, which can artificially inflate standard errors, destabilize path coefficients, and distort the subsequent structural equation modeling path estimation. These six operational risks are closely coupled because they collectively reflect the immediate behavioral and safety adherence characteristics of on-site workers within a shared socio-technical environment. By contrast, the absolute correlation coefficients between A17 (physical health conditions of operational personnel) and the other six indicators fall entirely below 0.13, demonstrating an extreme lack of linear association with the core operational risk network. According to the core screening protocol of this study, an indicator is designated for elimination if it manifests both a low correlation threshold (r < 0.20) and a low expert impact rating threshold (mean score < 2.0). For indicator A17, its correlation with the functional safety network is exceptionally weak, and its mean expert score stands at a marginal 1.8 points, mathematically and practically confirming that its perceived baseline impact on project safety is minimal within this specific framework.
Crucially, a key potential risk of removing indicators based on low correlation or low baseline expert ratings is the accidental omission of independent, orthogonal risk factors or rare, low-probability high-consequence events that do not co-vary with daily operational behaviors but could still trigger catastrophic project failures. In the context of old residential community renovations, discarding an indicator like worker health conditions (A17) could theoretically obscure sudden, severe health-related disruptions on site. However, this potential omission risk is thoroughly mitigated and justified in this study because physical health variations are already strictly controlled through standardized pre-employment medical screenings and mandatory daily health checks enforced by localized construction safety regulations, rendering its active variation on-site statistically marginal and operationally insulated from the dynamic socio-technical friction of the project execution phase. Accordingly, this explicitly delineates the applicable boundary of the finalized risk indicator system, which is strictly anchored in capturing active, dynamic operational threats and behavioral non-compliance during construction, rather than static physiological health diagnostics, further reinforcing the rationality of omitting A17. Consequently, eliminating A17 does not compromise the comprehensiveness of the risk breakdown structure; rather, it strategically prunes statistical noise, enhances the parsimony of the indicator framework, and guarantees that the subsequent SEM remains focused exclusively on the highly active, interactive risk transmission pathways. An identical rigorous threshold filtering logic combining multicollinearity avoidance (r ≥ 0.7) and marginal factor pruning (r < 0.20 and mean score < 2.0) was systematically applied to evaluate, screen, and optimize the material and equipment risk, technical risk, management risk, and environmental risk dimensions, culminating in the finalized and validated risk measurement indicator system presented in Table 3.

4. Construction and Analysis of the Structural Equation Model

4.1. Data Collection

Data collection for the structural equation model (SEM) is conducted through a questionnaire survey in this study. This data collection is based on the construction risk factor indicator system obtained in Table 3. The primary dimensions are numbered from A1 to A5. The sub-indicators are numbered from A11 to A54. The questionnaire uses a traditional five-point Likert scale to score each specific construction risk factor (A11 to A54) from Table 3. These factors serve as observed indicators of exogenous latent variables (independent variables) in the model.
To reflect the comprehensive level of construction risks in old residential community renovation projects, risk theory and existing literature are integrated. Four classical dimensional characteristics of risk are selected as endogenous latent variables (dependent variables) in the SEM. These variables include risk probability (B1), consequence severity (B2), control difficulty (B3), and exposure degree (B4). These variables are collectively termed construction risk characteristics. Each dimension contains four measurement items. There are 16 observed variables (B11 to B44) in total. The specific item contents and numbers are presented in Table 4.
In the model specification, the specific construction risk factors (A11 to A54) from Table 3 are hypothesized to point to the four latent variables B1 to B4. This specification implies that differences in the levels of construction risk factors affect the evaluation of construction risk characteristics. These characteristics include risk probability, consequence severity, control difficulty, and exposure degree. The questionnaire utilizes a five-point Likert scale. A score of 1 represents a very low impact level. A score of 5 represents a very high impact level. In addition, the questionnaire survey collects demographic data of the respondents. These data include gender, educational background, working organization, and years of professional experience. This collection ensures the scientific validity and professionalism of the sample.
To secure a highly qualified and contextually relevant respondent pool, a multi-stage data procurement protocol comprising a purposive sampling strategy combined with a snowball chain-referral technique was implemented. Geographically, the field survey focused heavily on high-density urban renovation clusters within eastern China (specifically centered across Shandong Province and neighboring municipal renewal zones), which currently represent the frontier of complex old residential community upgrading programs and exhibit acute socio-technical friction. Respondent recruitment was orchestrated by partnering with regional urban-rural development bureaus, local municipal project management associations, and top-tier construction contracting firms, ensuring direct access to active professionals who possess first-hand expertise in urban renewal execution. To ensure absolute data integrity, a rigorous two-stage response validation process was enforced upon recovering the questionnaires. First, a strict completion-time threshold was applied, systematically discarding any questionnaire completed in under 180 s to eliminate careless or random clicking behavior. Second, an internal consistency and attention-check filtration was executed to eliminate straight-line response patterns or contradictory answers between regular and reversed control questions. Through this stringent screening protocol, 50 invalid or low-quality responses were weeded out from the initial pool of 400 distributed questionnaires, culminating in n = 350 fully validated expert responses and yielding a high, statistically robust valid recovery rate of 87.5%.
The sample representativeness of these n = 350 respondents is highly robust and matches the multi-party stakeholder ecosystem of Chinese urban renewal practices, as detailed in Table 5. Methodologically, the sample breaks away from single-perspective biases by capturing a highly balanced distribution across the project lifecycle, balanced closely between Project Owners (36.0%) and Contractors (36.6%), while being supported by Design Organizations (10.9%), Material Suppliers (9.1%), and Academic Researchers (7.4%). Furthermore, the professional quality and cognitive depth of the sample are guaranteed by the respondents’ maturity and educational backgrounds: an overwhelming majority of 84.3% possess more than three years of active professional tenure in construction engineering, with nearly half (47.7%) exceeding five years of senior leadership experience. Additionally, 70.0% of the surveyed experts hold a Bachelor’s degree or higher (including 20.0% with Master’s degrees and above), ensuring that the complex socio-technical indicator descriptions were interpreted with high cognitive accuracy. This aligned demographic distribution closely mirrors the real-world configuration of urban renewal management in high-density live-in environments, thereby validating the empirical generalizability and structural stability of the subsequent statistical modeling.
Because the self-reported questionnaire data for both the construction risk factors and construction risk characteristics were harvested from a single survey source, the empirical sample may be susceptible to common method bias (CMB). To rigorously detect and control for potential common method variance, two distinct statistical diagnostic remedies were executed in accordance with the procedural and statistical protocols recommended by Podsakoff et al. [32]. First, Harman’s single-factor test was performed by entering all 43 observed items from the optimized framework into an unrotated exploratory factor analysis (EFA). The mathematical extraction revealed the emergence of nine distinct factors with eigenvalues greater than 1.0, which perfectly aligns with the nine theoretical latent dimensions developed in this study. Crucially, the first principal factor accounted for only 26.84% of the total variance. Because this variance explanation is substantially below the critical academic threshold of 50.0%, it demonstrates that no single latent variable dominates the covariance structure. Second, a confirmatory factor analysis (CFA) single-factor verification was conducted as a more stringent test, wherein all 43 measurement items were forced to load onto a single, overarching latent construct. This single-factor model exhibited an exceptionally poor and unacceptable statistical fit to the empirical data (CMIN/DF = 6.915, RMSEA = 0.138, GFI = 0.412, CFI = 0.456, TLI = 0.401), proving to be fundamentally incompatible with the data compared to our proposed multi-dimensional measurement structures. Taken together, these dual diagnostic results mathematically confirm that common method variance is not a pervasive threat in this study, thereby guaranteeing the structural validity and unbiased integrity of the subsequent structural equation modeling path estimations.

4.2. Theoretical Hypotheses and Model Specification Rationale

The structural specification linking the five construction risk dimensions to the four risk characteristics is rooted in the classical “Causal Antecedent–Profile Manifestation” paradigm of engineering risk appraisal and socio-technical systems theory. Within this integrated framework, the five exogenous risk dimensions, namely personnel risk (A1), material and equipment risk (A2), technical risk (A3), management risk (A4), and environmental risk (A5), represent the operational and physical infrastructure sources where engineering deficiencies and human errors originate. Conversely, the four endogenous latent variables, including risk probability (B1), consequence severity (B2), control difficulty (B3), and exposure degree (B4), represent the multi-dimensional evaluative attributes that collectively define the total risk profile of a project under ISO 31000 guidelines. Linking these five source dimensions to the four manifestation characteristics allows this study to break away from traditional linear or single-index risk evaluation. It explicitly models how operational failures within specific socio-technical dimensions systematically alter, amplify, or suppress different attributes of the project’s safety boundaries, transforming descriptive risk listings into an interactive structural pathway analysis based on the overarching model layout discussed in Section 5.1.
To guide the empirical verification and provide an explicit baseline before conducting model testing, twenty distinct research hypotheses are systematically formulated and grouped into five overarching theoretical paths. These paths, along with their core conceptual descriptions and theoretical justifications, are structurally consolidated in Table 6.

4.3. Reliability Analysis

Reliability analysis is a statistical method used to evaluate the consistency and stability of measurement tools, such as questionnaires and scales. This method is primarily applied to verify the degree of consistency among various items in a questionnaire or scale. Reliability analysis represents a critical step for measuring the reliability of research instruments in psychology, sociology, and behavioral research. The Cronbach’s Alpha coefficient is the most common reliability indicator. A higher value indicates stronger internal consistency of the scale. Conversely, a lower value indicates poorer consistency of the scale. Generally, a Cronbach’s Alpha coefficient greater than 0.7 indicates that the questionnaire or scale has acceptable reliability. A coefficient greater than 0.8 indicates high reliability.
The Cronbach’s Alpha coefficient is selected as the primary indicator for reliability testing in this study. In the process of reliability testing, reliability analysis is performed on all dimensions and the overall scale using SPSS 27.0 statistical software. The Cronbach’s Alpha coefficient for each dimension is obtained through this analysis. In this analysis, Table 7 shows that the reliability coefficients of the overall scale and each sub-dimension fall within the range of 0.8 to 1.0 for both construction risk factors and construction risk characteristics of old residential communities. Therefore, these results indicate that the scales utilized in this study possess a high level of reliability. These instruments can reliably reflect the relevant characteristics of the research subjects.

4.4. Validity Analysis

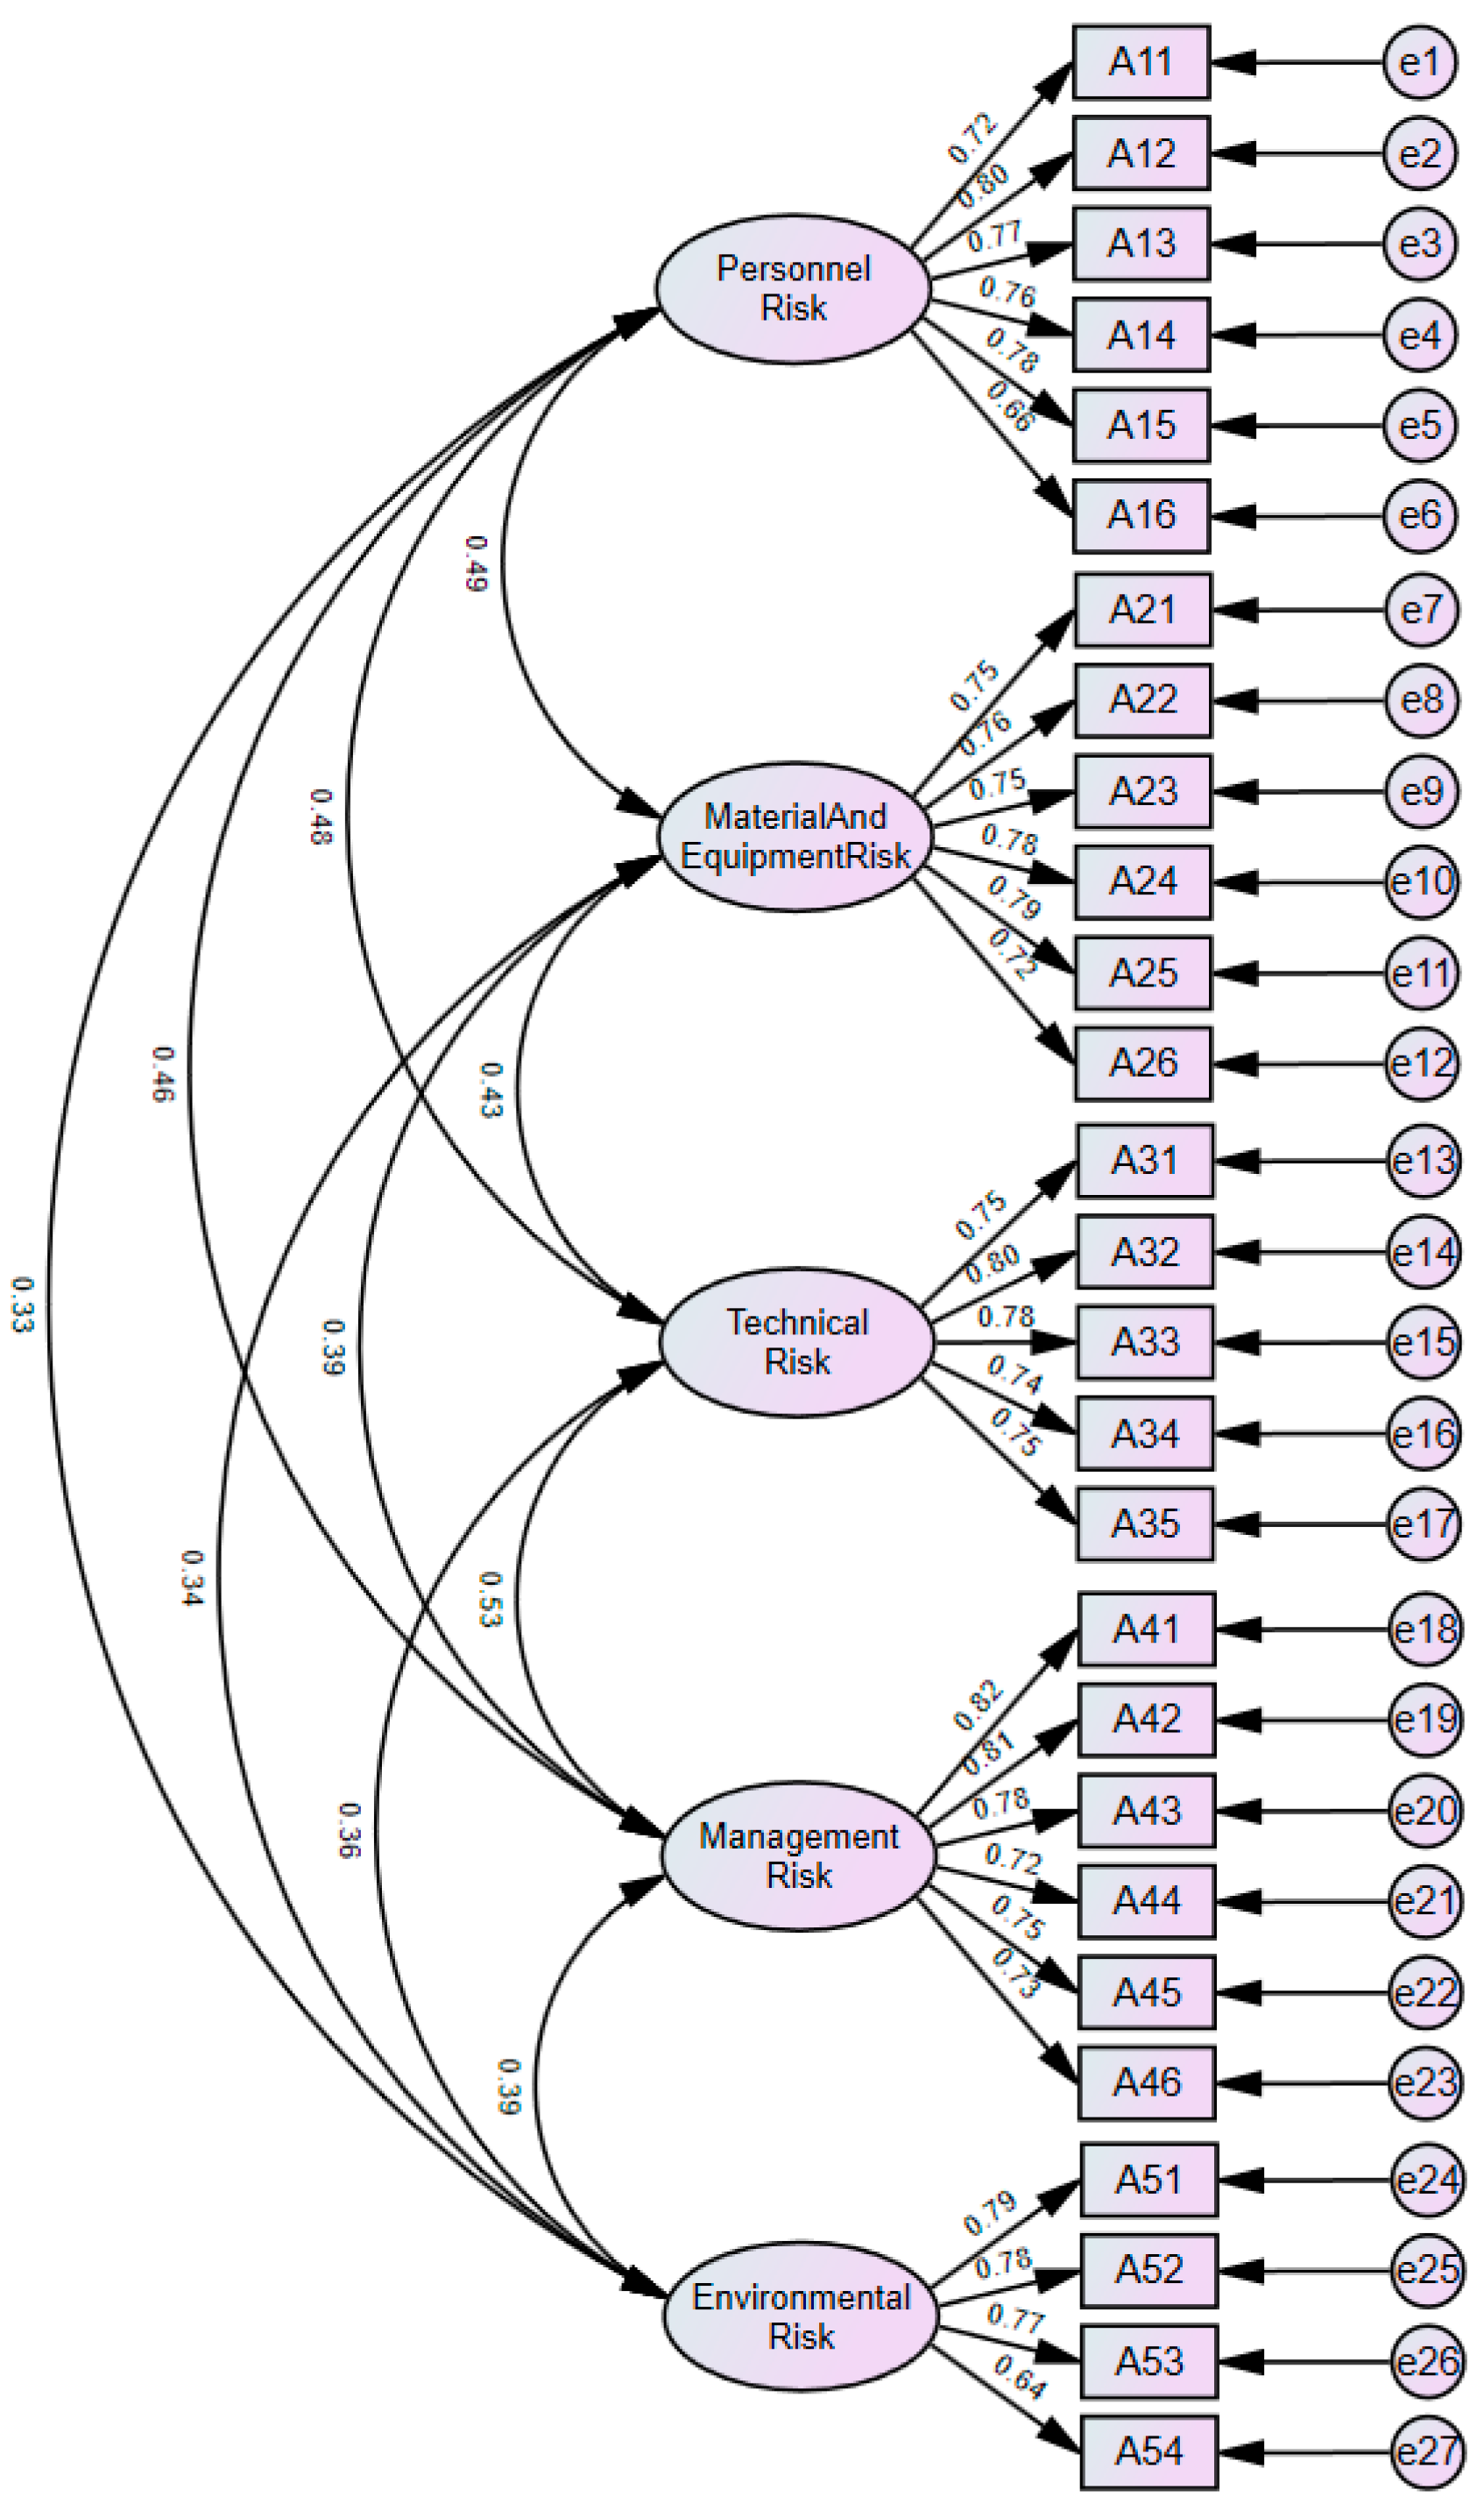
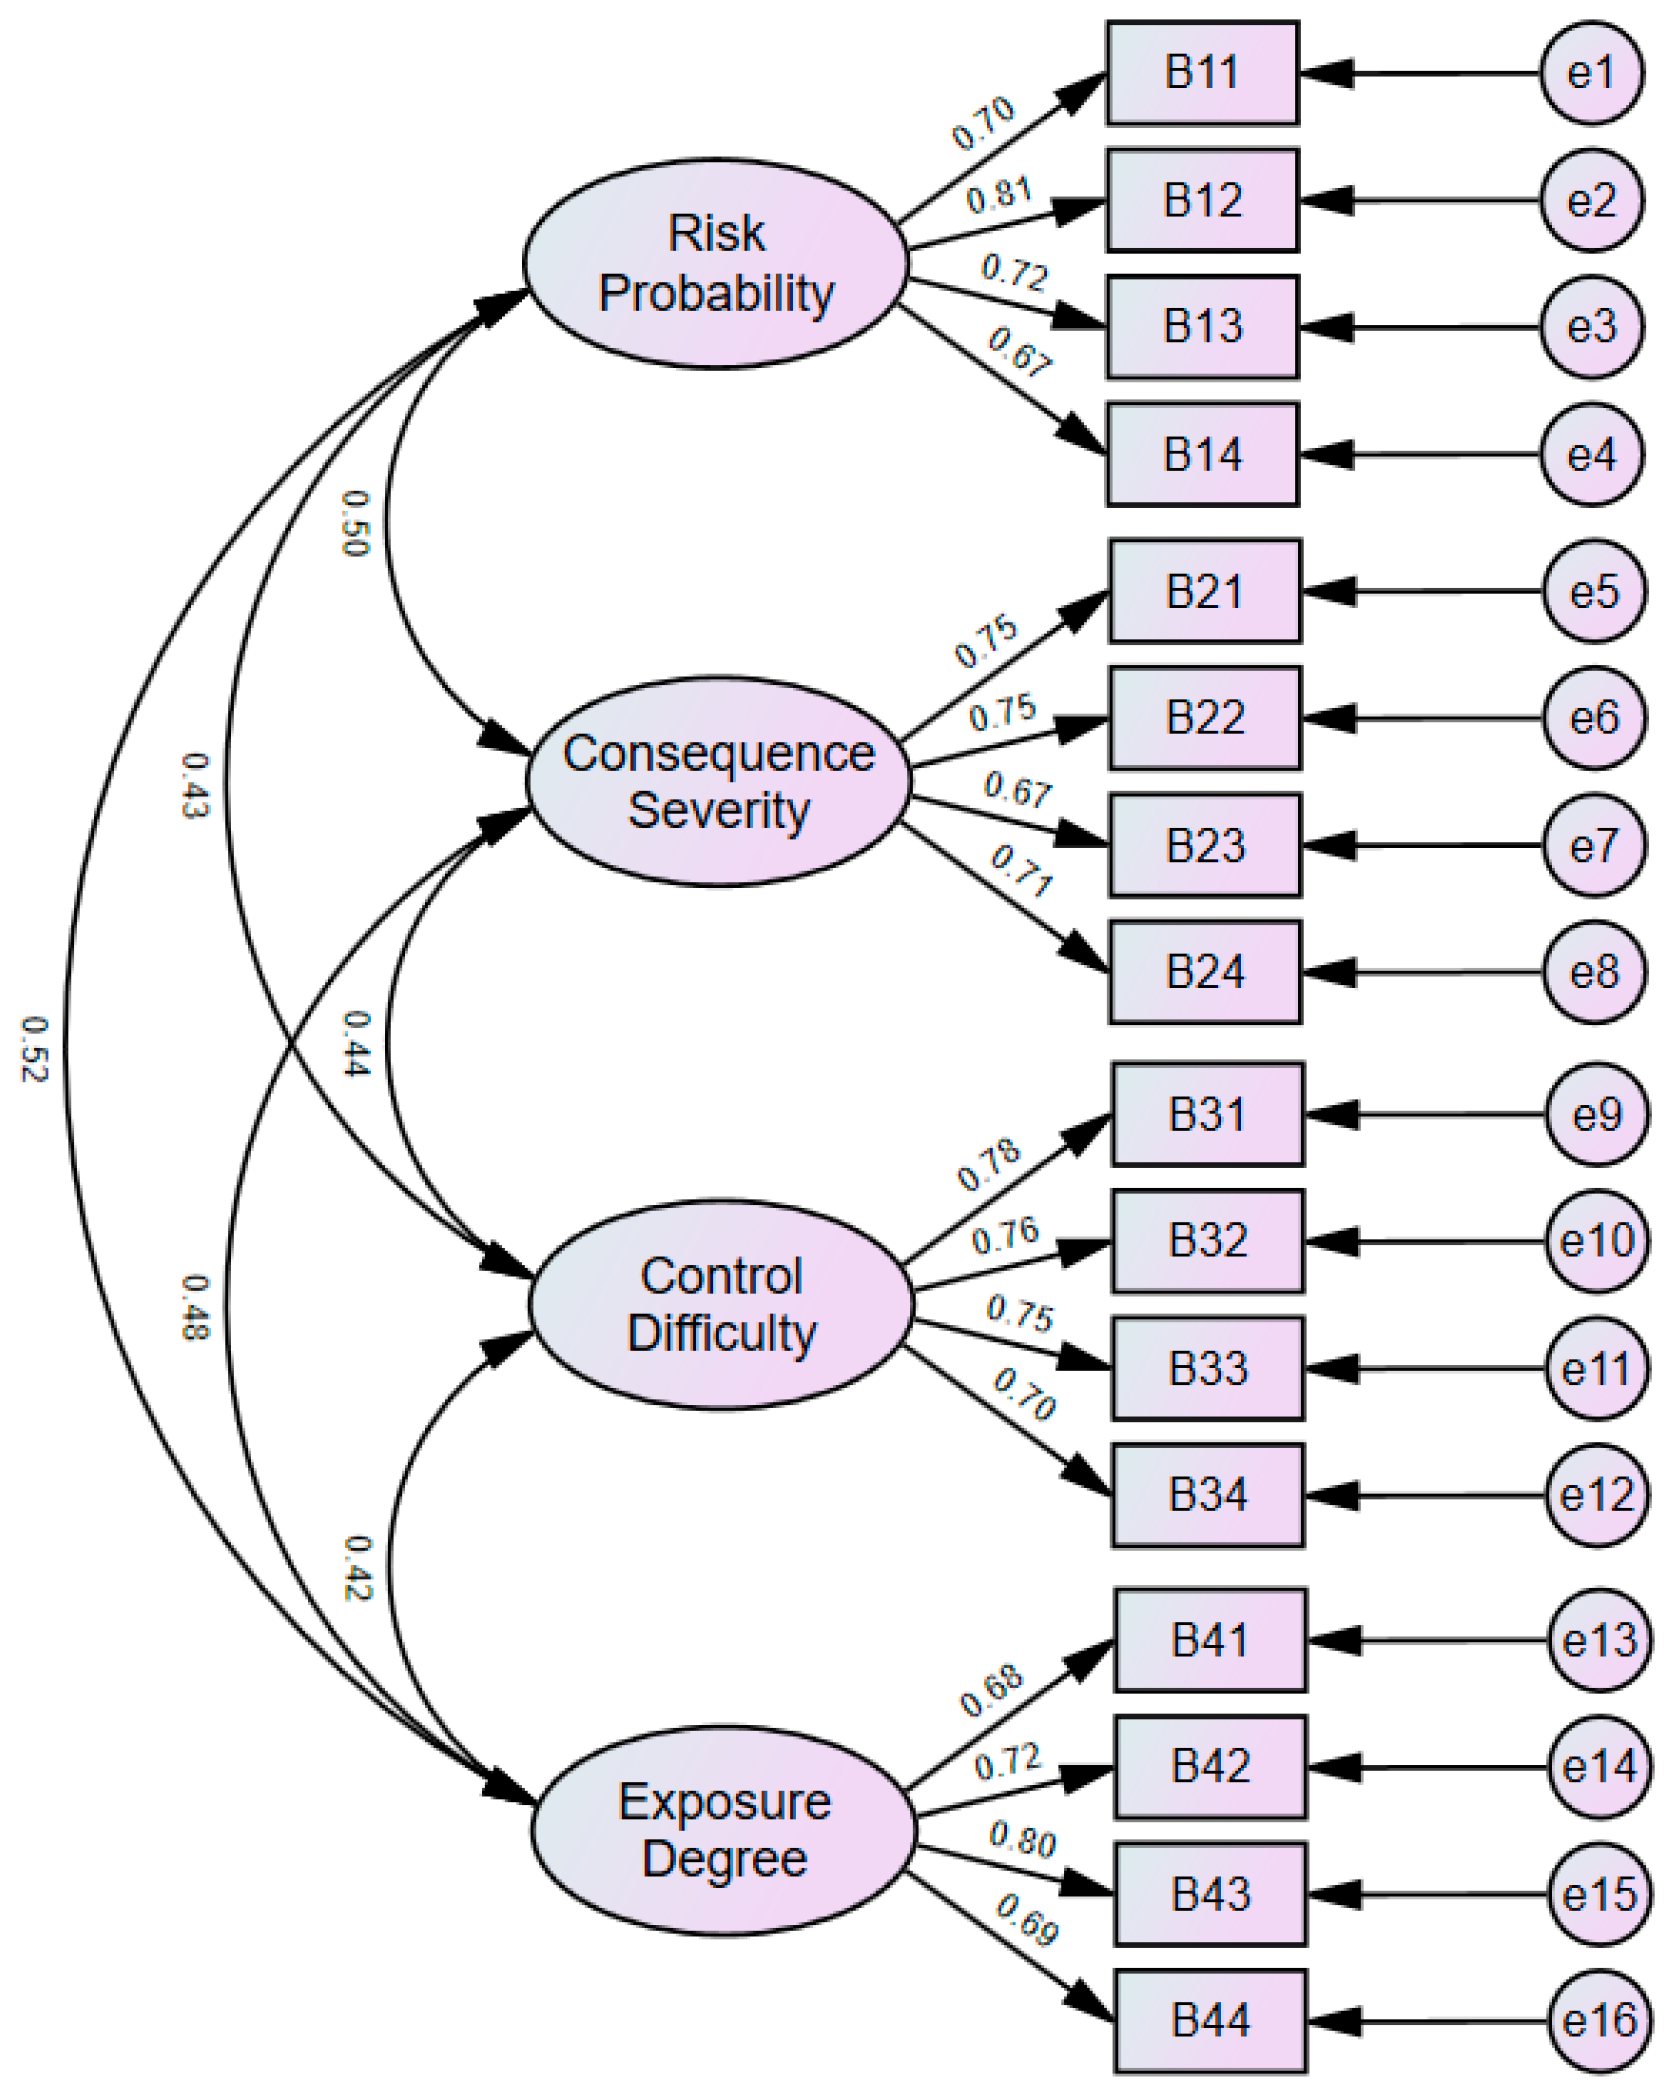
The data collected from the questionnaires were imported into AMOS 23.0 software. A first-order Confirmatory Factor Analysis (CFA) model for construction risk factors (Figure 1) and a first-order CFA model for construction risk characteristics (Figure 2) of old residential communities were established. According to the model fit results, no negative error variances were found in either CFA model. The standardized coefficients and error terms were all within acceptable ranges, thereby passing the offending estimate check.
According to the model fit test results in Table 8 and Table 9, the CMIN/DF (chi-square to degrees of freedom ratio) for the first-order CFA model of construction risk factors is 1.643, and that for construction risk characteristics is 1.489. Both ratios fall within the recommended range of 1 to 3. The Root Mean Square Error of Approximation (RMSEA) values are 0.043 and 0.034, which are within the excellent range of less than 0.05. The Standardized Root Mean Square Residual (SRMR) values are 0.0421 and 0.0385, also within the excellent range of less than 0.05. The Parsimonious Goodness-of-Fit Index (PGFI) values are 0.750 and 0.685, exceeding the acceptable threshold of 0.5. Furthermore, the test results for the Tucker–Lewis Index (TLI), Goodness-of-Fit Index (GFI), and Comparative Fit Index (CFI) all reached excellent levels above 0.9. Therefore, the comprehensive results indicate that both first-order CFA models exhibit good goodness-of-fit indices. The models are reasonable and require no further modification.
On the premise that both the risk factor CFA model and the risk characteristic CFA model exhibit a high goodness-of-fit, the convergent validity (Average Variance Extracted, AVE) and composite reliability (CR) of each dimension in the scale will be further examined. In the testing process, the standardized factor loadings of each measurement item on its corresponding dimension are calculated through the established CFA models. Subsequently, the convergent validity values and composite reliability values for each dimension are computed using the calculation formulas for AVE and CR. According to established academic standards, a minimum threshold of 0.5 for the AVE value and 0.7 for the CR value is required to demonstrate acceptable convergent validity and composite reliability.
The calculation formulas are expressed as follows:
A V E = i = 1 n λ i 2 n
C R = i = 1 n λ i 2 i = 1 n λ i 2 + i = 1 n ( 1 λ i 2 )
As demonstrated in Table 10 and Table 11, in this validity testing of construction risk factors and risk characteristics for old residential communities, the AVE values all exceed 0.5, and the CR values all exceed 0.7. Taken together, these findings indicate that all dimensions within the two first-order CFA models possess satisfactory convergent validity and composite reliability.
According to the analysis results presented in Table 12 and Table 13, in this discriminant validity testing, the standardized correlation coefficients between any two dimensions are all lower than the square root of the AVE for each respective dimension. This demonstrates that all dimensions possess satisfactory discriminant validity.
To further fortify the assessment of discriminant validity through a more rigorous and contemporary psychometric approach, the Heterotrait–Monotrait Ratio of Correlations (HTMT) analysis was explicitly performed in strict accordance with the criteria set by Henseler et al. [31]. The HTMT approach serves as an advanced alternative variance-based test that addresses potential sensitivity limitations inherent in the classical Fornell-Larcker matrix. Methodologically, an HTMT value lower than the conservative baseline threshold of 0.85 implies that the operationalized latent constructs are conceptually distinct and clear of multi-collinearity overlaps.
The empirically derived HTMT values based on the 350 valid responses for the five exogenous risk factor dimensions are structurally consolidated in Table 14, while the HTMT values for the four endogenous risk characteristic dimensions are compiled in Table 15.

4.5. Descriptive Statistics and Normality Test

Table 16 presents the descriptive statistical analysis and normality test results of the current status of the factors used in this study. Formally evaluating the central tendencies reveals that the overall mean scores of all risk dimensions and risk characteristics uniformly plateau within a tight, medium-to-high range between 3.2 and 3.5 on the 5-point positive Likert scale. This specific psychometric distribution reflects the distinct socio-technical operational realities inherent in old residential community renovation projects. On one hand, the baseline risk perceptions stay consistently above the absolute median line (Mean > 3.0) because urban retrofitting operates within highly dense, “occupied brownfields” where tight physical spaces, archaic underground pipelines, and continuous multi-trade cross-operations directly intersect with the daily movements of local residents, maintaining a high baseline level of perceived field hazards among practitioners. On the other hand, these scores do not spike into an uncontrollable panic zone (Mean ≥ 4.0) due to the strict enforcement of standardized construction safety protocols, mandatory daily morning briefings, and intensive third-party supervision mandated by localized regulatory authorities, which establishes an institutional safety cushion that stabilizes practitioner risk expectations. Crucially, this descriptive characteristic—where responses are securely anchored around the upper-middle spectrum without suffering from extreme ceiling or floor distortions—preserves a healthy level of sample variance across all measurement items. This robust underlying data structure provides the essential mathematical foundation and statistical power for the subsequent structural equation modeling path analysis, ensuring sufficient model sensitivity to effectively deconstruct and isolate the non-linear structural dependencies, such as the asymmetric management-driven risk amplification mechanisms and personnel triggering chains validated in subsequent sections.
The normality test for each measurement item was conducted using skewness and kurtosis. According to the criteria proposed by Kline [46], data can be considered to satisfy the requirements of an approximate normal distribution if the absolute value of the skewness coefficient is within 3 and the absolute value of the kurtosis coefficient is within 8. As demonstrated by the analysis results in Table 16, the absolute values of the skewness and kurtosis coefficients for all measurement items in this study fall well within the standard thresholds. Therefore, it can be concluded that the data for all measurement items satisfy the assumption of an approximate normal distribution.

4.6. Correlation Analysis

In this section, a Pearson correlation analysis was conducted to perform an exploratory analysis of the correlation relationships among the variables. According to the analysis results presented in Table 17, statistically significant correlations exist among all variables in this study. Furthermore, these correlations are all highly significant at the 0.01 significance level (p < 0.01). Based on the correlation coefficients, the correlation coefficient (r) between any two variables is greater than 0. Taken together, these findings demonstrate that all variables in this analysis exhibit significant positive correlations with one another.

5. Structural Equation Modeling (SEM)

5.1. Model Fit Test for the Construction Risk SEM in Old Residential Community Renovation Projects

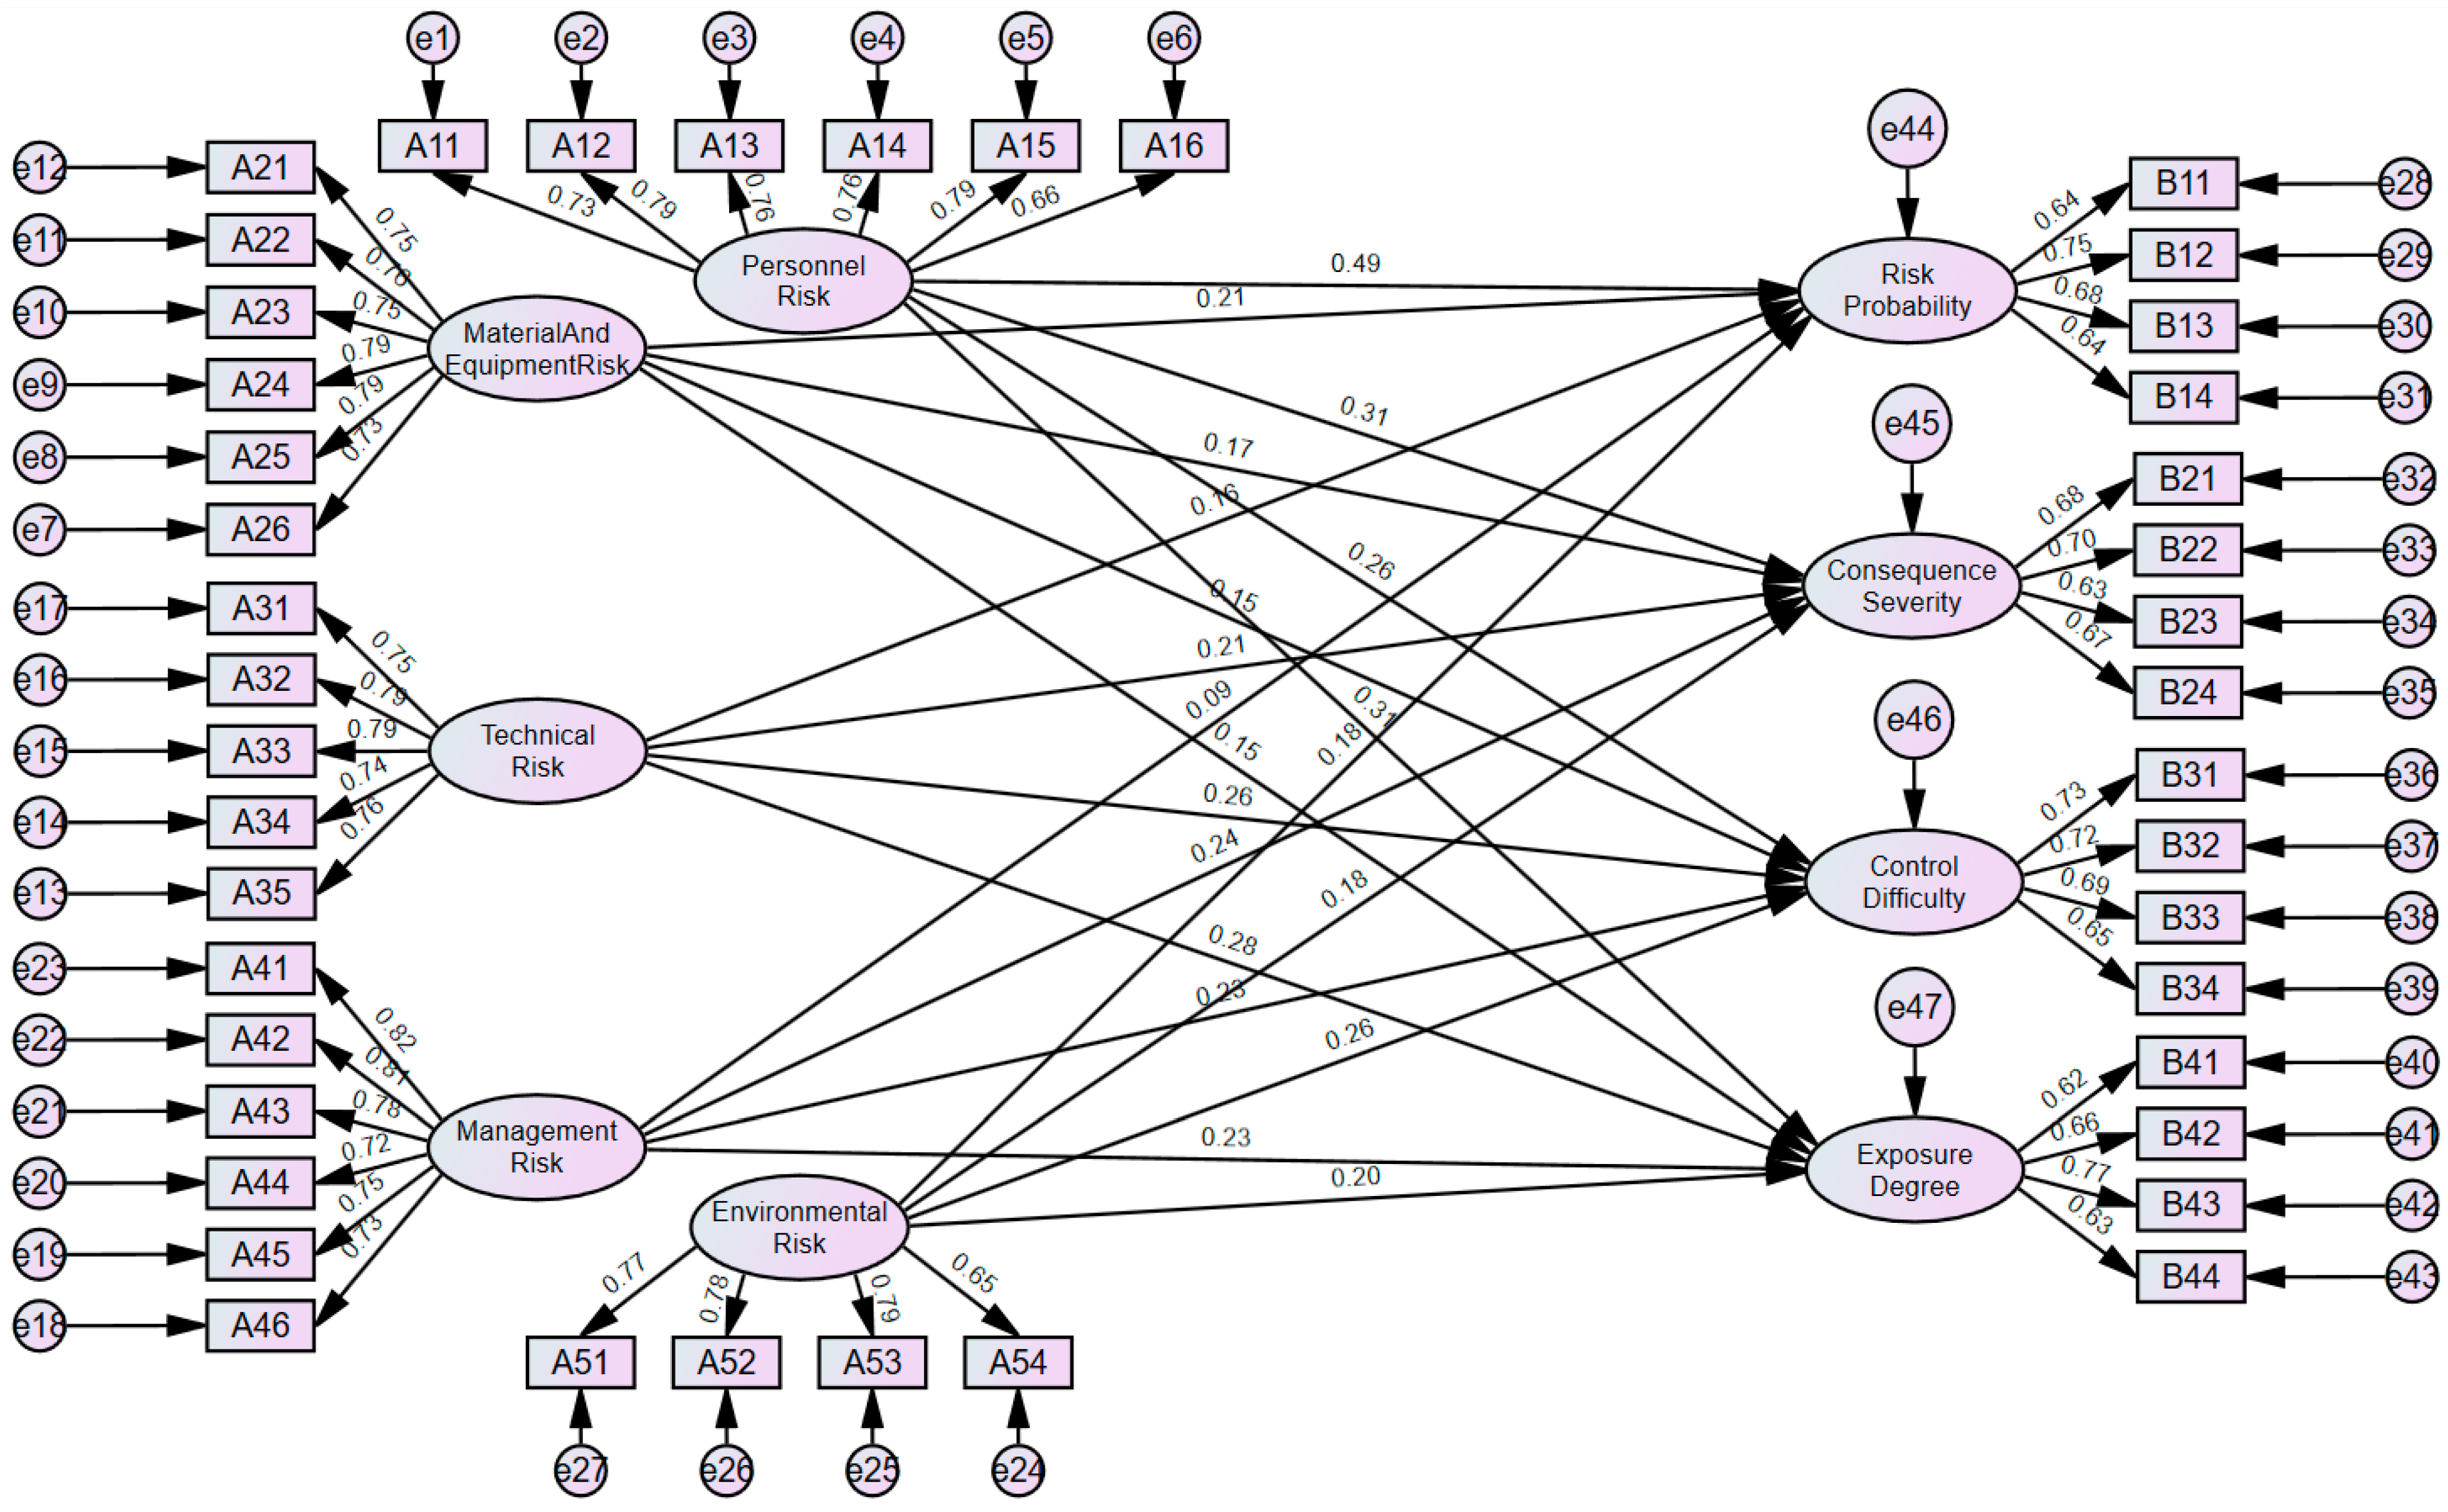
To examine the impact paths of construction risk factors on construction risk characteristics in old residential community renovation projects, this study constructed a structural equation model (hereinafter referred to as the “Risk Factor-Characteristic SEM Model,” as illustrated in Figure 3). To evaluate the overall goodness-of-fit of the model, multiple statistical indicators were comprehensively considered. As summarized in Table 18, the primary fit indices of the model are CMIN/DF = 1.781, GFI = 0.825, TLI = 0.906, CFI = 0.913, RMSEA = 0.047, and SRMR = 0.049. Regarding the GFI indicator, although its value falls marginally below the ideal threshold of 0.9, according to the evaluation criteria recommended by Hair et al. [9], Bagozzi and Yi [29], and Kline [46], fit indices should be assessed holistically rather than in isolation when dealing with highly complex empirical models. This marginal GFI is mathematically penalized by the model’s substantial parameter scale (5 antecedents and 4 attributes parsed simultaneously) and the inherent sample heterogeneity spanning both routine small- and medium-scale repairs and hazardous, large-scale operations. To optimize this absolute fit in subsequent model deployments without altering the verified structural hypotheses, researchers can utilize computed Modification Indices (MI) to selectively release the residual covariances of measurement items nested strictly within the same latent construct, thereby absorbing localized semantic overlap and driving the GFI toward the 0.90 threshold while strictly preserving the integrity of the baseline framework. As long as the core alternative fit indices—such as CMIN/DF, RMSEA, SRMR, and CFI—demonstrate robust performance, the structural model is deemed to possess an acceptable and statistically meaningful goodness-of-fit. In this empirical study, CMIN/DF < 3, RMSEA < 0.05, SRMR < 0.05, and both TLI and CFI comfortably exceed the strict benchmark of 0.9, indicating that the overall goodness-of-fit of the proposed model fully satisfies the rigorous scientific requirements of empirical statistical analysis.

5.2. Hypotheses Testing Results of Path Relationships in the Risk Factor-Characteristic SEM

The empirical pathway relationships and standardized parameter estimates calculated through the “Risk Factor-Characteristic” SEM are systematically compiled in Table 19, directly validating the 20 research hypotheses formulated in Section 4.2. The structural path analysis reveals that 19 out of the 20 individual hypotheses are statistically supported at the p < 0.05 level or higher, with only one structural path failing to reach statistical significance. Specifically, for hypothesis group H1, personnel risk (A1) manifests a dominant positive driving influence across the entire risk profile, significantly validating H1a (risk probability, β = 0.465, p < 0.001), H1b (consequence severity, β = 0.304, p < 0.001), H1c (control difficulty, β = 0.270, p < 0.001), and H1d (exposure degree, β = 0.272, p < 0.001), which establishes human behavior as the primary trigger and path amplifier within the project execution ecosystem. For hypothesis group H2, material and equipment risk (A2) presents a relatively weak yet statistically stable positive effect on the multi-dimensional risk attributes, supporting H2a (β = 0.173, p < 0.001), H2b (β = 0.145, p = 0.005), H2c (β = 0.139, p = 0.008), and H2d (β = 0.113, p = 0.013), indicating a controlled baseline variation due to modern access regulations. Testing of hypothesis group H3 demonstrates that technical risk (A3) exerts powerful driving paths on the risk profile, supporting H3a (β = 0.128, p = 0.007), H3b (β = 0.177, p < 0.001), H3c (β = 0.234, p < 0.001), and H3d (β = 0.211, p < 0.001), showing that technical schema flaws severely hinder situational control and intensify exposure boundaries. Crucially, within hypothesis group H4, management risk (A4) manifests a distinct asymmetric effect: sub-hypothesis H4a (management risk → risk probability) yields a non-significant critical ratio (β = 0.072, C.R. = 1.519, p = 0.129), leading to the formal rejection of H4a, whereas H4b (β = 0.207), H4c (β = 0.215), and H4d (β = 0.176) are highly supported (p < 0.001). This mathematically indicates that management-level omissions act as latent risk amplifiers rather than immediate triggers. Lastly, hypothesis group H5 is fully confirmed, as environmental risk (A5) exerts its most potent positive impact on control difficulty (β = 0.282, p < 0.001), while strongly driving probability (H5a, β = 0.176, p = 0.003), severity (H5b, β = 0.180, p = 0.004), and exposure (H5d, β = 0.182, p = 0.001), confirming that rigid spatial bottlenecks establish a major boundary constraint on operational safety limits.

6. Discussion

6.1. Overview of Research Findings

Based on the constructed combined Correlation–SEM approach for the coupled risk measurement framework, this chapter systematically analyzes the driving mechanisms of five major dimensions—personnel, material and equipment, technical, management, and environmental risks—on the construction risk characteristics (risk probability, consequence severity, control difficulty, and exposure degree) of old residential community renovation projects. Through the analysis of path coefficients within the structural equation model, the empirical findings demonstrate that personnel risk (A1) serves as the core driving source of construction risk evolution, exhibiting the strongest positive effect across all dimensions of risk characteristics and fully validating hypothesis group H1 (H1a through H1d). Furthermore, management risk (A4) demonstrates a significant asymmetric effect across the network; specifically, its direct inducing effect on risk probability (B1) is not statistically significant, leading to the formal rejection of hypothesis H4a, whereas it exerts a powerful, systemic amplification effect on risk consequences (B2), control difficulty (B3), and exposure degree (B4), fully confirming hypotheses H4b, H4c, and H4d. Lastly, technical risk (A3) and environmental risk (A5) present strong constraint characteristics on control difficulty (B3), fully supporting hypotheses H3c and H5c, while material and equipment risk (A2) displays a relatively weak overall effect across the empirical network, validating hypothesis group H2. Taken together, the transitioning patterns among these risk attributes reveal the non-linear coupling and differentiation mechanisms among multiple risk dimensions during the formation of construction risks, thereby providing robust empirical support for the refined governance of construction risks in old residential community renovation projects.

6.2. Theoretical Implications of Core Findings

6.2.1. Core Driving Mechanism of Personnel Risk

The empirical path estimations demonstrate that personnel risk (A1) exhibits the dominant positive impact across all analyzed structural links, directly validating the entire hypothesis group H1 (H1a, H1b, H1c, and H1d), which is highly consistent with the established research paradigms in construction safety management. Han et al. [28] and Choudhry and Fang [26] emphasized that the unsafe behaviors of construction personnel and cognitive misalignments represent the most direct and active risk-inducing factors leading to safety accidents on site; their studies further revealed the underlying logic through which individual cognitive limitations and behavioral choices translate into unsafe acts via complex pathways.
From the perspective of project management practice, this overwhelming path strength can be directly attributed to the industry’s deeply entrenched multi-tiered subcontracting structure and severe schedule compression typical of politically driven urban renewal initiatives. To meet rigid government deadlines, project managers frequently compress operational timelines, which inevitably induces cognitive fatigue, selective attention, and a high tolerance for minor non-compliance among frontline workers. Because old residential community renovations are heavily reliant on manual labor rather than automated heavy machinery, the safety margin of the entire project rests almost entirely on individual behavioral reliability. Under the friction of cross-operational scheduling where multiple trades occupy the same narrow scaffolding simultaneously, any minor behavioral slip or uncoordinated action by an uncertified worker instantly bypasses formal institutional defenses, immediately manifesting as an active site hazard and driving up both probability and consequence severity. This confirms that within the construction risk transmission chain, the personnel factor acts not only as a primary event trigger (H1a) but also as a vital structural path amplifier (H1b, H1c, and H1d) [25,28].

6.2.2. Asymmetric Amplification Mechanism of Management Risk

The empirical path estimations demonstrate that management risk (A4) exhibits a non-significant direct impact on risk probability (B1) (p = 0.129), resulting in the formal rejection of hypothesis H4a, but it exerts a highly resilient positive impact on consequence severity (B2), control difficulty (B3), and exposure degree (B4), systematically validating hypotheses H4b, H4c, and H4d. This conclusion confirms that management-level deficiencies (such as deviations in coordination, weak supervision, and superficial safety training) are not the immediate triggers of accidental site hazards; however, by weakening the organization’s capacity for mid-event intervention and collaborative mitigation, they structurally elevate the hazard level of risks once manifested. In terms of project management practice, this mathematical asymmetry uncovers a critical operational reality: formal safety management documentation, rigid institutional protocols, and superficial pre-job briefings cannot directly stop a worker from dropping a tool or stepping across a safety boundary in a dynamic, rapidly changing workspace, which explains the statistically non-significant link to direct risk occurrence probability. However, the true essence of project management manifests as a robust organizational shield after a hazard is initiated. When management systems suffer from structural deficiencies—such as a lack of real-time joint communication channels between the contractor, the municipal supervisor, and the community property management—the organization becomes paralyzed during an active crisis. Gaps in cross-organizational alignment mean that emergent hazards cannot be contained at the micro-level, safety wardens fail to execute immediate situational shutdowns, and local community residents cannot be efficiently evacuated or shielded from the danger zone. Consequently, a minor localized incident is systematically allowed to cascade into a widespread project crisis, exponentially inflating the ultimate loss severity, expanding the resident exposure boundaries, and severely increasing the post-event control difficulty. This aligns with the multi-stage risk transmission path theory embedded in the ProCRiM model proposed by Qazi et al. [8] and the collaborative network governance frameworks highlighted by Shen et al. [6], emphasizing the fundamental distinction between risk triggering (H4a) and risk amplification mechanisms (H4b–H4d). Distinct from the traditional management mode that emphasizes rigid compliance over responsiveness, this study suggests that managers should adopt a collaborative prevention and control strategy of “proactive personnel intervention (H1) + dynamic management mitigation (H4b–H4d)” [5,6].
Crucially, to enrich the theoretical interpretation of this differentiated action mechanism, a deeper speculative analysis of the interactive and mediating relationships between management risk and the remaining four risk dimensions must be articulated. Within the interconnected socio-technical fabric of urban renewal sites, management risk acts not as an isolated variance silo, but rather as a latent mediating conduit and structural risk converter that dictates how other hazards propagate. On one hand, regarding its interaction with personnel risk (A1), management risk serves as a sequential mediator in the primary causal chain; while human behavioral slips act as the immediate dynamic ignition, a systemic failure in routine supervisory presence or superficial safety education creates a passive organizational void that fails to intercept or rectify these frontline human errors, effectively channeling them into severe consequence outcomes. On the other hand, management risk functions as an operational transmission mediator for technical risk (A3) and environmental risk (A5). The archaic underground utility webs and tight physical dimensions of an occupied community are rigid, immutable site boundaries; however, a deficiency in agile managerial coordination or dynamic adaptive scheduling effectively catalyzes these physical constraints, indirectly converting static structural challenges and space constraints into acute post-event control difficulties and heightened resident exposure boundaries. Even for the relatively stable material and equipment risk (A2), a lapse in managerial access checks acts as a critical permissive node that allows supply chain defects to bypass site gatekeeping. Therefore, the mathematical essence of management risk lies in its overarching multi-path indirect mediation, structurally linking latent technical, human, and physical inputs to the final cascading severity profile of the urban renewal ecosystem.

6.2.3. Coupling Effects of Technical and Environmental Constraints

The structural verification shows that technical risk (A3) exhibits a profound driving impact on control difficulty (B3) and exposure degree (B4), supporting hypotheses H3c and H3d, whereas environmental risk (A5) manifests a particularly prominent influence on control difficulty (B3), strongly validating hypothesis H5c. Both dimensions also significantly influence probability and severity, supporting H3a, H3b, H5a, and H5b. This empirical pattern can be explicitly attributed to the dual “technical-spatial” constraints inherent in old residential community renovations: defects in technical schemes (such as lagged identification of hazardous and large-scale operations or inappropriate rework handling) increase the difficulty of coping with complex situations [10], while environmental constraints—such as restricted physical space in the community, high population density, and meteorological uncertainties—severely limit the operational room for risk prevention and control measures.
When translated into project management practice, these high structural weights reflect the intense “brownfield friction” that distinguishes urban retrofitting from traditional greenfield construction. Project managers are forced to operate within an extremely compressed urban footprint that leaves almost zero tolerance for structural errors. Technical schemes, such as installing external elevators or deep foundation structural reinforcement, must cut directly into archaic, undocumented underground municipal pipeline networks. Because historical blueprints are frequently inaccurate, engineering teams must constantly execute dynamic, ad hoc design modifications on-site. This technical fluidness is heavily penalized by the rigid environmental constraints of an occupied neighborhood; there is simply no physical space available for material staging, large crane setups, or clear safety exclusion zones. Any mismatch in the technical scheme triggers immediate engineering rework, which logistically chokes the narrow communal thoroughfares, creates immense coordinate friction with the overlapping daily movements of local residents, and generates an operational bottleneck where control difficulty increases exponentially. As discussed by Huo et al. [7] in their research on retrofitting project risks under green development, the trade-off between technical feasibility and physical space operability can easily trigger a chain reaction: “technical scheme mismatch (H3) → intensified spatial constraints (H5) → risk out of control.” This requires that physical adaptability to the neighborhood site and systemic safety boundaries must be proactively considered during the scheme design stage, thereby dampening the risk escalation paths validated under these coupling groups [7,23].

6.2.4. Analysis of the Relatively Weak Effect of Material and Equipment Risk

In contrast to the socio-behavioral dimensions, material and equipment risk (A2) displays a relatively low parameter weight across all empirical paths, confirming the baseline driving assumptions formulated under hypothesis group H2 (H2a through H2d). This may be because current old residential community renovation projects primarily consist of routine small- and medium-scale repairs, where the predictability and controllability of the construction material supply chain and routine logistics are high. Meanwhile, the continuous tightening of construction material market access standards, standardization guidelines (such as ISO 31000) [39], and equipment inspection systems in China in recent years has effectively suppressed risk variations in this dimension.
From a project management standpoint, this statistical weakness reflects the high level of institutional standardization and industrial maturity achieved in modern supply chain management. In the current housing renovation sector, key construction components, standard piping, structural concrete, and scaffolding equipment are heavily regulated by municipal procurement systems and subject to strict mandatory access checks prior to site entry. Because the quality variance of these core physical inputs has been effectively normalized across the market, material and equipment anomalies rarely act as a highly volatile or unpredictable differentiator of overall project safety performance. While on-site managers must maintain baseline vigilance during highly specialized operations—such as green facility integration or localized structural underpinning—the standardized nature of modern material logistics allows project management resources to be safely reallocated away from this stable sector and focused heavily on the highly unpredictable human and organizational risks, maintaining the statistical validity of the pathways within group H2 [13,22].
Crucially, to enhance the practical guiding value of these empirical insights, a granular cross-scenario investigation must be executed to unpack the distinctive risk heterogeneity operating beneath this globally weak statistical baseline. The overarching low path coefficient verified in the SEM is heavily driven by the demographic dominance of conventional renovation scenarios within the broader market portfolio. For routine, superficial interventions such as exterior facade repainting, thermal envelope upgrades, and surface-level utility line replacements, materials are highly standardized, highly predictable, and insulated from volatile failure paths. However, an acute risk polarization occurs when transitioning into large-scale structural renovation scenarios, such as localized structural underpinning, deep foundation reinforcement, and the mechanical addition of external elevator shafts. In these intensive structural demand scenarios, material and equipment risk (A2) undergoes a severe scale-up in hazard potential, presenting highly concentrated, non-linear threats. These deep transformations necessitate the deployment of heavy specialized machinery (e.g., compact micro-piling rigs, specialized hoisting cranes) within exceptionally confined spatial boundaries, while utilizing bespoke, high-consequence components like heavy structural steel members and specialized elevator mechanical systems. Under these high-intensity settings, any microscopic defect in component manufacturing, latent material fatigue, or minor malfunction in specialized machinery can bypass routine site checks and directly induce severe structural settlements or catastrophic collapse hazards. This stark operational dichotomy requires project managers to implement a differentiated risk governance matrix, maintaining a standardized, cost-efficient tracking posture during conventional surface repairs, while immediately switching to an exhaustive, zero-tolerance quality assurance protocol the moment the renewal portfolio upgrades into intensive structural transformations.

6.3. Theoretical Dialogue with Existing Research

By utilizing the coupled pathway of “correlation coefficient screening + SEM path validation,” this study expands the existing research paradigm in engineering management. Compared with traditional methods that simply rank risk factors or barriers using descriptive statistics, static index systems, or independent factor analysis, this study empirically distinguishes three types of risk-driving mechanisms for the first time, each explicitly derived from the unique mathematical configurations and statistical signatures observed within the SEM path analysis results in Table 19.
Specifically, the “triggering” mechanisms are derived from the absolute statistical dominance of Personnel Risk (A1) in directly driving Risk Probability (B1), yielding the highest path coefficient across the entire structural model (β = 0.465, p < 0.001) and proving that socio-behavioral failures act as the active primary spark that initiates the risk sequence. In contrast, the “amplifying” mechanisms are derived directly from the structural asymmetry verified under Management Risk (A4), whose path to direct occurrence probability is statistically non-significant (β = 0.072, p = 0.129), yet its systemic path weights targeting downstream consequence attributes—including severity (β = 0.207), difficulty (β = 0.215), and exposure (β = 0.176)—are highly supported (p < 0.001). This specific statistical signature represents a classic organizational amplifier that remains dormant during initiation but exponentially inflates the risk volume once a failure is triggered. Lastly, the “constraining” mechanisms are derived from the distinct localization of Technical Risk (A3) and Environmental Risk (A5) effects, which concentrate their maximum path weights heavily on Control Difficulty (B3, β = 0.234 and β = 0.282 respectively), demonstrating that physical brownfield bottlenecks and design deviations function as rigid boundary conditions that choke operational safety limits.
This integrated structural taxonomy reveals the complex, non-linear transmission patterns among risk factors that remain hidden in linear indices. Furthermore, tailored to the specific context of old residential community renovations, this study addresses the limitation of existing construction risk research—which mostly focuses on greenfield projects—through empirical data validation. It highlights the high-weight characteristics of personnel, management, and environmental factors within complex human settlement environments, providing strong empirical support for the contextualized application of the ProCRiM model and structural equation modeling in built environment transformations.

6.4. Practical Recommendations for Project Governance

Based on the research findings, the following differentiated prevention and control strategies are proposed to optimize risk governance and ensure safety in old residential community renovation projects:
  • Application of risk measurement tools: The evaluation index system constructed and validated in this study (Table 3) can serve as a standard tool for project managers to conduct routine risk inspections and precisely identify weak links, thereby achieving a Pareto-optimal allocation of limited regulatory resources based on the verified path weights.
  • Proactive intervention of personnel risk (H1): A warning mechanism based on safety skill access control and real-time dynamic monitoring should be established to facilitate the transformation of construction safety from “post-event accountability” to “pre-event early warning,” directly interrupting the primary triggering path (H1a).
  • Mid-event interruption of management risk (H4b–H4d): The mid-event responsiveness and post-event resilience of management mechanisms should be fortified by establishing a collaborative emergency command system involving the community, supervisors, and construction parties. To ensure swift post-accident recovery and clarify execution, project entities must institutionalize specialized financial reserves for specific hazard typologies, primarily by leveraging Work Safety Liability Insurance (WSLI). This insurance-driven financial mechanism acts as an institutional shield, providing immediate emergency liquidation and dedicated compensation funds to cover third-party bodily injuries, resident temporary relocation costs, and emergency rescue expenses following specific site failures (e.g., scaffolding collapses or falling objects). By securing these dynamic financial buffers, project managers can effectively neutralize the organizational amplification pathways (H4b–H4d), ensuring that localized engineering failures are instantly contained and prevented from cascading into widespread social or financial crises.
  • Source control of technical risk (H3): Digital technologies and Building Information Modeling (BIM) [41] should be utilized to simulate the entire operational process, pre-emptively resolving spatial conflicts and hidden hazards of hazardous and large-scale operations, while assisting in the establishment of a cross-enterprise technical risk expert database to systematically lower control difficulty (B3).
  • Adaptive strategies for environmental risk (H5): Dynamic operational schedules based on spatiotemporal characteristics should be implemented to navigate occupied brownfield friction. The adoption of modular prefabrication techniques is highly recommended to mitigate on-site operational interference, and a collaborative emergency response mechanism under extreme weather conditions should be established to shield the spatial boundaries.

7. Conclusions and Limitations

7.1. Research Summary

Addressing the realistic pain points of complex construction environments and highly coupled risk factors in old residential community renovation projects, this study constructs a systematic risk measurement and analysis framework. By integrating a quantitative analytical pathway of “correlation-based screening” and Structural Equation Modeling (SEM), this research not only effectively deconstructs the structural relationships among five major risk dimensions—personnel, material and equipment, technical, management, and environment—but also deeply quantifies the non-linear driving mechanisms of various risk sources on construction risk characteristics (risk probability, consequence severity, control difficulty, and exposure degree) through a proactive hypothesis-testing framework. The empirical analysis results demonstrate that the model exhibits sound statistical fit robustness and explanatory power [9,46], precisely capturing the logic of risk transmission under complex scenarios and providing a replicable quantitative paradigm for the refined safety governance of urban renewal projects.

7.2. Main Research Conclusions

Based on the empirical parameter estimations, this study confirms that construction-phase hazards in old residential community renovations operate as a coupled, multi-dimensional socio-technical ecosystem where separate antecedents systematically reshape distinct attributes of the project’s vulnerability profile. Specifically, first, Personnel Risk (A1) serves as the dominant core driving source of threat propagation, exhibiting the strongest, most pervasive positive path coefficients across all dimensions of incident characteristics, which fully confirms hypothesis group H1 (H1a through H1d) and marks human behavioral errors as the primary target for early access control and proactive safety containment within the causal chain [26,28]. Second, Management Risk (A4) manifests a distinct asymmetric impact mechanism, characterized by the formal rejection of hypothesis H4a alongside the high statistical validation of hypotheses H4b, H4c, and H4d; its mathematical essence lies not in directly triggering dynamic site failures, but rather in acting as an organizational “threat magnifier” that elevates consequence severity, control difficulty, and exposure degree by undermining the team’s capacity for mid-event intervention and collaborative loss containment [6]. Third, technical and environmental factors establish powerful boundary constraints on site safety, fully supporting hypothesis groups H3 and H5 to reflect the salient “technical scheme-physical space” coupling characteristics, where rigid spatial bottlenecks and lagged technical disclosures severely restrict operational safety limits and generate severe rework hazards [7,10]. Fourth, in comparison, Material and Equipment Risk (A2) presents a relatively low overall contribution under the current renovation context, validating hypothesis group H2 and demonstrating favorable operational controllability due to tight standardized market access controls and standardized guidelines like ISO 31000 [39].

7.3. Theoretical Contributions

The theoretical contributions of this study are primarily reflected at three distinct levels. Methodologically, the combined Correlation–SEM coupled framework proposed and validated in this study effectively overcomes the limitations of traditional factor analysis or static descriptive statistics in resolving complex causal paths among variables, adhering to the multivariate data analysis criteria recommended by Hair et al. [9] and Bagozzi and Yi [29] to provide a fresh, rigorous methodological reference for quantitative path measurement in the field of construction project management. At the theoretical mechanism level, this study empirically defines the three-dimensional driving paradigm of “triggering-amplifying-constraining” for risks in old residential community renovations for the first time, deepening the theoretical understanding of the non-linear transmission laws of built-environment retrofitting risks. Regarding contextual extension, this study introduces the risk path transmission theory embedded in the ProCRiM model proposed by Qazi et al. [8] into China’s urban renewal practices, successfully verifying through empirical data the moderating effects of unique attributes of existing communities—such as high population density, severe spatial constraints, and diverse stakeholders—on risk transmission, thereby enriching the collaborative governance and risk management theoretical system in the domain of urban renewal [5,6].

7.4. Managerial Implications

Based on the research conclusions, this study provides actionable decision-making references for government regulatory authorities and project implementation entities. In terms of resource allocation strategies, the extensive management mode of “equal resource distribution” should be abandoned in favor of a differentiated monitoring and resource deployment system established based on standardized path coefficients, focusing on building a tiered prevention and control line of proactive personnel access control to mitigate path H1 and post-event collaborative management mitigation to neutralize path group H4. Crucially, this post-event organizational mitigation must be backed by concrete contingency frameworks, such as establishing mandatory financial reserves through Work Safety Liability Insurance (WSLI) tailored to specific accident categories. By pre-arranging such dedicated insurance-backed financial tools, project teams guarantee that emergency compensation and rescue liquidation funds can be instantaneously deployed to buffer operational shocks, systematically preventing a physical site hazard from paralyzing the broader municipal renewal schedule.
For comprehensive process control, it is highly recommended to introduce digital simulation technologies during the design and engineering stages. To directly address the severe lack of pre-existing information models or reliable historical blueprints for older residential buildings, project teams should initially deploy 3D laser scanning (LiDAR telemetry) or UAV photogrammetry to capture high-precision point-cloud data of the cluttered community environments. This field data enables rapid reverse engineering and Scan-to-BIM reconstruction [42], allowing a reliable Building Information Modeling (BIM) [41] platform to be established from scratch to pre-emptively simulate the entire operational process, resolve spatial conflicts, and clear hidden hazards of large-scale operations under technical risk (H3). Simultaneously, project participants must formulate dynamic, differentiated operational schedules based on spatiotemporal characteristics to navigate occupied brownfield friction under environmental risk (H5). The adoption of modular prefabrication techniques is strongly recommended to systematically compress on-site operational interference and lower the overall exposure degree of vulnerable residents.

7.5. Research Limitations

Although this study successfully unveils the coupled pathway mechanisms of construction risks in old residential community renovations, several inherent empirical boundaries must be transparently acknowledged to guide interpretation. First, regarding the sample size constraints, while the 350 retrieved valid responses strictly satisfy the statistical requirements and critical ratio parameters for maximum likelihood estimation in structural equation modeling, the current data volume remains modest and leaves room for broader structural validation to further minimize parameter variance. Second, the geographic location of data collection exhibits localized sampling boundaries, as the investigated renovation projects were heavily clustered within Eastern China, specifically focusing on the urban renewal practices of Shandong Province. Given that this coastal region benefits from strong municipal fiscal support and rigorous localized safety supervision networks, the data may reflect a highly standardized baseline.
Third, the empirical framework relies entirely on cross-sectional data captured at a singular snapshot in time, which restricts the capacity to track the long-term, dynamic evolutionary feedback loops and shifting path weights as the project transitions through different phases of the construction lifecycle. Fourth, the evaluation index network exhibits a structural expert judgment dependence, since the measurement items are rooted in the subjective risk perceptions, experiential feedback, and cognitive interpretations of frontline practitioners, which may occasionally introduce individual halo effects or response biases. Fifth, because of these coupled spatial, temporal, and methodological constraints, the model generalizability remains bounded; the empirical configurations established here cannot be directly extrapolated without modification to traditional greenfield infrastructure projects, drastically different regional topographies within mainland China, or international built-environment retrofitting markets operating under distinct stakeholder governance frameworks.

7.6. Future Outlook

To radically advance the epistemological and practical boundaries established in this study, future research trajectories should be intentionally channeled along several methodologically rigorous paths. To alleviate geographic boundaries and resolve model generalizability constraints, subsequent initiatives should implement multi-group SEM configurations by compiling expansive, harmonized cross-regional datasets that span diverse municipal socioeconomic tiers across eastern, central, and western China. Such spatial comparative mapping will effectively test the geographic elasticity of the verified risk pathways and uncover how local fiscal capacities and regional institutional regulatory regimes moderate risk transmission patterns. Furthermore, to transcend the static limitations of cross-sectional snapshots, it is highly recommended to pioneer longitudinal research designs that combine System Dynamics (SD) with Agent-Based Modeling (ABM). This integrated computational simulation approach will enable researchers to mathematically capture the dynamic evolution rules of the personnel triggering, management amplification, and environmental constraint mechanisms, mapping their time-varying feedback loops as projects dynamically progress through sequential phases of the brownfield retrofitting lifecycle.
Simultaneously, transitioning from traditional psychometric elicitation to contemporary data-driven paradigms represents a critical evolutionary step. Future frameworks should explore the organic fusion of multi-source heterogeneous data, structurally bridging subjective human risk perceptions with objective, real-time physical safety telemetry within a unified Cyber-Physical Systems (CPS) architecture. This entails integrating frontline questionnaire insights with live streams from computer-vision hazard detection, wearable biometric sensors for worker fatigue monitoring, and onsite Internet-of-Things (IoT) tracking arrays, all synchronized within a Building Information Modeling (BIM) or Digital Twin environment to translate the empirical weights validated in this study into a high-fidelity, full-life-cycle risk early warning model. Finally, subsequent scholarly inquiries must pursue granular taxonomic investigations that isolate project-level heterogeneity. By systematically categorizing urban renewal interventions according to their structural and functional depths—explicitly distinguishing between basic repairs, complete facilities infrastructure, and upgraded smart-community retrofittings—researchers can formulate precision-targeted, customized risk-mitigation toolkits that align with the distinct operational realities of diverse urban transformation typologies.

Author Contributions

Conceptualization, J.Y. and J.Z.; methodology, J.Z.; software, J.Z.; validation, J.Y., J.Z. and L.S.; formal analysis, J.Z.; investigation, J.Y. and J.Z.; resources, J.Y. and L.S.; data curation, J.Y. and J.Z.; writing—original draft preparation, J.Y.; writing—review and editing, J.Y., J.Z. and L.S.; visualization, J.Z.; supervision, J.Z. and L.S.; project administration, J.Z.; funding acquisition, L.S. and J.Y. All authors have read and agreed to the published version of the manuscript.

Funding

This research was funded by the Natural Science Foundation of Shandong Province, China, grant number ZR2025QC1288; the project “Measurement and Governance of Resilience Levels in Megacities from a Disaster Perspective”, grant number ZR202211280088; and the technical service project “Research on Safety Early Warning for Large Equipment Hoisting in New Energy Projects of Shandong Electric Power Engineering Consulting Institute Co., Ltd.”, grant number P-XJ-26-00433845.

Data Availability Statement

The data presented in this study are available on reasonable request from the corresponding author. The data are not publicly available due to privacy and confidentiality restrictions related to respondents and construction project information.

Acknowledgments

The authors highly appreciate the contribution of frontline workers, team leaders, and construction managers who generously participated in the questionnaire surveys and field data collection. Special thanks are extended to the School of Management Engineering at Shandong Jianzhu University for providing valuable research platforms and academic advice throughout this study.

Conflicts of Interest

The authors confirm that there are no financial or commercial conflicts of interest regarding the publication of this research. All financial support received for this project was completely independent of the research implementation, data interpretation, and the decision to submit this manuscript.

Abbreviations

The following abbreviations are used in this manuscript:
SEMStructural Equation Modeling
CFAConfirmatory Factor Analysis
CRComposite Reliability
AVEAverage Variance Extracted

References

  1. Zheng, H.W.; Shen, G.Q.; Wang, H. A Review of Recent Studies on Sustainable Urban Renewal. Habitat Int. 2014, 41, 272–279. [Google Scholar] [CrossRef]
  2. Li, W.; Li, Q.; Liu, Y.; Wang, S.; Jia, L. Decision-Making Factors for Renovation of Old Residential Areas in Chinese Cities under the Concept of Sustainable Development. Environ. Sci. Pollut. Res. 2023, 30, 39695–39707. [Google Scholar] [CrossRef]
  3. Peng, W.; Huang, Y.; Li, C.; Wang, Y. Exploration of Resident Satisfaction and Willingness in the Renovation of a Typical Old Neighborhood. Buildings 2025, 15, 293. [Google Scholar] [CrossRef]
  4. Shi, H.; Liu, X.; Chen, S. Decision-Making Conflict Measurement of Old Neighborhoods Renovation Based on the Fuzzy Kano Model and Evolutionary Game Theory. Buildings 2024, 14, 785. [Google Scholar] [CrossRef]
  5. Teng, Y.; Bao, Y.; Wang, Y.; Liu, S.; Li, Z.; Tiong, R.L.K. Recognizing and Reconciling Dynamic Stakeholder Conflicts for Sustainability in Old Residential Community Renovation Project Strategies. Environ. Impact Assess. Rev. 2025, 110, 107693. [Google Scholar] [CrossRef]
  6. Shen, L.; Tang, L.; Mu, Y. Critical Success Factors and Collaborative Governance Mechanism for the Transformation of Existing Residential Buildings in Urban Renewal: From a Social Network Perspective. Heliyon 2024, 10, e27672. [Google Scholar] [CrossRef] [PubMed]
  7. Huo, X.; Xue, H.; Jiao, L. Risk Management of Retrofit Project in Old Residential Areas under Green Development. Energy Build. 2023, 279, 112708. [Google Scholar] [CrossRef]
  8. Qazi, A.; Quigley, J.; Dickson, A.; Kirytopoulos, K. Project Complexity and Risk Management (ProCRiM): Towards Modelling Project Complexity Driven Risk Paths in Construction Projects. Int. J. Proj. Manag. 2016, 34, 1183–1198. [Google Scholar] [CrossRef]
  9. Hair, J.F.; Black, W.C.; Babin, B.J.; Anderson, R.E. Multivariate Data Analysis, 8th ed.; Cengage Learning: Boston, MA, USA, 2019. [Google Scholar]
  10. Xiong, B.; Skitmore, M.; Xia, B. A Critical Review of Structural Equation Modeling Applications in Construction Research. Autom. Constr. 2015, 49, 59–70. [Google Scholar] [CrossRef]
  11. Aapaoja, A.; Haapasalo, H.; Söderström, P. Early Stakeholder Involvement in the Project Definition Phase: Case Renovation. ISRN Ind. Eng. 2013, 2013, 953915. [Google Scholar] [CrossRef]
  12. Taroun, A. Towards a Better Modelling and Assessment of Construction Risk: Insights from a Literature Review. Int. J. Proj. Manag. 2014, 32, 101–115. [Google Scholar] [CrossRef]
  13. Zhang, S.; Liu, L.; Fang, X.; Chen, G.; Ma, S. Barriers to the Renewal of Old Residential Communities in High-Density Urban Areas: Evidence from China. Sustainability 2025, 17, 10745. [Google Scholar] [CrossRef]
  14. Xie, H.; Zheng, S.; Zhai, Y.; Yuan, J.; Li, Q. Unveiling Urban Regeneration Risks in China: A Social Perspective. Sustainability 2024, 16, 1671. [Google Scholar] [CrossRef]
  15. Mai, Y.; Wu, J.; Zhang, Q.; Liang, Q.; Ma, Y.; Liu, Z. Confront or Comply? Managing Social Risks in China’s Urban Renewal Projects. Sustainability 2022, 14, 12553. [Google Scholar] [CrossRef]
  16. Li, Y.; Tao, Y.; Qian, Q.K.; Mlecnik, E.; Visscher, H.J. Critical Factors for Effective Resident Participation in Neighborhood Rehabilitation in Wuhan, China: From the Perspectives of Diverse Stakeholders. Landsc. Urban Plan. 2024, 242, 105000. [Google Scholar] [CrossRef]
  17. Xu, X.; Shi, F.; Zhu, J. Analyzing the Critical Factors Influencing Residents’ Willingness to Pay for Old Residential Neighborhoods Renewal: Insights from Nanjing, China. Environ. Dev. Sustain. 2025, 27, 13461–13487. [Google Scholar] [CrossRef]
  18. Gao, H.; Wang, T.; Gu, S. A Study of Resident Satisfaction and Factors That Influence Old Community Renewal Based on Community Governance in Hangzhou: An Empirical Analysis. Land 2022, 11, 1421. [Google Scholar] [CrossRef]
  19. Xu, Y.; Juan, Y.-K. Optimal Decision-Making Model for Outdoor Environment Renovation of Old Residential Communities Based on WELL Community Standards in China. Archit. Eng. Des. Manag. 2022, 18, 571–592. [Google Scholar] [CrossRef]
  20. Zhuo, X.; Li, H. A Study on Cost Allocation in Renovation of Old Urban Residential Communities. Sustainability 2022, 14, 6929. [Google Scholar] [CrossRef]
  21. Sun, G.; Zhang, H.; Feng, J. Factors Driving Social Capital Participation in Urban Green Development: A Case Study on Green Renovation of Old Residential Communities Under Urban Renewal in China. Buildings 2025, 15, 221. [Google Scholar] [CrossRef]
  22. Hwang, B.G.; Shan, M.; Supa’at, N.N.B. Green Commercial Building Projects in Singapore: Critical Risk Factors and Mitigation Measures. Sustain. Cities Soc. 2017, 30, 237–247. [Google Scholar] [CrossRef]
  23. Doukari, O.; Wakefield, J.; Martinez, P.; Kassem, M. An Ontology-Based Tool for Safety Management in Building Renovation Projects. J. Build. Eng. 2024, 84, 108609. [Google Scholar] [CrossRef]
  24. Zou, P.X.W.; Zhang, G.; Wang, J. Understanding the Key Risks in Construction Projects in China. Int. J. Proj. Manag. 2007, 25, 601–614. [Google Scholar] [CrossRef]
  25. Haslam, R.A.; Hide, S.A.; Gibb, A.G.F.; Gyi, D.E.; Pavitt, T.; Atkinson, S.; Duff, A.R. Contributing Factors in Construction Accidents. Appl. Ergon. 2005, 36, 401–415. [Google Scholar] [CrossRef] [PubMed]
  26. Choudhry, R.M.; Fang, D. Why Operatives Engage in Unsafe Work Behavior: Investigating Factors on Construction Sites. Saf. Sci. 2008, 46, 566–584. [Google Scholar] [CrossRef]
  27. Yu, Q.Z.; Ding, L.Y.; Zhou, C.; Luo, H.B. Analysis of Factors Influencing Safety Management for Metro Construction in China. Accid. Anal. Prev. 2014, 68, 131–138. [Google Scholar] [CrossRef] [PubMed]
  28. Han, Y.; Li, J.; Cao, X.; Jin, R. Structural Equation Modeling Approach to Studying the Relationships among Safety Investment, Construction Employees’ Safety Cognition, and Behavioral Performance. J. Constr. Eng. Manag. 2020, 146, 04020065. [Google Scholar] [CrossRef]
  29. Bagozzi, R.P.; Yi, Y. On the Evaluation of Structural Equation Models. J. Acad. Mark. Sci. 1988, 16, 74–94. [Google Scholar] [CrossRef]
  30. Fornell, C.; Larcker, D.F. Evaluating Structural Equation Models with Unobservable Variables and Measurement Error. J. Mark. Res. 1981, 18, 39–50. [Google Scholar] [CrossRef]
  31. Henseler, J.; Ringle, C.M.; Sarstedt, M. A New Criterion for Assessing Discriminant Validity in Variance-Based Structural Equation Modeling. J. Acad. Mark. Sci. 2015, 43, 115–135. [Google Scholar] [CrossRef]
  32. Podsakoff, P.M.; MacKenzie, S.B.; Lee, J.-Y.; Podsakoff, N.P. Common Method Biases in Behavioral Research: A Critical Review of the Literature and Recommended Remedies. J. Appl. Psychol. 2003, 88, 879–903. [Google Scholar] [CrossRef] [PubMed]
  33. Gefen, D.; Straub, D.; Boudreau, M.-C. Structural Equation Modeling and Regression: Guidelines for Research Practice. Commun. Assoc. Inf. Syst. 2000, 4, 7. [Google Scholar] [CrossRef]
  34. Tran, Q.; Nazir, S.; Nguyen, T.-H.; Ho, N.-K.; Dinh, T.-H.; Nguyen, V.-P.; Nguyen, M.-H.; Phan, Q.-K.; Kieu, T.-S. Empirical Examination of Factors Influencing the Adoption of Green Building Technologies: The Perspective of Construction Developers in Developing Economies. Sustainability 2020, 12, 8067. [Google Scholar] [CrossRef]
  35. Ajzen, I. The Theory of Planned Behavior. Organ. Behav. Hum. Decis. Process. 1991, 50, 179–211. [Google Scholar] [CrossRef]
  36. Freeman, R.E. Strategic Management: A Stakeholder Approach; Pitman: Boston, MA, USA, 1984. [Google Scholar]
  37. Mitchell, R.K.; Agle, B.R.; Wood, D.J. Toward a Theory of Stakeholder Identification and Salience: Defining the Principle of Who and What Really Counts. Acad. Manag. Rev. 1997, 22, 853–886. [Google Scholar] [CrossRef]
  38. Bryson, J.M. What to Do When Stakeholders Matter: Stakeholder Identification and Analysis Techniques. Public Manag. Rev. 2004, 6, 21–53. [Google Scholar] [CrossRef]
  39. ISO 31000:2018; Risk Management—Guidelines. International Organization for Standardization: Geneva, Switzerland, 2018.
  40. Aven, T. Risk Assessment and Risk Management: Review of Recent Advances on Their Foundation. Eur. J. Oper. Res. 2016, 253, 1–13. [Google Scholar] [CrossRef]
  41. Volk, R.; Stengel, J.; Schultmann, F. Building Information Modeling (BIM) for Existing Buildings—Literature Review and Future Needs. Autom. Constr. 2014, 38, 109–127. [Google Scholar] [CrossRef]
  42. Zhang, L.; Skibniewski, M.J.; Wu, X.; Chen, Y.; Deng, Q. A Probabilistic Approach for Safety Risk Analysis in Metro Construction. Saf. Sci. 2014, 63, 8–17. [Google Scholar] [CrossRef]
  43. Zhou, H.; Zhao, Y.; Shen, Q.; Yang, L.; Cai, H. Risk Assessment and Management via Multi-Source Information Fusion for Undersea Tunnel Construction. Autom. Constr. 2020, 111, 103050. [Google Scholar] [CrossRef]
  44. Sterman, J.D. Business Dynamics: Systems Thinking and Modeling for a Complex World; McGraw-Hill: Boston, MA, USA, 2000. [Google Scholar]
  45. Xie, H.; Zhang, L.; Cui, P.; Yuan, J.; Li, Q. Exploring the Evolution Mechanisms of Social Risks Associated with Urban Renewal from the Perspective of Stakeholders. Buildings 2024, 14, 1470. [Google Scholar] [CrossRef]
  46. Kline, R.B. Principles and Practice of Structural Equation Modeling, 4th ed.; Guilford Publications: New York, NY, USA, 2016. [Google Scholar]
Figure 1. Confirmatory factor analysis (CFA) model of construction risk factors in old residential community renovation.
Buildings 16 02740 g001
Figure 2. Confirmatory factor analysis (CFA) model of risk characteristics in old residential community renovation projects.
Buildings 16 02740 g002
Figure 3. The “Risk Factor-Characteristic” SEM.
Buildings 16 02740 g003
Table 1. Identification Checklist of Construction Risk Factors for Old Residential Communities.
No.Risk CategorySpecific Risk FactorSupporting References
1Personnel Risk A1Safety awareness of operational personnel A11[26,28]
Certification of special operation personnel A12[24,26]
Safety skills of operational personnel A13[26,28]
Operational violations by personnel A14[25,26]
Labor discipline violations by operational personnel A15[25,26]
Improper wearing of safety protective equipment A16[25,28]
Physical health conditions of operational personnel A17[25]
2Material and Equipment Risk A2Utilization of materials and equipment A21[22,24]
Regular maintenance of equipment A22[23,24]
Quality of materials and equipment A23[7,22]
Installation and dismantling of hoisting equipment A24[23,24]
Temporary electricity safety for equipment A25[23,24]
Use and management of flammable and explosive materials A26[24]
Stacking and storage of materials A27[22,23]
3Technical Risk A3Establishment and improvement of construction plans A31[13,23]
Demonstration of major special construction plans A32[23,24]
Identification and control of hazardous and large-scale projects A33[24,42]
Low level of technical platform intensification A34[41]
Deficient construction technology A35[13,23]
Failure to construct according to special construction plans A36[23,42]
4Management Risk A4Establishment and improvement of the safety responsibility system for all staff A41[27,39]
Three-level safety education and training A42[26,28]
Safety technical disclosure status A43[24,28]
Safety investment status A44[28]
Hazard identification and governance A45[27,39,40]
Failure to guarantee clear construction access roads A46[13,24]
Illegal commanding A47[24,27]
5Environmental Risk A5Severe weather A51[22,42]
Pedestrian density in the community A52[2,13]
Construction operation space in the community A53[13,22]
Stability of geological conditions A54[24,43]
Configuration of safety passages at the operation site A55[13,45]
Table 2. Scoring of personnel risk indicators by ten experts.
IndicatorExpert Scoring Results
12345678910
A114435435434
A125545445445
A134434334434
A145445435445
A154434334334
A164334324334
A172212213212
Table 3. Measurement indicator system of construction risk factors for old residential communities.
No.Risk CategorySpecific Risk Factor
1Personnel Risk A1Safety awareness of operational personnel A11
Certification of special operation personnel A12
Safety skills of operational personnel A13
Operational violations by personnel A14
Labor discipline violations by operational personnel A15
Improper wearing of safety protective equipment A16
2Material and Equipment Risk A2Utilization of materials and equipment A21
Regular maintenance of equipment A22
Quality of materials and equipment A23
Installation and dismantling of hoisting equipment A24
Temporary electricity safety for equipment A25
Use and management of flammable and explosive materials A26
3Technical Risk A3Establishment and improvement of construction plans A31
Demonstration of major special construction plans A32
Identification and control of hazardous and large-scale projects A33
Low level of technical platform intensification A34
Failure to construct according to special construction plans A35
4Management Risk A4Establishment and improvement of the safety responsibility system for all staff A41
Three-level safety education and training A42
Safety technical disclosure status A43
Safety investment status A44
Hazard identification and governance A45
Illegal commanding A46
5Environmental Risk A5Severe weather A51
Pedestrian density in the community A52
Construction operation space in the community A53
Configuration of safety passages at the operation site A54
Table 4. Construction risk characteristics of old residential communities.
No.DimensionMeasurement Item
1Risk probability B1High possibility of accidents such as falling from heights B11
Numerous safety hazards at the construction site B12
High susceptibility to unforeseen risk events B13
High overall probability of accident risks B14
2Consequence severity B2Potential to cause severe injuries or fatalities B21
Damage to building structures with high repair costs B22
Triggering resident complaints and negative public opinion B23
Leading to work suspension and huge economic losses B24
3Control difficulty B3Restricted operations due to narrow sites B31
Cross-construction of multiple professional disciplines B32
High density of pedestrian flow B33
Insufficiency of existing systems and technologies to cope with risks B34
4Exposure degree B4Exposure of residents’ daily activities to construction areas B41
Frequent passing and long exposure time of vulnerable groups B42
High vulnerability of old pipelines to construction damage B43
Inability to close roads B44
Table 5. Descriptive statistics of sample characteristic distribution.
VariableCategoryFrequencyPercentage
GenderMale30587.1%
Female4512.9%
Educational BackgroundJunior college and below10530.0%
Bachelor’s degree17550.0%
Master’s degree and above7020.0%
Organization TypeUniversities267.4%
Project Owner12636.0%
Contractor12836.6%
Design Organization3810.9%
Material Supplier329.1%
Professional ExperienceLess than 1 year3510.0%
1–3 years8424.0%
3–5 years6418.3%
More than 5 years16747.7%
Table 6. Summary of structural pathways and research hypotheses.
Hypothesis GroupPath AlignmentFormulated Sub-HypothesesCore Theoretical Justification & Rationale
Path Group H1Personnel Risk (A1) → Risk ProfileH1a, H1b, H1c, H1dDriven by individual cognitive limitations, onsite behavior deviations, and active human error causation [26,28].
Path Group H2Material & Equipment (A2) → Risk ProfileH2a, H2b, H2c, H2dGoverned by physical asset aging, supply chain logistics deviations, and mechanical boundary failures [22,23].
Path Group H3Technical Risk (A3) → Risk ProfileH3a, H3b, H3c, H3dRooted in engineering schema errors, dynamic rework hazards, and construction technology mismatches [10,13].
Path Group H4Management Risk (A4) → Risk ProfileH4a, H4b, H4c, H4dAnchored in organizational defense-in-depth gaps, weak monitoring, and administrative coordination failures [6,8].
Path Group H5Environmental Risk (A5) → Risk ProfileH5a, H5b, H5c, H5dConstrained by rigid physical space bottlenecks, high population density, and occupied brownfield friction [7,45].
Table 7. Cronbach’s alpha coefficients for reliability analysis.
VariableCronbach’s AlphaNumber of Items
Personnel Risk0.8846
Material and Equipment Risk0.8916
Technical Risk0.8865
Management Risk0.8976
Environmental Risk0.8334
Construction Risk Factors0.92227
Risk Probability0.8144
Consequence Severity0.8114
Control Difficulty0.8354
Exposure Degree0.8144
Construction Risk Characteristics0.87416
Table 8. Model fit test for construction risk factors.
Fit IndexRecommended ThresholdModel ValueAssessment
CMIN/DF<31.643Good
RMSEA<0.080.043Good
SRMR<0.050.042Good
TLI>0.900.954Good
GFI>0.900.903Good
CFI>0.900.959Good
PGFI>0.500.750Acceptable
Table 9. Model fit test for construction risk characteristics.
Fit IndexRecommended ThresholdModel ValueAssessment
CMIN/DF<31.489Good
RMSEA<0.080.034Good
SRMR<0.050.039Good
TLI>0.900.972Good
GFI>0.900.951Good
CFI>0.900.977Good
PGFI>0.500.685Acceptable
Table 10. Convergent validity and composite reliability testing for construction risk factor dimensions.
Path RelationshipEstimateAVECR
Personnel RiskA110.820.5600.884
Personnel RiskA120.656
Personnel RiskA130.837
Personnel RiskA140.734
Personnel RiskA150.744
Personnel RiskA160.893
Material and Equipment RiskA210.7390.5780.891
Material and Equipment RiskA220.75
Material and Equipment RiskA230.713
Material and Equipment RiskA240.805
Material and Equipment RiskA250.736
Material and Equipment RiskA260.785
Technical RiskA310.8260.5860.876
Technical RiskA320.821
Technical RiskA330.68
Technical RiskA340.72
Technical RiskA350.691
Management RiskA410.7370.5930.897
Management RiskA420.71
Management RiskA430.733
Management RiskA440.727
Management RiskA450.749
Management RiskA460.708
Environmental RiskA510.7250.5580.834
Environmental RiskA520.747
Environmental RiskA530.775
Environmental RiskA540.768
Table 11. Convergent validity and composite reliability testing for construction risk characteristic dimensions.
Path RelationshipEstimateAVECR
Risk ProbabilityB110.8320.5240.814
Risk ProbabilityB120.756
Risk ProbabilityB130.692
Risk ProbabilityB140.779
Consequence SeverityB210.8010.5180.811
Consequence SeverityB220.724
Consequence SeverityB230.687
Consequence SeverityB240.758
Control DifficultyB310.8430.5600.836
Control DifficultyB320.771
Control DifficultyB330.703
Control DifficultyB340.814
Exposure DegreeB410.7910.5250.815
Exposure DegreeB420.688
Exposure DegreeB430.732
Exposure DegreeB440.774
Table 12. Discriminant validity testing for construction risk factor dimensions.
DimensionPersonnel RiskMaterial & Equipment RiskTechnical RiskManagement RiskEnvironmental Risk
Personnel Risk0.748
Material & Equipment Risk0.4850.760
Technical Risk0.4750.4320.765
Management Risk0.4650.3940.5320.770
Environmental Risk0.3350.3400.3610.3880.747
Table 13. Discriminant validity testing for construction risk characteristic dimensions.
DimensionRisk ProbabilityConsequence SeverityControl DifficultyExposure Degree
Risk Probability0.724
Consequence Severity0.5000.720
Control Difficulty0.4270.4360.748
Exposure Degree0.5200.4770.4190.725
Table 14. HTMT analysis matrix for the risk factor dimensions.
DimensionPersonnel RiskMaterial & Equipment RiskTechnical RiskManagement RiskEnvironmental Risk
Personnel Risk
Material & Equipment Risk0.604
Technical Risk0.5240.571
Management Risk0.5230.4510.685
Environmental Risk0.4710.4240.4100.562
Table 15. HTMT analysis matrix for the risk characteristic dimensions.
DimensionRisk ProbabilityConsequence SeverityControl DifficultyExposure Degree
Risk Probability
Consequence Severity0.697
Control Difficulty0.5080.631
Exposure Degree0.5320.5630.549
Table 16. Descriptive statistics and normality test results of dimensions and measurement items.
DimensionItemMeanSDSkewnessKurtosisOverall MeanOverall SD
Personnel RiskA113.51.125−0.31−0.8063.43860.91555
A123.381.169−0.251−0.791
A133.471.196−0.276−0.874
A143.431.182−0.311−0.764
A153.441.126−0.328−0.634
A163.411.108−0.187−0.637
Material & Equipment RiskA213.41.136−0.241−0.7173.33290.92848
A223.351.129−0.134−0.805
A233.271.128−0.092−0.861
A243.281.19−0.125−0.888
A253.371.187−0.255−0.791
A263.331.15−0.112−0.746
Technical RiskA313.271.13−0.124−0.5793.30170.94511
A323.271.196−0.122−0.927
A333.331.15−0.196−0.758
A343.261.186−0.198−0.793
A353.371.118−0.122−0.747
Management RiskA413.351.241−0.288−0.9113.37520.94424
A423.351.18−0.284−0.765
A433.421.154−0.201−0.772
A443.381.131−0.113−0.755
A453.41.125−0.294−0.557
A463.351.138−0.24−0.724
Environmental RiskA513.411.149−0.119−0.9273.38360.91324
A523.441.11−0.182−0.658
A533.281.122−0.195−0.701
A543.41.094−0.211−0.633
Risk ProbabilityB113.461.149−0.215−0.7833.39570.91774
B123.421.15−0.185−0.859
B133.391.115−0.188−0.689
B143.311.166−0.08−0.993
Consequence SeverityB213.351.12−0.184−0.6893.31070.90192
B223.31.12−0.151−0.754
B233.31.152−0.255−0.632
B243.291.125−0.101−0.812
Control DifficultyB313.311.135−0.167−0.6913.31790.92203
B323.341.19−0.221−0.809
B333.331.088−0.064−0.628
B343.291.094−0.038−0.7
Exposure DegreeB413.391.107−0.113−0.763.41570.92852
B423.471.124−0.365−0.454
B433.411.24−0.152−1.151
B443.391.162−0.275−0.754
Table 17. Results of Pearson correlation analysis among dimensions.
DimensionRisk ProbabilityConsequence SeverityControl DifficultyExposure DegreePersonnel RiskMaterial & Equipment RiskTechnical RiskManagement RiskEnvironmental Risk
Risk Probability1
Consequence Severity0.398 **1
Control Difficulty0.352 **0.359 **1
Exposure Degree0.419 **0.391 **0.348 **1
Personnel Risk0.545 **0.454 **0.454 **0.459 **1
Material & Equipment Risk0.416 **0.378 **0.390 **0.377 **0.426 **1
Technical Risk0.389 **0.423 **0.459 **0.457 **0.412 **0.380 **1
Management Risk0.372 **0.436 **0.459 **0.436 **0.418 **0.348 **0.472 **1
Environmental Risk0.340 **0.345 **0.406 **0.351 **0.285 **0.295 **0.306 **0.340 **1
Note: ** Correlation is significant at the 0.01 level (2-tailed).
Table 18. Model fit test for the risk factor-characteristic SEM.
Fit IndexRecommended ThresholdModel ValueAssessment
CMIN/DF<31.781Good
RMSEA<0.080.047Good
SRMR<0.050.048Good
TLI>0.900.906Acceptable
GFI>0.900.825Acceptable
CFI>0.900.913Acceptable
PGFI>0.500.732Acceptable
Table 19. Path analysis and hypothesis testing results for the risk factor-characteristic SEM.
HypothesisPath RelationshipEstimateS.E.C.R.p
H1aRisk ProbabilityPersonnel Risk0.4650.0686.791***
H1bConsequence SeverityPersonnel Risk0.3040.0634.815***
H1cControl DifficultyPersonnel Risk0.270.0634.289***
H1dExposure DegreePersonnel Risk0.2720.0574.76***
H2aRisk ProbabilityMaterial & Equipment Risk0.1730.0493.546***
H2bConsequence SeverityMaterial & Equipment Risk0.1450.0512.8170.005
H2cControl DifficultyMaterial & Equipment Risk0.1390.0532.6480.008
H2dExposure DegreeMaterial & Equipment Risk0.1130.0452.490.013
H3aRisk ProbabilityTechnical Risk0.1280.0472.6910.007
H3bConsequence SeverityTechnical Risk0.1770.0523.435***
H3cControl DifficultyTechnical Risk0.2340.0544.346***
H3dExposure DegreeTechnical Risk0.2110.0484.409***
H4aRisk ProbabilityManagement Risk0.0720.0471.5190.129
H4bConsequence SeverityManagement Risk0.2070.0533.907***
H4cControl DifficultyManagement Risk0.2150.0543.969***
H4dExposure DegreeManagement Risk0.1760.0473.72***
H5aRisk ProbabilityEnvironmental Risk0.1760.0592.9850.003
H5bConsequence SeverityEnvironmental Risk0.1800.0632.8570.004
H5cControl DifficultyEnvironmental Risk0.2820.0674.199***
H5dExposure DegreeEnvironmental Risk0.1820.0573.2030.001
Note: S.E. stands for Standard Error; C.R. stands for Critical Ratio (t-value); *** indicates p < 0.001.
Disclaimer/Publisher’s Note: The statements, opinions and data contained in all publications are solely those of the individual author(s) and contributor(s) and not of MDPI and/or the editor(s). MDPI and/or the editor(s) disclaim responsibility for any injury to people or property resulting from any ideas, methods, instructions or products referred to in the content.