Article

Monitoring and Analysis of Crack Dimensions in Prestressed Concrete T-Girders on the Western Sichuan Plateau

1
Department of Road and Bridge Engineering, Sichuan Vocational and Technical College of Communications, Chengdu 611130, China
2
School of Architecture and Civil Engineering, Xihua University, Chengdu 610039, China
*
Author to whom correspondence should be addressed.
Buildings 2026, 16(14), 2732; https://doi.org/10.3390/buildings16142732
Submission received: 17 June 2026 / Revised: 2 July 2026 / Accepted: 5 July 2026 / Published: 9 July 2026

Abstract

Beam bridges in mountainous and high-altitude transport corridors are frequently exposed to large diurnal temperature differences, intense solar radiation, low humidity, freeze–thaw action and repeated wetting–drying cycles. These coupled actions can accelerate concrete surface cracking and reduce the durability of prestressed concrete T-girder bridges, but field evidence linking crack morphology, crack depth, concrete cover and short-term environmental response remains limited. This study investigates a representative 40 m in-service prestressed concrete T-girder bridge on the Western Sichuan Plateau through field survey and four-month continuous monitoring. Crack location, length, width, depth and concrete cover thickness were measured, and representative crack-width responses to ambient temperature were analyzed. The results show that web cracks are dominated by reticular and irregular microcracks, bottom cracks are mainly longitudinal intermittent short cracks, and diaphragm cracks are concentrated near reticular zones and local corner discontinuities. The sunny side of the edge girder contained approximately 598 cracks, about 4.8 times the 123 cracks observed on the shaded side. Web and diaphragm crack widths were mainly 0–0.04 mm, while bottom-crack widths of 0–0.10 mm accounted for about 92.7%; most crack lengths were 2–20 cm. During monitoring, newly developed cracks accounted for about 6.0% of all recorded cracks, and only 3 of 721 existing cracks increased by 4–6 cm. Representative crack widths fluctuated by about 0.02 mm under −1 to 24 °C without sustained growth. Cracks wider than 0.20 mm generally exceeded the approximately 40 mm concrete cover. Such penetrating cracks should be prioritized in durability maintenance and long-term monitoring.

1. Introduction

Prestressed concrete T-girder bridges are widely used in mountainous highway networks because they combine structural efficiency, convenient prefabrication and economical construction. In high-altitude and plateau regions, however, beam bridges are subjected not only to traffic loading but also to strong environmental gradients, including low air pressure, intense ultraviolet radiation, low relative humidity, rapid day–night temperature variation, freeze–thaw cycles and repeated wetting–drying action. Similar climatic combinations occur in many mountainous transport corridors, such as western China, the Qinghai–Tibet Plateau and other cold highland areas. Under these conditions, early-age shrinkage, thermal stress, local restraint and long-term environmental deterioration may act together to generate distributed surface cracking in concrete beam bridges [1,2,3,4,5,6,7,8].
Cracks in prestressed concrete members are not only geometric defects; they are also indicators of the interaction between material behavior, structural restraint and service environment. Fine cracks may have limited influence on immediate load-carrying capacity, but they can reduce the protective function of the concrete cover. Previous studies have demonstrated that crack width, crack depth, crack connectivity and healing capacity strongly influence water permeability, chloride ingress, carbonation and reinforcement corrosion [9,10,11,12,13,14,15,16,17,18]. Therefore, durability-oriented bridge assessment requires more than crack counting: it requires quantitative information on crack width, length, depth and the relationship between crack depth and concrete cover thickness.
In recent decades, bridge inspection has increasingly combined conventional visual inspection, non-destructive testing, structural health monitoring, optical-fiber sensing and computer-vision-based crack recognition [19,20,21,22,23,24,25,26,27,28,29,30,31,32,33,34]. These techniques provide important tools for acquiring crack geometry and tracking crack evolution. However, field studies that connect crack morphology, crack depth, concrete cover thickness and short-term temperature response for in-service T-girders in highland regions remain limited.
Shrinkage, freeze–thaw action and thermal stresses are also important for bridge concrete exposed to cold and dry environments. Creep-shrinkage models, microcracking studies and freeze–thaw durability research provide the theoretical basis for interpreting environmentally induced cracking [35,36,37,38]. Design and maintenance codes require that crack width, crack distribution and durability risk be considered in bridge inspection and condition evaluation [39,40,41,42,43,44]. Recent Chinese engineering studies on T-girder cracking, bridge-deck concrete cracking, static load testing and crack-control measures also indicate the practical need for refined monitoring of prestressed concrete bridge components. Existing Chinese engineering studies on T-girder and prestressed concrete bridge cracking provide important practical background. Wu et al. [45] discussed crack control and durability improvement in prefabricated T-girder bridge-deck systems, and Zhang [46] summarized common construction defects and prevention measures in high-performance fiber-reinforced prefabricated T-girders. Wei [47] and Lu [48] emphasized technical-condition assessment, static load testing and load-bearing evaluation for cracked T-girder bridges, while Song et al. [49] reviewed crack-control technologies for long-span prestressed concrete bridges. These studies mainly focus on construction control, structural evaluation or general crack-control strategies. Comparatively, fewer studies provide field statistics on microcrack morphology, exposure-side differences, crack depth relative to cover thickness and temperature-induced crack-width fluctuation in in-service plateau T-girder bridges.
High-altitude bridge environments deserve special attention. Hu et al. [50] analyzed asymmetric cracking in plateau concrete bridge piers and showed that nonuniform environmental exposure can produce spatially biased cracking. Yang et al. [51] investigated early-age thermal cracking of high-speed railway bridge piers in plateau regions and highlighted the importance of temperature control and formwork-removal timing. Wang et al. [52] further proposed thermal-control measures for concrete crack prevention in bridge piers under plateau climate conditions. Plateau concrete studies also indicate that freeze–thaw action, salt–frost environments and dry–wet cycles can intensify cracking and durability deterioration [53,54,55]. These findings support the need to treat highland bridges as exposure-specific structures rather than applying only generic bridge-inspection rules.
To address this gap, this paper investigates a typical prestressed concrete T-girder bridge in the Western Sichuan Plateau. The objectives are to: (i) classify crack morphology in the web, bottom and diaphragms; (ii) quantify crack length and width distributions; (iii) compare crack depth with concrete cover thickness; (iv) evaluate newly developed cracks and existing-crack growth; and (v) clarify representative crack-width fluctuation under winter-spring temperature variation. The study aims to provide measured evidence for durability assessment and maintenance decision-making for beam bridges operating in severe mountainous environments.

2. Materials and Methods

2.1. Study Object and Monitoring Indices

This study focuses on the concrete T-girder bridge—the most representative bridge type in the Western Sichuan Plateau—to conduct long-term crack monitoring. The selected bridge was constructed in 2023 and opened to traffic in March 2024. Its superstructure consists of simply supported prestressed concrete T-girders with a span arrangement of 40 m; the T-girders are 2.5 m high and made of C50 concrete. The bridge has a total width of 25 m and features no pedestrian walkways. The substructure comprises column piers and lightweight abutments, supported by pile foundations. The bridge is designed for Highway Class I loading.
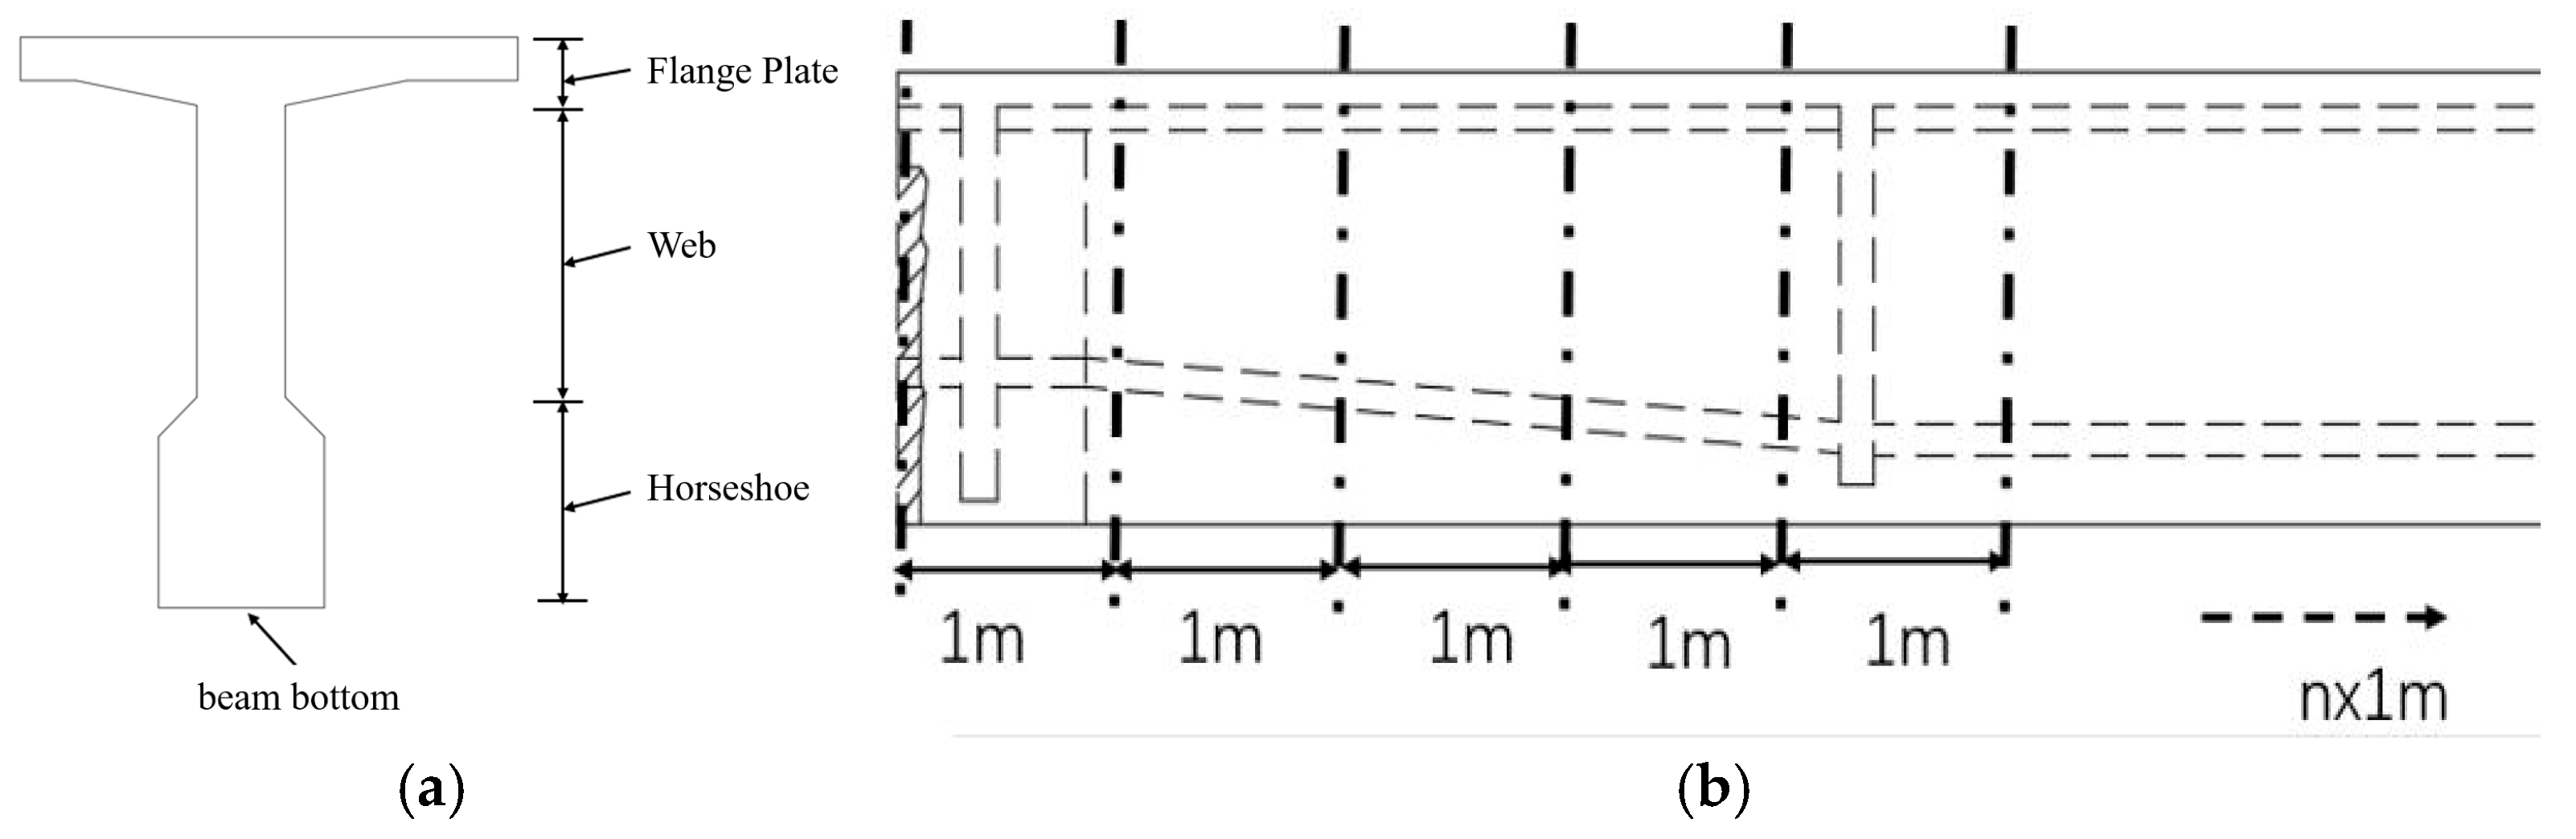
The monitoring indices included crack location, crack length, crack width, crack depth and concrete cover thickness (Figure 1). Crack location was used to identify concentration zones in the flange, web, haunch, diaphragms and girder bottom. Crack length and width were used to quantify geometric characteristics, while crack depth and cover thickness were used to judge whether a crack had the potential to reach the reinforcement and to evaluate durability risk.

2.2. Monitoring Method and Measurement Layout

The investigation combined a full-field crack survey with continuous dynamic monitoring. The monitoring period covered the winter-spring season from December to March, when environmental variation is significant in the study area. During the field survey, a crack-integrated detector and a crack-width gauge were used to mark and measure crack location, length, width and depth. Newly developed cracks were recorded during repeated inspections. For representative cracks at the girder-end web and girder bottom, crack gauges were installed to continuously collect crack-width data, while ambient temperature was recorded synchronously. When the crack width is less than approximately 0.05 mm, the relative measurement uncertainty may increase due to factors such as surface roughness and local humidity.
(1)
Crack width measurement: An integrated concrete crack testing instrument is used. It employs microscopic imaging technology, magnifying the crack image for measurement. Measurement range: 0–10 mm; accuracy: ±0.01 mm; analysis modes: AI-based automatic detection (diagonal and transverse cracks) and manual analysis. (Leitu Technology Co., Ltd., Beijing China)
(2)
Crack depth measurement: An ultrasonic instrument is used. It employs ultrasonic technology. Acoustic time measurement range: 0–4,096,000 μs; amplitude measurement range: 0–170 dB; crack depth measurement range: 5–500 mm; operating temperature: −20 to +60 °C. (Sinorock Technology Co., Ltd., Wuhan China)
(3)
Long-term dynamic crack width monitoring: An image-based crack width monitor is used. It captures images of the crack and performs edge detection analysis to track changes in crack width, uploading the results and image data to a remote viewing platform via a 4G network. Measurement accuracy: 0.01 mm; image resolution: 1920 × 1080; sampling frequency: ≥1 reading every 10 min. (Shengtuo Testing Technology Co., Ltd., Chengdu China)
The girder was divided into longitudinal monitoring zones at 1 m intervals. Within each zone, cracks in the flange, web, haunch, diaphragms and bottom were marked and measured to ensure systematic and comparable records for different structural components. The monitoring-point layout and longitudinal zoning are shown in Figure 2.

2.3. Data Processing and Evaluation Method

Crack widths and lengths were grouped into interval distributions to identify dominant crack-size ranges. The sunny and shaded faces of the edge girder were compared to evaluate exposure-orientation effects. Crack-depth measurements were compared with the measured concrete cover thickness to identify cracks that may penetrate the cover. For dynamic monitoring, crack-width records and ambient-temperature records were plotted on the same time axis, and the amplitude and trend of crack-width fluctuation were examined.

3. Results

3.1. Crack Characteristics of the Main-Girder Web

3.1.1. Crack Morphology of the Main-Girder Web

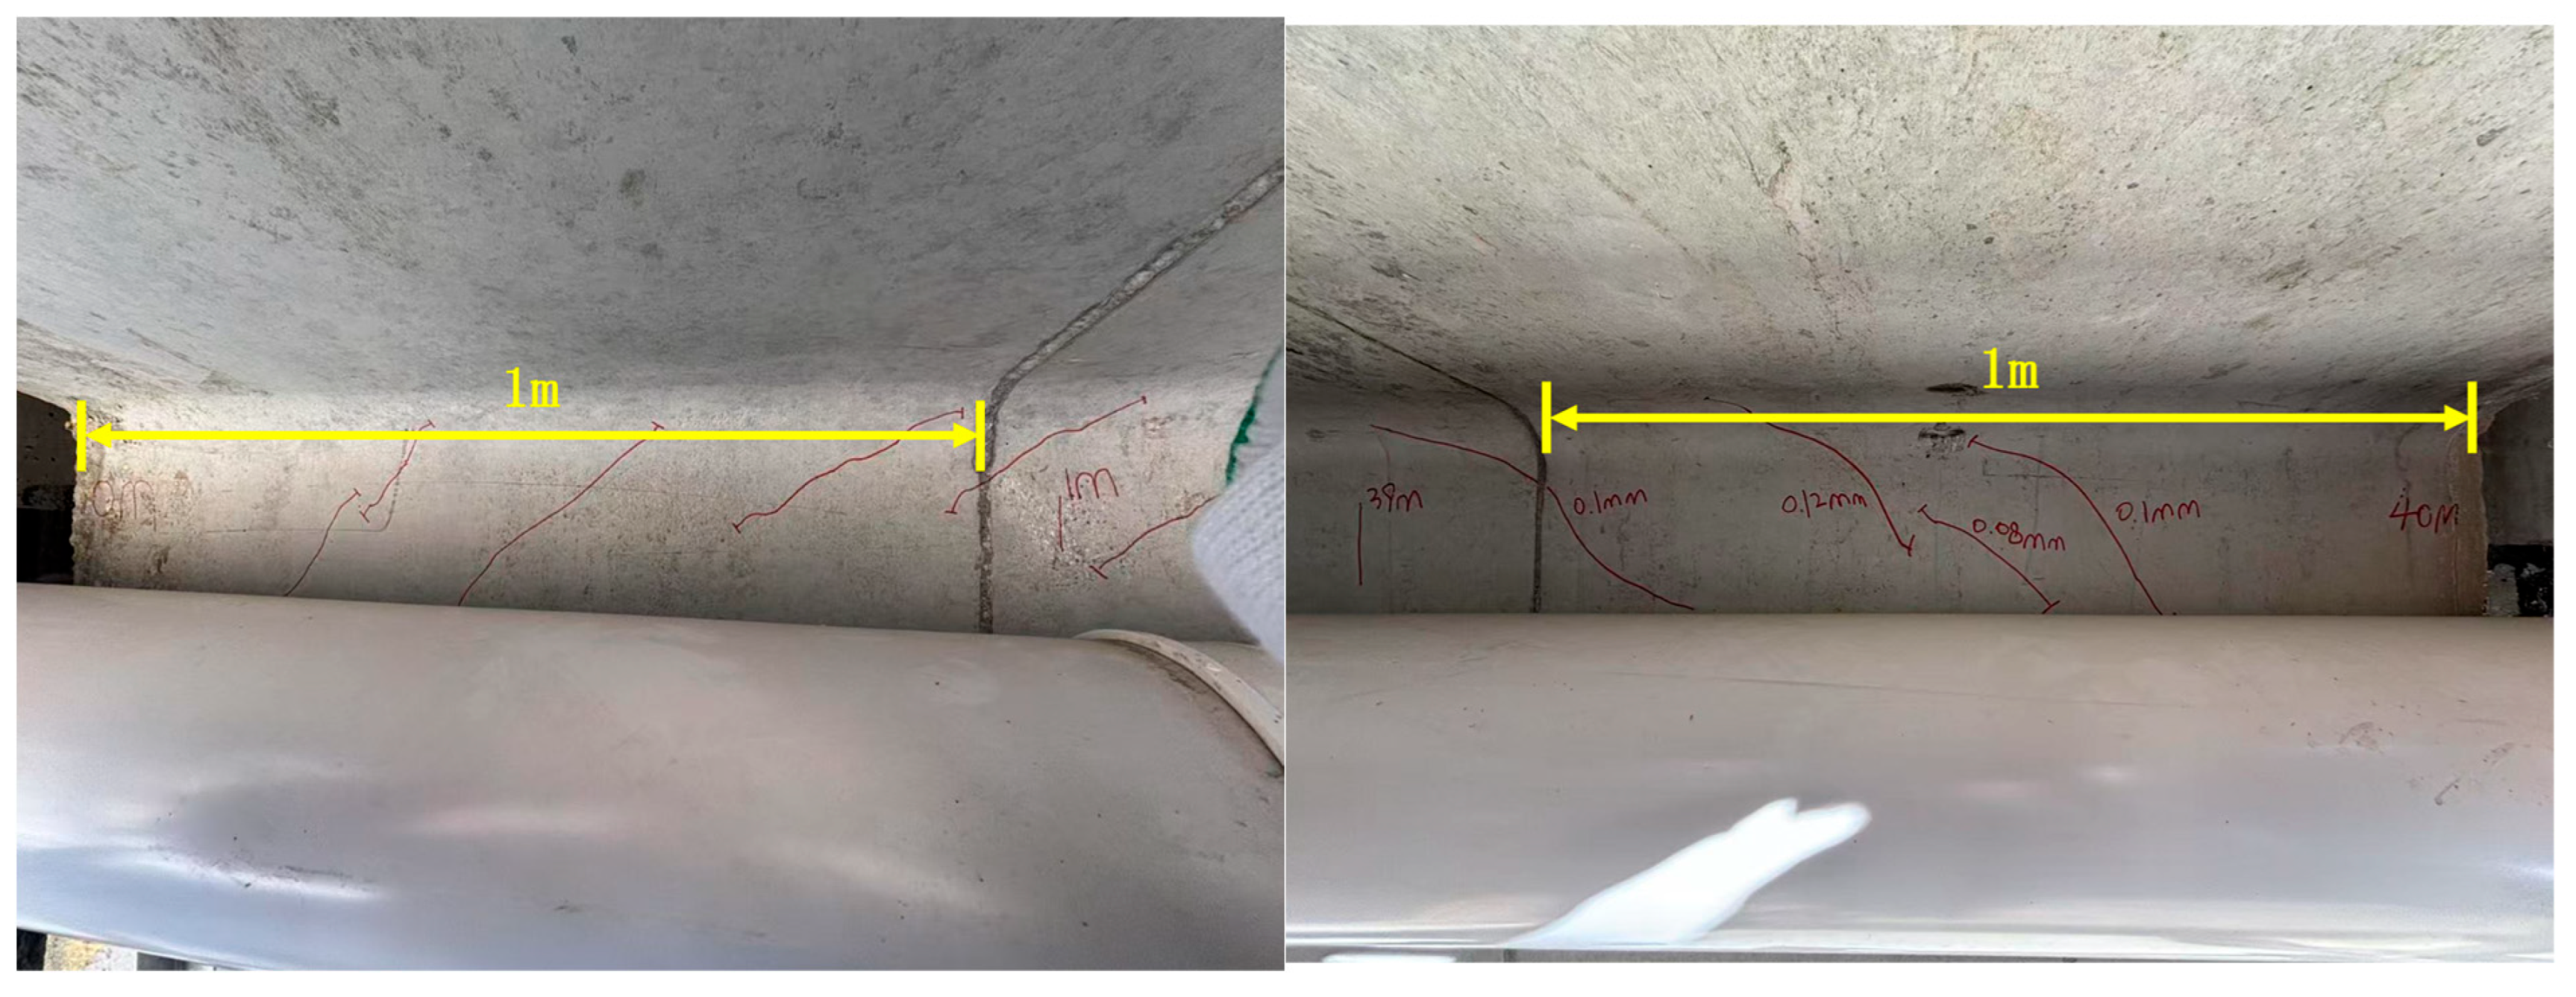
The web cracks can be classified into three typical forms. The first type consists of numerous reticular or irregular microcracks on the web surface, generally with widths not exceeding 0.05 mm (Figure 3). These cracks are mainly associated with early-age shrinkage, temperature stress and drying shrinkage, and they are promoted by strong solar radiation, large temperature differences and low humidity. The second type consists of several oblique parallel cracks near the upper part of the web close to the support region, with widths generally not exceeding 0.05 mm (Figure 4). Their formation is related to local shear stress and principal tensile stress. The third type consists of longitudinal cracks along the span direction at the web-haunch transition, with widths of approximately 0.01–0.20 mm, which are mainly caused by local stress concentration at geometric discontinuities. Furthermore, monitoring of cracks on the sun-facing side (the outer surface exposed to intense direct solar radiation) and the shaded side (the inner surface shielded by the bridge structure itself and receiving less direct sunlight) of the T-girder edge girders revealed a higher number of cracks on the sun-facing side. The cracks on both sides exhibited network-like or irregular patterns, indicating that adverse environmental factors—such as intense ultraviolet radiation and diurnal temperature fluctuations—exert a more pronounced deteriorating effect on the concrete of the sun-facing side.

3.1.2. Crack-Size Distribution of the Main-Girder Web

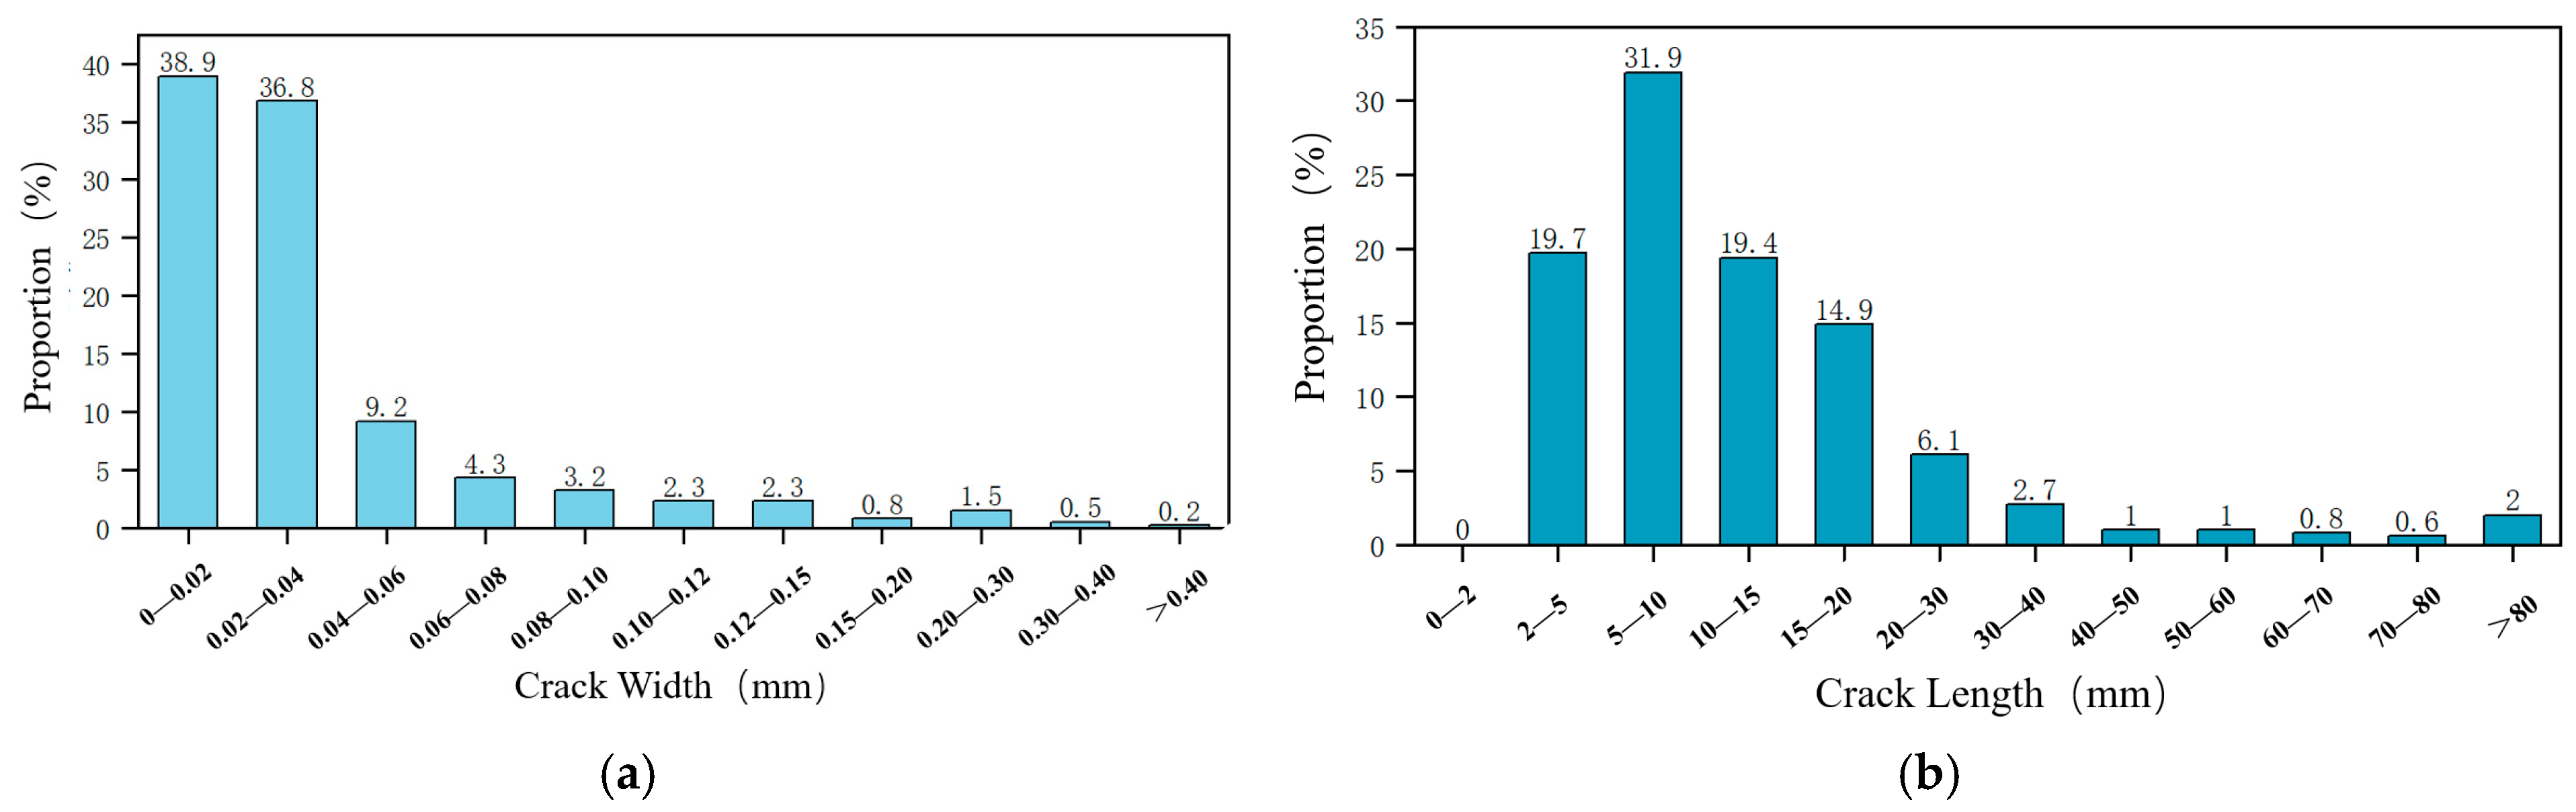
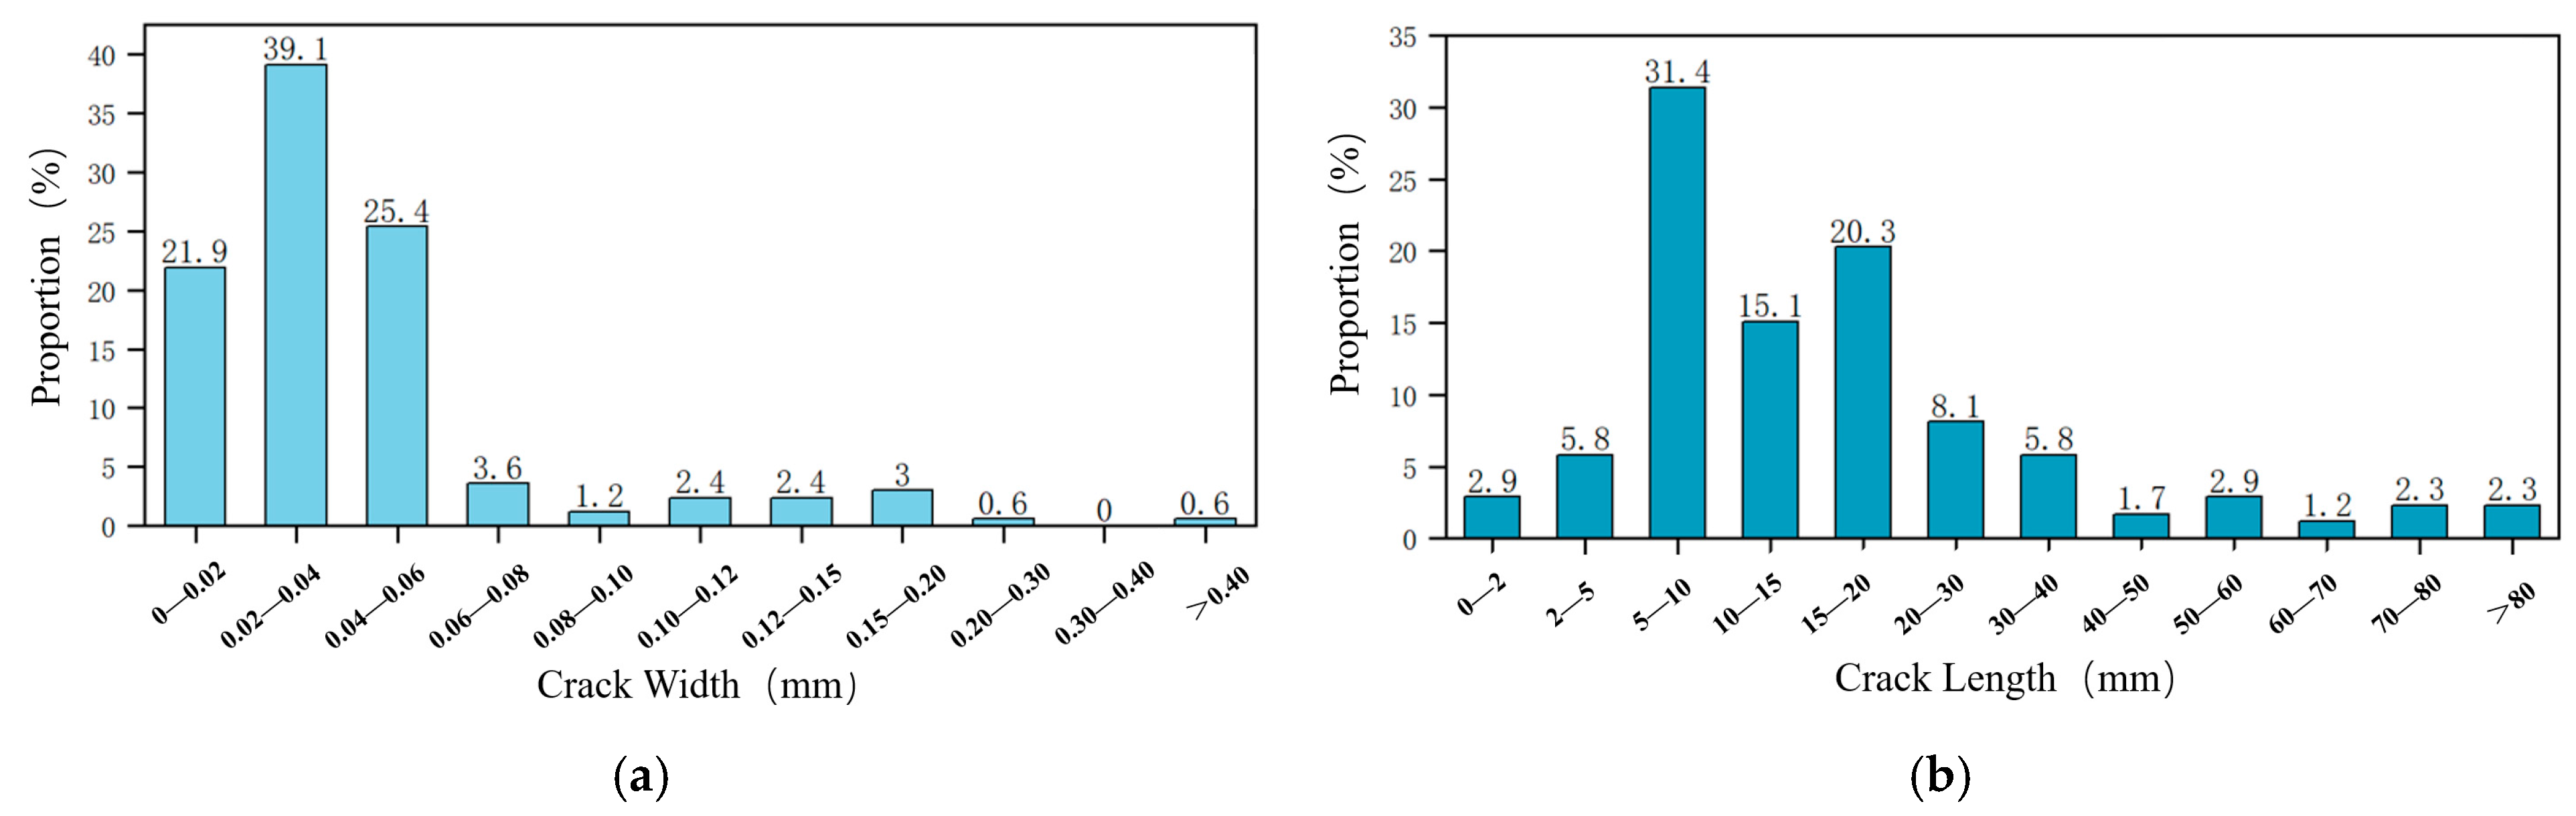
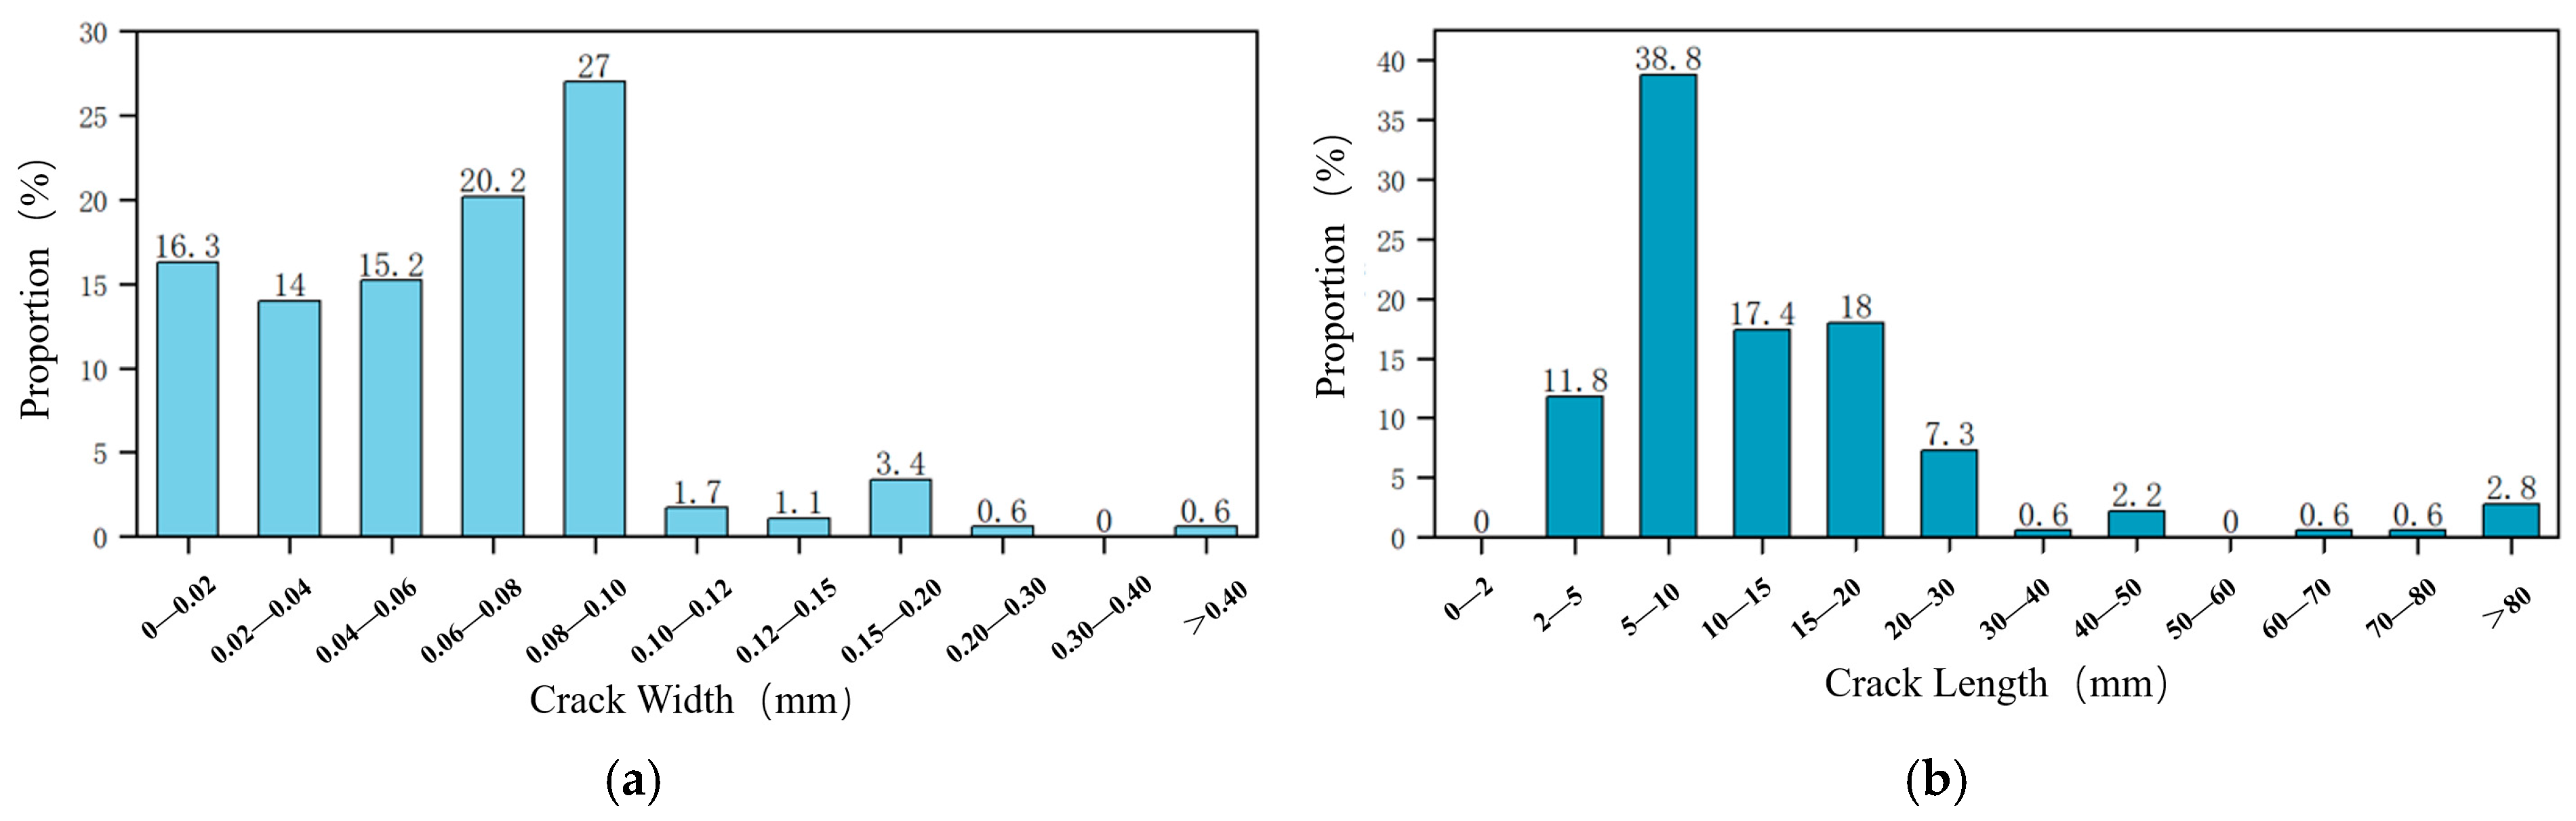
The width and length distributions of web cracks are shown in Figure 5. Crack widths are mainly concentrated in the 0–0.04 mm interval, accounting for approximately 75.7%. The proportion of cracks decreases gradually in the 0.04–0.12 mm interval, and cracks wider than 0.12 mm are rare. It essentially complies with the maximum crack width limits specified in the “Code for Design of Concrete Structures” (GB 50010-2010) [56]. Crack lengths are mainly distributed in the 2–20 cm interval, accounting for about 85.9%; short cracks of 2–10 cm have the highest proportion, followed by cracks of 10–20 cm, while cracks longer than 40 cm are limited. The web cracks therefore show the characteristics of small width, short length and high quantity.
A total of about 598 cracks were recorded on the sunny side of the edge girder, whereas about 123 cracks were recorded on the shaded side. The sunny-side crack count was therefore approximately 4.8 times that of the shaded side. This difference indicates that intense ultraviolet radiation, solar heating and large day–night temperature variation increase surface shrinkage stress and act as important external factors for microcrack development.

3.2. Crack Characteristics of the Girder Bottom

3.2.1. Crack Morphology of the Girder Bottom

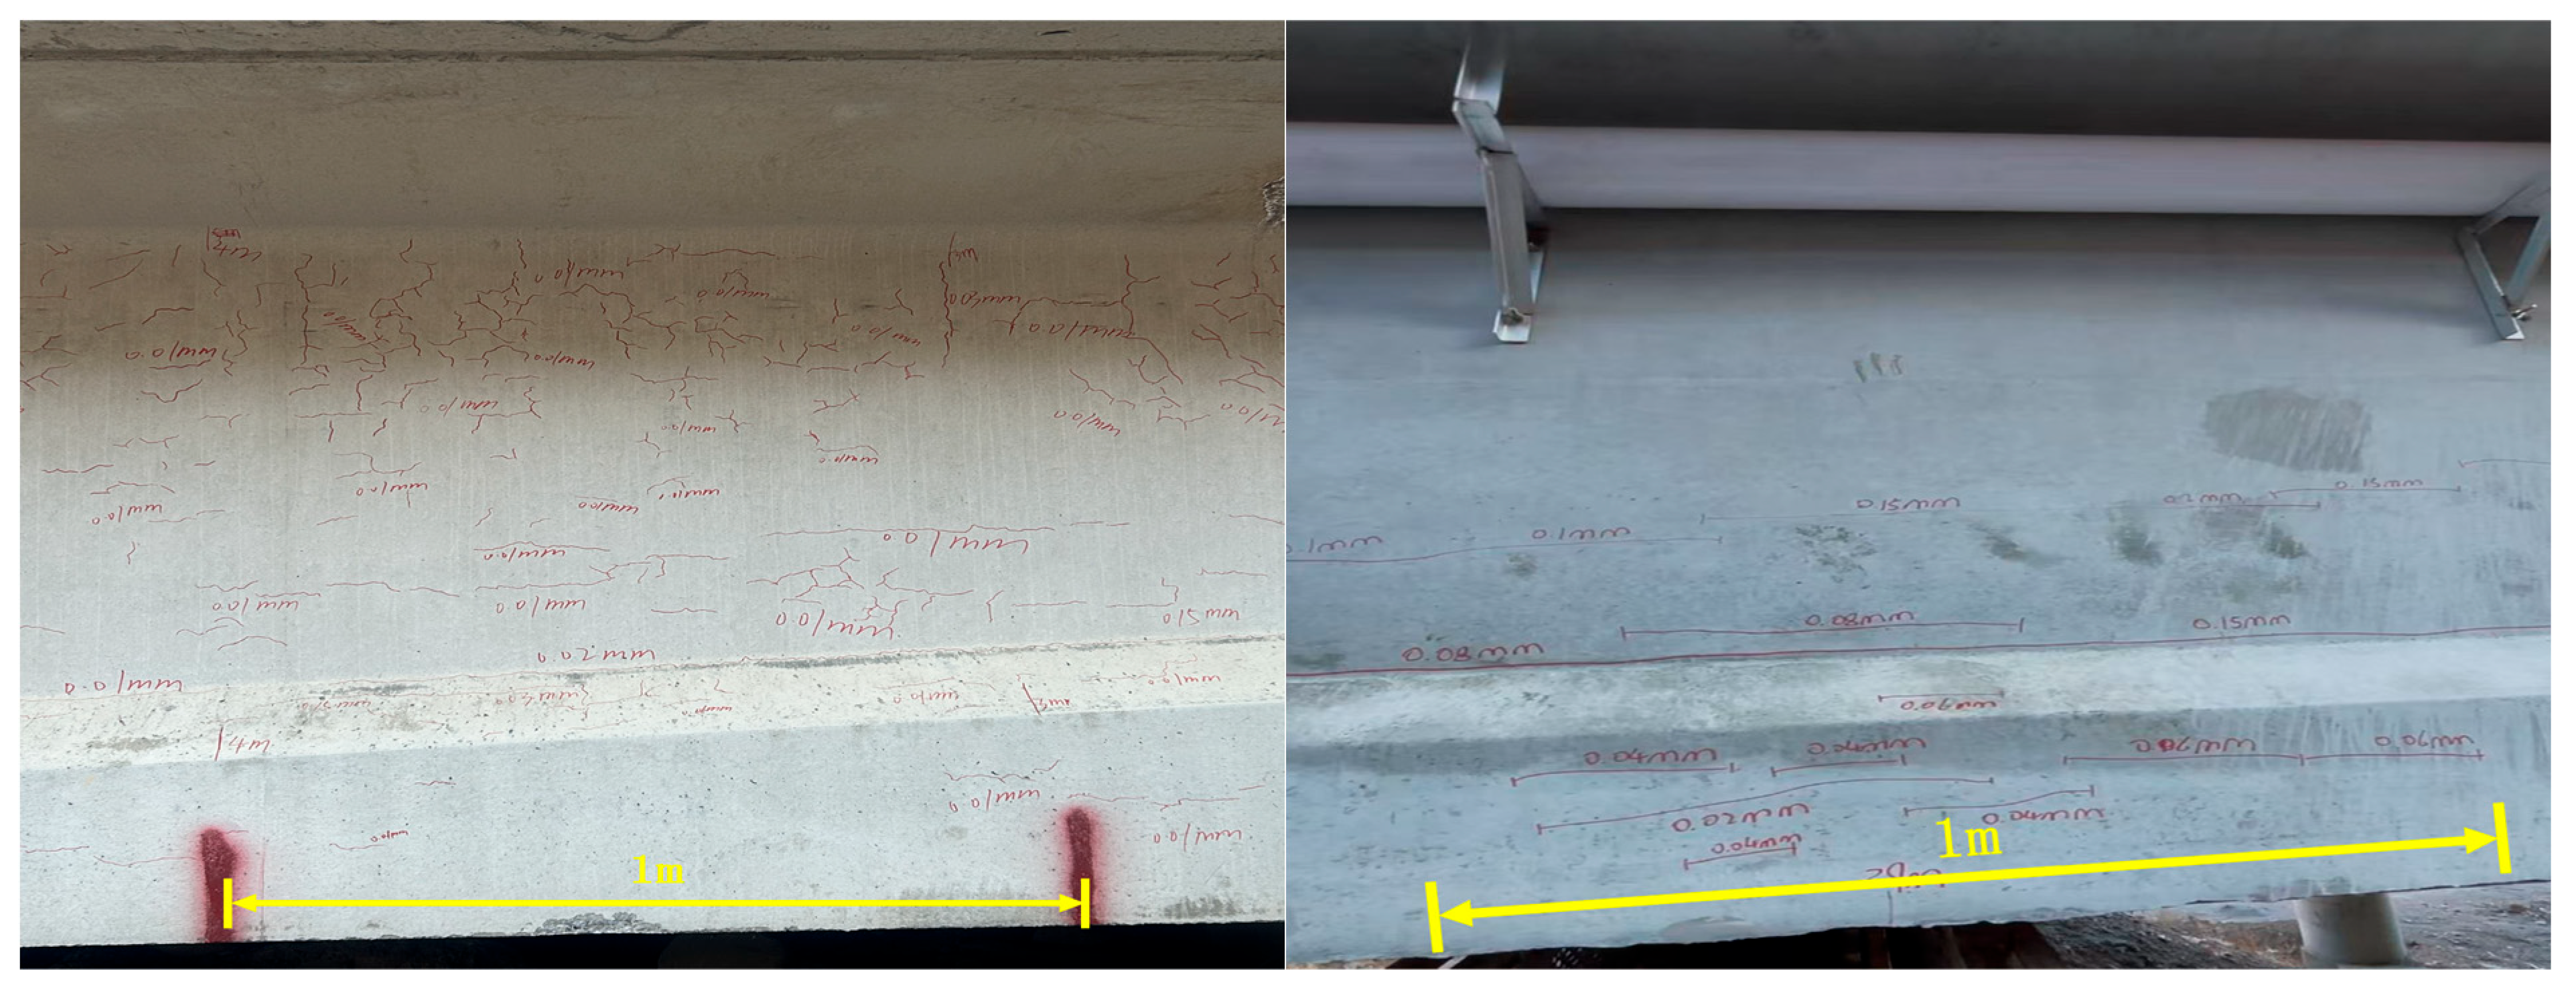
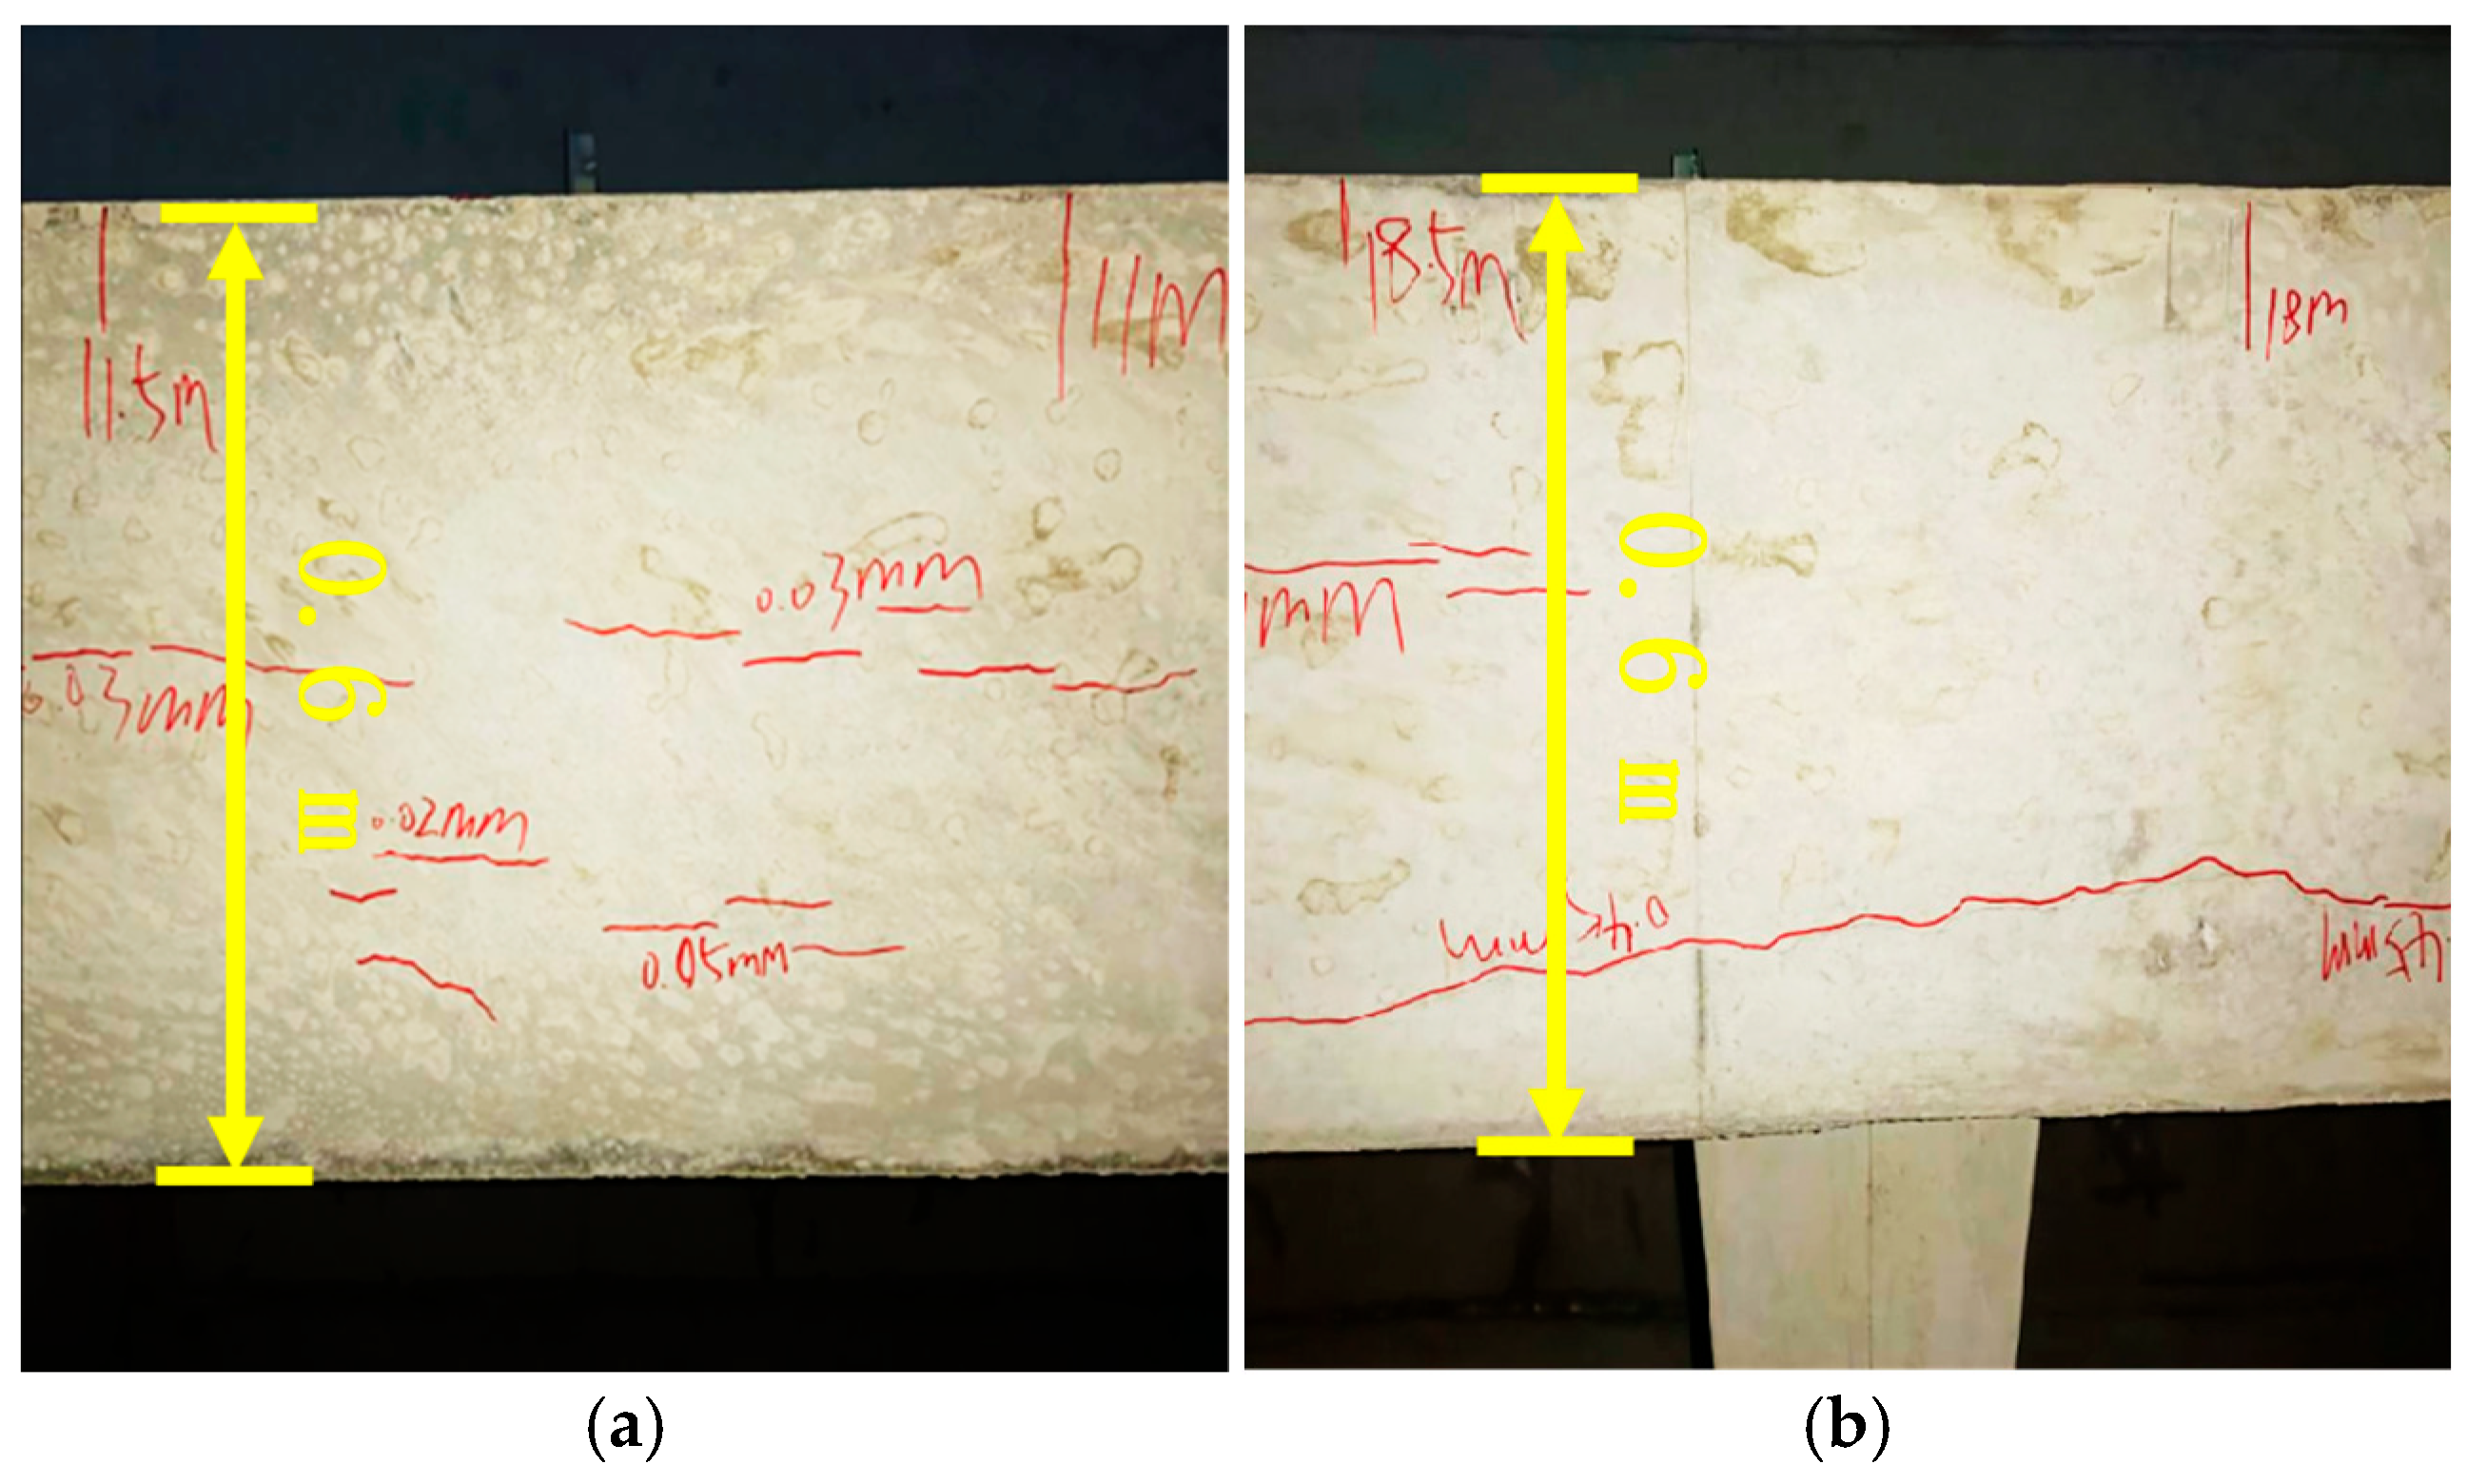
Bottom cracks mainly include two types (Figure 6). The first type is longitudinal intermittent short cracks along the girder span direction, with lengths mainly concentrated in the 2–10 cm interval and small widths. The second type is a limited number of longitudinal long cracks, generally 40–80 cm long and up to 220 cm. No obvious transverse cracks were found at the girder bottom within the monitoring range, indicating that the bottom cracking was dominated by longitudinal development rather than typical flexural transverse cracking. This is because the bending stress at the bottom of the beam is low; the cracks are primarily non-load-induced deformation cracks caused by temperature differences and shrinkage.

3.2.2. Crack-Size Distribution of the Girder Bottom

The size distribution of bottom cracks is shown in Figure 7. Crack lengths are mainly concentrated in the 2–20 cm interval, accounting for approximately 86.0%, and crack widths are mainly concentrated in the 0–0.10 mm interval, accounting for approximately 92.7%. Thus, most bottom cracks are short microcracks; it essentially complies with the maximum crack width limits specified in the “Code for Design of Concrete Structures” (GB 50010-2010) [56]. However, the few long cracks should be checked in future inspections for depth and development trend.

3.3. Crack Characteristics of Diaphragms

3.3.1. Crack Morphology of Diaphragms

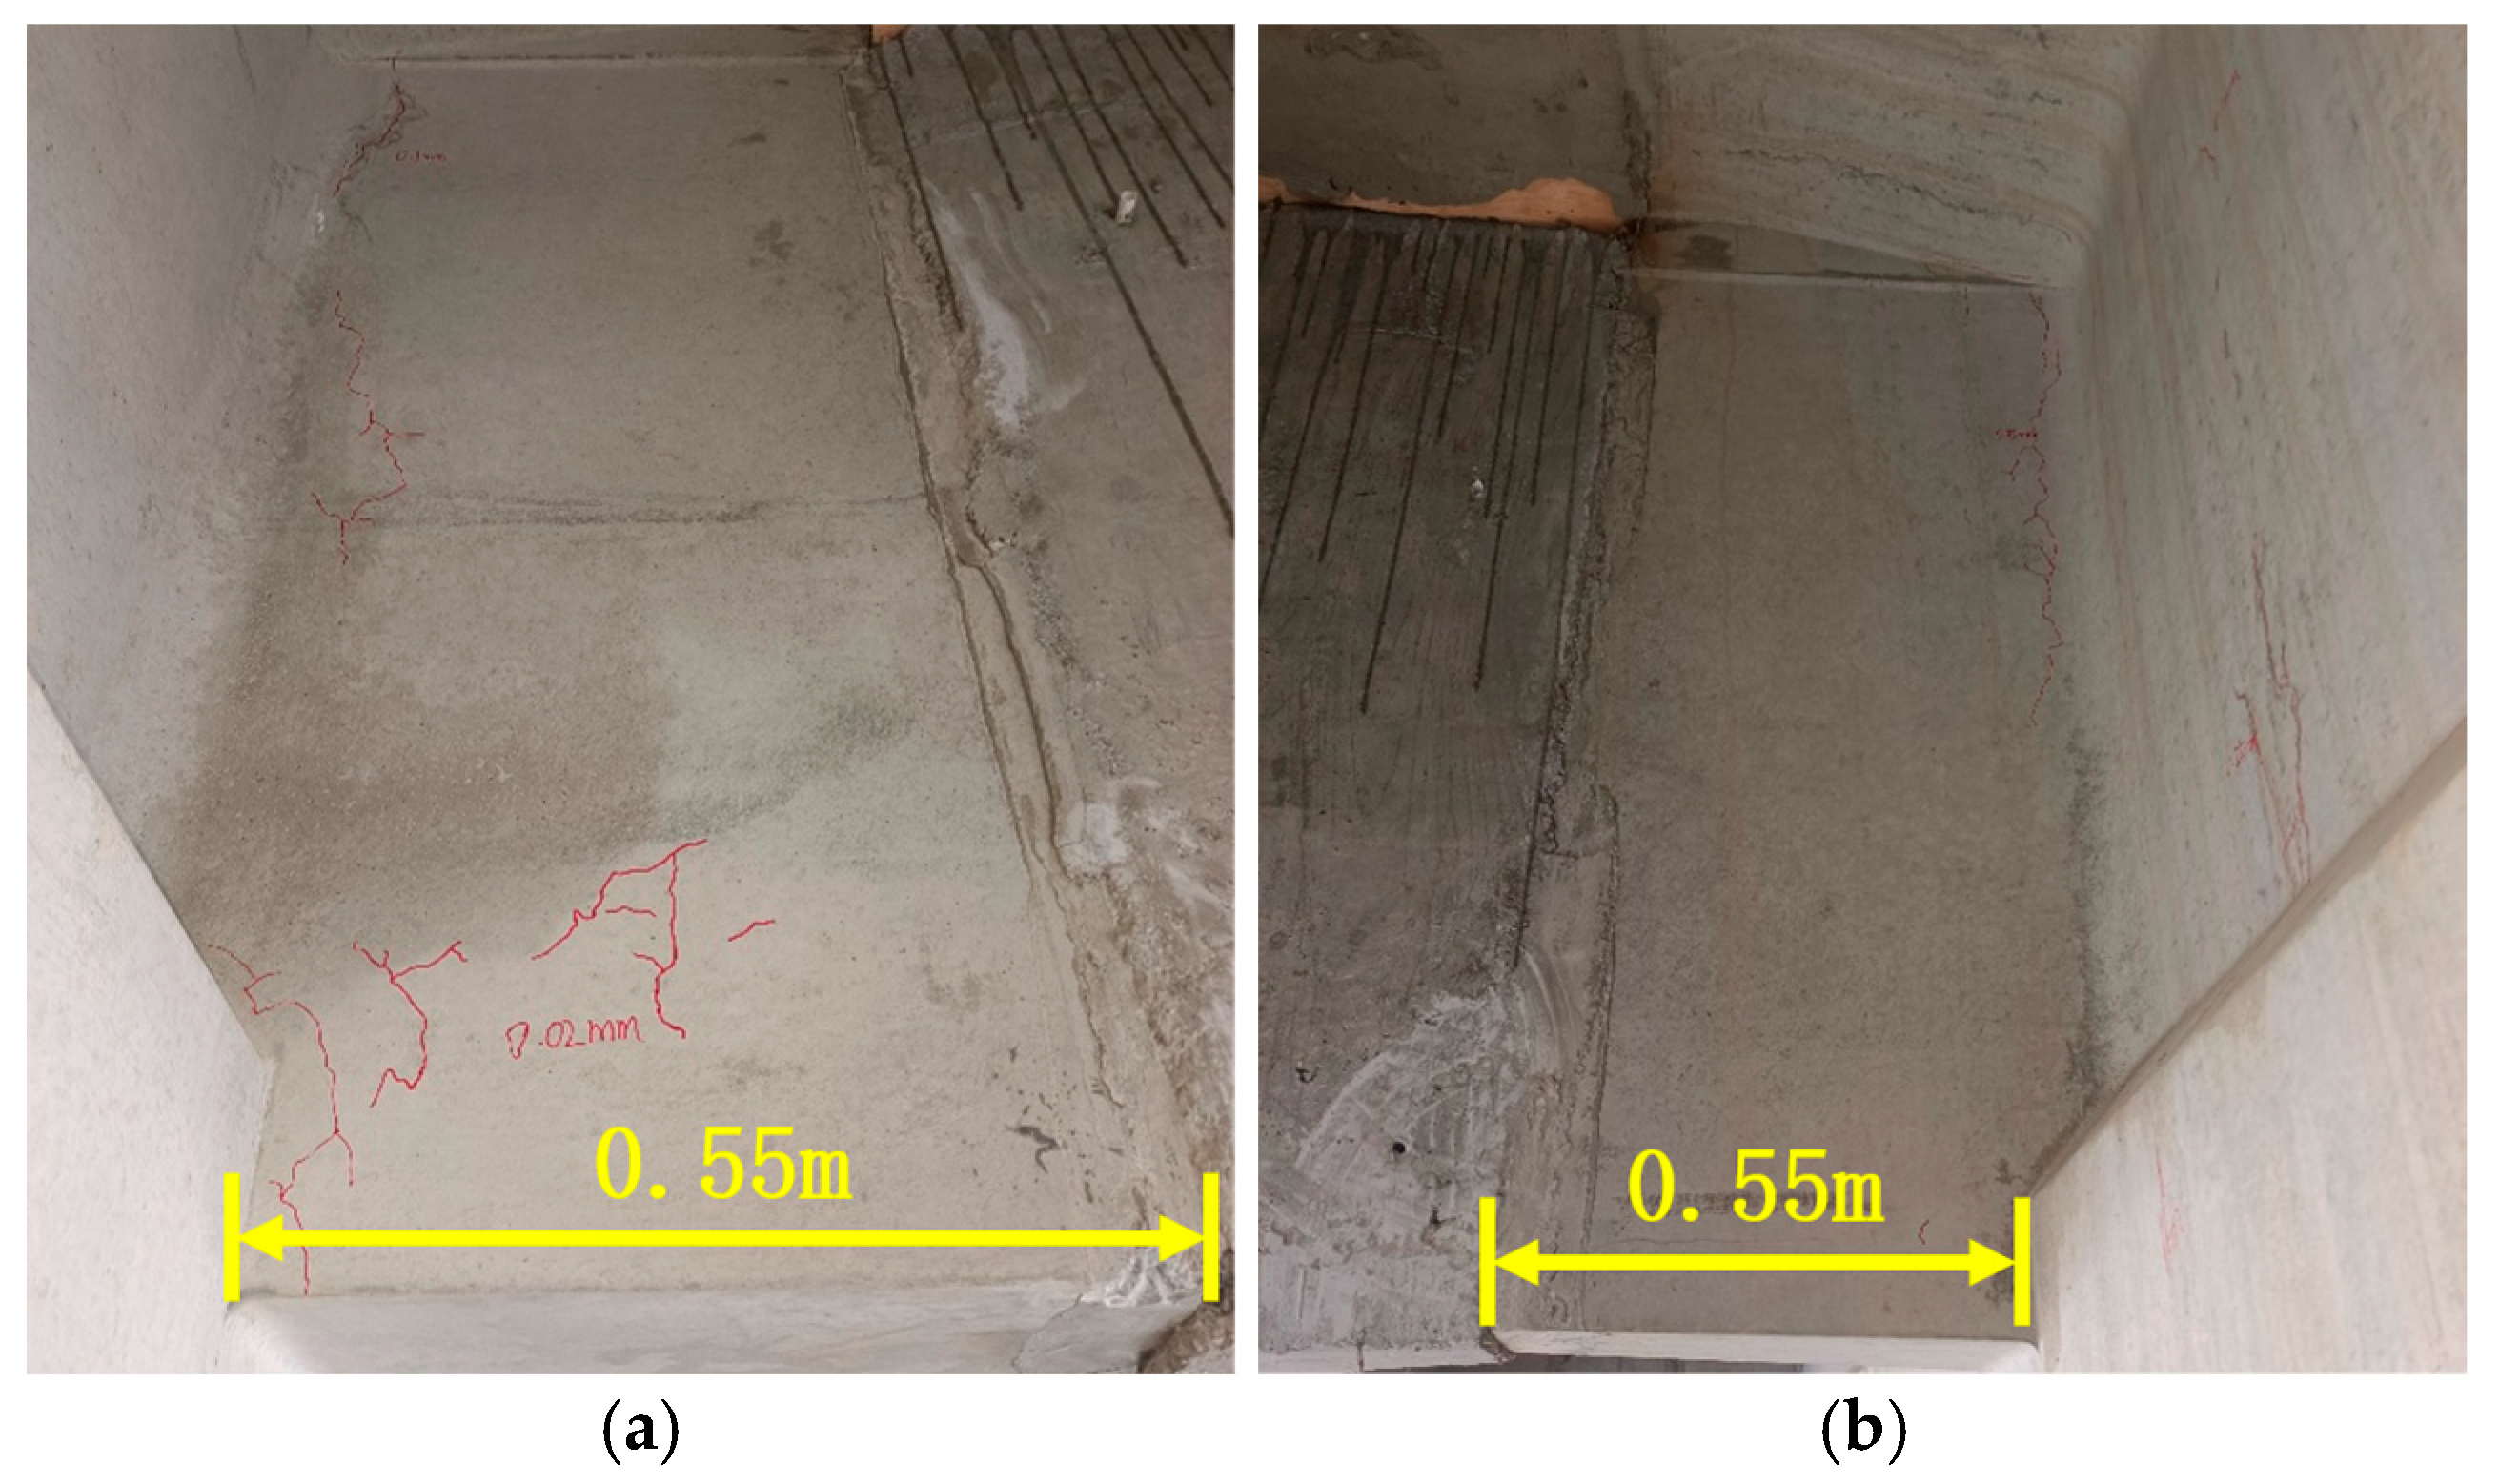
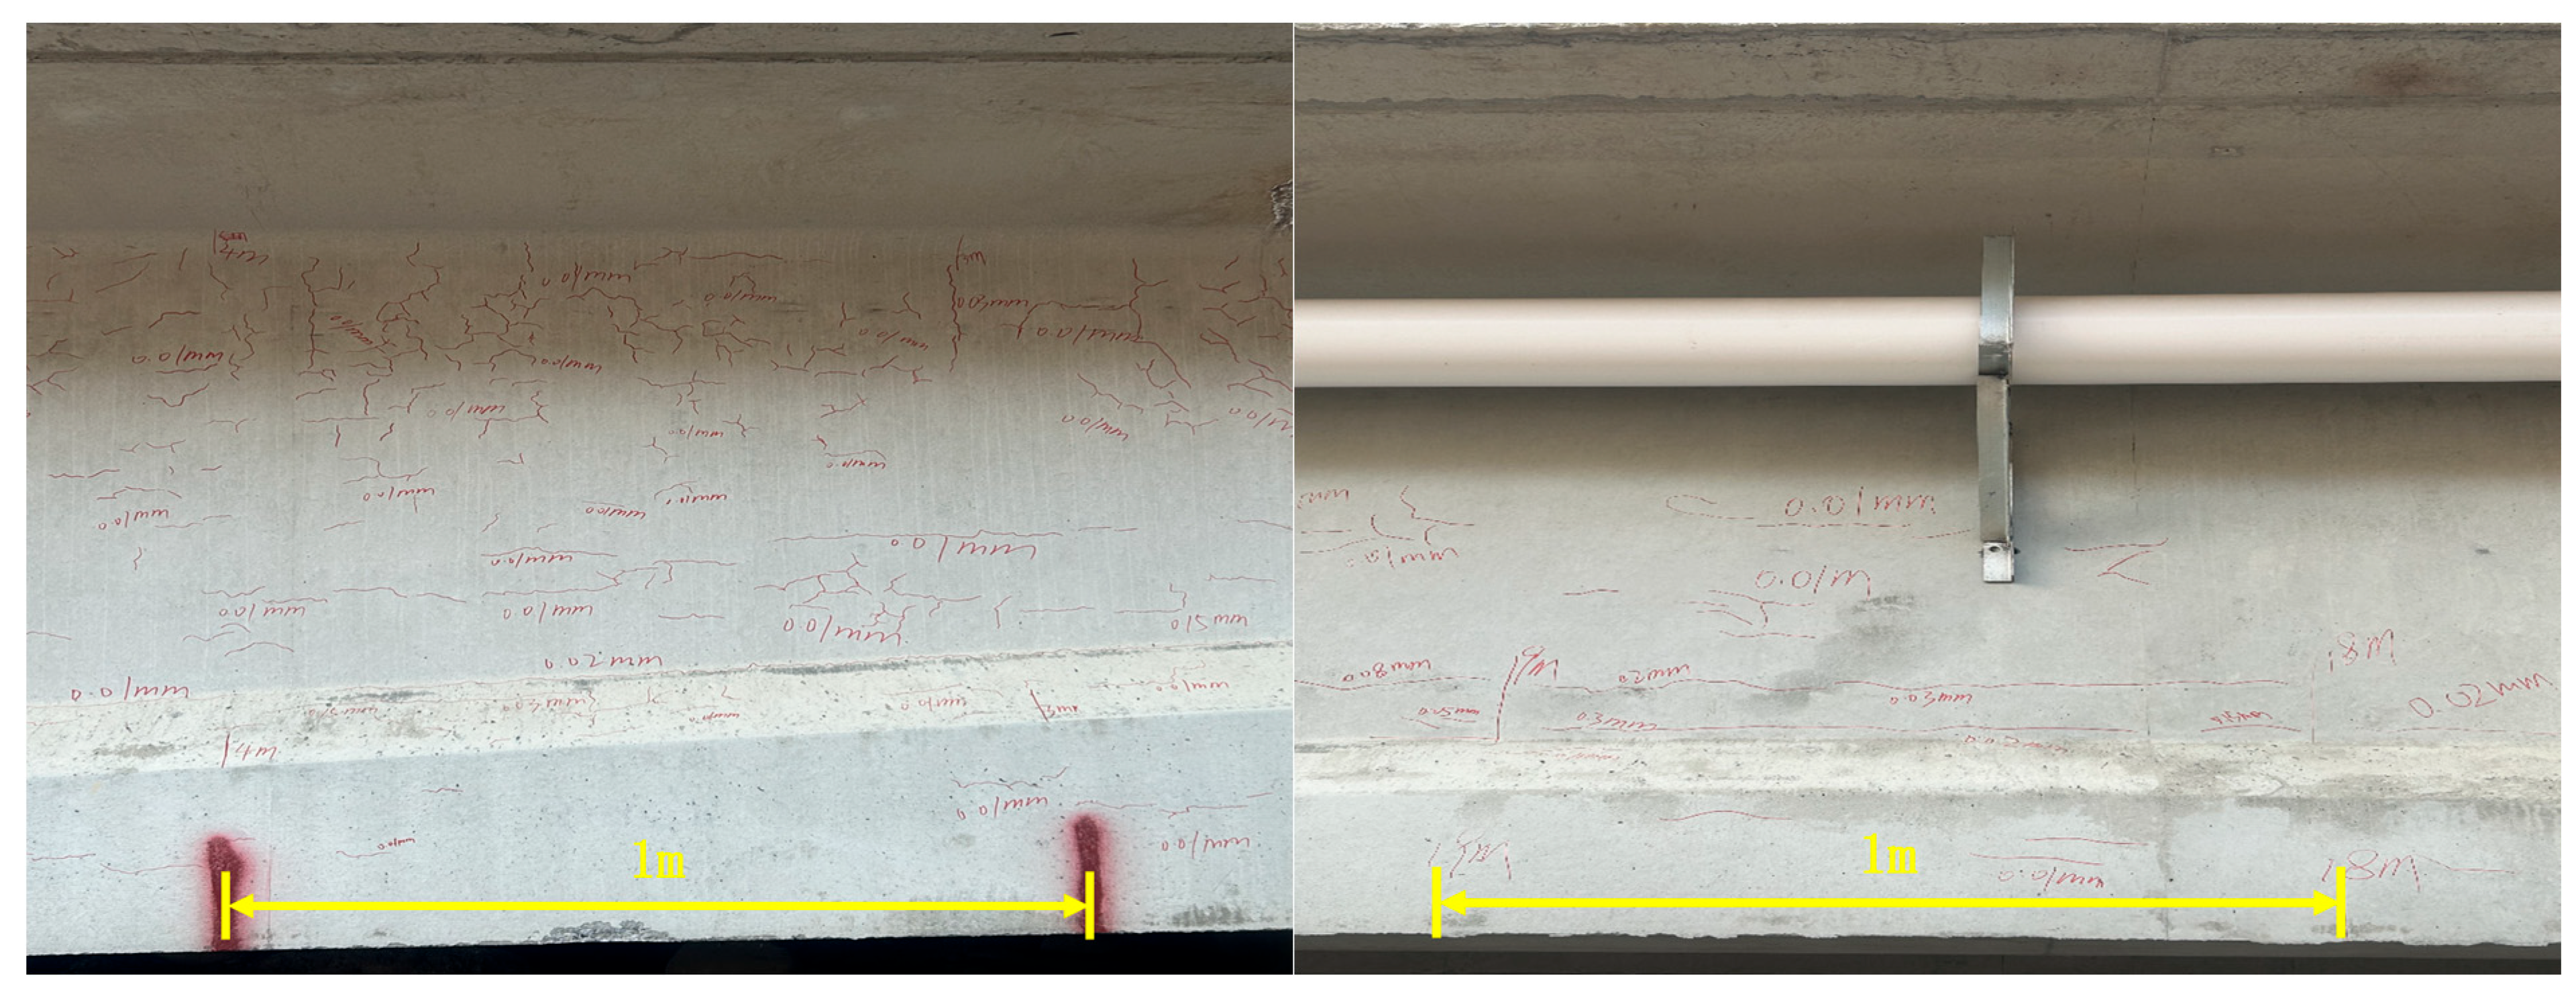
Diaphragm cracks also show two typical forms (Figure 8). The first type is reticular or irregular cracks with widths generally not exceeding 0.06 mm and a relatively wide distribution. The second type occurs at the intersection between the diaphragm and the top slab or web. Because of geometric discontinuity and local restraint, diaphragm corners are sensitive to stress concentration; cracks develop along the intersection line and usually remain within 0.10 mm in width.

3.3.2. Crack-Size Distribution of Diaphragms

The diaphragm crack-size distribution is shown in Figure 9. Crack lengths are mainly distributed in the 5–20 cm interval, accounting for about 66.8%, and widths are mainly in the 0–0.06 mm interval, accounting for about 86.4%. It essentially complies with the maximum crack width limits specified in the “Code for Design of Concrete Structures” (GB 50010-2010) [56]. Similar to web cracks, diaphragm cracks are dominated by microcracks, but their occurrence is more strongly controlled by corner geometry and local restraint.

3.4. Analysis of Crack Width, Depth and Concrete Cover Thickness

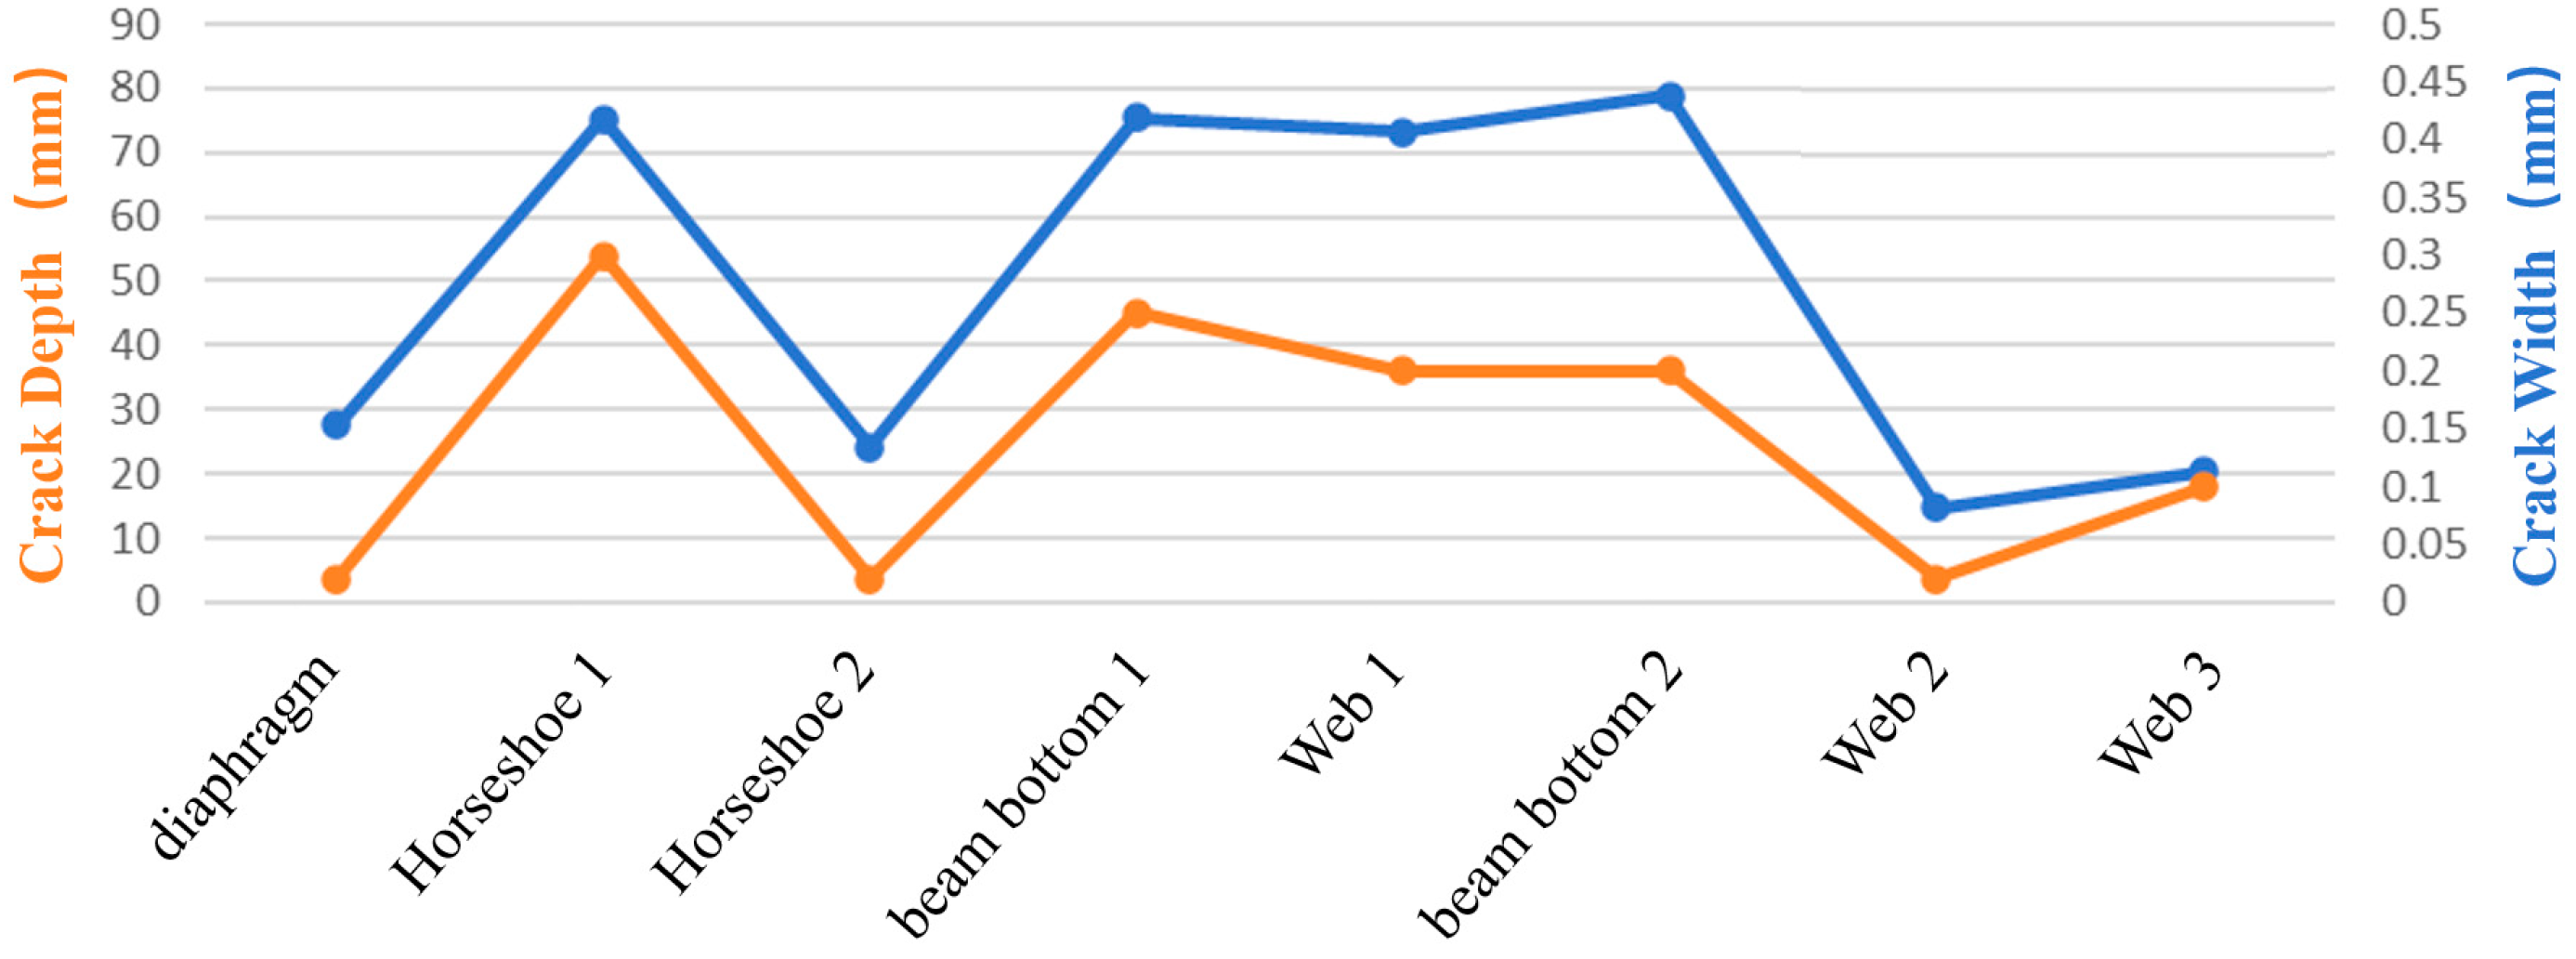
Crack depth is a critical parameter affecting the durability and load-bearing capacity of concrete structures. Measurements were taken of the concrete cover thickness and the depths of typical cracks located on the web regions, diaphragms, and other parts of a prestressed concrete T-girder. The average concrete cover thickness for the T-girder web regions and diaphragms is approximately 40 mm. This study selected eight representative cracks from various locations on a single T-girder—including the web regions (web regions 1, 2, and 3), diaphragms, girder bottoms (Bottom Flanges 1 and 2), and the beam soffits (Soffits 1 and 2)—to analyze the relationship between crack width, crack depth, and cover thickness. As shown in Figure 10, a positive correlation exists between crack width and crack depth: narrower cracks are shallower. Most hairline cracks with widths under 0.1 mm are confined to the concrete surface layer, with depths ranging from 15 mm to 28 mm, meaning they have not yet penetrated the concrete cover. In contrast, when crack widths exceed 0.2 mm, depths range from 73 mm to 79 mm; these depths generally exceed the cover thickness at the respective locations, indicating that the cracks have penetrated the cover to reach the surface of the reinforcement. Such penetrating cracks significantly compromise the concrete’s physical barrier protecting the reinforcement, creating rapid pathways for aggressive agents—such as chloride ions, moisture, and carbon dioxide—to accelerate rebar corrosion and concrete carbonation, thereby posing a serious threat to the structure’s durability.

4. Time-Dependent Crack Behavior

From December 2024 to March 2025, the bridge site was inspected once each month. The 721 marked cracks on the monitored T-girder were tracked for four months to evaluate whether existing cracks developed further and whether new cracks appeared under the winter-spring environmental conditions of the Western Sichuan Plateau.

4.1. Newly Developed Cracks

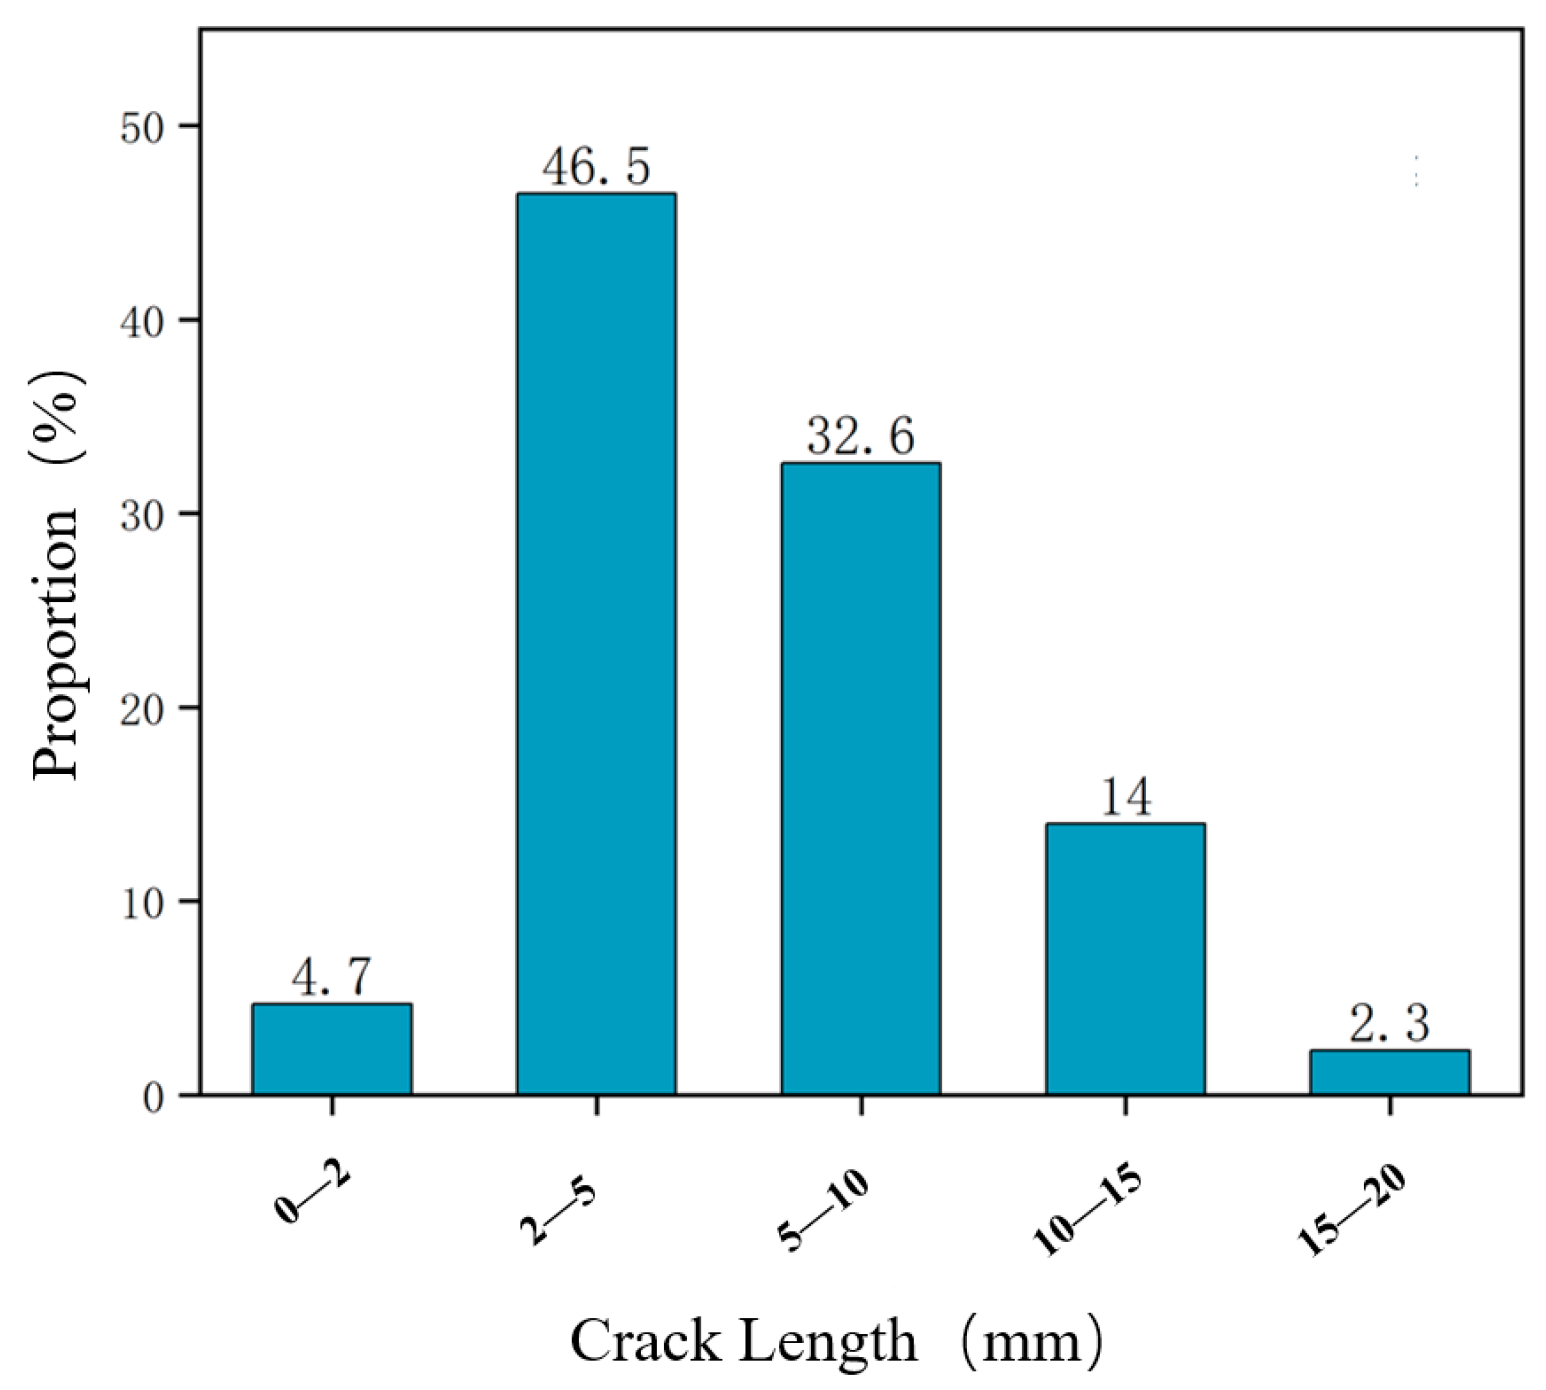
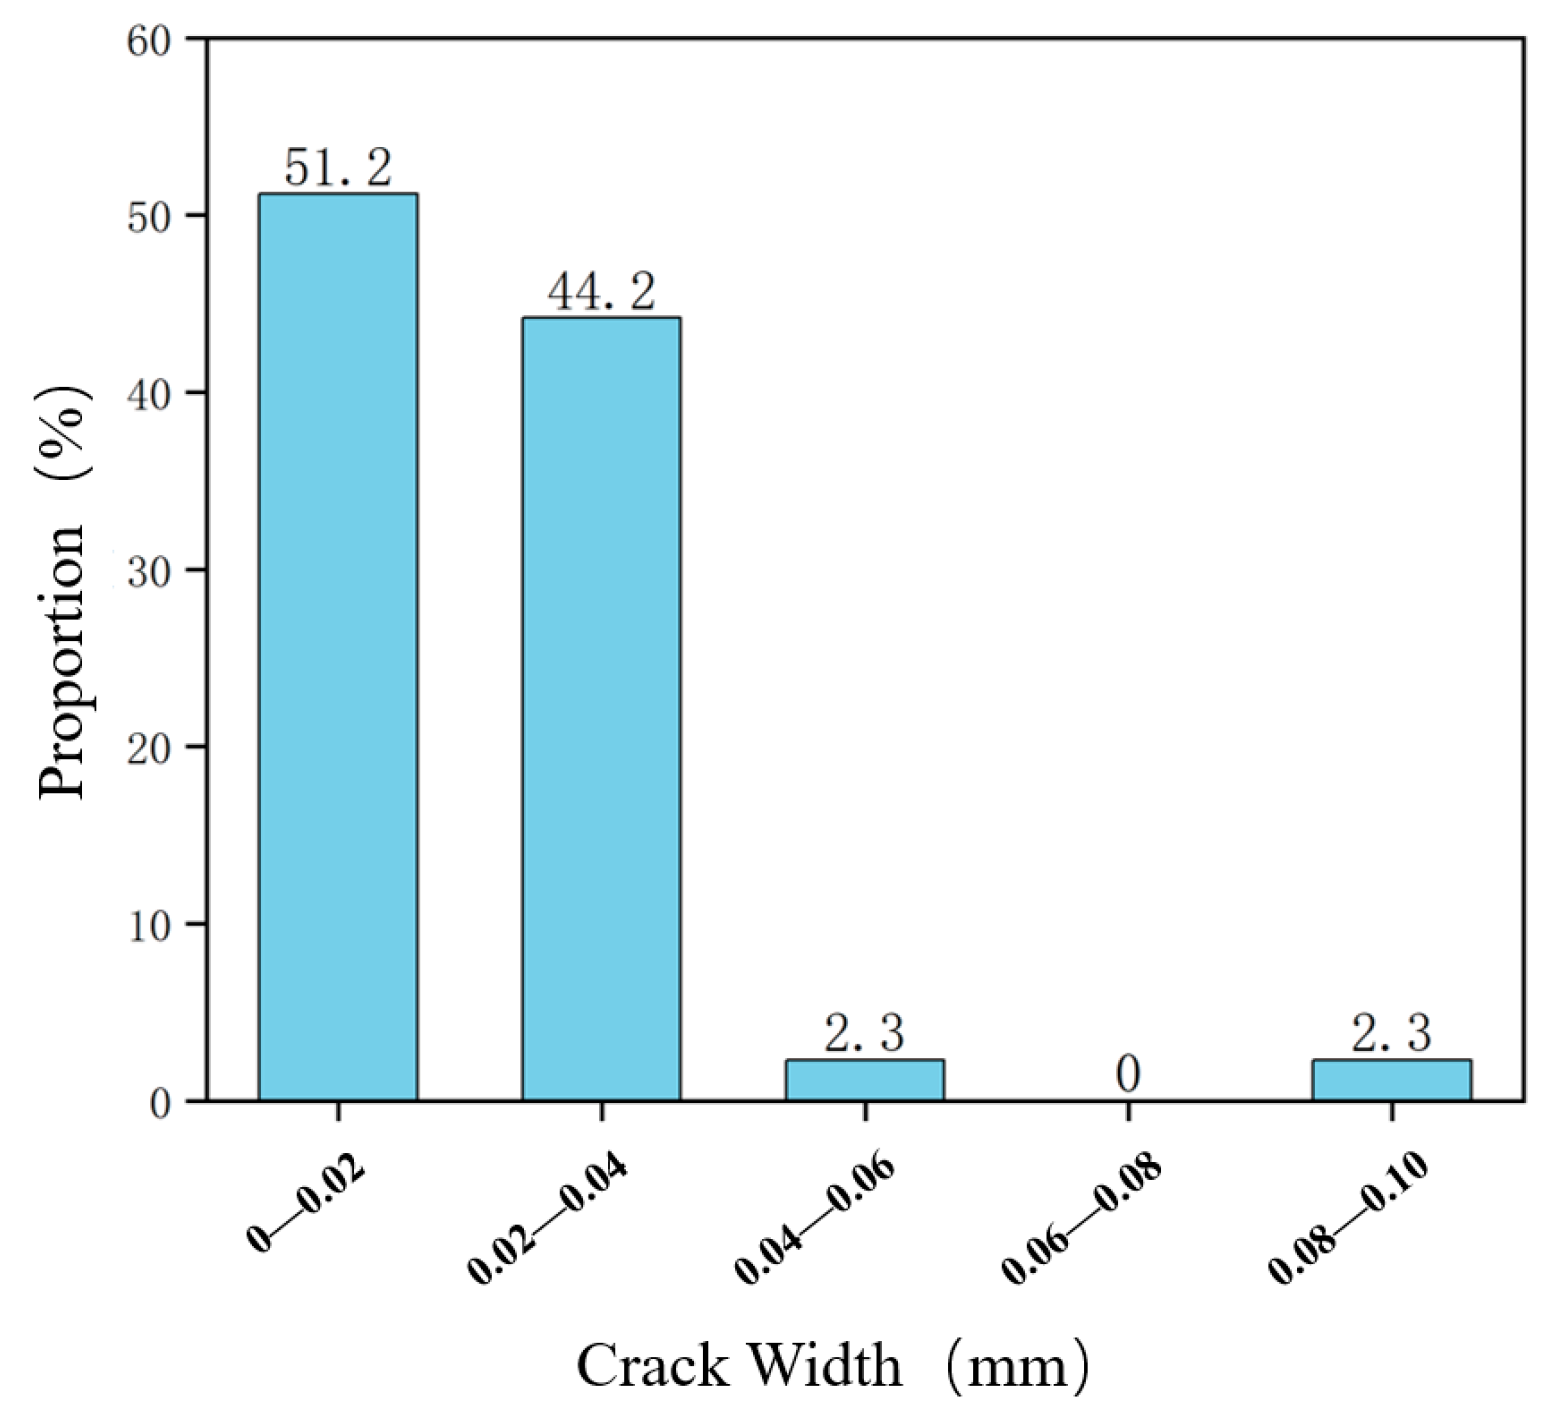
Only a small number of new cracks appeared during the monitoring period. These cracks were mainly reticular or irregular microcracks with widths not exceeding 0.04 mm and were generally distributed around existing reticular or irregular cracks. No newly developed large cracks were observed. Statistical results indicate that new cracks accounted for about 6.0% of all recorded cracks; their lengths were mainly 2–20 cm and their widths were mainly 0–0.10 mm (Figure 11 and Figure 12). Thus, within the monitoring period, the crack state of the in-service T-girder did not show rapid deterioration.

4.2. Development of Existing Cracks

Most existing cracks in the web, bottom and diaphragms did not expand obviously. Among the 721 marked cracks, only three cracks increased in length by about 4–6 cm (Table 1). These cracks were located near local stress-concentration regions such as the intersection between the web and the top slab. The remaining cracks showed no significant length change, indicating that corner regions should be emphasized in subsequent periodic inspection.

5. Temperature Response of Crack Width

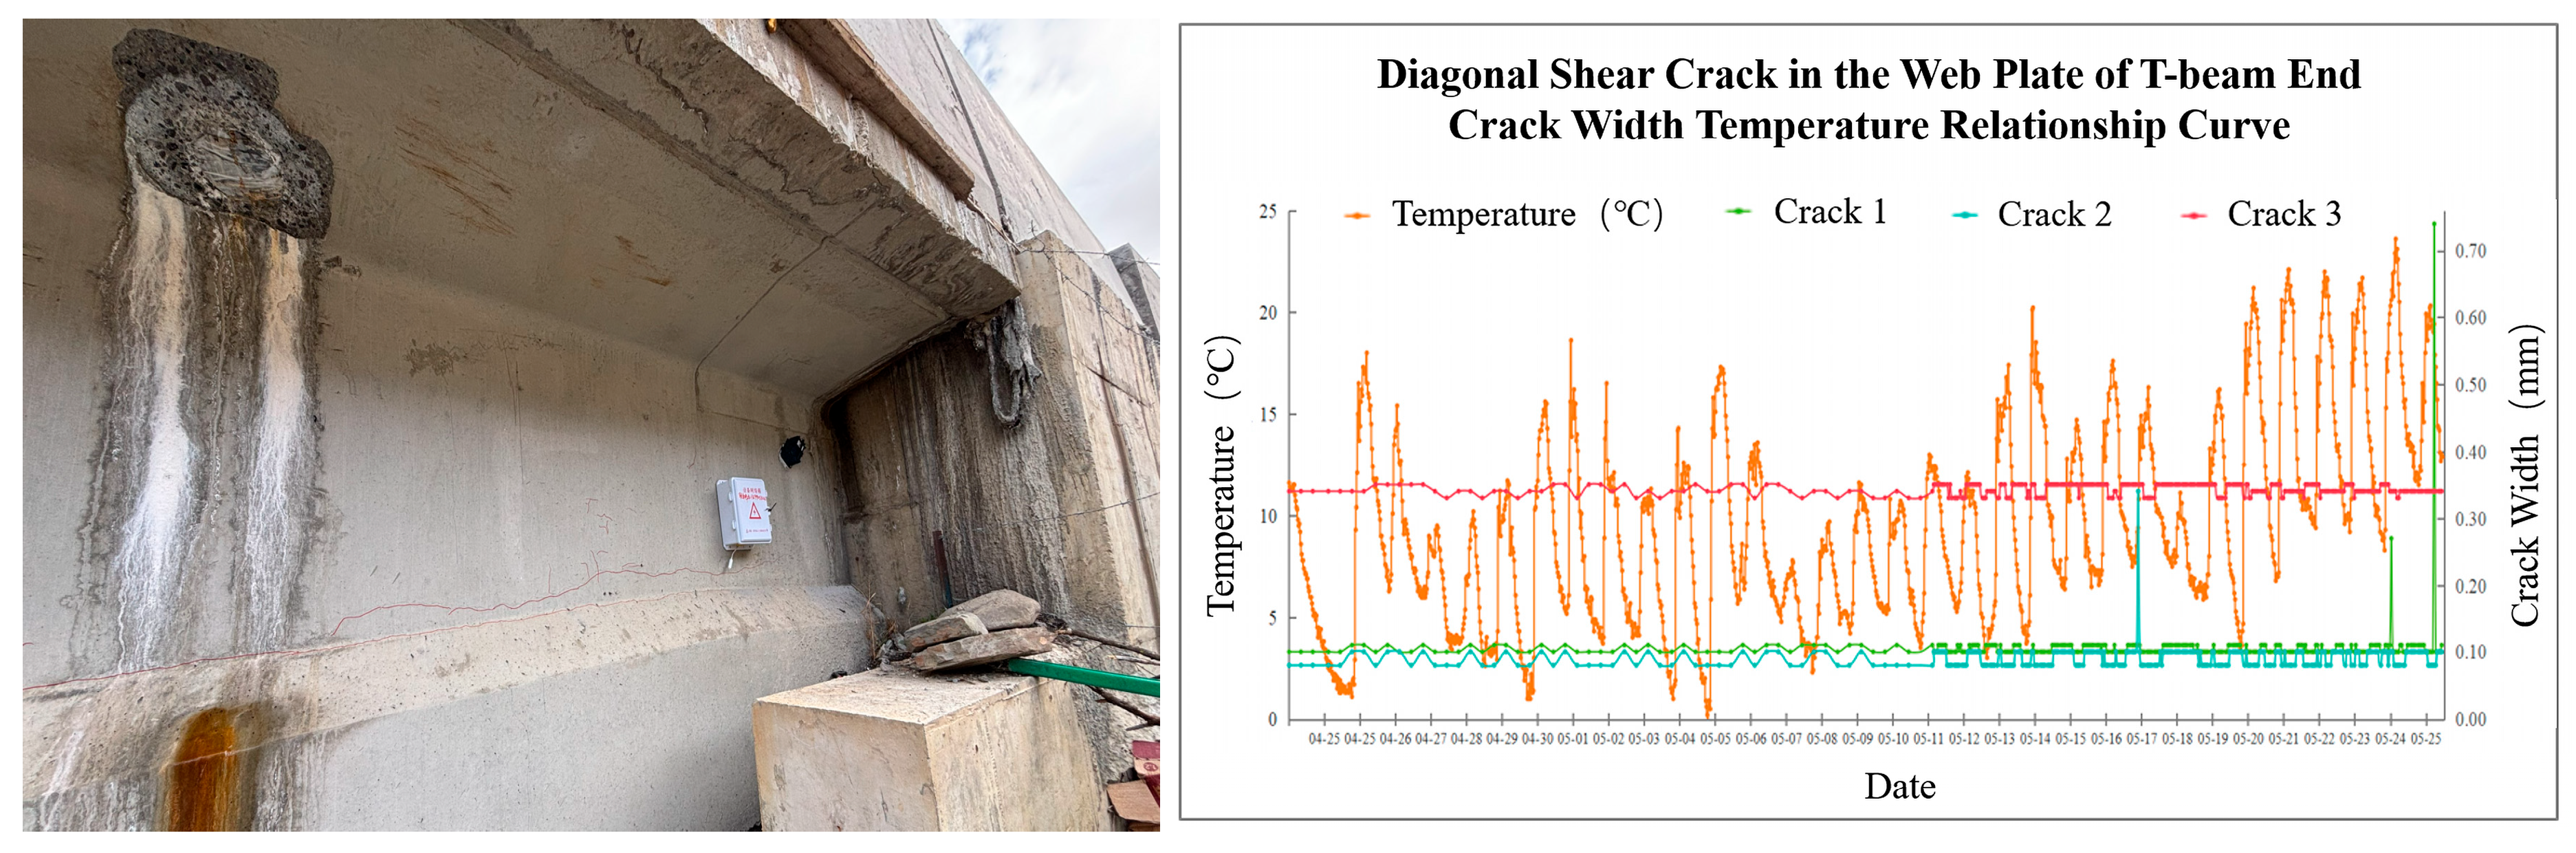
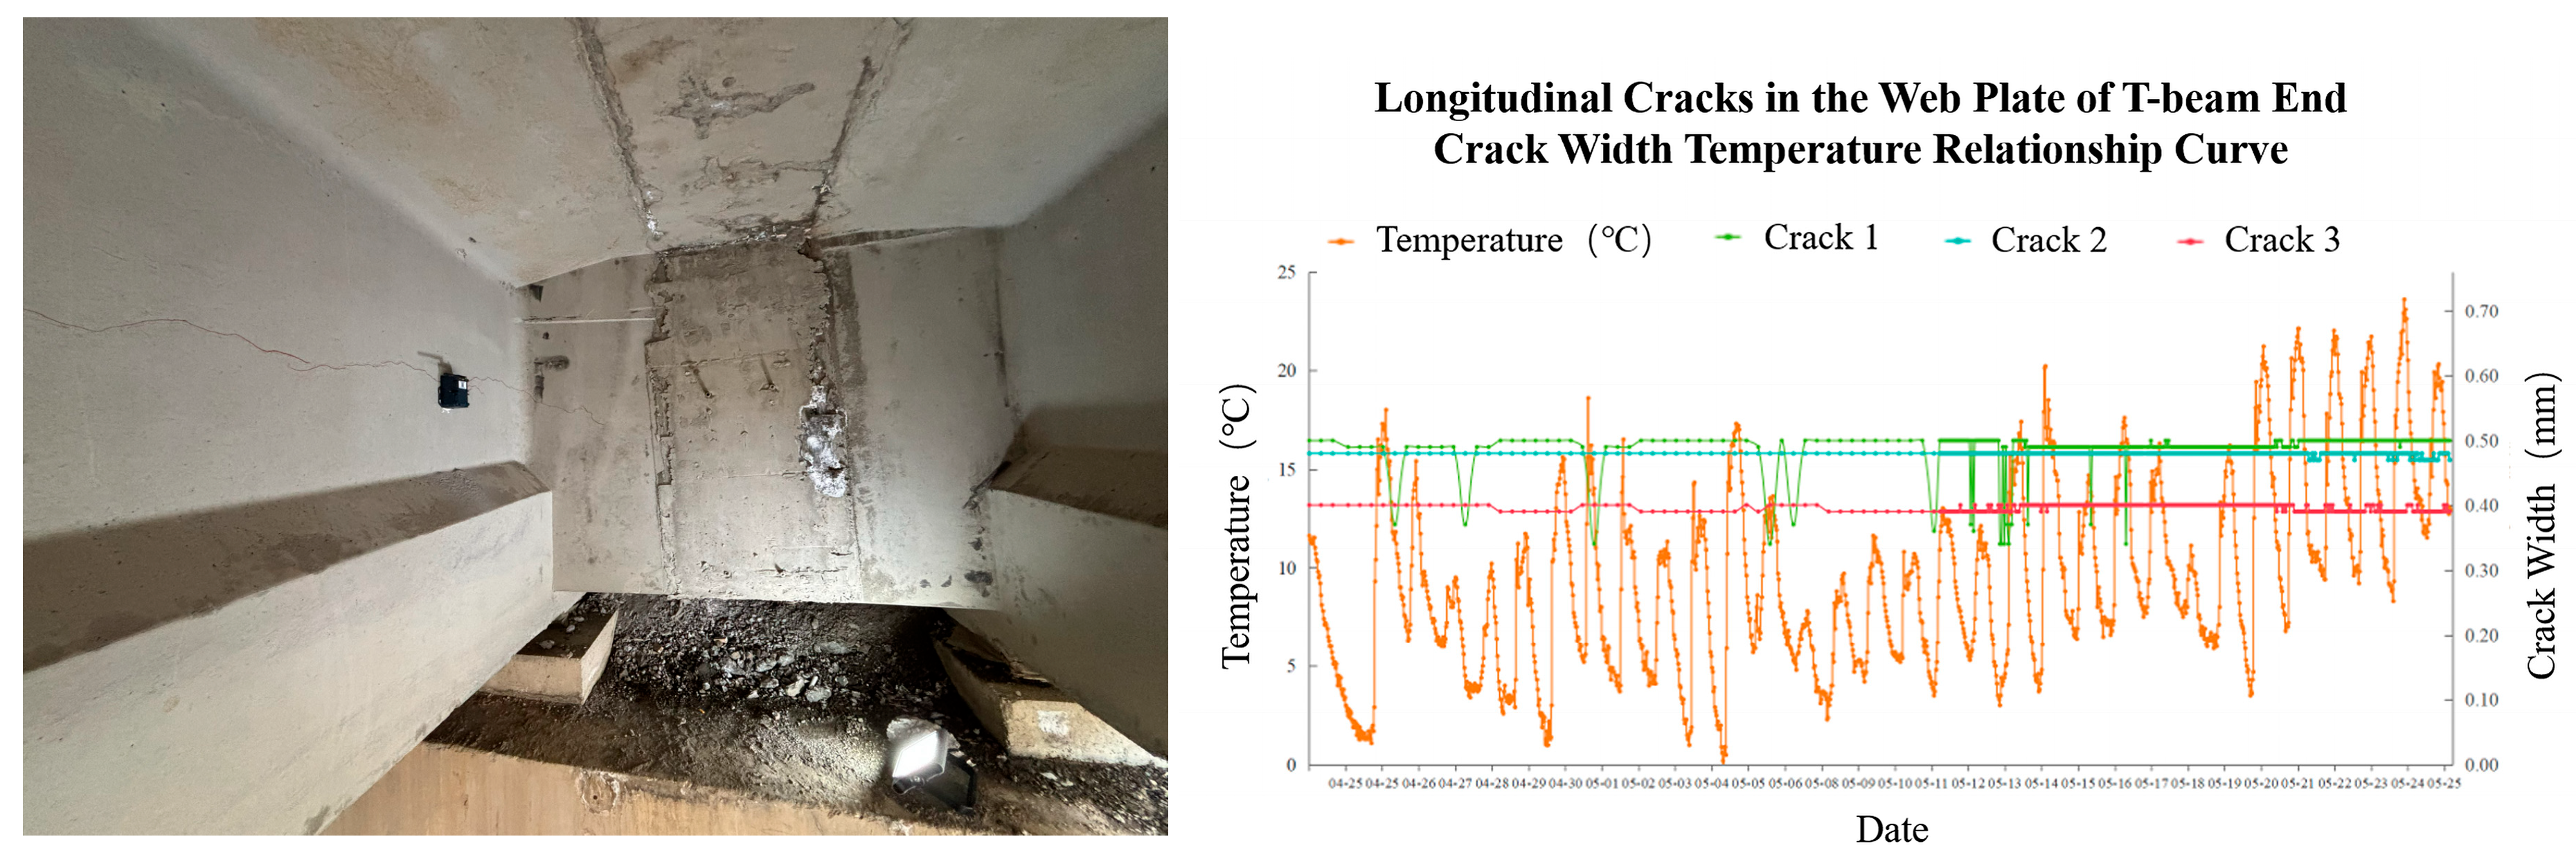
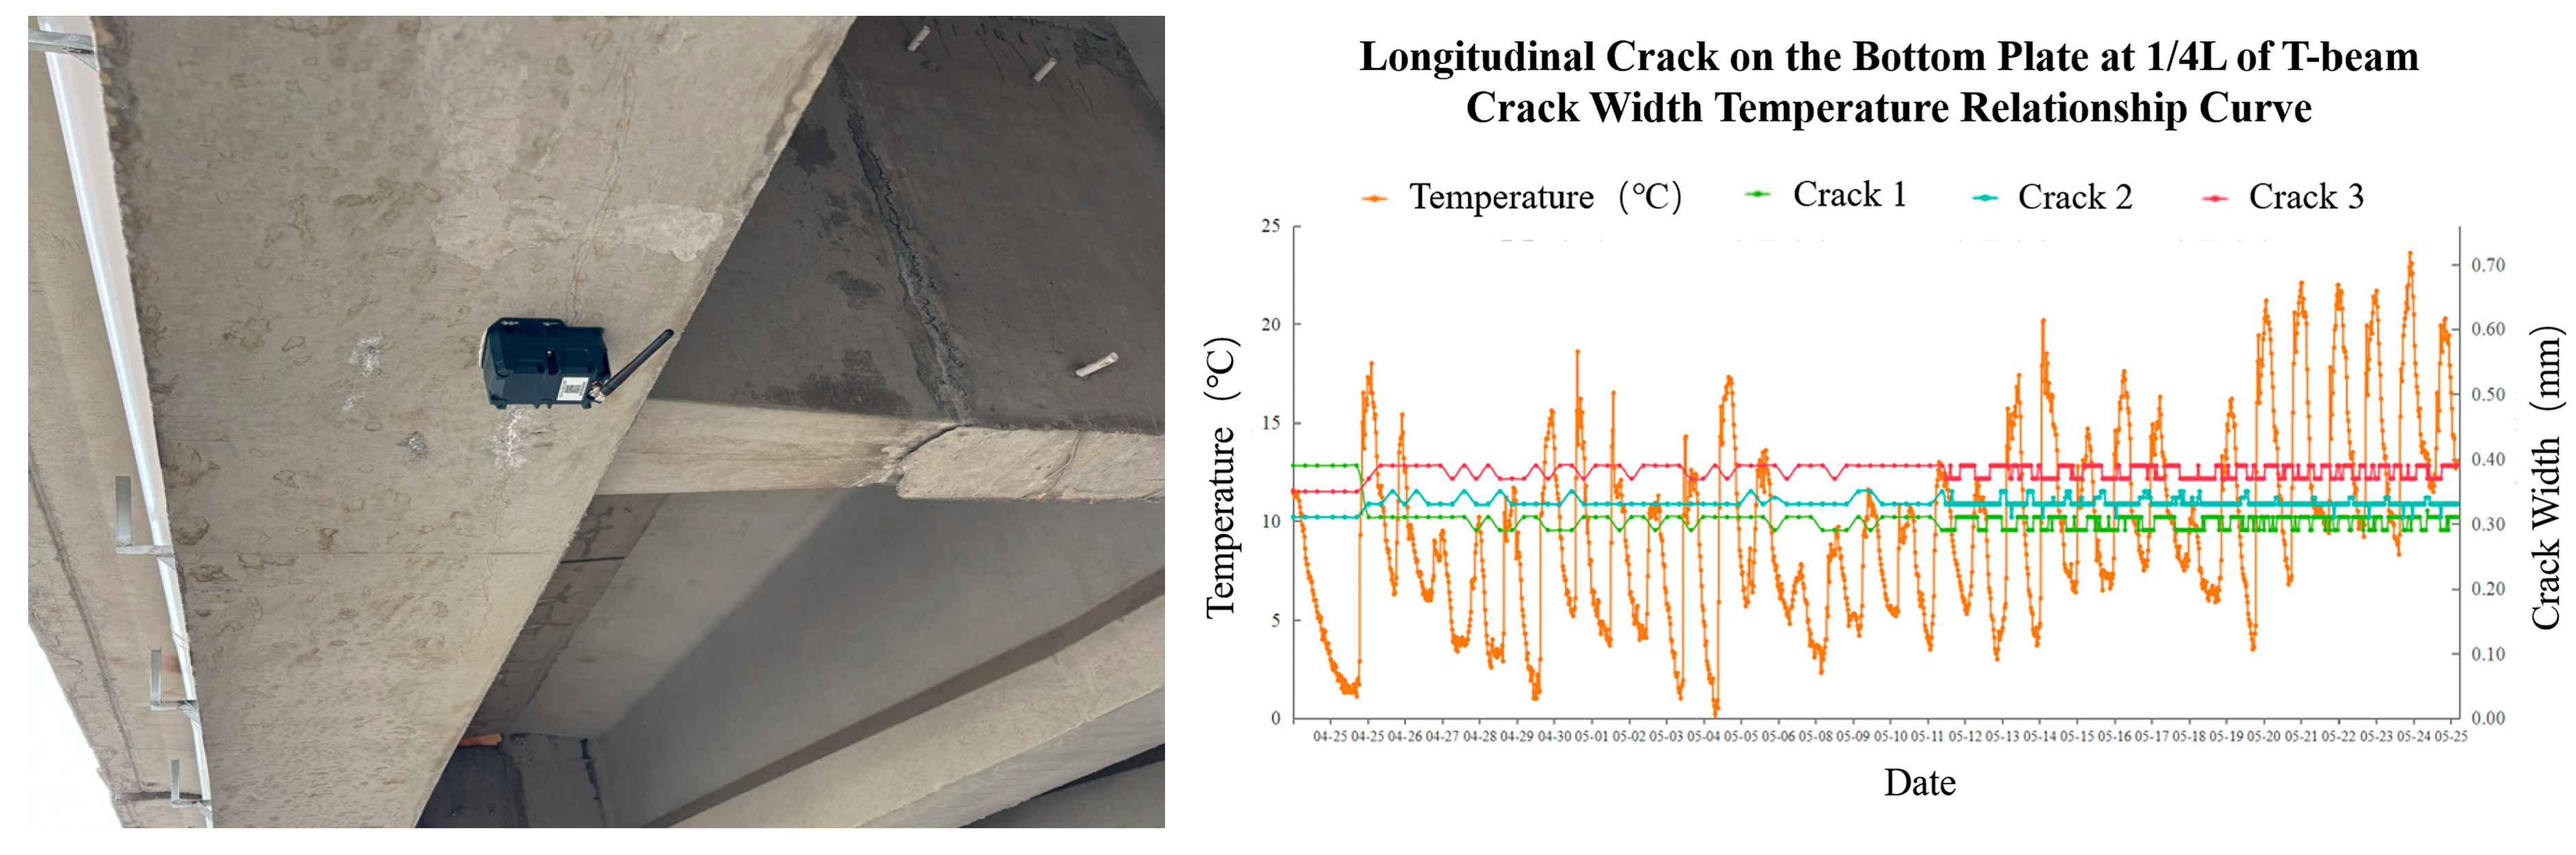
Long-term dynamic monitoring was conducted on three specific cracks in a prestressed concrete T-girder—namely, diagonal shear cracks in the web at the beam end, longitudinal cracks in the web at the beam end, and longitudinal cracks in the girder bottom at the quarter-span (1/4 L) location. Crack widths and temperatures were recorded simultaneously to analyze and compare the patterns of crack width propagation at key sections of the beam under the influence of temperature fluctuations in the Western Sichuan Plateau. The curves illustrating the relationship between crack width and temperature (Figure 13, Figure 14 and Figure 15) reveal that, despite the drastic temperature variations in the Western Sichuan Plateau (ranging from −1 °C to 24 °C), the crack widths remained generally stable. The widths ranged from 0.1 mm to 0.5 mm, with fluctuations of approximately 0.02 mm, and showed no trend of monotonic linear growth; this indicates that fine cracks (width ≤ 0.5 mm) in the prestressed concrete T-girder remain stable under the environmental conditions of the Western Sichuan Plateau, characterized by significant temperature differences.
This study is limited to one 40 m T-girder and a four-month winter-spring monitoring period.
The scientific advancement of this study lies in combining three types of information that are often reported separately: crack-size distribution, crack-depth/cover comparison and crack-width response to ambient temperature. The observed 0.02 mm reversible fluctuation suggests that short-term temperature variation mainly induced recoverable width changes in the monitored fine cracks. In contrast, cracks wider than 0.20 mm were likely to penetrate the cover and should therefore be prioritized for sealing, waterproofing and repeated depth verification. This combined criterion can help bridge managers distinguish visually abundant microcracks from fewer but more durability-critical penetrating cracks.
The results confirm that the crack pattern of the monitored T-girder is governed by both structural location and environmental exposure. The dominant web and diaphragm cracks were microcracks, but the sunny side of the edge girder exhibited about 4.8 times more cracks than the shaded side. This agrees with plateau bridge studies showing that asymmetric solar radiation and temperature gradients can produce nonuniform cracking in exposed concrete members [50,51,52]. For practical bridge inspection, this means that sunny and shaded faces should be recorded separately in high-altitude mountainous regions rather than being merged into a single crack-density index.

6. Conclusions

Focusing on a 40 m prestressed concrete T-girder bridge on the Western Sichuan Plateau, this study conducted field crack mapping and four-month monitoring from December 2024 to March 2025. The main conclusions are as follows:
(1)
The monitored bridge was dominated by microcracks. Web and diaphragm crack widths were mainly 0–0.04 mm, and bottom-crack widths were mainly 0–0.10 mm. Crack lengths in the main components were mostly 2–20 cm, indicating that crack quantity alone should not be used as the sole durability index.
(2)
Crack distribution showed a clear exposure-orientation effect. The sunny side of the edge girder contained about 598 cracks, approximately 4.8 times the 123 cracks on the shaded side. Solar radiation and daily temperature variation should therefore be considered when inspecting beam bridges in high-altitude mountainous regions.
(3)
Crack depth was positively related to crack width. Most cracks narrower than 0.10 mm remained within the concrete surface layer, whereas cracks wider than 0.20 mm generally exceeded the approximately 40 mm concrete cover and therefore posed greater durability risk.
(4)
During the four-month monitoring period, newly developed cracks accounted for about 6.0% of all recorded cracks, and only three of the 721 existing cracks increased by 4–6 cm. These growing cracks were mainly located near web-to-top-slab corner regions and should be treated as key follow-up zones.
(5)
Under the measured temperature range of −1 to 24 °C, representative crack widths fluctuated by about 0.02 mm without sustained growth. For maintenance, cracks wider than 0.20 mm and deeper than the concrete cover should be prioritized for sealing, waterproofing and periodic remeasurement.

Author Contributions

Conceptualization, Y.Z.; methodology, Y.Z. and N.X.; investigation, Y.Z.; data curation, Y.Z. and X.Z.; writing—original draft preparation, X.Z.; writing—review and editing, all authors. All authors have read and agreed to the published version of the manuscript.

Funding

Sichuan Province Transportation Technology Project; Evolution Mechanism and Prevention Technology of Concrete Cracks in Bridge and Tunnel Engineering in High altitude, Cold, and Temperature Difference Mountainous Areas; Project Number: 2025-C-03.

Data Availability Statement

The data presented in this study are publicly available and included in the article. Further inquiries can be directed to the corresponding author.

Acknowledgments

The authors acknowledge the field inspection and monitoring support provided during the bridge survey.

Conflicts of Interest

The authors declare no conflicts of interest.

References

  1. ACI 224R-01; Control of Cracking in Concrete Structures. American Concrete Institute: Farmington Hills, MI, USA, 2001. Available online: https://www.concrete.org/store/productdetail.aspx?ItemID=22401 (accessed on 1 July 2026).
  2. Mehta, P.K.; Monteiro, P.J.M. Concrete: Microstructure, Properties, and Materials, 4th ed.; McGraw-Hill Education: New York, NY, USA, 2014; Available online: https://www.accessengineeringlibrary.com/content/book/9780071797870 (accessed on 1 July 2026).
  3. Neville, A.M. Properties of Concrete, 5th ed.; Pearson: Harlow, UK, 2011. [Google Scholar]
  4. Fédération Internationale du Béton (fib). Model Code for Concrete Structures 2010; Fédération Internationale du Béton (fib): Lausanne, Switzerland, 2013. [Google Scholar] [CrossRef]
  5. ACI 201.2R-16; Guide to Durable Concrete. American Concrete Institute: Farmington Hills, MI, USA, 2016. Available online: https://www.concrete.org/store/productdetail.aspx?ItemID=201216 (accessed on 1 July 2026).
  6. Li, K. Durability Design of Concrete Structures: Phenomena, Modeling, and Practice; Wiley: Hoboken, NJ, USA, 2016. [Google Scholar] [CrossRef]
  7. Powers, T.C. A Working Hypothesis for Further Studies of Frost Resistance of Concrete. ACI J. Proc. 1945, 41, 245–272. [Google Scholar] [CrossRef] [PubMed]
  8. Fagerlund, G. The Critical Degree of Saturation Method of Assessing the Freeze/Thaw Resistance of Concrete. Mater. Constr. 1977, 10, 217–229. [Google Scholar] [CrossRef]
  9. Samaha, H.R.; Hover, K.C. Influence of Microcracking on the Mass Transport Properties of Concrete. ACI Mater. J. 1992, 89, 416–424. [Google Scholar] [CrossRef] [PubMed]
  10. Wang, K.; Jansen, D.C.; Shah, S.P.; Karr, A.F. Permeability Study of Cracked Concrete. Cem. Concr. Res. 1997, 27, 381–393. [Google Scholar] [CrossRef]
  11. Aldea, C.-M.; Shah, S.P.; Karr, A. Effect of Cracking on Water and Chloride Permeability of Concrete. J. Mater. Civ. Eng. 1999, 11, 181–187. [Google Scholar] [CrossRef]
  12. Jacobsen, S.; Marchand, J.; Boisvert, L. Effect of Cracking and Healing on Chloride Transport in OPC Concrete. Cem. Concr. Res. 1996, 26, 869–881. [Google Scholar] [CrossRef]
  13. Lim, C.C.; Gowripalan, N.; Sirivivatnanon, V. Microcracking and Chloride Permeability of Concrete under Uniaxial Compression. Cem. Concr. Compos. 2000, 22, 353–360. [Google Scholar] [CrossRef]
  14. Win, P.P.; Watanabe, M.; Machida, A. Penetration Profile of Chloride Ion in Cracked Reinforced Concrete. Cem. Concr. Res. 2004, 34, 1073–1079. [Google Scholar] [CrossRef]
  15. Djerbi, A.; Bonnet, S.; Khelidj, A.; Baroghel-Bouny, V. Influence of Traversing Crack on Chloride Diffusion into Concrete. Cem. Concr. Res. 2008, 38, 877–883. [Google Scholar] [CrossRef]
  16. Ismail, M.; Toumi, A.; Francois, R.; Gagne, R. Effect of Crack Opening on the Local Diffusion of Chloride in Cracked Mortar Samples. Cem. Concr. Res. 2008, 38, 1106–1111. [Google Scholar] [CrossRef]
  17. Otieno, M.; Beushausen, H.; Alexander, M. Chloride-Induced Corrosion of Steel in Cracked Concrete-Part I: Experimental Studies under Accelerated and Natural Marine Environments. Cem. Concr. Res. 2016, 79, 373–385. [Google Scholar] [CrossRef]
  18. Otieno, M.; Beushausen, H.; Alexander, M. Chloride-Induced Corrosion of Steel in Cracked Concrete-Part II: Corrosion Rate Prediction Models. Cem. Concr. Res. 2016, 79, 386–394. [Google Scholar] [CrossRef]
  19. Elsener, B.; Andrade, C.; Gulikers, J.; Polder, R.; Raupach, M. Half-Cell Potential Measurements-Potential Mapping on Reinforced Concrete Structures. Mater. Struct. 2003, 36, 461–471. [Google Scholar] [CrossRef]
  20. Breysse, D. (Ed.) Non-Destructive Assessment of Concrete Structures: Reliability and Limits of Single and Combined Techniques; Springer: Dordrecht, The Netherlands, 2012. [Google Scholar] [CrossRef]
  21. Carino, N.J.; Sansalone, M. Flaw Detection in Concrete Using the Impact-Echo Method. In Bridge Evaluation, Repair and Rehabilitation; Springer: Dordrecht, The Netherlands, 1990; pp. 101–118. [Google Scholar] [CrossRef]
  22. Lee, S.; Kalos, N. Bridge Inspection Practices Using Non-Destructive Testing Methods. J. Civ. Eng. Manag. 2015, 21, 654–665. [Google Scholar] [CrossRef]
  23. Brownjohn, J.M.W. Structural Health Monitoring of Civil Infrastructure. Philos. Trans. R. Soc. A 2007, 365, 589–622. [Google Scholar] [CrossRef] [PubMed]
  24. Doebling, S.W.; Farrar, C.R.; Prime, M.B.; Shevitz, D.W. Damage Identification and Health Monitoring of Structural and Mechanical Systems from Changes in Their Vibration Characteristics: A Literature Review; Los Alamos National Laboratory: Los Alamos, NM, USA, 1996. [Google Scholar] [CrossRef]
  25. Cross, E.J.; Worden, K.; Farrar, C.R. Structural Health Monitoring for Civil Infrastructure. In Health Assessment of Engineered Structures; World Scientific: Singapore, 2013; pp. 1–31. [Google Scholar] [CrossRef]
  26. Measures, R.M. Structural Monitoring with Fiber Optic Technology; Academic Press: San Diego, CA, USA, 2001; Available online: https://shop.elsevier.com/books/structural-monitoring-with-fiber-optic-technology/measures/978-0-08-051804-6 (accessed on 1 July 2026).
  27. Betz, D.C.; Staudigel, L.; Trutzel, M.N.; Kehlenbach, M.; Muller, M.; Krumpholz, O. Structural Monitoring Using Fiber-Optic Bragg Grating Sensors. Struct. Health Monit. 2003, 2, 145–152. [Google Scholar] [CrossRef]
  28. Berrocal, C.G.; Fernandez, I.; Rempling, R. Crack Monitoring in Reinforced Concrete Beams by Distributed Optical Fiber Sensors. Struct. Infrastruct. Eng. 2021, 17, 124–139. [Google Scholar] [CrossRef]
  29. Glisic, B. Long-Term Monitoring of Civil Structures and Infrastructure Using Long-Gauge Fiber Optic Sensors. In Proceedings of the 2019 IEEE SENSORS, Montreal, QC, Canada, 27–30 October 2019; pp. 1–4. [Google Scholar] [CrossRef]
  30. Koch, C.; Georgieva, K.; Kasireddy, V.; Akinci, B.; Fieguth, P. A Review on Computer Vision Based Defect Detection and Condition Assessment of Concrete and Asphalt Civil Infrastructure. Adv. Eng. Inform. 2015, 29, 196–210. [Google Scholar] [CrossRef]
  31. Yeum, C.M.; Dyke, S.J. Vision-Based Automated Crack Detection for Bridge Inspection. Comput.-Aided Civ. Infrastruct. Eng. 2015, 30, 759–770. [Google Scholar] [CrossRef]
  32. Fujita, Y.; Hamamoto, Y. A Robust Automatic Crack Detection Method from Noisy Concrete Surfaces. Mach. Vis. Appl. 2011, 22, 245–254. [Google Scholar] [CrossRef]
  33. Cha, Y.-J.; Choi, W.; Buyukozturk, O. Deep Learning-Based Crack Damage Detection Using Convolutional Neural Networks. Comput.-Aided Civ. Infrastruct. Eng. 2017, 32, 361–378. [Google Scholar] [CrossRef]
  34. Ai, D.; Jiang, G.; Lam, S.-K.; He, P.; Li, C. Computer Vision Framework for Crack Detection of Civil Infrastructure-A Review. Eng. Appl. Artif. Intell. 2023, 117, 105478. [Google Scholar] [CrossRef]
  35. Bazant, Z.P.; Baweja, S. Creep and Shrinkage Prediction Model for Analysis and Design of Concrete Structures-Model B3. Mater. Struct. 1995, 28, 357–365. [Google Scholar] [CrossRef]
  36. Wu, Z.; Wong, H.S.; Buenfeld, N.R. Influence of Drying-Induced Microcracking and Related Size Effects on Mass Transport Properties of Concrete. Cem. Concr. Res. 2015, 68, 35–48. [Google Scholar] [CrossRef]
  37. Dhir, R.K.; McCarthy, M.J.; Limbachiya, M.C.; El Sayad, I. Pulverized Fuel Ash Concrete: Air Entrainment and Freeze/Thaw Durability. Mag. Concr. Res. 1999, 51, 53–64. [Google Scholar] [CrossRef]
  38. Shang, H.-S.; Yi, T.-H. Freeze-Thaw Durability of Air-Entrained Concrete. Sci. World J. 2013, 2013, 650791. [Google Scholar] [CrossRef] [PubMed]
  39. JTG 3362-2018; Specifications for Design of Highway Reinforced Concrete and Prestressed Concrete Bridges and Culverts. China Communications Press: Beijing, China, 2018. Available online: https://xxgk.mot.gov.cn/jigou/glj/202006/t20200623_3312720.html (accessed on 1 July 2026).
  40. JTG/T H21-2011; Standards for Technical Condition Evaluation of Highway Bridges. China Communications Press: Beijing, China, 2011. Available online: https://xxgk.mot.gov.cn/jigou/glj/202006/t20200623_3312369.html (accessed on 1 July 2026).
  41. JTG/T J21-2011; Technical Specification for Inspection and Evaluation of Load-Bearing Capacity of Highway Bridges. China Communications Press: Beijing, China, 2011. Available online: https://xxgk.mot.gov.cn/jigou/glj/202006/t20200623_3312355.html (accessed on 1 July 2026).
  42. JTG 5120-2021; Technical Specifications for Maintenance of Highway Bridges and Culverts. China Communications Press: Beijing, China, 2021. Available online: https://xxgk.mot.gov.cn/jigou/glj/202108/t20210825_3616530.html (accessed on 1 July 2026).
  43. American Association of State Highway and Transportation Officials. AASHTO LRFD Bridge Design Specifications, 9th ed.; AASHTO: Washington, DC, USA, 2020; Available online: https://trid.trb.org/view/1704698 (accessed on 1 July 2026).
  44. EN 1992-1-1:2004; Eurocode 2: Design of Concrete Structures-Part 1-1: General Rules and Rules for Buildings. CEN: Brussels, Belgium, 2004. Available online: https://eurocodes.jrc.ec.europa.eu/EN-Eurocodes/eurocode-2-design-concrete-structures (accessed on 1 July 2026).
  45. Wu, W.; Zhou, W.; Ye, M. Crack Control and Durability Improvement Process for Concrete in the Integrated Layer of a Prefabricated T-Girder Bridge Deck System. Eng. Technol. Res. 2026, 11, 135–137. [Google Scholar] [CrossRef]
  46. Zhang, L. Common Defects and Prevention Measures in the Construction of High-Performance Fiber-Reinforced Concrete Prefabricated T-Girders. TranspoWorld 2025, 31, 152–154, 158. [Google Scholar] [CrossRef]
  47. Wei, C. Technical Condition Assessment and Static Load Test of a T-Girder Bridge with Over-Limit Cracks. Fujian Constr. Sci. Technol. 2025, 4, 89–93. [Google Scholar]
  48. Lu, W. Bearing Capacity Evaluation of a Reinforced Concrete T-Girder Strengthened Based on Load Test. Constr. Saf. 2024, 39, 26–29. [Google Scholar] [CrossRef]
  49. Song, Z.; Ma, Z.; Chen, H.; Ma, Z. Crack Control Technology for Long-Span Prestressed Concrete Bridges. Heilongjiang Transp. Sci. Technol. 2024, 47, 90–93. [Google Scholar] [CrossRef]
  50. Hu, X.C.; Hu, H.; Zhuang, M.-L.; Wang, T.C.; Jiang, H.H. Study on the Causes of Asymmetric Cracking of Plateau Concrete Bridge Piers. Strength Mater. 2024, 56, 1055–1061. [Google Scholar] [CrossRef]
  51. Yang, J.-L.; Yuan, Q.; Zhang, K.; Garba, J.M.; Li, Q.-Y.; Chen, L. Early-Age Thermal Cracking Behavior of High-Speed Railway Bridge Piers in Plateau Regions: Formwork Removal Recommendations. J. Cent. South Univ. 2025, 32, 4055–4072. [Google Scholar] [CrossRef]
  52. Wang, T.; Kong, G.; Liu, H.; Wang, C.; Hu, X. A Sustainable Strategy for Concrete Crack Prevention of Bridge Piers in Plateau Climate: Thermal Control Based on Energy Piles. Appl. Therm. Eng. 2025, 279, 127880. [Google Scholar] [CrossRef]
  53. Mao, J.; Fang, K.; Mi, L.; Jia, H. Freeze–Thaw Damage Mechanism and Cracking Behaviour of Perforated Plateau Concrete Structure. In Proceedings of the 16th International Conference on Durability of Building Materials and Components, Beijing, China, 10–13 October 2023. [Google Scholar] [CrossRef]
  54. Li, H.; Zhang, Y.; Guo, H. Numerical Simulation of the Effect of Freeze-Thaw Cycles on the Durability of Concrete in a Salt Frost Environment. Coatings 2021, 11, 1198. [Google Scholar] [CrossRef]
  55. Yoo, D.-Y.; Shin, W. Improvement of Fiber Corrosion Resistance of Ultra-High-Performance Concrete by Means of Crack Width Control and Repair. Cem. Concr. Compos. 2021, 121, 104073. [Google Scholar] [CrossRef]
  56. GB 50010—2010; Code for Design of Concrete Structures (2015 Edition). China Architecture & Building Press: Beijing, China, 2015. Available online: https://www.mohurd.gov.cn/gongkai/zc/wjk/art/2015/art_17339_225665.html (accessed on 1 July 2026).
Figure 1. Cracks in the monitored prestressed concrete T-girder.
Buildings 16 02732 g001
Figure 2. Monitoring-point layout and longitudinal crack-survey zones. (a) T-girder cross-section. (b) Longitudinal zoning for crack monitoring.
Buildings 16 02732 g002
Figure 3. Reticular cracks on the T-girder web.
Buildings 16 02732 g003
Figure 4. Oblique cracks on the T-girder web.
Buildings 16 02732 g004
Figure 5. Size distribution of web cracks. (a) Width distribution. (b) Length distribution. Note: The statistical sample for the T-girder web crack widths and lengths shown in the figure consists of a single T-girder, with a total of 721 cracks.
Buildings 16 02732 g005
Figure 6. Typical longitudinal cracks at the girder bottom. (a) Longitudinal intermittent cracks. (b) Longitudinal long cracks.
Buildings 16 02732 g006
Figure 7. Size distribution of bottom cracks. (a) Width distribution. (b) Length distribution. Note: The statistical sample for the crack widths and lengths at the bottom of the T-girder main girder shown in Figure 5 consists of a single T-girder, with a total of 721 cracks.
Buildings 16 02732 g007
Figure 8. Typical cracks in diaphragms. (a) Reticular or irregular cracks. (b) Corner cracks.
Buildings 16 02732 g008
Figure 9. Size distribution of diaphragm cracks. (a) Width distribution. (b) Length distribution. Note: The statistical sample for the crack widths and lengths in the T-girder diaphragms shown in Figure 5 consists of a single T-girder, with a total of 721 cracks.
Buildings 16 02732 g009
Figure 10. Relationship between crack width and crack depth.
Buildings 16 02732 g010
Figure 11. Width distribution of newly developed cracks.
Buildings 16 02732 g011
Figure 12. Length distribution of newly developed cracks.
Buildings 16 02732 g012
Figure 13. Width–temperature relationship of the oblique shear crack at the girder-end web.
Buildings 16 02732 g013
Figure 14. Width–temperature relationship of the longitudinal crack at the girder-end web.
Buildings 16 02732 g014
Figure 15. Width–temperature relationship of the longitudinal bottom crack at 1/4 L.
Buildings 16 02732 g015
Table 1. Length changes in selected existing cracks.
Monitoring Project and Structural LocationCrack LengthCrack LengthLength Increase
Shuajingsi No. 3 Bridge, left span 1, girder 1–4#, 3–4 m5 cm9 cm4 cm
Shuajingsi No. 3 Bridge, left span 1, girder 1–4#, 16–17 m6 cm12 cm6 cm
Shuajingsi No. 3 Bridge, left span 1, girder 1–6#, 17–18 m30 cm35 cm5 cm
Disclaimer/Publisher’s Note: The statements, opinions and data contained in all publications are solely those of the individual author(s) and contributor(s) and not of MDPI and/or the editor(s). MDPI and/or the editor(s) disclaim responsibility for any injury to people or property resulting from any ideas, methods, instructions or products referred to in the content.