Article

Photosynthetic Carbon Uptake Capacity of Nine Typical Green Roof Plants in Cities: A Case Study in the Southeastern Coast of China


1
College of Life Sciences, Fujian Agriculture and Forestry University, Fuzhou 350002, China
2
Key Laboratory of Urban Environment and Health, Institute of Urban Environment, Chinese Academy of Sciences, Xiamen 361021, China
3
Fujian Key Laboratory of Digital Technology for Territorial Space Analysis and Simulation, Fuzhou 350108, China
4
Xiamen Key Laboratory of Smart Management on the Urban Environment, Xiamen 361021, China
5
College of Resources and Environment, University of Chinese Academy of Sciences, Beijing 100049, China
*
Author to whom correspondence should be addressed.
Buildings 2026, 16(14), 2726; https://doi.org/10.3390/buildings16142726
Submission received: 31 May 2026 / Revised: 30 June 2026 / Accepted: 7 July 2026 / Published: 9 July 2026
(This article belongs to the Section Building Energy, Physics, Environment, and Systems)

Abstract

Due to climate change and urbanization, green roofs are vital for urban climate resilience. However, there is currently no consensus on the photosynthetic carbon uptake capacity of green roof plants in cities. This study investigated and compared nine common green roof plant species in Xiamen, a typical coastal city in southeastern China. Their photosynthetic parameters were measured across all four seasons to evaluate photosynthetic carbon uptake capacity, and the differences among the nine plant species were evaluated. Results show: (1) Significant interspecific differences exist. Ligustrum japonicum (Lj) had the highest seasonal average daily carbon uptake per unit leaf area (8.86 g m−2 d−1) and per unit area (93.10 g m−2 d−1), approximately 9 times that of the lowest-performing species per unit leaf area (Pedilanthus tithymaloides) and 11 times that of the lowest-performing species per unit area (Tradescantia spathacea). (2) The variation in carbon uptake capacity among different green roof plant species followed a pattern consistent with that of their net photosynthetic rate and leaf area index. (3) Overall, the carbon uptake capacity of the nine plant species exhibited a trend of trees > shrubs > herbs. In summary, Lj demonstrated the highest photosynthetic carbon uptake capacity among the nine species examined, suggesting its potential as a promising species for enhancing photosynthetic carbon uptake on green roofs in southeastern coastal cities.

1. Introduction

Climate change and urbanization are major global challenges currently facing humanity [1,2]. Although cities cover less than 3% of the world’s land area [3], they are responsible for approximately 70% of global carbon emissions, as highlighted in the IPCC Sixth Assessment Report [4]. These emissions significantly exacerbate the urban heat island effect [5], degrade air quality [6], and threaten public health [7], making urban decarbonization a critical climate mitigation priority [8]. As a nature-based solution, green roofs can mitigate many adverse consequences of climate change [9]. Their demonstrated benefits span carbon uptake and emission reduction [10], dust retention and noise reduction [11,12], stormwater regulation [13], urban heat island mitigation via cooling effects [14], biodiversity enhancement [15,16,17] and enhanced resident well-being [18]. Owing to these multifunctional benefits, green roofs have been widely implemented globally to advance urban sustainability and resilience [19].
Land is scarce and costly in highly urbanized southeastern coastal regions of China, which constrains the large-scale expansion of conventional ground-level greenery [20]. In these areas, however, rooftops constitute approximately 40–50% of all urban impervious surfaces [21]. Utilizing this largely untapped space for green infrastructure presents a significant opportunity to reduce carbon dioxide emissions at the city scale [22]. Consequently, the southeastern coastal region holds strong potential for the widespread implementation of green roofs as a strategy to enhance urban climate resilience.
In recent years, scholars have primarily evaluated the carbon uptake and emission reduction performance of green roofs from two perspectives: direct carbon uptake and indirect emission reduction through building cooling. On the building scale, green roofs can lower the temperature of the building itself and its surroundings, thereby reducing energy consumption and indirectly achieving carbon emission reduction [23]. Compared to conventional buildings, each square meter of a green roof can save approximately 6.037 kWh of electricity annually, equivalent to reducing CO2 emissions by 10 kg m−2 a−1 [24]. However, since all pollution mitigation benefits of green roofs derive from the plants themselves [23], such energy consumption-based assessments, while effective in quantifying the indirect emission reduction in green roofs at the building level, fail to adequately reveal the direct contribution of the plants on the green roof surface. Consequently, numerous researchers have begun focusing on quantifying the direct carbon uptake and emission reduction function of the plants themselves. Related studies indicate that if all flat roofs in 102 major Chinese cities were greened, the carbon sink generated by the vegetation could completely offset the household emissions of all these cities [25]. Another study based on the DNDC model showed that a full-scale implementation of green roofs in Xiamen City could reduce 29.28% of the city’s carbon emissions annually through vegetation carbon uptake [26]. Nevertheless, such simulation studies often treat green roof plants as a homogeneous unit, overlooking the differences in carbon uptake capacity among different plant species under actual environmental conditions. Therefore, many researchers have adopted on-site rooftop experiments to monitor plant photosynthesis, conducting species-specific studies on carbon uptake capacity.
Green roof plants directly reduce atmospheric CO2 levels through photosynthesis. The capacity to absorb CO2 varies among plant species. Studies indicate that plant type [27], species [28], and carbon fixation pathway [29] are key factors influencing the photosynthetic carbon uptake capacity of green roof vegetation. Regarding plant type, trees generally sequester more carbon than shrubs, which in turn outperform herbs [30]. However, the application of trees on green roofs is severely constrained by load-bearing limits and substrate depth [31]. At the species level, Sedum species are most commonly used in the vegetation layer due to their high drought tolerance [32], yet most research suggests they have a relatively low carbon uptake capacity [28,33]. From the perspective of photosynthetic carbon assimilation pathways, C4 and CAM plants typically have a longer period of CO2 uptake compared to C3 plants [29]. Although existing research provides a crucial foundation for understanding the carbon uptake function of green roof plants, there remain two major limitations in previous studies. First, studies specifically focusing on the photosynthetic carbon uptake capacity of green roof plants in southeastern coastal cities of China are still lacking. Second, while most previous studies have focused on only a single season, research on the carbon uptake capacity of green roof plants across four seasons remains insufficient.
Therefore, this study, taking Xiamen, a southeastern coastal city in China, as a case study, selected nine representative green roof plant species from local implementations as research subjects. By measuring their photosynthetic parameters across four seasons, this study aims to evaluate the differences in photosynthetic carbon uptake capacity among different green roof plants. This work is significant for revealing the physiological mechanisms behind the ecological efficacy of urban green roof plants and for understanding the carbon cycling processes within urban ecosystems. It provides a theoretical basis for plant selection and ecological benefit assessment in urban green roof projects, and offers a scientific reference for leveraging urban green infrastructure to mitigate climate change.

2. Materials and Methods

2.1. Study Area

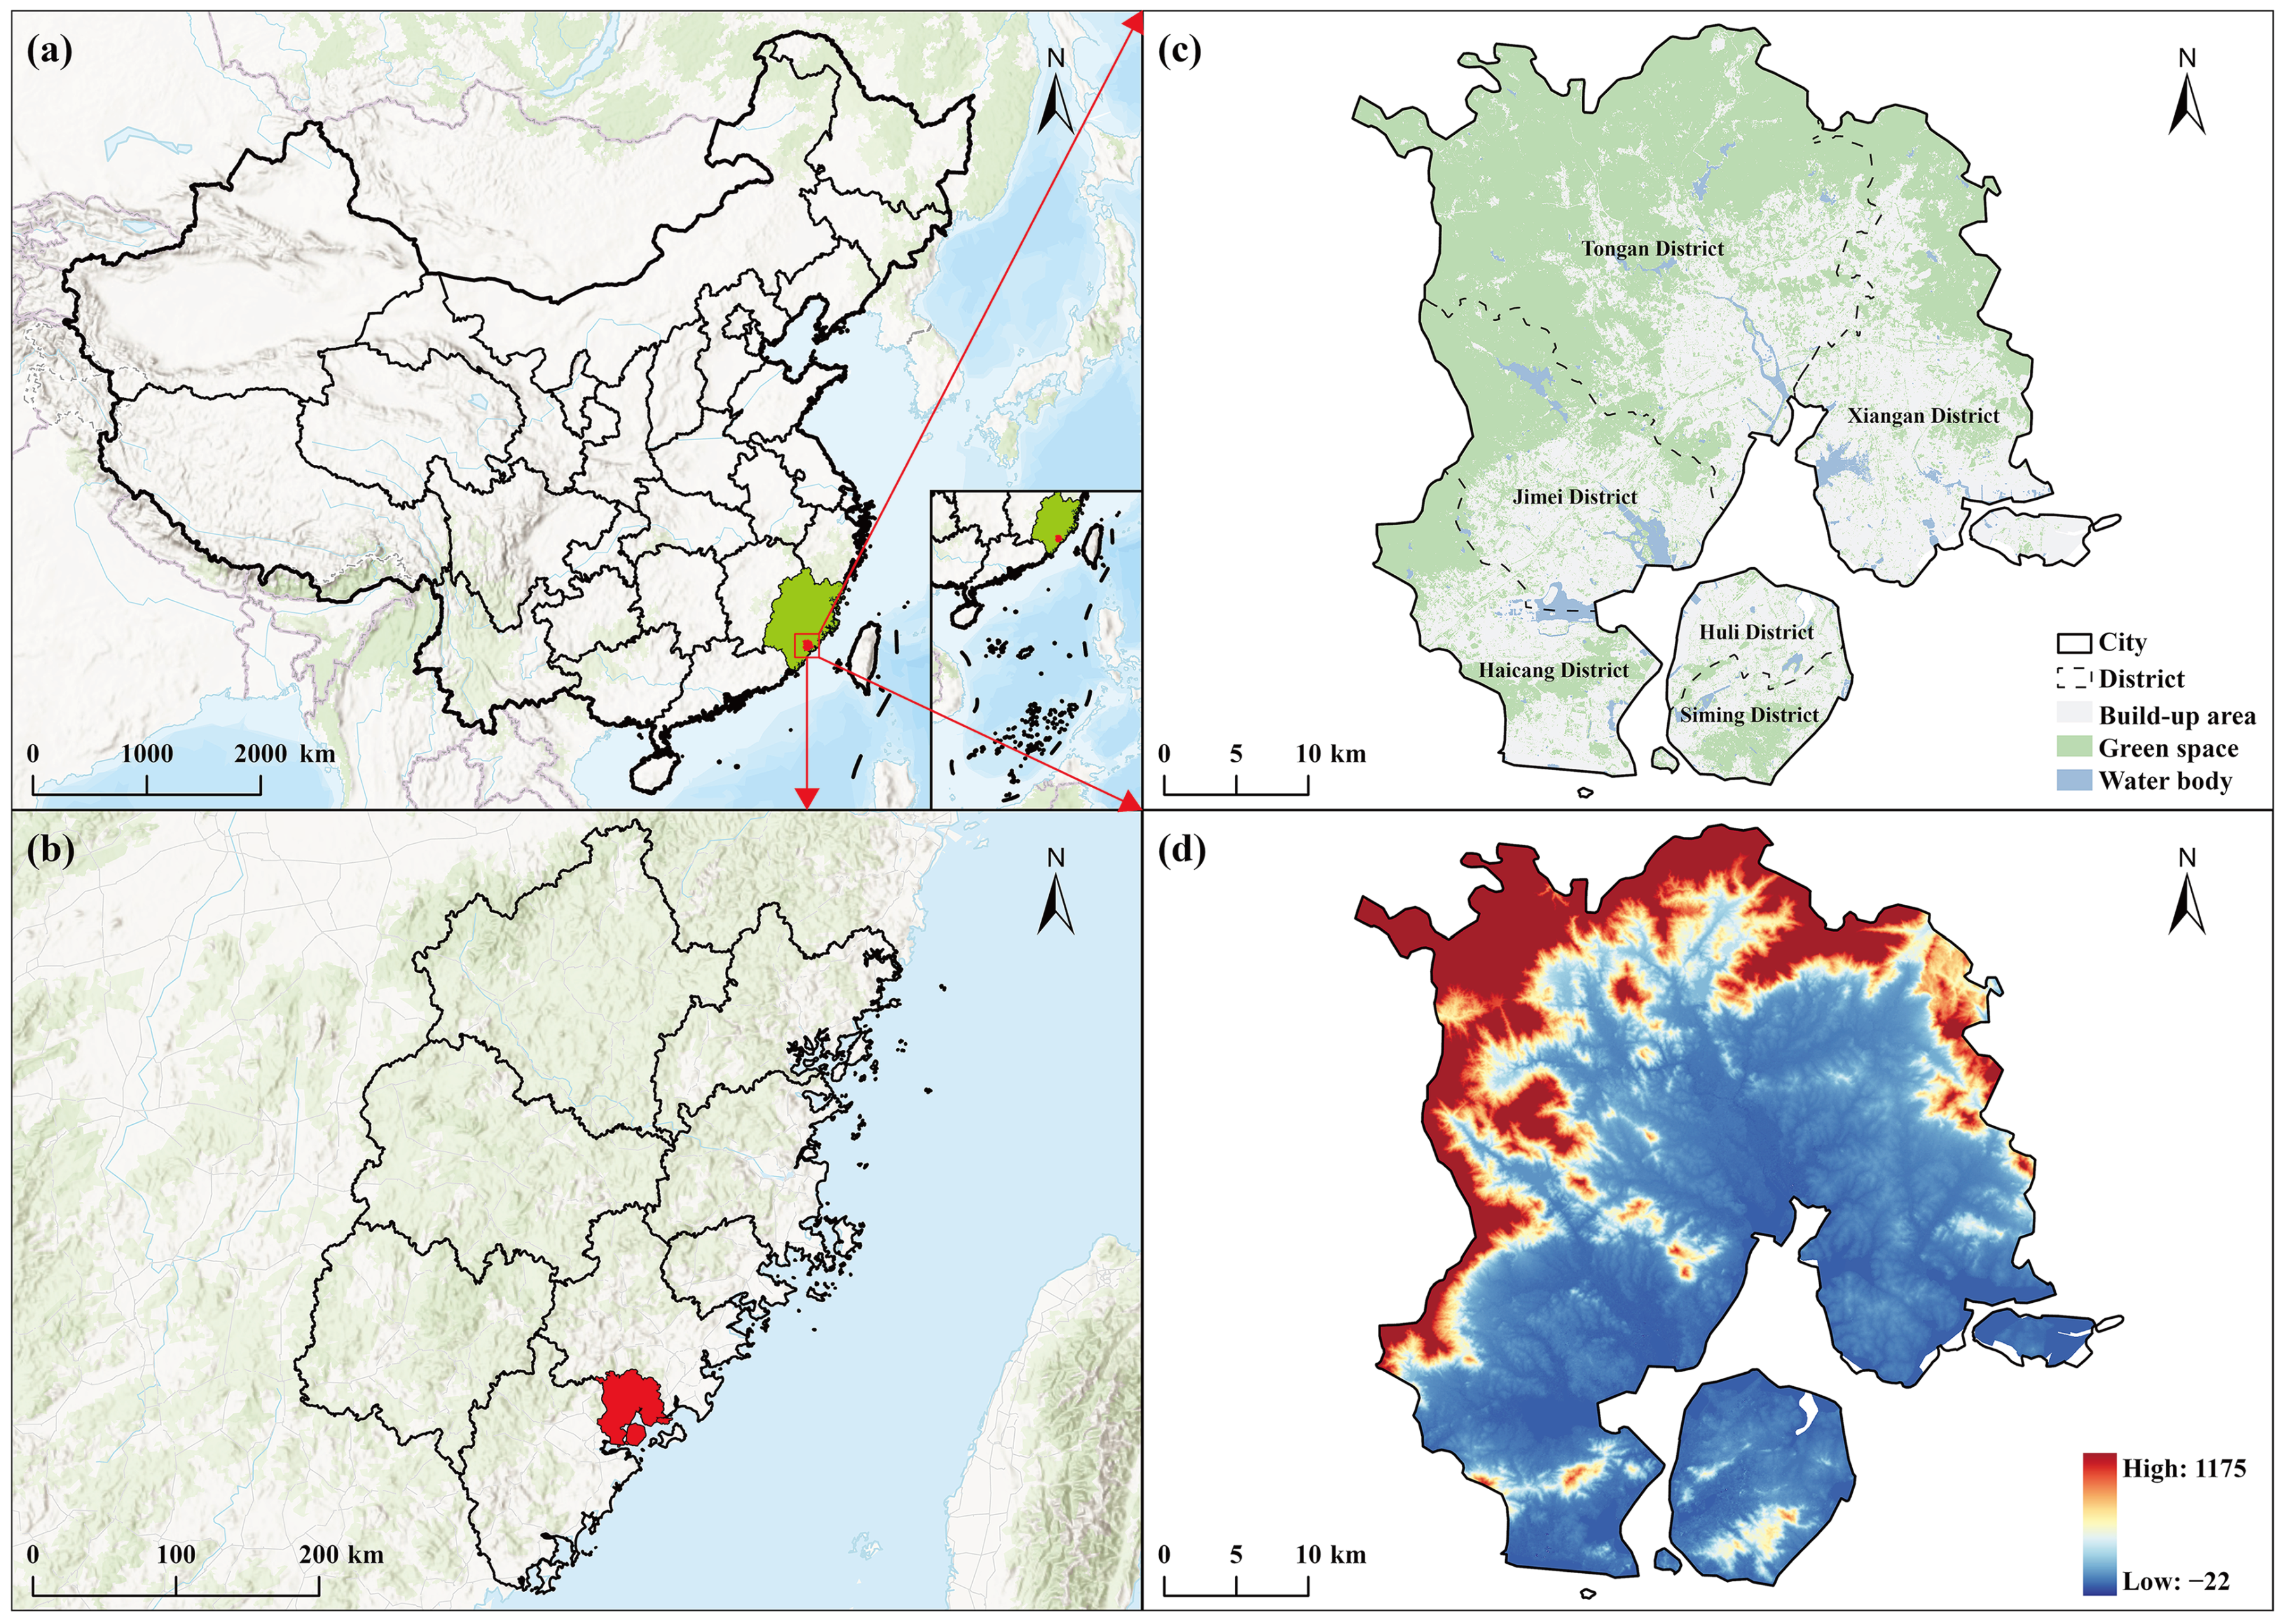
Xiamen (117°53′–118°26′ E, 24°23′–24°54′ N) was selected as the study area. Located on the southeastern coast of China at the estuary of the Jiulong River in Fujian Province and facing the Taiwan Strait, the city covers a land area of approximately 1699 km2. It serves as a key coastal city and a pilot zone for ecological civilization construction in the region. Xiamen experiences a subtropical maritime monsoon climate characterized by mild winters without severe cold and warm summers without intense heat. The area is frost-free and ice-free throughout the year. The mean annual temperature is 20.6 °C, with the highest monthly average reaching 32.3 °C during the hottest period from July to September. The mean annual precipitation is approximately 1315 mm, primarily concentrated between May and August. The warm and humid climate supports vegetation dominated by thermophilic and hygrophilous evergreen trees, shrubs, and perennial herbs. Representative species include the evergreen tree Ligustrum japonicum [34], the evergreen shrub Heptapleurum heptaphyllum [35], and the perennial herb Callisia repens [36]. The topography comprises mountains, platforms, plains, and tidal flats, forming a typical subtropical island landform [37]. Given its high similarity in climate, vegetation, and landforms to most cities along the southeastern coast of China, Xiamen is a representative city of this region (Figure 1).
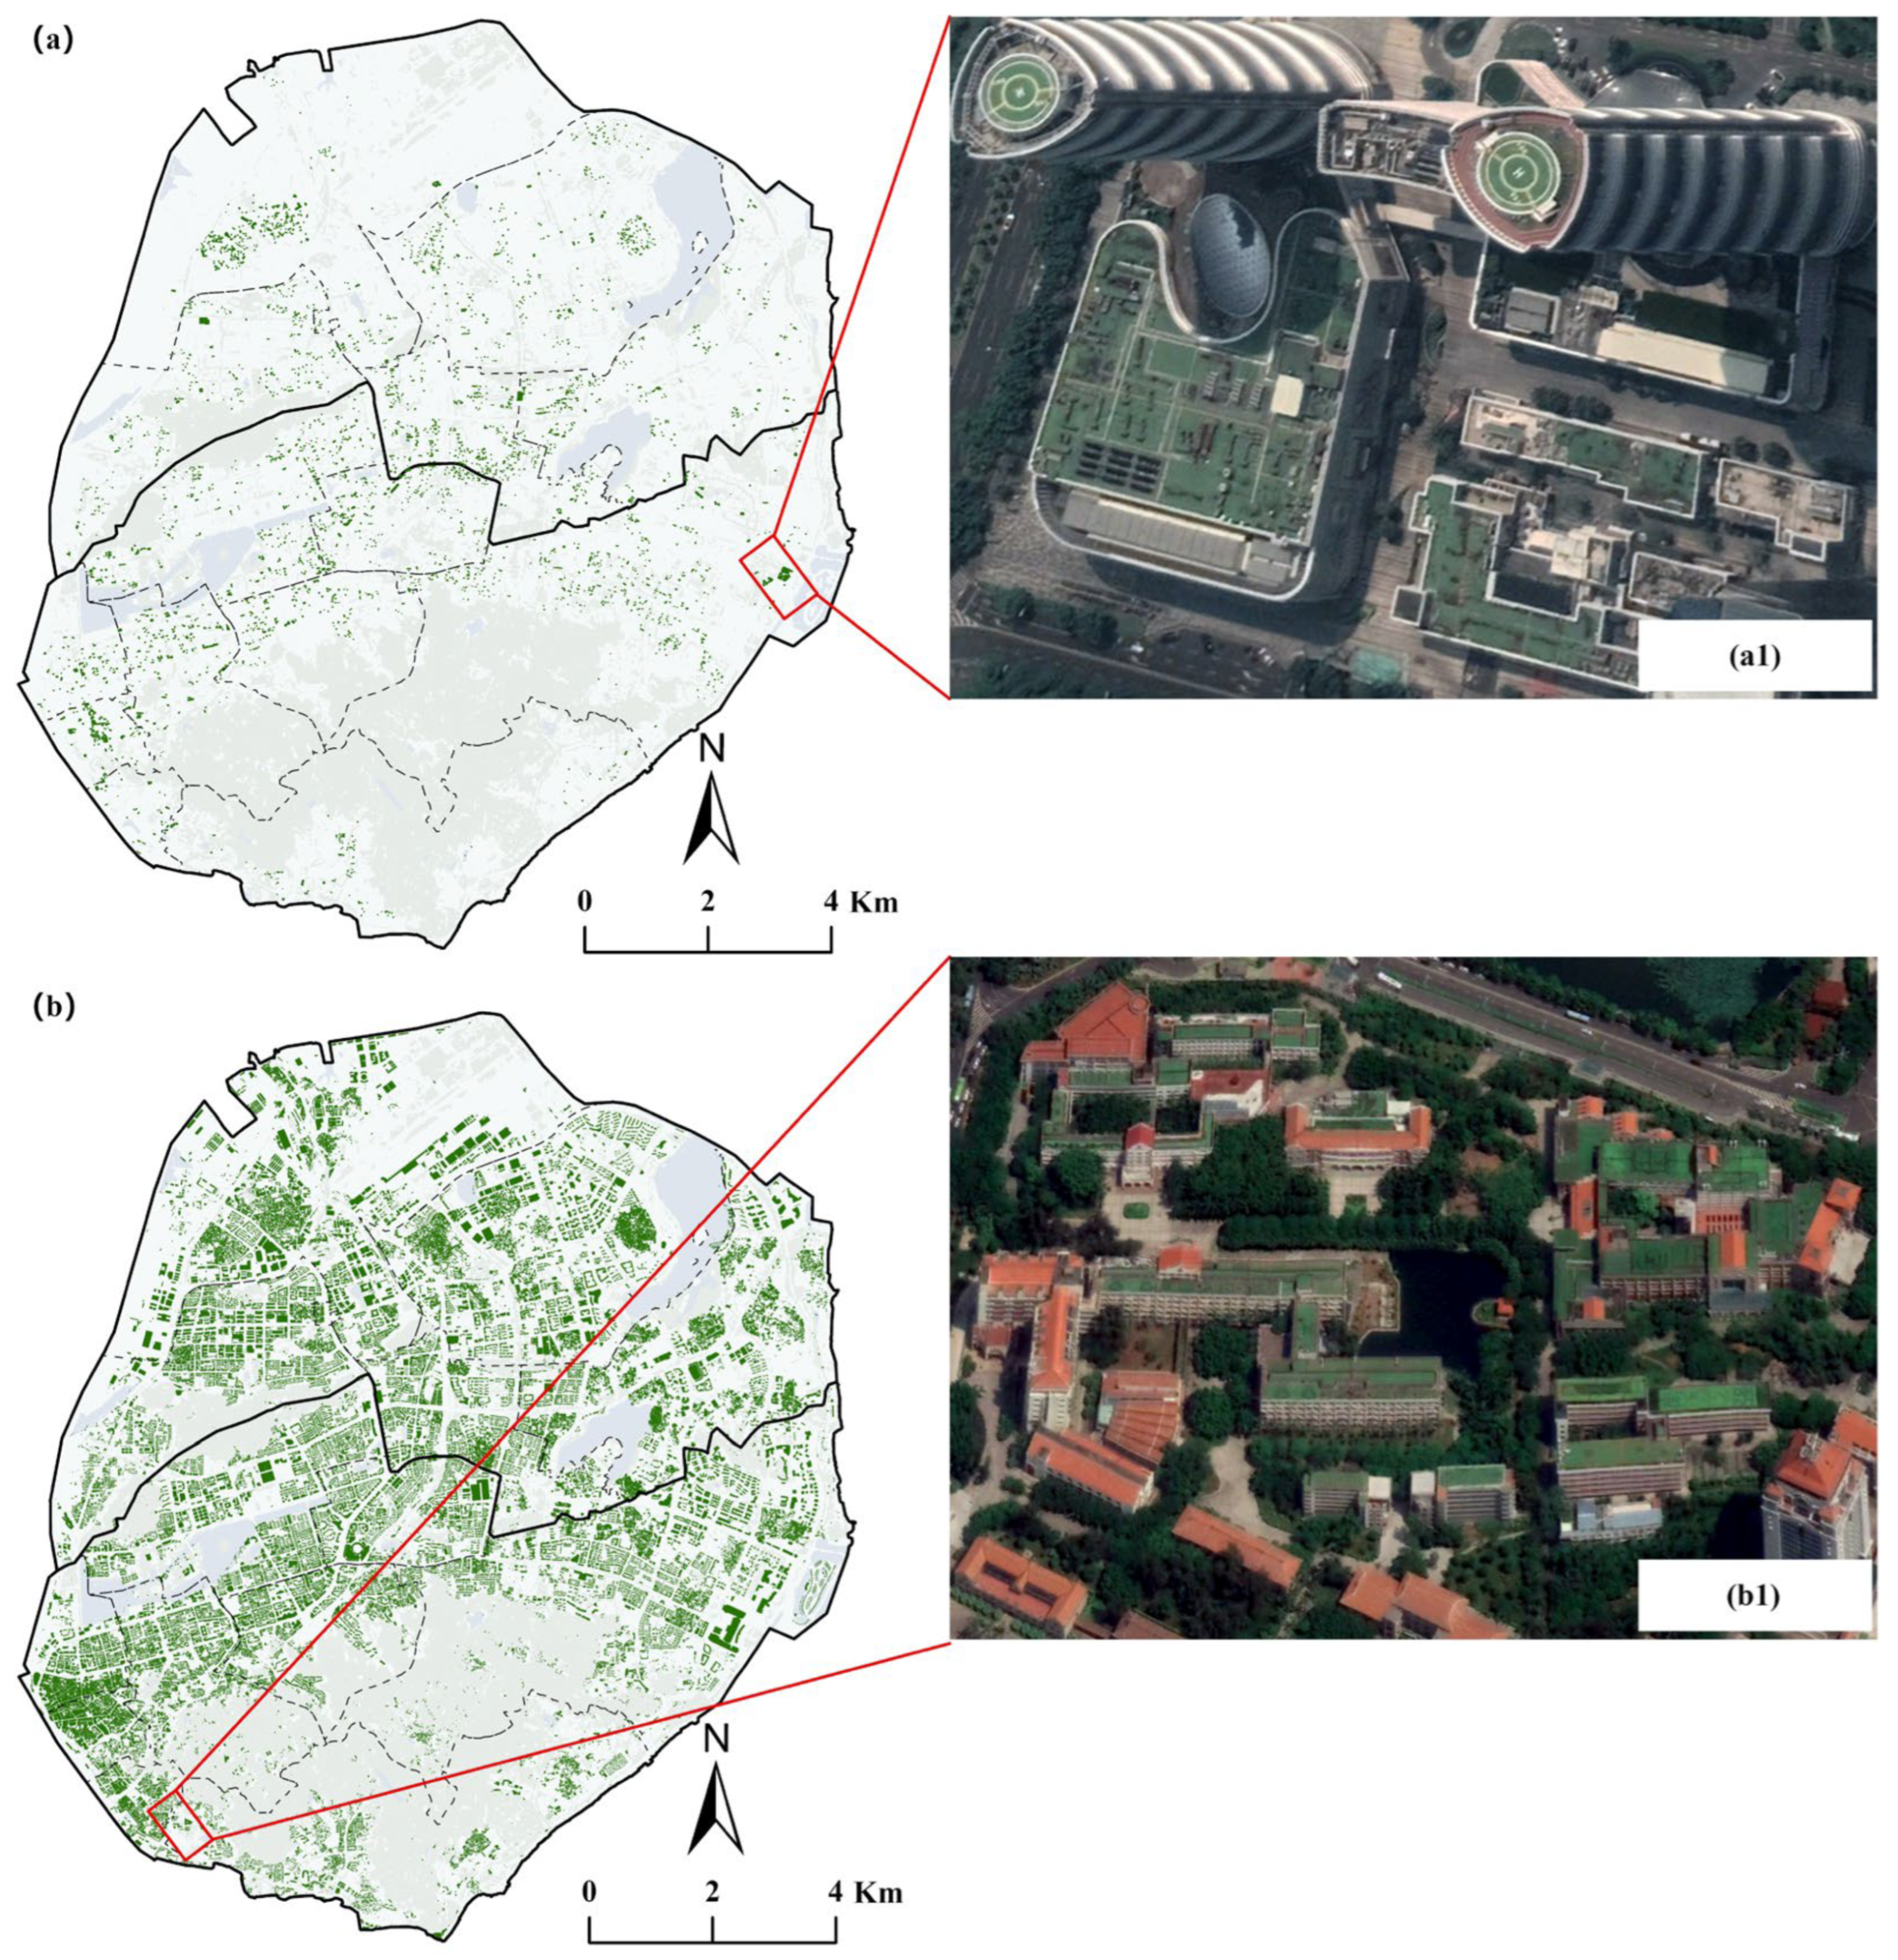
Xiamen is among the first cities in China to systematically promote green roofs. In 2002, Xiamen initiated its first green roof pilot projects [38]. In 2006, Xiamen designated building rooftops as the primary focus for green roof initiatives and rapidly expanded their implementation. In 2012, its municipal initiatives established 200 new vertical greening sites, shifting the focus of vertical greening efforts from the island proper to the outlying areas. In 2016, the green roof project at Zhonghang Zijin Plaza, which at 15,000 m2 was the largest in Xiamen, was completed [39]. Approximately 0.54 km2, or 2% of all building roofs, are currently covered by completed green roofs on Xiamen Island [40]. According to the Xiamen Statistical Yearbook, the urban built-up area has grown by about 30 times in less than 40 years. Impervious surfaces make up 71.66% of the urban area on Xiamen Island, and the city has reached 100% comprehensive urbanization with a permanent population of 2.06 million in 2022. Rapid population growth and urban expansion have led to the concentration of people and the encroachment on vast amounts of ecological resources, triggering a significant urban heat island effect [41]. Furthermore, high temperatures have driven an increase in air conditioning demand during the summer, thereby increasing energy consumption and degrading air quality [42]. As a National Demonstration Zone for Ecological Civilization and a Sponge City pilot, Xiamen faces higher standards for ecological and environmental quality [43]. Therefore, it is essential to enhance urban carbon uptake and emission reduction potential, as well as to improve ecological and environmental quality, through the implementation of urban-scale green roof projects (Figure 2).

2.2. Selection of Plants for Urban Green Roofs

The planting schemes for green roofs in Xiamen typically feature multi-layered vegetation communities, commonly structured with tree, shrub, and herbaceous layers [44]. Generally, green roofs require five or more plant species to form a highly biodiverse community [45]. A local survey in Xiamen indicates that the plant species richness of existing green roofs is typically around seven [44]. Since Xiamen is located on the coast and is prone to typhoons and high salinity, rooftop plants must be wind-resistant, salt-tolerant, drought-tolerant, and able to withstand waterlogging [46]. In addition, plant selection should prioritize native species [44]. Therefore, to meet the requirements of biodiversity enhancement and special habitat adaptation in green roof plant communities, this study selected nine dominant and representative adapted species commonly used in existing and under-construction green roof projects in Xiamen (Table 1). The selected species belong to seven families and can be categorized into three life forms: trees, shrubs, and herbs.

2.3. Measurement of Photosynthetic Parameters in Green Roof Plants

2.3.1. Measurement of Plant Photosynthetic Rates

The experiment was conducted on the green roof of the 20th floor of the Comprehensive Building at the Institute of Urban Environment, Chinese Academy of Sciences, Xiamen, China. The green roof was classified as an extensive green roof, with a substrate depth of 10 cm. The green roof plants were approximately five years old at the time of measurement. The green roof was managed under a low-maintenance, near-natural approach. To maintain basic physiological activity of the plants, a weekly irrigation regime was implemented: plants were irrigated once per week with municipal tap water, unless rainfall occurred during that week, in which case irrigation was omitted. During each irrigation event, plants were watered thoroughly until the substrate was fully saturated and water began to drain from the bottom of the containers.
Plant photosynthetic rates were measured using a LI-6400XT portable photosynthetic meter (Li-Cor, Inc., Lincoln, NE, USA). Experiments were conducted on days with ample sunlight and calm or nearly calm wind conditions in August 2024 (summer), November 2024 (autumn), January 2025 (winter), and June 2025 (spring) (Table 2). Under natural sunlight, photosynthetic rates were measured at two-hour intervals from 6:00 to 18:00. For each measurement, three fully expanded, healthy leaves of similar age were selected from the sun-exposed side of each plant. Without detaching the leaves, we carefully positioned each leaf to fill the leaf chamber, and recorded five instantaneous photosynthetic rate readings per leaf. The average of these five readings was calculated and used for analysis [47,48,49]. Measurements were performed in a consistent sequence across six daily time slots, with the order of plants maintained throughout the day.

2.3.2. Determination of Plant Leaf Area Index

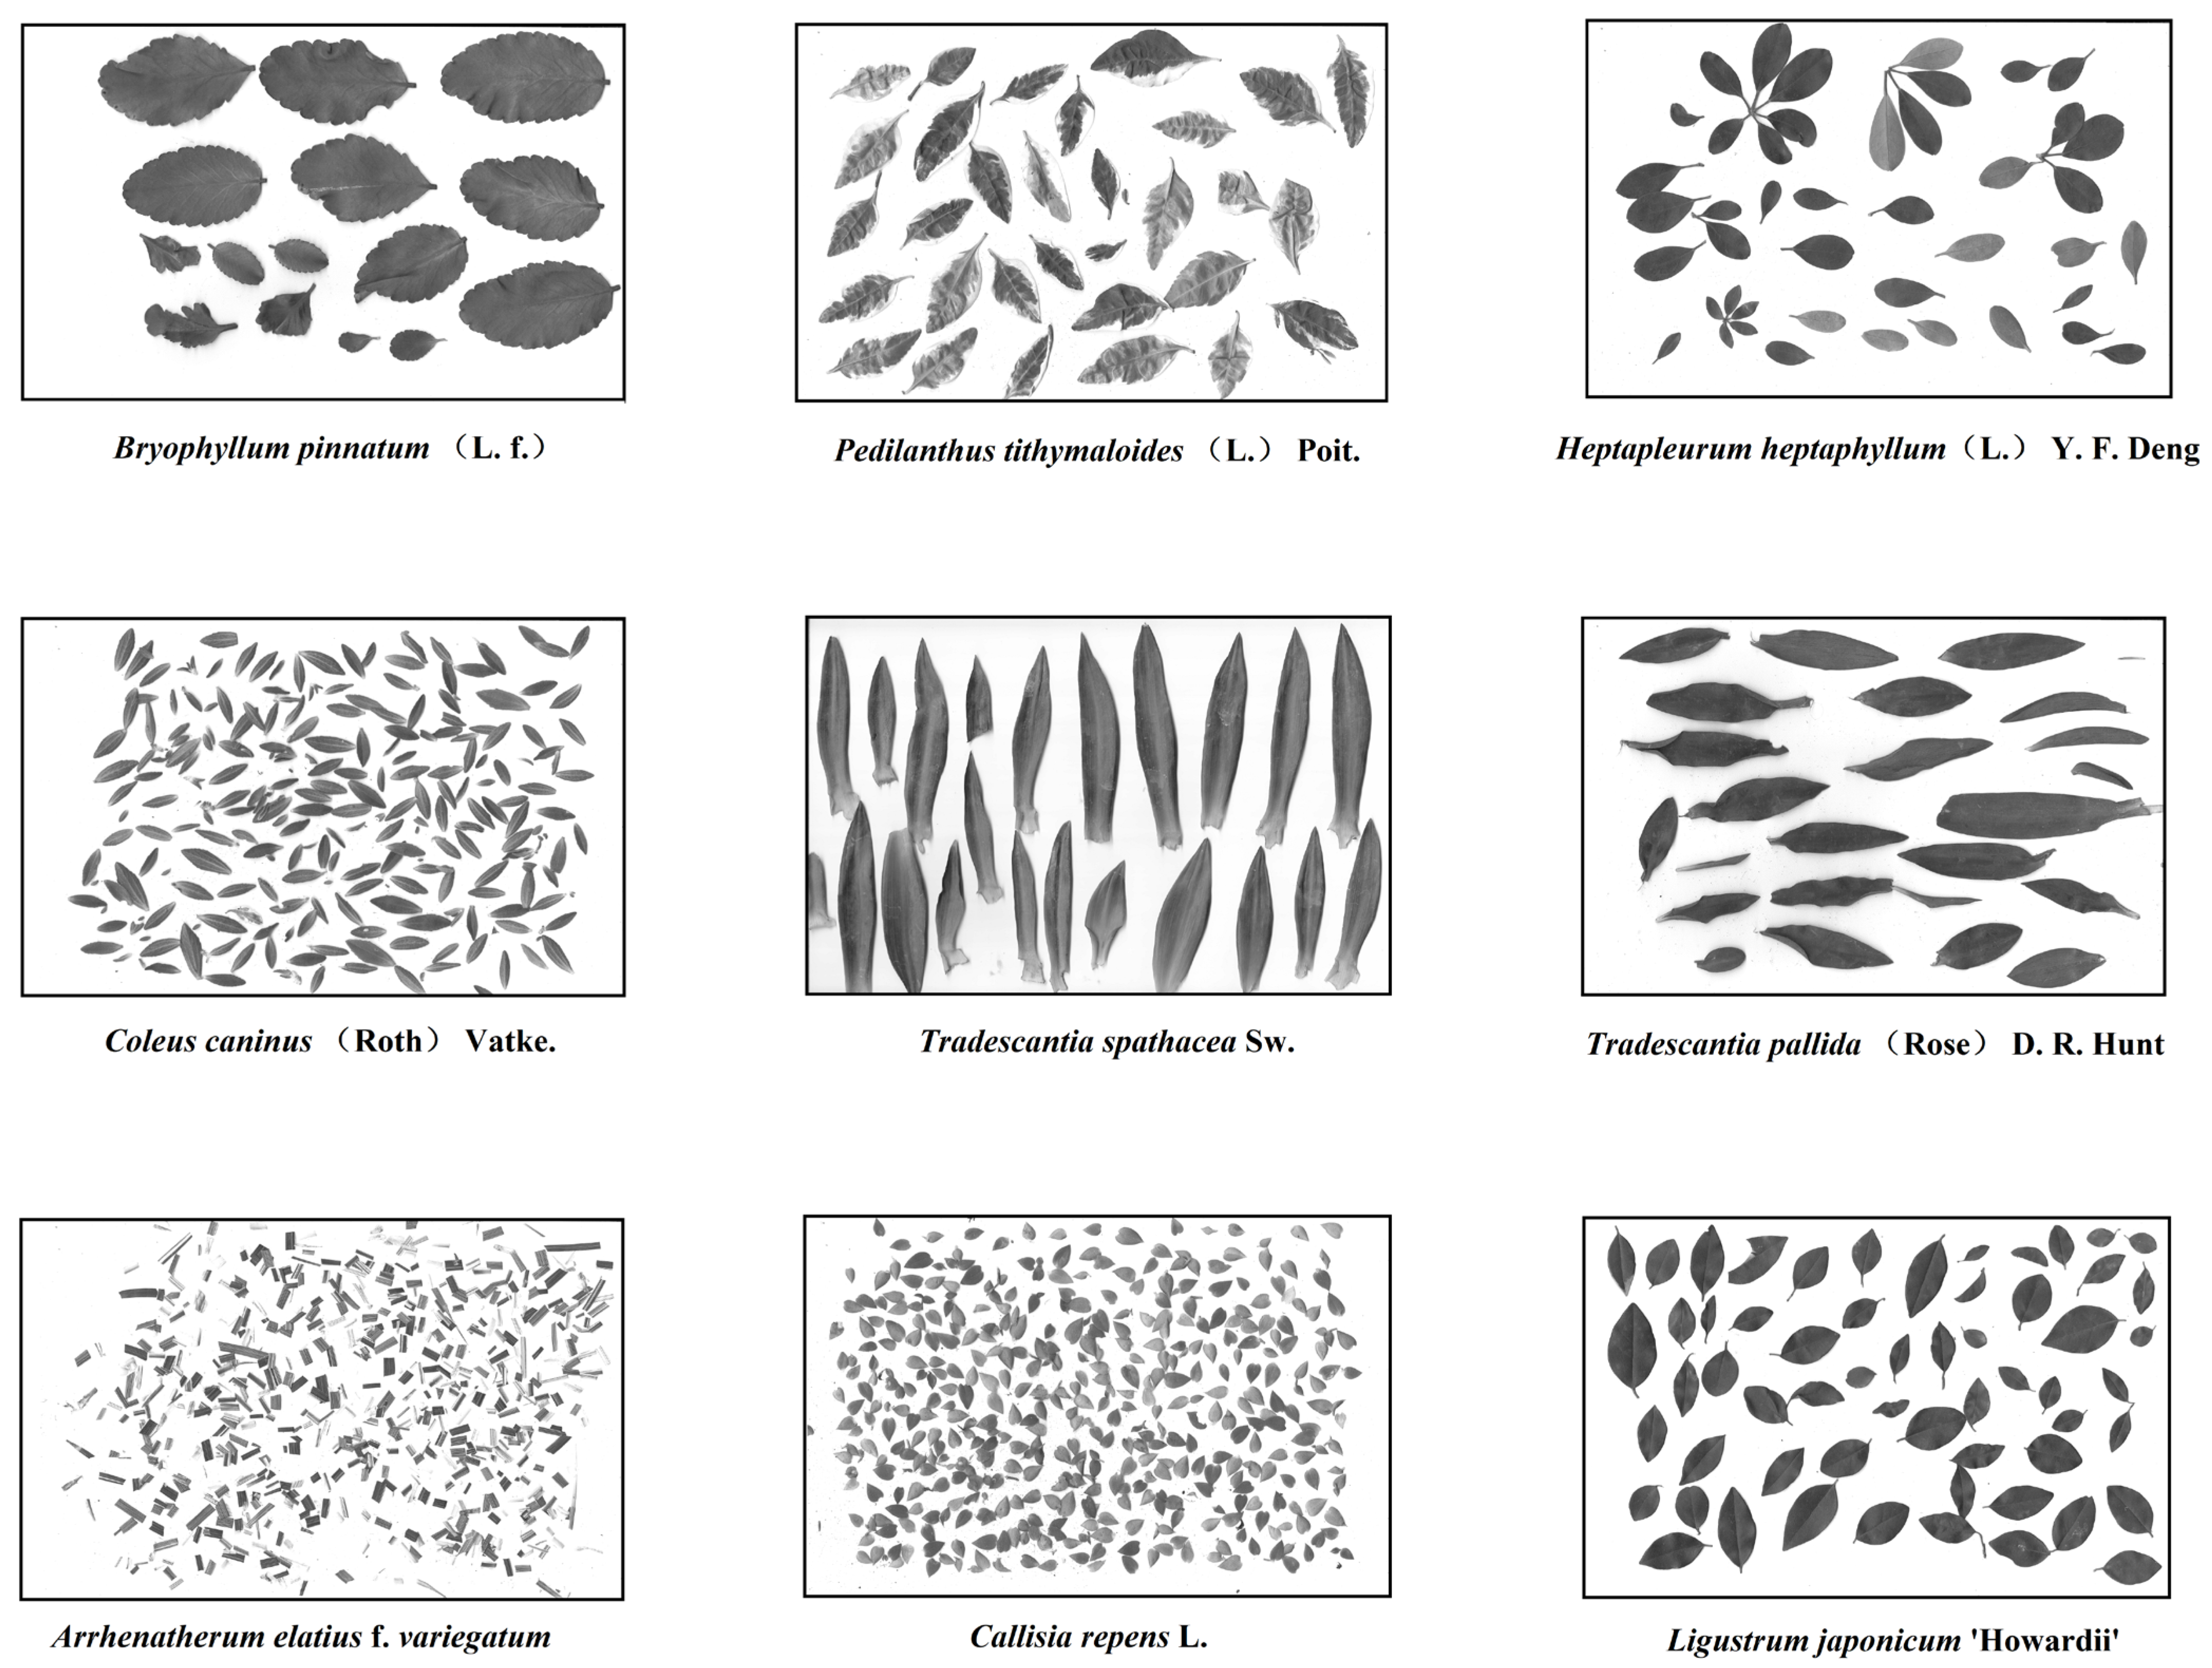
Select a 10 cm × 10 cm plot for collecting plant leaf samples. Scan the plant leaves using an image scanner, then calculate their area to determine the total leaf area (Figure 3). The leaf area index (LAI) refers to the total leaf area of plants within a given land area. The formula is:
L A I = Y S
where L A I represents the leaf area index; Y represents the total leaf area of plants within the plot (m2); S represents the area of the plot (m2).

2.4. Calculation of Photosynthetic Carbon Uptake Capacity of Green Roof Plants

2.4.1. Daily Carbon Uptake per Unit Leaf Area

Carbon sequestered by green roof plants is calculated based on their photosynthetic assimilation. In the diurnal photosynthesis curve, assimilation is the area of the region enclosed by the net photosynthesis rate curve and the horizontal time axis. Net assimilation per unit leaf area was calculated using a simple integration method [47,50]. The calculation formula is:
P = i = 1 j   P i + 1 + P i × t i + 1 t i × 3600 / 1000
where P represents the total net assimilation per unit leaf area on the measurement day (mmol·m−2·d−1). P i and P i + 1 are the instantaneous photosynthetic rates at the i and i + 1 measurement points, respectively (μmol·m−2·s−1), while t i and t i + 1 are the corresponding times (h). j is the number of measurements. Finally, 3600 represents 3600 s per hour and 1000 is the conversion factor between mmol and µmol.
Typically, the nocturnal dark respiration consumption of plants accounts for 20% of daytime assimilation [51,52]. The total daily assimilation is converted into the total CO2 fixation per unit leaf area for that day, using the following formula:
W C O 2 = P × 1 0.2 × 44 1000
where W C O 2 represents the mass of CO2 net fixed per unit leaf area per day (g m−2 d−1); 44 is the molar mass of CO2 (g/mol) [53].

2.4.2. Daily Carbon Uptake per Unit Area

Q C O 2 = W C O 2 × L A I
where Q C O 2 is the mass of net CO2 fixed per unit area per day (g m−2 d−1); L A I is the leaf area index.

2.5. Statistical Analysis

Data processing and graphing were performed using Microsoft Excel 2019 (Microsoft Corporation, Redmond, WA, USA) and Origin 2024 (OriginLab Corporation, Northampton, MA, USA, version 10.1.0.178), respectively. Hierarchical cluster analysis was performed using the Ward method in R Studio 2024 (Posit Software, PBC, Boston, MA, USA, version 2024.12.1+563). One-way analysis of variance (ANOVA) was used to examine differences in daily carbon uptake and assimilation per unit leaf area among species. For each season, the sample size comprised 27 observations (9 species × 3 replicates). For the seasonal average carbon uptake and assimilation per unit leaf area, the four seasonal values were treated as replicates for each species (n = 4 per species), resulting in 36 observations (9 species × 4 seasons). When ANOVA results were significant (p < 0.05), Duncan’s multiple range test was used for post hoc comparisons. The same statistical procedures were applied to the net photosynthetic rate data.

3. Results

3.1. Diurnal Variations in Net Photosynthetic Rate of Urban Green Roof Plants

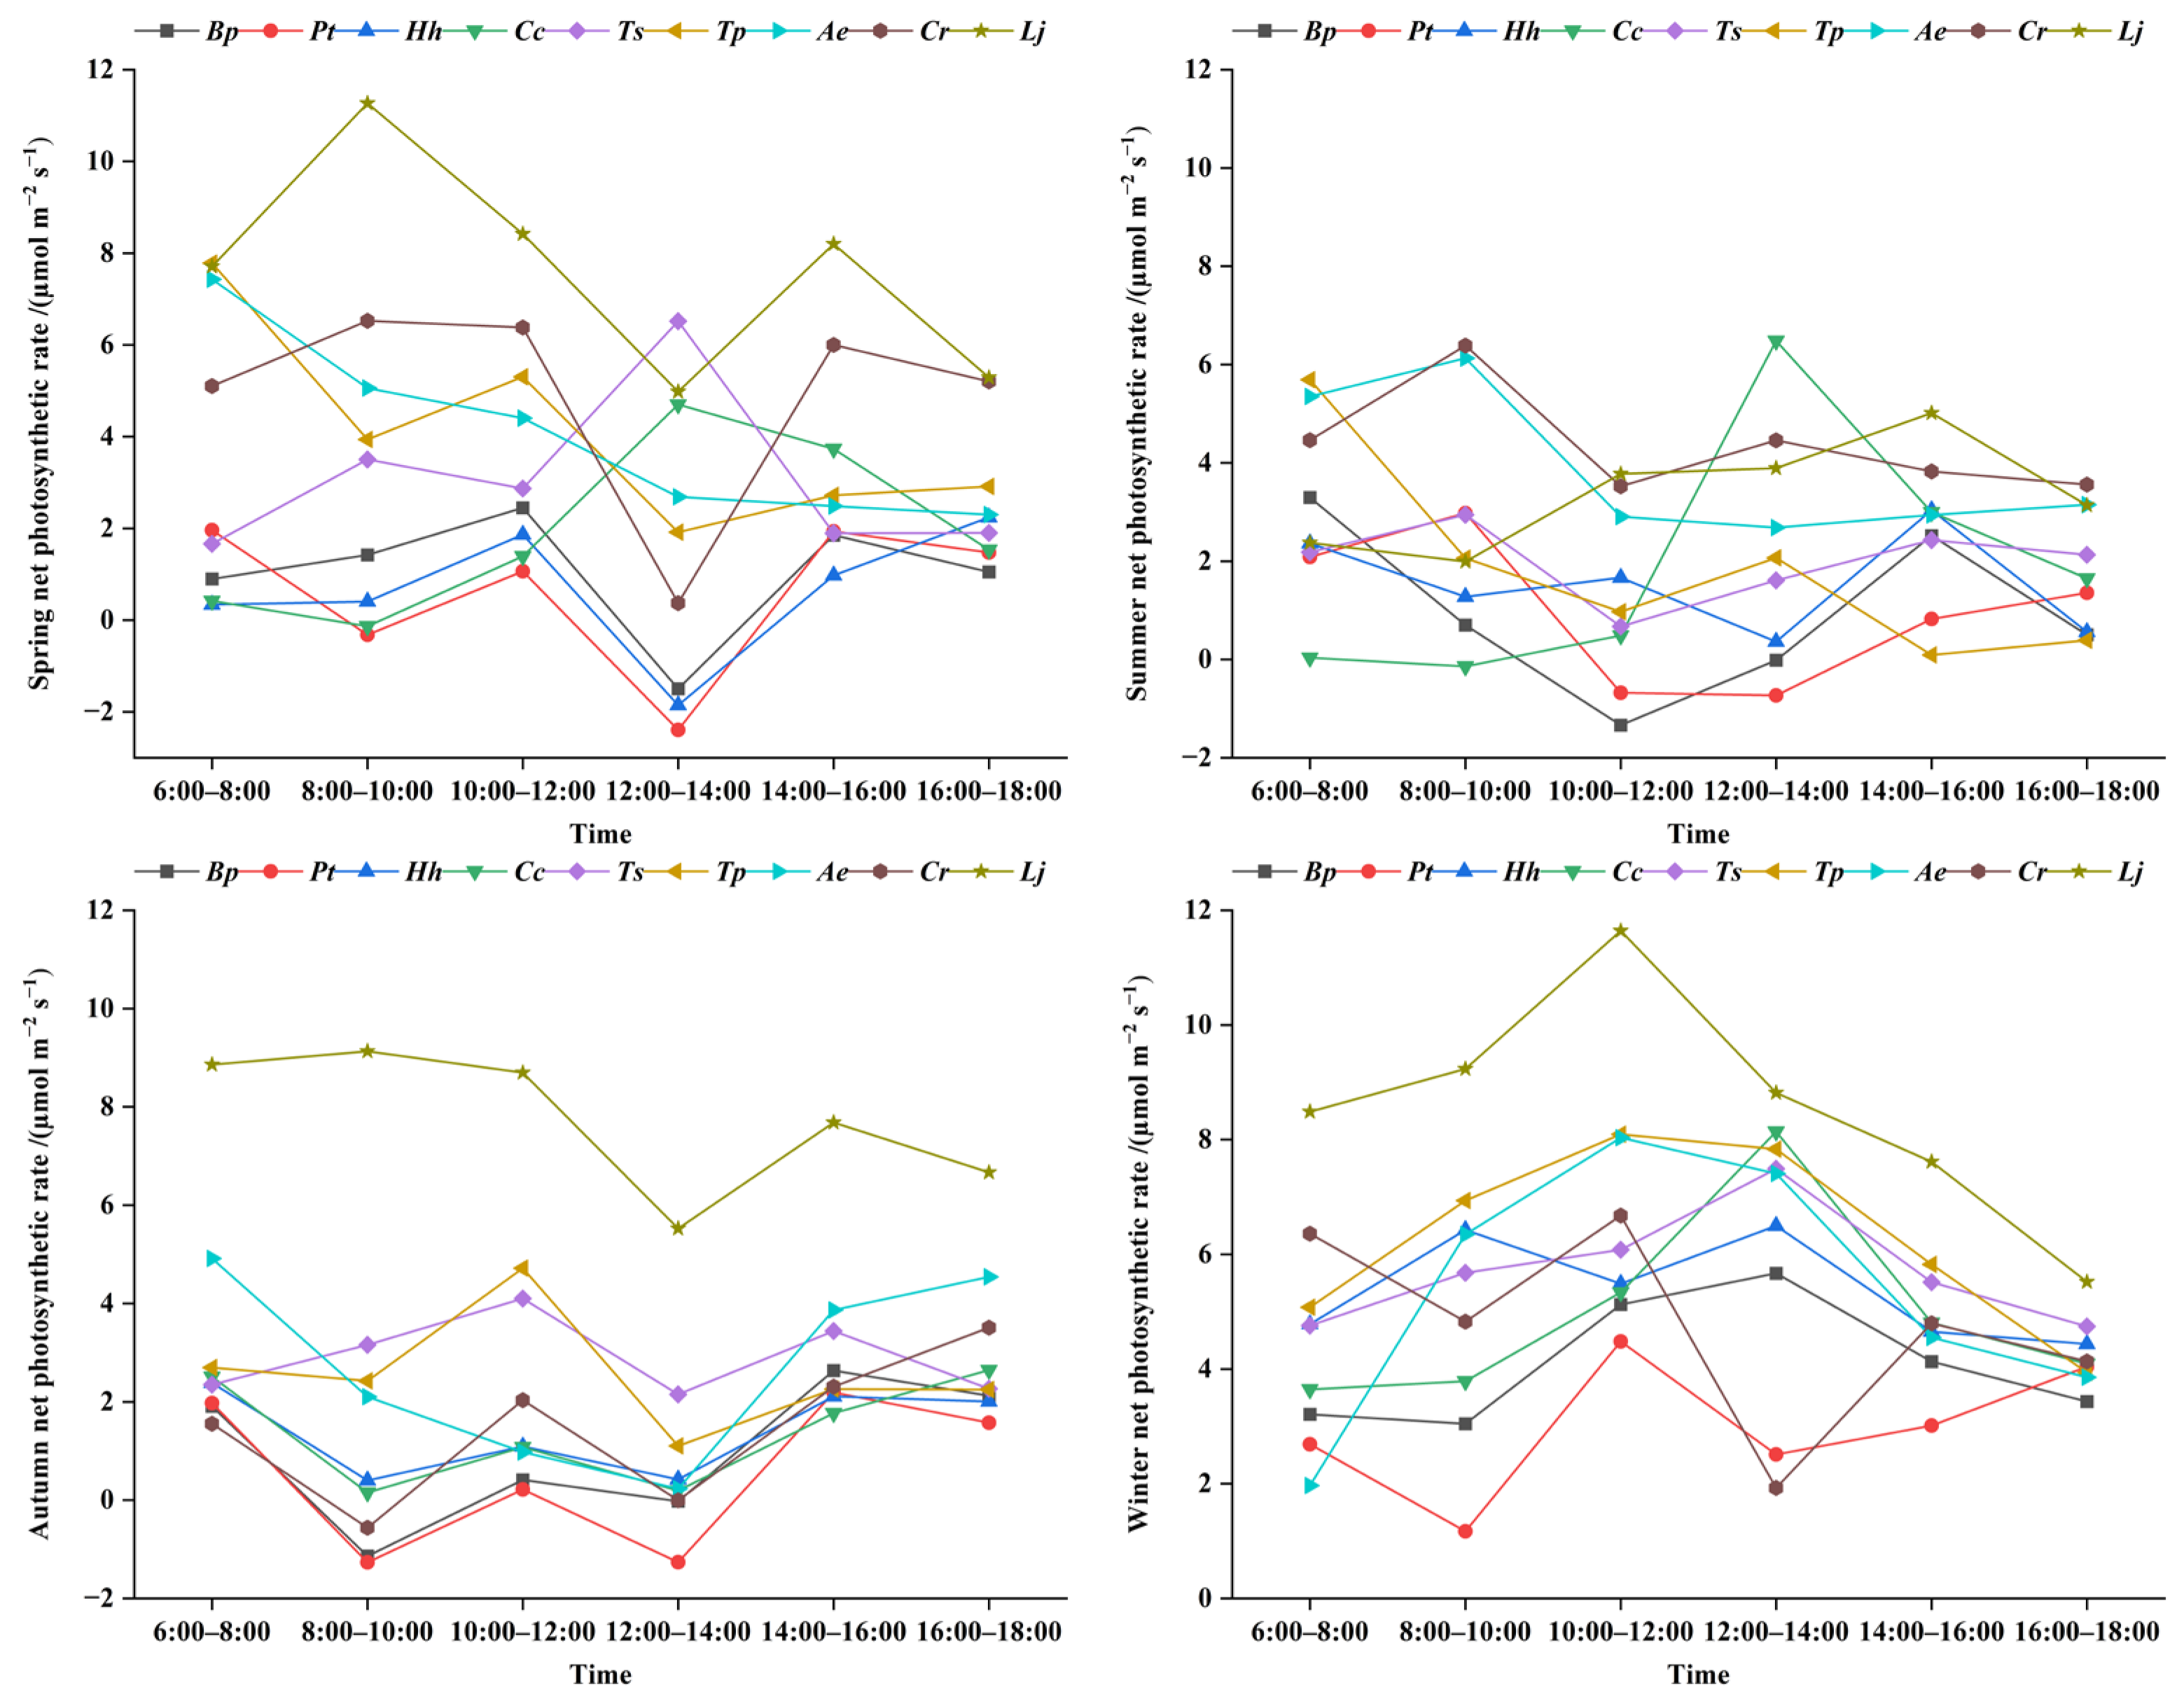
The peak net photosynthetic rate for the nine green roof plant species occurred at different times within the same season. Their diurnal variation curves were primarily characterized by two patterns: unimodal and bimodal. In spring and summer, both Cc and Ae exhibited unimodal diurnal patterns in net photosynthetic rate. The net photosynthetic rate of Cc peaked between 12:00 and 14:00, while that of Ae reached its maximum during 6:00–8:00 and 8:00–10:00, after which rates for both species declined gradually. The other seven species all exhibited a bimodal diurnal pattern. Their net photosynthetic rates showed a “photosynthetic siesta” between 12:00 and 14:00 due to excessively high light intensity. In autumn, all nine species exhibited a bimodal diurnal pattern in net photosynthetic rate. In winter, a bimodal diurnal pattern was observed for Pt, Hh, and Cr, but a unimodal pattern for the remaining species (Figure 4).
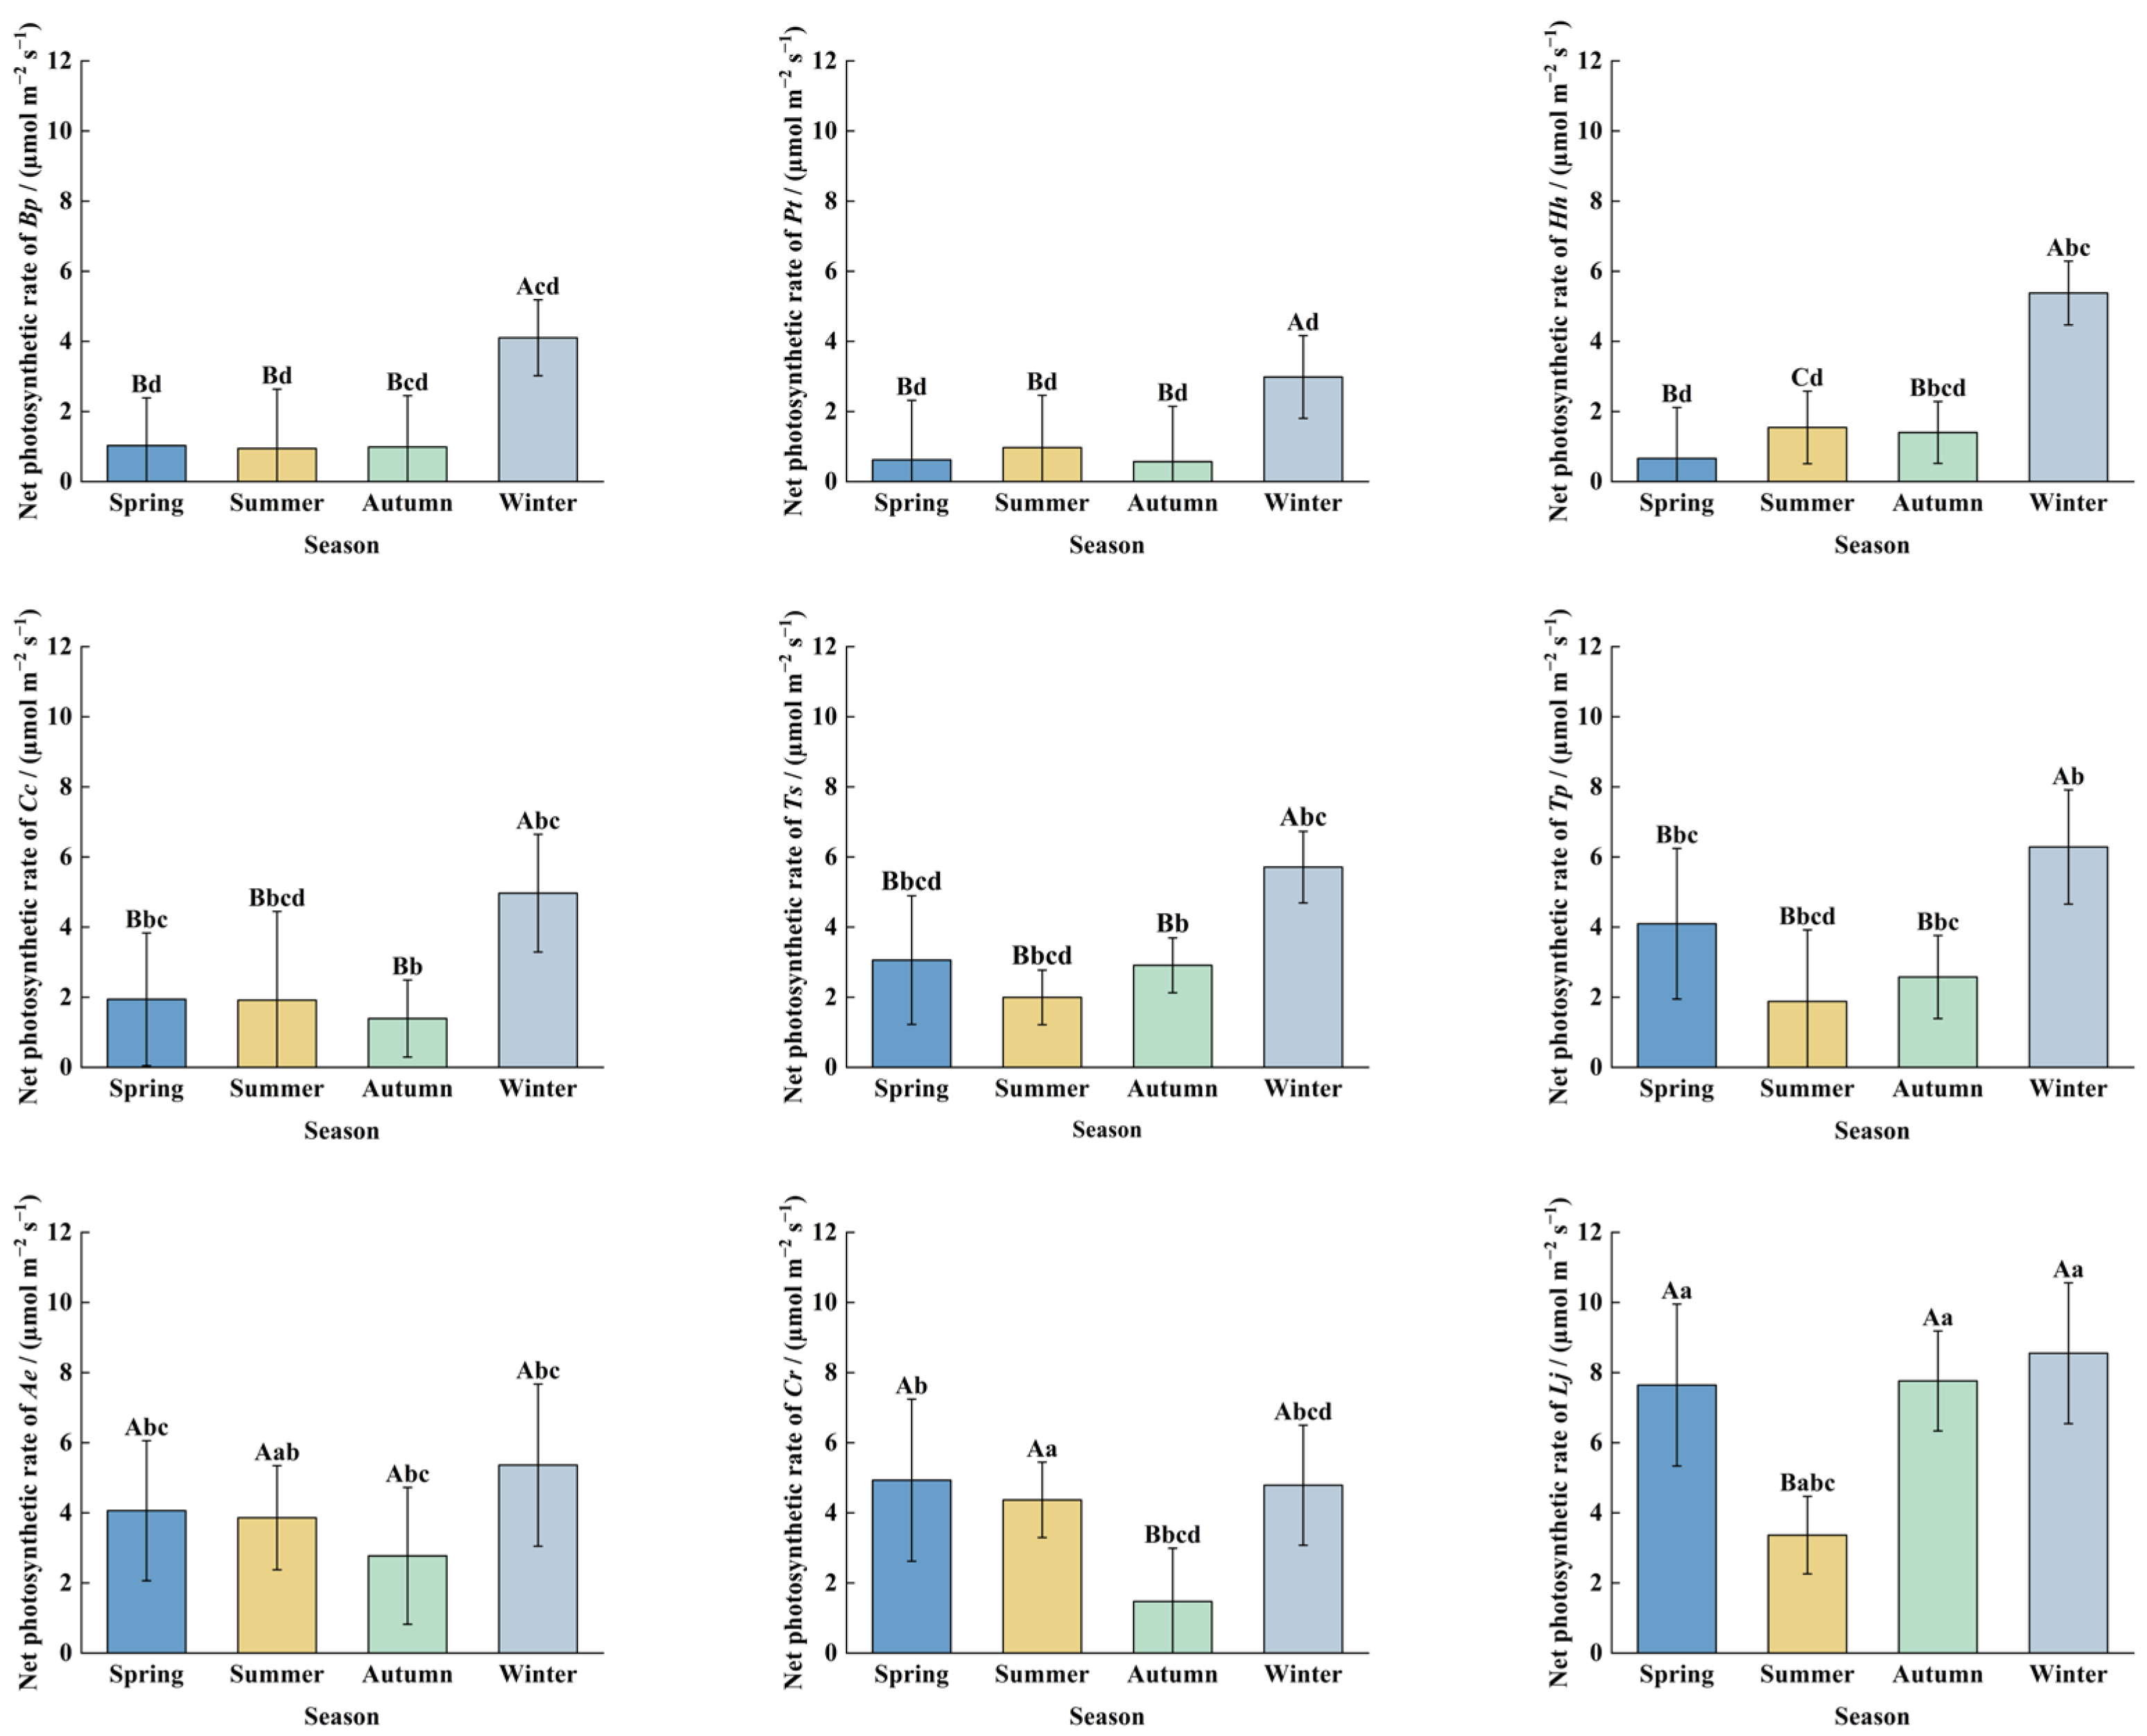
There were significant differences in net photosynthetic rates among different plant species within the same season. In spring, autumn, and winter, the daily average net photosynthetic rates of Lj were 7.64 µmol m−2 s−1, 7.76 µmol m−2 s−1, and 8.55 µmol m−2 s−1, respectively, all of which were significantly higher (p < 0.05) than those of the other plants. Pt had the lowest rates, at 0.62 µmol m−2 s−1, 0.57 µmol m−2 s−1, and 2.98 µmol m−2 s−1, respectively. Cr, Ae, Tp, Ts, and Cc had intermediate rates. Their daily average net photosynthetic rates in spring were 4.93 µmol m−2 s−1, 4.06 µmol m−2 s−1, 4.09 µmol m−2 s−1, 3.06 µmol m−2 s−1, and 1.94 µmol m−2 s−1, respectively. Their daily average net photosynthetic rates in autumn were 1.47 µmol m−2 s−1, 2.77 µmol m−2 s−1, 2.58 µmol m−2 s−1, 2.91 µmol m−2 s−1, and 1.39 µmol m−2 s−1. Their daily average net photosynthetic rates in winter were 4.79 µmol m−2 s−1, 5.36 µmol m−2 s−1, 6.28 µmol m−2 s−1, 5.71 µmol m−2 s−1, and 1.10 µmol m−2 s−1. In summer, the daily average net photosynthetic rate of Cr was 4.37 µmol m−2 s−1, significantly higher than (p < 0.05) that of Bp, Pt, Hh, Tp, Ts, and Cc. Among these, Bp had the lowest rate at 0.94 µmol m−2 s−1, and Lj and Ae had intermediate rates (Figure 5).
There are significant differences in the net photosynthetic rate of the same plant species across different seasons. The average daily net photosynthetic rate for Lj and Cr was significantly higher in spring, autumn, and winter (p < 0.05) than in summer. The average daily net photosynthetic rates for Tp, Ts, Cc, Hh, Pt, and Bp were significantly higher in winter than (p < 0.05) in spring, summer, and autumn. The daily net photosynthetic rate of Ae showed no significant difference among the four seasons (Figure 5).

3.2. Differences in Photosynthetic Carbon Uptake Capacity Among Urban Green Roof Plants

3.2.1. Carbon Uptake per Unit Leaf Area

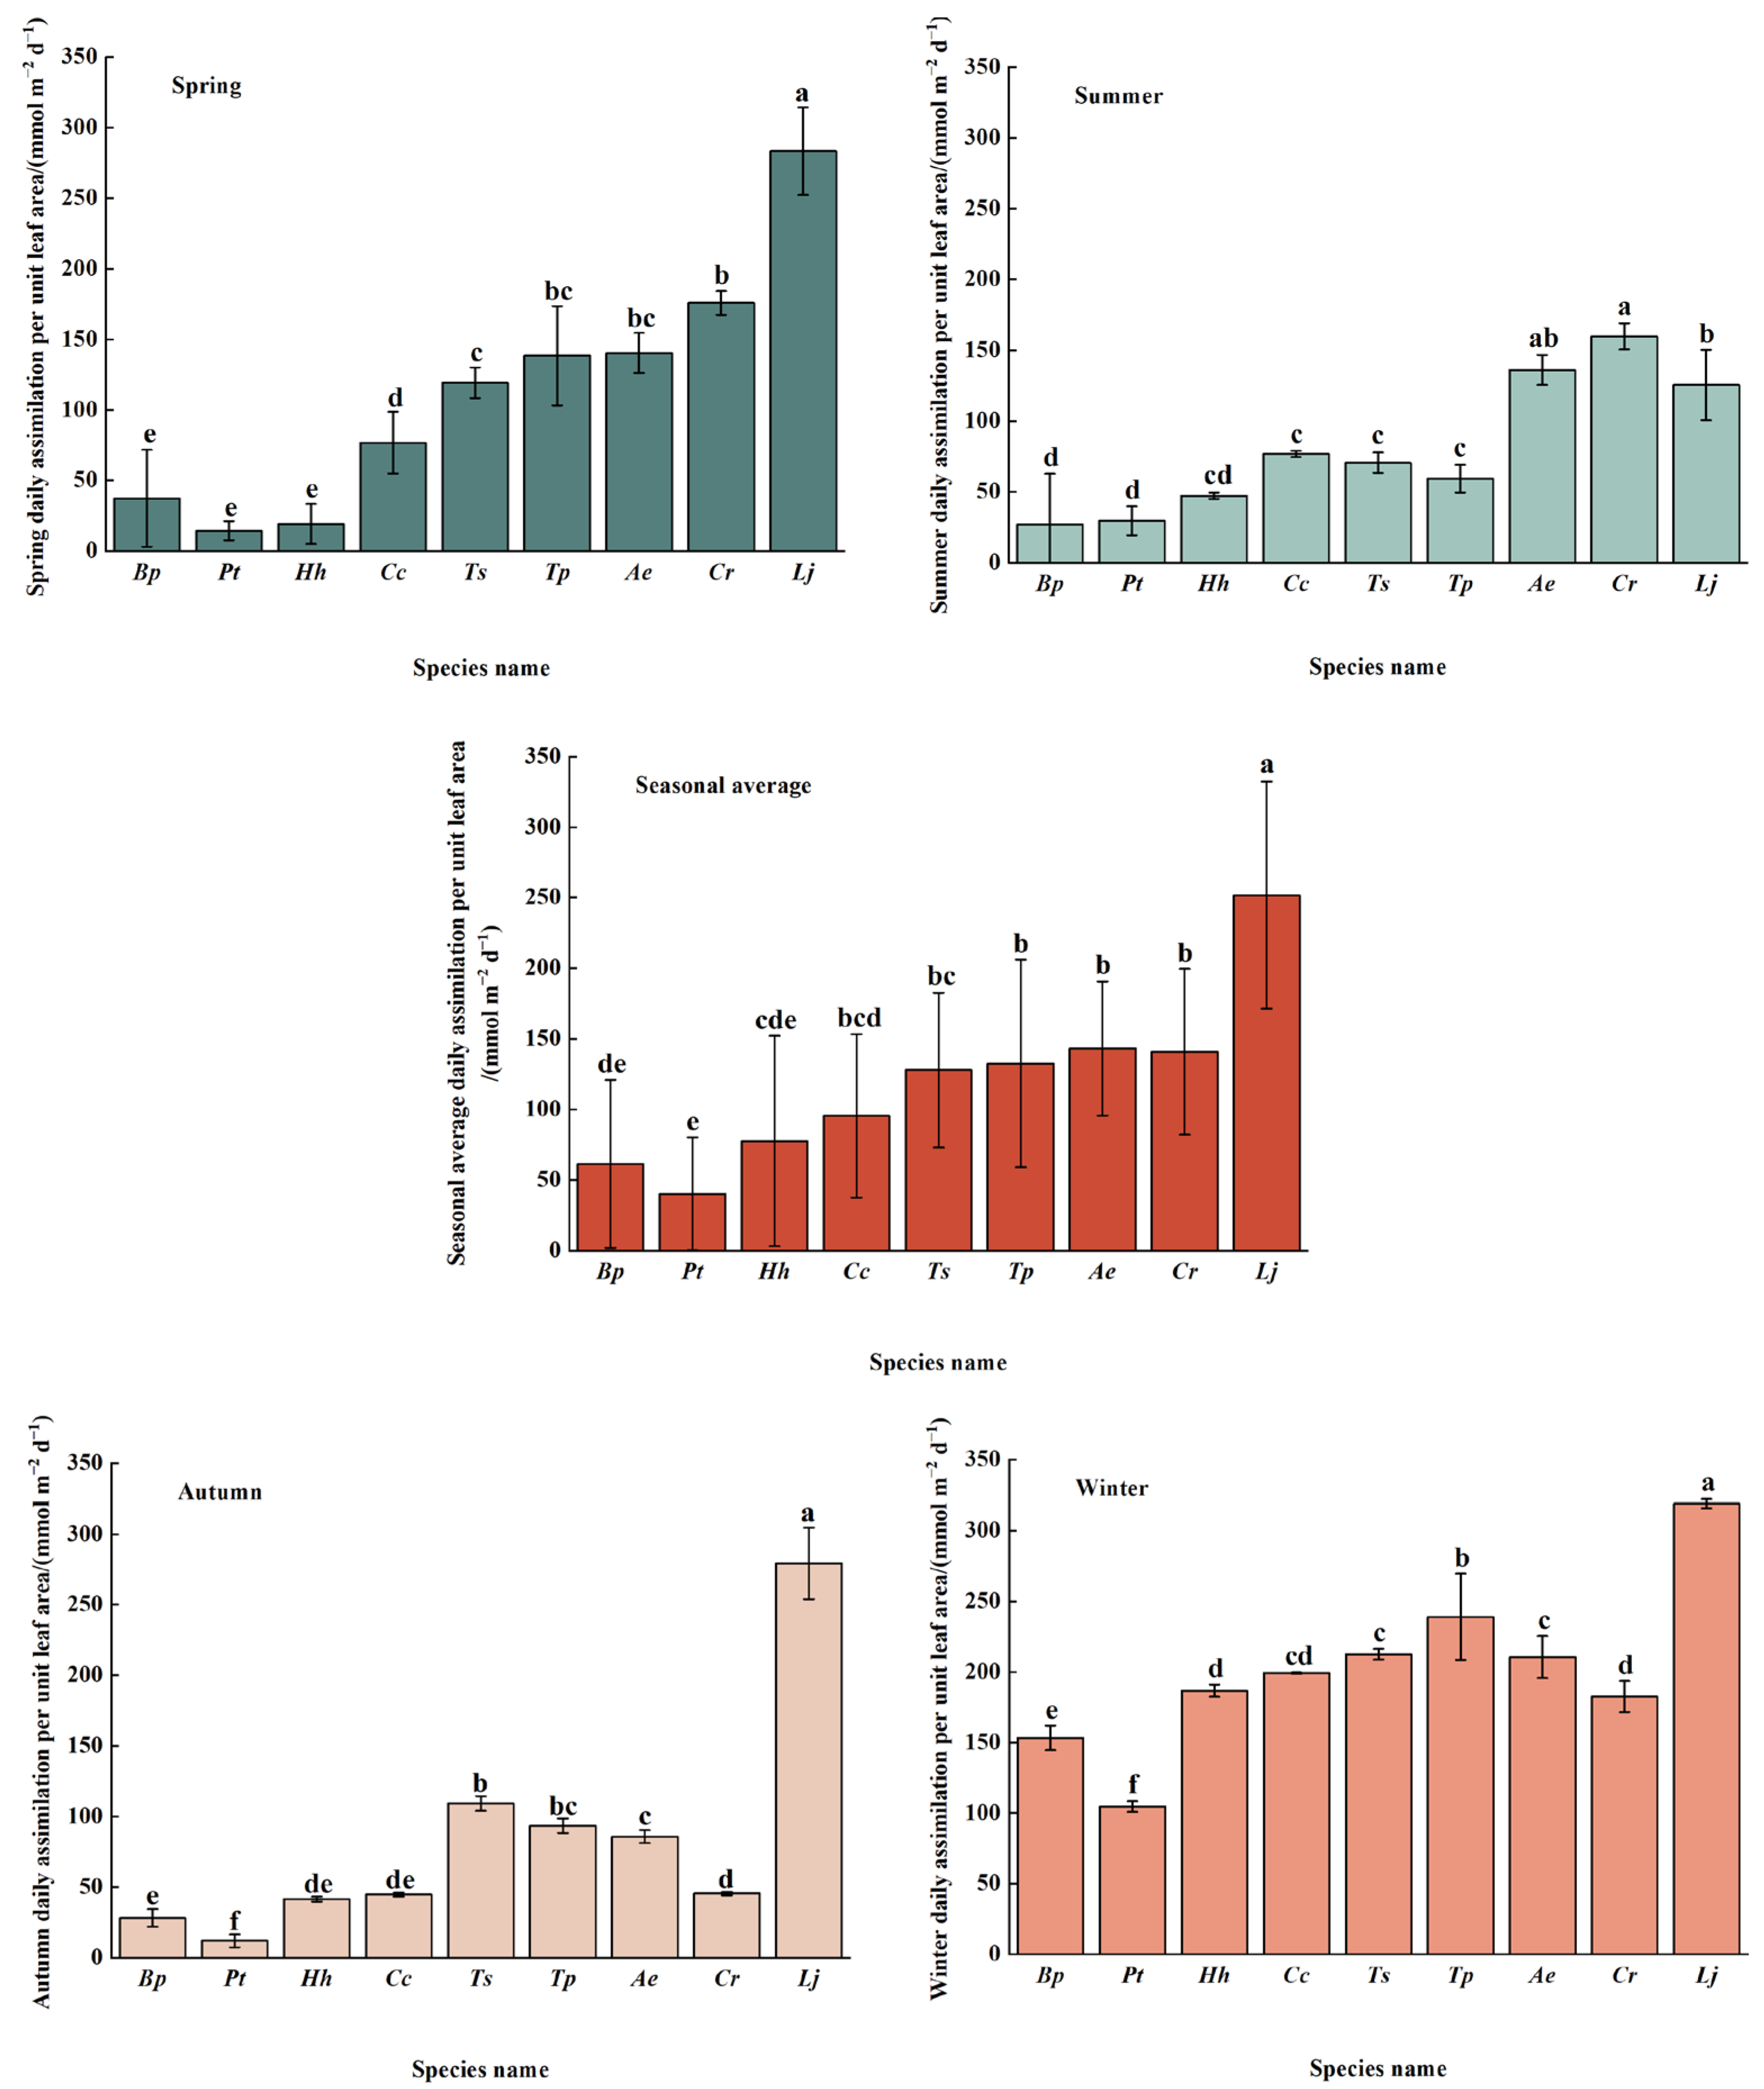
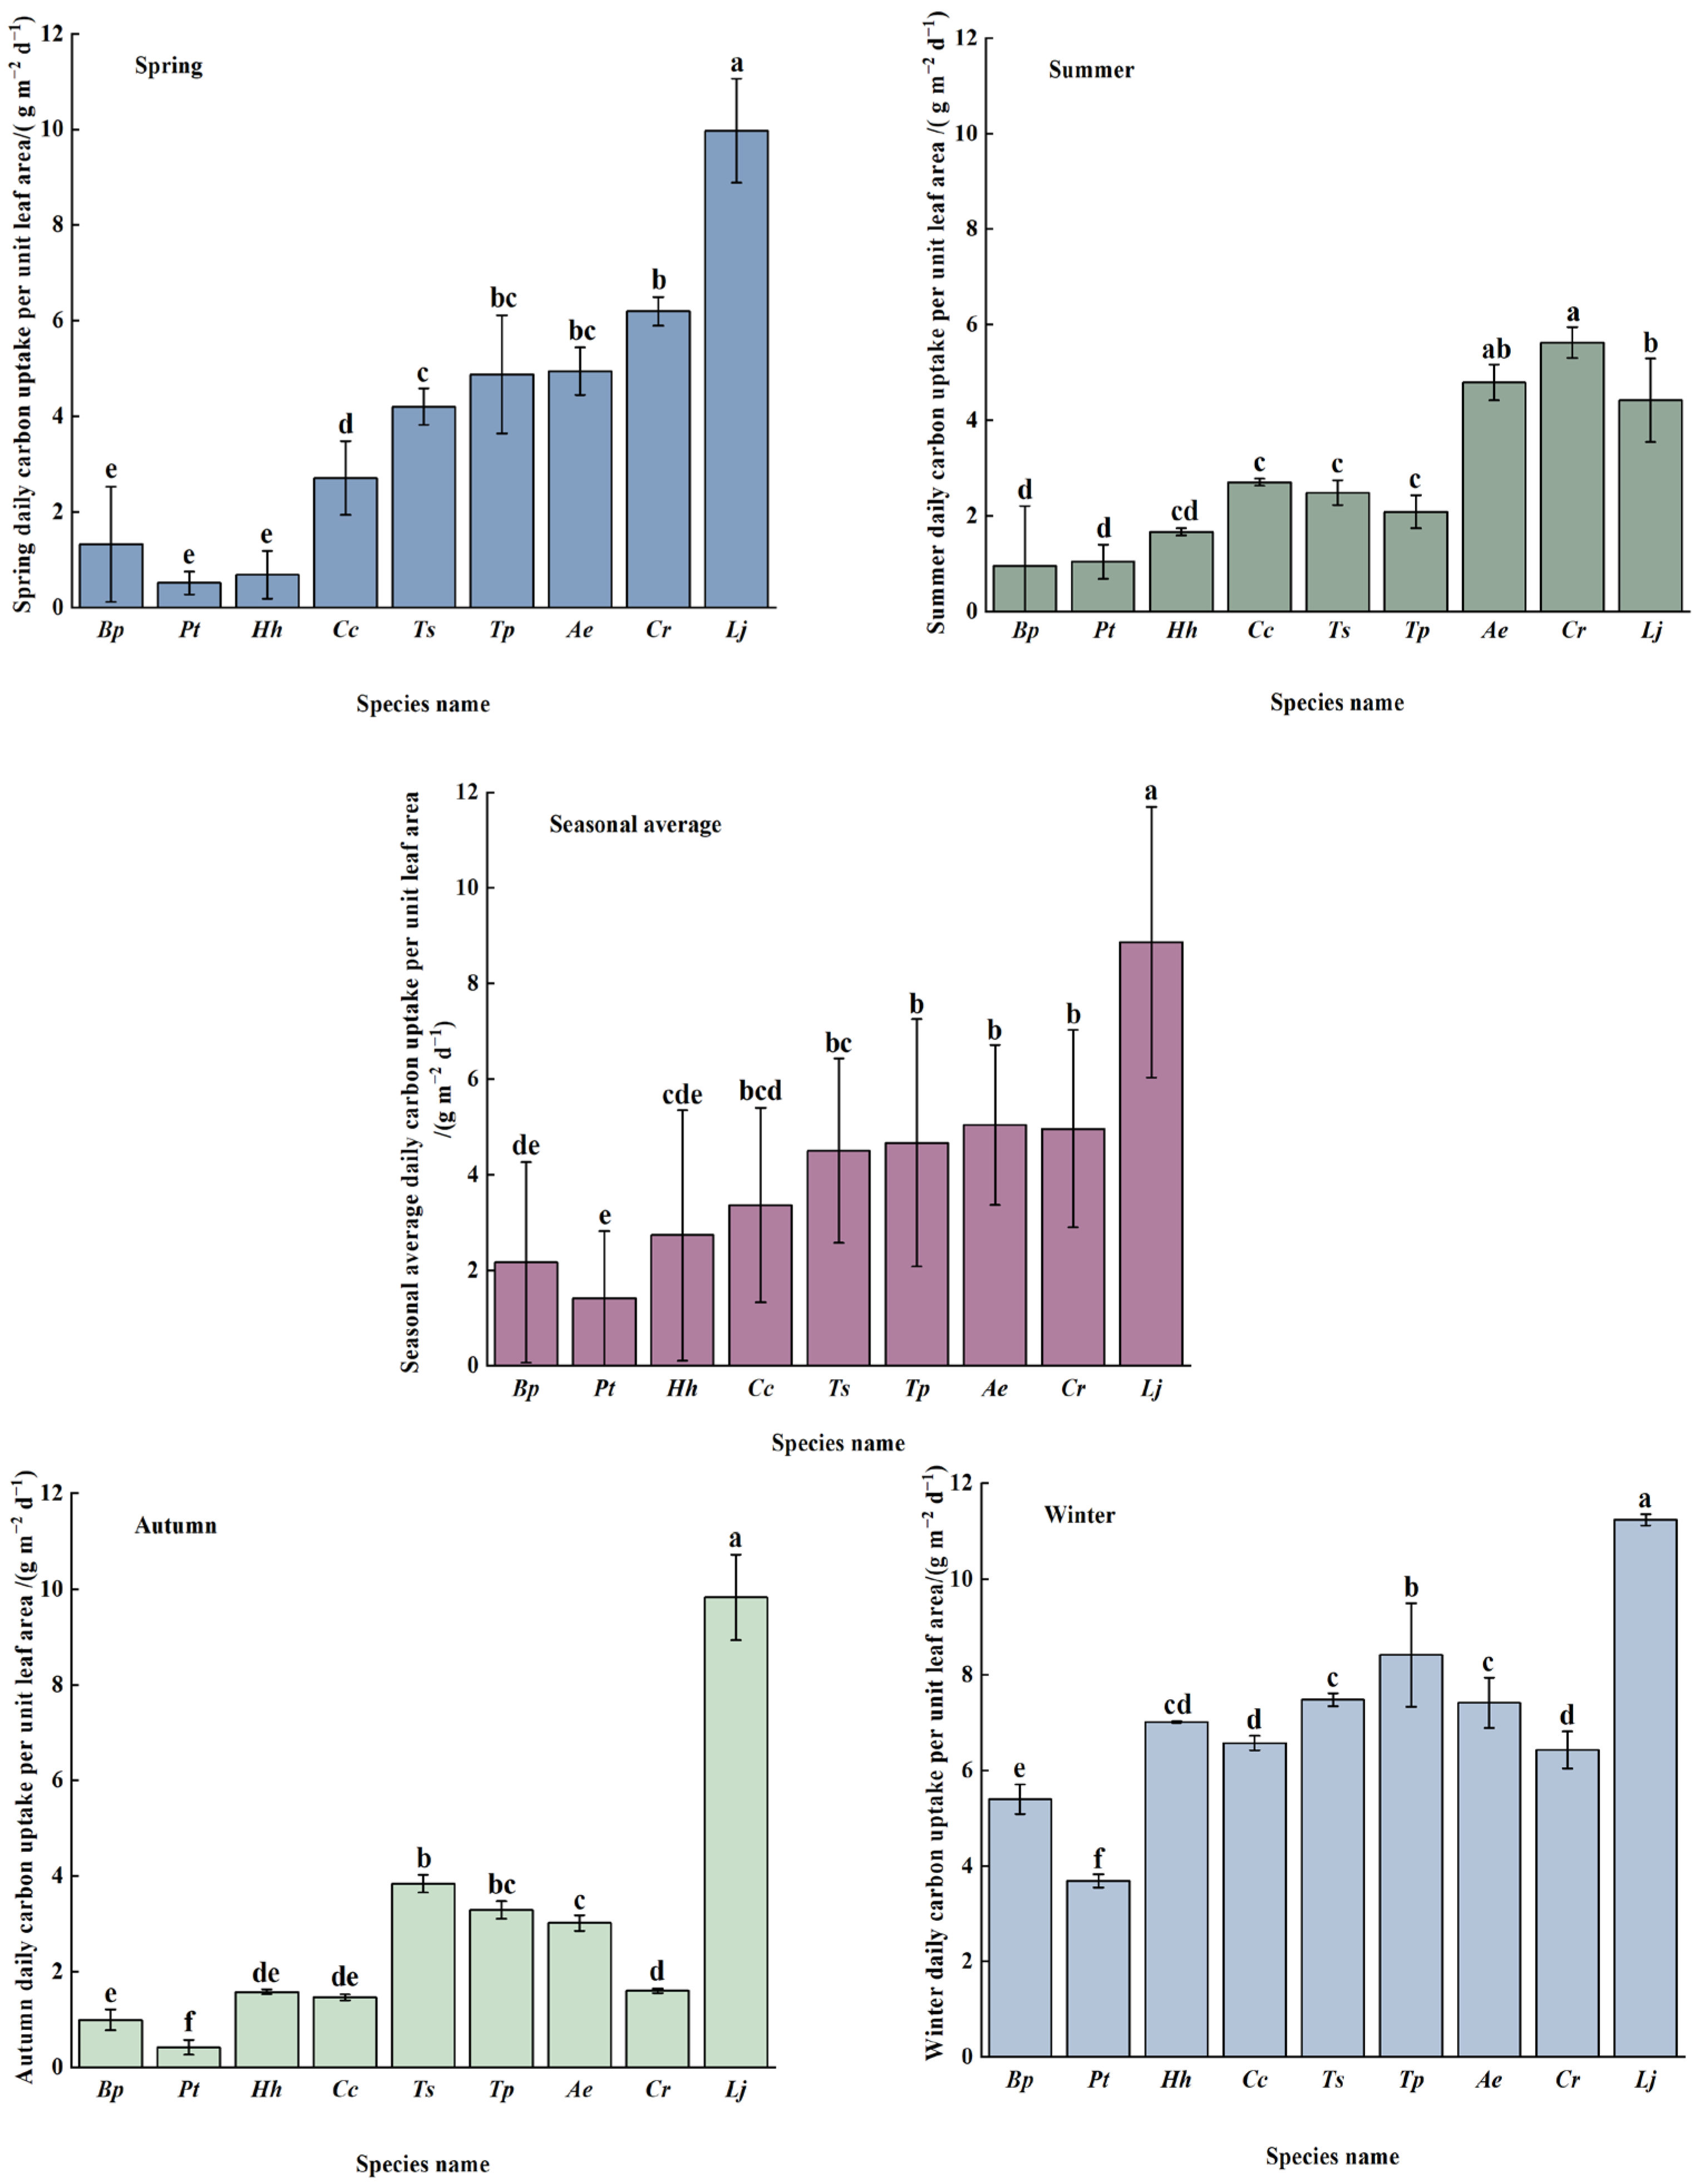
There were significant differences in carbon uptake capacity per unit leaf area among different plant species within the same season. In spring, autumn, and winter, the daily assimilation per unit leaf area of Lj was 283.41 mmol·m−2·d−1, 319.03 mmol·m−2·d−1, and 279.34 mmol·m−2·d−1, respectively. Its daily carbon uptake per unit leaf area was 9.98 g m−2 d−1, 9.83 g m−2 d−1, and 11.23 g m−2 d−1, respectively. All of these values were significantly higher than (p < 0.05) those of the other plants. Pt had the lowest values, with daily assimilation per unit leaf area of 14.43 mmol·m−2·d−1, 11.88 mmol·m−2·d−1, and 104.70 mmol·m−2·d−1, respectively. Its daily carbon uptake per unit leaf area was 0.51 g m−2 d−1, 0.42 g m−2 d−1, and 3.69 g m−2 d−1, respectively. In summer, the daily assimilation per unit leaf area and daily carbon uptake per unit leaf area for Cr were 159.86 mmol·m−2·d−1 and 5.63 g m−2·d−1, respectively. All of these values were significantly higher than (p < 0.05) those of all other plants except Ae, which exhibited intermediate values. Bp had the lowest values, with daily assimilation per unit leaf area and daily carbon uptake per unit leaf area of 27.09 mmol·m−2·d−1 and 0.95 g·m−2·d−1, respectively (Figure 6 and Figure 7).
The seasonal average daily assimilation per unit leaf area and daily carbon uptake per unit leaf area for the Lj were 251.82 mmol·m−2·d−1 and 8.86 g·m−2·d−1, respectively, which were significantly higher than (p < 0.05) those of the other plants. In contrast, Pt had the lowest values, with seasonal average daily assimilation per unit leaf area and daily carbon uptake per unit leaf area of 40.16 mmol·m−2·d−1 and 1.41 g·m−2·d−1, respectively. The species Cr, Ae, Tp, Ts, and Cc exhibited intermediate values. Their seasonal average daily assimilation per unit leaf area was 140.94 mmol·m−2·d−1, 143.22 mmol·m−2·d−1, 132.55 mmol·m−2·d−1, 127.88 mmol·m−2·d−1, and 95.50 mmol·m−2·d−1. Their seasonal average daily carbon uptake per unit leaf area was 4.96 g m−2 d−1, 5.04 g m−2 d−1, 4.67 g m−2 d−1, 4.50 g m−2 d−1, and 3.36 g m−2 d−1. There were no significant differences in the seasonal average daily carbon uptake capacity per unit leaf area among Cr, Ae, and Tp (Figure 6 and Figure 7).

3.2.2. Carbon Uptake per Unit Area of Plants

There were observed differences in carbon uptake per unit area among different plant species during the same season. Across all four seasons, Lj consistently exhibited the highest carbon uptake per unit area, with values of 104.78 g m−2 d−1 in spring, 46.40 g m−2 d−1 in summer, 103.27 g m−2 d−1 in autumn, and 117.95 g m−2 d−1 in winter. In spring and autumn, Pt had the lowest values, at 3.62 g m−2 d−1 and 2.98 g m−2 d−1, respectively. In summer, Bp showed the lowest value of 4.44 g m−2 d−1, while in winter, Ts had the lowest value of 14.10 g m−2 d−1. Lj had the highest seasonal average daily carbon uptake per unit area, at 93.10 g m−2 d−1. Ts had the lowest seasonal average daily carbon uptake per unit area, at 8.42 g m−2 d−1. The seasonal average daily carbon uptake capacity per unit area of Lj was approximately 11 times that of Ts. The ranking of seasonal average daily carbon uptake per unit area for the nine species from highest to lowest was Lj > Cc > Ae > Tp > Cr > Hh > Bp > Pt > Ts (Table 3). This seasonal pattern may be attributed to the indistinct seasonal differentiation in Xiamen’s coastal climate. As a result, light intensity and temperature do not differ greatly between summer and winter. Instead, the observed variation is likely driven by heat stress in summer.
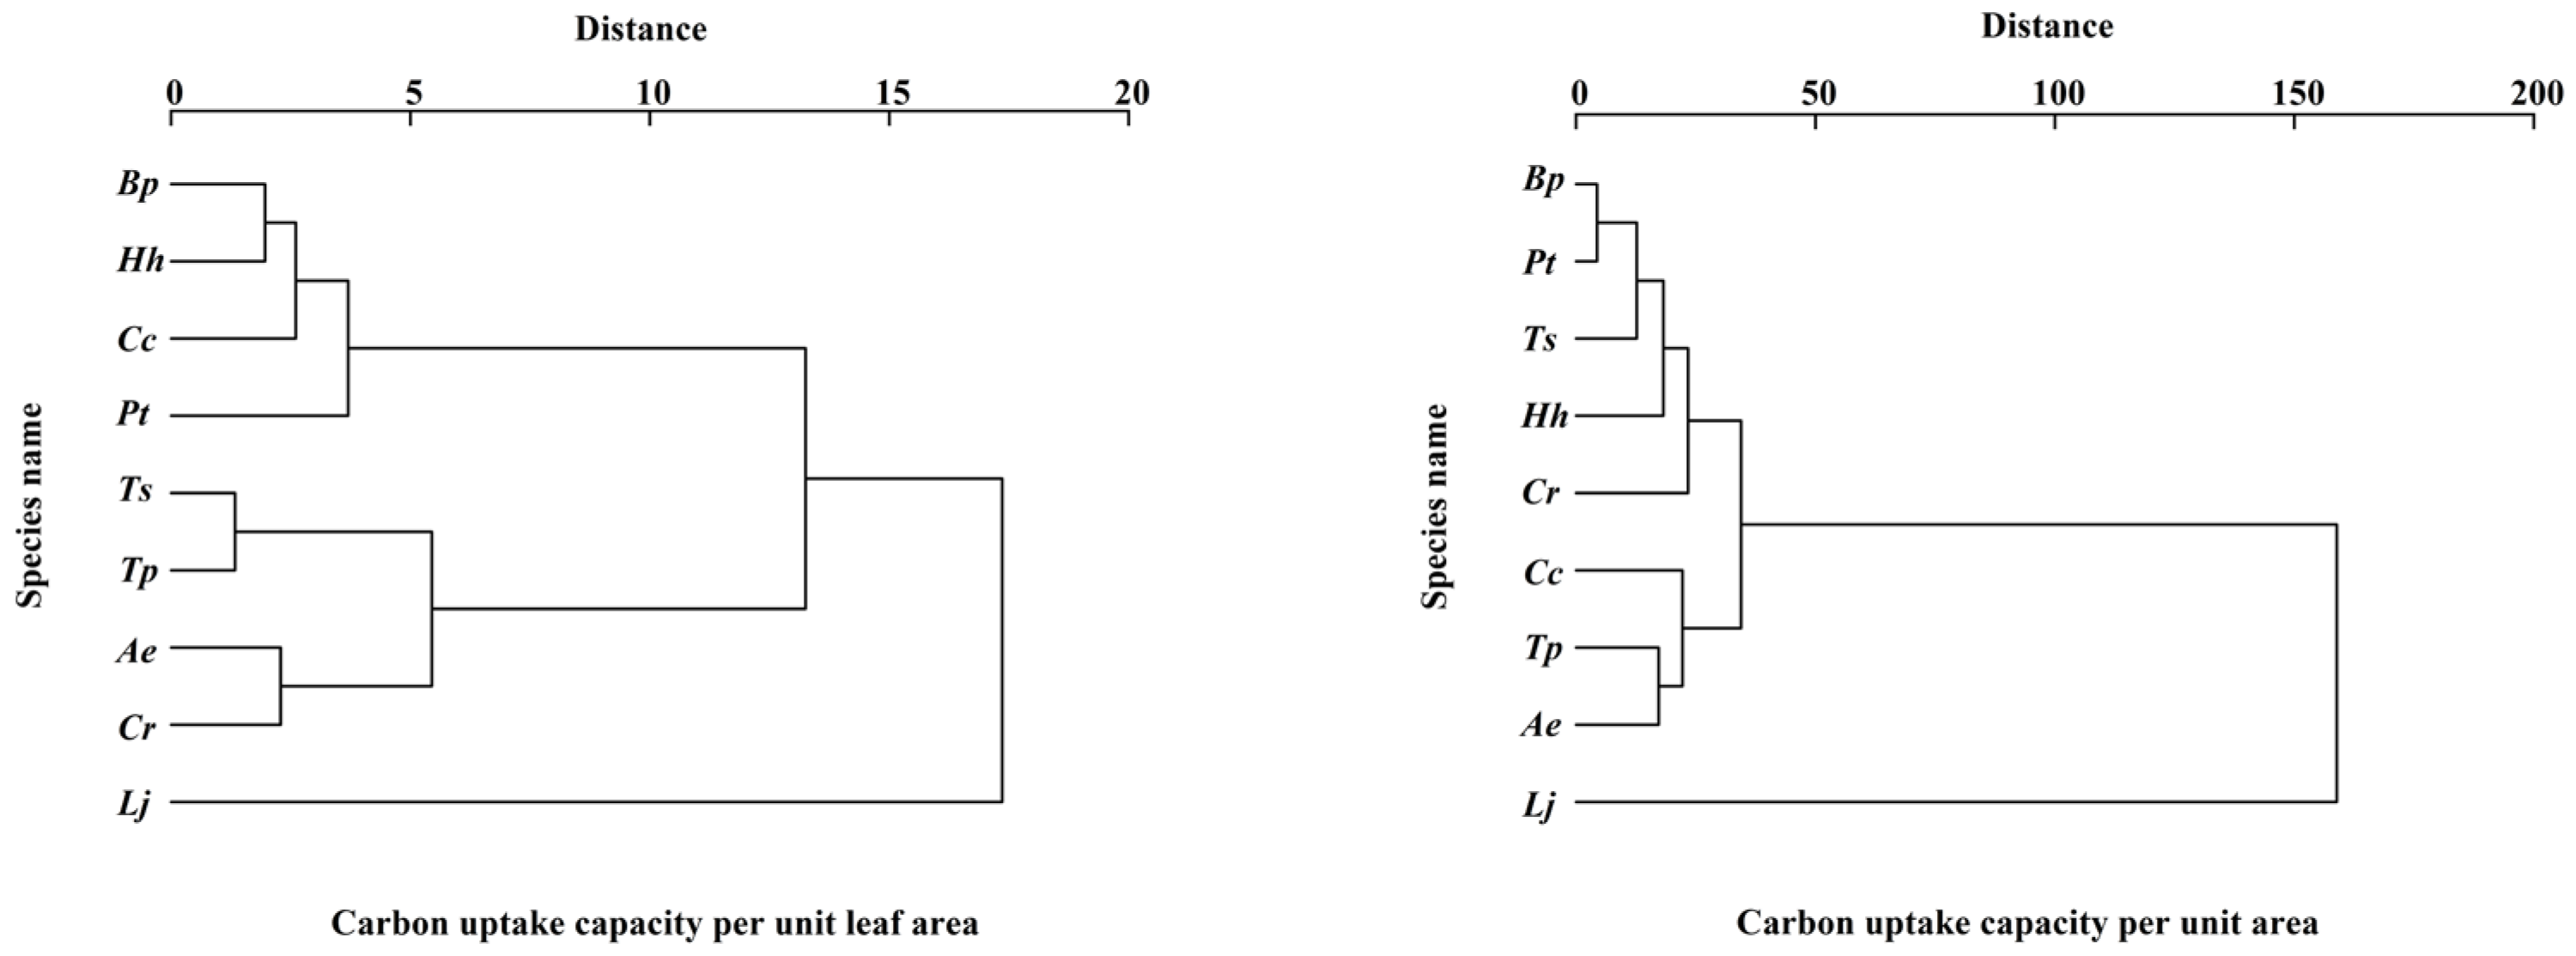
In terms of carbon uptake capacity per unit leaf area, Lj has the highest capacity. Cr, Ae, and Tp exhibited intermediate values. Pt, Cc, Hh, and Bp had lower capacities, with Pt having the lowest carbon uptake capacity per unit leaf area. In terms of carbon uptake capacity per unit area, Lj has the highest capacity. Ae, Tp, and Cc exhibited intermediate values. Cr, Hh, Ts, Pt, and Bp have lower capacities, with Ts having the lowest carbon uptake capacity per unit area (Figure 8).

4. Discussion

In this study, the diurnal variation in net photosynthetic rate in Cc and Ae exhibited a unimodal curve during spring and summer. The diurnal variation for the other seven plant species showed a bimodal curve. In autumn, the diurnal variation patterns for all nine plant species were bimodal curves. In winter, the diurnal variation in net photosynthetic rate for Pt, Hh, and Cr presented a bimodal curve, while the patterns for the remaining plants were unimodal curves. The prevalent bimodal pattern is primarily attributed to the “photosynthetic midday depression” observed in most plants. The main reason is that during dry and hot noon periods, plant leaves wilt, and stomatal conductance decreases, leading to reduced CO2 uptake and enhanced photorespiration [30]. Our observation that the majority of species displayed bimodal curves is consistent with previous research. For instance, Zhao et al. reported that five out of six tree species in East China exhibited bimodal diurnal patterns in net photosynthetic rate, with only one showing a unimodal curve [54].
Green roofs sequester CO2 from the surrounding environment through plant photosynthesis, thereby directly reducing atmospheric CO2 concentrations in urban areas [55]. The photosynthetic carbon uptake capacity of plants is an effective indicator for evaluating their carbon uptake and ecological functions [50]. There are significant interspecific differences in photosynthetic carbon uptake capacity among various green roof plants. Net photosynthetic rate is a decisive indicator influencing carbon uptake per unit leaf area [56]. The ranking of carbon uptake capacity per unit leaf area among different plant species should align with the trend in their daily average net photosynthetic rates [30]. This study yielded the same results: Lj, which had the highest net photosynthetic rate, exhibited the highest daily carbon uptake per unit leaf area, while Pt, which had the lowest net photosynthetic rate, exhibited the lowest daily carbon uptake per unit leaf area.
In addition to the net photosynthetic rate, the leaf area index (LAI) is a key factor influencing the carbon uptake capacity of plants [54]. The leaf area index reflects the density of plant foliage. A higher leaf area index indicates a greater leaf area per unit of land area, resulting in higher light-use efficiency [57]. In this study, the carbon uptake capacity per unit area of green roof plants showed an increasing trend with rising LAI. Although the carbon uptake capacity per unit leaf area of Cr was greater than that of Cc, the LAI of Cc was approximately 2.6 times that of Cr, resulting in a higher carbon uptake capacity per unit area for Cc than for Cr (Figure 8). This positive relationship between LAI and area-based carbon uptake is supported by previous research. For example, Zhang et al. reported that Salix babylonica, despite its moderate daily carbon uptake per unit leaf area, possessed a substantially higher LAI than other measured species, resulting in the highest annual carbon uptake and oxygen release capacity [58].
Carbon uptake capacity varies both among plant species in a given season and within the same species across different growing seasons [58]. In this study, the photosynthetic carbon uptake capacity of the nine green roof plant species generally followed the order: winter > spring > autumn > summer. This trend is inconsistent with some previous studies that reported the highest plant carbon uptake in summer [59,60]. The observed discrepancy may be explained by local environmental conditions. Summer in Xiamen is characterized by high temperatures (averaging 25.7–32.3 °C) and intense solar radiation, which can lead to stomatal closure to reduce water loss, thereby limiting CO2 uptake [30]. In contrast, winter temperatures (averaging 12.1–19.1 °C) are closer to the optimal light–temperature range (approximately 16–27 °C) for local evergreen plants [61], resulting in less environmental stress on photosynthesis. In addition, all nine plant species in this study are evergreen or perennial, maintaining green leaves throughout the year. Therefore, these plants can still maintain high photosynthesis in winter. Furthermore, the difference in light intensity between summer and winter in Xiamen is not substantial. The average irradiance was approximately 1057.55 µmol m−2 s−1 in winter and 1111.04 µmol m−2 s−1 in summer (Table 2), thus rendering light intensity a relatively minor limiting factor. Instead, heat stress in summer constitutes the primary constraint on photosynthesis. Finally, water availability, mediated by both natural precipitation and artificial management, plays a critical role. As a hybrid “human-made–natural” ecosystem [19], green roofs experience water stress during dry periods and require regular irrigation to maintain plant survival [62]. In this study, the green roof was irrigated weekly, except during weeks with sufficient rainfall. Precipitation in Xiamen is concentrated in summer (with about 41 rainy days), whereas winter has significantly fewer (about 13 rainy days). Consequently, artificial irrigation was required more than five times as frequently in winter as in summer, resulting in reduced water stress for plants in winter and thus no water limitation on photosynthesis. Therefore, in practice, the carbon uptake performance of green roof plants is co-determined by natural climatic factors and human management interventions.
The photosynthetic carbon uptake capacity varies among different types of green roof plants. Generally, trees exhibit a greater capacity than shrubs, which in turn surpass that of herbaceous plants. Consistent with this pattern, the nine green roof species examined in this study displayed a trend of trees > shrubs > herbs in terms of photosynthetic carbon uptake capacity. In a study quantifying carbon uptake in three types of green roof landscape systems, Whittinghill et al. also reported that systems dominated by woody plants achieved the highest carbon uptake [63]. Sedum species are currently the most widely used plants on green roofs due to their adaptability to rooftop cultivation. Some studies have indicated that Sedum species exhibit a relatively low carbon uptake capacity [33]. This study yielded a similar finding: the Sedum plant Bp showed a comparatively low photosynthetic carbon uptake capacity. In a study quantifying the carbon uptake capacity of three green roof vegetation types (Sedum, annual plants, and a Sedum–annual mixture), Agra et al. [28] also reported that the Sedum monoculture had the lowest photosynthetic carbon uptake capacity. In this study, Lj exhibited the highest photosynthetic carbon uptake capacity. This result can be attributed to its highest net photosynthetic rate and leaf area index. Furthermore, as a small tree species, Lj possesses a woody structure that contains a higher carbon content than the structures of other plants. Trees generally have a longer lifespan than shrubs and herbs, meaning that Lj benefits from a relatively longer carbon uptake period, thereby enabling greater CO2 uptake. In a study quantifying the carbon uptake capacity of three green roof plant species in Chengdu, Luo et al. [64] also reported that Ligustrum species (to which Lj belongs) demonstrated the highest carbon uptake capacity.

5. Limitations and Prospects

This study has certain limitations that should be acknowledged and addressed in future work. First, the assessment focused primarily on the direct photosynthetic carbon uptake by green roof vegetation. In practice, the overall carbon benefit of a green roof is also influenced by factors such as the growing medium, building energy use, and emissions associated with construction and maintenance. Future research should therefore integrate concurrent monitoring of both plant and substrate carbon fluxes, and incorporate indirect carbon factors related to building energy and life-cycle processes, to enable a holistic life-cycle assessment of green roof carbon performance. Second, the carbon uptake values reported here reflect the theoretical maximum under near-ideal weather conditions. In real growing seasons, non-ideal conditions such as cloudy and rainy days reduce daily photosynthetic activity, meaning our estimates may overestimate actual season-long carbon uptake. Further studies should include continuous measurements across a wider range of weather conditions to better quantify the impact of meteorological variability on photosynthetic carbon uptake. In addition, several limitations regarding LAI should be noted. LAI was measured only once and assumed constant across seasons, which does not account for potential seasonal changes in leaf area. Future studies should measure LAI across multiple seasons to capture seasonal dynamics. Furthermore, although all plants were grown under uniform conditions, LAI is influenced not only by species type but also by planting density and management practices; therefore, the reported rankings may partly reflect the specific setup conditions of this study. These factors should be considered when interpreting the seasonal estimates and generalizing the findings to other green roof contexts. Despite these limitations, this study advances the scientific understanding of the photosynthetic carbon uptake capacity of green roof plants. The findings provide a robust scientific basis for plant selection and policy planning of green roofs in southeastern coastal cities.

6. Conclusions

Green roofs effectively contribute to maintaining the stability of urban ecosystems. However, the differences in the photosynthetic carbon uptake capacity of green roof plants in southeastern coastal cities remain unclear. In this study, which investigated nine representative green roof plant species from southeastern coastal cities, Lj ranked highest in metrics such as net photosynthetic rate, net assimilation per unit leaf area, and leaf area index, resulting in its highest photosynthetic carbon uptake capacity among the nine species examined. The variation in carbon uptake capacity per unit leaf area among different green roof plants aligned with the trend in their net photosynthetic rate, while the variation in carbon uptake capacity per unit ground area corresponded to the trend in leaf area index. Overall, the photosynthetic carbon uptake capacity of the nine plant species followed the hierarchy: trees > shrubs > herbs. In future urban-scale green roof development projects in the southeastern coastal region, Lj may be considered a promising candidate to enhance the photosynthetic carbon uptake capacity of green roofs. At the same time, when implementing actual greening projects, it is essential to take site conditions into account and conduct a comprehensive assessment of factors such as the ecological adaptability of plants, engineering structures, and long-term maintenance costs. This study reveals the importance of green roofs in enhancing photosynthetic carbon uptake, and the findings provide a scientific basis for urban planning and development.

Author Contributions

Conceptualization, T.L. and S.T.; methodology, T.L. and S.T.; software, S.T.; validation, S.T.; formal analysis, S.T. and Z.J.; investigation, S.T. and Y.Z.; resources, T.L.; data curation, S.T. and Z.J.; writing—original draft preparation, S.T.; writing—review and editing, S.T., T.L. and Z.J.; visualization, S.T. and Y.Y.; supervision, T.L.; project administration, T.L.; funding acquisition, T.L. All authors have read and agreed to the published version of the manuscript.

Funding

This research was funded by the National Natural Science Foundation of China (NSFC), grant number 42561134232.

Data Availability Statement

The original contributions presented in the study are included in this article. Further inquiries can be directed to the corresponding author.

Conflicts of Interest

The authors declare no conflicts of interest.

Abbreviations

The following abbreviations are used in this manuscript:
BpBryophyllum pinnatum (L. f.)
PtPedilanthus tithymaloides (L.) Poit.
HhHeptapleurum heptaphyllum (L.) Y. F. Deng
CcColeus caninus (Roth) Vatke.
TsTradescantia spathacea Sw.
TpTradescantia pallida (Rose) D.
AeArrhenatherum elatius f. variegatum
CrCallisia repens L.
LjLigustrum japonicum ‘Howardii’
LAILeaf area index

References

  1. Farina, G.; Le Coënt, P.; Neverre, N. Multi-Objective Optimization of Rainwater Infiltration Infrastructures along an Urban–Rural Gradient. Landsc. Urban Plan. 2024, 242, 104949. [Google Scholar] [CrossRef]
  2. Liang, C.; Zhang, R.-C.; Zeng, J. Optimizing Ecological and Economic Benefits in Areas with Complex Land-Use Evolution Based on Spatial Subdivisions. Landsc. Urban Plan. 2023, 236, 104782. [Google Scholar] [CrossRef]
  3. International Resource Panel. The Weight of Cities: Resource Requirements of Future Urbanization; United Nations Environment Programme: Nairobi, Kenya, 2018; Available online: https://www.researchgate.net/publication/327035481_The_Weight_of_Cities_Resource_Requirements_of_Future_Urbanization (accessed on 24 March 2026).
  4. Calvin, K.; Dasgupta, D.; Krinner, G.; Mukherji, A.; Thorne, P.W.; Trisos, C.; Romero, J.; Aldunce, P.; Barrett, K.; Blanco, G.; et al. Climate Change 2023: Synthesis Report. Contribution of Working Groups I, II and III to the Sixth Assessment Report of the Intergovernmental Panel on Climate Change; IPCC: Geneva, Switzerland, 2023. [Google Scholar] [CrossRef]
  5. Sharma, A.; Conry, P.; Fernando, H.J.S.; Hamlet, A.F.; Hellmann, J.J.; Chen, F. Green and Cool Roofs to Mitigate Urban Heat Island Effects in the Chicago Metropolitan Area: Evaluation with a Regional Climate Model. Environ. Res. Lett. 2016, 11, 064004. [Google Scholar] [CrossRef]
  6. Grimmond, S.U.E. Urbanization and Global Environmental Change: Local Effects of Urban Warming. Geogr. J. 2007, 173, 83–88. [Google Scholar] [CrossRef]
  7. Aries, M.B.C.; Veitch, J.A.; Newsham, G.R. Windows, View, and Office Characteristics Predict Physical and Psychological Discomfort. J. Environ. Psychol. 2010, 30, 533–541. [Google Scholar] [CrossRef]
  8. Dong, X.; Liu, X.; He, B.J. Exploring the Potential of Roof Greening for Low-Carbon Landscapes. Chin. J. Appl. Ecol. 2023, 34, 2285–2296. [Google Scholar] [CrossRef] [PubMed]
  9. Aleksejeva, J.; Voulgaris, G.; Gasparatos, A. Systematic Review of the Climatic and Non-Climatic Benefits of Green Roofs in Urban Areas. Urban Clim. 2024, 58, 102133. [Google Scholar] [CrossRef]
  10. Yang, S.; Kong, F.; Yin, H.; Zhang, N.; Tan, T.; Middel, A.; Liu, H. Carbon Dioxide Reduction from an Intensive Green Roof through Carbon Flux Observations and Energy Consumption Simulations. Sustain. Cities Soc. 2023, 99, 104913. [Google Scholar] [CrossRef]
  11. Zhang, X.; Gu, R.; Chen, Z.; Li, Y. Effect of Dust Capturing of Residential Greenland in Beijing. J. Beijing Univ. Agric. 1997, 19, 12–17. [Google Scholar]
  12. Ren, L. Research on Roof Garden Design; Beijing Industrial University Press: Beijing, China, 2005. [Google Scholar]
  13. Ling, Z.Y.; Peng, L.H.; Wen, H. Comparison on the Stormwater Runoff Effects of Roof Greening in Different Urban Functional Areas. Chin. J. Appl. Ecol. 2023, 34, 491–498. [Google Scholar] [CrossRef] [PubMed]
  14. Imran, H.M.; Kala, J.; Ng, A.W.M.; Muthukumaran, S. Effectiveness of Green and Cool Roofs in Mitigating Urban Heat Island Effects during a Heatwave Event in the City of Melbourne in Southeast Australia. J. Clean. Prod. 2018, 197, 393–405. [Google Scholar] [CrossRef]
  15. Madre, F.; Vergnes, A.; Machon, N.; Clergeau, P. Green Roofs as Habitats for Wild Plant Species in Urban Landscapes: First Insights from a Large-Scale Sampling. Landsc. Urban Plan. 2014, 122, 100–107. [Google Scholar] [CrossRef]
  16. Joimel, S.; Grard, B.; Auclerc, A.; Hedde, M.; Le Doaré, N.; Salmon, S.; Chenu, C. Are Collembola “flying” onto green roofs? Ecol. Eng. 2018, 111, 117–124. [Google Scholar] [CrossRef]
  17. Ozden, O.; Yldrm, S. Positive Effects of Vegetation: Biodiversity and Extensive Green Roofs for Mediterranean Climate. Int. J. Adv. Appl. Sci. 2018, 5, 87–92. [Google Scholar] [CrossRef]
  18. Wang, X.; Rodiek, S.; Wu, C.; Chen, Y.; Li, Y. Stress Recovery and Restorative Effects of Viewing Different Urban Park Scenes in Shanghai, China. Urban For. Urban Green. 2016, 15, 112–122. [Google Scholar] [CrossRef]
  19. Mihalakakou, G.; Souliotis, M.; Papadaki, M.; Menounou, P.; Dimopoulos, P.; Kolokotsa, D.; Paravantis, J.A.; Tsangrassoulis, A.; Panaras, G.; Giannakopoulos, E.; et al. Green Roofs as a Nature-Based Solution for Improving Urban Sustainability: Progress and Perspectives. Renew. Sust. Energ. Rev. 2023, 180, 113306. [Google Scholar] [CrossRef]
  20. Lo, A.Y.H.; Jim, C.Y. Citizen Attitude and Expectation towards Greenspace Provision in Compact Urban Milieu. Land Use Policy 2012, 29, 577–586. [Google Scholar] [CrossRef]
  21. Stovin, V.; Vesuviano, G.; Kasmin, H. The Hydrological Performance of a Green Roof Test Bed under UK Climatic Conditions. J. Hydrol. 2012, 414–415, 148–161. [Google Scholar] [CrossRef]
  22. Tan, T.; Kong, F.; Yin, H.; Cook, L.M.; Middel, A.; Yang, S. Carbon Dioxide Reduction from Green Roofs: A Comprehensive Review of Processes, Factors, and Quantitative Methods. Renew. Sust. Energy Rev. 2023, 182, 113412. [Google Scholar] [CrossRef]
  23. Rowe, D.B. Green Roofs as a Means of Pollution Abatement. Environ. Pollut. 2011, 159, 2100–2110. [Google Scholar] [CrossRef] [PubMed]
  24. Wu, J.S. The Research of Planting Roof on Energy Saving of Building and Effect of City Ecological Environment. Master’s Thesis, Hebei University of Engineering, Handan, China, 2007. [Google Scholar] [CrossRef]
  25. Yang, C.; Zhang, Y.; Chen, M.; Zhu, S.; Tang, Y.; Zhang, Z.; Ma, W.; Liu, H.; Chen, J.; Tang, B.; et al. Roof Greening in Major Chinese Cities Possibly Afford a Large Potential Carbon Sink. Sci. Bull. 2024, 69, 3313–3322. [Google Scholar] [CrossRef] [PubMed]
  26. Chen, T.; Zhang, N.; Ye, Z.; Jiang, K.; Lin, Z.; Zhang, H.; Xu, Y.; Liu, Q.; Huang, H. Carbon Reduction Benefits of Photovoltaic-Green Roofs and Their Climate Change Mitigation Potential: A Case Study of Xiamen City. Sustain. Cities Soc. 2024, 114, 105760. [Google Scholar] [CrossRef]
  27. Li, H.M. Selection of Roof Greening Plants and The Study on Ecological Effects in Guangzhou. Master’s Thesis, South China University of Technology, Guangzhou, China, 2011. [Google Scholar]
  28. Agra, H.; Klein, T.; Vasl, A.; Kadas, G.; Blaustein, L. Measuring the Effect of Plant-Community Composition on Carbon Fixation on Green Roofs. Urban For. Urban Green. 2017, 24, 1–4. [Google Scholar] [CrossRef]
  29. Chen, C.-F. A Preliminary Study on Carbon Sequestration Potential of Different Green Roof Plants. Int. J. Res. Stud. Biosci. 2015, 3, 121–129. [Google Scholar]
  30. Chen, G.L. Photosynthetic Characteristics and Carbon Fixation and Oxygen Release Capacity of Typical Plants in Helan Mountain. Master’s Thesis, Ningxia University, Yinchuan, China, 2021. [Google Scholar] [CrossRef]
  31. Cao, D. Review of Research on Carbon Sequestration Potential of Green Roofs. Archit. Cult. 2021, 18, 27–30. [Google Scholar] [CrossRef]
  32. Yamori, W.; Hikosaka, K.; Way, D.A. Temperature Response of Photosynthesis in C3, C4, and CAM Plants: Temperature Acclimation and Temperature Adaptation. Photosynth. Res. 2014, 119, 101–117. [Google Scholar] [CrossRef] [PubMed]
  33. Getter, K.L.; Rowe, D.B.; Robertson, G.P.; Cregg, B.M.; Andresen, J.A. Carbon Sequestration Potential of Extensive Green Roofs. Environ. Sci. Technol. 2009, 43, 7564–7570. [Google Scholar] [CrossRef] [PubMed]
  34. Chen, A.H. Cultivation Techniques of Ligustrum japonicum ‘Howardii’. Anhui For. 2007, 27, 32–33. [Google Scholar]
  35. Zhao, M. Growth Characteristics and Cultivation Applications of Heptapleurum heptaphyllum(L.) Y. F. Deng. Mod. Hortic. 2018, 40, 34–35. [Google Scholar] [CrossRef]
  36. Lin, S.S.; Deng, G.W.; Hou, R.W. Application of Callisia repens L. in Urban Roof Greening. Flowers 2016, 32, 18. [Google Scholar]
  37. Huang, X.L.; Chen, N.; Ye, W.T.; Chen, S.L. Analysis of Urban Greenbelt Landscape Pattern in Xiamen Island Based on ALOS Image. Geospat. Inf. 2020, 18, 86–89. [Google Scholar]
  38. Chen, M.L. A Preliminary Study on the Construction of Roof Greening in Xiamen. Henan Build. Mater. 2021, 24, 108–110. [Google Scholar]
  39. Lin, Y.H. A Study on the Impact of Building Thermal Environment via Roof Greening in Xiamen: Illustrated by the Example of Pergola. Master’s Thesis, Xiamen University, Xiamen, China, 2018. [Google Scholar]
  40. Dong, J.; Zuo, J.; Li, C.; Fan, D.; Wu, Y. Research on Ecological Spatial Planning Method in High-Density Area under the Urban Regeneration Vision: A Case Study of a Three-Dimensional Greening Plan on Xiamen Island. Acta Ecol. Sin. 2018, 38, 12. [Google Scholar] [CrossRef]
  41. Zhao, X.; Huang, J.; Ye, H.; Wang, K.; Qiu, Q. Spatiotemporal Changes of the Urban Heat Island of a Coastal City in the Context of Urbanisation. Int. J. Sustain. Dev. World Ecol. 2010, 17, 311–316. [Google Scholar] [CrossRef]
  42. Xu, H.Q.; Chen, B.Q. A Study on Urban Heat Island and Its Spatial Relationship with Urban Expansion: Xiamen, SE China. Urban Dev. Stud. 2004, 11, 65–70. [Google Scholar]
  43. Dong, J.; Guo, R.; Lin, M.; Guo, F.; Zheng, X. Multi-Objective Optimization of Green Roof Spatial Layout in High-Density Urban Areas—A Case Study of Xiamen Island, China. Sustain. Cities Soc. 2024, 115, 105827. [Google Scholar] [CrossRef]
  44. Cui, Y. Discussion on Plant Selection and Configuration for Garden-Style Roof Greening in Xiamen Area. Mod. Hortic. 2022, 45, 160–162. [Google Scholar] [CrossRef]
  45. Yin, L.F.; Li, S.H. The Selection of Growing Media and the Establishment of Planting Mode for Roof Greening. Landsc. Archit. 2006, 2, 46–49. [Google Scholar] [CrossRef]
  46. Zhang, C.C. Plant Selection and Application Based on Roof Greening: A Case Study of Roof Greening in Xiamen. Chin. Hortic. Abstr. 2018, 34, 77–79, 132. [Google Scholar]
  47. Dang, X.H.; Meng, Z.J.; Gao, Y.; Wang, J.; Zhang, B.; Liu, B.; Wang, Z.; Zhai, B. Photosynthetic Carbon Fixation Capacity of Five Natural Desert Shrubs in West Ordos Region. J. Arid Land Resour. Environ. 2017, 31, 128–135. [Google Scholar] [CrossRef]
  48. Wang, Y.J.; Liu, T.; Bao, S.C.; Li, N.; Li, J.W.; Yuan, T. Carbon Sequestration and Oxygen Release Capacities of Common Landscape Plant Species in Warm Temperate Cities (Xi’an and Jinan). J. Ecol. Rural Environ. 2026, 42, 1–17. [Google Scholar] [CrossRef]
  49. Luo, N.; Zhang, R.; Cai, Y.P.; Luo, Q.; Zhou, Z.D.; Hua, J.F. Study on Carbon Sequestration and Oxygen Release Capacity of Common Tree Species in Jiangsu Seawall Shelterbelts. Jiangsu Water Resour. 2026, 1, 19–24+36. [Google Scholar] [CrossRef]
  50. He, X.H.; Si, J.H.; Zhou, D.M.; Wang, C.L.; Jia, B.; Qin, J.; Zhu, X.L.; Liu, Z.J.; Ndayambaza, B. Dynamic Changes of Photosynthetic Carbon Fixation and Oxygen Release Capacity with Stand Age in Typical Desert Vegetation Haloxylon ammodendron. Acta Ecol. Sin. 2025, 45, 10605–10615. [Google Scholar] [CrossRef]
  51. Ye, Z.P.; Wang, J.L. Comparative Analysis of Photosynthetic Light-Response Models in Plants. J. Jinggangshan Univ. (Nat. Sci. Ed.) 2009, 30, 9–13. [Google Scholar] [CrossRef]
  52. Dong, L.; Wang, Y.; Cheng, X.; Luo, Y. Estimating Carbon Sink Potential of Urban Green Space Plants Using Light Response Curves: A Case Study of Native Plants in Chongqing. Int. J. Environ. Sci. Technol. 2025, 22, 11295–11318. [Google Scholar] [CrossRef]
  53. Ding, J.; Li, S.N.; Lu, S.W.; Shi, Y.Y.; Zhao, Y.G.; Yang, X.B.; Chen, B. Water Use, Carbon Sequestration, and Oxygen Release Functions of Common Economic Forests in Beijing. Jiangsu Agric. Sci. 2017, 45, 130–133. [Google Scholar] [CrossRef]
  54. Zhao, T.Y.; Wang, X.T.; Zhang, Z.; Liu, Y.H.; Yu, C.G.; Hua, J.F. Study on Carbon Fixation and Oxygen Release Capacity of Six Typical Tree Species for Low-Lying Land Greening in Eastern China. J. Ecol. Rural Environ. 2026, 42, 69–77. [Google Scholar] [CrossRef]
  55. Velasco, E.; Roth, M. Cities as Net Sources of CO2: Review of Atmospheric CO2 Exchange in Urban Environments Measured by Eddy Covariance Technique. Geogr. Compass 2010, 4, 1238–1259. [Google Scholar] [CrossRef]
  56. Lei, Z.; Wang, Q.; Xiao, H. Carbon Fixation and Oxygen Release Capacity of Typical Riparian Plants in Wuhan City and Its Influencing Factors. Sustainability 2024, 16, 1168. [Google Scholar] [CrossRef]
  57. Han, H.J. Study on the Physiological and Ecological Functions of Main Plants in Harbin. J. Jiangsu For. Sci. Technol. 2005, 32, 5–10. [Google Scholar] [CrossRef]
  58. Zhang, Y.L.; Fei, S.M.; Li, Z.Y.; Meng, C.L.; Xu, J. Carbon Sequestration and Oxygen Release as well as Cooling and Humidification Efficiency of the Main Greening Tree Species of Sha River, Chengdu. Acta Ecol. Sin. 2013, 33, 3878–3887. [Google Scholar] [CrossRef]
  59. Deng, Y.J.; Wang, J.C.; Xu, J.; Wu, Y.Q.; Chen, J.Y. Study on the Temporal and Spatial Variation of Vegetation Carbon Sequestration and Its Meteorological Contribution Rate in Guangdong Province. Ecol. Environ. Sci. 2022, 31, 1–8. [Google Scholar] [CrossRef]
  60. Wang, L.M.; Hu, Y.H.; Qin, J.; Gao, K.; Huang, J. Study on Carbon Fixation and Oxygen Release Capacity of 151 Greening Plants in Shanghai Region. J. Huazhong Agric. Univ. 2007, 26, 399–401. [Google Scholar] [CrossRef]
  61. Yang, J.J.; Zhang, A.L.; Fu, H.M. Cultivation Management and Landscape Application of Schefflera octophylla(Lour.) Harms. Agric. Eng. Technol. (Greenh. Hortic.) 2013, 34, 34–36. [Google Scholar] [CrossRef]
  62. Liu, J.; Garg, A.; Wang, H.; Huang, S.; Mei, G. Moisture Management in Biochar-Amended Green Roofs Planted with Ophiopogon japonicus under Different Irrigation Schemes: An Integrated Experimental and Modeling Approach. Acta Geophys. 2022, 70, 373–384. [Google Scholar] [CrossRef]
  63. Whittinghill, L.J.; Rowe, D.B.; Schutzki, R.; Cregg, B.M. Quantifying Carbon Sequestration of Various Green Roof and Ornamental Landscape Systems. Landsc. Urban Plan. 2014, 123, 41–48. [Google Scholar] [CrossRef]
  64. Luo, H.; Liu, X.; Anderson, B.C.; Zhang, K.; Li, X.; Huang, B.; Li, M.; Mo, Y.; Fan, L.; Shen, Q.; et al. Carbon sequestration potential of green roofs using mixed-sewage-sludge substrate in Chengdu World Modern Garden City. Ecol. Indic. 2015, 49, 247–259. [Google Scholar] [CrossRef]
Figure 1. Location of the study area. (a) Geographic location of the study area within China. (b) Detailed location of the study area within Fujian Province. (c) Administrative divisions and land use types of the study area. (d) Topographic relief map of the study area.
Buildings 16 02726 g001
Figure 2. Scenarios of the implementation of green roofs in Xiamen Island. (a) Existing green roofs on Xiamen Island. (b) Anticipated green roofs on Xiamen Island. (a1,b1) exhibit two green roof pilots on Xiamen Island. (Images (a1,b1) © 2025 Maxar Technologies. Westminster, CO, USA; Source: Google Earth Mountain View, CA, USA).
Buildings 16 02726 g002
Figure 3. Leaf morphological characteristics across green roof plant species.
Buildings 16 02726 g003
Figure 4. Diurnal variation in net photosynthetic rate in different plant species across four seasons.
Buildings 16 02726 g004
Figure 5. Seasonal variations in the daily average net photosynthetic rate of plants. Lowercase letters in the figure indicate significant differences among plants within the same season (p < 0.05). Uppercase letters indicate significant differences among plants across different seasons (p < 0.05).
Buildings 16 02726 g005
Figure 6. Diurnal net assimilation per unit leaf area of different plant species across four seasons. Different lowercase letters in the figure indicate significant differences among plants (p < 0.05).
Buildings 16 02726 g006
Figure 7. Diurnal carbon uptake per unit leaf area of different plant species across four seasons. Different lowercase letters in the figure indicate significant differences among plants (p < 0.05).
Buildings 16 02726 g007
Figure 8. Cluster analysis of the carbon uptake capacity of plant species.
Buildings 16 02726 g008
Table 1. A Catalog of 9 Green Roof Plant Species.
Species NameFamilyLife FormLeaf Area Index (LAI)
Bryophyllum pinnatum (L. f.)CrassulaceaePerennial herb4.66
Pedilanthus tithymaloides (L.) Poit.Euphorbiaceae Juss.Shrub7.14
Heptapleurum heptaphyllum (L.) Y. F. DengAraliaceaeShrub5.54
Coleus caninus (Roth) Vatke.LamiaceaePerennial herb9.17
Tradescantia spathacea Sw.CommelinaceaePerennial herb1.87
Tradescantia pallida (Rose) D.CommelinaceaePerennial herb4.81
Arrhenatherum elatius f. variegatumPoaceaePerennial herb5.59
Callisia repens L.CommelinaceaePerennial herb3.52
Ligustrum japonicum ‘Howardii’Oleaceae Hoffmanns. & LinkTree10.50
The abbreviations for the plants in the table are as follows: (Bp): Bryophyllum pinnatum (L. f.), (Pt): Pedilanthus tithymaloides (L.) Poit., (Hh): Heptapleurum heptaphyllum (L.) Y. F. Deng, (Cc): Coleus caninus (Roth) Vatke., (Ts): Tradescantia spathacea Sw., (Tp): Tradescantia pallida (Rose) D., (Ae): Arrhenatherum elatius f., (Cr): Callisia repens L., (Lj): Ligustrum japonicum ‘Howardii’.
Table 2. Weather parameters on the measurement date.
Experiment DateAverage Irradiance
(μmol m−2 s−1)
Average Temperature (°C)Average Humidity
(%)
August 2024 (summer)1111.0429.6780.21
November 2024 (autumn)820.7817.1158.07
January 2025 (winter)1057.5515.2845.41
June 2025 (spring)1249.0630.5073.51
Table 3. Diurnal and annual carbon uptake per unit land area of different plant species across four seasons.
Species( Q C O 2 ) Daily Carbon Uptake per Unit Area/(g m−2 d−1)( Q C O 2 ) Seasonal Average Daily Carbon Uptake per Unit Area/(g m−2 d−1)
SpringSummerAutumnWinter
Bp6.144.444.6125.1610.10
Pt3.627.442.9826.3010.09
Hh3.779.228.7338.8515.14
Cc24.8024.8113.4260.3030.83
Ts7.854.657.1814.108.42
Tp23.4510.0415.8340.4822.45
Ae27.5826.7416.8441.3728.13
Cr21.8219.835.6322.6517.48
Lj104.7846.40103.27117.9593.10
Disclaimer/Publisher’s Note: The statements, opinions and data contained in all publications are solely those of the individual author(s) and contributor(s) and not of MDPI and/or the editor(s). MDPI and/or the editor(s) disclaim responsibility for any injury to people or property resulting from any ideas, methods, instructions or products referred to in the content.