Review

Digital Life-Cycle Carbon Governance for Climate-Resilient Buildings: Global Evidence and a Singapore National Pathway


1
Carbon Neutrality Institute, China University of Mining and Technology, Xuzhou 221116, China
2
NUS College of Design and Engineering, National University of Singapore, Singapore 117575, Singapore
*
Author to whom correspondence should be addressed.
Buildings 2026, 16(14), 2725; https://doi.org/10.3390/buildings16142725
Submission received: 14 May 2026 / Revised: 22 June 2026 / Accepted: 25 June 2026 / Published: 9 July 2026
(This article belongs to the Special Issue New Trends in Digital Buildings)

Abstract

Background: Buildings and construction account for a substantial share of global energy use, carbon dioxide emissions, and material extraction, making both operational and embodied carbon central to climate-resilient building policy. Methods: This article is framed as a critical scoping review with a structured narrative synthesis. It synthesizes peer-reviewed studies, standards, and policy reports published mainly from 2020 to June 2026, while retaining older foundational standards where they define life-cycle boundaries or verification methods. The counted revision documents a reproducible screened search in OpenAlex plus targeted website and standards searching, with Google Scholar retained only for citation chasing and sensitivity checking; reporting is aligned to PRISMA-ScR and PRISMA-S principles. Results: The evidence shows that operational carbon reduction remains the most immediately measurable pathway through HVAC optimization, envelope improvement, smart energy management systems, and digital measurement, reporting, and verification. However, embodied carbon management through Environmental Product Declarations, material passports, low-carbon procurement, prefabrication, and circularity is necessary to avoid shifting emissions from operation to construction. Contribution: The review develops a four-layer digital life-cycle carbon governance mechanism linking life-cycle boundary setting, data capture, verification and assurance, and policy-market conversion. Singapore pathway: Singapore’s five-phase pathway is repositioned as an operational carbon MRV entry point that must be expanded to whole-life carbon through embodied carbon datasets, EPD-based procurement, and ASEAN-specific localization. The revised pathway identifies implementation risks, including data governance, additionality, double-counting, auditor capacity, SME access, market liquidity, and cross-country transferability. Conclusions: Digital MRV and carbon-market mechanisms can accelerate building decarbonization only when they are coupled with whole-life carbon boundaries, embodied carbon safeguards, transparent review methods, and context-specific financing.

1. Introduction

Buildings remain a major focus of global climate policy. They contribute roughly 37–39% of energy-related GHG emissions globally [1,2], and the world’s floor area is projected to double by 2060. Reducing the sector’s carbon footprint has therefore become an urgent priority for policymakers, investors, and the construction industry. While operational-energy use has historically received most attention, embodied carbon—the emissions associated with material extraction, manufacturing, transport, and construction—is now recognized as equally important, particularly in new buildings where upfront emissions can dominate the life-cycle profile. This review, therefore, examines both operational and embodied carbon within a unified life-cycle framework.
This distinction between operational and embodied carbon also defines the scope of the Singapore pathway examined in this review. Operational carbon reduction is emphasized first because electricity, chilled-water, and equipment-level performance data can be continuously measured, normalized, verified, and linked to existing energy-efficiency and carbon-pricing instruments. This does not mean that embodied carbon is secondary. As operational performance improves, upfront and replacement-related embodied carbon can become a larger share of life-cycle impacts; therefore, any credible digital governance pathway must connect operational MRV with material-carbon accounting, Environmental Product Declarations, material passports, low-carbon procurement, and circular-construction requirements.
This article is therefore framed as a critical scoping review rather than as a hypothesis-testing research article. It asks four review questions: (RQ1) how are operational and embodied carbon currently accounted for in building decarbonization frameworks; (RQ2) which technical and policy levers have the strongest evidence across life-cycle stages; (RQ3) what governance mechanism links LCA, digital MRV, verification, and carbon-finance instruments; and (RQ4) under what institutional, financial, and data-governance conditions can Singapore’s five-phase pathway be adapted to ASEAN contexts? The Singapore pathway is used as an illustrative governance design, not as proof of a fully implemented national programme. Its initial operational-energy emphasis is justified by the availability of metered energy data, established IPMVP [3] and ISO 50001 [4] procedures, and Singapore’s Green Mark and carbon-pricing ecosystem; however, this review treats whole-life carbon governance as the final policy target.

2. Review Design and Methods

2.1. Review Type and Reporting Basis

This review follows a critical scoping-review design with structured narrative synthesis. It is not a meta-analysis and does not estimate pooled effect sizes because the evidence base combines quantitative LCA studies, building-performance studies, certification standards, policy roadmaps, carbon-market governance documents, and Singapore-specific policy material. The reporting structure is aligned with PRISMA-ScR for scoping reviews and PRISMA-S for literature-search reporting [5,6]. Because the manuscript also synthesizes policy and narrative sources, the quality appraisal combines a simplified SANRA-informed check for narrative sources with an AACODS-informed check for grey literature [7,8].

2.2. Review Questions

The review is organized around four questions. RQ1: How do current building decarbonization frameworks define and measure operational carbon, embodied carbon, and whole-life carbon? RQ2: Which design, material, construction, operational, verification, and market instruments are most frequently identified as effective decarbonization levers? RQ3: Through what mechanism can LCA, digital measurement, verification, and carbon credit systems be integrated into a credible governance pathway? RQ4: What risks and boundary conditions determine whether Singapore’s five-phase pathway can be localized across ASEAN countries with different levels of income, building-code maturity, digital infrastructure, and carbon-market capacity?

2.3. Information Sources and Search Strategy

Searches were designed to capture both scholarly and policy evidence. For the reproducible counted update requested in peer review, the formal screened search was rerun in OpenAlex using eight title-search strings: “embodied carbon building”, “operational carbon building”, “whole life carbon building”, “life cycle assessment building carbon”, “building energy management singapore”, “building carbon singapore”, “building carbon asean”, and “building carbon credit”. Targeted supplementary searching then screened standards and policy repositories from IEA, UNEP/GlobalABC, IFC, EEA, EPA, UKGBC, the European Commission, USGBC, BCA Singapore, NEA Singapore, RICS, ISO, PAS 2080, and China building-energy reports. Google Scholar was retained only for citation chasing and sensitivity checking and was not counted in the PRISMA-style flow because its hit estimates fluctuate over time. The main search window was from 1 January 2020 to 10 June 2026. Foundational standards or methodological references published before 2020 were retained when they define life-cycle boundaries, verification protocols, or review-methodology rules.

2.4. Eligibility Criteria

Sources were selected using inclusion and exclusion criteria covering topic relevance, document type, time window, language, geography, and minimum quality threshold. Included sources had to address at least one of the following: building-sector operational carbon, embodied carbon, whole-life carbon, LCA methodology, digital MRV, energy management systems, carbon credit governance, Singapore building decarbonization policy, or ASEAN localization conditions. Excluded sources were those without identifiable authorship or issuing organization, without relevance to buildings or construction, without sufficient methodological or policy detail, not available in English, or focused only on general climate policy without a building-sector link.

2.5. Screening and Source Selection

Screening followed two stages. First, titles and abstracts or executive summaries were screened against the eligibility criteria. Second, full texts were assessed for relevance, methodological transparency, and contribution to one or more review questions. Duplicates were removed before screening. Scholarly sources were screened using a structured eligibility checklist, and uncertain cases were discussed among the authors before inclusion.
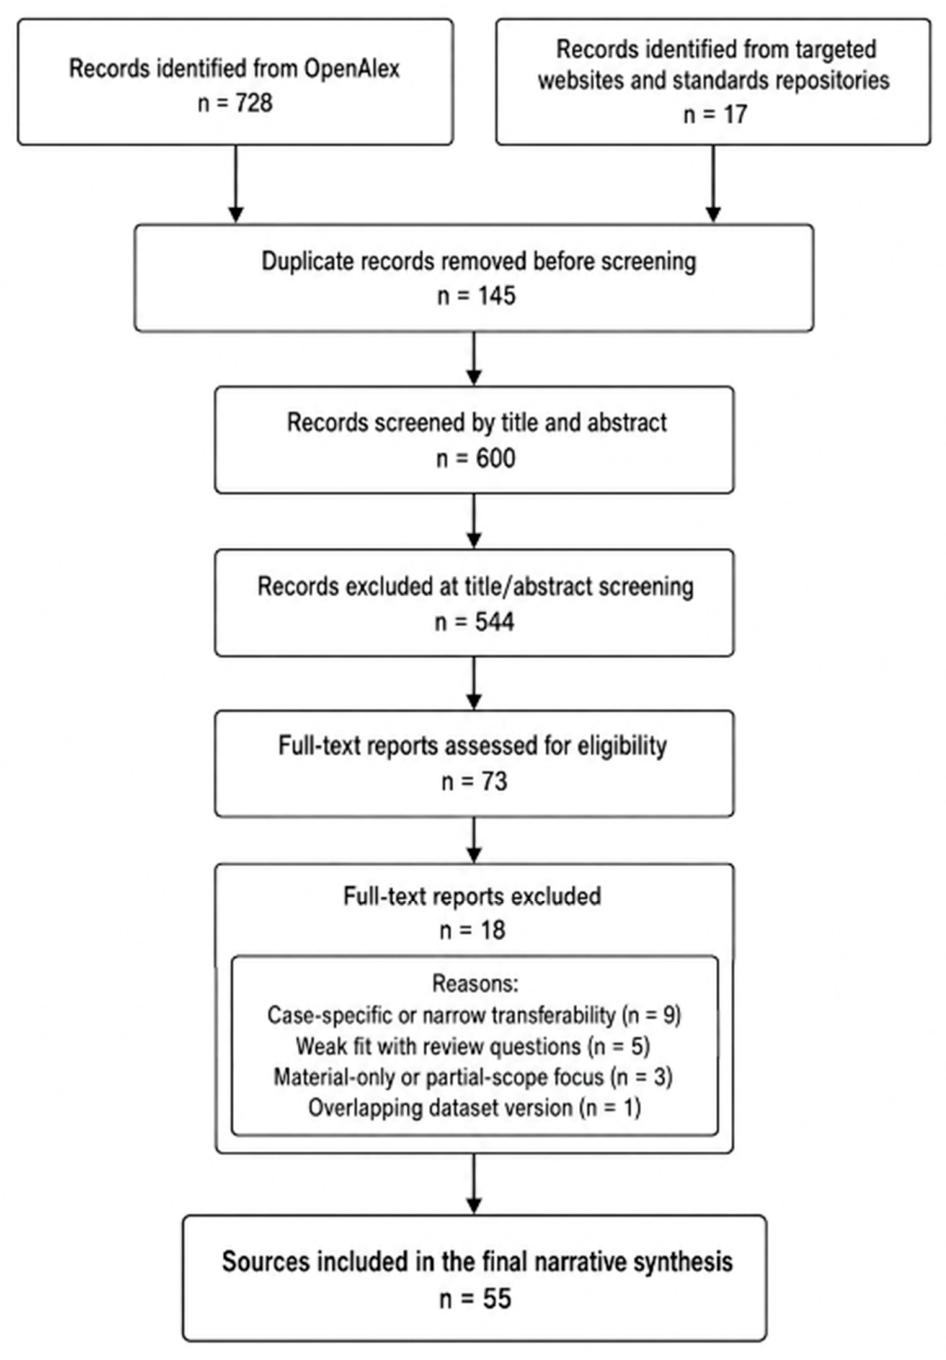
The counted rerun identified 745 records in total (728 from OpenAlex and 17 from the targeted website or standards searching). After removing 145 duplicate records, 600 records were screened by title and abstract. A total of 544 records were excluded at that stage, mainly because they were outside the building-sector scope, focused too narrowly on isolated components, or did not contribute directly to the four review questions. Full-text assessment was completed for 73 reports, of which 18 were excluded after eligibility review, leaving 55 included sources for the final synthesis.
The updated screening flow is summarized in Figure 1.

2.6. Data Charting

Each included source was charted using a common extraction template: author or issuing organization; year; geography; document type; building type or policy scope; carbon boundary; life-cycle modules; operational carbon measures; embodied carbon measures; digital MRV or verification method; carbon-market or finance mechanism; reported benefits; implementation risks; and relevance to the Singapore or ASEAN pathway. Evidence was then coded into five synthesis categories: (i) life-cycle accounting frameworks; (ii) material and construction-stage interventions; (iii) operational-energy and digital EMS interventions; (iv) verification, carbon credit, and market-governance instruments; and (v) implementation risks and transferability conditions.

2.7. Quality Appraisal and Bias Assessment

Quality appraisal was used to weight the synthesis rather than to exclude all non-peer-reviewed sources. Peer-reviewed empirical or modelling studies were appraised across five domains: transparency of method, clarity of system boundary, data-source quality, treatment of uncertainty, and transferability of findings. Narrative reviews were checked against SANRA-informed criteria. Grey literature and policy documents were assessed using AACODS-informed criteria: authority, accuracy, coverage, objectivity, date, and significance. Bias risks were considered across publication type, geography, language, and institutional source. The review, therefore, treats evidence from high-income regions and standards bodies as useful but not automatically transferable to lower-income ASEAN settings.
Included peer-reviewed sources were rescored on a 0–10 scale across the five domains already defined in this section: method transparency, system-boundary clarity, data-source quality, treatment of uncertainty, and transferability. Policy, standards, and institutional sources were rescored on an AACODS-informed 0–10 scale normalized across authority, accuracy, coverage, objectivity, date, and significance. Appendix A reports the source-level scores, inclusion decisions, and full-text exclusions used in the updated synthesis.

2.8. Synthesis Strategy

The synthesis combines thematic mapping and mechanism-based explanation. First, evidence is mapped by life-cycle stage and carbon boundary. Second, policy and technology levers are compared across regions. Third, the Singapore pathway is reconstructed as a four-layer governance mechanism: boundary setting, data capture, assurance, and policy-market conversion. Fourth, risks and boundary conditions are identified.

3. Global Progress in Building Carbon Mitigation

3.1. Global Progress

The building sector is central to national climate-mitigation efforts because buildings and construction account for a large share of energy demand, carbon dioxide emissions, and material extraction, while the sector’s territorial share varies widely across regions depending on the electricity mix, climate, building stock, and whether embodied carbon is included.
The screened evidence base used in this section comprised 38 peer-reviewed database records and 17 policy, standards, or institutional sources. This balance explains why the results below combine empirical LCA findings with governance instruments, while treating formal standards and public policy documents as boundary-setting references rather than direct substitutes for empirical outcome studies.
Table 1 and Table 2 report different regional metrics because building-sector shares are not calculated uniformly across jurisdictions. The revised manuscript therefore distinguishes operational emissions, embodied emissions, and whole-life carbon, and avoids comparing percentages unless the underlying boundary is stated. Where sources report energy-related operational emissions only, they are not treated as equivalent to whole-life carbon values that also include materials and construction [9,10,11,12,13,14,15,16].
Many jurisdictions are beginning to incorporate life-cycle assessment (LCA) into regulatory and voluntary schemes, marking a shift from a narrow focus on energy efficiency to broader whole-life carbon accountability. Initiatives include Europe’s nearly zero-energy and renovation agenda, the United States’ LEED-led voluntary model, the United Kingdom’s PAS 2080 and Future Homes Standard, China’s Green Building Evaluation and efficiency programmes, and emerging-market green-building finance initiatives [12,17,18,19,20,21,22,28,29]. Quantitative targets likewise vary across regions, from nearly zero-energy requirements in Europe to the United Kingdom’s 75–80% reduction pathway for new homes, China’s rapid expansion of certified green-building floor area, and continued pressure for lower-carbon growth in rapidly urbanizing emerging economies [12,15,17,21,28,29]. These developments reflect a shared recognition of the sector’s significance while illustrating varied policy pathways shaped by governance systems, market maturity, and industrial structures. Despite this momentum, most frameworks still lack standardized approaches for comparing embodied carbon performance across regions, highlighting the need for more harmonized LCA metrics.

3.2. Europe: EPBD, LCA Roadmap, Net-Zero Targets

Europe has taken a leading role in regulatory action. The Energy Performance of Buildings Directive (EPBD) has pushed member states toward nearly zero-energy standards for new construction, while broader EU policy sets a pathway toward decarbonizing the building stock by 2050 [17,22]. National policies—such as Germany’s EnEV and France’s RE2020—combine energy-efficiency requirements with material-related carbon-intensity benchmarks. Buildings currently account for about 40% of EU energy consumption and 36% of CO2 emissions. The broader EU renovation and whole-life-carbon policy agenda has also increased attention to disclosing both operational and embodied carbon [22,23]. Scandinavian initiatives, including Sweden’s Climate Declaration for Buildings and Norway’s Powerhouse energy-positive developments, illustrate early integration of whole-life carbon metrics within a strong regulatory and compliance environment [23].

3.3. United States: LEED, Material Efficiency, Renewable Integration

The United States relies on a decentralized, market-driven approach. The Leadership in Energy and Environmental Design (LEED) programme remains the most recognized voluntary certification, with more than 100,000 projects worldwide and reported 25–30% operational-energy savings over conventional peers [24,25]. State-level policies increasingly address embodied carbon disclosure—for example, California’s Buy Clean Act for public procurement of steel and glass and New York City Local Law 97, imposing strict operational carbon caps for large buildings. According to the EPA, buildings account for roughly 29% of national GHG emissions, still dominated by operational energy, while embodied carbon attention is growing through corporate supply-chain commitments and tools such as the EC3 database [26].

3.4. United Kingdom: PAS 2080, Whole-Life Carbon Focus

The UK has embedded whole-life carbon accounting more systematically than most regions. PAS 2080 [20] sets out a framework for managing carbon across infrastructure projects, assigning responsibilities to designers, contractors, and suppliers throughout the delivery chain. Estimates from the UK Green Building Council indicate that embodied carbon can account for up to half of emissions in new buildings, underscoring the limits of relying solely on operational-efficiency improvements. National measures such as the Future Homes Standard [21] target a 75–80% reduction in emissions from new homes, while initiatives including the London Energy Transformation Initiative (LETI) provide technical guidance to support net-zero design and delivery pathways [27].

3.5. China: Green Building Evaluation, High Embodied Carbon Challenges

China’s rapid urbanization makes decarbonization in the building sector both critical and challenging. Buildings account for roughly 46% of national energy use and more than half of CO2 emissions when operational and embodied components are combined. Embodied impacts are strongly shaped by cement and steel production, reflecting the prevalence of high-rise construction and large-scale infrastructure development. The Green Building Evaluation Standard (GBES) promotes energy-efficient design, renewable-energy integration, and sustainable construction practices, with more than 6.6 billion m2 certified by 2022. Digital initiatives—such as smart-construction platforms enabling real-time energy monitoring and waste-recycling systems—demonstrate emerging progress, although dependence on carbon-intensive materials continues to constrain reductions [12].

3.6. Emerging Markets: Financing Gaps, Technology Adoption Needs

Emerging-economy regions—including Southeast Asia, Africa, and Latin America—are experiencing rapid construction growth but often lack sufficient capital and technical capacity. Without stronger mitigation measures, the IEA projects that building-energy demand in these regions could rise by 50% by 2040. International programmes such as IFC-backed EDGE and related green-building finance initiatives [28,29] have supported early adoption of net-zero or high-efficiency building codes in cities like Nairobi and São Paulo, yet progress remains uneven, constrained by fragmented governance, weak enforcement, and low market awareness. Realizing the sector’s potential will require mobilizing an estimated US$1.5 trillion in climate investment by 2030, together with sustained knowledge transfer and capacity building [28,29].

3.7. Cross-Regional Comparison and Remaining Gaps

Across regions, managing operational carbon—emissions from building energy use—has become standard practice. Embodied carbon, however, is addressed far less consistently, reflecting fragmented data sources, divergent accounting methods, and limited transparency in material disclosure. Closing these gaps will require a harmonized, LCA-based framework supported by robust emission databases and aligned financing mechanisms so that progress can be measured and compared more reliably across markets.
  • Europe and the UK adopt binding regulations and mandatory disclosure, establishing clear requirements for whole-life carbon reporting and accountability.
  • The United States progresses mainly through voluntary certification schemes, corporate supply-chain commitments, and state-level policies that partly offset slower federal action.
  • China seeks to align rapid urban growth with emerging policies and digital pilot programmes, though dependence on carbon-intensive materials continues to constrain reductions.
  • Emerging markets show promise in renewable-energy uptake and efficient design but face structural obstacles, including limited finance and insufficient technical capacity.

4. Life-Cycle Assessment Frameworks

4.1. EN 15978 Stages (A–D)

Life-cycle assessment (LCA) provides a means to quantify carbon emissions across all stages of a building’s life—from raw-material extraction to demolition. It captures both direct and embodied emissions, offering a structured way to identify high-impact stages and to inform targeted strategies for reducing overall carbon output [30,31].
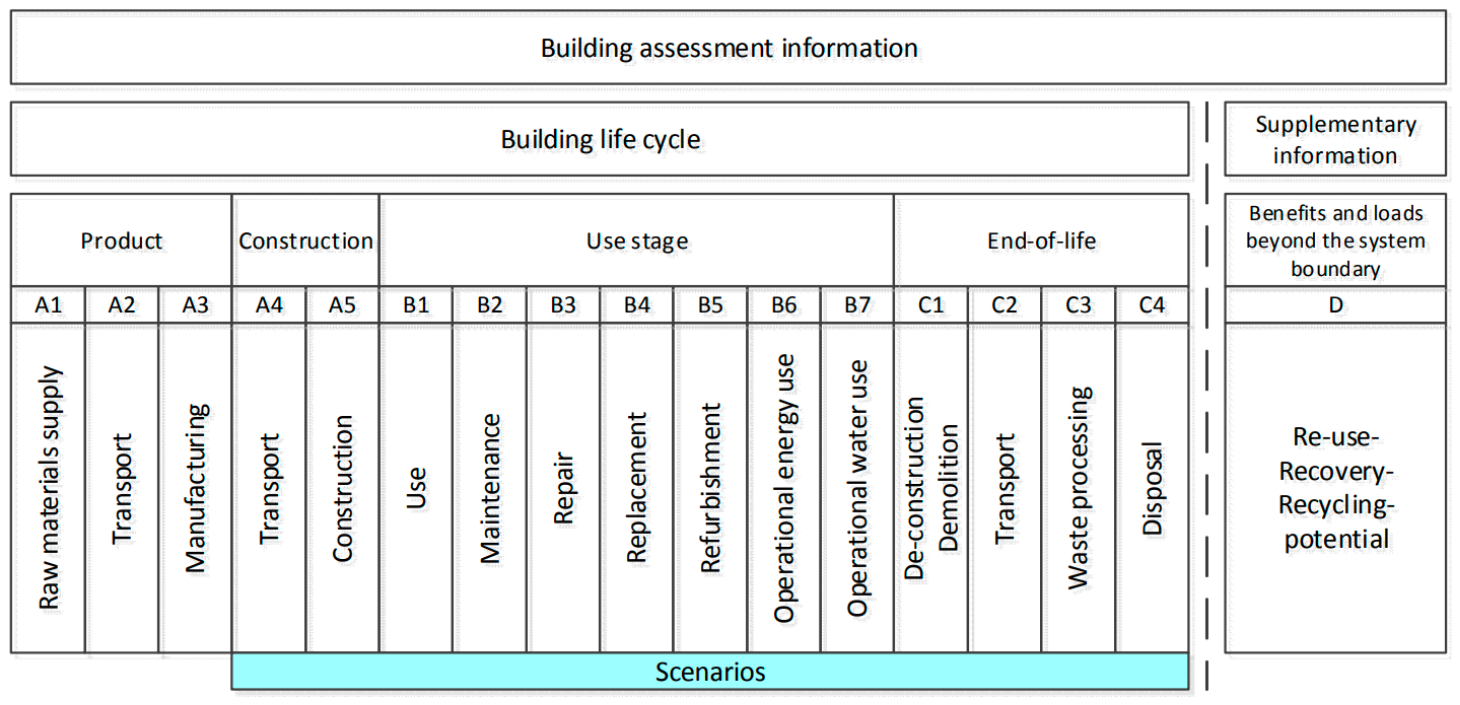
As defined in the EN 15978:2011 standard [32], which sets out the methodology for assessing a building’s environmental performance, the life-cycle assessment (LCA) framework is organized into a series of distinct stages (Figure 2):
  • Product Stage (A1–A3):
A1 (Raw-Material Supply) covers emissions from the extraction of raw materials, such as mining and logging. A2 (Transportation) accounts for the movement of these materials to manufacturing facilities. A3 (Manufacturing) includes emissions generated during the production of building materials such as steel and concrete—a stage that often constitutes a major share of embodied carbon, especially for energy-intensive materials.
  • Construction Stage (A4–A5):
A4 (Transportation) covers the movement of building materials from manufacturing sites to the construction location. A5 (Construction/Installation) captures emissions from on-site activities, including machinery operation, energy use, and material waste. Reducing transport distances and adopting more efficient equipment can help lower carbon impacts at this stage.
  • Use Stage (B1–B7):
B1 (Use) covers emissions directly associated with building use, excluding energy consumption. B2 (Maintenance) captures emissions from routine upkeep. B3 (Repair), B4 (Replacement), and B5 (Refurbishment) record impacts from material repair, substitution, and upgrades. B6 (Operational-Energy Use) refers to emissions from heating, cooling, lighting, and other energy demands during operation.
In conventional buildings, operational-stage emissions, especially B6 energy use, have often represented the largest share of life-cycle impacts. However, in high-performance new buildings, A1–A5 upfront embodied carbon and B2–B5 replacement-related carbon can become comparable to or larger than operational emissions. The revised analysis, therefore, treats B6–B7 and A1–A5 as linked governance targets rather than competing priorities.
  • End-of-Life Stage (C1–C4):
C1 (Deconstruction/Demolition) covers emissions generated during building demolition. C2 (Transportation) accounts for the movement of demolition wastes to recycling or disposal facilities. C3 (Waste Processing) includes emissions from sorting, treatment, or recycling of recovered materials. C4 (Disposal) refers to emissions associated with final disposal routes such as landfilling or incineration. Greater emphasis on material recovery and recycling at this stage can substantially reduce environmental impacts.
  • Benefits and Loads Beyond the System Boundary (D):
D (Reuse, Recovery, Recycling Potential) reflects the benefits that arise when materials are reused or recycled, reducing impacts in future projects. Recycled steel, concrete, and other recovered materials can substitute for virgin resources and help offset emissions in subsequent production cycles.
Adhering to the EN 15978:2011 framework enables stakeholders to identify carbon-intensive stages systematically and to design targeted mitigation strategies across the building life cycle. The standard provides a consistent structure for assessment, improving the comparability and reliability of LCA results and supporting more informed decisions in sustainable building design.

4.2. Scope 1–3 Emissions in the Building Sector

In life-cycle assessment, carbon emissions are classified into Scope 1, Scope 2, and Scope 3 categories, each capturing distinct emission sources across the building life cycle. As summarized in Table 3, this structure provides a more comprehensive and accurate representation of a building’s carbon footprint [31,33]. It also helps developers, operators, and regulators identify targeted mitigation actions—for example, improving HVAC systems (Scope 1), procuring renewable electricity (Scope 2), or sourcing lower-carbon materials and advancing circular-economy practices (Scope 3).

4.3. Operational vs. Embodied Carbon Comparison

When evaluating the climate impact of buildings, the relative contribution of operational and embodied carbon varies widely by building type, geography, and regulatory setting. Operational emissions have traditionally dominated, with heating, cooling, and electricity accounting for roughly 60–80% of life-cycle impacts. As energy-efficiency standards improve, however, embodied emissions linked to materials and construction are becoming increasingly prominent. Table 4 summarizes typical shares of embodied and operational carbon across building categories. The data indicate a clear shift: in high-performance residential and commercial projects, embodied carbon can match or surpass operational emissions. In infrastructure projects such as bridges and tunnels, embodied carbon is the primary contributor, highlighting the importance of early decisions on materials and design.
The implication of Table 4 is not that one carbon category should replace the other. Operational carbon remains the fastest category to monitor and reduce through metering, controls, HVAC optimization, and renewable electricity, but embodied carbon determines the emissions locked in before a building is occupied. The revised Singapore pathway, therefore, uses operational MRV as the initial data infrastructure and adds material-carbon reporting so that operational savings are not achieved by increasing high-carbon materials or premature equipment replacement.

4.4. LCA in Regulatory and Voluntary Frameworks

A building’s carbon footprint cannot be reduced through design efficiency alone; it must be addressed across every stage of the life cycle. Each stage carries unique opportunities for intervention, as summarized below.

4.4.1. Material Choice and Manufacturing

Representative greenhouse gas intensities for selected construction materials are summarized in Table 5 [35].

4.4.2. Construction Process

Emissions during construction stem primarily from diesel-powered machinery and the transport of heavy materials. Reinforced concrete works can release 300–500 kg CO2 per cubic metre when cement and steel are combined. Logistics decisions also influence impacts, as locally sourced materials can significantly reduce transport-related emissions. Prefabrication and modular construction—by shifting energy-intensive activities into controlled manufacturing environments—are increasingly viewed as effective ways to lower emissions while improving construction efficiency.

4.4.3. Building Operation

Even with steady improvements in efficiency, operational carbon remains a substantial contributor over a building’s lifetime. HVAC systems alone can represent 25–40% of operational emissions in commercial buildings, and lighting can add 10–20 kg CO2 per m2 each year. Enhanced insulation, passive-design measures, renewable-energy integration, and intelligent energy management systems can significantly reduce these impacts. As operational emissions fall, however, the relative importance of embodied carbon increases, underscoring the need for strategies that address both aspects in parallel.

4.4.4. Maintenance, Demolition, and End-of-Life

The later stages of a building’s life cycle also carry notable carbon impacts. Maintenance and refurbishment activities can generate 100–300 kg CO2 per m2, depending on their extent. At the end-of-life, demolition typically produces 20–30 kg CO2 per hour of machinery use, with additional emissions arising from the transport and disposal of waste materials. However, adopting selective deconstruction rather than traditional demolition allows valuable materials (steel, concrete, timber) to be salvaged, significantly lowering net emissions.

4.4.5. Recycling and Reuse

As shown in Table 6, lower-clinker cement strategies [36], system-level material-efficiency gains from prefabrication [37], recycled steel pathways [38], timber reuse [39], and broader design-for-disassembly and waste-reduction measures [40,41] can all reduce life-cycle emissions relative to conventional practice. The scale of benefit depends on substitution rates, transport distances, process energy, and how effectively recovered materials are reintegrated into later projects. Encouraging circular design, material recovery, and secondary-material markets can therefore amplify these gains across the full building life cycle.
Addressing carbon at every stage—from material extraction through to demolition and recycling—offers the most robust route toward net-zero buildings. Policy frameworks are beginning to reflect this broader scope, with some regions now requiring whole-life carbon reporting and encouraging circular construction models. For industry practitioners, the message is clear: carbon management is no longer a single-stage exercise but a multi-decade responsibility spanning the entire life of a building.

4.5. Synthesis and Next-Level Actions from LCA Evidence

The LCA evidence requires three next-level actions. First, every building decarbonization strategy in this review should report the boundary used for each claim: A1–A5 for upfront embodied carbon; B6–B7 for operational energy and water; B2–B5 for maintenance and replacement; C1–C4 for end-of-life; and D only as a separately reported benefit beyond the system boundary. Second, operational-energy measures must be paired with material-carbon safeguards so that efficiency upgrades do not increase upfront carbon through oversized systems or high-carbon envelope materials. Third, public authorities should require EPD-based material reporting and a common kgCO2e/m2 benchmark for new buildings and major retrofits, while allowing older foundational standards to remain in the evidence base only when they define calculation boundaries or verification rules rather than current market performance.

5. Carbon Management Strategies Across the Building Life Cycle

5.1. Embodied Carbon Management (Design, Materials, Prefabrication)

The design stage offers the most powerful leverage for reducing embodied carbon because decisions made at this point determine the structural system, material mix, and spatial layout that together account for up to half of a building’s life-cycle emissions. Early-stage optimization, therefore, begins with establishing a transparent baseline scenario against which all interventions can be measured. In this study, the baseline is defined as a code-compliant reference building following EN 15978 system boundaries (A1–A5 for material production and construction) [32]. Emissions are typically expressed as kg CO2e per m2 of gross floor area, drawing on Environmental Product Declarations (EPDs) and regional life-cycle inventory databases such as ICE v3.0 [35] and Ecoinvent [42]. Using this consistent basis enables meaningful comparisons across design options and supports transparent, verifiable reporting of emission reductions.
Circular-economy outcomes are supported through prefabrication and modular construction. Factory-controlled production can reduce material waste by 15–25% and shorten construction schedules, thereby lowering on-site energy use [40,41]. Prefabricated systems also facilitate selective deconstruction and component reuse at end-of-life. A monitoring plan is embedded within procurement and construction workflows, tracking key performance indicators (KPIs) such as embodied carbon intensity per material batch, substitution rates for low-carbon alternatives, and on-site fuel and electricity consumption. Progress is reported at major project milestones—design freeze, procurement, structural topping-out, and post-construction—using templates aligned with ISO 14064-1 [43]. All data are stored on a centralized digital platform to enable traceability.
Verification is conducted by third-party LCA consultants and accredited assessors (e.g., BCA-approved verifiers or TÜV/SGS), who audit emission factors and material documentation. Any discrepancies from projected reductions prompt corrective measures and are reflected in the final carbon statement. A follow-up process compares post-occupancy performance with baseline estimates, creating a feedback loop for continual refinement. Insights—such as gaps between modelled and measured outcomes—inform future baselines and procurement criteria, ensuring that carbon-management practices evolve in step with market conditions, data improvements, and regulatory shifts.
These embodied carbon controls are treated as mandatory elements of the Singapore pathway rather than optional design preferences, because they address the risk that operational-efficiency gains may obscure high upfront material impacts.

5.2. Operational Carbon Management (HVAC, Insulation, Smart EMS)

The operational phase is the most measurable and continuously adjustable part of building carbon management because HVAC, lighting, plug loads, and chilled-water systems can be tracked through meters, sensors, and energy management platforms. Its relative share of whole-life carbon varies by building type, climate, grid intensity, and embodied carbon intensity. Therefore, operational carbon strategies in this section are treated as one part of whole-life management and are paired with material-carbon checks to prevent burden shifting from operation to construction.

5.2.1. Heating, Ventilation, and Air Conditioning (HVAC)

HVAC systems typically account for 25–40% of energy use in commercial buildings, making them the largest source of operational emissions. Upgrading to high-efficiency chillers, variable-speed heat pumps, and advanced ventilation systems can cut these emissions by 30–50%, with further reductions when equipment is powered by on-site solar generation or connected to district-cooling networks. Ongoing commissioning and predictive maintenance—supported by sensors and IoT-based monitoring—help sustain performance throughout the equipment’s life cycle [44,45,46].

5.2.2. Insulation and Envelope Performance

Reducing heating and cooling demand at the source is equally important. Improvements to the thermal envelope—such as high-performance insulation, airtight façades, low-emissivity glazing, external shading, and reflective roofs—can reduce annual operational emissions by 15–25 kg CO2/m2 [34]. In temperate and subtropical climates, these measures often achieve payback within five years, making them some of the most cost-effective options for lowering building-energy use.

5.2.3. Smart Energy Management and Occupant Engagement

Operational efficiency depends not only on equipment but also on occupant behaviour. Smart thermostats, automated lighting controls, and occupancy sensors can lower energy use by 10–20% with minimal capital cost [47]. User-feedback systems further promote behaviours aligned with sustainability targets, reinforcing savings over time. Data-driven management also supports long-term carbon reduction: continuous energy monitoring and digital reporting enable operators to refine maintenance schedules, benchmark performance, and meet increasingly stringent disclosure requirements.

5.3. Intelligent Grid EMS and AI-Driven Optimization

Traditional building systems were designed for stable operating conditions and often struggle to adjust to changing energy demand. Intelligent grid Energy Management Systems (EMS) address this limitation by integrating real-time sensor data, smart meters, and distributed energy resources (DERs) such as rooftop PV and battery storage, alongside demand-response controls. This coordinated framework allows buildings to balance supply and demand dynamically, leading to substantial gains in operational efficiency.

5.3.1. Smart Grid Energy Management Systems (EMS)

EMS platforms optimize energy use by shifting loads to off-peak periods, coordinating on-site renewables, and reducing grid stress during peak hours. In large commercial buildings, these systems typically lower energy costs and carbon emissions by 20–30% [47]. Key elements include distributed energy resources that provide local clean power, storage systems that buffer mismatches between supply and demand, and smart meters that deliver granular, real-time consumption data. Combined, these components reduce energy waste and enhance operational resilience.

5.3.2. AI-Driven Optimization

Artificial intelligence strengthens EMS performance by drawing on historical building data to predict future demand. AI-enabled systems can forecast occupancy to adjust HVAC schedules, anticipate peak loads for grid participation, and recommend optimal energy mixes based on weather or price conditions. Pilot studies in Singapore and Europe report that AI-enhanced EMS can reduce energy intensity by up to 40% compared with conventional systems [47].

5.3.3. Integration with Carbon Markets

Beyond reducing energy use, advanced EMS platforms can link verified emission reductions to carbon credit markets. This creates a financial incentive for operators, allowing measurable GHG reductions to be monetized while contributing to national decarbonization goals. Such integration also supports regulatory compliance and aligns building operations with emerging climate-finance frameworks.
Reducing operational carbon requires a coordinated set of interventions rather than isolated measures. Equipment upgrades, improved thermal envelopes, smart grid–enabled EMS, and engaged occupants each contribute to lowering energy demand. AI-driven platforms enhance this by converting real-time data into targeted operational adjustments, while connections to carbon markets allow verified reductions to generate financial value. Taken together, these strategies show that well-managed operations can deliver immediate emission cuts alongside long-term cost savings—an essential foundation for achieving whole-life carbon neutrality.

5.4. Synthesis and Next-Level Actions from Carbon-Management Strategies

The operational and embodied carbon evidence can be translated into an implementation sequence. At concept design, set a whole-life carbon budget and compare structural options before the design is locked. At procurement, require EPDs for cement, steel, glass, aluminum, insulation, and major MEP equipment, and reject substitutions that reduce cost while increasing kgCO2e/m2 beyond the project budget. During construction, monitor transport distances, prefabrication yield, waste rate, and diesel/electricity consumption. During operation, connect HVAC, lighting, plug loads, and renewable generation to an EMS that reports normalized energy use intensity and carbon intensity. At retrofit and end-of-life, apply design-for-disassembly and secondary-material recovery targets. These actions are the manuscript’s practical contribution because they convert the review evidence into a staged governance checklist rather than a descriptive catalogue.

6. Singapore’s Five-Phase Pathway

In highly urbanized economies such as Singapore, the built environment is a strategic decarbonization domain because dense high-rise buildings, tropical cooling loads, limited land, and strong regulatory capacity create both constraints and implementation opportunities. Singapore’s Green Building Masterplan and Green Mark framework provide the policy context, while the carbon-tax and International Carbon Credit frameworks create incentives for verified emission reduction [48,49,50]. This paper outlines a five-phase pathway for digital building-carbon governance in Singapore. The pathway begins with operational carbon MRV because metered electricity and chilled-water data can be monitored continuously and verified using established energy-performance protocols. It does not treat operational energy as the only decarbonization priority. Instead, operational MRV is the first implementation layer, and the pathway is expanded to whole-life carbon by adding EPD-based embodied carbon accounting, material passports, low-carbon procurement thresholds, and circularity requirements. The five phases are therefore evidence-based design components rather than proof that a complete national programme already exists (Table 7).

6.1. Phase 1—Real-Time Building Energy Monitoring

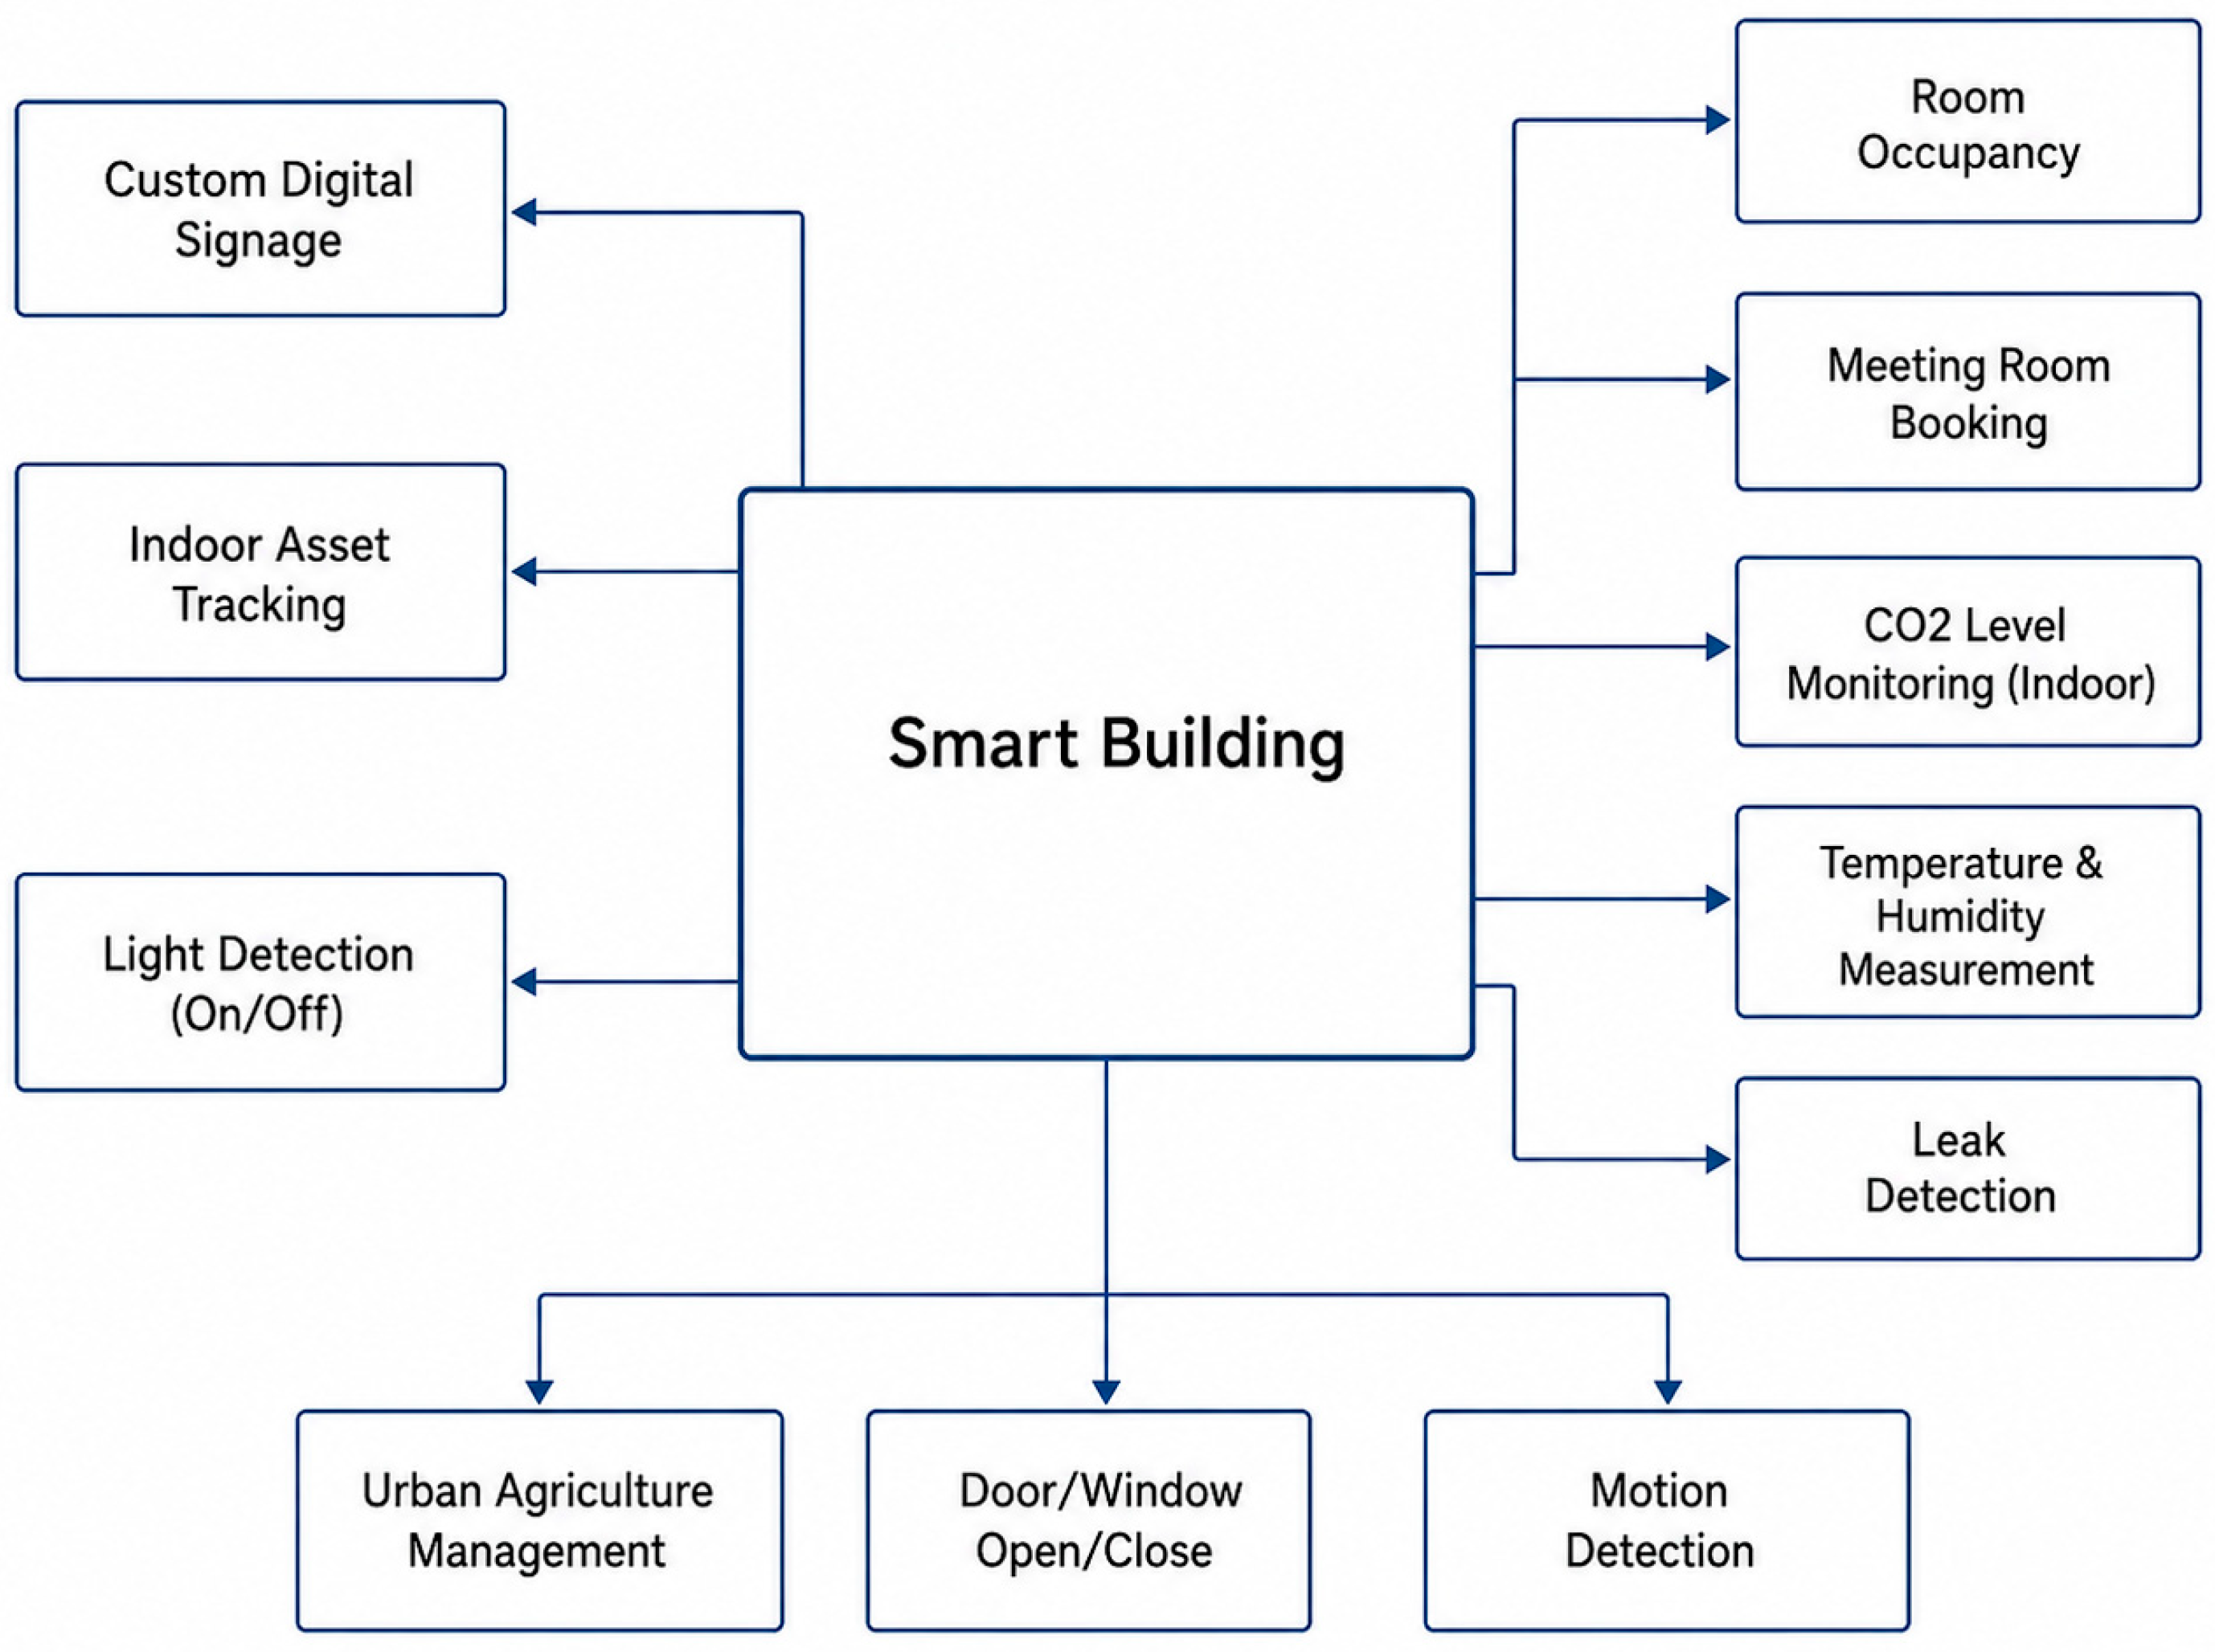
A central element of the strategy is establishing a digital infrastructure capable of continuous energy monitoring. Using IoT sensors and AI analytics, the platform captures granular consumption data across commercial, residential, and industrial buildings (Figure 3). These real-time insights support immediate operational adjustments and enable long-term energy profiling and benchmarking. To ensure scalability, the system adopts a modular architecture and cloud-based deployment, with data protection maintained through encryption, anonymization protocols, and compliance with local governance requirements. Pilot deployments with early adopters, supported by government incentives such as subsidies and eligibility for Green Mark certification, are intended to build confidence and encourage broad participation.
Phase 1 of Singapore’s five-phase decarbonization strategy centres on establishing a national digital platform for real-time energy monitoring. The system integrates IoT sensors with AI-based analytics to generate continuous, high-resolution consumption data across the country’s diverse building stock—from HDB residential blocks to industrial facilities and high-rise commercial developments. This data stream enables owners, operators, and regulators to identify inefficiencies as they arise, benchmark performance across portfolios, and support more targeted operational decisions. The platform is built for scalability and retrofitting. A modular architecture and cloud-based deployment allow integration with both new and existing buildings, many of which operate legacy systems that hinder interoperability. Although customized retrofit solutions can raise upfront costs and slow deployment, early pilots demonstrate clear benefits: Resync’s AI-enabled platform has achieved roughly 20% energy savings through automated load adjustments, while ST Engineering’s AGIL® Smart Energy Building system—combining anticipatory lighting controls with energy-recovery features—has reported up to 50% reductions in HVAC and lighting demand.
Phase 1 also aligns with national incentive schemes. Buildings adopting the platform may qualify for Green Mark certification, the Energy Efficiency Fund, and other subsidies that help offset capital expenditure. Financial feasibility nonetheless remains a concern for smaller owners and tenants with limited upfront capital or expectations of slow returns. Participation increases when platform adoption is linked to compliance credits, eligibility for certification points, or other regulatory benefits that shift the cost–benefit balance toward engagement. Data governance is another critical factor. The platform aggregates detailed consumption profiles that could reveal commercially sensitive information if inadequately protected. Existing measures—including end-to-end encryption and anonymization—form the baseline, but industry experts note the need for a national data-trust framework to clarify rules on ownership, access, and accountability. Such governance will be essential for addressing concerns about vendor lock-in and loss of operational control. Overall, Phase 1 establishes the technological and institutional foundation for the wider decarbonization roadmap. By combining transparent, real-time energy monitoring with incentives and robust data protections—and by positioning verified savings for future participation in carbon credit markets—the phase sets the stage for broader adoption and enables the subsequent steps of Singapore’s whole-life carbon strategy.
Phase 1 must also prepare the data architecture for embodied carbon inputs. Each monitored building should have a digital asset record that links energy-meter data with BIM quantities, EPDs, material passports, and replacement schedules. This prevents the platform from becoming an operational-energy-only tool and allows later phases to compare operational savings with the upfront and recurring carbon consequences of materials and equipment replacement.

6.2. Phase 2—Validation and Verification (V&V) Framework

This phase adopts a two-stage process to build confidence in projected outcomes and confirm the accuracy of achieved results. The first stage—predictive validation—uses historical consumption data and digital simulations to establish a robust baseline representing expected energy use without intervention. This baseline guides target-setting and investment decisions. The second stage—performance-based verification—assesses actual reductions by drawing on real-time monitoring data from the national platform. This continuous feedback loop supports ongoing performance tracking and aligns with internationally recognized standards such as the International Performance Measurement and Verification Protocol (IPMVP) [3] and ISO 50001 [4], signalling a commitment to global best practice.
While digitized validation improves reporting speed and transparency, it remains highly sensitive to baseline assumptions. Unexpected shifts—such as changes in occupancy, temporary shutdowns, or seasonal variation—can distort predictive models and lead to over- or under-estimation of savings. Without statistical safeguards, such discrepancies risk weakening policy credibility and investor confidence. To mitigate these issues, the framework incorporates uncertainty buffers and adaptive modelling techniques that correct for anomalies and help maintain the reliability of reported results [51].
The V&V framework must also include a carbon-payback test for major retrofits. When equipment replacement, façade upgrades, or envelope improvements are credited for operational savings, the embodied carbon of replacement materials and equipment should be reported separately. A retrofit should be classified as whole-life beneficial only when cumulative operational savings exceed added embodied emissions within a stated assessment period.
A key constraint is institutional rather than technical. Singapore has a limited pool of accredited V&V professionals, and scaling verification across thousands of buildings could create significant bottlenecks. Heavy reliance on manual audits would slow certification, raise transaction costs, and weaken market confidence. To avoid this, the framework adopts a hybrid approach that combines automated analytics with targeted third-party auditing. AI-driven tools handle routine analysis, anomaly detection, and benchmarking at scale, while human auditors focus on complex cases and quality assurance. This division of labour balances efficiency with credibility and reduces risks such as algorithmic bias or misinterpretation of context-specific results.
Equally important is the integration of V&V processes into the core monitoring platform. Embedding standard reporting templates, automated anomaly alerts, and transparent audit trails streamlines compliance for building owners and reduces administrative burdens for regulators. This institutionalized workflow improves traceability, minimizes delays, and strengthens stakeholder confidence. Its effectiveness, however, depends on close coordination among the Building and Construction Authority, the National Environment Agency, and accredited verifiers to ensure that technical tools are supported by coherent institutional arrangements. Phase 2, therefore, represents not only a technical enhancement but also an institutional reform, establishing the foundation for a transparent, efficient, and scalable system for validating energy savings across Singapore’s built environment.

6.3. Phase 3—Carbon Credit Conversion and Accreditation (VCS, NEA, SMEs Challenges)

Phase 3 shifts the strategy from validating energy savings to monetizing them through accredited carbon credits. Verified reductions constitute a latent asset that, once properly quantified and certified, can generate revenue while advancing national decarbonization goals. This phase outlines a structured pathway through which data from the national monitoring platform—already processed under the standardized V&V framework—are translated into carbon credits under domestic and international standards. The economic rationale is clear: efficiency-based credits can be traded on Singapore’s voluntary carbon market or used to offset up to 5% of emissions under the Carbon Pricing Act, which, from 2024, permits the use of International Carbon Credits (ICCs). Linking operational savings to financial incentives provides a strong motivation for building owners to invest in measures that might otherwise be deemed uneconomical.
Before energy-efficiency credits are issued, the scheme must test additionality against four conditions: mandatory code requirements, existing Green Mark or public-subsidy incentives, business-as-usual equipment replacement schedules, and changes in grid-emission factors. Savings already claimed under a public subsidy, renewable-energy certificate, corporate Scope 2 instrument, or another crediting programme must not be credited again without a transparent allocation and retirement rule.
However, accreditation processes are complex. They require extensive documentation, independent audits, and strict adherence to methodological protocols—efforts that can be costly and time-consuming. For many small and medium-sized enterprises, accreditation expenses may exceed potential credit revenue, limiting participation and concentrating benefits among large actors. The strategy therefore recommends targeted grants, fee subsidies, and aggregation mechanisms that allow smaller projects to pool resources and reduce per-project accreditation costs.
Ensuring credit integrity poses further challenges. The value of any carbon credit hinges on “additionality”—evidence that reductions would not have occurred without the credited intervention. In Singapore, where many efficiency upgrades already receive support through schemes such as Green Mark or BREEF, preventing double-counting and inflated baselines is essential. To safeguard credibility, the strategy calls for close alignment with international accreditation bodies such as Verra’s Verified Carbon Standard (VCS) and the British Standards Institution (BSI), supplemented by Singapore-specific protocols that reflect local financing structures and policy conditions. Technological integration is designed to streamline accreditation. Automated emissions calculations, life-cycle tracking of credits from issuance to retirement, and direct linkages to verified registries can reduce transaction costs and strengthen transparency. These tools must nonetheless be auditable, secure, and resistant to data errors or manipulation to maintain market confidence. Failure to ensure data integrity would undermine both credit validity and Singapore’s broader ambitions in carbon-market development.
The success of Phase 3 ultimately depends on regulatory clarity, institutional coordination, and user trust. A dedicated oversight unit is needed to interface with domestic regulators and international registries, ensuring that issued credits meet evolving compliance requirements. With transparent methodologies, strong governance, and targeted financial support, this phase can convert verified energy savings into a tradable, revenue-generating asset—aligning private incentives with national climate objectives and reinforcing Singapore’s position as a credible hub for high-quality carbon markets.

6.4. Phase 4—Carbon Credit Marketplace (Blockchain, Carbon Credit Exchange)

Phase 4 shifts the emphasis from generating carbon credits to activating a functioning market, recognizing that credits have value only when they can be traded transparently and efficiently. The strategy therefore proposes a national digital marketplace built on blockchain and smart-contract infrastructure to automate transactions, enforce compliance, and ensure secure, traceable retirement of credits. Such features reduce counterparty risk, lower administrative costs, and improve price discovery—capabilities essential for scaling transactions beyond bilateral deals.
Existing digital carbon exchanges illustrate the feasibility of this model. A national marketplace would build on these precedents by supporting not only primary issuance but also secondary trading and retirement tracking, thereby improving liquidity and enabling more robust pricing of energy-efficiency-derived credits. Still, a nascent market carries risks: low early trading volumes, thin liquidity, and incomplete regulation can invite volatility, deter institutional investors, or enable speculative behaviour. To address these vulnerabilities, the strategy prioritizes strong regulatory oversight, real-time auditing, transparent reporting, and smart-contract protocols designed to safeguard credit integrity and reduce opportunities for fraud.
Broad stakeholder engagement is essential for sustaining both supply and demand. Partnerships with institutional investors, corporates pursuing ESG goals, and regional sustainability funds are expected to drive initial uptake and stabilize prices. Rebuilding trust in voluntary carbon markets—globally challenged by greenwashing and double-counting concerns—requires strict traceability, full disclosure, and third-party verification aligned with widely used market-integrity principles. Policy coherence is equally important. Credits traded on the marketplace could serve dual functions: they may be used to offset up to 5% of taxable emissions under Singapore’s Carbon Pricing Act beginning in 2024 or be transacted internationally under Article 6 of the Paris Agreement. Preventing double-counting and maintaining environmental integrity will require ongoing coordination with regional partners, especially within ASEAN, and alignment with domestic and international carbon-accounting rules [50].
Finally, market credibility depends on accessibility and outreach. A user-friendly interface with clear pricing and automated settlement is intended to lower barriers for smaller firms such as SMEs. Demonstration projects that highlight cost savings, regulatory preparedness, and reputational benefits can help expand participation. A coordinated education and outreach programme—supported by government incentives and pilot case studies—will be crucial to accelerate adoption. Phase 4 thus aims to establish Singapore as a regional hub for high-integrity carbon trading, combining advanced digital infrastructure with stringent governance and strong cross-border cooperation. If implemented effectively, the marketplace can unlock new revenue streams for verified energy-efficiency projects, lower compliance costs for emitters, and reinforce Singapore’s position in Asia’s emerging carbon-finance landscape.

6.5. Phase 5—Continuous Integration, ESG Alignment, ASEAN Expansion

Phase 5 emphasizes adaptability and long-term resilience, treating the platform not as a fixed system but as an evolving ecosystem. As climate regulations tighten and technologies such as AI, blockchain, and advanced sensor networks progress, the platform must continually integrate new data streams, user feedback, and operational insights to remain effective. This adaptability ensures that the system evolves alongside market expectations and regulatory shifts rather than becoming outdated. A key component of this phase is expanding monitoring beyond energy to include broader sustainability indicators—such as water use, waste generation, and indoor environmental quality—reflecting the growing importance of ESG frameworks like the Task Force on Climate-related Financial Disclosures (TCFD) and the Global Reporting Initiative (GRI). Incorporating these metrics provides a more holistic view of building performance and aligns Singapore’s built environment with international reporting standards.
Institutional coordination is equally critical. Decarbonizing the built environment involves multiple agencies—BCA, NEA, EMA, and MSE—and fragmented mandates risk inconsistent regulations, duplicated reporting, and inefficiencies in data management. To address this, the strategy proposes establishing an inter-agency decarbonization task force or a centralized data-governance body to harmonize standards, reduce compliance burdens, and strengthen cross-sectoral alignment. Regionally, Phase 5 looks toward extending the platform across ASEAN, where rapid urbanization, rising energy demand, and varying regulatory capacity create both need and opportunity. Successful deployment, however, depends on local readiness, including digital infrastructure, carbon-market governance, and workforce skills. A uniform model would be impractical; instead, a modular and customizable platform—supported by training programmes, bilateral agreements for credit mutual recognition, and technical assistance—would better accommodate diverse national contexts.
Overall, Phase 5 ensures the strategy remains future-proof by embedding mechanisms for continuous learning, technological adaptation, and policy coherence. This forward-looking orientation allows the platform to stay relevant amid shifting regulatory and climatic conditions and positions Singapore as both a regional innovation hub and a reliable partner in advancing low-carbon development across Asia.

6.6. Whole-Life and Embodied Carbon Extension of the Singapore Pathway

The five-phase pathway should be read as a staged route from operational carbon MRV to whole-life carbon governance. The operational layer is the entry point because Singapore already has strong building-energy benchmarking, Green Mark experience, carbon-pricing infrastructure, and digital-building capabilities. The embodied carbon layer should be added through four instruments. First, new buildings and major retrofits should disclose A1–A5 upfront carbon using EN 15978-compatible boundaries and product-specific EPDs where available. Second, major materials such as cement, concrete, steel, aluminum, glass, insulation, timber, and MEP equipment should be attached to digital material passports. Third, public procurement and Green Mark criteria should include declining kgCO2e/m2 benchmarks for high-impact building types. Fourth, retrofit approval should include a carbon-payback analysis so that operational savings are not credited without acknowledging the embodied carbon of replacement systems. This extension resolves the apparent imbalance between the manuscript’s whole-life carbon framing and the operational-energy emphasis of the initial Singapore pathway.
Key implementation risks, responsible stakeholders, and required supporting documents are summarized in Table 8.

6.7. Implementation-Risk Register for Singapore

Table 8 translates the proposed pathway into an implementation-risk register by linking each major risk to its relevance and the corresponding mitigation measure.
Table 8. Implementation-risk register for the Singapore pathway.
Risk CategoryWhy It MattersMitigation Measure
Data privacy and ownershipBuilding-level energy and occupancy data may reveal commercially sensitive or personal information.Use data-governance rules, anonymization, access control, and clear ownership agreements.
CybersecurityDigital MRV platforms may become attack surfaces.Require cybersecurity standards, audit logs, and resilience testing.
Vendor lock-inProprietary platforms can reduce interoperability and increase long-term costs.Require open data standards, API interoperability, and procurement safeguards.
Baseline manipulationCarbon savings can be overstated if baselines are inflated.Use standardized baselines, independent verification, and periodic recalibration.
Additionality failureCredits may be issued for reductions that would have occurred anyway.Apply additionality tests before credit issuance.
Double-countingThe same reduction may be claimed by multiple parties.Use registry controls, unique credit identifiers, and transparent ownership rules.
Auditor capacityLimited verifier capacity can weaken credibility.Train accredited auditors and introduce third-party assurance requirements.
SME exclusionSmaller building owners may lack resources to participate.Provide simplified MRV templates, technical assistance, and financing support.
Market liquidityCarbon credit markets may remain too thin for reliable pricing.Aggregate projects and connect verified credits to credible exchanges.
Embodied carbon data gapsLocal EPD and material-carbon data may be incomplete.Build national/regional EPD databases and material-passport systems.
Split incentivesOwners, tenants, and operators may not share costs and benefits.Use green leases, performance contracts, and shared-savings mechanisms.
Equity concernsLow-income users may be excluded or face cost pass-through.Pair carbon governance with grants, concessional finance, and affordability safeguards.

6.8. ASEAN Localization Framework

Table 9 summarizes the main localization priorities, enabling conditions, and institutional requirements for adapting the Singapore pathway across ASEAN contexts.

7. Discussion

The global building sector is at a pivotal moment. It must deliver large volumes of housing, infrastructure, and workplaces to accommodate rapid urbanization and population growth, while simultaneously accounting for more than one-third of global GHG emissions. These emissions stem from both operational-energy use and the carbon intensity of materials such as steel and cement. The imperative to balance expanding development needs with deep decarbonization has never been more pressing. Evidence from different regions shows meaningful progress but also enduring structural constraints that together define the sector’s trajectory toward net-zero buildings.

7.1. Mechanism and Boundaries of Digital Life-Cycle Carbon Governance

Digital life-cycle carbon governance should be defined as a four-layer mechanism. The boundary-setting layer defines what is counted through EN 15978 modules and Scope 1–3 categories. The data layer converts operational and embodied carbon information into auditable datasets through smart meters, BMS/EMS, BIM quantities, EPDs, material passports, and construction-waste logs. The assurance layer tests whether claimed reductions are real, additional, durable, and not double-counted using IPMVP [3], ISO 50001 [4], ISO 14064-1 [43], third-party audits, and uncertainty checks. The policy-market layer converts verified performance into procurement decisions, Green Mark or code compliance, carbon-tax offsets, ESG disclosure, or carbon credit transactions. The mechanism works only when data rights, audit capacity, baseline rules, and material-carbon boundaries are explicit; otherwise, digitalization can increase reporting volume without improving environmental integrity.

7.2. Comparative Insights: Singapore and Global Regions

Singapore’s case illustrates how a digital-first, policy-aligned pathway can support building decarbonization in a dense, high-income, institutionally coordinated city-state. Its strengths are continuous energy data, Green Mark experience, carbon-pricing infrastructure, and strong public-sector capacity. These conditions make Singapore suitable for piloting operational carbon MRV and later extending the platform to embodied carbon reporting. The pathway should not be described as universally replicable, because many rapidly urbanizing markets lack comparable digital infrastructure, audit capacity, EPD coverage, and carbon-market governance. Its transferable value lies in modular design: energy monitoring, verification, material-carbon reporting, credit conversion, and marketplace development can be adopted sequentially according to local readiness.
Europe and the United Kingdom illustrate the impact of binding regulation and whole-life-carbon guidance [17,19,20,21,22,23,27,32]. Their policies mandate whole-life carbon accounting—capturing both embodied and operational emissions—and set stringent benchmarks for carbon-intensive materials such as cement and steel. These requirements have no direct equivalent in Singapore, indicating an area where the city-state could strengthen its decarbonization agenda. The United States offers a different lesson, showing how market-driven certification systems such as LEED can mobilize private investment and shape consumer preferences. This demonstrates the value of voluntary standards and competitive incentives as complements to regulation [18,24,25,26]. China, as the world’s largest construction market, highlights the industrial dimension of the challenge [12,52,53]. Decarbonizing its building sector requires simultaneous progress in energy-intensive upstream industries—particularly steel and cement—and continued tightening of codes and certification schemes. The scale of China’s urban expansion underscores the need for integrated industrial and building-sector strategies. Together, these cases show the importance of peer learning. Singapore can deepen its embodied carbon accounting by drawing on European and UK models, while other regions may benefit from Singapore’s integration of digital platforms with regulatory and market mechanisms [47,49,50]. Such cross-regional exchange is essential for developing global approaches that are technologically advanced yet adaptable to diverse local contexts.

7.3. International Cooperation and Harmonized Standards

The comparison also highlights the pressing need for harmonized standards and methodologies. Life-cycle assessment (LCA) practices vary widely across regions, complicating cross-border benchmarking and weakening investor confidence. Without a global “common language” for measuring building emissions, policymakers and financiers face obstacles to scaling effective solutions. Greater alignment among regional frameworks—such as EN 15978 in Europe, PAS 2080 in the UK, and RICS whole-life-carbon guidance [20,32,54,55]—would improve comparability and transparency, directing capital toward the projects where it can achieve the greatest impact.
Harmonization should also include embodied carbon data. A Singapore or ASEAN pathway that monitors operational energy but lacks EPD coverage, material-carbon benchmarks, and common rules for modules A1–A5 and B2–B5 would remain incomplete. The revised framework, therefore, treats EN 15978-compatible boundaries, product-level EPDs, and whole-life carbon benchmarks as prerequisites for moving from energy governance to life-cycle carbon governance.
Equitable access to finance is equally essential. While advanced economies move toward whole-life carbon disclosure and net-zero building requirements, many emerging markets face capital shortages, fragmented infrastructure, and institutional capacity constraints. Mobilizing concessional finance, blended investment models, and technical assistance is not only a matter of fairness but a strategic necessity, as future building-emissions growth will be concentrated in developing regions [15,28]. Without financial inclusivity, global decarbonization targets will remain out of reach.

7.4. Policy Innovation and Digital Technologies as Enablers

Across all regions, two consistent enablers of progress stand out: policy innovation and digital technology [47,49,50]. Effective policies—through carbon pricing, green procurement, or mandatory emissions disclosure—provide direction and establish accountability frameworks that shape market behaviour [47,50]. Digital technologies operationalize these policies. Digital platforms, IoT-enabled EMS, automated reporting, and carbon-accounting workflows translate regulatory goals into verifiable, on-the-ground outcomes [47,49,50]. The interplay between policy and technology is crucial: policy supplies the structure and incentives, while digital tools deliver the precision, transparency, and cost-effective compliance needed to implement them. Together, they support more responsive decision-making and lower transaction costs, especially in settings with limited institutional capacity.

7.5. Future Directions: Integration, Equity, and Digitalization

The global building sector’s transition to net zero hinges on three interlinked priorities that shape how buildings are designed, financed, and operated.
First, the main unresolved methodological issue is how to combine real-time operational data with slower, document-based embodied carbon data. Energy meters can produce hourly or sub-hourly operational records, whereas embodied carbon information depends on EPD availability, supplier documentation, material quantities, and assumptions about service life and replacement. Future digital platforms should therefore avoid presenting a single carbon number without boundary disclosure. They should report operational carbon, upfront embodied carbon, replacement carbon, end-of-life carbon, and module D benefits separately, before aggregating them into whole-life indicators.
Second, equitable financing will be critical. Most future construction will take place in rapidly urbanizing regions where capital constraints are greatest. Concessional loans, blended finance, and performance-based carbon markets will be necessary to unlock investment in these contexts [15,28]. Without such mechanisms, the transition risks becoming uneven, with low-carbon construction advancing in high-income economies while developing regions remain tied to carbon-intensive growth models.
Third, digital transformation must be fully leveraged. Real-time energy and carbon monitoring should be regarded as a core building-management function. Digital platforms integrating sensors, analytics, and automated reporting provide the transparency needed to inform operational decisions and support market instruments such as carbon credits. The ability to measure and verify emissions reliably will determine whether policy goals translate into reductions at scale [47].
These priorities highlight that no single region holds the complete solution. Singapore’s digital leadership, Europe and the UK’s regulatory depth, the United States’ market-driven innovation, China’s industrial decarbonization efforts, and the development needs of emerging economies each offer complementary lessons for building decarbonization [1,2].

8. Conclusions

The building sector is now widely recognized as a pivotal arena in the global transition to net-zero emissions. Accounting for more than one-third of global greenhouse gas output, it poses both a formidable challenge and a significant opportunity. Insights from regional experiences and the strategies outlined in this review converge on a clear message: climate targets cannot be achieved without addressing the full carbon footprint of buildings [1,2]. A life-cycle perspective is essential. While operational emissions—historically the focus of building codes and efficiency programmes—are declining in many advanced economies, embodied carbon from materials and construction is rising. Life-Cycle Assessment (LCA) offers the methodological backbone to capture both, ensuring that emissions from extraction through demolition and material recovery are fully accounted for. Digital transformation is simultaneously reshaping carbon management in practice. Intelligent grid management systems, AI-enabled optimization, and real-time monitoring platforms are moving from experimental trials to widespread adoption. These tools not only reduce emissions but also generate reliable data streams that can be directly linked to carbon markets and financial instruments, translating climate performance into measurable economic value.
Its strengths—metered operational data, digital infrastructure, Green Mark experience, and carbon-market institutions—make it suitable for piloting high-integrity MRV, but its limitations—embodied carbon data gaps, SME adoption costs, additionality risks, auditor capacity constraints, and ASEAN heterogeneity—mean that wider application requires localization, blended finance, and material-carbon safeguards.
Within this landscape, Singapore’s integrated approach should be described as a transferable governance prototype rather than a directly replicable model. Its wider relevance depends on explicit localization of embodied carbon data systems, financing instruments, verification capacity, and building-code maturity. Digital MRV and carbon-market mechanisms can accelerate building decarbonization only when they are coupled with whole-life carbon boundaries, embodied carbon safeguards, transparent review methods, and context-specific financing.
The revised conclusions are therefore grounded in 55 screened sources rather than unscreened citation accumulation, and the transfer claims are intentionally narrowed where the retained evidence remained region-specific, case-specific, or more mature for operational carbon than for embodied carbon governance.

Author Contributions

Conceptualization, Y.L.; Methodology, Y.L.; Validation, Y.M. and Y.L.; Formal Analysis, X.W.; Investigation, Y.L. and Y.M.; Resources, X.W. and Y.M.; Writing—Original Draft Preparation, Y.L.; Writing—Review and Editing, Y.L.; Visualization, X.W.; Supervision, Y.L.; Project Administration, Y.M. All authors have read and agreed to the published version of the manuscript.

Funding

This research was funded by Enerstay Sustainability Academy (Singapore) Grant Call (Call 7/2025) _SDG (Project ID CUMT-001), Singapore.

Data Availability Statement

The data presented in this study are available on request from the corresponding author due to the confidentiality of ongoing research and project restrictions.

Conflicts of Interest

The authors declare no conflicts of interest.

List of Abbreviations

ACXAirCarbon Exchange
AIArtificial Intelligence
BCABuilding and Construction Authority (Singapore)
BMSBuilding Management System
CENEuropean Committee for Standardization
CPACarbon Pricing Act (Singapore)
DERDistributed Energy Resources
EBDEmbodied Carbon
EC3Embodied Carbon in Construction Calculator
EcoinventLife-cycle inventory database (proper noun; no expansion)
EDGEExcellence in Design for Greater Efficiencies (IFC)
EMSEnergy Management System
EN 15978Sustainability of Construction Works—Assessment of Environmental Performance of Buildings—Calculation Method
EPDEnvironmental Product Declaration
ESGEnvironmental, Social and Governance
EVOEfficiency Valuation Organization (publisher of IPMVP)
GHGGreenhouse Gas
GRIGlobal Reporting Initiative
HVACHeating, Ventilation and Air Conditioning
ICCInternational Carbon Credit (plural: ICCs)
ICVCMIntegrity Council for the Voluntary Carbon Market
IEAInternational Energy Agency
IFCInternational Finance Corporation
IoTInternet of Things
IPMVPInternational Performance Measurement and Verification Protocol
ISO 14064-1Greenhouse gases—Part 1: Specification for organizational-level quantification/reporting
ISO 21930Core rules for EPDs of construction products
ISO 50001Energy Management Systems—Requirements with guidance
LCALife-Cycle Assessment
LEEDLeadership in Energy and Environmental Design
LETILondon Energy Transformation Initiative
MRVMeasurement, Reporting and Verification
NEANational Environment Agency (Singapore)
nZEBNearly Zero-Energy Building
PAS 2080Carbon Management in Infrastructure (BSI)
RICSRoyal Institution of Chartered Surveyors
TCFDTask Force on Climate-related Financial Disclosures
UKGBCUK Green Building Council
UNEPUnited Nations Environment Programme
USGBCU.S. Green Building Council
V&VValidation and Verification
VCSVerified Carbon Standard (Verra)
WGBCWorld Green Building Council

Appendix A. Supplementary Evidence Screening and Quality Appraisal

Scoring note: peer-reviewed studies were scored on a 0–10 scale using the five domains stated in Section 2.7 (method transparency, boundary clarity, data quality, treatment of uncertainty, and transferability). Policy, standards, and institutional sources were scored on an AACODS-informed 0–10 scale normalized for authority, accuracy, coverage, objectivity, date, and significance. Foundational methodological references retained for background explanation were not counted in the 2020–2026 screening flow below.
Table A1. Scholarly sources that were included after database screening. All sources listed in Table A1 and Table A2 were included in the final synthesis; the score column reports the source-level appraisal used to weight the narrative review.
S/NSourceAppraisal BasisScore
1Maryam Keyhani. Measuring and mitigating embodied carbon in educational buildings: A case study in the UKEmpirical or applied LCA/5-domain7.5
2Darshan Chaudhary. Use of Digital Analysis Methods in Determination of Embodied Carbon of Buildings in the UKEmpirical or applied LCA/5-domain7.8
3Martin Röck. A Global Database on Whole Life Carbon, Energy and Material Intensity of Buildings (CarbEnMats-Buildings)Framework or benchmark/5-domain8.4
4Zheyuan Zhang. Embodied carbon saving potential of using recycled materials as cement substitute in Singapore’s buildingsEmpirical or applied LCA/5-domain7.6
5Mohammed Seddiki. A Life Cycle Carbon Assessment and Multi-Criteria Decision-Making Framework for Building Renovation Within the Circular Economy Context: A Case StudyFramework or benchmark/5-domain8.4
6Yueping Luo. A comparative review of whole-life-cycle carbon emission assessment in the building sector: progress, challenges, and trends in China and globallyReview/SANRA-informed8.7
7Xiaolong Xu. Research on Carbon Emission Calculation and Emission Reduction Strategies for Buildings Based on the Whole Life CycleEmpirical or applied LCA/5-domain7.3
8Julie Železná. Whole life carbon assessment of Czech building typologies: analysis of 170 representative case studies towards the definition of national benchmarksFramework or benchmark/5-domain8.4
9Shaotsu Tu. Whole-life carbon reduction in early building design: Comparing industry perspective in China and the United StatesEmpirical or applied LCA/5-domain7.3
10Christina Kiamili. Detailed Assessment of Embodied Carbon of HVAC Systems for a New Office Building Based on BIMEmpirical or applied LCA/5-domain7.8
11Chen Chen. A Conceptual Framework for Estimating Building Embodied Carbon Based on Digital Twin Technology and Life Cycle AssessmentFramework or benchmark/5-domain8.7
12Jim Hart. Whole-life embodied carbon in multistory buildings: Steel, concrete and timber structuresEmpirical or applied LCA/5-domain7.3
13Sila Temizel-Sekeryan. Circular Design and Embodied Carbon in Living Buildings: The Missing PotentialEmpirical or applied LCA/5-domain7.3
14José Humberto de Paula Filho. Life-Cycle Assessment of an Office Building: Influence of the Structural Design on the Embodied Carbon EmissionsEmpirical or applied LCA/5-domain7.3
15Dilek Arslan. Sensitivity analysis of the impact of environmental product declaration values on whole life carbon assessment: A case study using expanded polystyrene insulation for the retrofit of a building in TurkiyeEmpirical or applied LCA/5-domain7.7
16D Tigani. Measuring Embodied Carbon of Buildings: A Review of Methodologies and Benchmarking Towards Net ZeroReview/SANRA-informed9.5
17Emilie Brisson Stapel. Methodological Challenges in Aligning EPDs with Whole Life Carbon Limits for Buildings: A B2B ApproachEmpirical or applied LCA/5-domain7.5
18Yangxiaoxia Li. Methodologies for assessing building embodied carbon in a circular economy perspectiveEmpirical or applied LCA/5-domain7.3
19Xiaojun Luo. An integrated blockchain, building information modelling and life-cycle assessment framework for carbon footprint tracking and low-carbon building designFramework or benchmark/5-domain8.7
20Mohsen Ahmadi. Circularity-based embodied carbon performance in building design: Index development and circular initiativesEmpirical or applied LCA/5-domain7.3
21Ana Karolina Santos. Promoting decarbonisation in the construction of new buildings: A strategy to calculate the Embodied Carbon FootprintEmpirical or applied LCA/5-domain7.3
22Naif Albelwi. DT-LCAF: Digital Twin-Enabled Life Cycle Assessment Framework for Real-Time Embodied Carbon Optimization in Smart Building ConstructionFramework or benchmark/5-domain8.7
23Wai Lam Ng. Decarbonization in green building rating systems: A systematic review on embodied and operational carbon creditsReview/SANRA-informed9.3
24Maria M. Brooks. Application of life-cycle carbon assessment for a sustainable building design: a case study in the UKEmpirical or applied LCA/5-domain7.5
25Yumin Liang. Assessment of operational carbon emission reduction potential of green building technologiesEmpirical or applied LCA/5-domain7.5
26Golnaz Mohebbi. The Role of Embodied Carbon Databases in the Accuracy of Life Cycle Assessment (LCA) Calculations for the Embodied Carbon of BuildingsFramework or benchmark/5-domain8.2
27Marjana Šijanec-Zavrl. Whole-life carbon emissions benchmarks for buildings in SloveniaFramework or benchmark/5-domain8.2
28Ana Ferreira. Embodied vs. Operational Energy and Carbon in Retail Building Shells: A Case Study in PortugalEmpirical or applied LCA/5-domain7.5
29Chen Zhu. Embodied Carbon Emissions in China’s Building Sector: Historical Track from 2005 to 2020Empirical or applied LCA/5-domain7.3
30Hanwei Liang. Towards net zero carbon buildings: Accounting the building embodied carbon and life cycle-based policy design for Greater Bay Area, ChinaPolicy-linked study/5-domain7.7
31Yijun Zhou. Trade-Off Between Embodied and Operational Carbon Emissions of Residential Buildings in Early Design StageEmpirical or applied LCA/5-domain7.5
32Maryam Keyhani. Whole Life Carbon Assessment of a Typical UK Residential Building Using Different Embodied Carbon Data SourcesEmpirical or applied LCA/5-domain7.5
33Harry King. A critical evaluation of the sustainability of building codes and policy when embodied carbon is considered for the construction of three-bedroom houses in UKPolicy-linked study/5-domain7.7
34Wanying Wang. Carbon Emission Accounting and Reduction for Buildings Based on a Life Cycle Assessment: A Case Study in China’s Hot-Summer and Warm-Winter RegionEmpirical or applied LCA/5-domain7.5
35Martin Röck. Science for Policy: Insights from Supporting an EU Roadmap for the Reduction of Whole Life Carbon of BuildingsFramework or benchmark/5-domain8.8
36Maryam Keyhani. Whole-Life Embodied Carbon Reduction Strategies in UK Buildings: A Comprehensive AnalysisReview/SANRA-informed8.7
37Charles Gillott. Material stocks and embodied carbon in UK buildings: An archetype-based, bottom-up, GIS approachEmpirical or applied LCA/5-domain7.3
38Keyhani Maryam. Whole life embodied carbon assessment and reduction in UK buildingsEmpirical or applied LCA/5-domain7.3
Table A2. Policy, standards, and institutional sources that were included after targeted website searching.
IDSourceAppraisal BasisScore
1International Energy Agency (2023). Global Status Report for Buildings and Construction 2023.Policy report/AACODS-informed9.4
2UNEP GlobalABC (2022). GlobalABC Roadmap for Buildings and Construction 2022–2050.Policy roadmap/AACODS-informed9.2
3International Finance Corporation (2023). Green Buildings Market Intelligence and Climate Finance Opportunities.Market report/AACODS-informed8.8
4European Environment Agency (2022). Greenhouse gas emissions from energy use in buildings in the EU.Agency indicator report/AACODS-informed8.8
5U.S. Environmental Protection Agency (2021). Inventory of U.S. Greenhouse Gas Emissions and Sinks: buildings-related chapters.Government inventory/AACODS-informed9.0
6UK Green Building Council (2020). Net Zero Whole Life Carbon Roadmap for the Built Environment.Industry roadmap/AACODS-informed8.7
7China Building Energy Conservation Association (2022). Annual Report on China Building Energy Consumption.Sector report/AACODS-informed8.4
8European Commission (2020). A Renovation Wave for Europe.Policy communication/AACODS-informed8.8
9U.S. Green Building Council (2023). LEED v4.1 for Building Design and Construction.Certification standard/AACODS-informed8.6
10British Standards Institution (2020). PAS 2080: Carbon Management in Infrastructure.Standard/AACODS-informed8.9
11Department for Levelling Up, Housing and Communities (2021). The Future Homes and Buildings Standard.Government consultation response/AACODS-informed8.5
12International Energy Agency (2022). World Energy Outlook 2022: building-sector projections.Scenario report/AACODS-informed8.8
13Building and Construction Authority Singapore (2024). Green Mark Certification Scheme.Regulatory scheme/AACODS-informed8.9
14Royal Institution of Chartered Surveyors (2021). Whole Life Carbon Assessment for the Built Environment.Professional standard/AACODS-informed9.1
15ISO 14064-1:2018. Greenhouse gas quantification and reporting guidance.International standard/AACODS-informed9.0
16Building and Construction Authority Singapore (2022). Singapore Green Building Masterplan.National masterplan/AACODS-informed9.1
17National Environment Agency Singapore (2023). Carbon Pricing implementation and international carbon credits guidance.Government policy guidance/AACODS-informed8.7
Table A3. Full-text reports that were excluded after eligibility assessment.
IDSourceExclusion Reason
1Martin Röck (2024). Global Buildings Database Seed on Whole Life Carbon Emissions, Energy Performance, and Material Intensity (GBDB CarbEnMats)Overlapping database-seed record retained only once in the final synthesis.
2Rahul Grover (2020). Towards Zero Carbon Buildings: Reducing the embodied carbon footprint of a constructionToo generic and not sufficiently specific to the review questions or screening boundaries.
3Matt Roberts (2024). Material Selection and System Layout to Lower Embodied Carbon of Pipe in an Office BuildingComponent-level pipe-design case with limited transferability to whole-building governance.
4Cyntha Tendean (2025). Application of Tekla Structures Designer in Life Cycle Analysis to Measure Embodied Carbon in Steel BuildingsSoftware-specific steel-design application with limited policy or synthesis relevance.
5Nasim Eslamirad (2025). Optimizing Carbon Credit Strategies for Low-Energy-Efficient Buildings: Greener Alternatives for a Sustainable FutureCarbon credit concept paper not sufficiently anchored to screened building-sector evidence boundaries.
6Rihan Hai (2025). Quantitative Analysis of Life-Cycle Embodied Carbon in Residential Buildings Under Different Design PatternsResidential-pattern case was narrower than the final cross-context evidence set.
7Chanhyeok Kang (2026). Automated IFC Generation and Machine Learning-Based λ-Correction for Embodied Carbon Estimation of BuildingsHighly technical automation paper without enough review-level synthesis contribution.
8Hamad Alabdulrazzaq (2026). Comparative study of conventional and emerging façade systems: Pathways to reducing embodied carbon and enhancing circularity in buildingsFacade-system comparison was too component-specific for the final synthesis.
9Yu Dong (2020). Comparative Whole Building Life Cycle Assessment of Energy Saving and Carbon Reduction Performance of Reinforced Concrete and Timber Stadiums—A Case Study in ChinaStadium case lay outside the mainstream building-stock and policy framing used in the review.
10Liu Ke (2022). Quantitative research on embodied carbon emissions in the design stage: a case study from an educational building in ChinaSingle educational-building design-stage case was redundant after broader benchmarks and reviews were retained.
11Pablo Newberry (2023). Carbon assessment of building shell options for eco self-build community housing through the integration of building energy modelling and life cycle analysis toolsEco self-build housing case was too niche for the final global-comparison synthesis.
12Wil V. Srubar (2023). Material Use Intensity and Embodied Carbon Intensity of Single-Family Residential Buildings in the United StatesSingle-family material-intensity study was retained only as background context, not final synthesis evidence.
13Francesco Asdrubali (2023). Sustainability of Building Materials: Embodied Energy and Embodied Carbon of MasonryMaterial overview lacked a direct whole-building synthesis fit.
14Miaoyi Wang (2025). A Systematic Study on Embodied Carbon Emissions in the Materialization Phase of Residential Buildings: Indicator Assessment Based on Life Cycle Analysis and STIRPAT ModelingMaterialization-phase STIRPAT study was too narrow and overlapped with broader sector evidence.
15Joanna Pietrzak (2025). Assessing the Significance of a Wind-Load Application Methodology for Embodied Carbon in a European High-Rise BuildingWind-load methodology paper was too specialized for the final narrative synthesis.
16Yifeng Guo (2025). BIM-Based Life Cycle Carbon Assessment and PV Strategies for Residential Buildings in Central ChinaPV-strategy case study was narrower than the final four-question evidence base.
17Sarwar Mohammed (2025). Environmental Impact of Building Drainage Systems: Analysis of Embodied Carbon Emissions in Terms of Code-Based DesignDrainage-system component study was too narrow for the review scope.
18Claire-Louise Pickard Wheen (2025). The Impact of Roof Design on Embodied Carbon and BIPV Energy of a Primary School Building: An LCA-Based Study on the Embodied Carbon and PV-Generated Energy of Seven Roof Designs on a Two-Form Entry Primary School in Leeds, UKRoof-design school case study was excluded for limited transferability.

References

  1. International Energy Agency (IEA). Global Status Report for Buildings and Construction 2023: Towards a Zero-Emission, Efficient and Resilient Buildings and Construction Sector; IEA: Paris, France, 2023. [Google Scholar]
  2. United Nations Environment Programme (UNEP). GlobalABC Roadmap for Buildings and Construction 2022–2050; UNEP: Nairobi, Kenya, 2022. [Google Scholar]
  3. Efficiency Valuation Organization (EVO). International Performance Measurement and Verification Protocol (IPMVP): Core Concepts 2022; EVO: Washington, DC, USA, 2022. [Google Scholar]
  4. ISO 50001:2018; Energy Management Systems—Requirements with Guidance for Use. ISO: Geneva, Switzerland, 2018.
  5. Tricco, A.C.; Lillie, E.; Zarin, W.; O’Brien, K.K.; Colquhoun, H.; Levac, D.; Moher, D.; Peters, M.D.J.; Horsley, T.; Weeks, L.; et al. PRISMA Extension for Scoping Reviews (PRISMA-ScR): Checklist and Explanation. Ann. Intern. Med. 2018, 169, 467–473. [Google Scholar] [CrossRef] [PubMed]
  6. Rethlefsen, M.L.; Kirtley, S.; Waffenschmidt, S.; Ayala, A.P.; Moher, D.; Page, M.J.; Koffel, J.B. PRISMA-S: An Extension to the PRISMA Statement for Reporting Literature Searches in Systematic Reviews. J. Med. Libr. Assoc. 2021, 109, 174–200. [Google Scholar] [CrossRef] [PubMed]
  7. Baethge, C.; Goldbeck-Wood, S.; Mertens, S. SANRA-A Scale for the Quality Assessment of Narrative Review Articles. Res. Integr. Peer Rev. 2019, 4, 5. [Google Scholar] [CrossRef] [PubMed]
  8. Tyndall, J. AACODS Checklist; Flinders University: Adelaide, Australia, 2010; Available online: https://fac.flinders.edu.au/bitstream/handle/2328/3326/AACODS_Checklist.pdf (accessed on 10 June 2026).
  9. European Environment Agency (EEA). Greenhouse Gas Emissions from Energy Use in Buildings in the EU; EEA: Copenhagen, Denmark, 2022. [Google Scholar]
  10. U.S. Environmental Protection Agency (EPA). Inventory of U.S. Greenhouse Gas Emissions and Sinks: 1990–2019-Chapter on Residential and Commercial Buildings; EPA: Washington, DC, USA, 2021.
  11. UK Green Building Council (UKGBC). Net Zero Whole Life Carbon Roadmap for the Built Environment; UKGBC: London, UK, 2020. [Google Scholar]
  12. China Building Energy Conservation Association (CBECA). Annual Report on China Building Energy Consumption; CBECA: Beijing, China, 2022. [Google Scholar]
  13. International Energy Agency (IEA). Global Status Report for Buildings and Construction: Towards a Zero-Emission, Efficient and Resilient Buildings and Construction Sector; IEA: Paris, France, 2022. [Google Scholar]
  14. United Nations Environment Programme (UNEP). 2020 Global Status Report for Buildings and Construction; UNEP: Nairobi, Kenya, 2020. [Google Scholar]
  15. International Energy Agency (IEA). World Energy Outlook 2021-Emerging Economies Building Sector Data; IEA: Paris, France, 2021. [Google Scholar]
  16. International Energy Agency (IEA). World Energy Outlook 2022: Building Sector Projections; IEA: Paris, France, 2022. [Google Scholar]
  17. European Environment Agency (EEA). Progress Towards Nearly Zero-Energy Buildings (nZEB) in Europe; EEA: Copenhagen, Denmark, 2021. [Google Scholar]
  18. U.S. Green Building Council (USGBC). LEED v4.1 Building Design and Construction Reference Guide; USGBC: Washington, DC, USA, 2021. [Google Scholar]
  19. UK Green Building Council (UKGBC). Net Zero Carbon Buildings Framework; UKGBC: London, UK, 2020. [Google Scholar]
  20. PAS 2080:2020; Carbon Management in Infrastructure. British Standards Institution: London, UK, 2020.
  21. Department for Levelling Up, Housing and Communities (DLUHC). The Future Homes and Buildings Standard: Government Response to the Future Homes Standard Consultation; UK Government: London, UK, 2021.
  22. European Commission. A Renovation Wave for Europe-Greening Our Buildings, Creating Jobs, Improving Lives; COM(2020) 662 final; European Commission: Brussels, Belgium, 2020. [Google Scholar]
  23. European Environment Agency (EEA). Trends in Energy Use and Carbon Emissions from the EU Building Sector; EEA: Copenhagen, Denmark, 2022. [Google Scholar]
  24. U.S. Green Building Council (USGBC). LEED v4.1 for Building Design and Construction; USGBC: Washington, DC, USA, 2023. [Google Scholar]
  25. U.S. Environmental Protection Agency (EPA). Inventory of U.S. Greenhouse Gas Emissions and Sinks: Building Sector Trends; EPA: Washington, DC, USA, 2021. [Google Scholar]
  26. Building Transparency. EC3 (Embodied Carbon in Construction Calculator). Available online: https://www.buildingtransparency.org/tools/ec3/ (accessed on 4 May 2026).
  27. London Energy Transformation Initiative (LETI). Net-Zero Operational & Embodied Carbon Design Guidance; LETI: London, UK, 2021. [Google Scholar]
  28. International Finance Corporation (IFC). Green Buildings: A Finance and Market Perspective for Emerging Markets; IFC: Washington, DC, USA, 2020. [Google Scholar]
  29. International Finance Corporation (IFC). Green Buildings Market Intelligence and Climate Finance Opportunities; IFC: Washington, DC, USA, 2023. [Google Scholar]
  30. Pomponi, F.; Moncaster, A.M. Embodied Carbon Mitigation and Reduction in the Built Environment-What Does the Evidence Say? J. Environ. Manag. 2016, 181, 687–700. [Google Scholar] [CrossRef] [PubMed]
  31. Cabeza, L.F.; Rincón, L.; Vilariño, V.; Pérez, G.; Castell, A. Life Cycle Assessment (LCA) and Life Cycle Energy Analysis (LCEA) of Buildings and the Building Sector: A Review. Renew. Sustain. Energy Rev. 2014, 29, 394–416. [Google Scholar] [CrossRef]
  32. EN 15978:2011; Sustainability of Construction Works-Assessment of Environmental Performance of Buildings-Calculation Method. European Committee for Standardization: Brussels, Belgium, 2011.
  33. Greenhouse Gas Protocol. Corporate Value Chain (Scope 3) Accounting and Reporting Standard; World Resources Institute and World Business Council for Sustainable Development: Washington, DC, USA, 2011. [Google Scholar]
  34. RMI. Decarbonizing Buildings: Reducing Operational and Embodied Carbon; Rocky Mountain Institute: Basalt, CO, USA, 2021. [Google Scholar]
  35. Hammond, G.; Jones, C. Inventory of Carbon & Energy (ICE); Version 3.0; University of Bath: Bath, UK, 2019. [Google Scholar]
  36. Lessard, J.-M.; Habert, G.; Tagnit-Hamou, A.; Ben Amor, B. Unintended Consequences of the Global Reduction in Clinker-to-Cement Ratio. In Proceedings of the 11th ACI/RILEM International Conference on Cementitious Materials and Alternative Binders for Sustainable Concrete, Virtual, 7–10 June 2021; Volume SP-349, pp. 394–407. [Google Scholar] [CrossRef]
  37. Wang, H.; Zhang, Y.; Gao, W.; Kuroki, S. Life Cycle Environmental and Cost Performance of Prefabricated Buildings. Sustainability 2020, 12, 2609. [Google Scholar] [CrossRef]
  38. Ryan, N.A.; Miller, S.A.; Skerlos, S.J.; Cooper, D.R. Reducing CO2 Emissions from U.S. Steel Consumption by 70% by 2050. Environ. Sci. Technol. 2020, 54, 14598–14608. [Google Scholar] [CrossRef] [PubMed]
  39. Puettmann, M.; Wilson, J. Life-Cycle Carbon of Wood Products: An Overview. Wood Fiber Sci. 2005, 37, 18–29. [Google Scholar]
  40. Teng, Y.; Li, K.; Pan, W.; Ng, T. Reducing Building Life Cycle Carbon Emissions through Prefabrication: Evidence from and Gaps in Empirical Studies. Build. Environ. 2018, 132, 125–136. [Google Scholar] [CrossRef]
  41. Jaillon, L.; Poon, C.S.; Chiang, Y.H. Quantifying Waste Reduction Potential of Prefabrication in Building Construction. Waste Manag. 2009, 29, 309–320. [Google Scholar] [PubMed]
  42. Wernet, G.; Bauer, C.; Steubing, B.; Reinhard, J.; Moreno-Ruiz, E.; Weidema, B. The Ecoinvent Database Version 3 (Part I): Overview and Methodology. Int. J. Life Cycle Assess. 2016, 21, 1218–1230. [Google Scholar] [CrossRef]
  43. ISO 14064-1:2018; Greenhouse Gases-Part 1: Specification with Guidance at the Organization Level for Quantification and Reporting of Greenhouse Gas Emissions and Removals. ISO: Geneva, Switzerland, 2018.
  44. International Energy Agency (IEA). The Future of Cooling: Opportunities for Energy-Efficient Air Conditioning; IEA: Paris, France, 2022. [Google Scholar]
  45. U.S. Department of Energy (DOE). High-Performance HVAC Equipment Guide; Building Technologies Office, U.S. Department of Energy: Washington, DC, USA, 2020.
  46. O’Donnell, J.; Maile, T.; Bazjanac, V. Improving Building HVAC Energy Efficiency: A Review of Advanced Control Strategies. Energy Build. 2020, 223, 110005. [Google Scholar]
  47. Tan, Z.; Low, S.P. Smart Building Energy Management in Singapore: Integration of Digital Platforms with Green Certification. Energy Build. 2022, 266, 112123. [Google Scholar]
  48. Building and Construction Authority (BCA). Green Mark Certification Scheme. Available online: https://www1.bca.gov.sg/sustainability/greenmark/ (accessed on 19 June 2026).
  49. Building and Construction Authority (BCA). Singapore Green Building Masterplan and Green Mark Certification Scheme; BCA: Singapore, 2022. [Google Scholar]
  50. National Environment Agency (NEA). Carbon Pricing (Amendment) Act 2022 and Implementation of International Carbon Credits (ICCs); NEA: Singapore, 2023. [Google Scholar]
  51. Fouché, C.; Crawford, R.H. Uncertainty in Life-Cycle Carbon Assessment of Building Materials: Sources and Mitigation Strategies. Build. Environ. 2022, 210, 108722. [Google Scholar]
  52. China Building Energy-Efficiency Association (CBEEA). China Building Energy-Efficiency and Low-Carbon Development Report; CBEEA: Beijing, China, 2022. [Google Scholar]
  53. Habert, G.; Miller, S.A.; John, V.M.; Provis, J.L.; Favier, A.; Horvath, A.; Scrivener, K.L. Environmental Impacts and Decarbonization Strategies in the Cement and Concrete Industries. Nat. Rev. Earth Environ. 2020, 1, 559–573. [Google Scholar] [CrossRef]
  54. RICS (Royal Institution of Chartered Surveyors). Whole Life Carbon Assessment for the Built Environment; RICS: London, UK, 2021. [Google Scholar]
  55. RICS (Royal Institution of Chartered Surveyors). Whole Life Carbon Assessment for the Built Environment; RICS: London, UK, 2017. [Google Scholar]
Figure 1. PRISMA-style flow diagram for the updated literature screening process.
Buildings 16 02725 g001
Figure 2. Building life cycle according to EN 15978:2011 standard [32].
Buildings 16 02725 g002
Figure 3. Smart building IoT system integrating environmental monitoring, energy management, and occupant-centric controls.
Buildings 16 02725 g003
Table 1. Contribution of buildings to GHG emissions across selected regions [9,10,11,12,13,14,15,16].
RegionBuilding Sector Share of National GHG (%)Operational Carbon DominanceEmbodied Carbon ShareSource/Estimates
Europe (EU-27)~36% of CO2; 40% of energy consumptionHistorically dominant; efficiency gains reducing share20–30% of new buildsEEA (2022) [9]
United States~29% of total national emissionsHVAC, lighting major driversGrowing focus on procurementEPA (2021) [10]
United Kingdom~25% direct, but up to 50% in new builds if embodied carbon is includedOperational carbon declining40–50% embodied in new buildsUKGBC (2020) [11]
China~46% of national energy use; ~50% of CO2 emissionsBoth heating/cooling and appliance loads risingCement/steel dominate embodied carbonCBECA (2022) [12]
Emerging Markets (avg)35–45% projected in 2030Still largely operational focusEmbodied rising with urbanizationIEA/UNEP (2020–2022) [13,14,15,16]
Table 2. Author synthesis of representative policy frameworks in different regions based on regional policy and market sources [12,15,17,18,19,20,21,22,23,24,25,26,27,28,29].
RegionKey Policy/StandardMain Focus AreaQuantitative Target/BenchmarkRemarks
EuropeEPBD; Renovation Wave/EU life-cycle carbon policy agenda [17,22,23]Nearly zero-energy buildings; life-cycle carbon disclosureAll new buildings will be nearly zero-energy from 2020; full decarbonization by 2050Mandatory across the EU; embodied-carbon disclosure expectations are expanding in some states
United StatesLEED certification; Buy Clean California Act; NYC Local Law 97 [18,24,25,26]Market-driven certification; embodied carbon procurement; operational capsLEED: 25–30% operational-energy savings vs. baseline; LL97: emissions caps of 0.00453 tCO2/ft2Fragmented by state; strong corporate uptake
United KingdomNet Zero Carbon Buildings Framework; PAS 2080; Future Homes Standard; LETI guidance [19,20,21,27]Whole-life carbon management; residential net-zero readinessNew homes 75–80% less CO2 than 2020 levels by 2025Clear “cradle-to-grave” accountability
ChinaGBES; national building-energy-efficiency reporting [12]Energy-efficiency, renewable integration, digital monitoring>6.6 billion m2 certified by 2022Still high reliance on carbon-intensive materials
Emerging MarketsIFC EDGE and related green-building finance initiatives [28,29]Affordable efficiency, technical assistance, and climate-finance supportBuilding energy demand projected to rise 50% by 2040 [15]Requires major climate investment and capacity building [28,29]
Table 3. Scope 1–3 Emissions in the building life cycle: definitions, boundaries, and typical activities.
Scope 1 (Direct)Scope 2 (Indirect)Scope 3 (Indirect)
DefinitionDirect GHG emissions from sources within the building boundary that are owned or controlled by the entity (e.g., boilers, generators, on-site fuel use).Indirect GHG emissions from the consumption of purchased energy (e.g., electricity, district heating/cooling) that is imported into the building boundary.Other indirect GHG emissions that occur as a consequence of building operations but from sources not owned or controlled by the entity (e.g., embodied carbon in materials, tenant activities, waste, commuting, and supply chain impacts).
Phase of the production cycleDuring building operation (e.g., heating, cooling, on-site fuel combustion).During building operation (e.g., electricity or steam purchased for HVAC, lighting, lifts, appliances).Both upstream (e.g., material production, transport to site, construction) and downstream (e.g., tenant use, demolition, waste disposal, recycling).
ActivitiesOn-site combustion of natural gas, diesel, or other fuels in boilers, furnaces, or generators; fugitive emissions from refrigerants (HVAC systems); direct emissions from building-owned vehicles.Purchased electricity for lighting, HVAC, elevators, office equipment, and district heating/cooling; imported chilled water or steam.Embodied carbon of construction materials (cement, steel, glass); transportation of materials and waste; tenant electricity consumption if sub-metered; employee commuting; outsourced services; water supply and wastewater treatment; end-of-life demolition and disposal impacts.
Table 4. Typical contribution of embodied and operational carbon in different building types.
Building TypeEmbodied Carbon Contribution (%)Operational Carbon Contribution (%)Data Source
Standard Residential Building20–40%60–80%RMI, 2021 [34]
Low-Energy Residential50–70%30–50%Pomponi & Moncaster, 2016 [30]
Commercial Office Building30–50%50–70%UNEP, 2020 [14]
Infrastructure (e.g., Bridge)80–90%10–20%UNEP, 2020 [14]
Table 5. Greenhouse gas emissions from selected construction materials [35,36].
MaterialApprox. CO2 Emissions (kg per kg)Remarks
Cement0.93Driven by calcination and fuel combustion
Steel1.85Highly energy-intensive; opportunities for recycling
Brickwork0.17–0.45 per brickVaries by production method
Timber0.15–0.25Lower footprint; potential carbon storage
Table 6. Representative lower-carbon material pathways relevant to reuse and recycled-content strategies [36,38,39].
Material PathwayTypical Carbon ImplicationConventional BenchmarkMain Takeaway
Lower-clinker concrete/cement [36]Lower than conventional high-clinker cement mixesPortland-cement-dominant baselineImportant because concrete is used at very large volumes
Steel recycling [38]Substantially lower than primary steel productionVirgin steel production routeHigh reduction potential where scrap and electric-arc routes are available
Timber reuse [39]Generally lower than manufacturing new timber productsVirgin timber product baselineBenefits depend on durability, transport, and end-use compatibility
Table 7. Author synthesis of a building energy monitoring and carbon credit market pathway for Singapore.
PhaseKey Success FactorsSource/Person to ReachInformation/Documentation to Provide
Phase 1. Building Energy Monitoring Platform Readiness
Platform Design and ScalabilityUser-friendly, scalable, and secure platform
- IoT and AI integration
Tech providers (e.g., software vendors, IoT suppliers)
- Cybersecurity consultants
Platform architecture plan
- Vendor proposals
- IoT integration guides
Pilot ProjectsDiverse building types for pilots
- Effective stakeholder engagement
Building owners
- Facility managers
- Energy consultants
Project proposals
- Incentive structure
- Pilot feedback forms
Stakeholder Buy-InClear ROI demonstration
- Effective communication
Building owners
- Industry associations (e.g., Singapore Green Building Council)
Case studies
- Cost–benefit analysis
- Marketing materials
Data Privacy and SecurityTransparent data usage policies
- Strong cybersecurity measures
Legal advisors
- Data protection specialists
Data privacy policy
- Cybersecurity compliance documentation
Phase 2. Validation and Verification Framework
Pre-Implementation ValidationStandardized baseline determination
- Clear alignment with standards
Accredited energy auditors
- Industry regulators (e.g., NEA)
Energy baseline methodology
- Simulation models
Post-Implementation VerificationReliable and automated V&V process
- Third-party audits
V&V experts
- Energy performance monitoring firms
V&V framework documentation
- Audit reports
Framework IntegrationSeamless integration into the platform
- Minimal manual intervention
Platform developers
- Workflow optimization specialists
Integration guidelines
- Operational workflows
Phase 3. Carbon Credit Conversion and Accreditation
Engagement with Accreditation BodiesAdherence to Verra VCS and local accreditation requirements
- Transparent process
Verra VCS
- National Environment Agency (NEA)
- Other accrediting bodies
Carbon credit methodology
- Accreditation application and progress reports
Cost ManagementMinimizing accreditation costs
- Financial support mechanisms
Financial planners
- Grant providers (e.g., Enterprise Singapore)
Detailed cost estimates
- Grant applications
Carbon Credit CalculationAccuracy and compliance with standards
- Automated calculations
Platform developers
- Verification experts
Calculation algorithms
- Verification guidelines
Phase 4. Market Development for Carbon Credits
Marketplace DesignTransparent and secure trading platform
- Smart contracts for transactions
Blockchain developers
- Financial technology consultants
Platform design documents
- Legal compliance guidelines
Stakeholder EngagementActive participation of buyers and sellers
- Effective education and outreach
Building owners
- Corporations and green investors
- Marketing agencies
Educational materials
- Market analysis reports
- Case studies
Marketing and OutreachStrong partnerships with key stakeholders
- Visibility at global sustainability forums
Industry associations
- Sustainability event organizers (e.g., GRESB, COP meetings)
Marketing strategies
- Partnership proposals
Phase 5. Integration and Continuous Improvement
Feedback LoopsRegular engagement with users
- Integration of stakeholder feedback
Platform users (building owners, facility managers)
- Industry experts
Feedback collection surveys
- Quarterly performance reports
Policy AlignmentSupportive regulatory framework
- Incentives for adoption
Policymakers (e.g., Ministry of Sustainability and Environment)
- NEA
Policy proposals
- Legislative recommendations
Global OutreachInternational recognition
- Expansion to other markets
International carbon market bodies
- ASEAN sustainability forums
Accreditation documentation
- Expansion strategies
Table 9. ASEAN localization framework for Singapore’s digital carbon governance pathway.
Readiness TierTypical ConditionsSuitable Entry PointFinancing and Capacity Needs
Tier 1: High-readiness marketsStrong digital infrastructure, mature building codes, established green-building certification, and emerging carbon-market rules.Full-digital MRV pilots, EPD-based procurement, and carbon credit integration.Green bonds, transition finance, private-sector ESCO models, and verifier training.
Tier 2: Middle-readiness marketsGrowing urban construction, partial building-code enforcement, improving utility data, and limited carbon-market infrastructure.Energy-efficiency MRV, public-building pilots, basic material-carbon disclosure, and phased Green Mark/EDGE-type certification.Blended finance, public-sector procurement support, multilateral technical assistance, and auditor-capacity building.
Tier 3: Low-readiness marketsLimited digital infrastructure, weak enforcement, high capital constraints, and incomplete material/emissions data.Low-cost efficiency standards, simplified reporting templates, priority retrofits, and donor-supported public-building pilots.Grants, concessional loans, MDB support, capacity building, and regional shared EPD/MRV infrastructure.
Disclaimer/Publisher’s Note: The statements, opinions and data contained in all publications are solely those of the individual author(s) and contributor(s) and not of MDPI and/or the editor(s). MDPI and/or the editor(s) disclaim responsibility for any injury to people or property resulting from any ideas, methods, instructions or products referred to in the content.