Article

Impact of Near-Fault Rupture Directivity on the Seismic Performance of Existing Reinforced Concrete Buildings: A Probabilistic Seismic Hazard Analysis-Based Nonlinear Assessment

Department of Civil Engineering, Gebze Technical University, Kocaeli 41400, Türkiye
*
Author to whom correspondence should be addressed.
Buildings 2026, 16(14), 2711; https://doi.org/10.3390/buildings16142711
Submission received: 17 June 2026 / Revised: 30 June 2026 / Accepted: 4 July 2026 / Published: 8 July 2026
(This article belongs to the Special Issue Extreme Performance of Composite and Protective Structures)

Abstract

Near-fault ground motions influenced by rupture directivity impose seismic demands that differ fundamentally from those associated with conventional far-field earthquakes, particularly in terms of displacement-controlled response. This study presents a performance-based seismic assessment of existing reinforced concrete (RC) buildings subjected to near-fault ground motions in the Sivrice–Pütürge segment of the Malatya–Ovacık Fault Zone, Eastern Anatolia. A probabilistic seismic hazard analysis (PSHA) was performed using NGA-West2 ground-motion prediction equations together with a regionally defined fault model, and the resulting hazard was evaluated within the framework of the Turkish Building Earthquake Code (TBEC-2018). Code-compatible earthquake records were selected and scaled for the DD-2 design earthquake level, while rupture directivity was represented using a literature-based median amplification factor. Nonlinear time-history analyses were subsequently carried out for three existing RC buildings representing low-, mid-, and high-rise structural typologies. Structural performance was evaluated in terms of roof displacement, interstory drift ratio, base shear, and element-level damage states. The maximum roof displacements reached 0.070 m, 0.107 m, and 0.138 m for the low-, mid-, and high-rise buildings, respectively, corresponding to maximum drift ratios of 0.60%, 0.46%, and 0.34%. The results indicate that rupture directivity has only a limited influence on base shear demand but substantially increases displacement-related response quantities and promotes a redistribution of structural damage from predominantly beam-controlled behavior toward increased participation of columns and shear walls, particularly in medium- and high-rise buildings. These findings demonstrate that conventional code-based assessment procedures may underestimate deformation demands in fault-proximal regions and highlight the importance of explicitly considering rupture directivity in the seismic performance assessment of existing reinforced concrete buildings.

1. Introduction

Near-fault earthquakes represent one of the most critical challenges in performance-based seismic assessment due to their distinctive ground motion characteristics, which substantially differ from far-field seismic excitations. In particular, rupture directivity effects lead to the concentration of seismic energy in the direction of fault propagation, producing high-amplitude, short-duration velocity pulses that impose severe displacement and ductility demands on structures located close to active fault zones [1,2]. These pulse-like ground motions have been repeatedly shown to be especially detrimental to medium- and long-period structures, where resonance between the structural fundamental period and the velocity pulse period may occur.
Turkey is situated within the highly active Alp–Himalayan seismic belt and is dominated by major strike-slip fault systems, notably the North Anatolian Fault Zone (NAFZ) and the East Anatolian Fault Zone (EAFZ). In addition to these primary tectonic features, secondary fault systems such as the Malatya–Ovacık Fault Zone (MOFZ) pose a significant seismic threat to densely populated urban areas in Eastern Anatolia. Geological and paleoseismological investigations indicate that the MOFZ exhibits long-term slip rates on the order of 1.0–1.5 mm/year and has generated several large-magnitude earthquakes throughout its seismic history, implying substantial seismic potential despite relatively long recurrence intervals [3,4].
From a seismic hazard perspective, the accurate representation of both source characteristics and site conditions is essential for reliable structural performance evaluation. Probabilistic Seismic Hazard Analysis (PSHA) provides a rational framework for integrating uncertainties related to earthquake magnitude, recurrence, source-to-site distance, and ground motion variability [5]. Modern PSHA implementations commonly employ Ground Motion Prediction Equations (GMPEs) derived from large global databases, such as the NGA-West2 models developed by [6,7,8,9]. These models explicitly account for key parameters including moment magnitude, rupture distance, fault mechanism, and local site conditions expressed through the average shear-wave velocity in the upper 30 m (Vs,30), as originally formalized by [10].
Several studies have demonstrated that GMPE-based hazard estimates can be significantly modified in near-fault regions by rupture directivity effects, particularly at medium-to-long vibration periods. Moghimi and Akkar [11] quantified period-dependent amplification ratios associated with rupture directivity and reported that spectral accelerations at periods of approximately 3–5 s may increase by more than 40%, depending on fault geometry and rupture characteristics. Likewise, Vassiliou and Makris [12] showed that pulse-like ground motions substantially increase inelastic deformation demands, especially for structures whose fundamental periods are compatible with the dominant pulse period. These findings have motivated extensive research on the nonlinear seismic response of reinforced concrete (RC) buildings subjected to near-fault earthquakes.
Recent studies have increasingly focused on the seismic performance of RC buildings under near-fault ground motions. Daei et al. [13] demonstrated that pulse-like ground motions generate considerably higher deformation demands than non-pulse-like records, particularly in moment-resisting frame buildings. Taslimi and Tehranizadeh [14] investigated the influence of vertical near-field motions on the collapse risk of high-rise RC frame-core wall structures, while Basefat et al. [15] performed probabilistic seismic performance assessments of tall RC buildings equipped with buckling-restrained braces under near-field excitations. Torghabeh et al. [16] further highlighted the significant influence of soil–structure interaction on the collapse probability of high-rise RC buildings subjected to near-fault earthquakes. Kenawy et al. [17,18] demonstrated that both the characteristics of near-fault ground motions and the adopted record-selection strategy substantially influence nonlinear structural response and seismic risk evaluation.
Performance-based seismic assessment and fragility analysis of RC buildings have also received considerable attention in recent years. Zucconi et al. [19] investigated the influence of bidirectional ground motions on the fragility of existing RC buildings, while Pinzón et al. [20] examined the relationship between engineering demand parameters and seismic intensity measures using nonlinear time-history analyses. Recent studies by Aljawhari et al. [21], Abeysiriwardena et al. [22], Nagarajan et al. [23], and Sharma et al. [24] further expanded seismic risk assessment methodologies by integrating fragility functions, repair consequences, cumulative damage indices, and displacement-based seismic evaluation. In addition, Kazemi et al. [25] demonstrated that machine-learning-based approaches can successfully predict the seismic response and performance of reinforced concrete buildings, providing an efficient alternative for large-scale seismic assessment studies.
In Turkey, seismic design and performance evaluation are governed by the Turkish Building Earthquake Code (TBEC-2018) [26], which adopts a spectrum-based approach derived from probabilistic seismic hazard maps prepared by AFAD using NGA-West2 ground-motion prediction equations. While TBEC-2018 provides a comprehensive framework for defining design spectra at different earthquake hazard levels, the treatment of near-fault rupture directivity remains largely implicit and is embedded within the hazard definition rather than explicitly incorporated into ground-motion selection or scaling procedures. Following the 6 February 2023 Kahramanmaraş earthquakes, several studies have emphasized the importance of re-evaluating the seismic performance of Turkish RC buildings located in fault-proximal regions. Öz and Omur [27] evaluated the seismic fragility and code compliance of Turkish RC buildings after the 2023 Kahramanmaraş earthquake sequence, whereas Öztürk and Karan [28] demonstrated the significant influence of near-fault seismic inputs on structural performance using observations from the same earthquake sequence.
Although previous studies have significantly improved the understanding of near-fault structural response, several research gaps remain. Most existing investigations focus on individual aspects such as collapse assessment, fragility analysis, seismic risk evaluation, or isolated building typologies. Comprehensive studies integrating site-specific probabilistic seismic hazard analysis, code-compatible ground-motion selection, rupture directivity amplification, and nonlinear performance evaluation of existing RC buildings with different heights within a unified analytical framework remain limited, particularly for the Eastern Anatolia region. Unlike previous studies, which generally examine individual aspects of near-fault structural response, the present study combines site-specific probabilistic seismic hazard analysis, code-compatible ground-motion selection, rupture directivity modification, and nonlinear time-history analysis of representative existing reinforced concrete buildings with different heights within a single analytical framework. This integrated approach enables a comprehensive evaluation of the influence of rupture directivity on structural response and damage distribution under the current Turkish seismic design framework, thereby providing practical implications for the seismic assessment of existing reinforced concrete buildings in fault-proximal regions.
Within this context, the present study aims to provide a comprehensive performance-based seismic assessment of existing reinforced concrete buildings subjected to near-fault ground motions influenced by rupture directivity. Focusing on the Sivrice–Pütürge segment of the Malatya–Ovacık Fault Zone, the study integrates (i) probabilistic seismic hazard analysis based on regionally applicable GMPEs, (ii) site-specific design spectra developed in accordance with TBEC-2018 [26], (iii) directivity-based modification of selected ground motion records, and (iv) nonlinear time history analyses of low-rise, mid-rise, and high-rise RC buildings. By explicitly comparing structural responses obtained from baseline and directivity-amplified ground motion sets, the study seeks to quantify the extent to which near-fault effects alter displacement demands, interstory drifts, base shear forces, and element-level performance states.
Despite the extensive body of research on near-fault ground motions and rupture directivity, their explicit integration into performance-based seismic assessment of existing reinforced concrete buildings remains limited, particularly within the context of site-specific probabilistic hazard and national code-based frameworks. The primary novelty of this study lies in the systematic coupling of probabilistic seismic hazard analysis, TBEC-2018 [26]-compatible site-specific design spectra, and directivity-modified real earthquake records within a unified nonlinear time history analysis framework. Unlike conventional assessments that implicitly account for near-fault effects through generic design spectra, this study explicitly isolates the influence of rupture directivity by employing paired ground motion sets with and without directivity amplification. Furthermore, the comparative evaluation of low-rise, mid-rise, and high-rise reinforced concrete buildings enables a clear identification of height- and period-dependent vulnerability mechanisms under near-fault excitation. By linking pulse–period compatibility, nonlinear period elongation, and element-level damage redistribution, the study provides new mechanistic insight into why deformation-based performance indicators are systematically underestimated by conventional code-oriented approaches in fault-proximal regions. These contributions offer a refined perspective for seismic performance evaluation of existing reinforced concrete buildings located near active fault systems and provide a transferable assessment framework for similar tectonic environments.

2. Seismotectonic Framework and Near-Fault Directivity Effects

2.1. Regional Seismotectonic Setting of Malatya Province

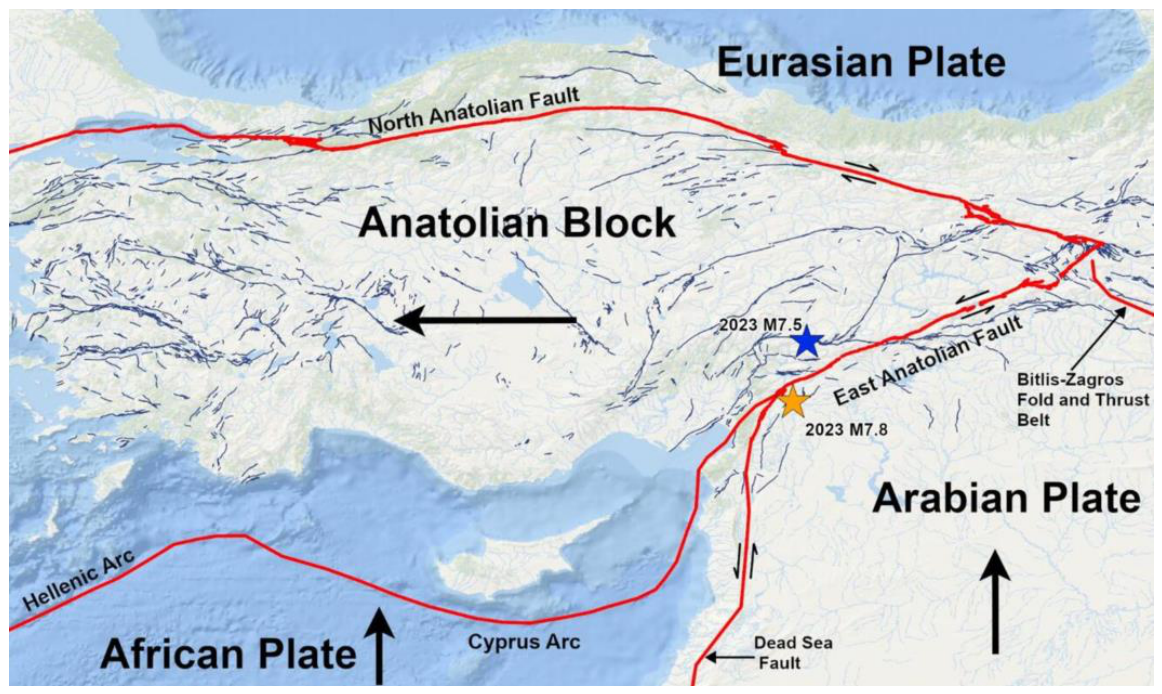
Eastern Anatolia represents one of the most seismically active regions of Turkey due to the ongoing convergence between the Arabian and Eurasian plates and the westward extrusion of the Anatolian plate. This complex tectonic interaction is accommodated primarily by large strike-slip fault systems, most notably the East Anatolian Fault Zone (EAFZ). In addition to these major structures, several secondary fault zones significantly influence regional seismic hazard, among which the Malatya–Ovacık Fault Zone (MOFZ) plays a critical role for Malatya province.
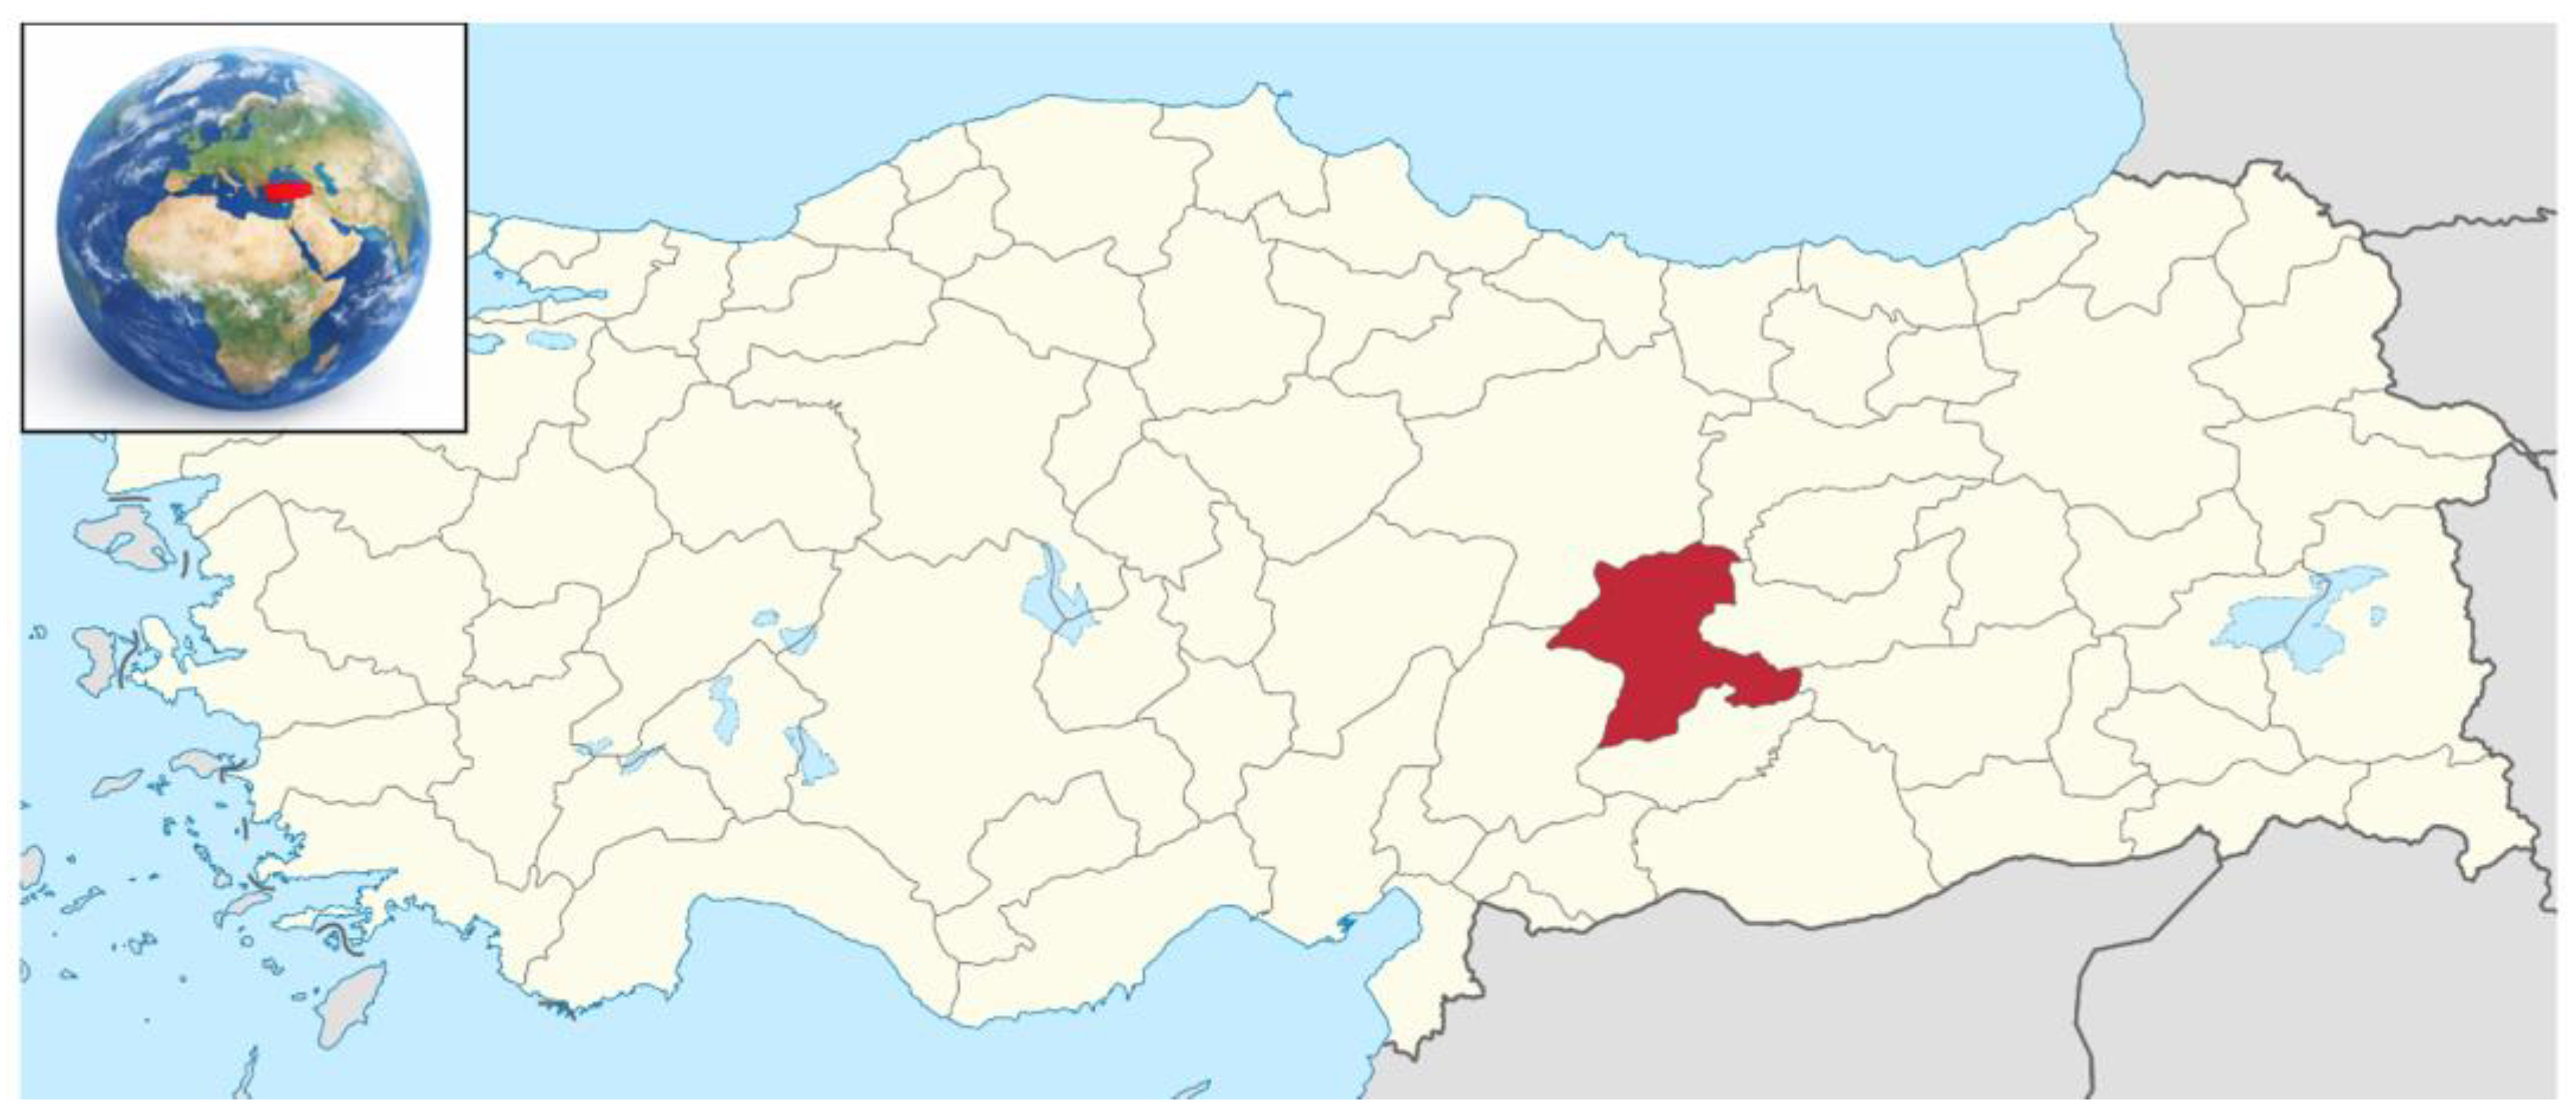
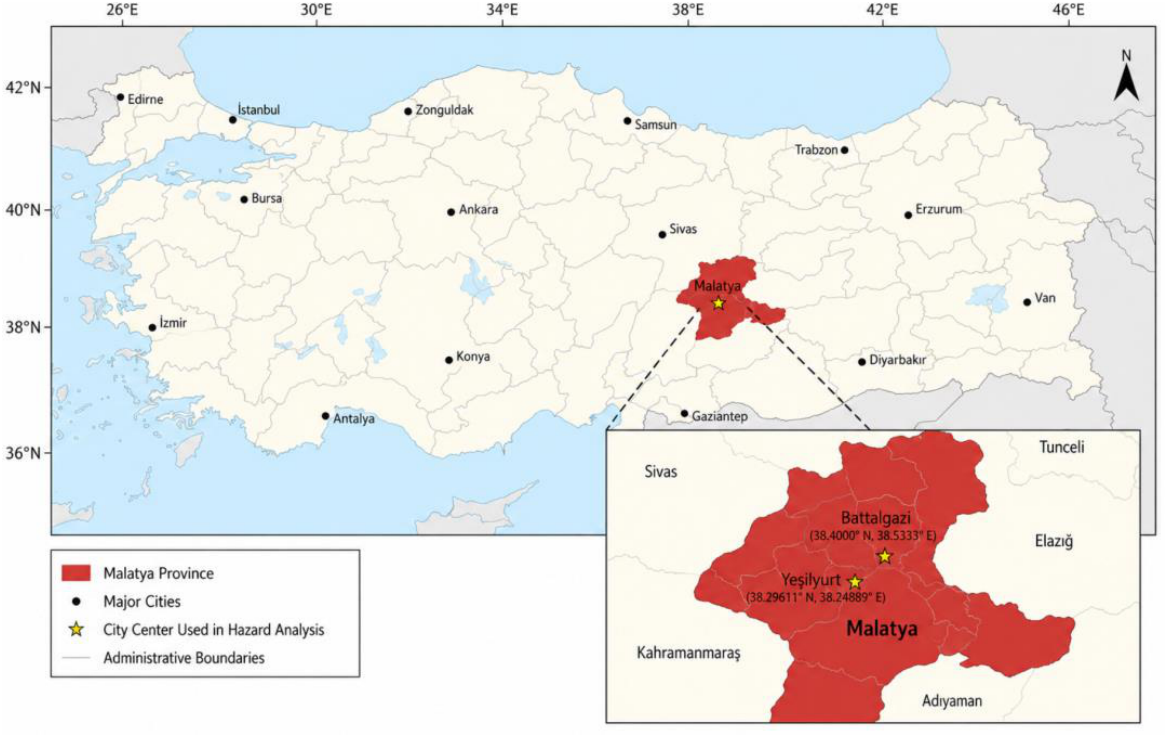
The geographical position of Malatya within the national seismotectonic framework of Turkey, together with its proximity to active fault systems, is illustrated in Figure 1. As shown in this figure, Malatya is located in a region where active strike-slip faulting dominates seismic deformation, making the city particularly vulnerable to strong ground motions generated by nearby seismic sources. Geological and paleoseismological investigations indicate that the MOFZ is an active fault system characterized by long-term tectonic deformation. Slip rate estimates for the fault zone generally range between approximately 1.0 and 1.5 mm/year, indicating a continuous accumulation of strain energy over geological timescales [3,4]. Although these slip rates are lower than those associated with the EAFZ, the long recurrence interval of the MOFZ does not eliminate the possibility of large-magnitude earthquakes, particularly when the fault is considered in a probabilistic seismic hazard framework.

2.2. Near-Fault Characteristics of the Study Area

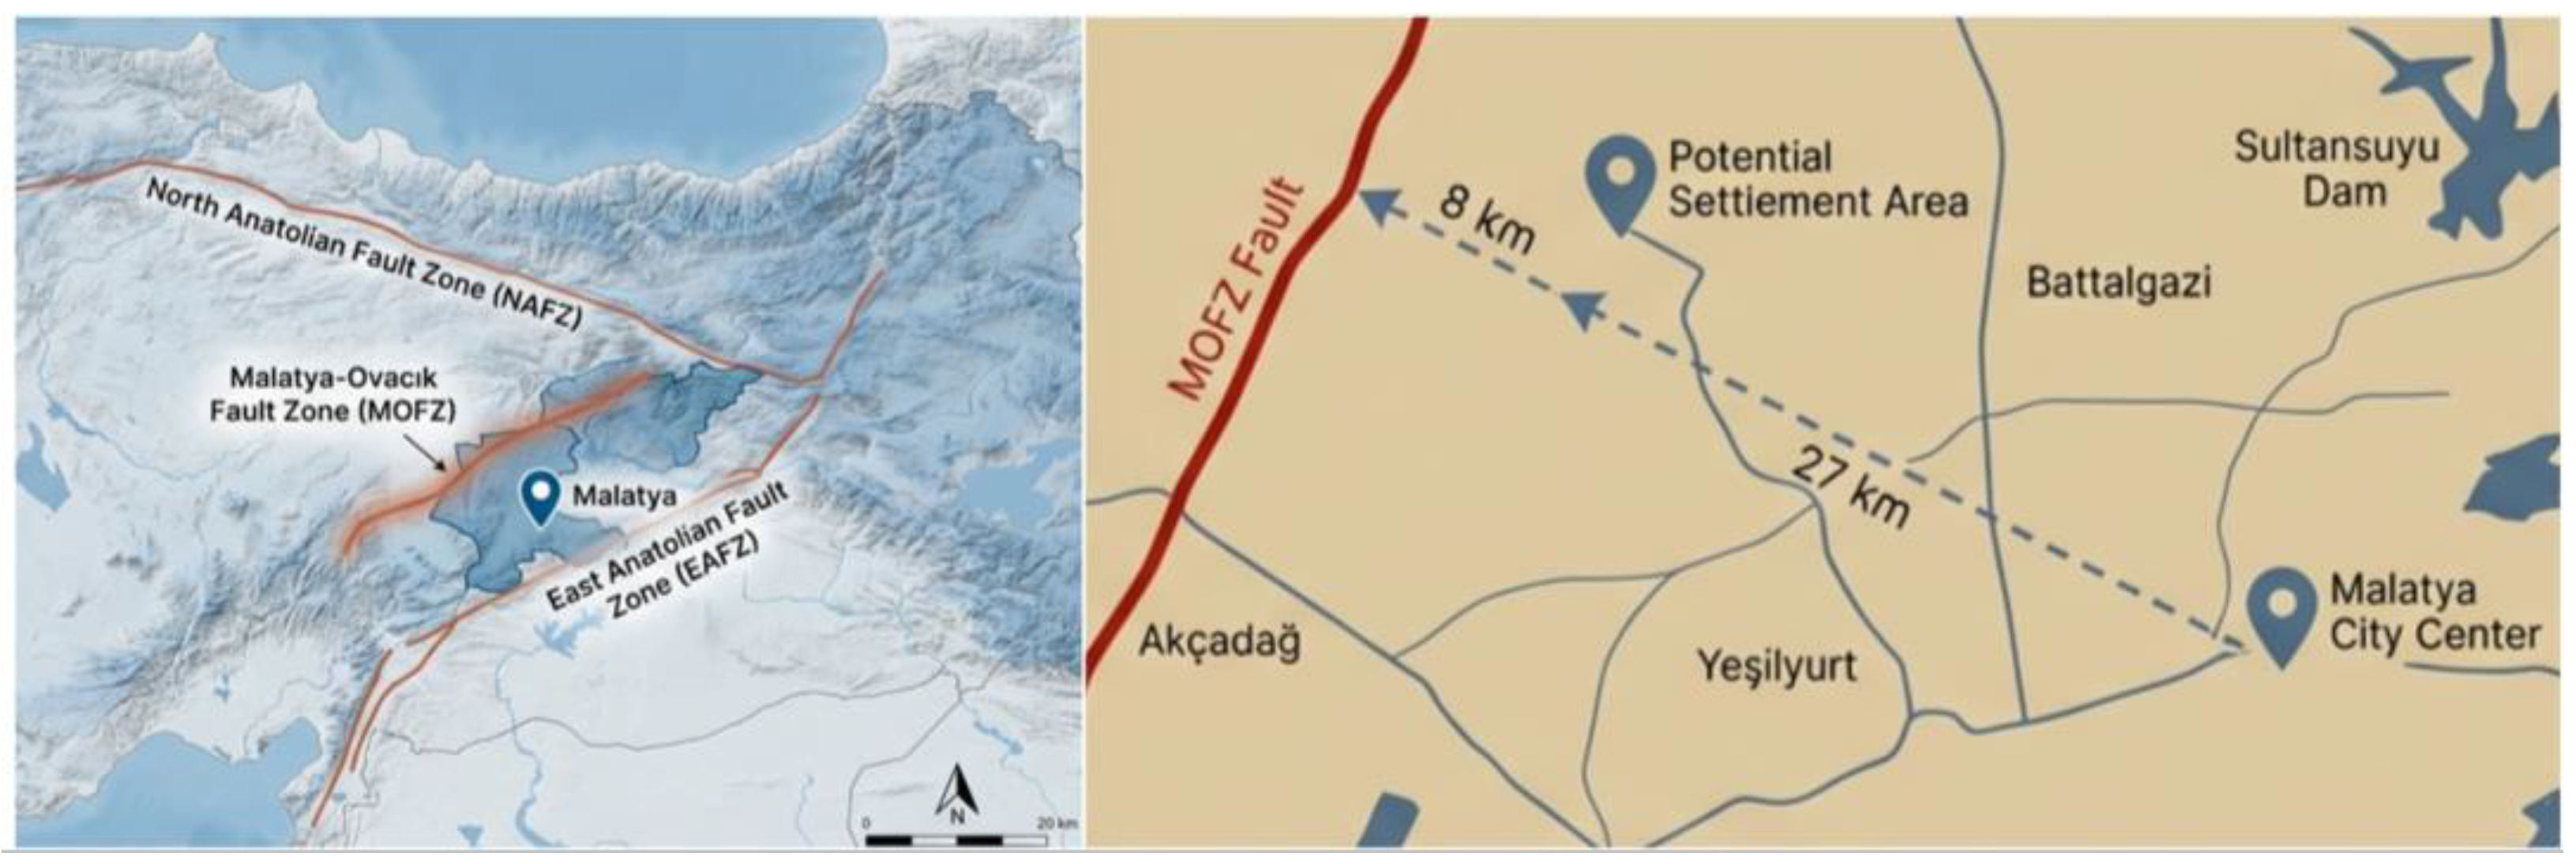
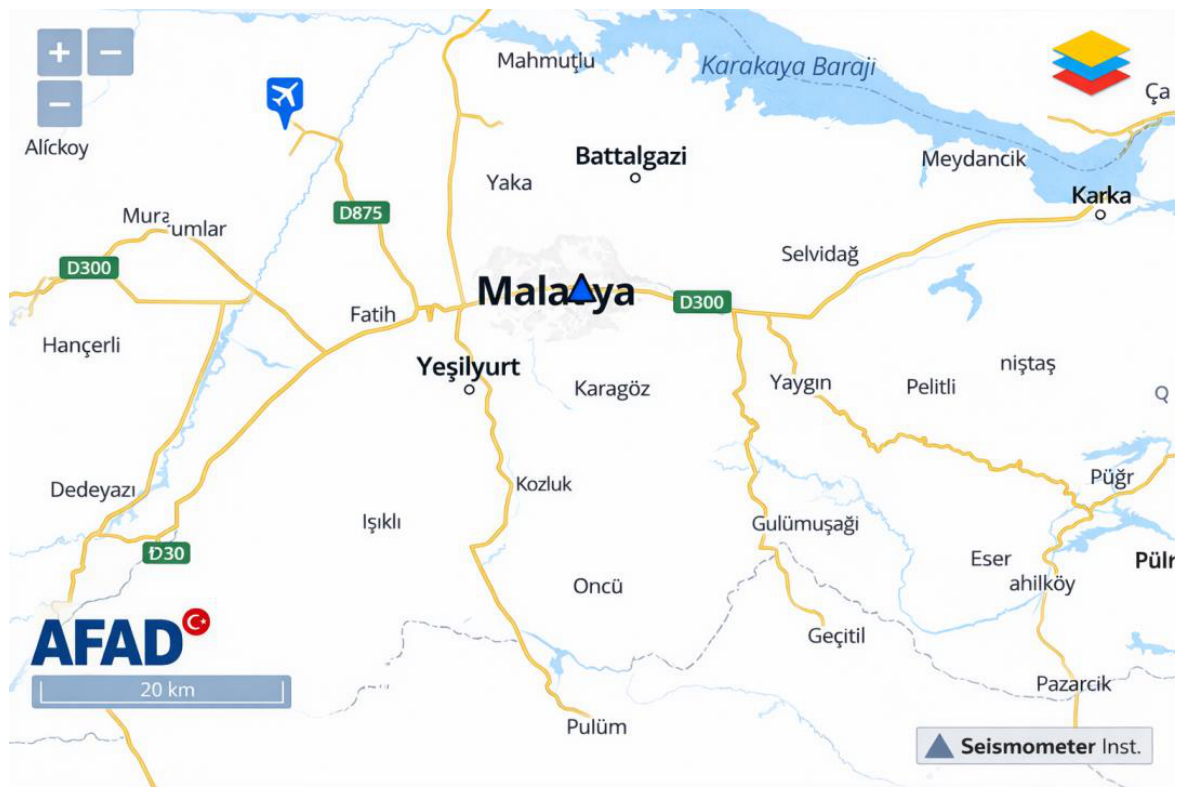
The seismic demand imposed on structures located near active faults is strongly governed by fault geometry, rupture extent, and the relative position of the site with respect to the fault rupture plane. In the present study, the seismic performance of structures located in Malatya city center is hypothetically evaluated under conditions representative of a potential settlement area near Malatya Airport, which lies at a significantly shorter distance from the Sivrice–Pütürge segment of the MOFZ.
The distance between the city center, the potential settlement area, and the nearest fault rupture is quantitatively illustrated in Figure 1 and Figure 2. This figure clearly demonstrates that the airport area is located within the near-fault zone, where rupture directivity effects are expected to significantly influence ground motion characteristics. Distances on the order of a few kilometers place the site well within the region where pulse-like ground motions may dominate the seismic response. Pulse-type near-fault ground motions can be objectively identified and classified using wavelet-based signal decomposition techniques, allowing a clear distinction between pulse-like and non-pulse records [14].
From a seismological perspective, such proximity implies that the finite-fault nature of the seismic source cannot be neglected. Instead, rupture propagation effects, rupture velocity, and fault orientation relative to the site must be explicitly considered in seismic hazard and structural performance assessments.

2.3. Physical Mechanism of Near-Fault Directivity

Near-fault directivity arises from the coherent radiation of seismic energy during fault rupture, particularly when rupture propagates toward a site. In such cases, seismic waves emitted from successive points along the fault arrive at the site within a narrow time window, resulting in constructive interference and the formation of a large-amplitude velocity pulse. Conversely, when rupture propagates away from the site, ground motions generally exhibit lower amplitudes, reduced peak velocities, and longer durations.
From a structural dynamics standpoint, the velocity pulse associated with forward directivity acts as a long-period transient excitation. The severity of the structural response is largely controlled by the relationship between the pulse period (Tp) and the fundamental period of the structure (T1). When TpT1, resonance-like amplification may occur, leading to excessive displacement and rotation demands even in structures designed according to modern seismic codes [1,2].
In strike-slip fault systems such as the MOFZ, the strike-normal component of ground motion is generally more severely affected by directivity than the strike-parallel component. This directional dependence becomes increasingly significant for vibration periods exceeding approximately 0.6 s, corresponding to the fundamental periods of medium- and high-rise reinforced concrete buildings. Consequently, forward-directivity ground motions are characterized by large-amplitude, long-period velocity pulses that concentrate seismic energy within a short duration, thereby substantially increasing displacement-sensitive structural demands [15].

2.4. Quantification of Directivity-Induced Amplification

Several empirical and semi-empirical studies have quantified the amplification effects associated with rupture directivity by examining period-dependent spectral acceleration ratios. Moghimi and Akkar [11] investigated both deterministic and probabilistic seismic scenarios and demonstrated that directivity effects may lead to substantial amplification in spectral accelerations, particularly at long periods.
Reported amplification ratios at a vibration period of 4 s indicate that spectral accelerations may increase by more than 40%, depending on the fault slip rate and seismic hazard level. These findings highlight the pronounced influence of rupture directivity on long-period ground motions and provide a quantitative basis for incorporating directivity effects into structural performance assessments.
Considering the slip rate characteristics of the MOFZ and the regional seismic context, a conservative amplification factor of 13% was adopted in the present study. This value corresponds to the median amplification levels reported for low-to-moderate slip-rate faults and is considered representative of the expected directivity effects for the Sivrice–Pütürge segment.
It should be emphasized that the adopted 13% amplification factor is intended as an engineering approximation of the median directivity-induced increase reported in the literature rather than a complete representation of pulse-like ground motions. Rupture directivity influences multiple characteristics of earthquake records, including pulse period, velocity pulse amplitude, duration, orientation, and spectral shape. The objective of the present study is to isolate the influence of directivity-induced amplification on structural response while maintaining an identical record set for direct comparison. Accordingly, the adopted approach should be interpreted as a simplified engineering methodology rather than a comprehensive simulation of pulse-like near-fault ground motions. Future studies may extend the present framework by employing pulse-classification techniques and explicit pulse-like record selection methods.

2.5. Active Fault Data and Reliability of Seismotectonic Inputs

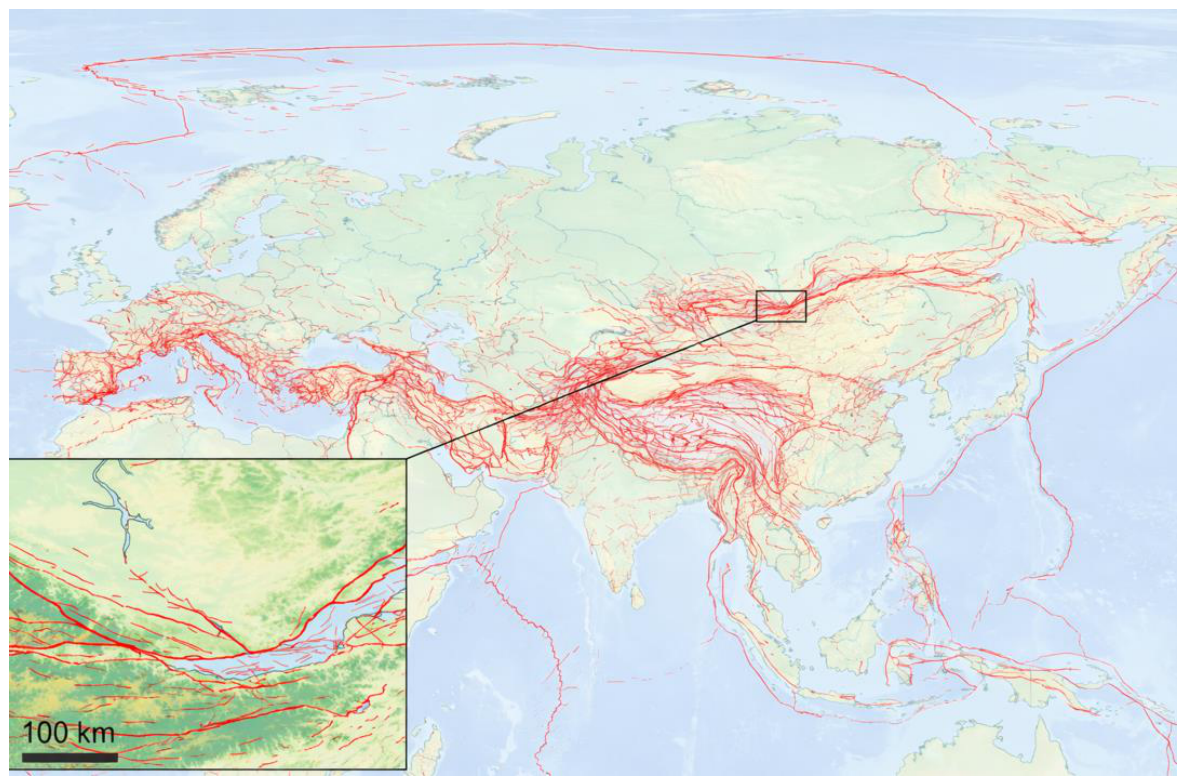
The reliability of seismotectonic inputs is a fundamental requirement for both seismic hazard analysis and performance-based structural assessment. In this study, active fault data were obtained from the Active Faults of Eurasia Database (AFEAD), which provides a comprehensive and systematically classified inventory of active faults across Eurasia.
An overview of the AFEAD database and its spatial resolution is presented in Figure 3, while the confidence levels assigned to active faults across Turkey are illustrated in Figure 4. These classifications reflect the degree of geological, geomorphological, and seismological evidence supporting fault activity.
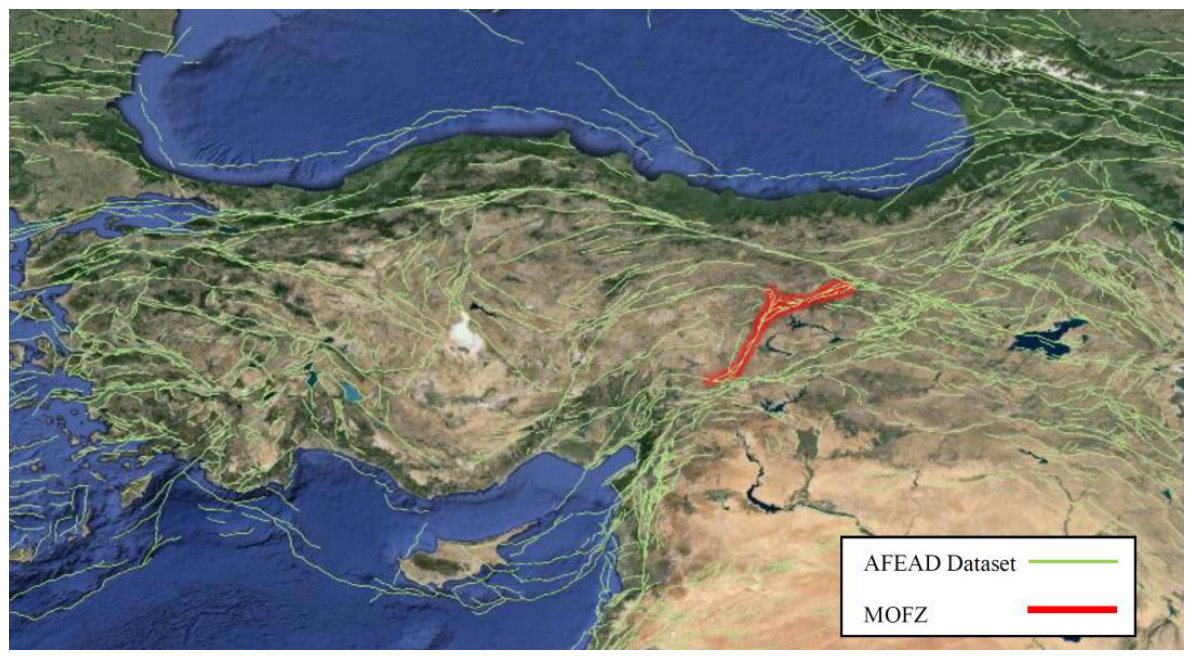
The subset of AFEAD data corresponding to the Malatya–Ovacık Fault Zone, extracted and processed for seismic hazard analysis, is shown in Figure 5. The use of this dataset ensures that fault geometry, activity level, and slip rate information are incorporated into the probabilistic seismic hazard framework with a consistent and transparent methodology.

3. Materials and Methods

The methodological framework adopted in this study consists of five sequential stages: (i) characterization of the regional seismotectonic environment and development of the probabilistic seismic hazard model; (ii) generation of site-specific design spectra and selection of code-compatible ground motions; (iii) incorporation of rupture directivity effects through literature-based amplification factors; (iv) nonlinear modeling of representative low-, medium-, and high-rise reinforced concrete buildings; and (v) nonlinear time-history analyses followed by performance evaluation based on displacement, drift, base shear, and damage-state distributions.

3.1. General Framework of Probabilistic Seismic Hazard Analysis

Probabilistic Seismic Hazard Analysis (PSHA) provides a rational and comprehensive framework for quantifying seismic hazard by explicitly accounting for the uncertainties associated with earthquake magnitude, recurrence, source-to-site distance, and ground motion variability. Unlike deterministic approaches that rely on a limited number of scenario earthquakes, PSHA integrates contributions from all possible seismic sources and earthquake sizes to estimate the probability that a given ground motion parameter will be exceeded within a specified time period.
In this study, PSHA was carried out using the R-CRISIS ver. 20.3.0 software environment by integrating the seismic source model derived from the Active Faults of Eurasia Database (AFEAD), the regional AFAD Earthquake Catalog (1900–2024), and the NGA-West2 ground-motion prediction equations. Earthquake recurrence was represented using the Gutenberg–Richter magnitude–frequency relationship derived from the regional catalog. The objective of the PSHA was to establish a consistent seismic hazard framework for the subsequent nonlinear structural analyses rather than to develop a regional hazard model. Therefore, while the hybrid NGA-West2 implementation available in R-CRISIS was adopted, no independent logic-tree weighting scheme or separate epistemic uncertainty analysis was introduced. These assumptions have now been explicitly stated to improve the transparency and reproducibility of the adopted methodology.

3.2. Seismic Sources

The first step in PSHA involves the definition and spatial modeling of seismic sources. In this study, active fault data were obtained from the Active Faults of Eurasia Database (AFEAD), which provides a comprehensive and systematically classified inventory of active faults across Turkey and surrounding regions.
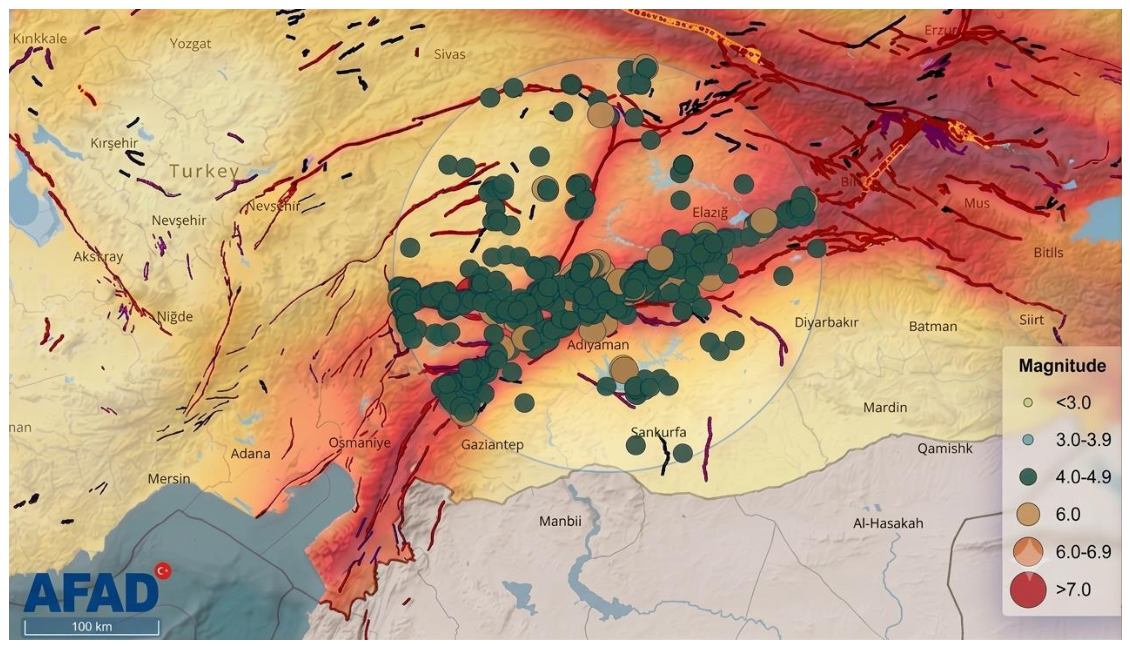
The national-scale distribution of seismic sources and city coordinates used in the hazard analysis is illustrated in Figure 6, while the spatial representation of active faults and earthquake epicenters relative to the 2018 Turkish Seismic Hazard Map is shown in Figure 7. These figures demonstrate that the Malatya region is influenced by both regional-scale fault systems and local fault segments, necessitating a probabilistic treatment of seismic sources.
The AFEAD dataset prepared specifically for Turkey and the extracted Malatya–Ovacık Fault Zone. This dataset includes fault geometry, fault type, slip rate, and confidence level, all of which are essential parameters for seismic source characterization within PSHA.

3.3. Magnitude–Frequency Relationship and Gutenberg–Richter Model

The occurrence rate of earthquakes along a fault system is commonly described using the Gutenberg–Richter magnitude–frequency relationship, which expresses the logarithmic relationship between earthquake magnitude and cumulative occurrence rate. In this study, regional seismicity data were obtained from the AFAD Earthquake Catalog (1900–2024), covering a total of 709 recorded events with magnitudes ranging from Mw 4.0 to Mw 7.6 since 1900.
The Gutenberg–Richter relationship is expressed as
log 10 N M = a b M ,
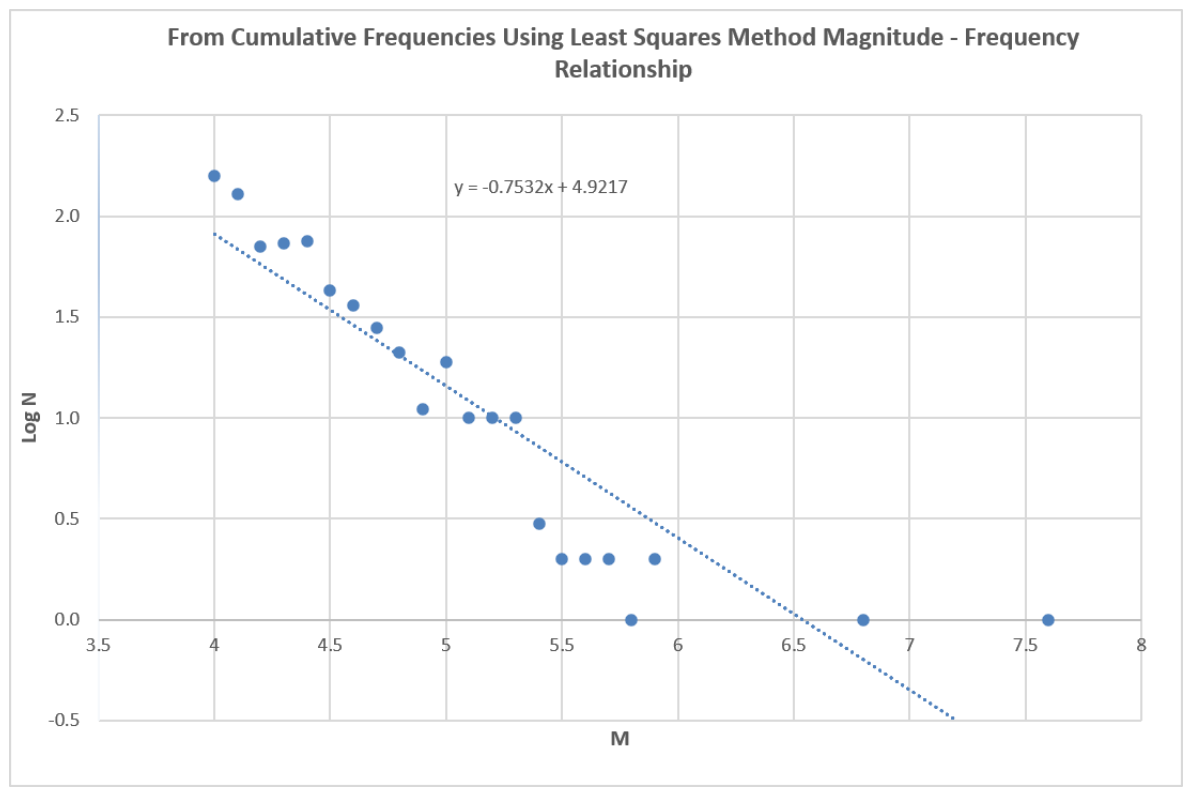
where N(M) denotes the cumulative annual number of earthquakes with magnitude greater than or equal to M, and a and b are empirical regression coefficients. These parameters were estimated using simple linear regression based on the least squares method applied to cumulative earthquake data.
The resulting magnitude–frequency distribution and regression fit are illustrated in Figure 8, which demonstrates a statistically consistent linear trend over the considered magnitude range. This relationship was subsequently used to compute annual exceedance probabilities and recurrence intervals for earthquakes of different magnitudes.
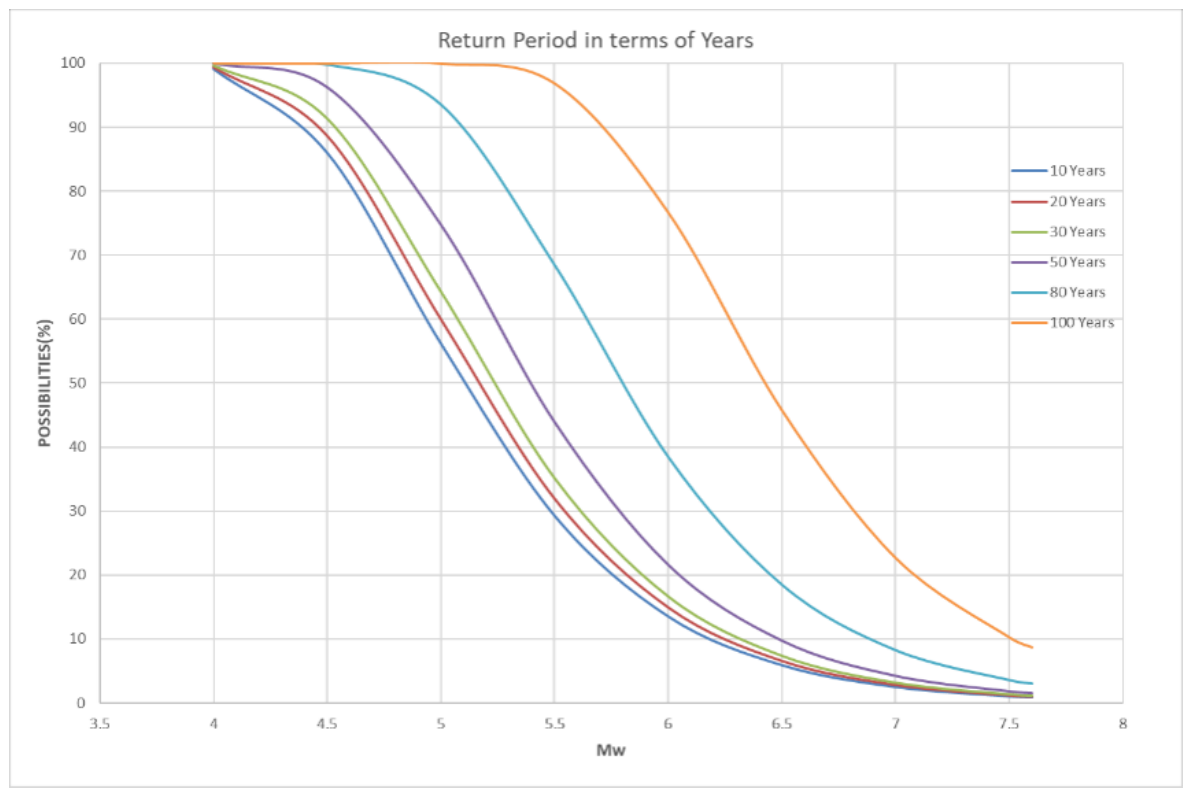
The probability of earthquake occurrence for various magnitudes and return periods ranging from 10 to 100 years is presented in Figure 9. Based on the regional earthquake catalog, Mw 4.5 was adopted as the lower-bound magnitude for the seismicity model used in the probabilistic seismic hazard assessment. This threshold was selected solely to define the recurrence relationship of regional earthquakes and should not be interpreted as the earthquake scenario governing the nonlinear structural analyses. The structural performance assessment was performed using ground motions scaled to the DD-2 design earthquake level in accordance with TBEC-2018 [26], where the seismic demand is controlled by moderate-to-large magnitude earthquakes capable of producing significant near-fault directivity effects.

3.4. Ground Motion Prediction Equations and Regional Applicability

Ground Motion Prediction Equations (GMPEs) are a critical component of PSHA, as they provide estimates of ground motion intensity measures as a function of earthquake magnitude, distance, fault mechanism, and site conditions. In this study, GMPEs developed within the NGA-West2 framework were adopted due to their proven applicability to active crustal regions similar to those in Turkey.
Specifically, the models proposed by [6,7,8,9] were employed. These models explicitly incorporate the effects of moment magnitude, rupture distance, faulting mechanism, and local site conditions through the average shear-wave velocity in the upper 30 m (Vs,30).
The regional applicability of these GMPEs to Turkey was evaluated by comparing the predicted spectral accelerations for a representative Mw 7.0 strike-slip earthquake at a rupture distance of 20 km and a site condition of Vs,30 = 450 m/s. The comparison indicated a high level of consistency among the selected models over the structural period range considered in this study, while also capturing the variability associated with epistemic uncertainty.
A hybrid model combining these GMPEs was subsequently adopted to reduce epistemic uncertainty. The close agreement among the selected models, together with their consistency with observed ground-motion characteristics in Turkey, supports their suitability for use in the present hazard analysis.

3.5. Selection of Spectral Ordinates and Hazard Computation

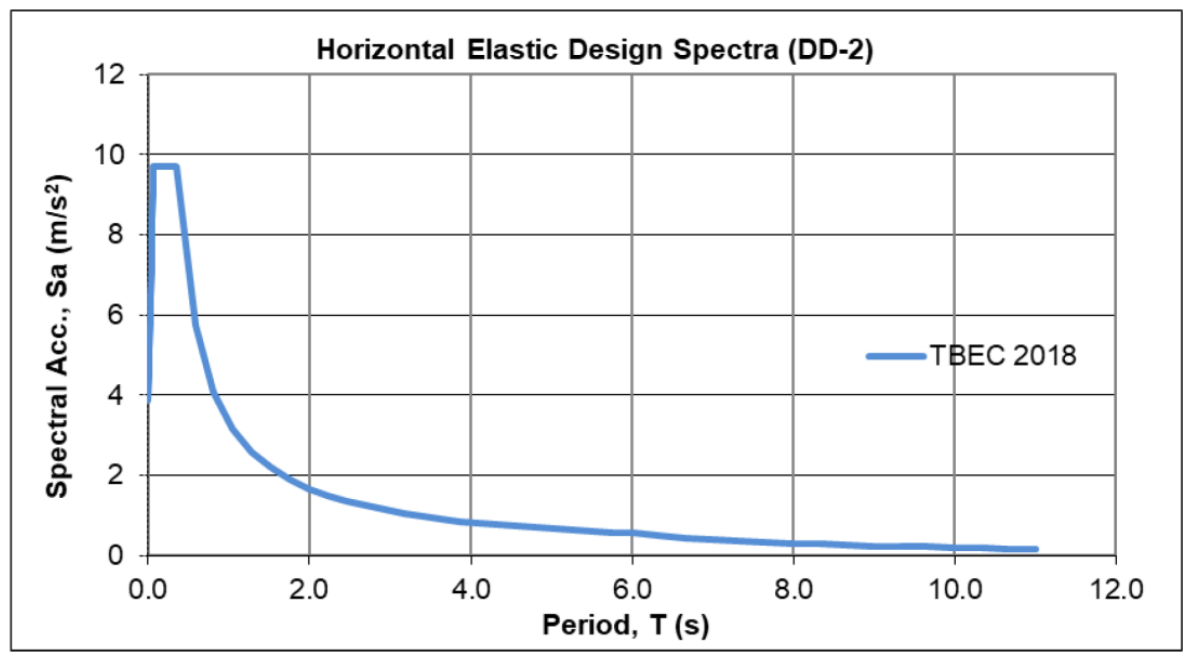
In order to capture the period-dependent response of structures with different dynamic characteristics, spectral accelerations corresponding to the horizontal elastic design spectrum were selected as intensity measures in the PSHA. The horizontal elastic design spectrum used in the analysis is presented in Figure 10.
Short-period spectral accelerations primarily influence low-rise structures, while long-period spectral accelerations govern the displacement response of mid-rise and high-rise buildings. Consequently, the use of spectral ordinates over a wide period range enables a more comprehensive assessment of seismic demand across different structural typologies.
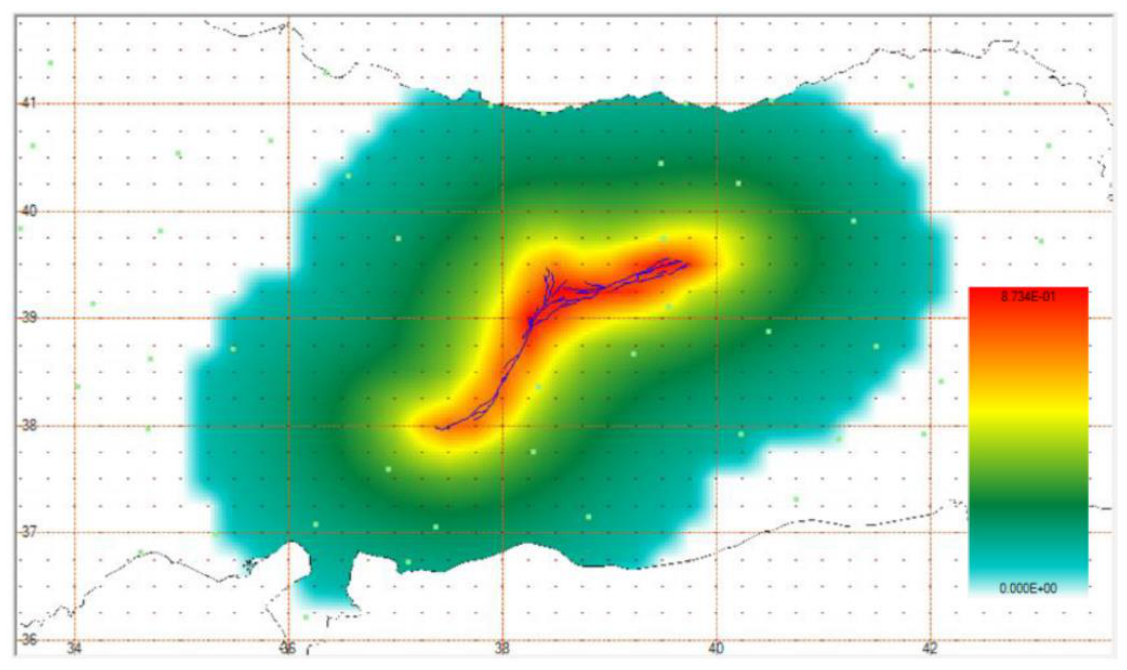
The PSHA computations resulted in exceedance probability curves and hazard-consistent spectral accelerations for a 10% probability of exceedance in 50 years, corresponding to a return period of 475 years. The resulting peak ground acceleration (PGA) values for the scenario earthquake are illustrated in Figure 11.

3.6. Comparison with TBEC-2018 Design Spectrum

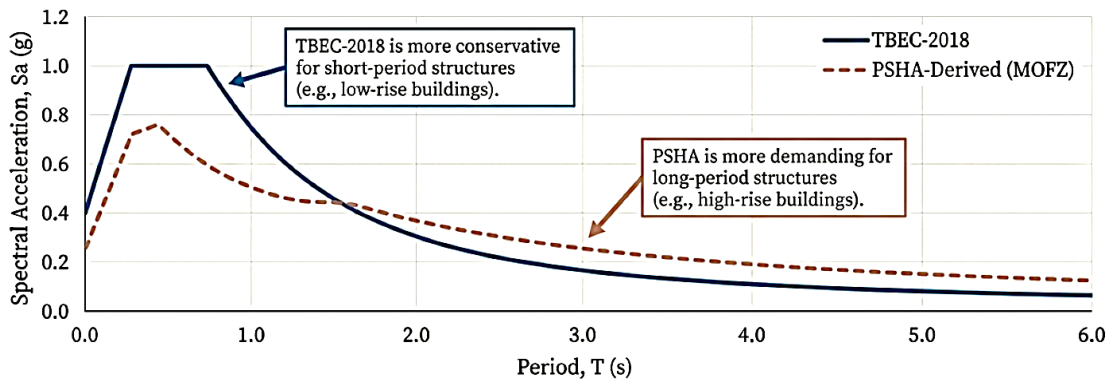
A critical objective of the PSHA was to evaluate the consistency between site-specific hazard results and the design spectra prescribed by the Turkish Building Earthquake Code (TBEC-2018 [26]). The comparison between the horizontal elastic spectrum obtained from PSHA and the TBEC-2018 design spectrum for the DD-2 earthquake ground motion level is presented in Figure 12.
As shown in this figure, the TBEC-2018 [26] design spectrum exhibits PGA values that are approximately 6% higher than those obtained from PSHA. However, significant discrepancies are observed in the spectral acceleration values at different period ranges. Specifically, the TBEC-2018 [26] spectrum yields approximately 28% higher short-period spectral accelerations (S0.3), while the PSHA-based spectrum produces approximately 29% higher spectral accelerations at a period of 1.0 s (S1.0).
These differences indicate that the TBEC-2018 [26] design spectrum is more conservative for low- and mid-rise structures dominated by short-period response, whereas the PSHA-based spectrum is more unfavorable for long-period, high-rise structures. Considering the focus of the present study on nonlinear time history analyses and near-fault effects, the TBEC-2018 [26] horizontal elastic design spectrum was adopted as the reference spectrum for ground motion scaling in subsequent analyses.
Although the PSHA-based spectrum predicts higher spectral accelerations in the long-period range, the TBEC-2018 [26] design spectrum was intentionally selected as the target spectrum for ground-motion scaling. The objective of the present study was to investigate the influence of rupture directivity within the framework of the current Turkish seismic design provisions rather than to compare alternative hazard representations. Adopting a common TBEC-2018 [26] target spectrum for both the baseline and directivity-modified record sets ensures methodological consistency and allows the observed differences in structural response to be attributed primarily to the directivity modification. Nevertheless, the authors acknowledge that employing a PSHA-derived target spectrum may lead to increased long-period displacement demands, particularly for medium- and high-rise structures, and this constitutes an important subject for future investigation.

4. Site-Specific Design Spectrum and Ground Motion Selection

4.1. Earthquake Ground Motion Levels According to TBEC-2018

The TBEC-2018 [26] defines four discrete earthquake ground motion levels to be used in seismic design and performance assessment. These levels are distinguished by their probability of exceedance within a reference time period and corresponding return periods, thereby enabling a performance-based evaluation of structures under different seismic intensities.
In the present study, the DD-2 earthquake ground motion level, corresponding to a 10% probability of exceedance in 50 years (return period of 475 years), was adopted as the reference hazard level for both seismic hazard assessment and nonlinear structural analyses. This selection is consistent with the objectives of evaluating the seismic performance of ordinary reinforced concrete buildings under design-level earthquake conditions.

4.2. Horizontal Elastic Design Spectrum Formulation

The horizontal elastic design spectrum constitutes the fundamental input for seismic demand representation in TBEC-2018 [26]. It is defined for a damping ratio of 5% and is constructed using map-based spectral acceleration coefficients together with local site effect factors.
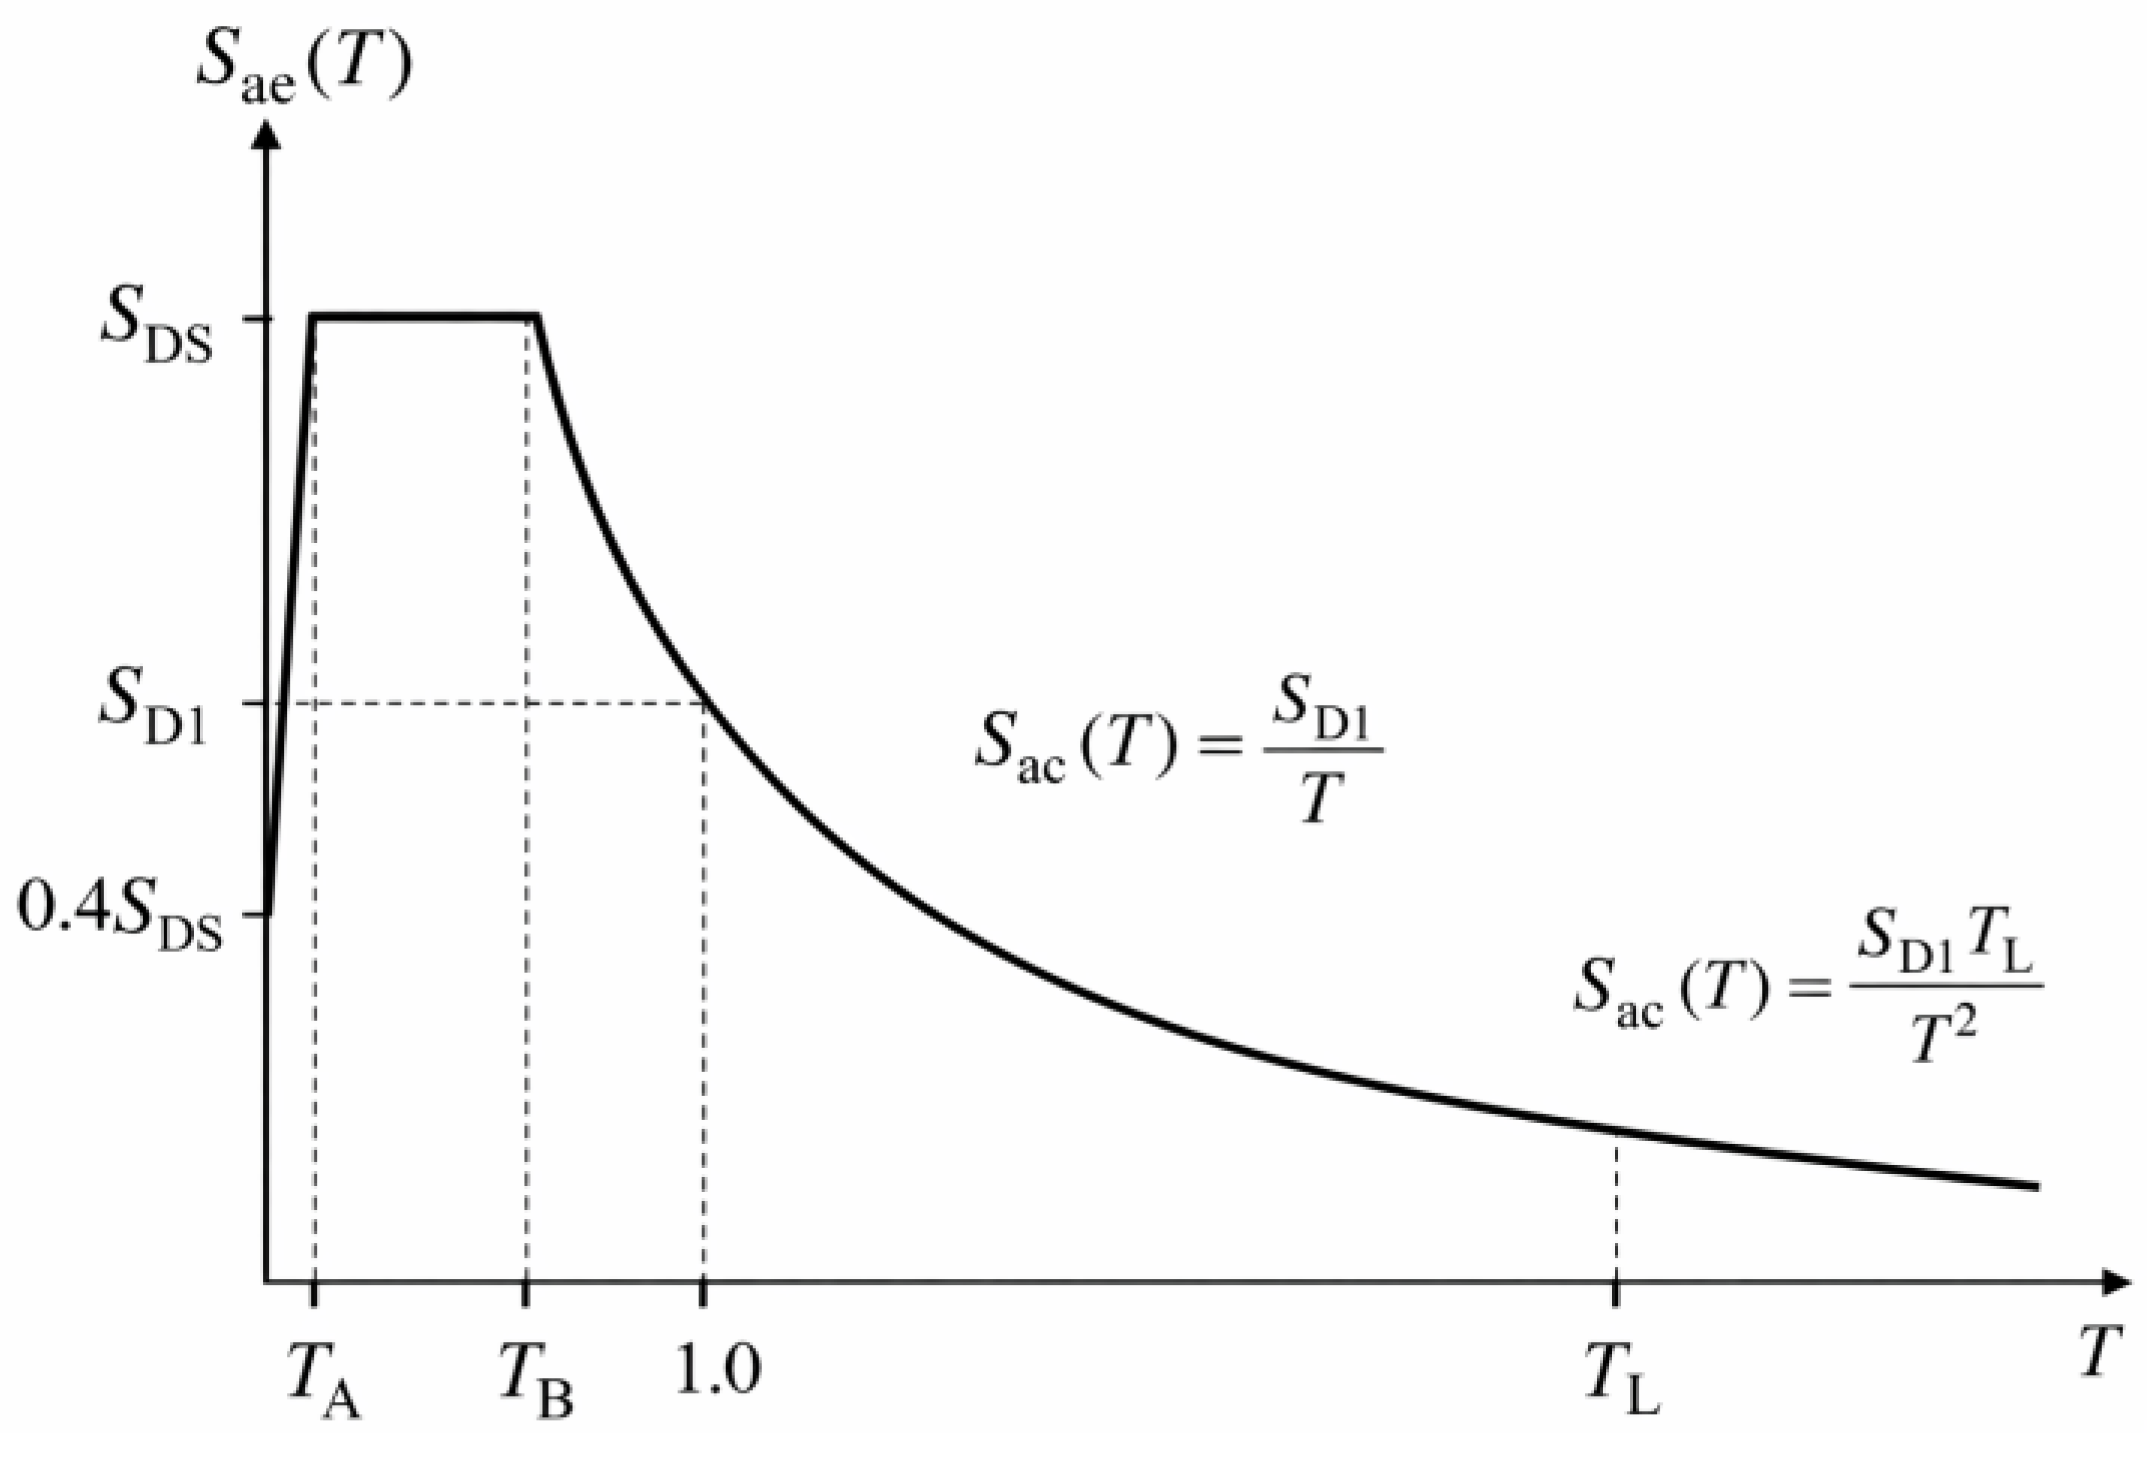
The general shape and definition of the horizontal elastic design spectrum are illustrated in Figure 13. The spectral acceleration ordinates Sae (T) are defined as a piecewise function of vibration period T, governed by the short-period and long-period design spectral acceleration coefficients.
The corner periods of the spectrum are calculated as
T A = 0.2 S D 1 S D S T B = S D 1 S D S T L = 6.0   s ,
where SDS is the short-period design spectral acceleration coefficient and SD1 is the design spectral acceleration coefficient at a period of 1.0 s.

4.3. Determination of Site-Specific Spectral Acceleration Coefficients

Map-based spectral acceleration coefficients SS and S1 were obtained for the selected location in Malatya city center. These coefficients represent reference site conditions corresponding to an average shear-wave velocity of Vs,30 = 760 m/s. Local site effects were incorporated through site amplification coefficients FS and F1, which depend on soil class and spectral acceleration level. Based on the soil data obtained from nearby AFAD accelerometer stations, particularly the TK-4401 station shown in Figure 14, the site was classified as ZD soil class.
Accordingly, the design spectral acceleration coefficients were computed as
S D S = S S F S S D 1 = S 1 F 1

4.4. Comparison of Site-Specific and Hazard-Based Spectra

The site-specific horizontal elastic design spectrum developed according to TBEC-2018 [26] was compared with the spectrum obtained from the probabilistic seismic hazard analysis. This comparison revealed notable differences in spectral acceleration levels across different period ranges. While the TBEC-2018 [26] spectrum exhibited slightly higher PGA values, the PSHA-based spectrum produced higher spectral accelerations at longer periods. Given the objective of maintaining consistency with code-based procedures and enabling direct comparison with TBEC-2018 [26] performance limits, the TBEC-2018 [26] horizontal elastic design spectrum was selected as the reference spectrum for ground motion scaling.

4.5. Selection of Earthquake Records

Real earthquake records were selected in accordance with the Simple Scaling Method defined in TBEC-2018 [26]. The selected records satisfy the following criteria:
  • Moment magnitude and faulting mechanism consistent with regional seismicity;
  • Source-to-site distance representative of near-fault conditions;
  • Availability of high-quality acceleration time histories.
A total of 11 real earthquake records meeting these criteria were selected. The selected records and their key seismological characteristics are summarized in Table 1.
The selected records were intended to constitute a code-compatible baseline ground motion set satisfying the requirements of TBEC-2018 [26] with respect to magnitude, faulting mechanism, site conditions, and spectral compatibility. Accordingly, the selection was not restricted solely to records within the conventional near-fault distance range. Instead, rupture directivity effects were incorporated in a subsequent stage through the directivity-modification procedure described in Section 4.7. This methodology enables a controlled comparison between baseline and directivity-modified ground motions while preserving the same underlying record characteristics.
The two recorded horizontal components were assigned directly to the global X and Y directions of the structural models without additional rotation into fault-normal (FN) and fault-parallel (FP) orientations. This approach was adopted to preserve the original characteristics of the recorded ground motions and to maintain consistency with the code-based nonlinear time-history analysis procedure. Accordingly, the directivity modification employed in this study represents an engineering-oriented evaluation of the overall influence of rupture directivity rather than an explicit investigation of direction-dependent fault-normal and fault-parallel effects. Future studies may extend the present framework by considering component rotation and orientation-specific response analyses.

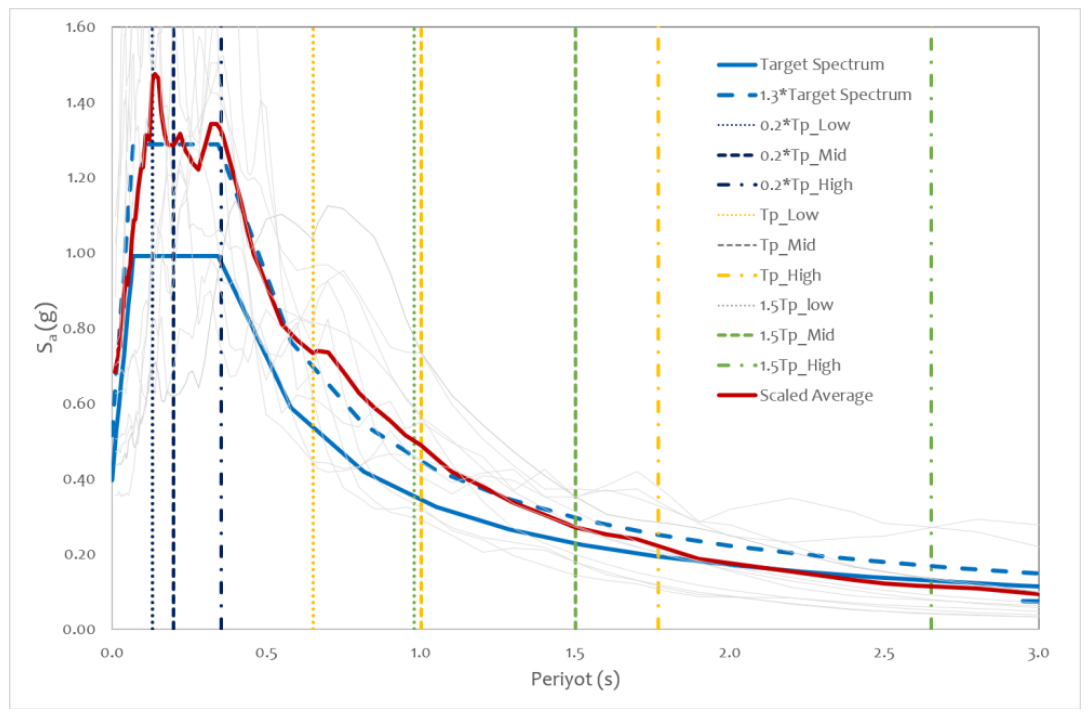
4.6. Scaling of Earthquake Records

Each selected earthquake record was scaled such that the average response spectrum of the record set satisfies the TBEC-2018 [26] requirement:
S a ¯ T 1.3 S d e s i g n T ,
over the period range of interest. The comparison between the scaled average spectrum of the 11 records and the DD-2 design spectrum, including the 1.3 amplification envelope, is presented in Figure 15. Individual record spectra are also shown in this figure to demonstrate compliance with code requirements.
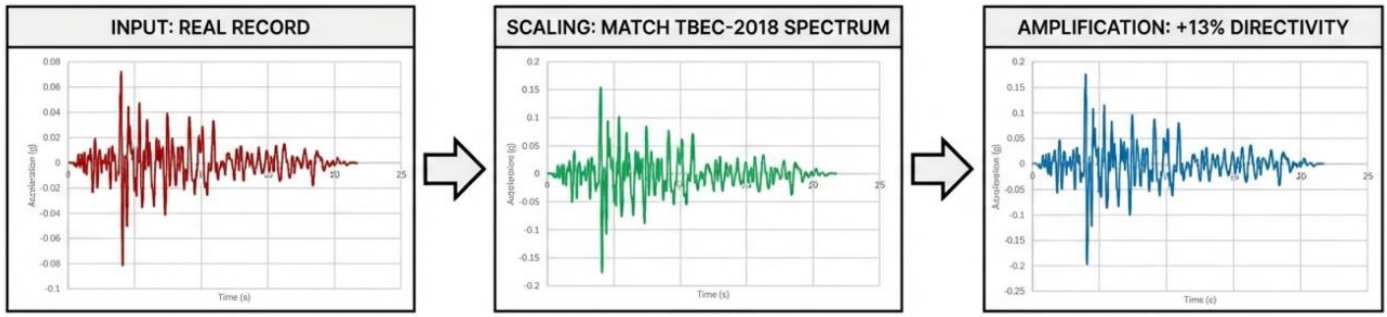
Representative examples of an original and scaled earthquake record are illustrated in Figure 16, respectively.

4.7. Incorporation of Near-Fault Directivity Effects

To account explicitly for rupture directivity effects, the selected earthquake records were further modified by applying a uniform amplification factor derived from the directivity analysis presented in Section 2.
An example of an earthquake record amplified to account for directivity effects is illustrated in Figure 16. Consequently, two ground motion sets were considered in the nonlinear time-history analyses. The first set consisted of the baseline code-compatible ground motions obtained after the TBEC-2018 [26] scaling procedure. The second set was generated by applying the adopted directivity modification to the same baseline records. Therefore, the comparison presented in this study is not between different earthquake databases, but between the original baseline records and their directivity-modified counterparts, allowing the isolated influence of rupture directivity on structural response to be evaluated.
This dual-record approach enables a direct comparison of structural responses with and without explicit consideration of rupture directivity effects.

5. Structural Modeling of Case Study Buildings

5.1. General Description of the Case Study Buildings

Within the scope of this study, three existing reinforced concrete (RC) buildings located in Malatya province were selected as representative case studies. The selected buildings differ in height, structural configuration, and functional use, thereby enabling a systematic investigation of the influence of near-fault directivity on structures with distinct dynamic characteristics.
The investigated buildings consist of
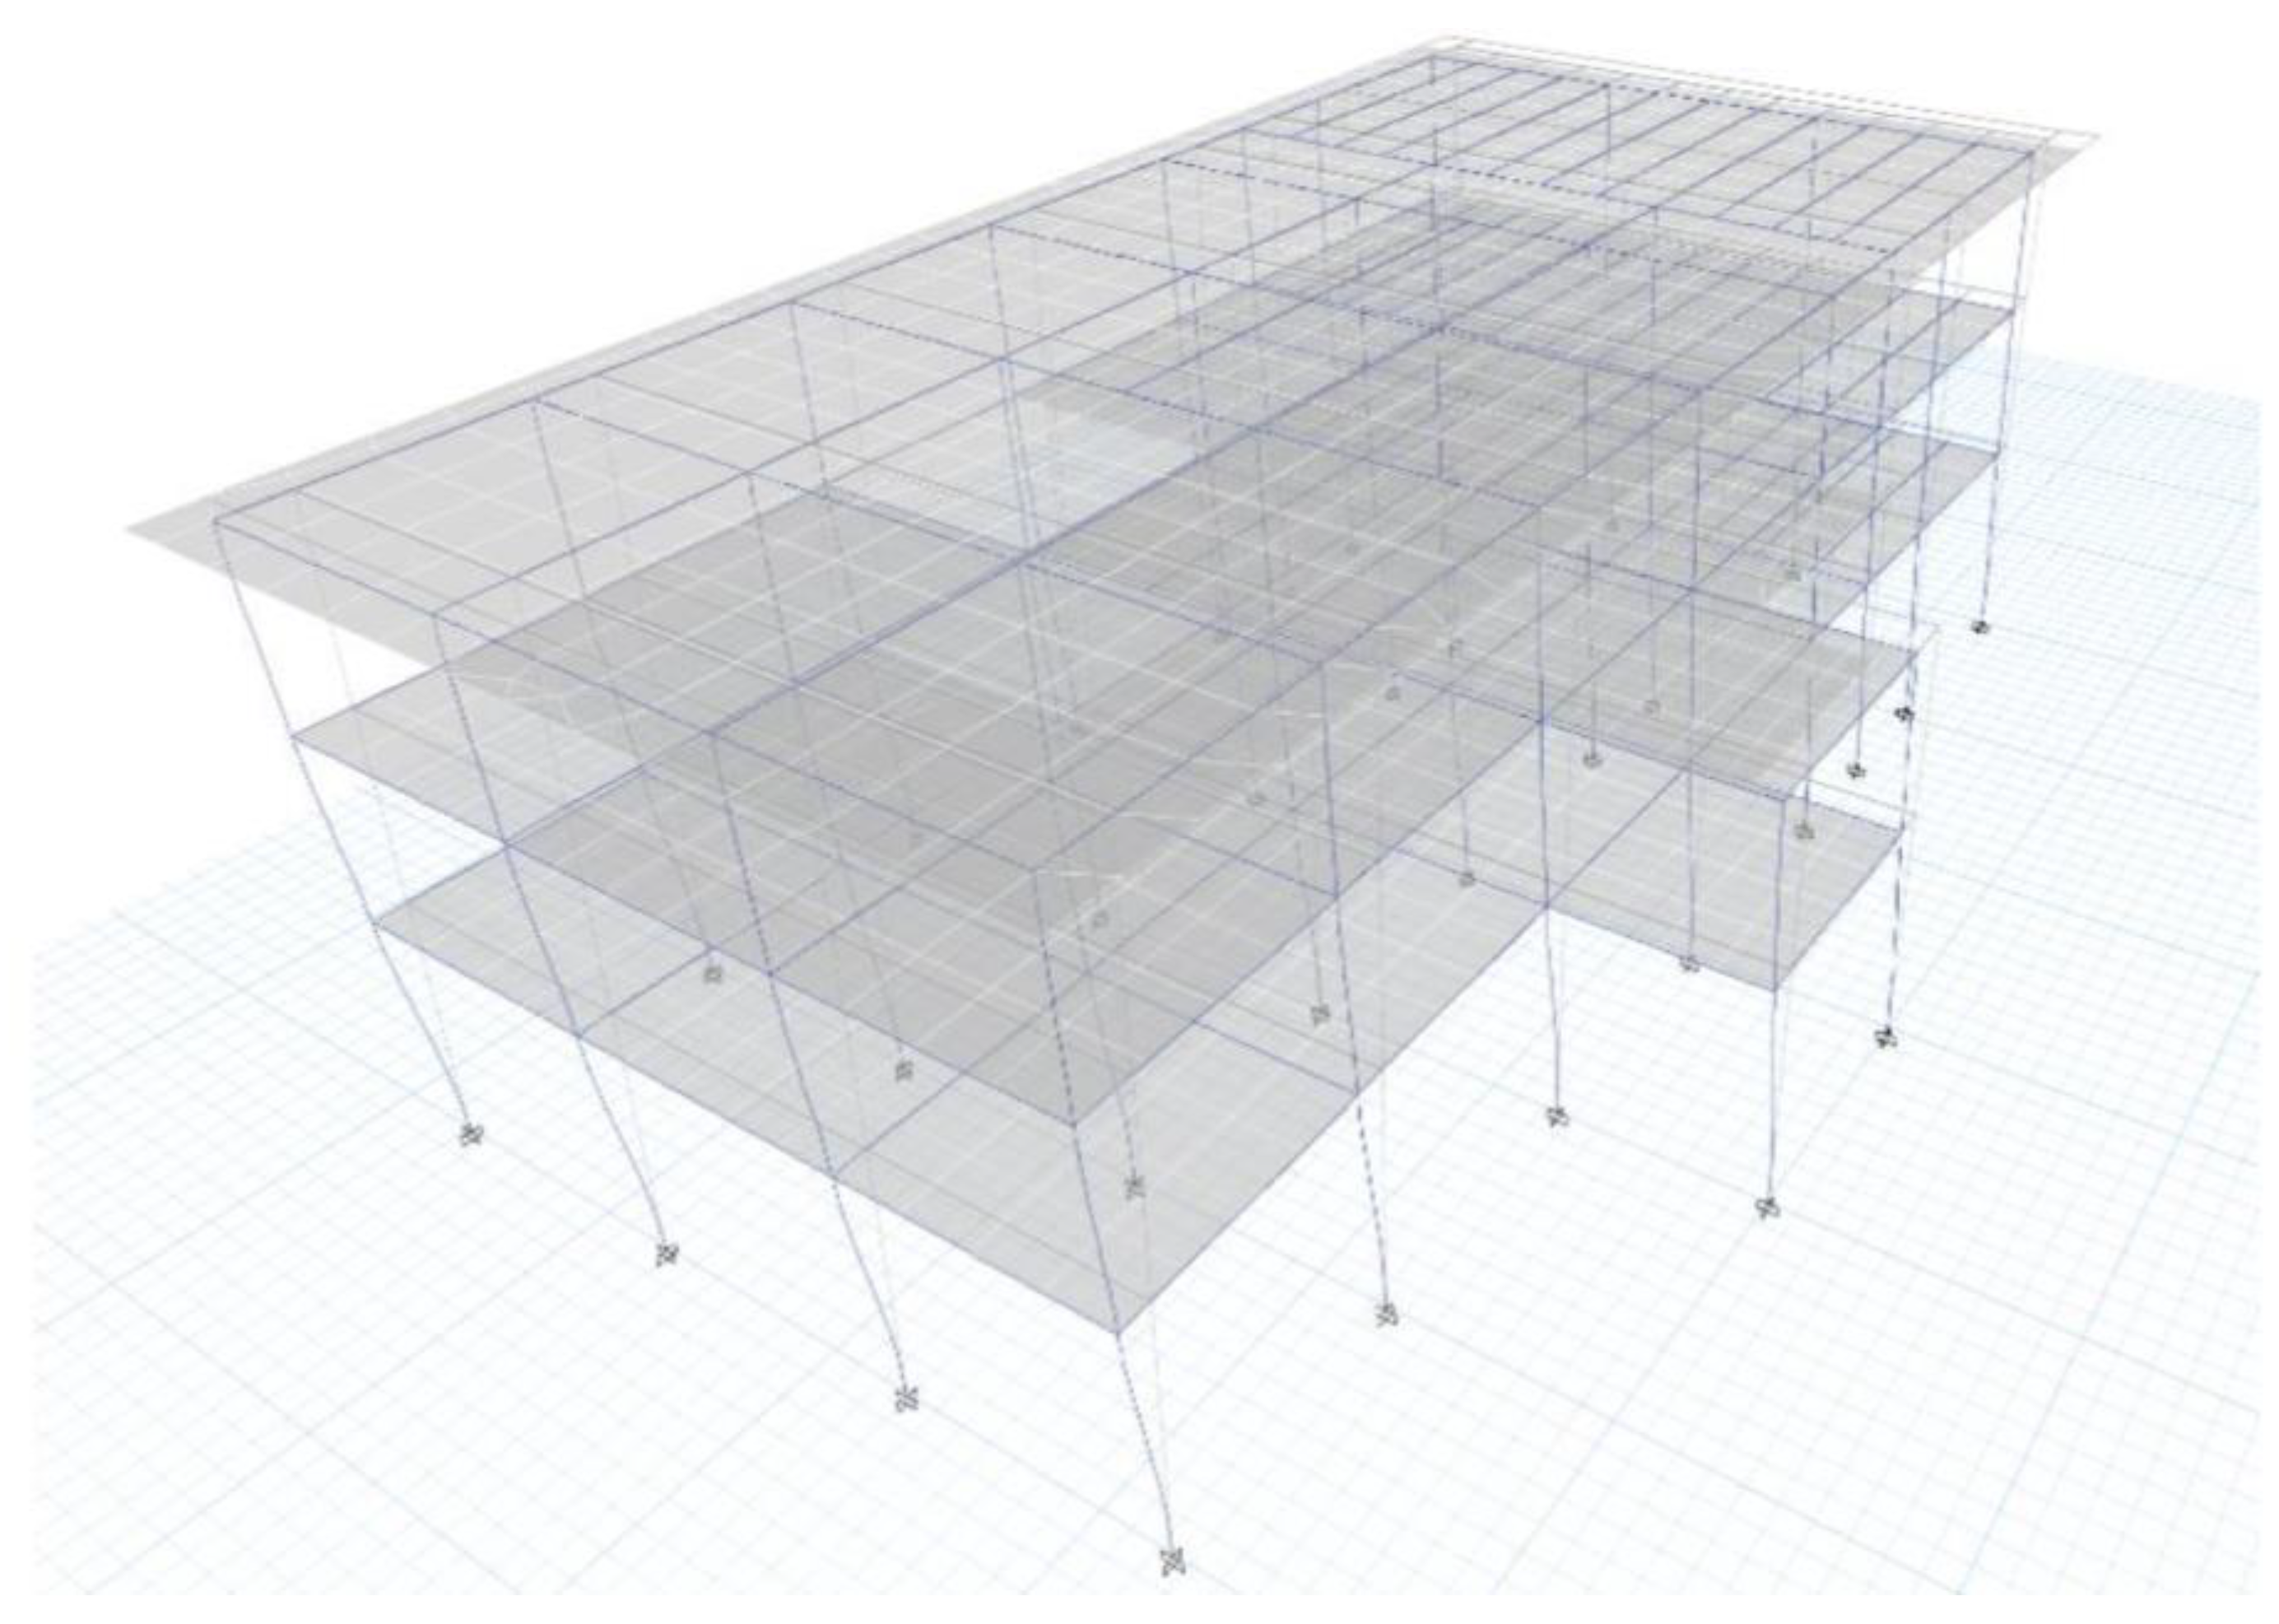
(i) a low-rise public library building (Structure A);
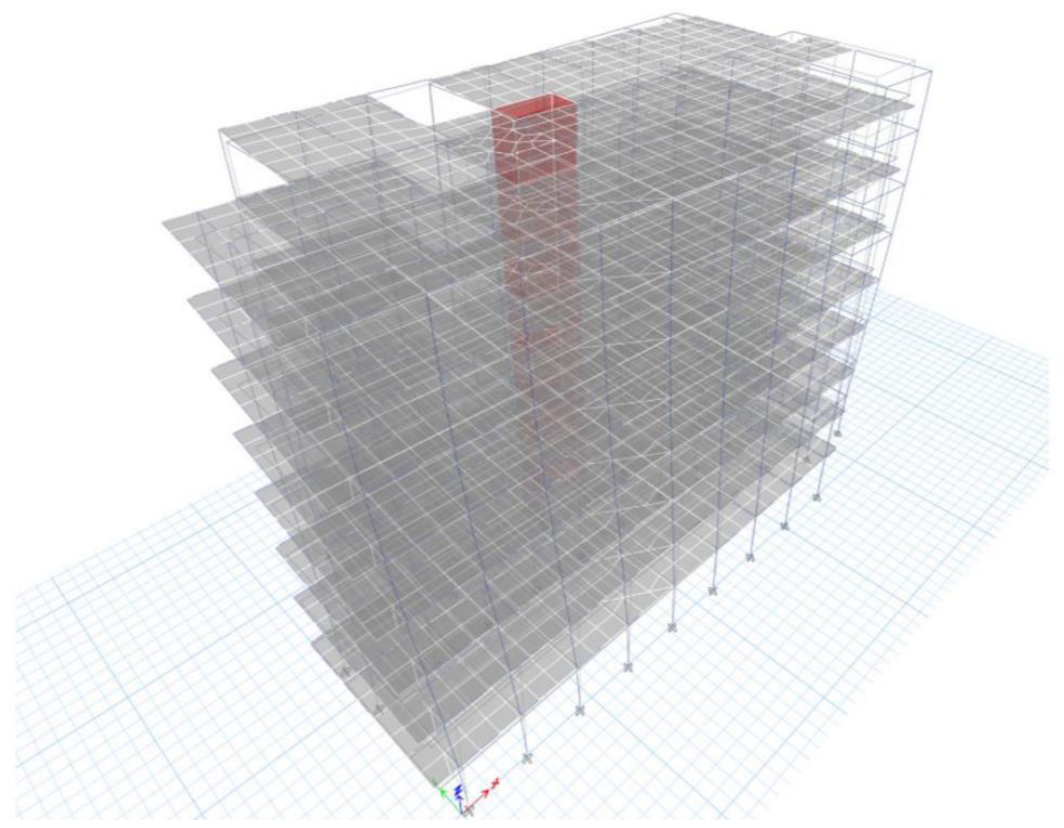
(ii) a mid-rise public office building (Structure B);
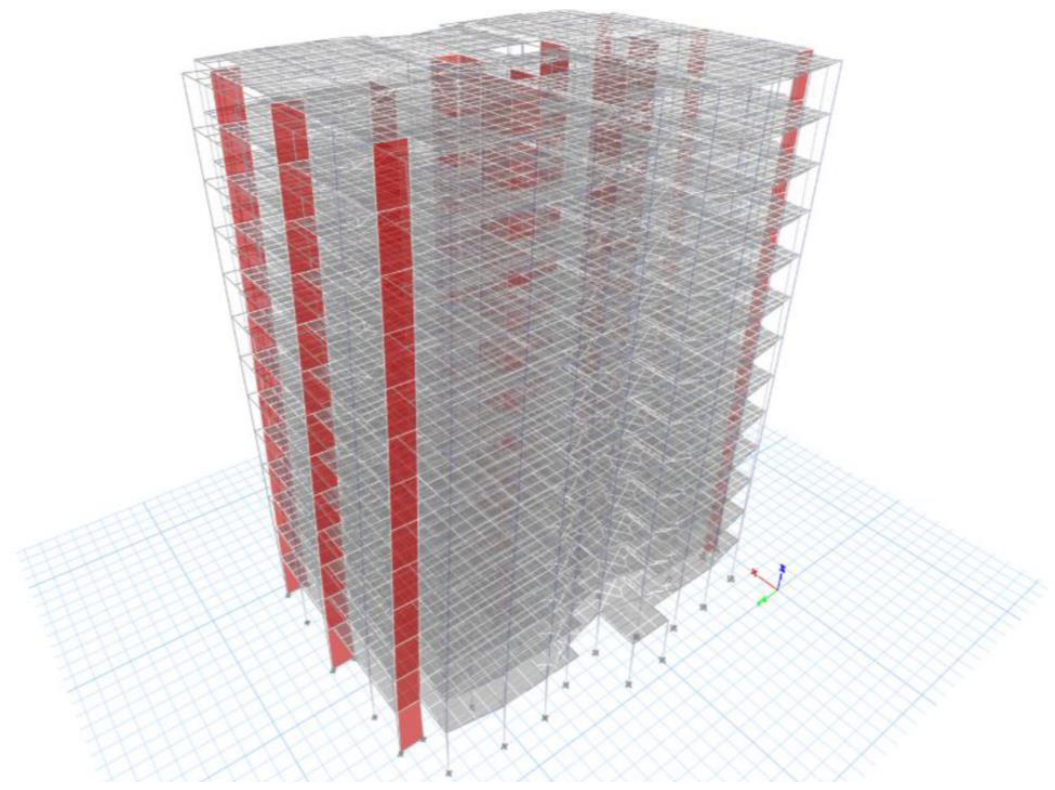
(iii) a high-rise residential building (Structure C).
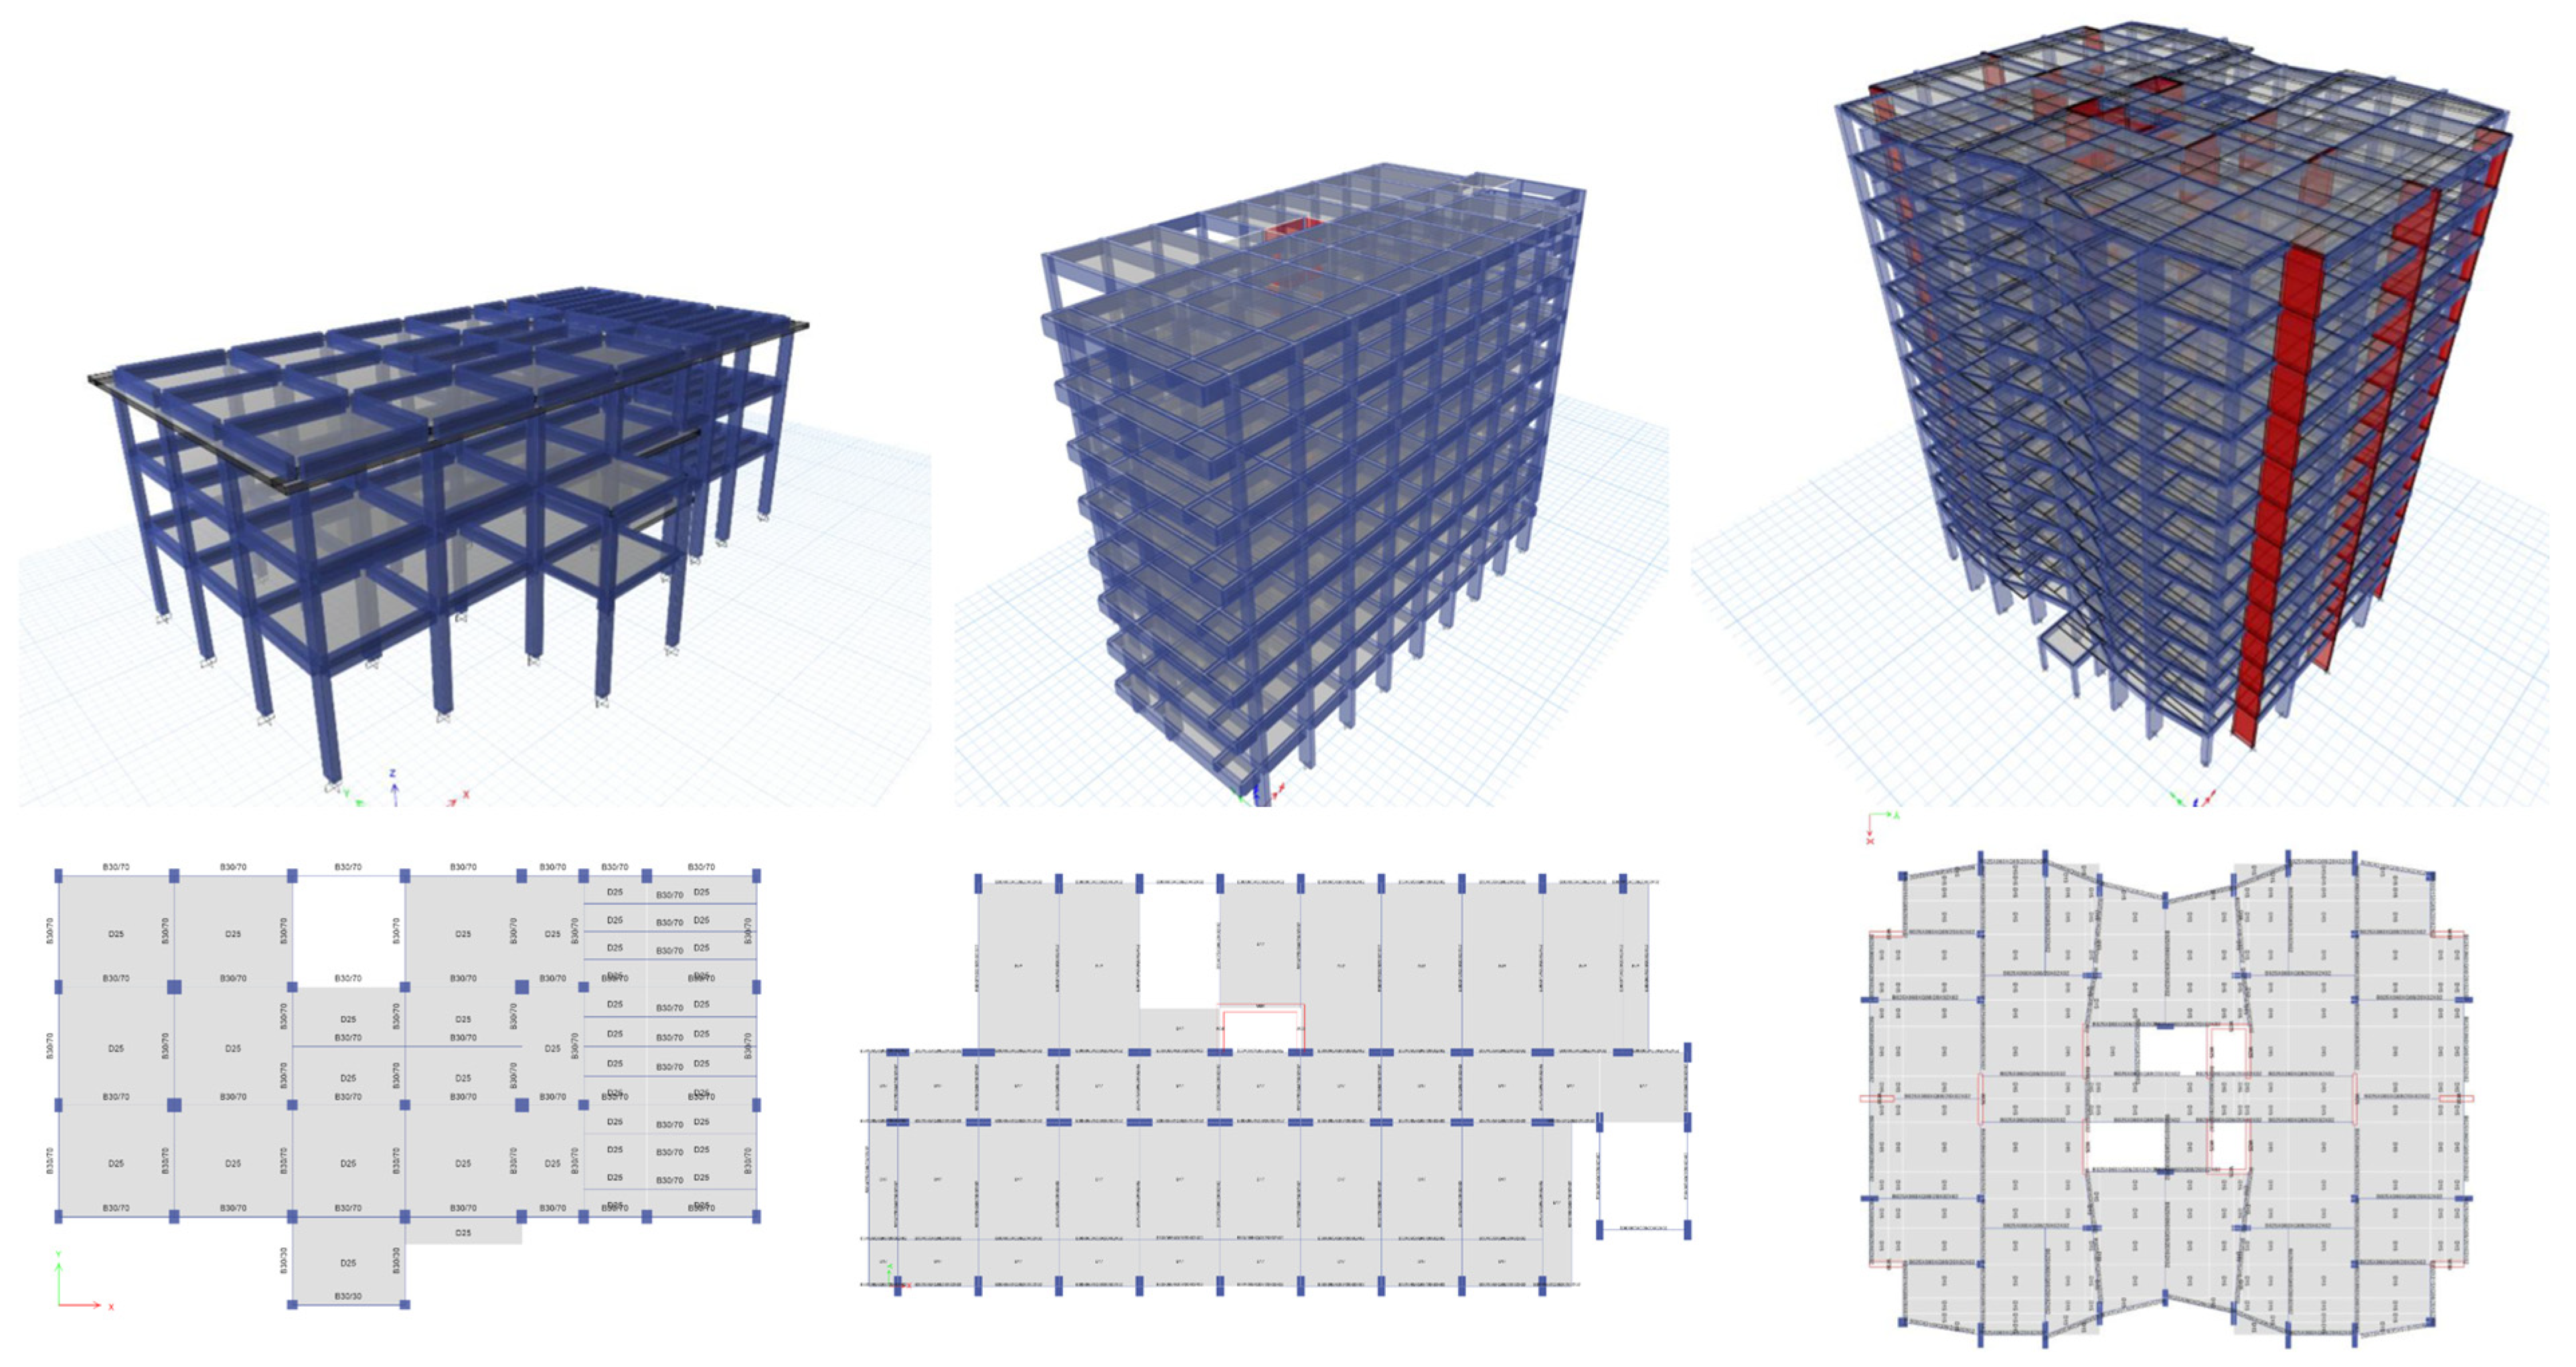
The geometric layouts, formwork plans, and three-dimensional numerical models of these structures are presented in Figure 17, respectively. Key structural properties, including number of stories, story heights, plan dimensions, and structural system types, are summarized in Table 2.

5.2. Governing Equations of Nonlinear Structural Response

The seismic response of each structure was evaluated using nonlinear time history analysis, in which the dynamic equilibrium of the structural system is governed by the following matrix equation of motion:
M u ¨ t + C u ˙ t + K u u t = M r u ¨ g t ,
where
M is the mass matrix,
C is the damping matrix,
(u) is the displacement-dependent nonlinear stiffness matrix,
u t , u ˙ t , and u ¨ t are the displacement, velocity, and acceleration vectors, respectively,
r is the influence vector, and
u ¨ g t denotes the ground acceleration time history.
The nonlinearity in the stiffness matrix arises from material yielding and plastic hinge formation in beams, columns, and shear walls.

5.3. Material Modeling of Concrete and Reinforcing Steel

5.3.1. Concrete Constitutive Model

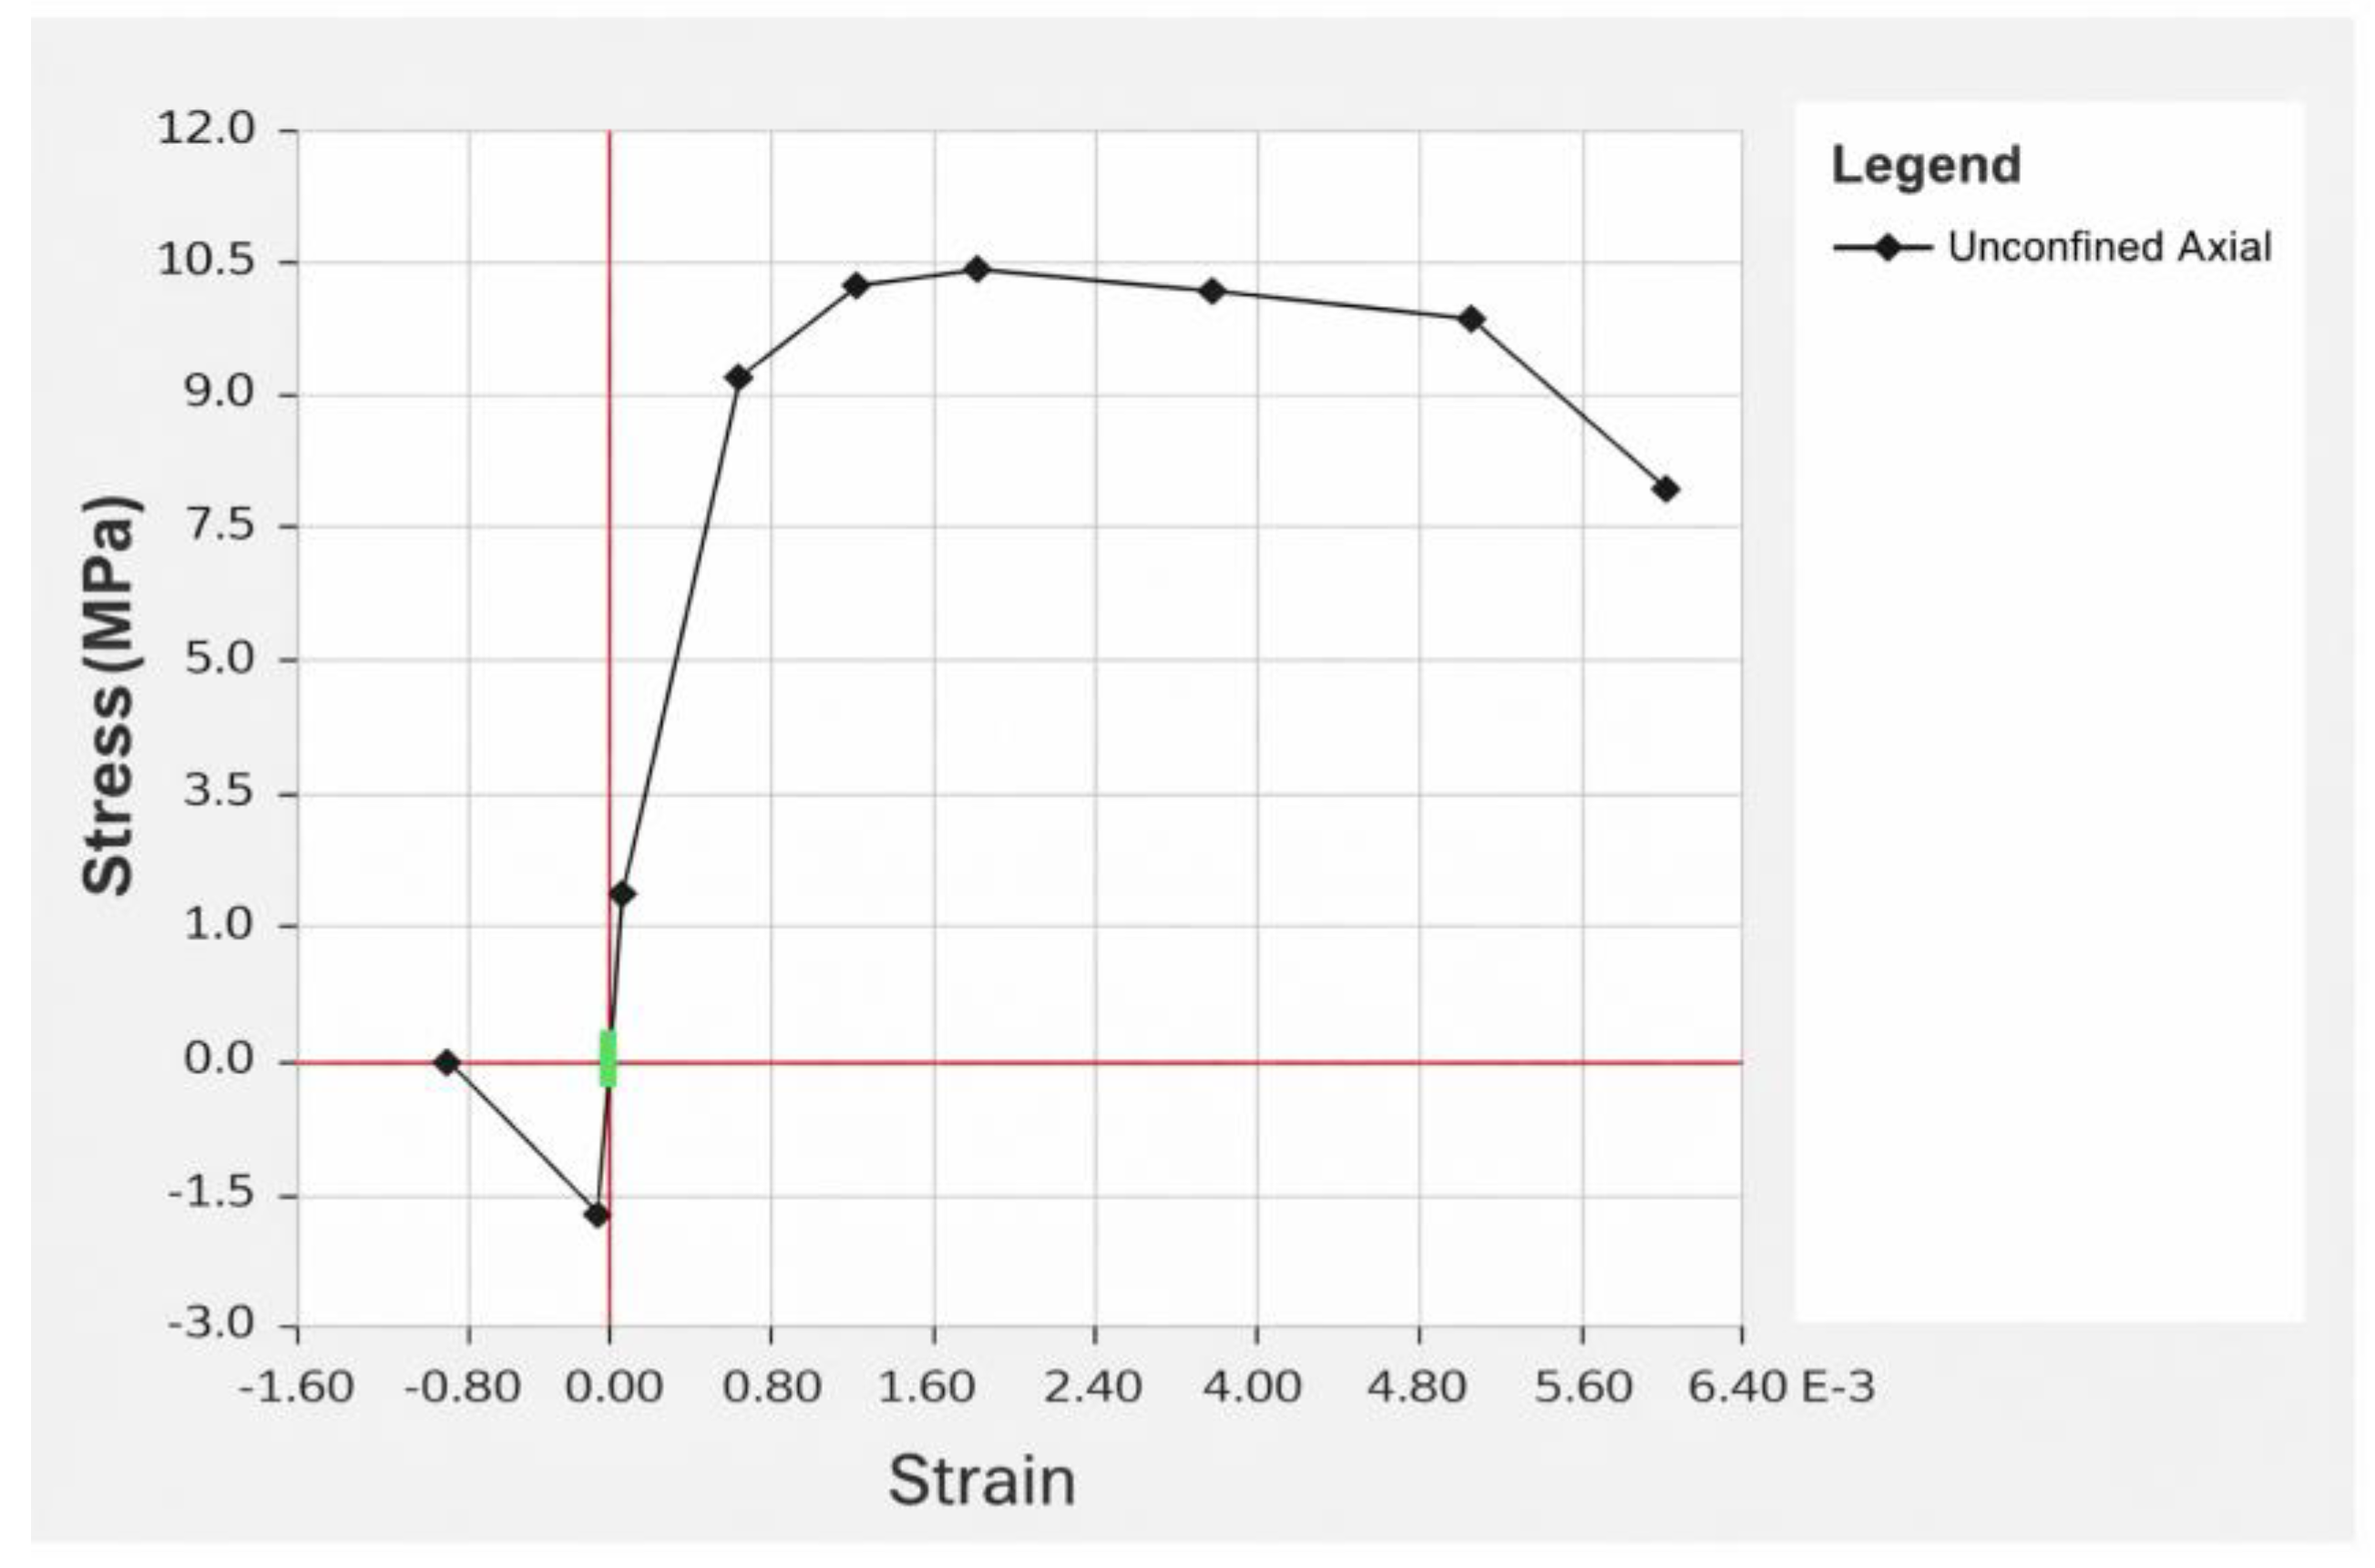
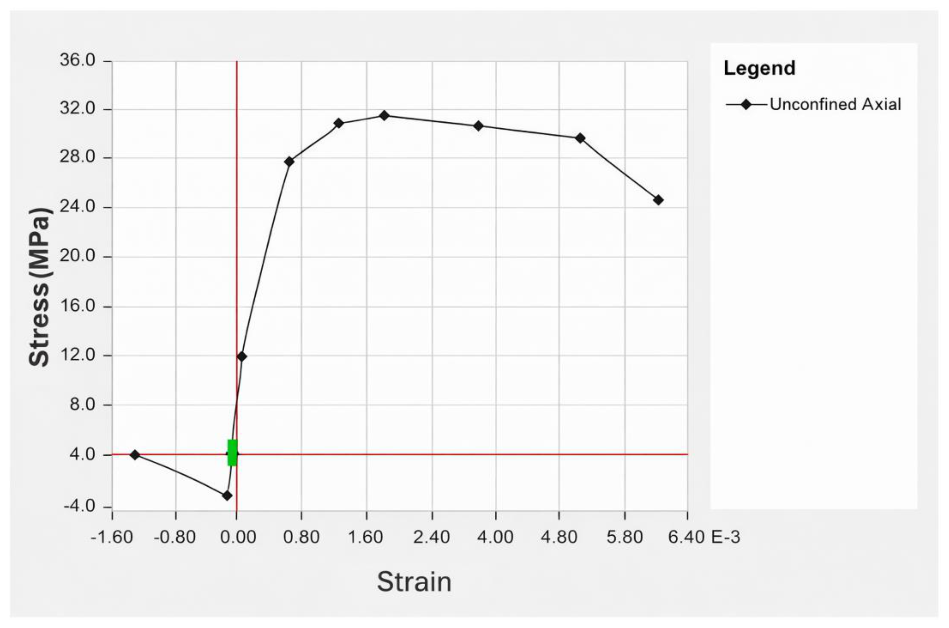
Concrete behavior was modeled using nonlinear stress–strain relationships for both confined and unconfined concrete, consistent with TBEC-2018 [26] material definitions. Representative stress–strain curves for the concrete classes used in the analyzed buildings are shown in Figure 18 and Figure 19.
The compressive stress–strain relationship of unconfined concrete was defined as
σ c ε c = f c 2 ε c ε c 0 ε c ε c 0 2 , ε c ε c 0 f c 1 α ε c ε c 0 , ε c > ε c 0
where fc is the compressive strength, εc0 is the strain at peak stress, and α controls post-peak softening.

5.3.2. Rebar Model

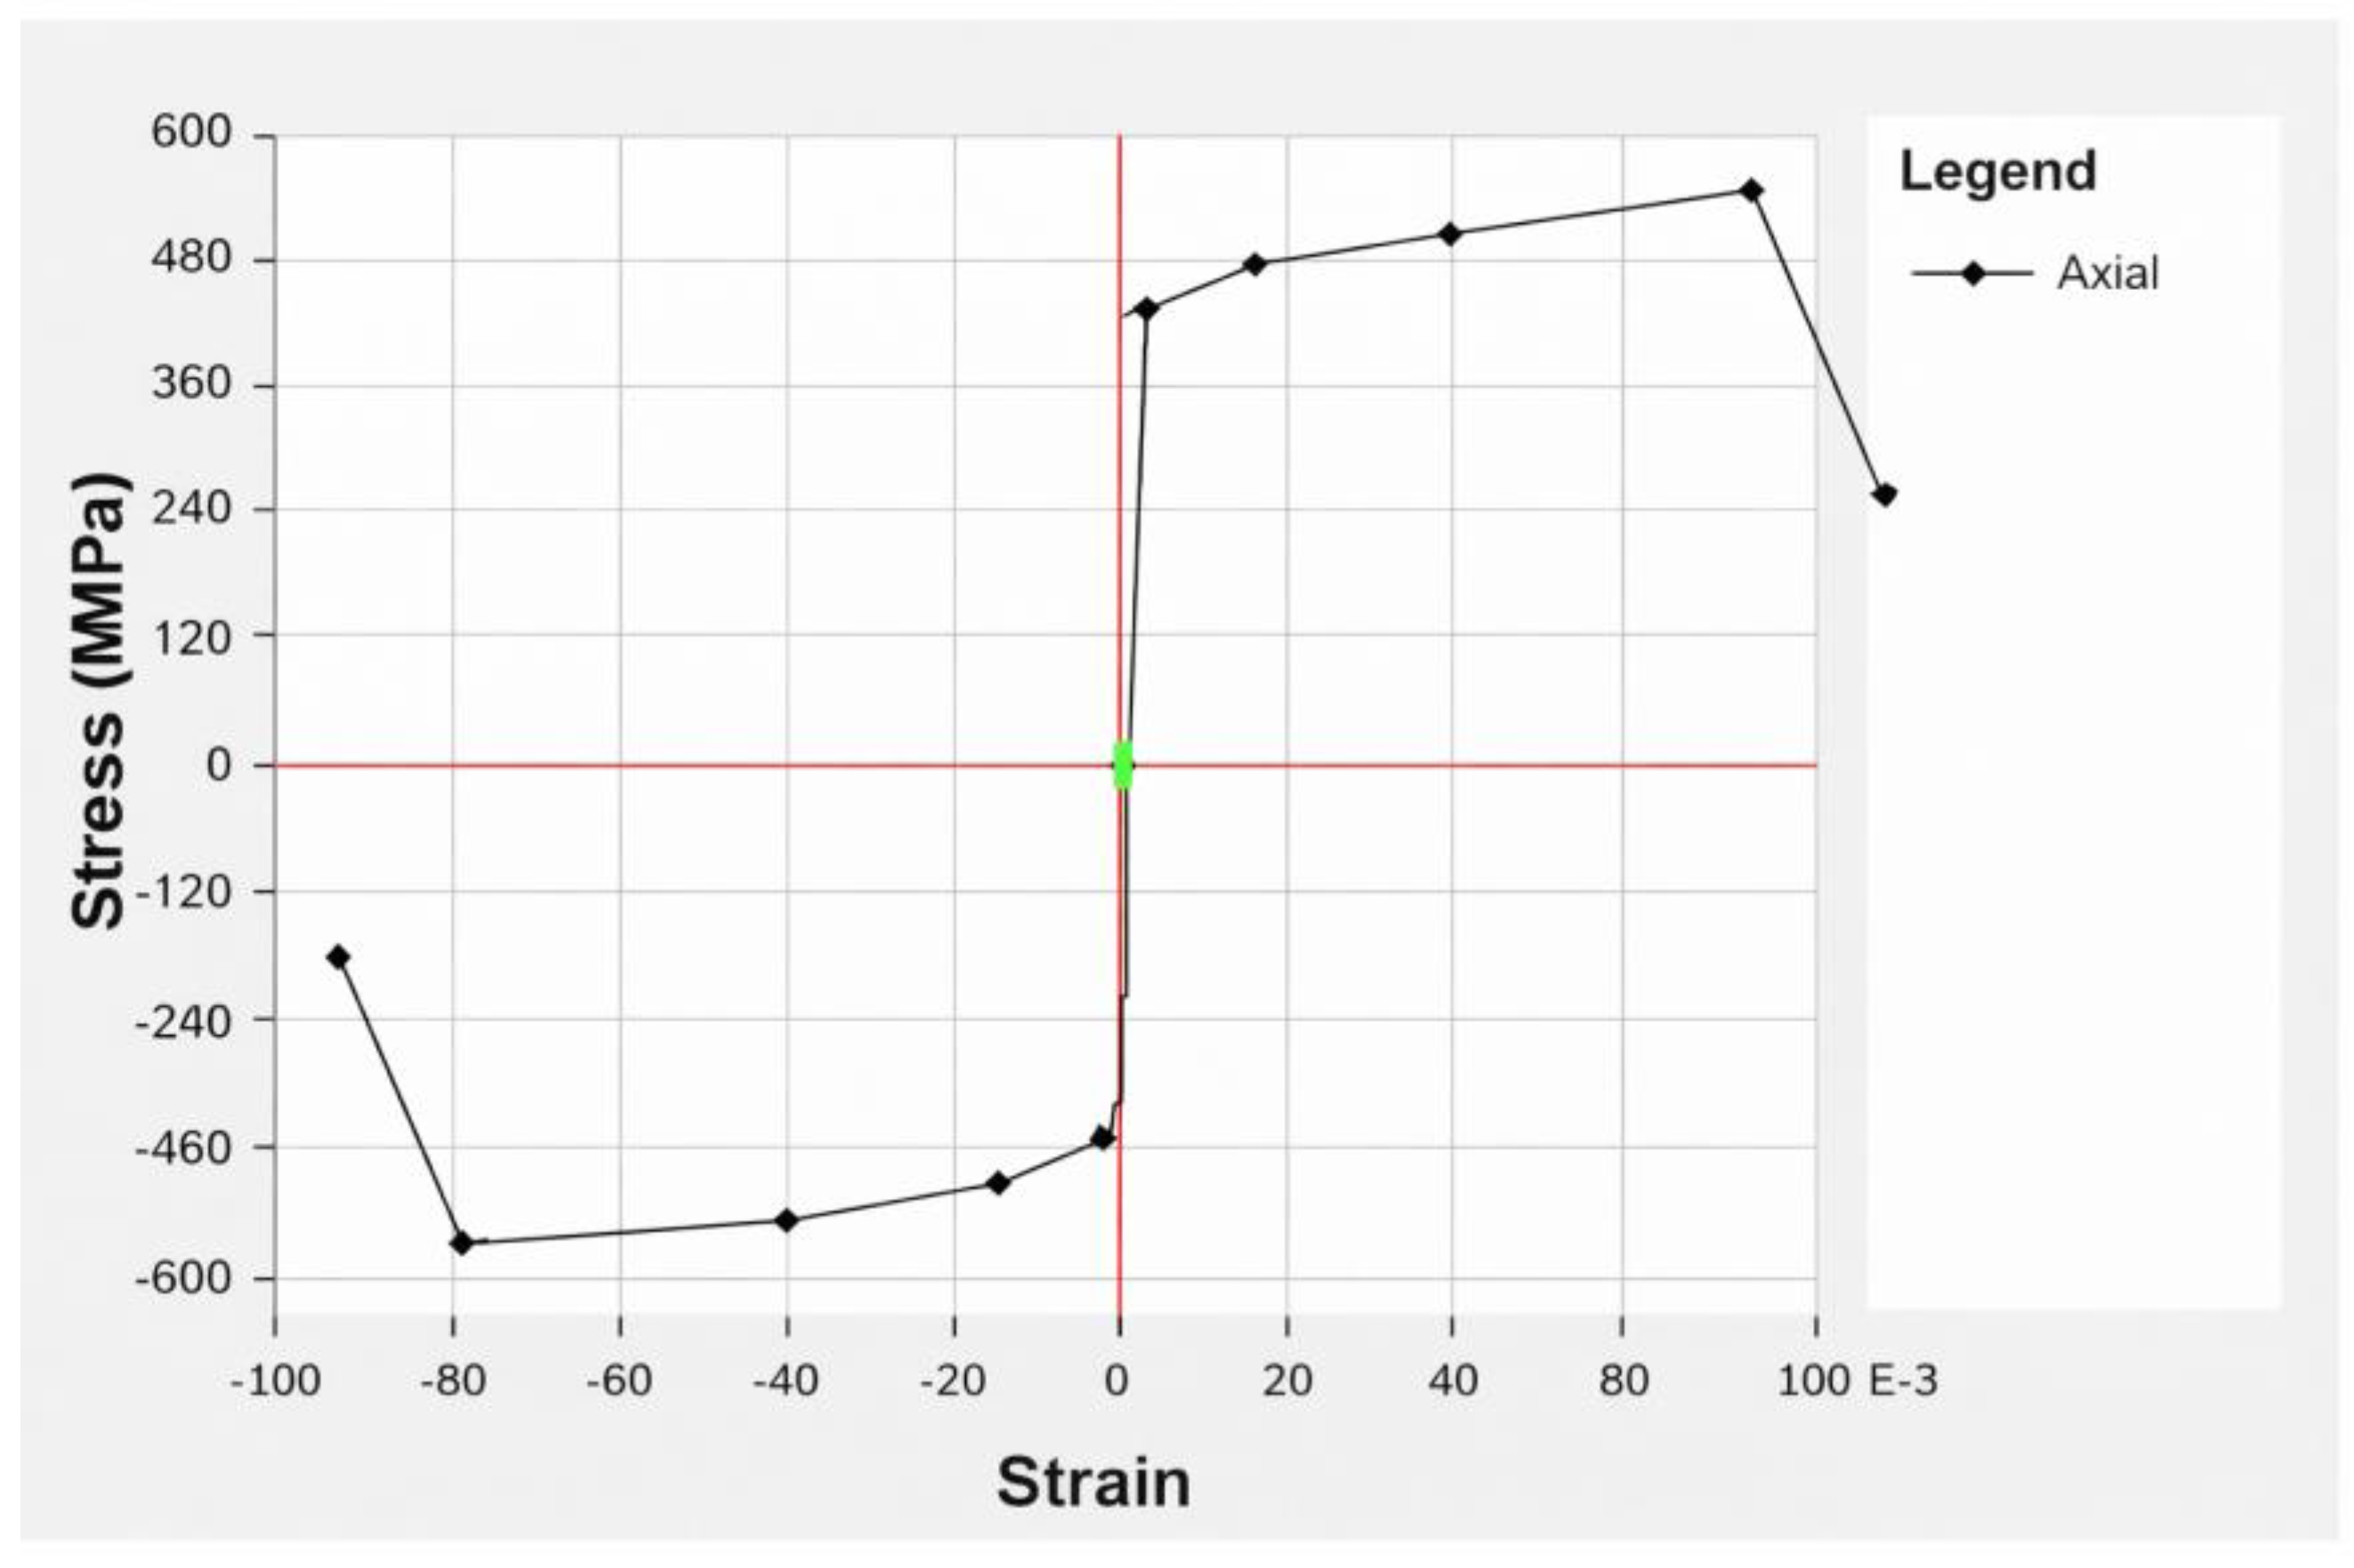
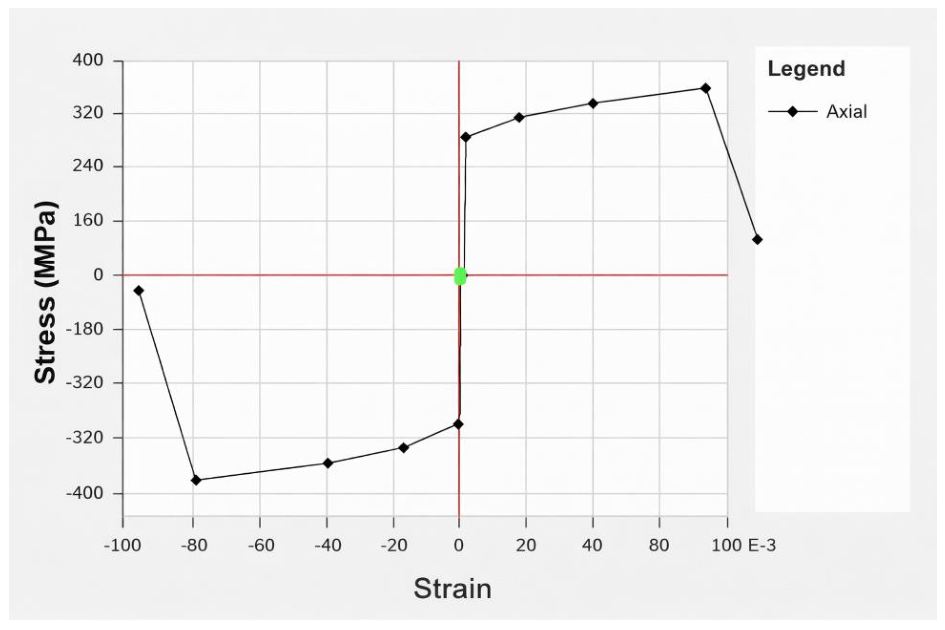
In this study, rebars were modeled using a bilinear elastoplastic stress–strain relationship with kinematic hardening, as illustrated in Figure 20 and Figure 21. The constitutive law is expressed as
σ s ε s = E s ε s , ε s ε y f y + E t ε s ε y , ε s > ε y
where Es is the elastic modulus, fy is the yield stress, and Et is the post-yield tangent modulus.

5.4. Effective Section Stiffness and Cracked Section Modeling

To account for stiffness degradation due to cracking, effective section stiffness values were assigned to beams, columns, and shear walls in accordance with TBEC-2018 [26]. The relationship between gross and effective flexural stiffness is given by
E I ) eff = η ( E I ) gross
where η is a stiffness reduction coefficient dependent on element type and axial load level. The adopted stiffness reduction factors are summarized in Table 3.
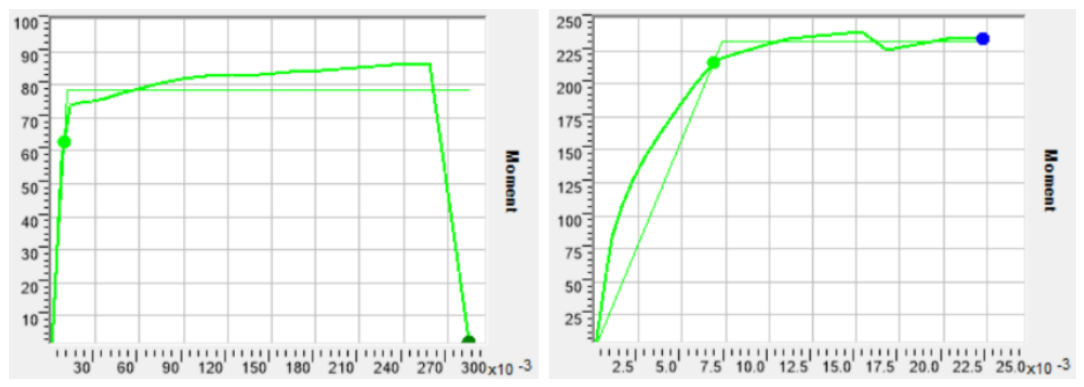
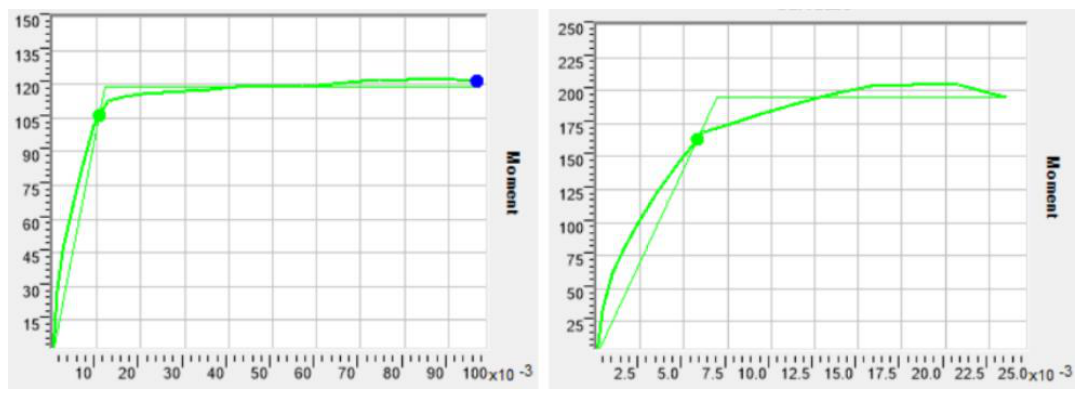
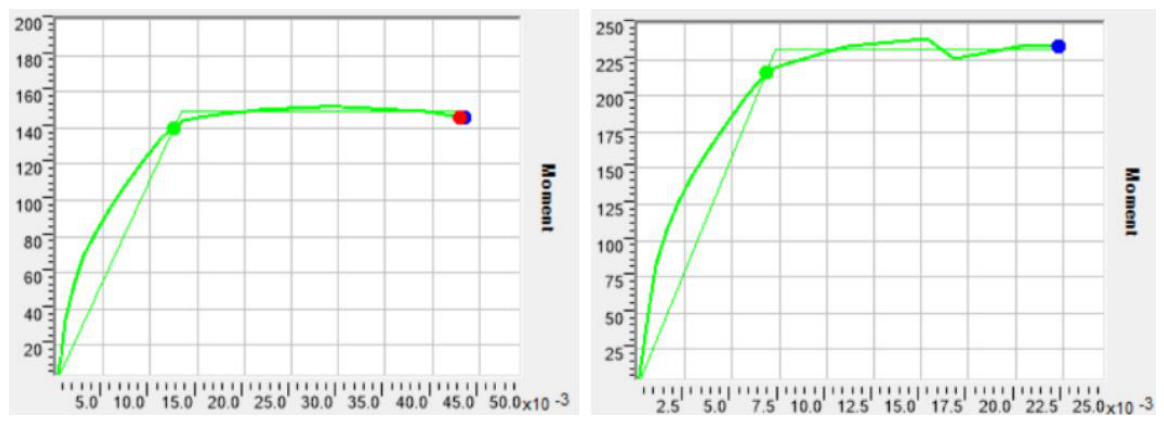
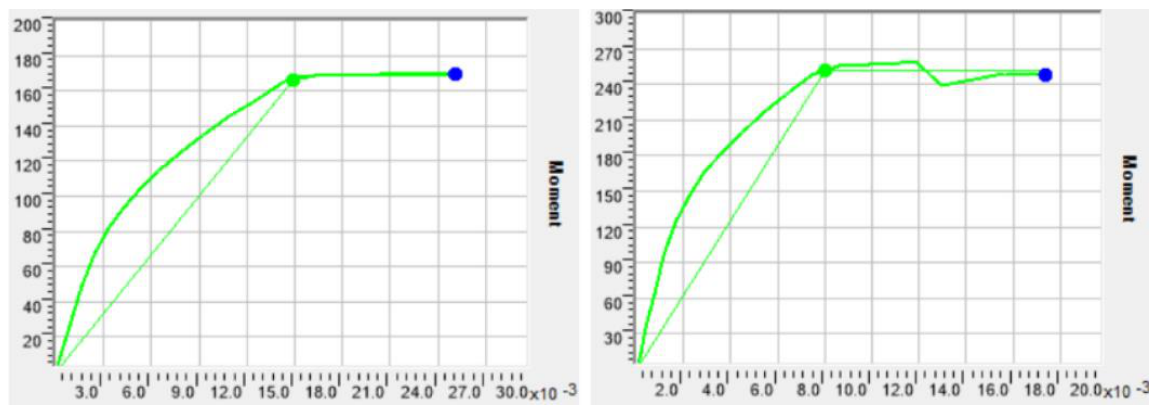
Moment–curvature relationships used to define nonlinear section behavior were obtained through sectional analysis, examples of which are presented in Figure 22, Figure 23, Figure 24 and Figure 25.

5.5. Plastic Hinge Modeling and Nonlinear Behavior Definition

Nonlinear behavior was concentrated at predefined plastic hinge regions using the lumped plasticity approach. Plastic hinges were assigned at the ends of beams, columns, and shear walls. The plastic hinge length Lp was defined as a function of member geometry and material properties:
L p = 0.08 L + 0.022 f y d b
where L is the member length and db is the longitudinal reinforcement diameter.
Plastic rotation capacity θp was derived from the moment–curvature relationship:
θ p = κ u κ y L p
where κy and κu denote yield and ultimate curvature, respectively.

5.6. Mass Modeling and Rigid Diaphragm Assumption

Masses were lumped at story levels based on tributary areas and gravity load combinations. The rigid diaphragm assumption enforces in-plane rigidity at each floor level, reducing the degrees of freedom and ensuring realistic lateral load distribution.

5.7. Damping Model and Rayleigh Damping Coefficients

Classical Rayleigh damping was adopted to represent the inherent energy dissipation of the structural systems. The damping coefficients were determined using the initial modal properties of each structural model to provide an equivalent viscous damping ratio of 5%, consistent with the recommendations of TBEC-2018 [26]. Although the effective damping characteristics of a structure may evolve as nonlinear behavior develops and stiffness degradation occurs, the same damping formulation was applied consistently to all analyses performed in this study. Therefore, the comparative assessment between the baseline and directivity-modified ground motions was not influenced by differences in the damping model, allowing the observed variations in structural response to be primarily attributed to the effects of rupture directivity.
Energy dissipation was modeled using classical Rayleigh damping, in which the damping matrix is defined as
C = α M + β K
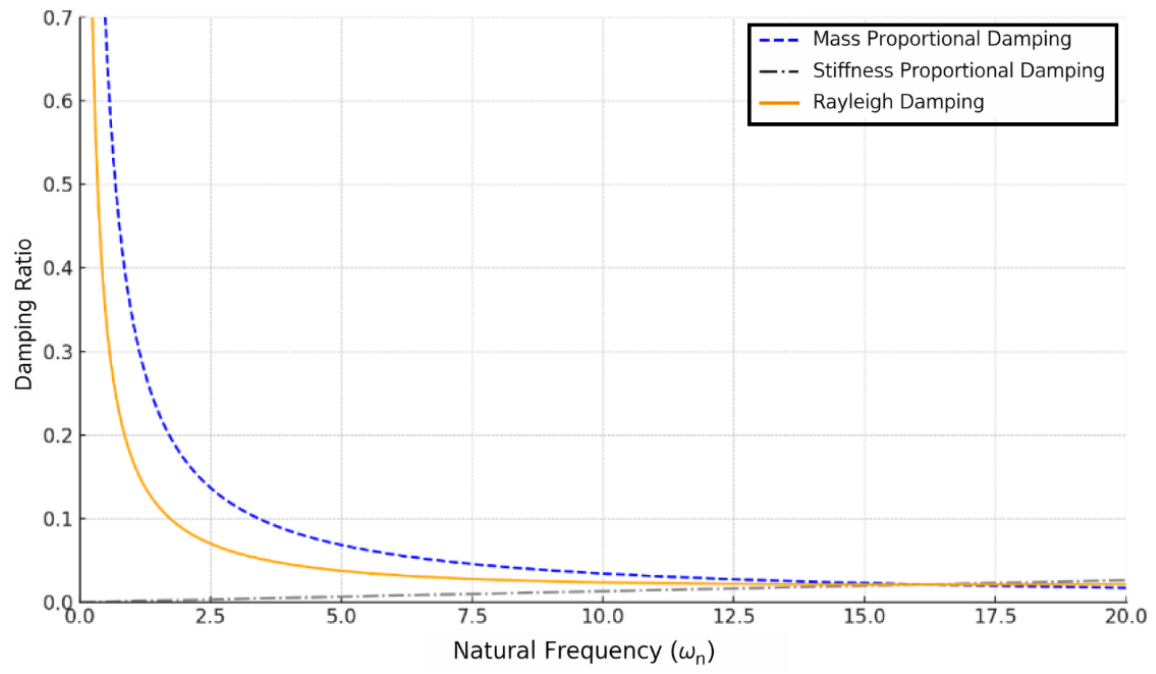
The Rayleigh coefficients α and β were calibrated to achieve a target damping ratio of 5% for the first and second vibration modes:
ζ i = 1 2 α ω i   +   β ω i
The resulting damping curves for representative structures are shown in Figure 26.

5.8. Nonlinear Time-History Load Cases

Nonlinear time-history load cases were constructed by first applying gravity loads incrementally, followed by dynamic excitation using scaled earthquake records. This sequential loading strategy ensures numerical stability and realistic simulation of structural response under combined gravity and seismic actions. The nonlinear time-history analyses were performed using the numerical integration algorithm implemented in the adopted structural analysis software. A constant integration time step consistent with the sampling interval of the selected ground-motion records was employed throughout the analyses. Nonlinear equilibrium was enforced at each integration step using the default convergence criteria of the analysis platform. The same numerical solution parameters were maintained for all structural models and all ground-motion sets to ensure a consistent comparison of structural response. Recent developments in energy-conserving time integration algorithms have demonstrated their potential advantages for nonlinear dynamic simulations; however, the present study adopts the validated implementation available in the commercial analysis software, which is widely used for engineering applications.

6. Results and Discussion

6.1. Modal Characteristics and Period Sensitivity to Near-Fault Effects

The dynamic characteristics of the investigated structures were first examined through modal analyses in order to establish a baseline for interpreting the nonlinear response results. The fundamental vibration modes and associated natural periods of the low-rise, mid-rise, and high-rise buildings are presented in Figure 27, Figure 28 and Figure 29, respectively, while the numerical values of modal periods and mass participation ratios are summarized in Table 4, Table 5 and Table 6.
The results indicate a clear increase in fundamental period with building height, as expected from classical structural dynamics principles. This period elongation plays a critical role in near-fault conditions, where rupture directivity generates velocity pulses with dominant periods typically ranging from approximately 0.6 s to several seconds. Consequently, medium- and high-rise buildings exhibit a higher likelihood of pulse–structure period matching, leading to amplified displacement demands.
Under directivity-amplified ground motions, the effective stiffness degradation observed during nonlinear response further elongates the structural periods. This phenomenon enhances resonance-like effects, particularly in the high-rise building, where the fundamental period approaches the dominant pulse period of the amplified records.

6.2. Global Displacement Response and Directional Effects

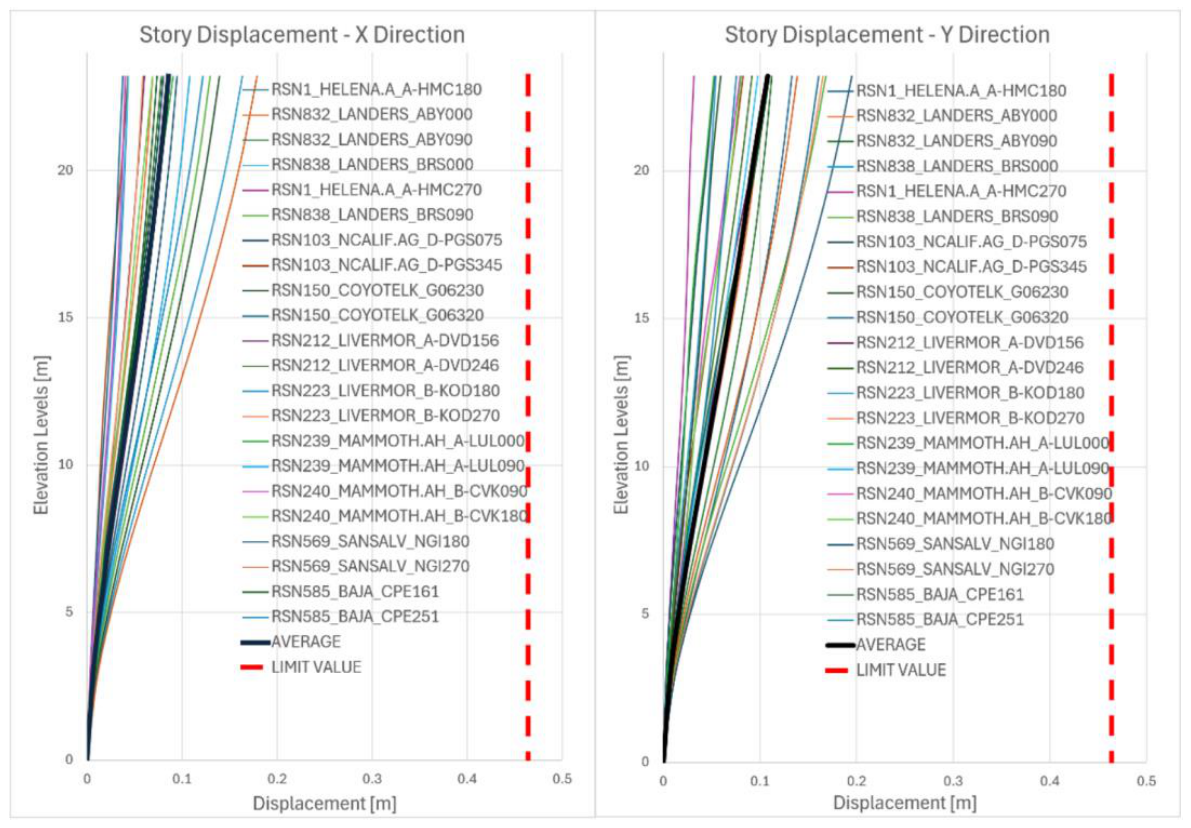
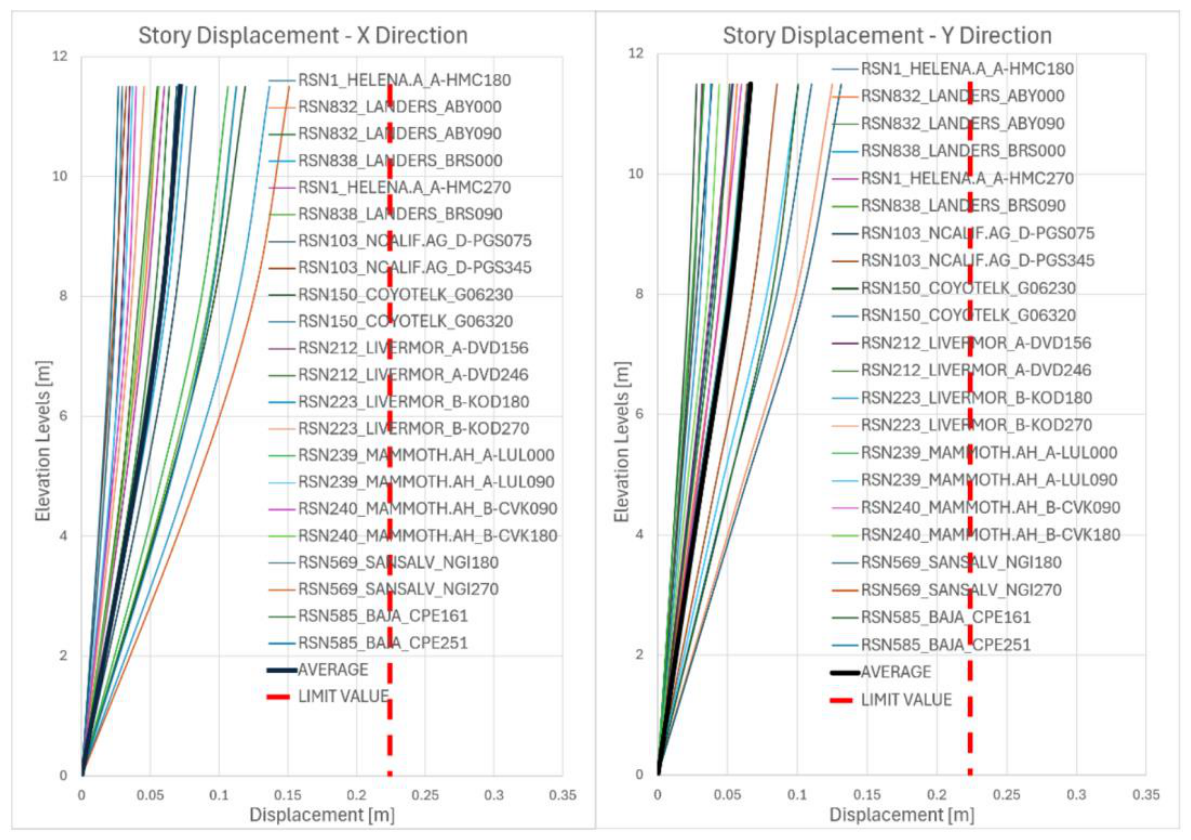
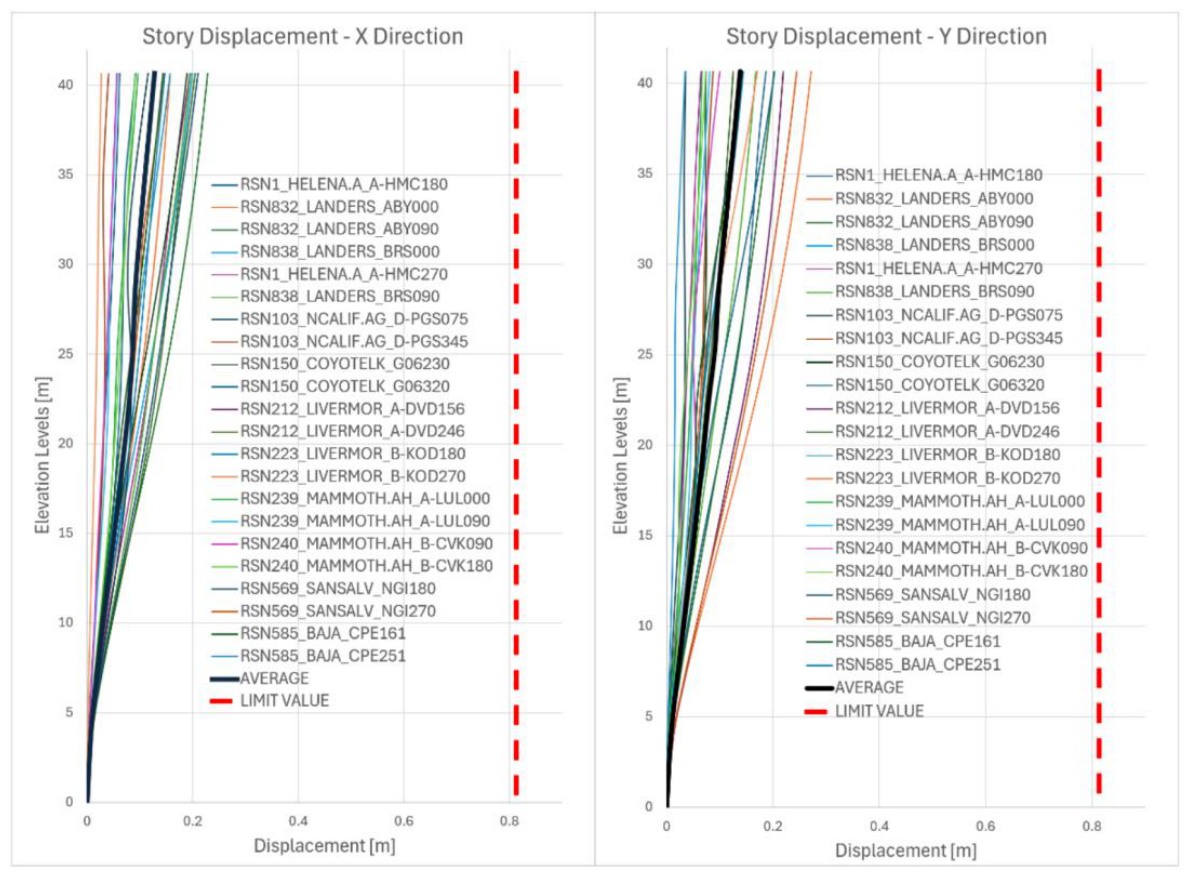
Maximum roof displacements obtained from nonlinear time history analyses are presented for both horizontal directions in Figure 30, Figure 31 and Figure 32. A systematic comparison between baseline scaled records and directivity-amplified records reveals a consistent increase in displacement demands under near-fault conditions.
For the low-rise structure, the increase in maximum displacement remains relatively limited, reflecting the dominance of short-period response governed primarily by peak ground acceleration rather than velocity pulse effects. In contrast, the mid-rise and high-rise structures exhibit pronounced displacement amplification when subjected to directivity-modified records.
This behavior can be interpreted by considering the displacement response spectrum, in which spectral displacement Sdis approximately proportional to the ratio of spectral acceleration to the square of the circular frequency:
S d T S a T ω 2 = S a T T 2 4 π 2
As near-fault directivity primarily amplifies spectral accelerations at longer periods, the resulting increase in displacement demand becomes disproportionately large for structures with longer fundamental periods.
Directional dependency is also evident in the results. The strike-normal direction consistently exhibits larger displacement demands compared to the strike-parallel direction, confirming the directional nature of rupture directivity effects observed in near-fault ground motions.

6.3. Interstory Drift Demands and Damage Concentration

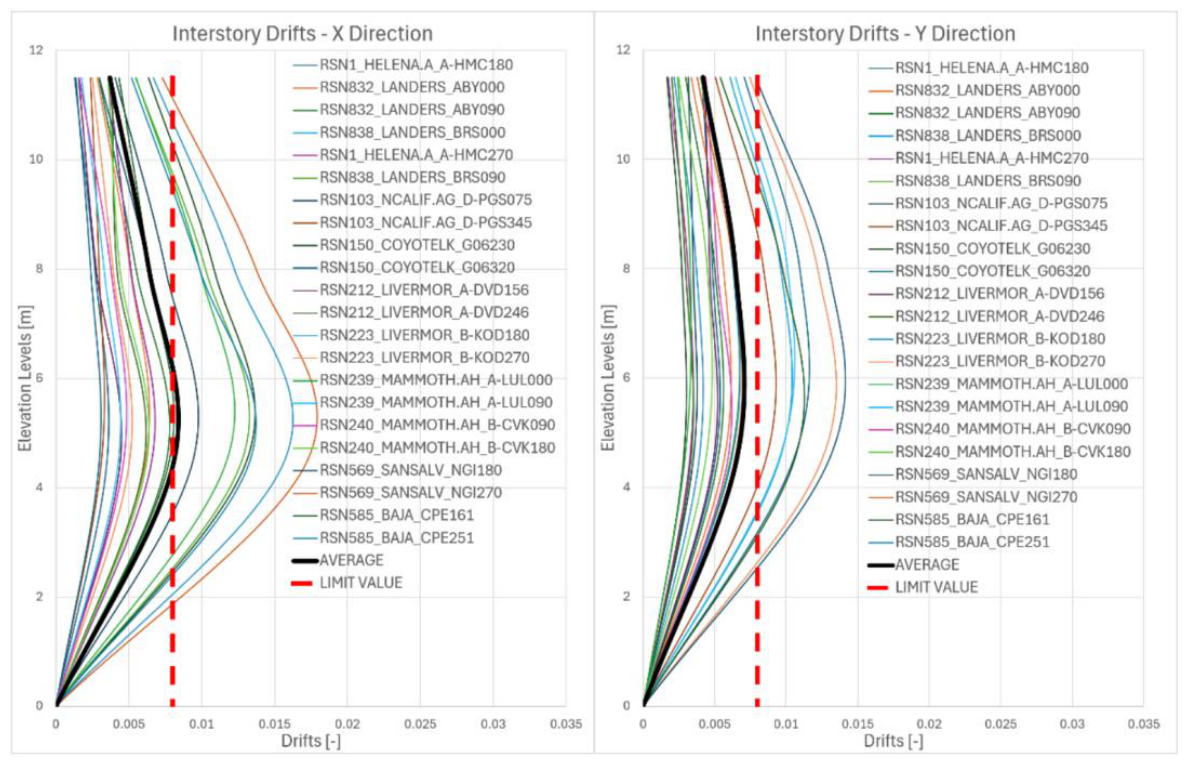
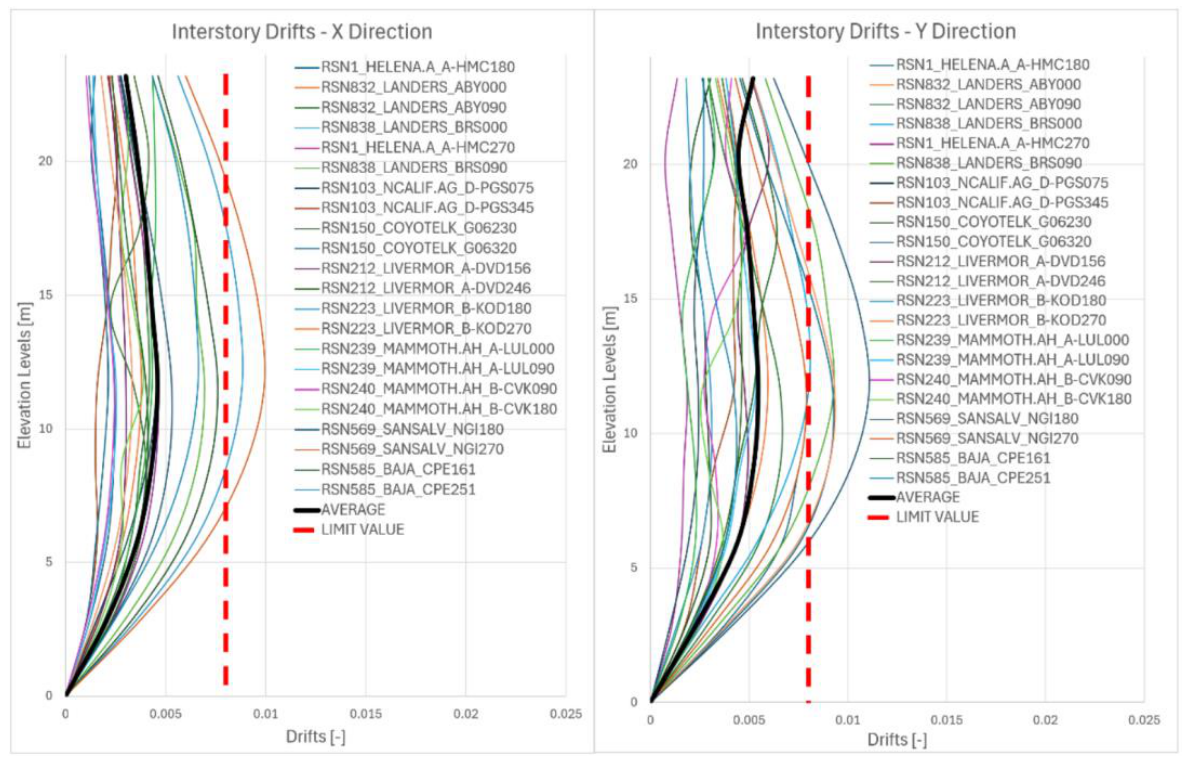
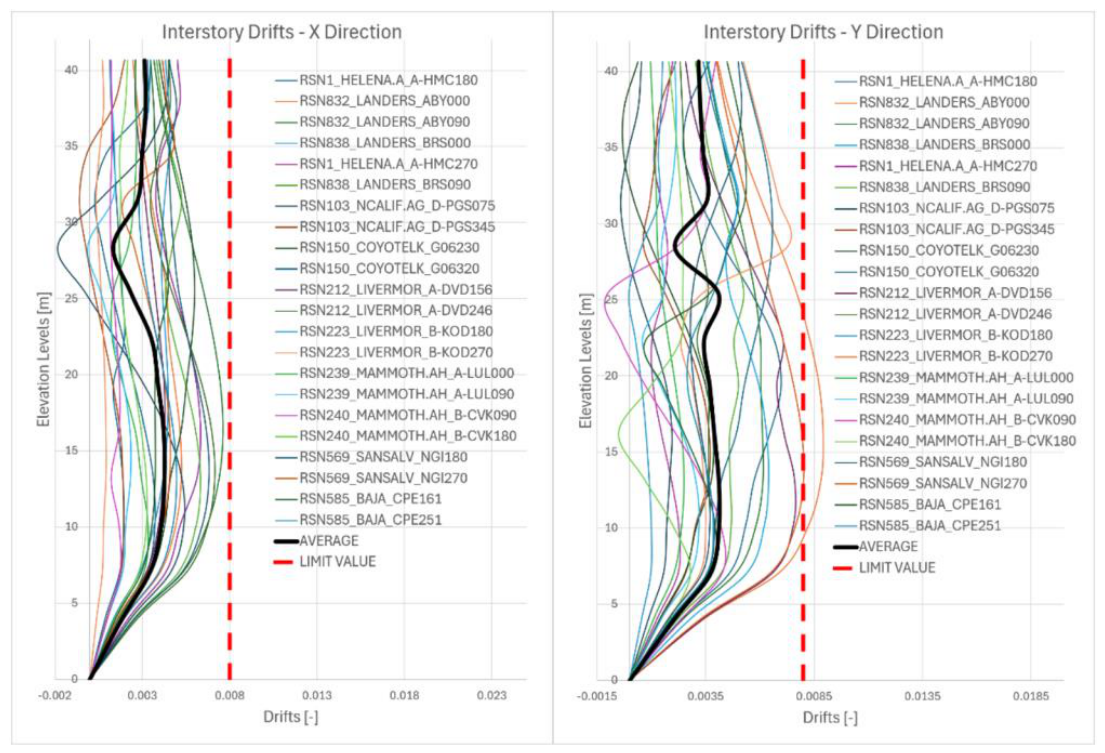
Interstory drift ratios, which constitute a primary performance indicator in performance-based seismic assessment, are presented in Figure 33, Figure 34 and Figure 35, for the three buildings, respectively.
For baseline-scaled ground motions, drift demands generally remain within acceptable performance limits prescribed by TBEC-2018 [26] for the DD-2 earthquake level. However, under directivity-amplified records, significant increases in interstory drift are observed, particularly in the mid-rise and high-rise buildings.
The concentration of drift demand tends to occur in the lower and middle stories, where flexural yielding and stiffness degradation are most pronounced. This localization of deformation is indicative of soft-story formation mechanisms, which are exacerbated by the pulse-like nature of near-fault excitations.
Mathematically, the increase in drift demand can be associated with the accumulation of plastic rotations θp at beam and column ends, which are directly related to curvature demands through
θ p = κ u κ y L p
Under near-fault excitation, the increased curvature demand κ u leads to larger plastic rotations and, consequently, higher interstory drifts.

6.4. Base Shear Forces and Global Force Demand

Comparison between baseline and directivity-amplified records reveals that near-fault effects influence base shear demands to a lesser extent than displacement-based response parameters.
While moderate increases in base shear are observed under directivity-modified records, the relative amplification is significantly smaller than that observed for displacement and drift demands. This observation is consistent with the theoretical understanding that near-fault velocity pulses primarily affect displacement-sensitive response quantities rather than force-controlled parameters (Appendix A).
This distinction highlights a critical limitation of force-based design approaches, which may fail to capture the severity of near-fault effects on deformation and damage accumulation, particularly for existing structures. Pulse-like near-fault ground motions predominantly increase displacement- and rotation-based response quantities, while force-controlled parameters such as base shear remain comparatively less affected [12].

6.5. Damage State Evaluation

Element-level performance assessments were conducted by examining brittle–ductile behavior classifications and final performance states of beams, columns, and shear walls. The corresponding results are presented in Table 7.
For baseline ground motions, damage remains predominantly concentrated in beam elements, indicating a desirable ductile response mechanism consistent with capacity design principles. Column and shear wall elements generally maintain acceptable performance levels. Under directivity-amplified ground motions, a notable redistribution of structural damage is observed. Compared with the baseline analyses, increased curvature and axial force interaction demands promote greater participation of columns and shear walls in the nonlinear response, while beam plastic hinging continues to contribute significantly to energy dissipation. This redistribution results in a less favorable damage pattern, with a larger number of vertical load-resisting elements reaching advanced performance limits. Although the overall structural response remains stable, the increased concentration of damage in columns and shear walls indicates a reduction in the structural safety margin under near-fault directivity effects. These findings demonstrate that rupture directivity can significantly modify the distribution of inelastic demand assumed in conventional design and performance assessment procedures (Table 8).
A comparative evaluation of the three case-study buildings reveals that the vulnerability to near-fault directivity effects increases systematically with building height. The low-rise structure, governed by short-period response, remains relatively insensitive to velocity pulse effects. In contrast, the mid-rise and high-rise structures experience substantial increases in displacement, drift, and element-level damage under directivity-modified ground motions.
This trend underscores the critical role of the ratio between the structural fundamental period and the dominant pulse period in determining seismic demand. Structures with longer natural periods are inherently more susceptible to near-fault effects, particularly when nonlinear behavior leads to additional period elongation during seismic response.
The results presented in this section indicate that while TBEC-2018 [26] design spectra provide a reasonable representation of force demand, they may underestimate displacement-based performance metrics for structures located in near-fault regions. The implicit treatment of near-fault effects within code-based spectra appears insufficient to capture the amplified deformation demands induced by rupture directivity.
These findings suggest that performance-based assessment of existing reinforced concrete buildings in fault-proximal regions should explicitly incorporate near-fault ground motion characteristics, either through record selection procedures or through direct modification of ground motion inputs.
In summary, the results demonstrate that near-fault directivity effects significantly influence the nonlinear seismic response of reinforced concrete buildings, particularly in terms of displacement demand, interstory drift, and damage distribution. The severity of these effects increases with building height and structural period, highlighting the need for enhanced assessment methodologies when evaluating structures located near active fault systems.
The insights obtained from this study provide a strong basis for the conclusions and recommendations presented in the following section.
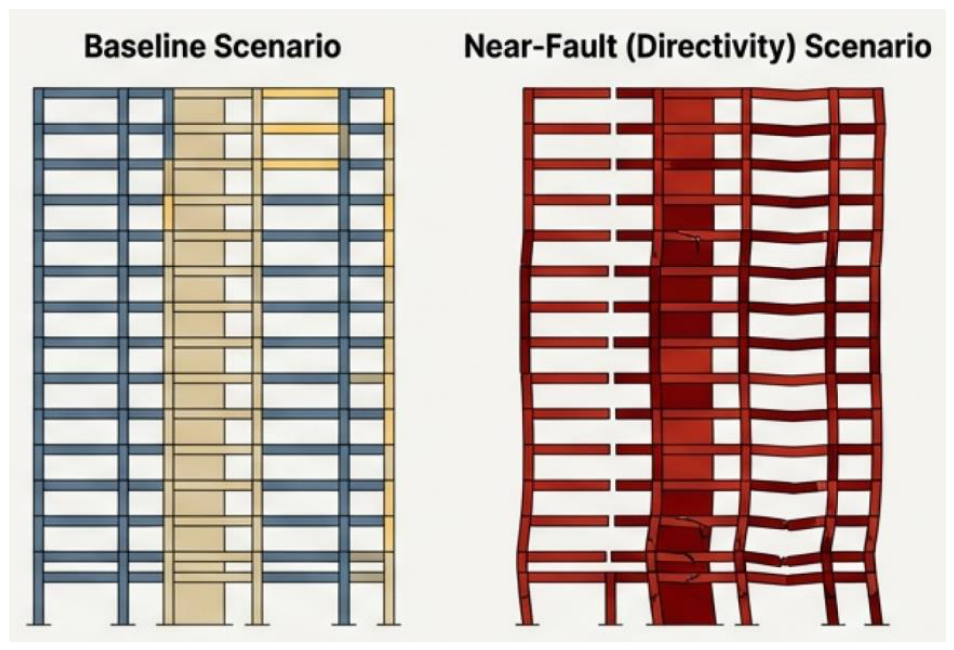
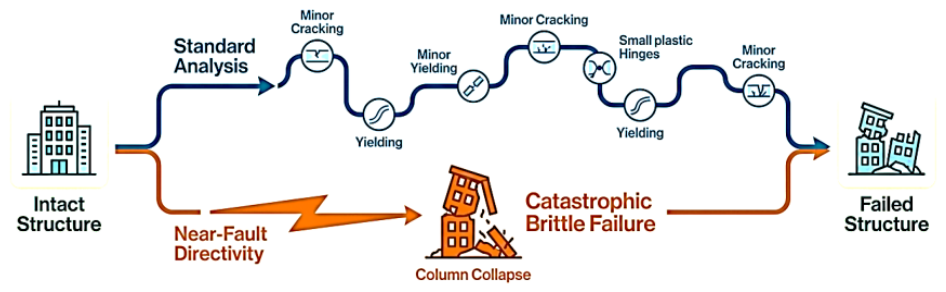
Figure 36 schematically illustrates the fundamentally different damage evolution paths observed under baseline ground motion conditions and near-fault directivity-dominated excitation. Under the baseline ground motions, the overall structural response was predominantly governed by beam-controlled inelastic behavior. However, the numerical results also indicate that brittle column damage occurred in several structural models, although its extent remained considerably lower than that observed under the directivity-modified ground motions. The introduction of rupture directivity increased not only the overall damage level but also the participation of columns and shear walls in the nonlinear response.
In contrast, near-fault directivity fundamentally alters this evolution pathway by introducing large-amplitude, pulse-like velocity demands that rapidly concentrate deformation in vertical load-carrying elements. As depicted in the figure, this abrupt increase in displacement and curvature demand bypasses the conventional gradual damage sequence and triggers a direct transition toward column-dominated brittle mechanisms. Once critical columns experience excessive curvature and axial force interaction, the damage progression accelerates, leading to column collapse and, subsequently, global structural failure.
The figure emphasizes that the catastrophic brittle failure mechanism induced by near-fault directivity is not merely an amplification of standard damage processes but represents a qualitative shift in failure mode. This conceptual distinction is consistent with the numerical findings of the present study, where near-fault excitation selectively activated column-level collapse mechanisms in structures that otherwise exhibited acceptable performance under standard ground motion analyses. Accordingly, the schematic highlights the limitation of conventional analysis frameworks that implicitly assume gradual damage evolution and underscores the necessity of explicitly accounting for near-fault directivity effects in performance-based seismic assessment of fault-proximal reinforced concrete buildings.
Table 9 summarizes the maximum roof displacement demands of the investigated structures, while Table 10 extends this comparison by normalizing these displacements in terms of maximum interstory drift ratios. The results reveal a clear distinction between absolute displacement demand and deformation efficiency, emphasizing that building height alone does not directly govern seismic performance under near-fault excitation.
In absolute terms, maximum roof displacements increase systematically with building height. Structure A exhibits the lowest displacement demand, whereas Structures B and C experience progressively larger displacements in both horizontal directions. This trend reflects the increasing flexibility and longer fundamental periods associated with taller buildings, which amplify displacement response under long-period components of near-fault ground motions.
However, when displacement demands are normalized through interstory drift ratios, a markedly different performance hierarchy emerges. Despite having the smallest absolute displacements, Structure A exhibits the highest drift ratios (0.60% in X and 0.52% in Y), indicating a concentration of deformation demand over a relatively short height. This behavior is consistent with the presence of a pronounced soft-story mechanism at the ground level, where limited vertical distribution of lateral deformation leads to unfavorable drift amplification.
Structure B shows moderate displacement levels but lower drift ratios compared to Structure A, suggesting a more distributed deformation pattern along the height. Nevertheless, the drift demands remain sufficiently high to activate column-level vulnerabilities under near-fault excitation, as discussed in the preceding sections. The asymmetric increase between X and Y directions further highlights the directional sensitivity of the structure to near-fault ground motions.
Structure C, despite exhibiting the largest absolute displacements, achieves the lowest drift ratios in both directions. This indicates that lateral deformations are effectively distributed along the building height, primarily due to the presence of shear walls and a more favorable stiffness and strength configuration. As a result, global displacement demand does not translate into critical local deformation concentrations.
Overall, these results demonstrate that seismic performance under near-fault ground motions is governed by deformation distribution rather than absolute displacement magnitude. Consequently, displacement-based assessment must be complemented by drift-based performance metrics to reliably identify critical failure mechanisms in fault-proximal reinforced concrete buildings.
Table 11 provides a comparative synthesis of the dominant vulnerabilities, column behavior, and overall seismic performance of the three investigated structures under near-fault ground motions. The results highlight that overall performance is not governed solely by the proportion of ductile column behavior, but rather by the interaction between global structural irregularities, deformation demand concentration, and load-resisting system configuration.
Structure A, despite exhibiting a predominantly ductile column response (82%), fails to meet code-defined performance limits due to a pronounced soft-story irregularity at the ground floor. The exceedance of inter-story drift limits indicates that global deformation demand is highly localized, leading to an unfavorable redistribution of demands even when column-level behavior remains largely ductile. This finding underscores that ductility alone is insufficient to ensure acceptable performance when geometric or stiffness irregularities dominate the response.
Structure B demonstrates the most critical performance degradation, characterized by a substantial escalation of column damage toward collapse under near-fault directivity. Although the majority of columns still exhibit ductile behavior (66%), the reduced margin relative to Structure A, combined with near-fault pulse effects, results in a systemic instability and a high collapse risk. This behavior confirms that near-fault excitation can selectively activate brittle or near-brittle mechanisms in mid-rise structures, particularly when their fundamental periods align with dominant velocity pulse periods.
In contrast, Structure C exhibits a uniformly ductile column response (100%) and achieves good overall performance, meeting the intended design objectives. The presence of shear walls and superior material properties effectively limits drift demands and prevents the propagation of localized damage into a global failure mechanism. This comparison demonstrates that structural system redundancy and stiffness distribution play a decisive role in mitigating near-fault effects, beyond what can be inferred from column ductility ratios alone.
Overall, the table illustrates that near-fault seismic performance is governed by system-level behavior rather than isolated element response, reinforcing the necessity of deformation-based, performance-oriented assessment approaches for structures located in fault-proximal regions.
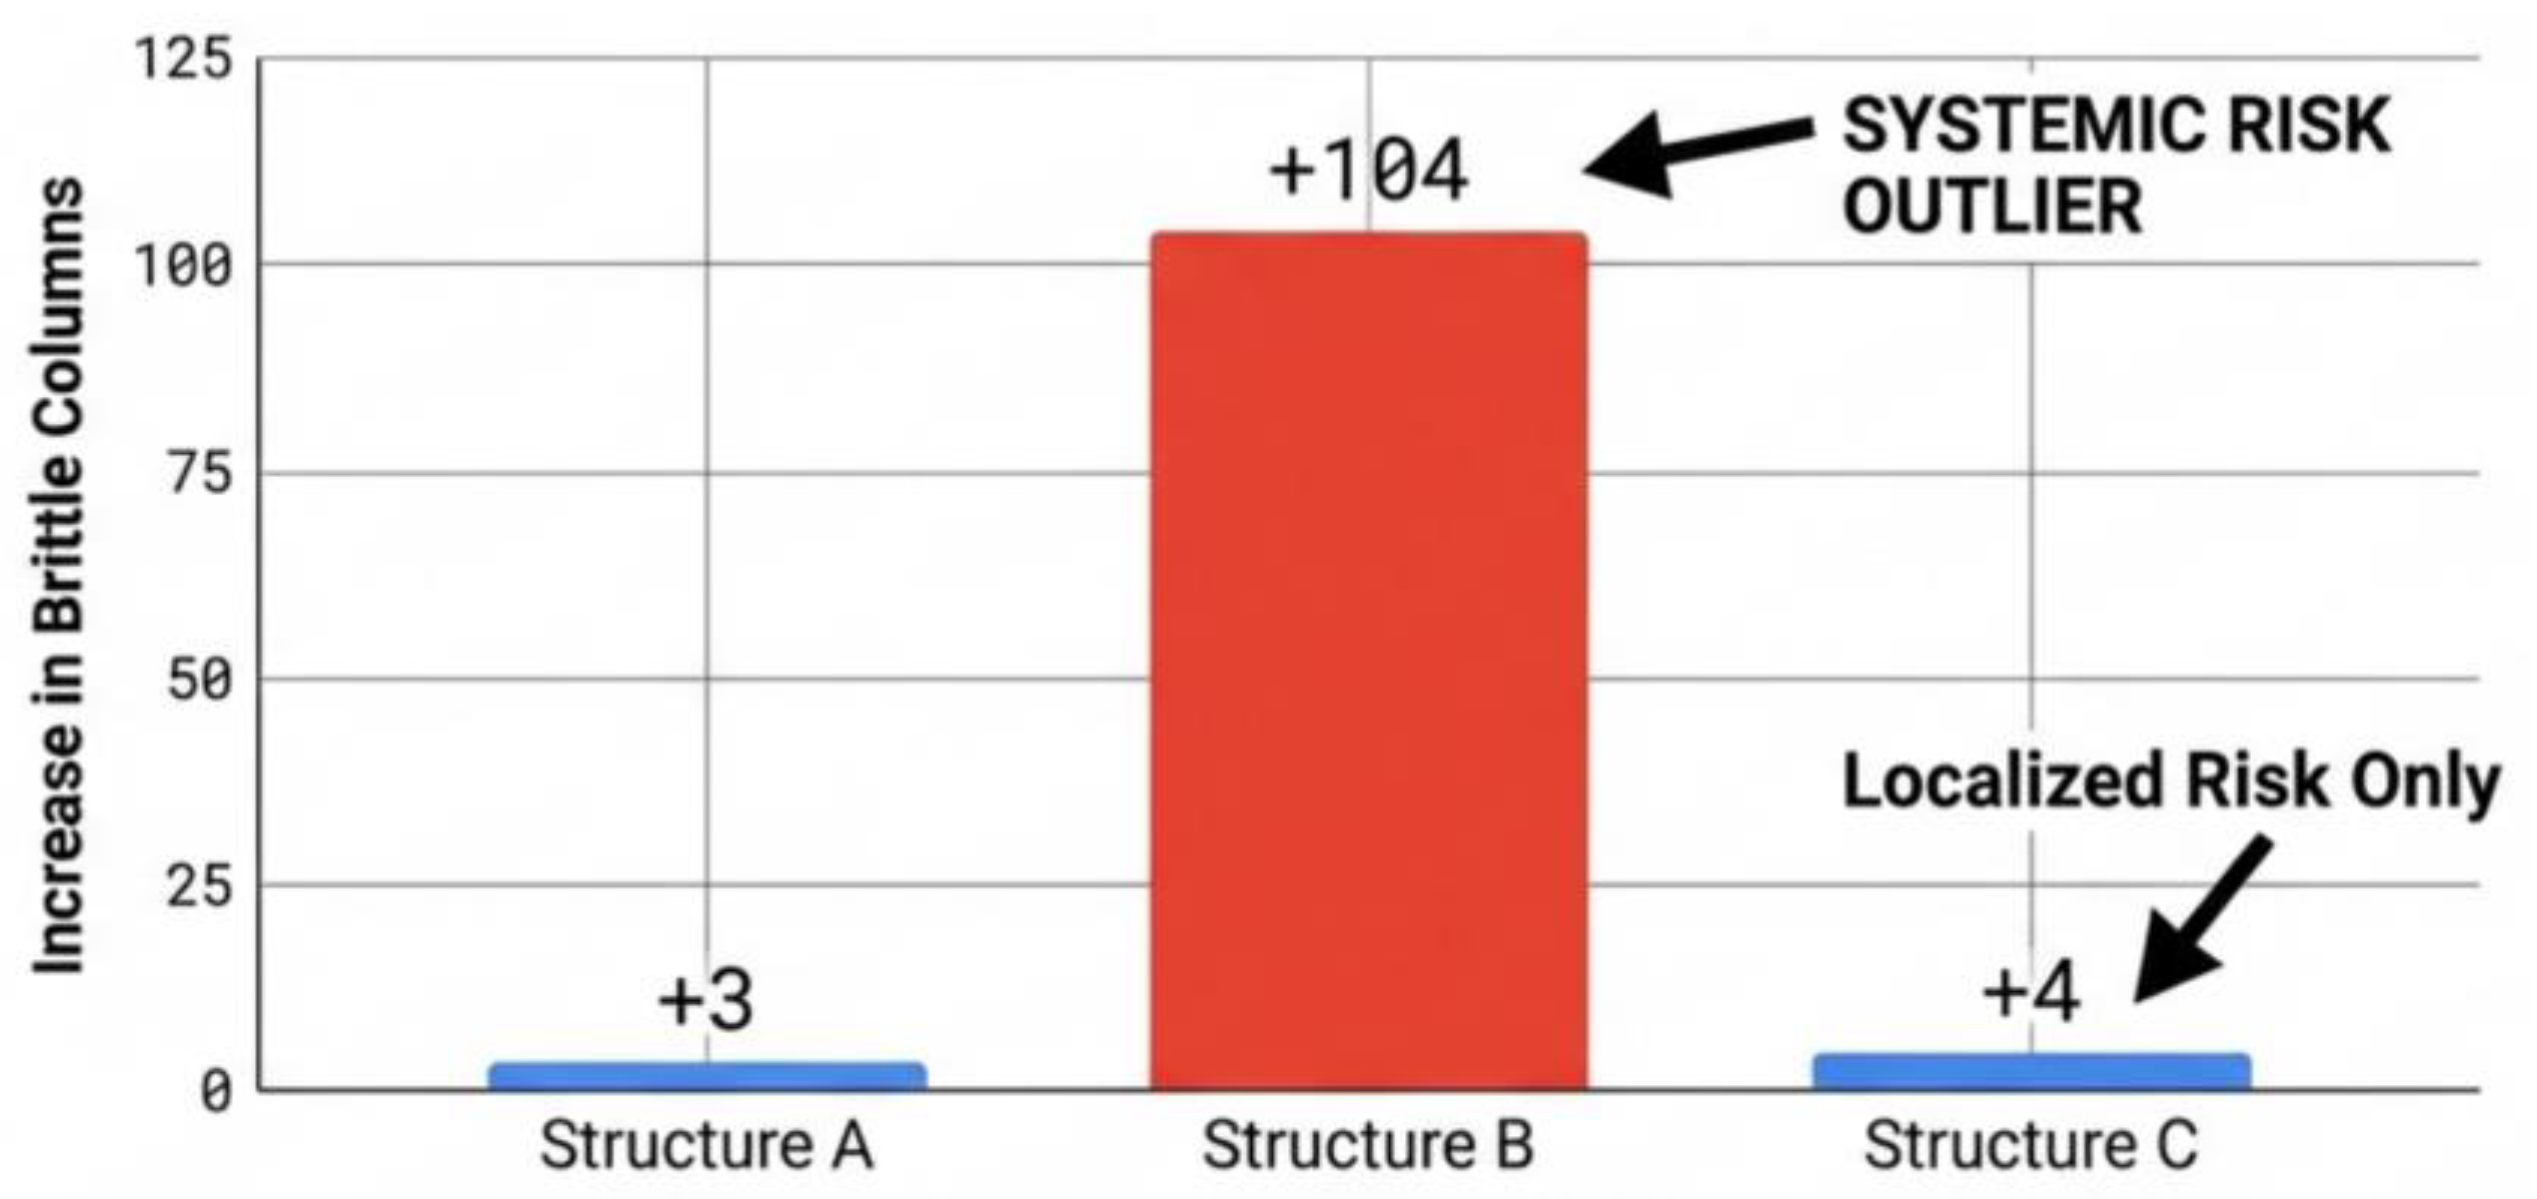
Figure 37 illustrates the relative increase in the number of brittle column responses observed in the three investigated structures when subjected to directivity-modified ground motions. The results reveal a highly non-uniform distribution of vulnerability among the structures. While Structures A and C exhibit only marginal increases in brittle column demand (+3 and +4, respectively), Structure B shows an extraordinary increase of +104, clearly standing out as a systemic risk outlier. This pronounced disparity cannot be attributed solely to local detailing deficiencies but rather indicates a global response instability driven by unfavorable interaction between structural dynamic characteristics and near-fault excitation.
The extreme response observed in Structure B suggests a critical alignment between its fundamental period and the dominant velocity pulse period associated with rupture directivity, leading to amplified displacement and curvature demands in vertical load-carrying elements. As a result, plastic hinge formation is no longer confined to beams, and a widespread transition toward column-dominated brittle mechanisms is triggered. In contrast, the limited increases observed in Structures A and C indicate that their responses remain largely governed by localized damage mechanisms, without propagation into a system-wide instability. These findings demonstrate that near-fault directivity effects do not uniformly increase seismic demand across different structures; instead, they may selectively activate catastrophic failure modes in specific structural typologies, which are not readily detectable through conventional force-based or code-compliant assessment procedures.
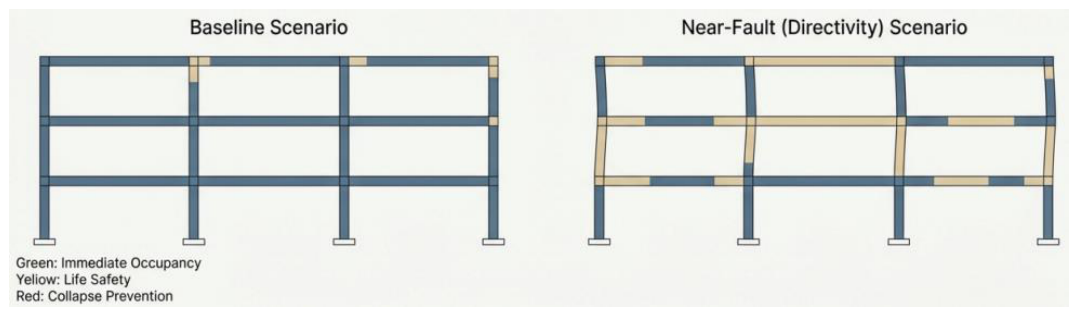
Under the baseline scenario, Structure A exhibits a relatively regular deformation pattern, with damage remaining largely confined to beam elements and limited column involvement. However, under the near-fault (directivity) scenario, a pronounced concentration of deformation is observed at the ground-story level (Figure 38). The figures clearly indicate that column deformations localize in the lower stories rather than being distributed along the height. This behavior reflects the presence of a soft-story mechanism, where near-fault velocity pulses amplify interstory drift demands despite relatively modest absolute displacements. Consequently, although the overall deformation demand remains limited in magnitude, the structural response becomes performance-critical due to localized drift concentration, leading to code-level performance exceedance driven by system irregularity rather than widespread damage.
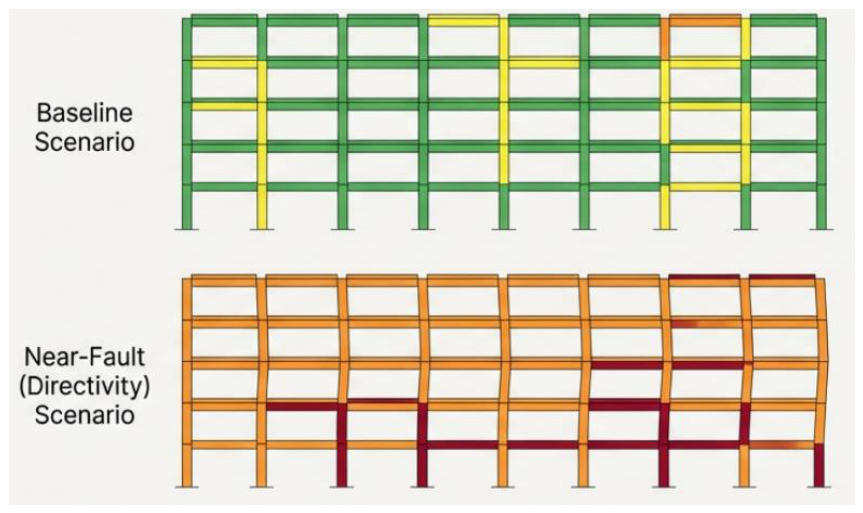
Structure B exhibits the most severe degradation under near-fault directivity effects. While the baseline scenario shows a gradual and relatively balanced damage progression, the near-fault scenario triggers a rapid transition toward column-dominated inelastic behavior. Figure 39 reveals extensive plastic deformation and geometric distortion in columns, particularly at the lower and intermediate stories, indicating the activation of a global instability mechanism. This response is consistent with an unfavorable alignment between the building’s fundamental period and the dominant velocity pulse period associated with near-fault excitation. As a result, energy dissipation shifts away from controlled beam yielding toward brittle or near-brittle column mechanisms, significantly increasing collapse potential. Structure B therefore behaves as a systemic risk outlier, for which conventional code-compliant assessments fail to capture the severity of near-fault-induced demand amplification.
Structure C demonstrates a fundamentally different response compared to Structures A and B. Under both baseline and near-fault scenarios, deformation demands are distributed more uniformly along the building height. Although near-fault excitation leads to increased absolute displacements, Figure 40 shows that deformation remains largely global and controlled, without excessive concentration in critical columns. The presence of shear walls and a more balanced stiffness distribution enables the structure to accommodate near-fault demands through overall flexural response rather than localized failure mechanisms. Consequently, near-fault directivity does not trigger a qualitative change in the damage evolution path of Structure C, indicating that appropriate structural system configuration can effectively mitigate near-fault-induced instability despite increased displacement demand.
The increase in structural response observed under directivity-modified ground motions is primarily governed by the interaction between the structural fundamental period and the dominant period of the near-fault velocity pulse. When these characteristic periods become comparable, the transient pulse introduces a concentrated energy input over a short duration, resulting in increased inelastic deformation demands. As nonlinear behavior develops, stiffness degradation and period elongation further amplify displacement demands, leading to larger interstory drifts and a redistribution of damage from beam-dominated plastic hinging toward increased participation of columns and shear walls. These findings are consistent with the well-established understanding that near-fault directivity primarily amplifies deformation-controlled response parameters rather than force-controlled quantities. Recent advances in nonlinear seismic-wave propagation have further demonstrated that complex wave amplification mechanisms can significantly influence structural demand under strong ground motions [29]. Likewise, studies investigating nonlinear deformation mechanisms at the material scale have highlighted the importance of energy dissipation and deformation localization in the overall nonlinear response of engineering systems [30]. Although the present study does not explicitly model these physical processes, the observed structural response trends are consistent with these broader nonlinear response mechanisms.
Recent advances in seismic wave engineering have shown that engineered metasurfaces and locally resonant metamaterials can effectively modify the propagation characteristics of seismic waves and reduce wave amplification within specific frequency ranges. For example, elastic metasurfaces have been proposed to manipulate Scholte waves propagating along fluid–poroelastic interfaces, while quasi-zero stiffness locally resonant metamaterials have demonstrated remarkable capabilities for attenuating low-frequency vibrations over relatively wide frequency bands [31,32]. Although the present study focuses on the structural response of existing reinforced concrete buildings rather than seismic wave-control technologies, these emerging concepts may provide promising complementary strategies for mitigating near-fault ground-motion effects in future earthquake-resistant infrastructure.


7. Conclusions

The present study proposed an integrated framework for evaluating the seismic performance of existing reinforced concrete (RC) buildings subjected to near-fault ground motions influenced by rupture directivity. By combining probabilistic seismic hazard analysis (PSHA), site-specific design spectrum development in accordance with TBEC-2018 [26], directivity-based ground-motion modification, and nonlinear time-history analysis, the study investigated the influence of rupture directivity on representative low-, medium-, and high-rise RC buildings located near the Sivrice–Pütürge segment of the Malatya–Ovacık Fault Zone.
The principal findings of the study can be summarized as follows:
  • Near-fault rupture directivity significantly increased displacement-controlled response parameters. Roof displacement, interstory drift ratio, and member deformation demands were substantially amplified under directivity-modified ground motions, whereas force-controlled response parameters, such as base shear, exhibited comparatively smaller changes.
  • The influence of rupture directivity was strongly dependent on structural height and dynamic characteristics. Low-rise buildings showed relatively limited sensitivity because of their short fundamental periods, whereas medium- and high-rise buildings experienced considerably greater deformation demands due to the interaction between long-period velocity pulses and structural vibration periods.
  • Near-fault directivity modified the distribution of structural damage. Compared with the baseline ground motions, directivity-modified records increased the participation of columns and shear walls in the nonlinear response, resulting in a less favorable damage distribution and higher deformation demands in the vertical load-resisting system.
  • The comparison between the PSHA-derived spectra and the TBEC-2018 design spectrum demonstrated that the code-based spectrum is generally adequate for short-period response but may underestimate long-period demands relevant to near-fault conditions. Consequently, performance evaluations based solely on conventional code-compatible spectra may underestimate deformation demands in fault-proximal regions.
  • The adopted analytical framework provides practical engineering implications for seismic assessment in near-fault regions. The use of paired ground-motion sets consisting of baseline and directivity-modified records proved to be an effective approach for quantifying the influence of rupture directivity while maintaining a consistent comparison between conventional and near-fault seismic demands.
From an engineering perspective, the results highlight that seismic performance assessments of existing RC buildings located near active faults should explicitly consider rupture directivity during ground-motion selection and scaling, particularly when displacement-based performance objectives govern structural safety.
Future research should extend the proposed framework by incorporating explicit pulse-like ground-motion characterization, soil–structure interaction, regional fragility assessment, and additional building typologies representative of existing RC building stock. Such developments would further improve the reliability of seismic performance evaluations for structures located in fault-proximal regions.

Author Contributions

Conceptualization, F.K. and U.M.; methodology, F.K. and U.M.; software, F.K.; validation, F.K. and U.M.; formal analysis, F.K.; investigation, F.K.; data curation, F.K.; writing—original draft preparation, F.K.; writing—review and editing, U.M.; supervision, U.M.; project administration, U.M. All authors have read and agreed to the published version of the manuscript.

Funding

This research received no external funding.

Data Availability Statement

The data presented in this study are available on request from the corresponding author due to privacy.

Conflicts of Interest

The authors declare no conflicts of interest.

Appendix A

Table A1. Base Shear Forces in X and Y Directions from All Time-History Analyses for Structure-A.
Earthquake RecordResponseX-Direction (kN)Y-Direction (kN)
RSN1_HELENA_A_A-HMC180Max4133.525901.95
RSN1_HELENA_A_A-HMC180Min−3179.54−7846.53
RSN103_NCALIF_AG_D-PGS075Max11,466.545100.50
RSN103_NCALIF_AG_D-PGS075Min−8215.19−4461.65
RSN150_COYOTELK_G06230Max12,217.553370.88
RSN150_COYOTELK_G06230Min−16,561.95−3608.62
RSN212_LIVERMOR_A-DVD156Max4771.737095.96
RSN212_LIVERMOR_A-DVD156Min−5883.42−7835.99
RSN223_LIVERMOR_B-KOD180Max18,399.455245.17
RSN223_LIVERMOR_B-KOD180Min−19,809.68−5055.86
RSN239_MAMMOTH_AH_A-LUL000Max13,603.863971.25
RSN239_MAMMOTH_AH_A-LUL000Min−12,783.66−3631.13
RSN240_MAMMOTH_AH_B-CVK090Max5191.859219.80
RSN240_MAMMOTH_AH_B-CVK090Min−5596.03−7823.02
RSN569_SANSALV_NGI180Max9655.5117,988.51
RSN569_SANSALV_NGI180Min−10,116.21−17,340.26
RSN585_BAJA_CPE161Max9333.9613,531.35
RSN585_BAJA_CPE161Min−10,367.31−15,639.59
RSN832_LANDERS_ABY000Max6362.567243.77
RSN832_LANDERS_ABY000Min−7164.97−6367.71
RSN838_LANDERS_BRS000Max10,357.5712,939.18
RSN838_LANDERS_BRS000Min−10,476.89−11,706.10
RSN1_HELENA_A_A-HMC270Max7097.034875.42
RSN1_HELENA_A_A-HMC270Min−8843.63−3064.68
RSN103_NCALIF_AG_D-PGS345Max3536.0412,407.01
RSN103_NCALIF_AG_D-PGS345Min−3122.29−7764.36
RSN150_COYOTELK_G06320Max2627.3011,090.03
RSN150_COYOTELK_G06320Min−3711.83−14,778.51
RSN212_LIVERMOR_A-DVD246Max6702.834680.55
RSN212_LIVERMOR_A-DVD246Min−8312.25−5016.10
RSN223_LIVERMOR_B-KOD270Max5381.4716,824.63
RSN223_LIVERMOR_B-KOD270Min−6034.58−18,112.84
RSN239_MAMMOTH_AH_A-LUL090Max4031.3112,379.54
RSN239_MAMMOTH_AH_A-LUL090Min−4839.29−10,660.62
RSN240_MAMMOTH_AH_B-CVK180Max8029.145778.19
RSN240_MAMMOTH_AH_B-CVK180Min−7128.99−6657.26
RSN569_SANSALV_NGI270Max20,860.369220.19
RSN569_SANSALV_NGI270Min−20,330.85−8867.44
RSN585_BAJA_CPE251Max14,161.748824.62
RSN585_BAJA_CPE251Min−17,108.63−9026.48
RSN832_LANDERS_ABY090Max8659.966477.90
RSN832_LANDERS_ABY090Min−8032.24−7108.18
RSN838_LANDERS_BRS090Max15,607.988965.87
RSN838_LANDERS_BRS090Min−14,757.55−8327.02
Table A2. Base Shear Forces in X and Y Directions from All Time-History Analyses for Structure-B.
Earthquake RecordResponseX-Direction (kN)Y-Direction (kN)
RSN1_HELENA.A_A-HMC180Max7298.751918,602.3583
RSN1_HELENA.A_A-HMC180Min−7553.345−19,869.2921
RSN103_NCALIF.AG_D-PGS075Max10,221.16165245.4423
RSN103_NCALIF.AG_D-PGS075Min−10,067.9672−6035.0043
RSN150_COYOTELK_G06230Max17,937.416710,045.4283
RSN150_COYOTELK_G06230Min−22,097.5244−6948.7205
RSN212_LIVERMOR_A-DVD156Max9463.086513,988.2168
RSN212_LIVERMOR_A-DVD156Min−12,174.8815−10,008.1525
RSN223_LIVERMOR_B-KOD180Max23,233.456643.9355
RSN223_LIVERMOR_B-KOD180Min−23,834.1384−6549.5159
RSN239_MAMMOTH.AH_A-LUL000Max17,315.60946755.5804
RSN239_MAMMOTH.AH_A-LUL000Min−15,458.4068−8374.8088
RSN240_MAMMOTH.AH_B-CVK090Max7835.755713,306.722
RSN240_MAMMOTH.AH_B-CVK090Min−8642.7864−13,254.033
RSN569_SANSALV_NGI180Max14,717.629820,587.4785
RSN569_SANSALV_NGI180Min−12,087.8577−18,808.9058
RSN585_BAJA_CPE161Max12,165.60998867.1468
RSN585_BAJA_CPE161Min−15,876.8343−12,204.3179
RSN832_LANDERS_ABY000Max10,239.890410,910.7019
RSN832_LANDERS_ABY000Min−10,997.3469−10,818.9847
RSN838_LANDERS_BRS000Max18,495.96412,895.04
RSN838_LANDERS_BRS000Min−18,172.318−12,680.7841
RSN1_HELENA.A_A-HMC270Max14,107.595645.9414
RSN1_HELENA.A_A-HMC270Min−16,691.2726−6583.9846
RSN103_NCALIF.AG_D-PGS345Max5035.401210,767.7037
RSN103_NCALIF.AG_D-PGS345Min−7674.6148−8039.7778
RSN150_COYOTELK_G06320Max8540.779917,013.3792
RSN150_COYOTELK_G06320Min−5805.2694−20,003.6355
RSN212_LIVERMOR_A-DVD246Max15,221.61339973.2499
RSN212_LIVERMOR_A-DVD246Min−16,863.7078−10,113.1802
RSN223_LIVERMOR_B-KOD270Max9095.384318,132.9498
RSN223_LIVERMOR_B-KOD270Min−8643.1232−18,795.3084
RSN239_MAMMOTH.AH_A-LUL090Max8324.65412,251.9542
RSN239_MAMMOTH.AH_A-LUL090Min−6278.6936−8666.6525
RSN240_MAMMOTH.AH_B-CVK180Max11,857.091910,504.1917
RSN240_MAMMOTH.AH_B-CVK180Min−13,884.4393−14,523.9183
RSN569_SANSALV_NGI270Max24,537.728714,607.5397
RSN569_SANSALV_NGI270Min−25,026.8333−14,411.5713
RSN585_BAJA_CPE251Max13,426.0957953.1931
RSN585_BAJA_CPE251Min−15,861.1784−11,398.0834
RSN832_LANDERS_ABY090Max13,737.26214,070.7326
RSN832_LANDERS_ABY090Min−13,413.4693−12,761.5874
RSN838_LANDERS_BRS090Max20,280.354915,036.2378
RSN838_LANDERS_BRS090Min−17,278.8418−16,316.8219
Table A3. Base Shear Forces in X and Y Directions from All Time-History Analyses for Structure-C.
Earthquake RecordResponseX-Direction (kN)Y-Direction (kN)
RSN1_HELENA.A_A-HMC180Max9159.73559623.0274
RSN1_HELENA.A_A-HMC180Min−6592.3731−14,836.0309
RSN103_NCALIF.AG_D-PGS075Max24,088.73434389.136
RSN103_NCALIF.AG_D-PGS075Min−26,142.3831−6293.5069
RSN150_COYOTELK_G06230Max14,256.79666218.405
RSN150_COYOTELK_G06230Min−17,629.6591−9170.3701
RSN212_LIVERMOR_A-DVD156Max16,114.762317,519.1677
RSN212_LIVERMOR_A-DVD156Min−15,612.0502−20,145.7451
RSN223_LIVERMOR_B-KOD180Max12,818.8253976.6961
RSN223_LIVERMOR_B-KOD180Min−12,699.9311−4550.8316
RSN239_MAMMOTH.AH_A-LUL000Max20,743.5117612.915
RSN239_MAMMOTH.AH_A-LUL000Min−19,531.0572−7900.0757
RSN240_MAMMOTH.AH_B-CVK090Max10,937.353312,021.2599
RSN240_MAMMOTH.AH_B-CVK090Min−12,648.596−17,812.9861
RSN569_SANSALV_NGI180Max23,571.988512,387.8005
RSN569_SANSALV_NGI180Min−24,566.8945−12,046.2673
RSN585_BAJA_CPE161Max14,366.25112,594.0979
RSN585_BAJA_CPE161Min−14,258.0702−14,282.1215
RSN832_LANDERS_ABY000Max18,599.765819,227.4501
RSN832_LANDERS_ABY000Min−14,349.3804−18,916.3502
RSN838_LANDERS_BRS000Max15,739.881817,152.2371
RSN838_LANDERS_BRS000Min−17,219.3196−15,848.113
RSN1_HELENA.A_A-HMC270Max22,319.02037914.0976
RSN1_HELENA.A_A-HMC270Min−18,721.3849−8723.7919
RSN103_NCALIF.AG_D-PGS345Max10,226.798210,822.1982
RSN103_NCALIF.AG_D-PGS345Min−11,782.9235−9859.313
RSN150_COYOTELK_G06320Max13,294.621810,628.2441
RSN150_COYOTELK_G06320Min−17,807.5489−12,025.6871
RSN212_LIVERMOR_A-DVD246Max26,261.114610,113.4902
RSN212_LIVERMOR_A-DVD246Min−23,486.0281−12,428.9299
RSN223_LIVERMOR_B-KOD270Max4306.037411,437.1094
RSN223_LIVERMOR_B-KOD270Min−3394.2127−12,893.2767
RSN239_MAMMOTH.AH_A-LUL090Max9485.62089324.8135
RSN239_MAMMOTH.AH_A-LUL090Min−11,828.0013−9522.6992
RSN240_MAMMOTH.AH_B-CVK180Max14,761.553915,562.1973
RSN240_MAMMOTH.AH_B-CVK180Min−12,385.5313−12,460.3146
RSN569_SANSALV_NGI270Max14,302.660819,761.5867
RSN569_SANSALV_NGI270Min−13,736.6451−18,759.8486
RSN585_BAJA_CPE251Max19,063.716412,228.2131
RSN585_BAJA_CPE251Min−20,298.0463−10,447.5421
RSN832_LANDERS_ABY090Max22,717.691913,920.4633
RSN832_LANDERS_ABY090Min−20,889.7713−13,155.2124
RSN838_LANDERS_BRS090Max24,712.878813,801.6363
RSN838_LANDERS_BRS090Min−20,462.1883−11,212.5711

References

  1. Somerville, P.G.; Smith, N.F.; Graves, R.W.; Abrahamson, N.A. Modification of empirical strong ground motion attenuation relations to include the amplitude and duration effects of rupture directivity. Seismol. Res. Lett. 1997, 68, 199–222. [Google Scholar] [CrossRef] [Scilit]
  2. Mavroeidis, G.P.; Papageorgiou, A.S. A mathematical representation of near-fault ground motions. Bull. Seismol. Soc. Am. 2003, 93, 1099–1131. [Google Scholar] [CrossRef] [Scilit]
  3. Zabcı, C.; Sançar, T.; Karabacak, V. Paleoseismology of the Malatya–Ovacık Fault Zone (Eastern Turkey): Implications for seismic hazard. Tectonophysics 2017, 712–713, 210–230. [Google Scholar] [CrossRef] [Scilit]
  4. Yıldız, D.Y.; Zabcı, C.; Sançar, T.; Karabacak, V. Active tectonics and slip-rate distribution of the Malatya–Ovacık Fault Zone, Eastern Anatolia. Turk. J. Earth Sci. 2023, 32, 213–232. [Google Scholar] [CrossRef] [Scilit]
  5. Cornell, C.A. Engineering seismic risk analysis. Bull. Seismol. Soc. Am. 1968, 58, 1583–1606. [Google Scholar] [CrossRef] [Scilit]
  6. Abrahamson, N.A.; Silva, W.J.; Kamai, R. An updated empirical ground-motion model for active crustal regions. Earthq. Spectra 2014, 30, 1025–1055. [Google Scholar] [CrossRef] [Scilit]
  7. Campbell, K.W.; Bozorgnia, Y. NGA-West2 ground motion model for the average horizontal components of PGA, PGV, and 5% damped linear acceleration response spectra. Earthq. Spectra 2014, 30, 1087–1115. [Google Scholar] [CrossRef] [Scilit]
  8. Chiou, B.S.J.; Youngs, R.R. Update of the Chiou and Youngs NGA model for the average horizontal component of peak ground motion and response spectra. Earthq. Spectra 2014, 30, 1117–1153. [Google Scholar] [CrossRef] [Scilit]
  9. Boore, D.M.; Stewart, J.P.; Seyhan, E.; Atkinson, G.M. NGA-West2 equations for predicting PGA, PGV, and 5% damped PSA for shallow crustal earthquakes. Earthq. Spectra 2014, 30, 1057–1085. [Google Scholar] [CrossRef] [Scilit]
  10. Borcherdt, R.D. Estimates of site-dependent response spectra for design (methodology and justification). Earthq. Spectra 1994, 10, 617–653. [Google Scholar] [CrossRef] [Scilit]
  11. Moghimi, H.; Akkar, S. Period-dependent directivity amplification factors for probabilistic seismic hazard analysis. Earthq. Eng. Struct. Dyn. 2017, 46, 765–789. [Google Scholar] [CrossRef] [Scilit]
  12. Vassiliou, M.F.; Makris, N. Estimating time scales and length scales in pulse-like earthquake acceleration records with wavelet analysis. Bull. Seismol. Soc. Am. 2011, 101, 596–618. [Google Scholar] [CrossRef] [Scilit]
  13. Daei, A.; Poursha, M.; Zarrin, M. Seismic performance evaluation of code-compliant RC moment-resisting frame buildings subjected to near-fault pulse-like and non-pulse-like ground motions. J. Earthq. Eng. 2021, 26, 5058–5085. [Google Scholar] [CrossRef] [Scilit]
  14. Taslimi, A.; Tehranizadeh, M. The effect of vertical near-field ground motions on the collapse risk of high-rise reinforced concrete frame-core wall structures. Adv. Struct. Eng. 2021, 25, 410–425. [Google Scholar] [CrossRef] [Scilit]
  15. Basefat, A.Z.M.; Pahlavan, H.; Shafaie, J. Probabilistic seismic performance assessment of tall RC special moment-resisting frame buildings equipped with buckling-restrained braces under near-field excitations. Period. Polytech. Civ. Eng. 2024, 68, 524–542. [Google Scholar] [CrossRef] [Scilit]
  16. Torghabeh, A.B.; Tehranizadeh, M.; Taslimi, A. Probability of collapse evaluation for high-rise reinforced concrete buildings in the event of near-fault earthquakes and soil–structure interaction effects. Structures 2023, 54, 104858. [Google Scholar] [CrossRef] [Scilit]
  17. Kenawy, M.; McCallen, D.; Pitarka, A. Variability of near-fault seismic risk to reinforced concrete buildings based on high-resolution physics-based ground motion simulations. Earthq. Eng. Struct. Dyn. 2021, 50, 1713–1733. [Google Scholar] [CrossRef] [Scilit]
  18. Kenawy, M.; McCallen, D.; Pitarka, A. Characteristics and selection of near-fault simulated earthquake ground motions for nonlinear analysis of buildings. Earthq. Spectra 2023, 39, 2281–2322. [Google Scholar] [CrossRef] [Scilit]
  19. Zucconi, M.; Bovo, M.; Ferracuti, B. Fragility curves of existing RC buildings accounting for bidirectional ground motion. Buildings 2022, 12, 872. [Google Scholar] [CrossRef] [Scilit]
  20. Pinzón, L.; Hidalgo-Leiva, D.; Alva, R.; Mánica, M.A.; Pujades, L. Correlation between seismic intensity measures and engineering demand parameters of reinforced concrete frame buildings through nonlinear time history analysis. Structures 2023, 54, 105276. [Google Scholar] [CrossRef] [Scilit]
  21. Aljawhari, K.; Gentile, R.; Galasso, C. Simulation-based consequence models of seismic direct loss and repair time for archetype reinforced concrete frames. Soil Dyn. Earthq. Eng. 2023, 171, 107979. [Google Scholar] [CrossRef] [Scilit]
  22. Abeysiriwardena, T.; Wijesundara, K.; Nascimbene, R. Seismic risk assessment of typical reinforced concrete frame school buildings in Sri Lanka. Buildings 2023, 13, 2662. [Google Scholar] [CrossRef] [Scilit]
  23. Nagarajan, M.; Raghunandan, M.; Rao, A. Seismic risk assessment of reinforced concrete buildings in India using cumulative damage index-based vulnerability functions. Earthq. Spectra 2025, 41, 1506–1535. [Google Scholar] [CrossRef] [Scilit]
  24. Sharma, K.; Imam, A.; Kumar, P.; Olaiya, B.C. Displacement-based seismic fragility assessment of a high-rise reinforced concrete building. Sci. Rep. 2025, 15, 22256. [Google Scholar] [CrossRef] [Scilit] [PubMed]
  25. Kazemi, F.; Asgarkhani, N.; Jankowski, R. Machine learning-based seismic response and performance assessment of reinforced concrete buildings. Arch. Civ. Mech. Eng. 2023, 23, 150. [Google Scholar] [CrossRef] [Scilit]
  26. Republic of Türkiye, Ministry of Environment, Urbanization and Climate Change. Turkish Building Earthquake Code (TBEC-2018); Republic of Türkiye, Ministry of Environment, Urbanization and Climate Change: Ankara, Türkiye, 2018.
  27. Öz, İ.; Omur, M. Evaluating the seismic fragility and code compliance of Turkish reinforced concrete buildings after the 6 February 2023 Kahramanmaraş earthquake. Appl. Sci. 2025, 15, 5554. [Google Scholar] [CrossRef] [Scilit]
  28. Öztürk, M.; Karan, M.A. Impact of near-fault seismic inputs on building performance: A case study informed by the 2023 Maraş earthquakes. Appl. Sci. 2025, 15, 10142. [Google Scholar] [CrossRef] [Scilit]
  29. Tong, L.; Fu, L.; Wu, B.; Xu, C.; Lim, C.W.; Ding, H. Particle shape effect on creep and fluidity of granular packing. J. Eng. Mech. 2025, 151, 04025067. [Google Scholar] [CrossRef] [Scilit]
  30. Ding, H.; Yu, Y.; Xu, C.; Pu, X.; Guo, W.; Tong, L. Analytical modeling for nonlinear seismic metasurfaces of saturated porous media. Int. J. Mech. Sci. 2025, 303, 110666. [Google Scholar] [CrossRef] [Scilit]
  31. Yu, Y.; Ding, H.; Tong, L.; Xu, C.; Lin, C.; Liu, Z.; Pu, X. Elastic metasurfaces for Scholte waves at fluid–poroelastic interfaces. Int. J. Mech. Sci. 2026, 321, 111657. [Google Scholar] [CrossRef] [Scilit]
  32. Ding, H.; Lin, C.; Xu, C.; Pu, X.; Tong, L. A quasi-zero stiffness locally resonant metamaterial with tunable low-frequency and wide bandgap. Eng. Struct. 2026, 361, 122891. [Google Scholar] [CrossRef] [Scilit]
Figure 1. The Location of Malatya.
Buildings 16 02711 g001
Figure 2. Earthquake Prone Zones near to Malatya.
Buildings 16 02711 g002
Figure 3. Overview and detailed exploration of the Active Faults of Eurasia Database (AFEAD).
Buildings 16 02711 g003
Figure 4. Tectonic Map of Turkey Region (USGS). Blue star: The epicenter of the M7.5 earthquake; Yellow star: The epicenter of the M7.8 earthquake.
Buildings 16 02711 g004
Figure 5. The AFEAD dataset prepared for Turkey and the Malatya–Ovacık Fault Zone (MOFZ).
Buildings 16 02711 g005
Figure 6. Map of Turkey showing Malatya Province and district centers üşed in the hazard analysis.
Buildings 16 02711 g006
Figure 7. Distribution of earthquake epicenters and active faults on the 2018 Turkish Seismic Hazard Map.
Buildings 16 02711 g007
Figure 8. Magnitude–frequency relationship obtained from cumulative earthquake data using the least squares method.
Buildings 16 02711 g008
Figure 9. Probability of earthquake occurrence for different magnitudes (Mw) over various return periods ranging from 10 to 100 years.
Buildings 16 02711 g009
Figure 10. The Horizontal Elastic Design Spectrum used in hazard analyses.
Buildings 16 02711 g010
Figure 11. Peak Ground Acceleration (PGA) for the scenario earthquake with a 10% exceedance probability in 50 years and a return period of 475 years [g], T = 0.00 s.
Buildings 16 02711 g011
Figure 12. Comparison of the Probabilistic Seismic Hazard Analysis and the Horizontal Elastic Design Spectrum According to TBEC-18.
Buildings 16 02711 g012
Figure 13. Definition of the Horizontal Elastic Design Spectrum.
Buildings 16 02711 g013
Figure 14. TK-4401 Earthquake Accelerometer Station.
Buildings 16 02711 g014
Figure 15. Spectral Compatibility of the Scaled Ground Motion Set with the Target Spectrum.
Buildings 16 02711 g015
Figure 16. Original, Scaled and Amplified Earthquake Record.
Buildings 16 02711 g016
Figure 17. Three-dimensional View and Plans of Structure A, Structure B and Structure C.
Buildings 16 02711 g017
Figure 18. Stress–strain graph for unconfined C10 concrete class.
Buildings 16 02711 g018
Figure 19. Stress–strain graph for unconfined C24.1 concrete class.
Buildings 16 02711 g019
Figure 20. Stress–strain graph for S420 rebar.
Buildings 16 02711 g020
Figure 21. Stress–strain graph for S220 rebar.
Buildings 16 02711 g021
Figure 22. For P = 0% Axial Load; 0° for M-κ Graph (kNm-rad/m) and 90° for M-κ Graph (kNm-rad/m).
Buildings 16 02711 g022
Figure 23. For P = 15% Axial Load; 0° for M-κ Graph (kNm-rad/m) and 90° for M-κ Graph (kNm-rad/m).
Buildings 16 02711 g023
Figure 24. For P = 30% Axial Load; 0° for M-κ Graph (kNm-rad/m) and 90° for M-κ Graph (kNm-rad/m).
Buildings 16 02711 g024
Figure 25. For P = 45% Axial Load; 0° for M-κ Graph (kNm-rad/m) and 90° for M-κ Graph (kNm-rad/m).
Buildings 16 02711 g025
Figure 26. Rayleigh Damping Curve.
Buildings 16 02711 g026
Figure 27. The first mode of the Structure-A in the X-direction of the building at T = 0.7 s.
Buildings 16 02711 g027
Figure 28. The first mode of the Structure-B in the Z-rotation direction of the building at T = 1.05 s.
Buildings 16 02711 g028
Figure 29. The first mode of the Structure-C in the X-direction of the building at T = 1.945 s.
Buildings 16 02711 g029
Figure 30. Displacement Outputs for X and Y Directions of the Structure-A.
Buildings 16 02711 g030
Figure 31. Displacement Outputs for X and Y Directions of the Structure-B.
Buildings 16 02711 g031
Figure 32. Displacement Outputs for X and Y Directions of the Structure-C.
Buildings 16 02711 g032
Figure 33. Inter story Drift Check for the X and Y Directions of the Structure-A.
Buildings 16 02711 g033
Figure 34. Inter story Drift Check for the X and Y Directions of the Structure-B.
Buildings 16 02711 g034
Figure 35. Inter story Drift Check for the X and Y Directions of the Structure-C.
Buildings 16 02711 g035
Figure 36. Schematically illustrates the fundamentally different damage evolution paths.
Buildings 16 02711 g036
Figure 37. The number of brittle columns.
Buildings 16 02711 g037
Figure 38. Deformation pattern of Structure-A.
Buildings 16 02711 g038
Figure 39. Deformation pattern of Structure-B.
Buildings 16 02711 g039
Figure 40. Deformation pattern of Structure-C.
Buildings 16 02711 g040
Table 1. Selected Earthquake Records.
#PEER Record NoEarthquake NameDateMwFault TypeVs,30 (m/s)Rrup (km)Δt (s)Scale Factor
11Helena_Montana-0119356.00Strike Slip593.352.860.013.239
2103Northern Calif-0719755.20Strike Slip368.7234.670.0053.218
3150Coyote Lake19795.74Strike Slip663.313.110.0050.952
4212Livermore-0119805.80Strike Slip403.3724.950.0052.334
5223Livermore-0219805.42Strike Slip377.5118.280.0052.146
6239Mammoth Lakes-0319805.91Strike Slip537.1618.130.0051.960
7240Mammoth Lakes-0419805.70Strike Slip382.125.320.0051.771
8569San Salvador19865.80Strike Slip455.936.990.0050.650
9585Baja California19875.50Strike Slip471.534.460.0050.559
10832Landers19927.28Strike Slip382.9369.210.021.892
11838Landers19927.28Strike Slip370.0834.860.022.480
Table 2. Summary of Geometric, Material, and Structural Properties of the Selected Buildings.
PropertyStructure A: State Library (Low-Rise)Structure B: Public Office (Mid-Rise)Structure C: Residential (High-Rise)
Concrete ClassC10C10C24.1
Rebar Steel ClassS420S220S420
Snow Load Region3. Region3. Region3. Region
Altitude954 m954 m954 m
Building Total Height (Hn)11.50 m23.20 m40.65 m
Building Height Class (BHC)654
Total Footprint515 m2548 m21167 m2
Local Site ClassZCZCZC
Total Column94336470
Total Shear Wall024208
Total Beam2896641095
Infill Wall Thickness13.5 cm13.5 cm13.5 cm
Exterior Wall Thickness20 cm20 cm20 cm
Floor FinishingMarble + ScreedMarble + ScreedMarble + Screed
Slab Thickness25 cm17 cm15 cm
Table 3. Effective Section Stiffness Assignments for Elements According to TBEC-2018 [26].
RC Structural System MemberAxial/BearingSlide/Shear
Shear Wall–Slab (in-plane)AxialSlide
Shear Wall0.500.50
Basement Shear Wall0.800.50
Slab0.250.25
Shear Wall–Slab (out of plane)BearingShear
Shear Wall0.251.00
Basement Shear Wall0.501.00
Slab0.251.00
Frame MemberBearingShear
Tie Beam0.151.00
Frame Beam0.351.00
Frame Column0.701.00
Shear Wall (Equ. Frame Mem.)0.500.50
Table 4. Natural Vibration Periods and Modal Analysis Results of the Structure-A.
Mode Period (s)UX (%)UY (%)SumRZ (%)
10.70093.60.00.0
20.6800.176.514.8
30.6040.014.791.9
40.2165.60.091.9
50.2030.06.493.1
60.1820.01.299.0
70.1230.70.099.0
80.1070.01.099.2
90.0980.00.2100.0
100.0050.00.0100.0
110.0010.00.0100.0
120.0010.00.0100.0
Table 5. Natural Vibration Periods and Modal Analysis Results of the Structure-B.
Mode Period (s)UX (%)UY (%)SumRZ (%)
11.04910.25.661.7
20.9131.968.366.0
30.72862.50.277.7
40.3421.70.487.1
50.2730.00.187.1
60.2710.213.687.3
70.21713.10.089.4
80.1790.90.392.8
90.1360.35.792.9
100.1134.10.592.9
110.0752.92.193.2
120.0651.52.693.3
Table 6. Natural Vibration Periods and Modal Analysis Results of the Structure-C.
Mode Period (s)UX (%)UY (%)SumRZ (%)
11.9450.071.82.5
21.9420.92.475.7
31.59272.90.076.6
40.5820.10.087.9
50.5520.013.687.9
60.44313.10.088.1
70.2980.10.092.9
80.2680.05.292.9
90.2075.50.093.0
100.1830.10.095.7
110.1630.02.695.7
120.1250.00.097.3
Table 7. Summary of Brittle–Ductile Element Distribution (Baseline vs. Near-Fault).
StructureElement TypeBaseline BrittleBaseline DuctileNear-Fault BrittleNear-Fault Ductile
Structure ABeam999610293
Column8311868
Shear Wall0000
Structure BBeam256408312352
Column2271093315
Shear Wall240240
Structure CBeam208887275820
Column04704465
Shear Wall7213681127
Table 8. Element Performance Levels under Baseline Ground Motions and Near-Fault (Directivity) Ground Motions.
Structure ElementIOLSCP
Structure ABaselineBeam132063
Column78313
Structure BBeam5440120
Column319125
Shear Wall3219
Structure CBeam805981
Column410060
Shear Wall145189
Structure ANear-Fault (Directivity)Beam145050
Column74614
Structure BBeam5490115
Column2793225
Shear Wall3021
Structure CBeam9213171
Column410060
Shear Wall716185
IO = Immediate Occupancy; LS = Life Safety; CP = Collapse Prevention.
Table 9. Maximum Displacement Values of the Structures.
StructureStructure Height (m)Max Displacement (X)Max Displacement (Y)
Structure A11.50 m0.070 m0.060 m
Structure B23.20 m0.085 m0.107 m
Structure C40.65 m0.127 m0.138 m
Table 10. Maximum Displacement Values of the Structures in terms of Drift Ratios.
StructureStructure Height (m)Max Displacement (X)Max Displacement (Y)Maximum Drift Ratio
(X)
Maximum Drift Ratio (Y)
Structure A11.50 m0.070 m0.060 m0.60%0.52%
Structure B23.20 m0.085 m0.107 m0.37%0.46%
Structure C40.65 m0.127 m0.138 m0.31%0.34%
Table 11. Comparative synthesis of the dominant vulnerabilities, column behavior, and overall seismic performance.
StructureKey Vulnerability/FindingDominant Column BehaviorOverall Performance
A: Low-Rise LibraryExceeds inter-story drift limits due to a pronounced soft-story irregularity at the ground floor.Mostly Ductile (82%)POOR–Fails code limits
B: Mid-Rise OfficeColumns are highly vulnerable, with damage escalating to “Collapse” under near-fault directivity.Mostly Ductile (66%)POOR–High collapse risk
C: High-Rise ResidentialPerforms well due to shear walls and superior materials (C24.1/S420). All columns behave ductilely.DUCTILE (100%)GOOD–Meets design intent
Disclaimer/Publisher’s Note: The statements, opinions and data contained in all publications are solely those of the individual author(s) and contributor(s) and not of MDPI and/or the editor(s). MDPI and/or the editor(s) disclaim responsibility for any injury to people or property resulting from any ideas, methods, instructions or products referred to in the content.