Article

Sports Space in Complete Communities: A Chrono-Adaptive Framework for Dynamic Sport Environment Programming in Chinese Urban Communities

1
School of Architecture and Fine Art, Dalian University of Technology, Dalian 116024, China
2
School of Architecture & Civil Engineering, Shenzhen Polytechnic University (SZPU), Shenzhen 518055, China
3
Shenzhen Institutes of Advanced Technology (SIAT), University of Chinese Academy of Sciences (UCAS), Shenzhen 518055, China
*
Author to whom correspondence should be addressed.
Buildings 2026, 16(14), 2704; https://doi.org/10.3390/buildings16142704
Submission received: 9 May 2026 / Revised: 24 June 2026 / Accepted: 27 June 2026 / Published: 8 July 2026
(This article belongs to the Special Issue Urban Regeneration and Resilient City)

Abstract

The complete community paradigm, emphasising walkable, self-sufficient neighbourhoods, has gained significant global traction, yet the role of sports and physical activity spaces within such frameworks remains undertheorised, particularly in dense Chinese urban environments. This paper introduces the Chrono-Adaptive Sports Space Index (CASI), a preliminary evaluative framework whose diagnostic utility is demonstrated through three contrasting case studies. CASI integrates temporal usage dynamics, demographic composition, smart-city sensor data, and multi-generational programming flexibility to assess sports environments within China’s 15-Minute Complete Community (完整社区, Wánzhěng Shèqū) policy framework. Unlike existing frameworks that assess sports spaces through static metrics, CASI proposes that sports environments must be evaluated across four temporal dimensions: diurnal rhythms, weekly cycles, seasonal transitions, and demographic lifecycle shifts. The four sub-indices are weighted equally (25 points each) as a deliberate first-generation design choice reflecting the absence of pre-existing empirical benchmarks; this assumption requires empirical validation in future research. Through exploratory multi-case analysis of communities in Shanghai (Jing’an District), Chengdu (Tianfu New Area), and Beijing (Chaoyang District), this study provides preliminary evidence suggesting that temporally inert sports spaces may be associated with utilisation losses of 38–52% during off-peak periods and the systematic exclusion of elderly and child populations; these figures should be treated as indicative estimates pending broader empirical validation. A Chrono-Adaptive Design Protocol (CADP) is proposed as a conceptual, practice-informed protocol awaiting prospective empirical evaluation. This research is better characterised as a framework development and initial exploratory application study rather than a validation of a mature instrument. Its primary contribution is a new theoretical and diagnostic lens for complete community planning, together with an agenda for the empirical work needed to develop CASI into a broadly applicable assessment tool. The study’s limitations and a structured five-priority future research agenda are presented in a dedicated section following the Conclusions.

1. Introduction

Urbanisation in the twenty-first century has generated profound questions about the quality of life available to city residents, particularly those living in high-density residential environments. Among the many dimensions of urban quality of life, access to sports and physical activity infrastructure has emerged as a critical public health and social equity concern [1,2]. The concept of the complete community—a planning paradigm that seeks to embed the full range of daily necessities, including work, commerce, education, health, culture, and recreation, within walkable proximity—offers a compelling structural response to these concerns [3,4,5]. In China, complete community planning has been formalised through the 2021 Ministry of Housing and Urban-Rural Development (MOHURD) guidelines for the “完整居住社区” (Complete Residential Community), which mandate sports and recreation facilities within a 15 min walking catchment of all residents [6].
This policy marks a significant shift from the quantity-driven sports infrastructure expansion of earlier decades toward a quality-, equity-, and proximity-focused approach [7]. Nevertheless, implementation challenges persist, particularly concerning the dynamic utilisation of sports spaces across different times of day, seasons, and demographic cohorts. The existing literature on sports facilities in complete communities has concentrated predominantly on spatial allocation (area per capita), physical accessibility (proximity and connectivity), and equipment standards [8,9,10,11]. These metrics, while necessary, are fundamentally static: they capture a snapshot of capacity but fail to account for the temporal dimension of use. A badminton court that is intensively used by retirees at 7:00 AM and by young adults at 9:00 PM may satisfy static metrics while remaining severely underutilised during the hours most valued by working-age parents with children, thereby producing systematic inequities in access [12].
This paper addresses this gap by introducing the Chrono-Adaptive Sports Space Index (CASI)—a preliminary evaluative and design framework that foregrounds temporal dynamics in the assessment and planning of sports environments within complete communities. The emphasis on temporality connects CASI to broader urban form and design theory. The 15 min city concept, as advanced by Moreno et al. [5] and implemented in Paris, Melbourne, and Portland, has largely concentrated on spatial proximity. Less attention has been paid to the temporal dimension of completeness: whether spaces are usable by all residents at the times those residents actually need them. This connects CASI to urban morphology scholarship on compact city forms, mixed-use density, and street-network configuration [13,14]. Beyond spatial proximity, CASI proposes that fully equitable access requires temporal responsiveness: matching space configuration and programming to the structured daily, weekly, and seasonal rhythms of diverse user populations.
CASI draws on concepts from temporal urbanism [15,16], chrono-urbanism and temporal design theory [17], smart city data infrastructure [18], and intergenerational equity planning [19] to construct a multi-dimensional index capable of diagnosing temporal utilisation failures and proposing design interventions. The framework is assessed through empirical analysis of three Chinese urban communities in Shanghai, Chengdu, and Beijing, selected to represent variation in climate, density, demographic composition, and smart-city infrastructure maturity. The paper is organised as follows: Section 2 reviews the relevant literature; Section 3 presents the theoretical framework; Section 4 describes the methodology; Section 5 introduces the CASI architecture; Section 6 presents case study findings; Section 7 describes the Chrono-Adaptive Design Protocol (CADP); Section 8 discusses the findings, limitations, and implications; Section 9 concludes.

2. Literature Review

2.1. The Complete Community Paradigm and Urban Form

The complete community concept has roots in multiple planning traditions, including new urbanism [13], the compact city movement [14], and more recently the 15 min city concept popularised by Carlos Moreno and adopted in policy frameworks in Paris, Melbourne, and Portland [5,20]. At its core, the paradigm posits that urban residents should be able to meet their essential daily needs within a 15 min walk or bicycle ride from their homes [5]. Urban form theory is central to this aspiration: the density, connectivity, and mixed-use character of the built environment collectively determine whether 15 min proximity is achievable [21,22]. For sports spaces specifically, the quality of pedestrian connectivity, the microclimate of routes, and the legibility of paths to facilities are as important as Euclidean distance in determining effective access.
In China, the complete community framework has been shaped by distinct institutional and demographic contexts. The 2021 MOHURD guidelines represent the most comprehensive national policy articulation to date, establishing minimum standards for six categories of facilities, including sports and fitness facilities [6]. Specifically, the guidelines mandate at least 0.1 square metres of outdoor sports space per resident and the provision of indoor sports facilities within a 10 min walking distance. The transition from work-unit (danwei) community planning to market-oriented development has disrupted collective recreation models without consistently replacing them with equivalent alternatives [23,24,25]. Scholars have critically noted that China’s complete community policy implementation has varied significantly across cities, with considerable gaps between policy intent and realised outcomes [7].

2.2. Sports Space Planning in Urban Communities

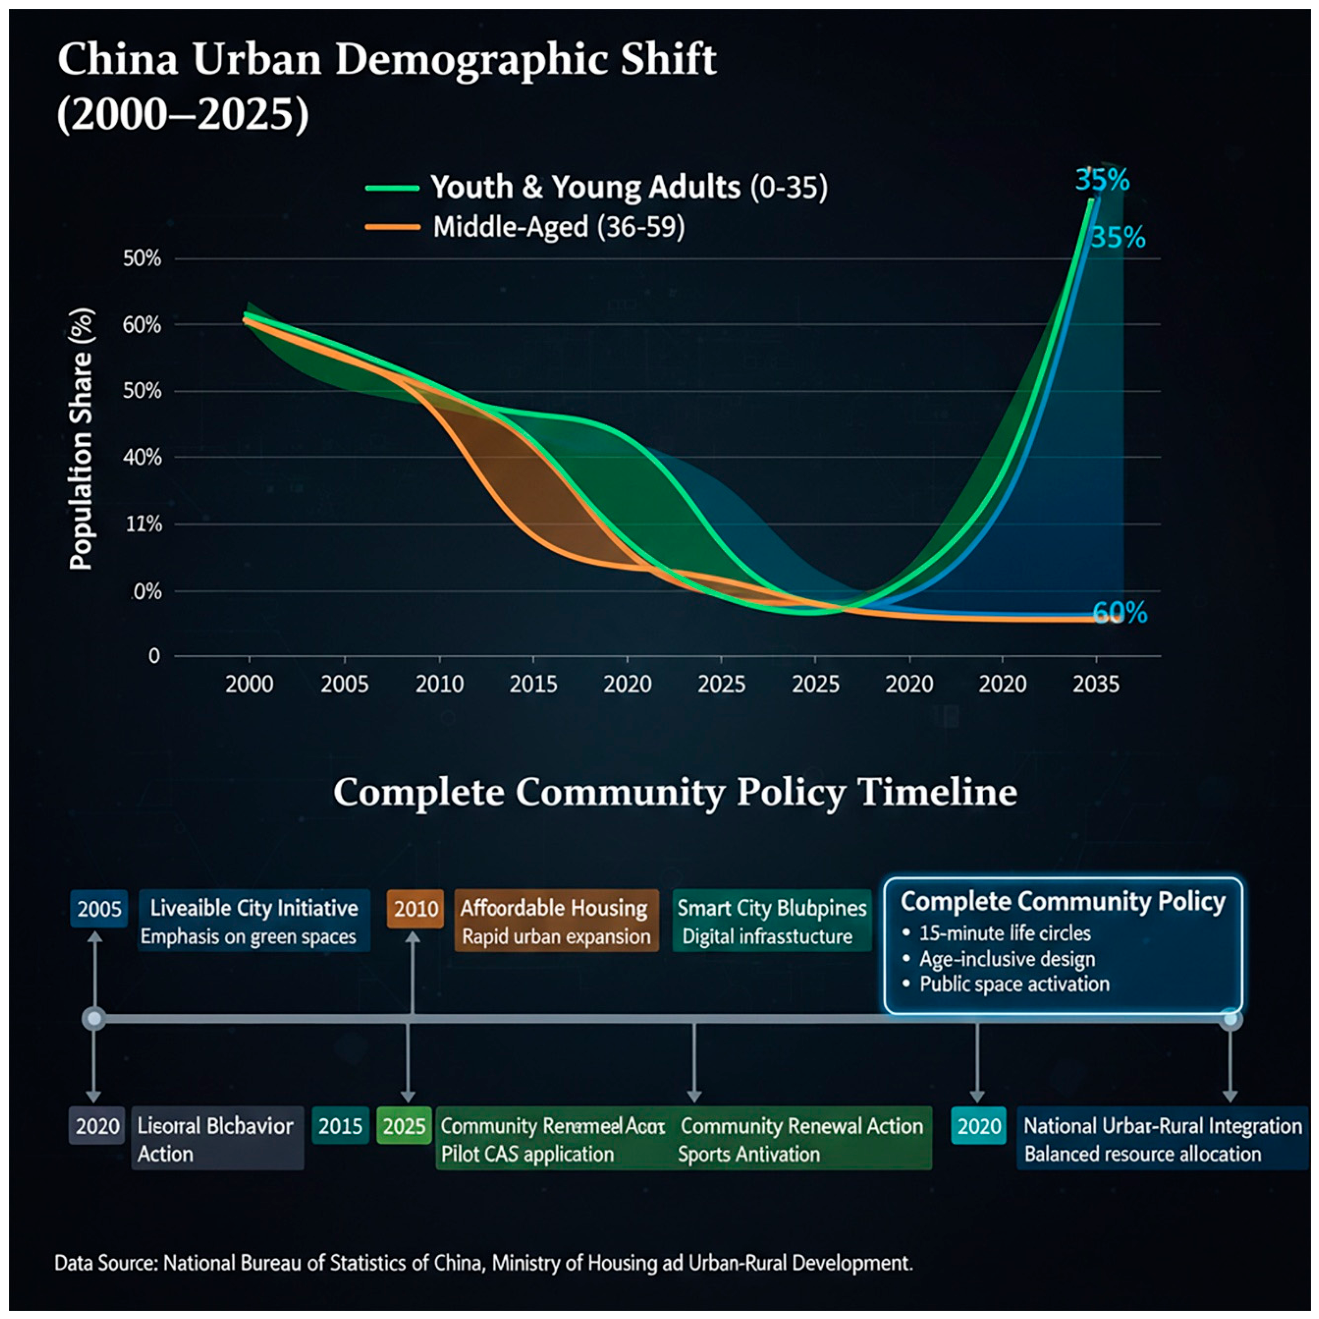
Sports space planning literature has evolved from a primarily quantitative, supply-side focus toward more nuanced frameworks incorporating demand analysis, behavioural observation, and equity considerations [26,27]. The physical activity environment literature, rooted in ecological models of health behaviour, emphasises the built environment’s mediating role in shaping physical activity levels [1,28]. International research has begun to address temporal dynamics in sports space utilisation. Pawlowski et al. [29] analysed attendance patterns at public sports facilities in Germany, finding that peak hours accounted for 73% of use on facilities designed for universal access. Stevenson et al. [30] found that park-based exercise equipment in Australian communities was predominantly used by elderly women in morning hours and male adolescents in evening hours, with near-zero midday use despite optimal weather conditions. These patterns point toward the need for temporal programming and adaptive design (Figure 1).

2.3. Existing Sports Space Assessment Instruments

Before establishing CASI’s contribution, it is necessary to situate it within the landscape of existing sports and physical activity space assessment tools. Table 1 provides a systematic comparison across six instruments, illustrating the specific gap that CASI addresses.
As Table 1 illustrates, no existing instrument combines full temporal coverage, demographic lifecycle projection, smart data integration, and policy-prescriptive output. SOPARC [31] offers the closest methodological precedent, employing systematic direct observation with demographic coding; however, it captures only snapshot utilisation patterns without temporal adaptability indicators or design prescriptions. CASI therefore addresses a genuine gap in the assessment toolkit: the integration of temporal dynamics, demographic equity, and design prescription in a single evaluative framework.

2.4. Temporal Urbanism, Chrono-Urbanism, and the Time Geography of Sports

Temporal urbanism, as articulated by Schwanen [16] and others, addresses the temporal organisation of urban life—the rhythms, schedules, and time-space patterns through which people inhabit and use urban space. Time geography, originating with Hägerstrand [36], provides methodological tools for understanding how individuals navigate time–space constraints to engage in activities, including sports and recreation. Applied to sports spaces, a time-geographic lens reveals how space-time prisms determine de facto access to facilities beyond mere spatial proximity [37,38].
Significant advances in chrono-urbanism over the past decade have expanded both the theoretical and methodological resources available for temporal sports space planning. Muliček et al. [15] developed the concept of urban timescapes, demonstrating that temporal segregation can be as significant as spatial segregation in producing inequitable outcomes. Neuhaus [17] advanced the concept of temporal design: the intentional shaping of spatial conditions to respond to and support the temporal rhythms of different user groups. European chrono-policy practice, most notably Barcelona’s superblocks programme, has demonstrated how temporal management of public space can substantially improve equitable access without capital investment in new facilities [39]. CASI’s integration of smart city data into its scoring system draws directly on these methodological advances.

2.5. East Asian and International Comparative Perspectives

East Asian cities offer directly comparable precedents given their shared characteristics of high density, ageing demographics, and collective approaches to community sports provision. Seoul’s ‘Living SOC’ (Social Overhead Capital) policy, launched in 2018, explicitly aims to provide community sports facilities within a 10 min walk of all residents, with particular attention to the temporal programming of shared spaces to serve diverse age groups across the day [40]. Tokyo’s neighbourhood sports facility planning standards integrate universal design requirements and seasonal programming expectations [41]. Singapore’s ActiveSG community sports programme has demonstrated that active management and temporal programming of existing community sports spaces can achieve utilisation improvements comparable to capital investment in new facilities [42]. These East Asian precedents share important features with the CASI framework’s prescriptions: temporal programming, demographic responsiveness, active community management, and integration of digital monitoring.

2.6. Smart City Data and Community Sport

China’s rapid development of smart city infrastructure—including ubiquitous mobile internet, QR-code-based facility booking systems, AI-enabled security cameras, and integrated community management platforms—has created unprecedented opportunities for real-time monitoring of sports space utilisation [43,44]. IoT sensor applications in sports venue management have demonstrated that real-time occupancy data can reduce peak-hour overcrowding by 20–30% through dynamic allocation and user guidance [45]. However, these systems have overwhelmingly been deployed in a monitoring rather than design-generative capacity in China: data is collected but has not been systematically used to inform adaptive programming or facility redesign [46]. CASI’s integration of smart city data is designed to be proportionate and privacy-respecting: the framework can function at a reduced level of precision with passive environmental sensors and booking system data that do not require individual tracking.

3. Theoretical Framework

3.1. Foundations of the Chrono-Adaptive Sports Space Concept

The theoretical framework of this paper integrates three intellectual traditions: (1) the complete community paradigm’s emphasis on proximity-based, equitable access to daily necessities; (2) temporal urbanism’s attention to the rhythmic, time-structured nature of urban life; and (3) adaptive systems theory’s conceptualisation of environments that respond dynamically to changing conditions [47,48]. From these traditions, we derive the concept of the chrono-adaptive sports space: a physical environment intentionally designed to shift its functional configuration, programming, atmosphere, and management in response to predictable temporal patterns of demand.
The chrono-adaptive sports space concept rests on three foundational propositions. First, the temporal distribution of sports space demand is highly structured and largely predictable, reflecting stable rhythms of daily life, cultural practice, and demographic behaviour. Second, conventional static design approaches systematically misalign with this structured demand, producing chronic underutilisation and inequitable access patterns. Third, intelligently designed flexibility, supported by smart technology and evidence-based programming protocols, can align supply with demand across temporal dimensions without compromising any user cohort’s access. It is important to situate CASI as a preliminary, formative framework rather than a fully validated instrument: three case studies can demonstrate the framework’s diagnostic utility and reveal important patterns, but they cannot validate scoring thresholds or confirm weighting choices.

3.2. Four Temporal Dimensions of Sports Space Demand

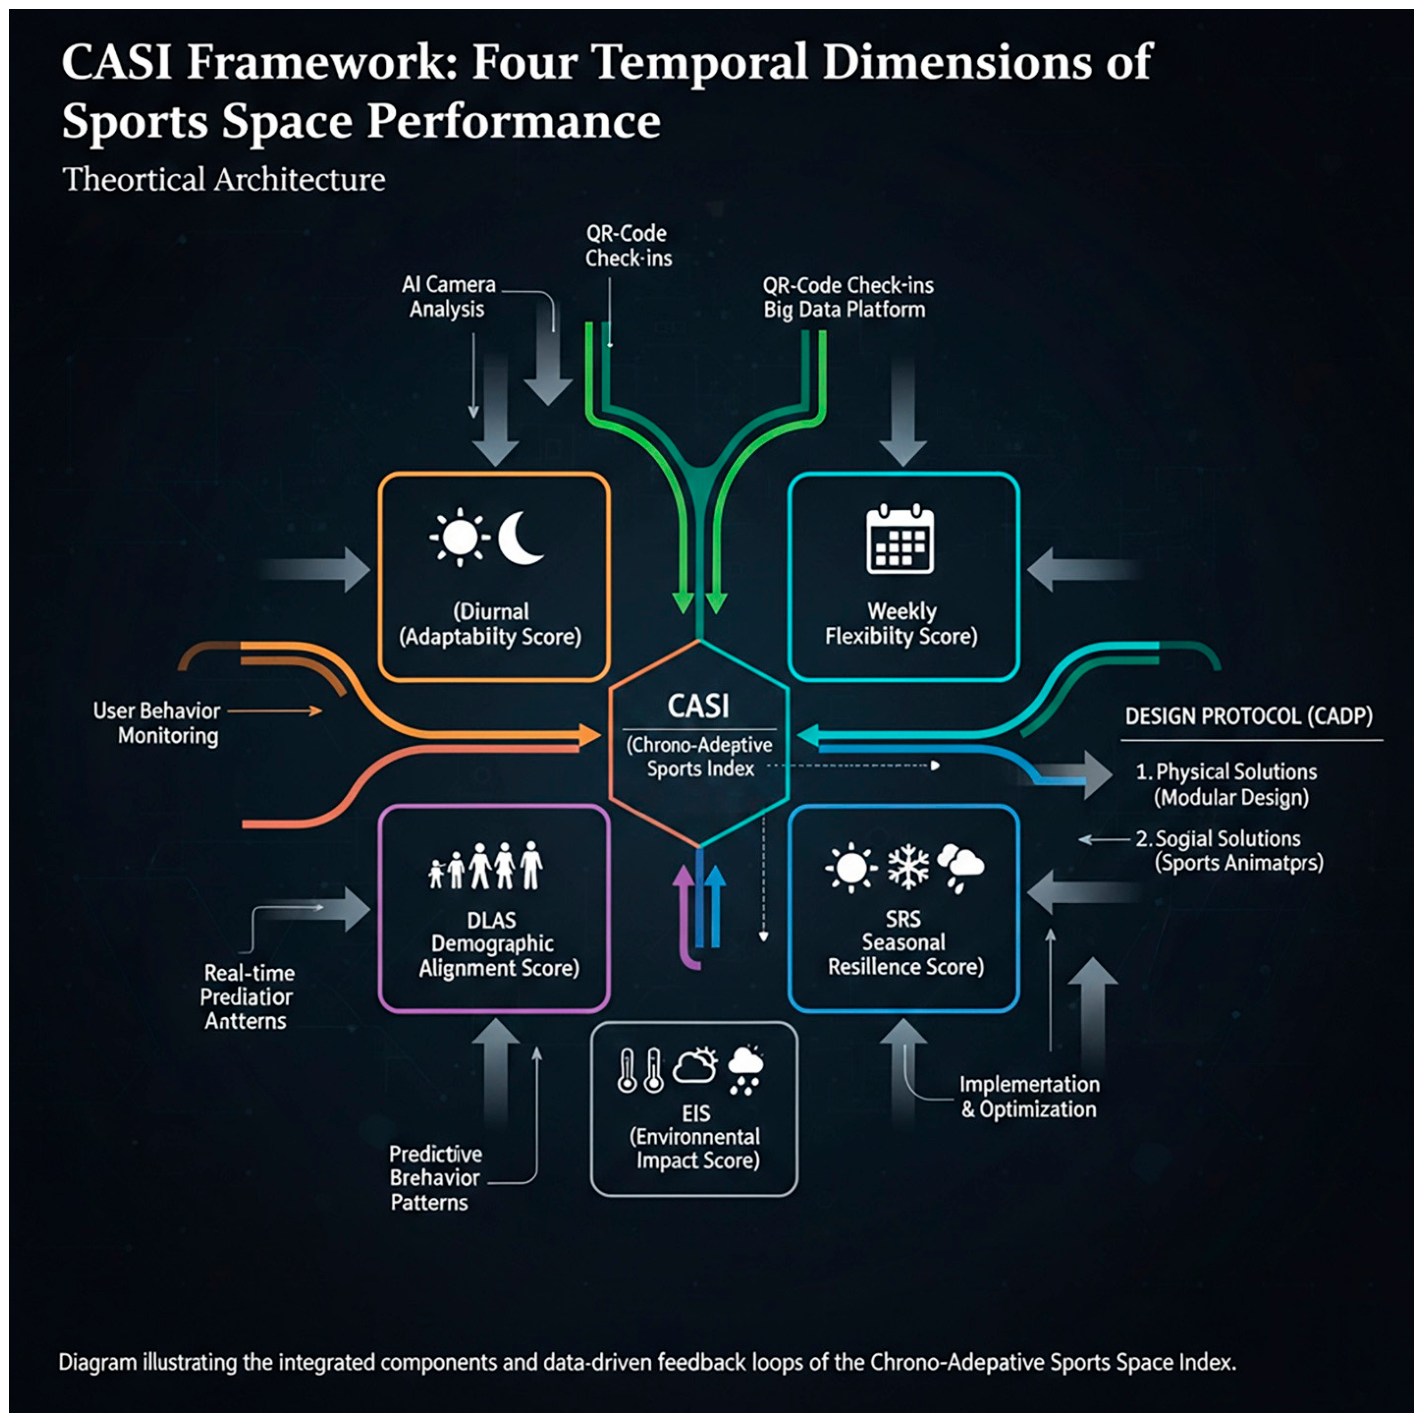
CASI conceptualises sports space demand as varying across four analytically distinct temporal dimensions, each requiring different design and management responses (Figure 2). The diurnal dimension captures within-day variation in user populations and activity types. In Chinese urban communities, this dimension typically reveals a trimodal pattern: an early morning peak (5:30–8:00 AM) dominated by elderly residents; a post-school/post-work peak (5:30–8:30 PM) dominated by working adults and adolescents; and a compressed midday trough used primarily by stay-at-home caregivers with young children [49,50]. The weekly dimension captures variation between weekdays and weekends, where Chinese urban sports spaces typically exhibit 40–60% higher utilisation on weekends. The seasonal dimension is particularly salient in China’s diverse climate zones, where northern cities face harsh winters and southern cities face extreme summer heat. The demographic lifecycle dimension is the most strategically significant for China’s ageing urban communities: a space designed for the current demographic will become increasingly misaligned as the community ages, producing the spatial mismatch documented in older danwei communities [23].

3.3. The Equity Dimension of Temporal Adaptability

Physical activity inequality in urban communities has been extensively documented along lines of age, gender, and socioeconomic status [27,28]. The temporal dimension introduces a further axis of inequality: temporal exclusion, defined as the systematic inability of certain user groups to access sports spaces during the hours most compatible with their daily time-space constraints. It is important to acknowledge, however, that temporal exclusion is only one dimension of a broader equity landscape. Spatial accessibility, economic affordability, information access, disability accommodation, and the cultural relevance of available activities are all significant equity dimensions that CASI’s Equity Integration Score (EIS) does not directly capture. CASI’s equity component should therefore be understood as a temporal equity measure, not a comprehensive social equity index. Future CASI iterations should explicitly track migrant-worker utilisation patterns and programming responsiveness.

4. Methodology

4.1. Research Design

This research employs a multi-method, comparative case study design [51] to (1) develop and operationalise the CASI framework through inductive engagement with empirical data; and (2) provide an initial exploratory assessment of CASI’s diagnostic value through application to three Chinese complete community cases. The case study approach is appropriate for this stage of theoretical development, where the goal is framework elaboration and initial assessment rather than statistical generalisation [52]. Following Seawright and Gerring’s [53] typology of case selection strategies, the three cases were selected as a ‘diverse’ set designed to maximise variation across theoretically relevant dimensions: climate zone, demographic composition, smart-city infrastructure maturity, and community lifecycle stage. It is important to distinguish between the dimensions that were intentionally varied for theoretical purposes and those that represent uncontrolled sources of variation. The intentionally varied dimensions include climate zone, demographic profile, and community lifecycle stage. The uncontrolled confounders include capital investment levels, governance capacity, planning quality, and redevelopment status. These confounders are not independent of the theoretical dimensions: a newly built Chengdu community will tend to have higher investment and stronger governance capacity than an ageing Shanghai inner-city community almost by definition, given China’s urban development trajectory. This structural co-variation limits the study’s ability to support causal attribution. An alternative and arguably more rigorous design for a future study would be to select a larger number of communities within a single metropolitan context, thereby reducing city-level confounding effects and improving internal validity. The current three-city design was chosen to demonstrate the framework’s applicability across China’s diverse climate zones and community typologies, prioritising breadth of initial assessment over causal rigour, which is acknowledged as a limitation. A key methodological limitation is the absence of control cases: it is therefore not possible to determine whether the temporal utilisation patterns identified by CASI are distinctive to complete communities or prevalent across Chinese urban communities more generally. Ethical approval for the research was obtained through the authors’ institution. All interview participants provided informed consent. Smart city data were obtained under formal data-sharing agreements with district-level sports bureaux and community management committees.

4.2. Case Selection

The three selected communities are: (1) Caojiadu Community, Jing’an District, Shanghai—a high-density, rapidly ageing inner-city community with advanced smart city infrastructure and severe land constraints; (2) Tianfu Future Community, Tianfu New Area, Chengdu—a newly planned community incorporating green design principles, serving a younger family demographic; and (3) Tuanjiehu Community, Chaoyang District, Beijing—a mid-vintage community with a mixed demographic profile, currently undergoing renovation to align with MOHURD 2021 complete community standards. Together, these cases represent China’s three primary climate zones for sports space planning, three distinct phases of the community lifecycle, and three levels of smart city data availability.

4.3. Data Collection

Data collection for each case proceeded through four channels. First, systematic behavioural observation was conducted over a minimum of 14 days per site, stratified across weekdays and weekends and covering morning (6:00–10:00 AM), midday (10:00 AM–4:00 PM), late afternoon/evening (4:00–9:00 PM), and night (9:00–11:00 PM) time windows. Observations were conducted in spring/early summer (April–June 2023) only. Critically, no direct observational data were collected during winter conditions (particularly relevant for Tuanjiehu, Beijing) or peak summer conditions (particularly relevant for Tianfu, Chengdu). This is a significant limitation for a framework designed to evaluate seasonal resilience: the SRS scores for all three cases therefore incorporate a degree of estimation uncertainty that cannot be fully resolved through administrative data and interview recall alone. The SRS scores should be understood as partially estimated values rather than fully observed measures; they represent the best available approximation given the data collected, and should be interpreted with appropriate caution. Future CASI applications should employ a minimum of four observation windows—one per season—with particular emphasis on the adverse season most relevant to each climate zone. At each site, two trained observers conducted parallel independent sessions on six randomly selected days to enable inter-rater reliability assessment. Inter-rater reliability for total user count (ICC = 0.94) and demographic category assignment (Cohen’s Kappa = 0.81) met acceptable thresholds. Second, semi-structured interviews were conducted with 30–40 community residents per site (total N = 103), purposively sampled to ensure representation across elderly residents aged 60+ (approximately 30%), working adults aged 18–59 (approximately 40%), parents with children under 12 (approximately 20%), and community management staff (2–3 per site). Third, smart city administrative data were obtained through formal data-sharing agreements. Fourth, spatial mapping and environmental assessment documented facility dimensions, equipment inventory, surface materials, microclimate conditions, and spatial configuration.

4.4. Data Analysis

Behavioural observation data were coded and aggregated into temporal utilisation matrices for each sports space. Interview data were analysed using thematic analysis [54], with particular attention to temporal access barriers, programming preferences, and unmet demand. Two researchers coded independently; inter-coder reliability was assessed using Cohen’s Kappa (κ = 0.79 across primary themes). Smart city data were processed to compute utilisation rates, temporal distribution coefficients, and demographic representativeness indices. All CASI sub-index scores should be understood as point estimates based on the available observational and administrative data; no formal confidence intervals are reported, given the 14-day observation window and partial seasonal coverage.

5. The Chrono-Adaptive Sports Space Index (CASI)

5.1. Index Architecture and Weighting Rationale

CASI is composed of four primary sub-indices, each addressing one temporal dimension of sports space performance, plus an overarching Equity Integration Score (EIS). The four sub-indices are the Diurnal Adaptability Score (DAS), the Weekly Flexibility Score (WFS), the Seasonal Resilience Score (SRS), and the Demographic Lifecycle Alignment Score (DLAS). Each sub-index is scored on a 0–25 scale, yielding a composite CASI score of 0–100. The EIS is a corrective multiplier (0.6–1.0) applied to the composite score to penalise temporal concentration of access among narrow demographic cohorts. The equal weighting of the four sub-indices at 25 points each is a deliberate first-generation design choice rather than a claim that all four dimensions are equally important in all contexts. This approach is consistent with precedents in composite index development [55]. As the OECD [55] handbook notes, equal weighting is a starting point requiring sensitivity validation, not an inherently appropriate default. The four dimensions also operate across fundamentally different temporal scales—DAS captures daily variation, WFS captures weekly variation, SRS reflects seasonal adaptability, and DLAS addresses long-term demographic change—making the assumption of equal importance theoretically uncertain. The primary concern is not whether equal weighting is correct in principle, but whether the CASI community rankings remain stable under alternative weighting scenarios. An indicative assessment suggests that the large gap between Caojiadu (27.7) and Tianfu (59.6) is likely robust to moderate weighting variations given their substantially different sub-index profiles across all four dimensions. However, the closer comparison between Tianfu (59.6) and Tuanjiehu (52.6) is potentially less robust: if SRS were weighted more heavily (for example, at 40% rather than 25%), Tuanjiehu’s stronger seasonal performance (SRS = 18 vs. 14) would narrow or close the gap with Tianfu. The current ranking between these two communities should therefore be interpreted with caution. Formal sensitivity analysis using AHP, Delphi, PCA, or entropy weighting methods is identified as the highest priority for the next phase of CASI development. Until such analysis is conducted, CASI scores should be treated as diagnostic indicators of temporal performance profile rather than definitive comparative rankings. The individual rationale for including each sub-index at 25 points is summarised in Table 2.

5.2. Diurnal Adaptability Score (DAS)

The DAS measures the extent to which a sports space actively supports diverse user cohorts across the full daily activity cycle. Scoring is based on three components: (a) the ratio of peak to trough hourly utilisation (0–7 points); (b) the number of distinct demographic cohorts whose primary activity windows are served by the space (0–10 points); and (c) the presence and quality of design elements enabling diurnal adaptation—adjustable shading, timed lighting systems, reconfigurable surface zones, and programming infrastructure (0–8 points). The 8:1 and 3:1 peak-to-trough ratios that define ‘severe’ and ‘high-adaptability’ performance levels were derived from the distribution of peak-to-trough ratios observed in the three case studies (range: 3.8:1 to 14.5:1), supplemented by the benchmarks from Pawlowski et al. [29] and Stevenson et al. [30]. These thresholds should be treated as provisional calibrations. A DAS below 10 indicates a diurnally inflexible space requiring significant intervention; a DAS above 18 indicates strong diurnal performance.

5.3. Weekly Flexibility Score (WFS)

The WFS assesses the degree to which a sports space accommodates the qualitatively different patterns of use characteristic of weekdays and weekends. In Chinese urban communities, weekends concentrate larger groups, multi-generational family use, and organised activity, while weekdays are dominated by individual or small-group use [50,56]. Scoring covers: (a) the capacity of the space to expand or reconfigure for larger groups (0–10 points); (b) the availability of weekend-specific programming or management support (0–7 points); and (c) evidence that neither weekday nor weekend users report displacement or access barriers caused by temporal concentration (0–8 points).

5.4. Seasonal Resilience Score (SRS)

The SRS evaluates year-round usability across climate-driven seasonal variation. Scoring criteria vary by climate zone, with parallel weighting of the relevant adverse season. The SRS incorporates: (a) a climate usability assessment scoring the proportion of annual hours during which outdoor sports are feasible without design intervention (0–5 points); (b) the presence and effectiveness of climate-adaptive infrastructure (0–12 points); and (c) the diversity of activities documented as occurring across all four seasons (0–8 points).

5.5. Demographic Lifecycle Alignment Score (DLAS)

The DLAS is the most distinctive component of CASI. It assesses the degree to which a sports space is designed not only for the current demographic profile of the community but also for the predictable demographic trajectory over a 10–20 year horizon. The DLAS scores: (a) the convertibility of the space’s primary infrastructure (0–10 points); (b) the proportion of design elements meeting universal design standards applicable to both young and elderly users (0–8 points); and (c) the presence of a formal demographic planning review mechanism in community management (0–7 points). The DLAS requires engagement with local demographic projection data available through community committee household registration records and municipal statistical offices.

5.6. Equity Integration Score (EIS)—Computational Methodology

The EIS is computed as a multiplier applied to the composite CASI score (DAS + WFS + SRS + DLAS). It penalises temporal inequity by computing a modified Gini coefficient for the distribution of utilisation hours across demographic cohorts. The computational procedure is as follows: Step 1, construct the utilisation matrix U(t,d), where t indexes time windows (hourly across 18 active hours per day, averaged across the 14-day observation period) and d indexes demographic cohorts (five groups). Step 2, compute the total utilisation share s(d) for each cohort. Step 3, rank cohorts from lowest to highest share and construct the Lorenz curvse. Step 4, compute the standard Gini coefficient G = 1 − 2∪L(x)dx, approximated using the trapezoidal rule across the five cohort points. Step 5, map G to the EIS scale using the linear transformation EIS = 1.0 − (G × 1.0), clamped to the interval [0.6, 1.0]. A worked numerical example from Caojiadu yielded EIS = max(0.6, 1.0 − 0.41) = 0.6 (clamped at lower bound), reflecting extreme elderly-dominated utilisation (58% elderly, compared to a community population share of 34%).

6. Case Study Findings

6.1. Case 1: Caojiadu Community, Jing’an District, Shanghai

6.1.1. Community Profile

Caojiadu is a dense inner-city community of approximately 18,000 residents in Jing’an District, one of Shanghai’s most centrally located and land-constrained districts. The community’s demographic profile has shifted significantly over the past two decades: residents aged 60 and above now constitute 34% of the population, compared with a Shanghai urban average of 28% [57]. The sports space provision consists of a 1200 m2 outdoor fitness area, a 400 m2 covered badminton and table tennis pavilion, and a linear fitness trail of approximately 300 m along a refurbished canal edge. Total sports area per capita is approximately 0.11 m2, marginally exceeding the MOHURD 2021 minimum standard.

6.1.2. CASI Assessment Results

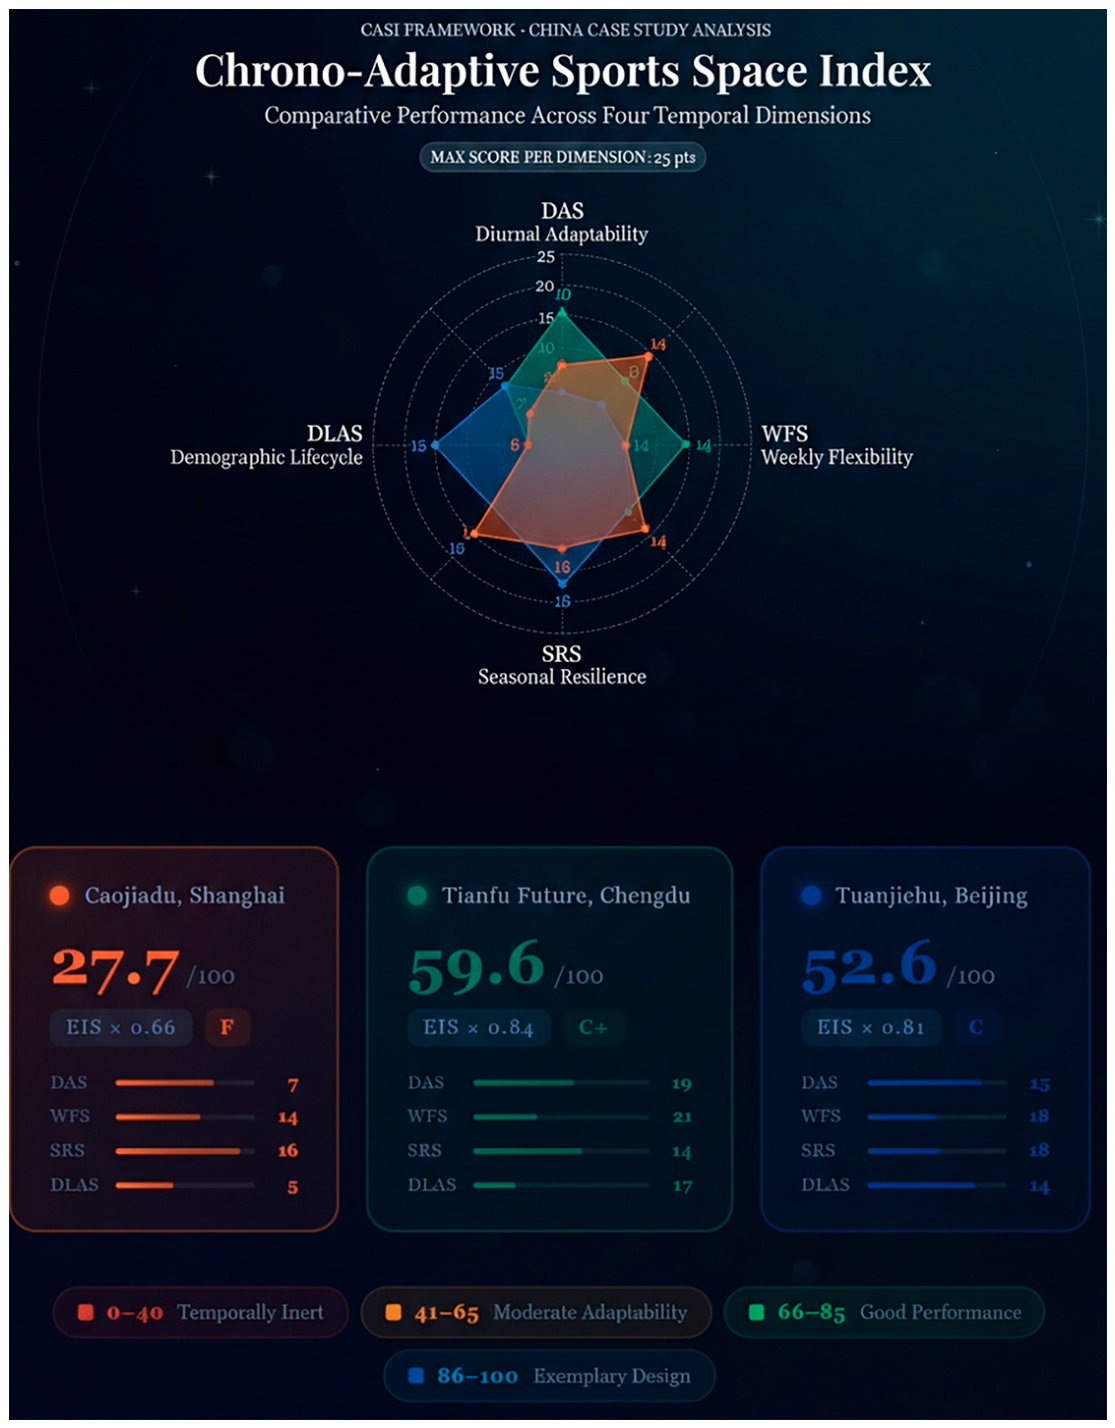
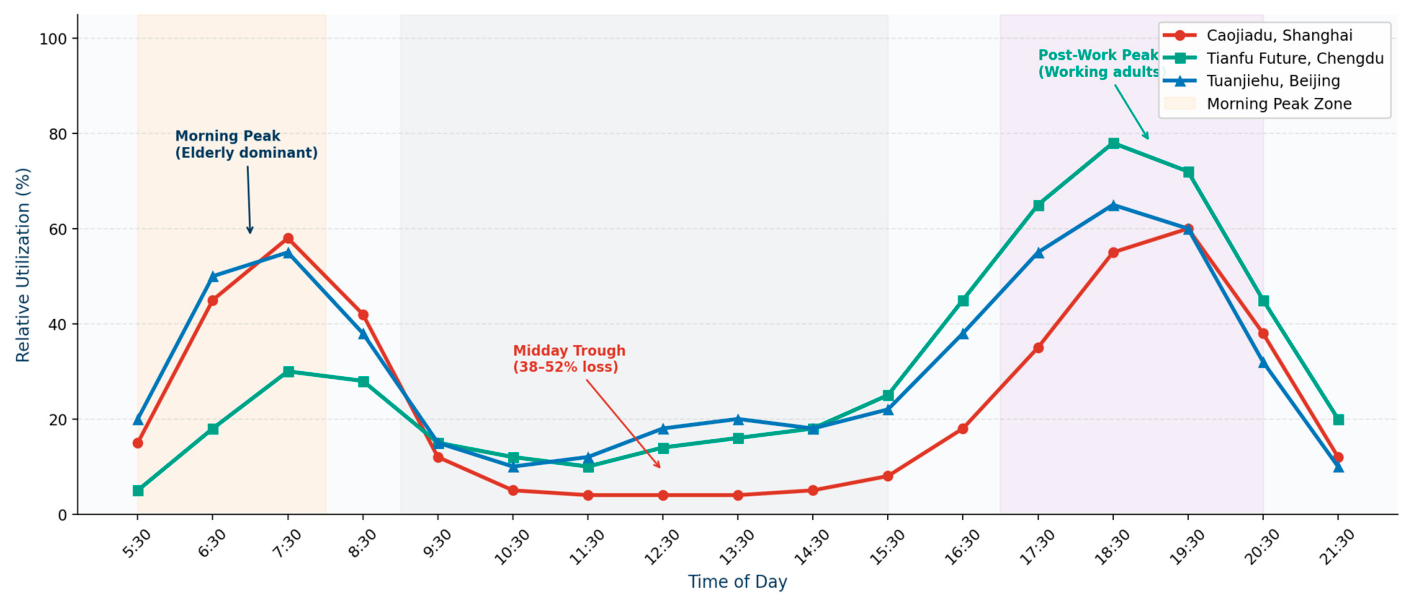
Behavioural observation and smart city data analysis revealed a highly polarised utilisation pattern. Morning peak hours (6:00–8:30 AM) accounted for 58% of all recorded weekday activity, dominated overwhelmingly by residents aged 60 and above engaged in tai chi, qigong, and informal walking. The post-work peak (5:30–8:00 PM) accounted for a further 29% of activity. Total midday utilisation (10:00 AM–4:30 PM) was 4% of daily activity. The peak-to-trough ratio was 14.5:1. The DAS for Caojiadu was 7/25. The WFS was 14/25, reflecting moderately greater weekend utilisation diversity. The SRS was 16/25, benefiting from Shanghai’s relatively mild climate. The DLAS score was 5/25—the lowest sub-index—reflecting the space’s design for an earlier, younger demographic without convertibility provisions. The EIS computation yielded a multiplier of 0.66. The resulting CASI score was (7 + 14 + 16 + 5) × 0.66 = 27.7/100, placing Caojiadu in the temporally inert category.

6.2. Case 2: Tianfu Future Community, Tianfu New Area, Chengdu

6.2.1. Community Profile

Tianfu Future Community is a newly completed planned community in Chengdu’s Tianfu New Area, designed under Chengdu’s Municipal Complete Community Standards [25] and intended as a flagship demonstration of sustainable, smart community design. The community serves approximately 12,000 residents, with a demographic profile skewed toward younger families: 38% of residents are aged 0–17, and only 12% are aged 60 or above. The sports provision includes a 2800 m2 central sports plaza, an 800 m2 multi-use games area (MUGA) with reconfigurable surface markings, a rooftop running track of 350 m, a climate-controlled indoor fitness centre of 600 m2, and a children’s active play landscape of 500 m2. Total sports area per capita is approximately 0.37 m2.

6.2.2. CASI Assessment Results

Tianfu demonstrated markedly higher diurnal adaptability than Caojiadu, reflecting intentional design investment. The central sports plaza employs an automated retractable shade system, timed LED lighting synchronised with a community app, and surface markings for five different sports. Behavioural observation confirmed a more even utilisation distribution: morning peak (6:30–8:30 AM) accounted for 22% of daily activity; post-school afternoon peak (4:00–7:30 PM) for 41%; and midday (10:00 AM–4:00 PM) for 19%. The DAS was 19/25. The WFS was 21/25, reflecting the MUGAs’ reconfigurability and a formal weekend community sports programme. The SRS was 14/25: Chengdu’s extreme summer heat severely restricts outdoor midday activity from June through August. The DLAS was 17/25. The EIS multiplier was 0.84. The CASI score was (19 + 21 + 14 + 17) × 0.84 = 59.6/100, in the moderate adaptability category.

6.3. Case 3: Tuanjiehu Community, Chaoyang District, Beijing

6.3.1. Community Profile

Tuanjiehu is a mid-vintage community of approximately 22,000 residents, originally developed as a state-enterprise residential compound in the 1980s and substantially renovated between 2018 and 2023. The demographic profile is mixed: 26% aged 60 and above, 18% aged 0–17, and 56% working-age adults. Sports provision includes a 1800 m2 outdoor multi-sport area, a 1200 m2 covered sports pavilion (recently renovated), an 800 m2 fitness trail network, and a heated indoor-outdoor transitional sports hall of 400 m2 opened in 2023. Total sports area per capita is 0.19 m2. The renovation was informed by community participatory design processes, including resident sport preference surveys conducted by the Chaoyang District Sports Bureau (2022).

6.3.2. CASI Assessment Results

Tuanjiehu presented the most complex utilisation profile of the three cases, reflecting its mixed demographic structure. The DAS score was 15/25: the morning peak (5:30–8:30 AM) was dominated by elderly users (64% of morning activity), but the transitional indoor-outdoor hall supported a significant midday population, generating a more moderate peak-to-trough ratio of 6.2:1. The heated transitional hall proved particularly effective in extending the viable outdoor season by approximately six weeks. The WFS was 18/25. The SRS was 18/25—the highest among the three cases—reflecting the combined effect of the transitional hall, the renovated covered pavilion, and a winter programming calendar. The DLAS was 14/25. The EIS multiplier was 0.81. The CASI score was (15 + 18 + 18 + 14) × 0.81 = 52.6/100, in the moderate adaptability range with notably stronger seasonal resilience than the other cases.

6.4. Comparative Analysis

Table 3 presents the comparative CASI scores across the three cases.
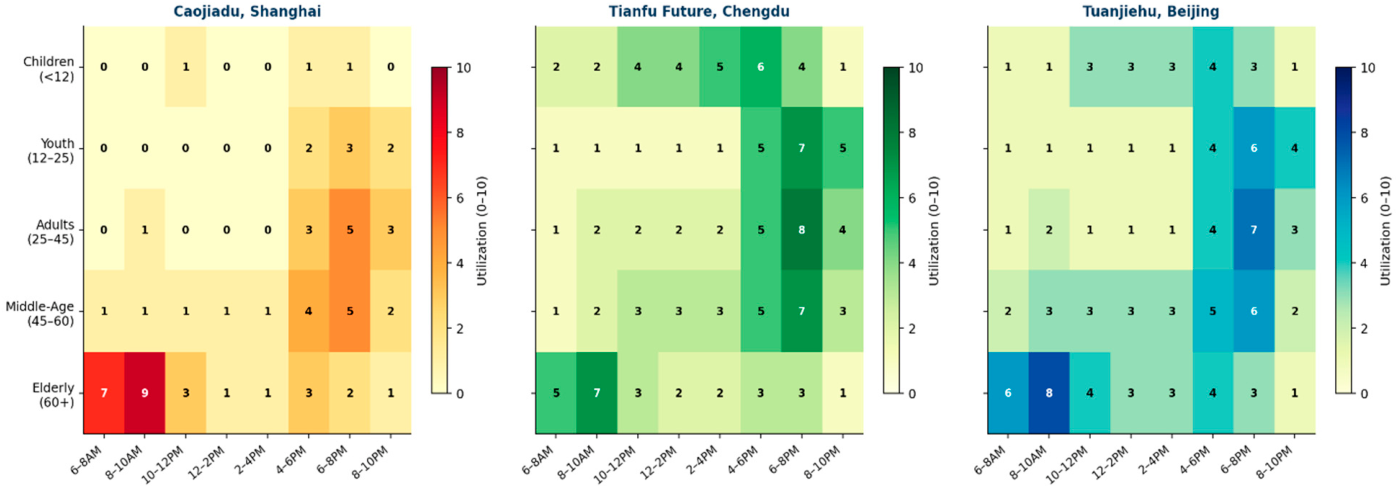
The large CASI difference between Tianfu (59.6) and Caojiadu (27.7) warrants careful attributional analysis. Multiple factors co-vary across these two cases, including community age, funding and design investment levels, demographic composition, climate zone, and institutional governance capacity. The current study cannot isolate the contribution of chrono-adaptive design choices from these confounding factors. The CASI scores should therefore be interpreted as diagnostics of current performance across temporal dimensions, not as evidence that chrono-adaptive design per se caused the differences observed. Figure 3, Figure 4 and Figure 5 present, respectively, a radar chart of CASI sub-index performance across the three communities, a heat map of sports space utilisation by time of day and demographic cohort, and diurnal utilisation patterns by weekday average.

7. The Chrono-Adaptive Design Protocol (CADP)

7.1. Protocol Overview

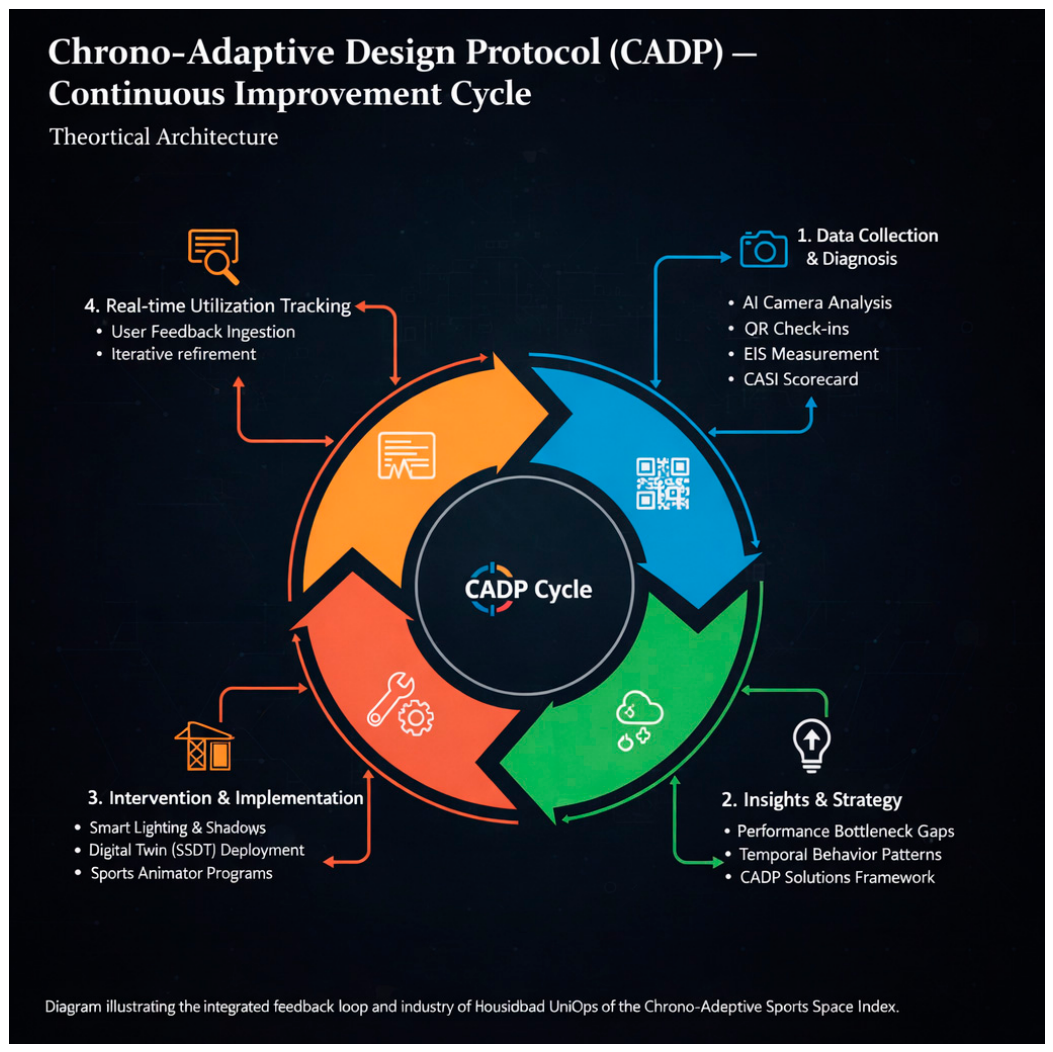
The CASI framework generates diagnostic scores that identify temporal performance gaps; the Chrono-Adaptive Design Protocol (CADP) translates these diagnoses into actionable design, programming, and management prescriptions. The CADP operates across three interconnected layers: physical design interventions, programming frameworks, and smart management systems. It is conceived as a cyclical, iterative process in which CASI assessments generate CADP prescriptions, implemented interventions are monitored through smart city data systems, and subsequent CASI assessments evaluate improvement. It is important to clarify that the CADP is a conceptual and prescriptive framework that has not been implemented and evaluated, and no empirical evidence is available to confirm whether CADP interventions generate the utilisation improvements anticipated by the diagnostic logic. The CADP should be understood as a testable, practice-informed protocol awaiting prospective evaluation. Figure 6 presents the CADP continuous improvement cycle schematically.

7.2. Physical Design Layer

Physical design interventions prescribed by CADP are organised around the identified CASI sub-index weaknesses. For a community with a low DAS (such as Caojiadu), CADP prescribes: (a) installation of modular, foldable equipment panels allowing rapid reconfiguration of court areas; (b) automated shading systems with programmable schedules aligned to diurnal usage peaks; (c) timed LED lighting designed to extend the usable evening window; and (d) the designation of a flexible activity mat zone replacing fixed equipment in a portion of the space. For a community with a low SRS (such as Tianfu’s summer heat challenge), CADP prescribes: (a) expanded and optimised retractable shading coverage; (b) provision of mist-cooling systems at key activity nodes; (c) development of a phased indoor overflow programme for the summer months; and (d) a seasonal activity calendar developed collaboratively with community sports animators.

7.3. Programming Framework Layer

Physical design alone is insufficient to achieve chrono-adaptive sports space performance; active programming and community engagement are essential co-requisites [12]. The CADP programming framework prescribes a structured annual programming calendar for each community sports space, developed through participatory needs assessment with resident demographic groups. Central to the programming framework is the role of the sports animator (体育指导员, Tǐyù Zhǐdǎo yén), a community-employed sports facilitator whose position is recommended by MOHURD but inconsistently implemented. CADP prescribes a specific role for the sports animator that explicitly addresses temporal equity: reaching out to temporally excluded groups, designing programming to serve them, and reporting temporal utilisation gaps to community management.

7.4. Smart Management Systems Layer and Feasibility Considerations

The smart management layer of CADP connects physical and programming interventions to real-time data systems. CADP recommends the implementation of a community Sports Space Digital Twin (SSDT): a continuously updated digital model integrating sensor data, booking system data, and programming calendar information. However, it must be acknowledged that the full digital twin proposal may be feasible only in well-resourced communities with advanced smart city infrastructure. CADP should therefore be understood as a scalable framework with a low-cost baseline configuration and optional digital enhancement. The baseline CADP—requiring only a manual observation protocol, a structured programming calendar, and a community sports animator—can be implemented without any digital infrastructure. Privacy, surveillance, and data governance must be addressed explicitly at the point of implementation. Any camera-based monitoring system should employ aggregate counting technology only, with no individual identification capability.

8. Discussion

8.1. Theoretical Contributions

This paper makes three primary theoretical contributions. First, it introduces CASI as a preliminary index that operationalises temporal dynamics as a primary evaluative criterion for community sports spaces, extending the complete community literature with a temporal quality dimension that more accurately captures effective access to physical activity infrastructure [5,6]. Second, it demonstrates the empirical significance of temporal exclusion as a form of sports space inequity distinct from, and not captured by, spatial proximity measures. The finding that Caojiadu marginally meets MOHURD area per capita standards while scoring 27.7/100 on CASI illustrates the potential inadequacy of purely spatial metrics. Third, it integrates temporal urbanism theory [16,36] with smart city data infrastructure [18] into a policy-applicable planning framework. A fourth contribution is the explicit connection CASI draws between urban form, city design, and temporal equity: the 15 min complete community is not merely a spatial concept—it implies that space should be accessible at the times residents need it, by the residents who need it.

8.2. Policy Implications

The findings carry several significant implications for Chinese community sports policy. The MOHURD 2021 Complete Community Standards should consider incorporating temporal accessibility criteria: specifically, a requirement that community sports space plans include a CASI assessment demonstrating how the proposed provision addresses the diurnal, weekly, seasonal, and demographic lifecycle dimensions of demand. The consistent finding across cases that the midday trough represents the most severe temporal access gap—despite being the period most accessible to caregivers of young children, persons with mobility limitations, and shift workers—suggests that programmatic investment in midday activation could yield high equity returns at relatively low cost. The DLAS findings highlight a systemic risk in China’s current community development trajectory: communities being built today for young families will face a demographic transformation within 15–20 years that their sports infrastructure is not designed to accommodate.

8.3. Framework Applicability and Boundary Conditions

CASI as currently specified has important boundary conditions. The framework was developed and initially assessed in three urban Chinese communities, all of which are designated complete communities with at least moderate smart city infrastructure. Its applicability to the following conditions has not been assessed and may require modification: low-density communities, where the DAS peak-to-trough ratio thresholds may not be reliable; non-Chinese cultural contexts, where different temporal rhythms would be expected; contexts with limited or no smart city data; and rural or peri-urban communities with fundamentally different sports space typologies. Future research should explicitly test CASI’s performance across these boundary conditions and develop adapted protocols where necessary.

8.4. Limitations

Several limitations merit explicit acknowledgement. First, the three-case design does not support statistical generalisation; the study is better characterised as an exploratory framework development exercise rather than a validation study. Future research should apply CASI to a larger, systematically sampled set of Chinese communities across a broader range of city tiers and community types, and should include non-complete community control cases. Second, the observation period was restricted to spring/early summer (April–June 2023) only; no direct observations were collected during winter or peak summer conditions. This is a particularly significant limitation for the SRS sub-index: all three SRS scores incorporate estimation uncertainty that cannot be fully resolved from administrative data and interview recall. Future CASI applications must include four-season direct observation, with particular emphasis on the adverse season most relevant to each climate zone. Third, the equal weighting assumption has not been validated through sensitivity analysis; the ranking between Tianfu (59.6) and Tuanjiehu (52.6) may not be robust to alternative weighting schemes, and formal AHP or entropy-based weighting analysis is required before these rankings are used for policy-consequential decisions. Fourth, the EIS computation relies on observational data that may undercount casual drop-in users, particularly elderly populations less likely to use QR-code booking systems. Fifth, the DLAS demographic projection component relies on residential registration data that may undercount mobile populations. Sixth, the CADP has not been implemented and evaluated; all claims about the potential utilisation improvements associated with CADP interventions should be understood as indicative estimates pending longitudinal evaluation. Together, these limitations mean that CASI should currently be used as a diagnostic and exploratory tool, not as a definitive ranking or policy-validation instrument.

9. Conclusions

This paper has introduced the Chrono-Adaptive Sports Space Index (CASI) and the Chrono-Adaptive Design Protocol (CADP) as a theoretically grounded preliminary framework for addressing a fundamental limitation in current approaches to sports space planning within China’s complete community framework: the failure to account for temporal dynamics in the provision and design of physical activity environments. This study is best understood as a framework development and initial exploratory application rather than a validation of a mature, broadly applicable instrument. The empirical evidence provided by three case studies demonstrates the framework’s diagnostic utility and reveals important patterns of temporal exclusion, but it is insufficient to validate scoring thresholds, confirm weighting choices, or support strong claims about broader generalisability. Through the exploratory assessment of three contrasting Chinese urban communities—Caojiadu in Shanghai, Tianfu Future in Chengdu, and Tuanjiehu in Beijing—the paper demonstrates that static, quantity-focused metrics systematically obscure patterns of temporal exclusion that affect working parents, adolescents, and midday users, while masking demographic misalignment risks that will materialise as communities age.
CASI provides a diagnostic framework for identifying these patterns across four temporal dimensions (diurnal, weekly, seasonal, and demographic lifecycle), while the CADP translates diagnoses into design, programming, and management interventions scalable across different levels of institutional and technological capacity. Before CASI can be considered a broadly applicable assessment instrument, five specific research priorities must be completed: (1) large-scale CASI assessment across a larger and more systematically selected national case set, including non-complete community control cases, to establish performance benchmarks and validate scoring thresholds; (2) longitudinal multi-season observation protocols replacing the current spring-only window; (3) formal weighting sensitivity analysis using AHP, Delphi, or entropy methods to replace the current equal-weighting assumption with an empirically calibrated alternative; (4) prospective evaluation of CADP interventions in communities where they are implemented, to document improvement trajectories and refine the protocol; and (5) adaptation of the CASI framework for boundary conditions including low-density communities, data-limited contexts, and non-Chinese cultural settings, as well as testing across East and Southeast Asian cities with comparable density and demographic challenges. The present study establishes the theoretical foundation and demonstrates the diagnostic value of the framework; this five-part research agenda represents the pathway from exploratory application to validated instrument.

10. Limitations and Future Research Directions

10.1. Limitations of the Present Study

This study represents a framework development and initial exploratory application; it is not a validation of a mature, broadly applicable instrument. The following limitations must be acknowledged explicitly and transparently before the findings are used for policy purposes.
First, the three-case study design does not support statistical generalisation. The study is best characterised as an exploratory framework development exercise; the findings illustrate the diagnostic potential of CASI but cannot establish population-level validity. The selection of only three communities, all located within major Tier-1 and New Area contexts, limits the representativeness of the findings across China’s diverse city tiers, community governance structures, and socioeconomic profiles. Future work must apply CASI to a substantially larger, stratified national sample that includes Tier-2 and Tier-3 cities, township-level communities, and non-designated-complete-community control cases, to enable benchmark calibration and cross-context comparison.
Second, data collection was restricted to spring and early summer (April–June 2023). No direct observational data were collected during winter or peak summer conditions, which are precisely the adverse climate seasons that the Seasonal Resilience Score (SRS) is designed to assess. Accordingly, all three SRS scores incorporate a degree of estimation uncertainty that cannot be fully resolved through administrative data or interview recall. The SRS scores reported here should be understood as partially estimated values, not fully observed measures, and must be interpreted with appropriate epistemic caution. Future CASI applications must employ a minimum of four seasonal observation windows, with particular emphasis on the climate-adverse season most critical to each case community.
Third, the equal-weighting assumption applied to the four CASI sub-indices (25 points each) is a deliberate first-generation design choice in the absence of pre-existing empirical benchmarks; it is not a validated empirical claim. The community ranking between Tianfu (59.6) and Tuanjiehu (52.6) may be sensitive to alternative weighting schemes, particularly if the SRS is assigned greater weight to reflect the severity of seasonal climate challenges. Formal sensitivity analysis using Analytic Hierarchy Process (AHP), Delphi expert panels, Principal Component Analysis (PCA), or entropy-weighting methods is a prerequisite before CASI scores are used in policy-consequential contexts. Until such analysis is conducted, CASI scores should be treated as diagnostic indicators of temporal performance profile rather than definitive comparative rankings.
Fourth, the Equity Integration Score (EIS) relies on observational data that may systematically undercount certain user groups, particularly elderly residents who are less likely to use QR-code-based booking systems and casual drop-in users who do not register through digital platforms. This introduces a potential downward bias in the utilisation shares attributed to these cohorts, which could artificially inflate the Gini coefficient and reduce the EIS multiplier. Similarly, the Demographic Lifecycle Alignment Score (DLAS) depends on residential registration data (户籍 records) that structurally undercount migrant worker populations, who constitute a significant proportion of urban residents in many Chinese communities. Future CASI instruments should develop non-digital counting methods as complementary data sources to reduce the risk of systematic data omission.
Fifth, the Chrono-Adaptive Design Protocol (CADP) is a conceptual, prescriptive framework that has not been prospectively implemented or evaluated in any community. All projected utilisation improvements associated with CADP interventions are indicative estimates grounded in analogous evidence from comparable programmes; they do not constitute empirical evidence from within this study. The CADP should be understood as a testable hypothesis awaiting longitudinal evaluation, not as a proven intervention model.
Sixth, the absence of control cases—communities not designated as complete communities—means that the temporal utilisation patterns identified by CASI cannot be attributed specifically to complete community planning policy. It is not possible to determine, on the basis of this study alone, whether the patterns documented are distinctive to complete communities or reflect more general characteristics of Chinese urban communities. A future study including matched non-complete community comparators within a single metropolitan context would substantially improve the internal validity of CASI’s diagnostic claims.
Seventh, CASI’s equity component—as operationalised through the EIS multiplier—captures only temporal equity, defined as the distribution of utilisation time across demographic cohorts. It does not directly measure spatial accessibility, economic affordability, linguistic or informational accessibility, disability accommodation, or the cultural relevance of available programming. CASI’s equity assessment should therefore be understood as a temporal equity measure within a broader equity landscape that requires complementary instruments for a comprehensive social equity evaluation.

10.2. Future Research Directions

The limitations identified above define a structured and prioritised agenda for future research. The following five directions are considered the most critical for advancing CASI from an exploratory framework to a validated, broadly applicable assessment instrument.
The first and most urgent priority is large-scale, multi-tier national validation. Future research should apply CASI to a minimum of 30 communities across at least three city tiers (Tier-1, Tier-2, and Tier-3), systematically varying community lifecycle stage, climate zone, governance capacity, and designation status (complete community vs. non-designated control). This expanded dataset would enable benchmark calibration for each sub-index, the establishment of empirically grounded threshold values (replacing the provisional thresholds derived in this study), and multi-level modelling that can disentangle city-level from community-level determinants of temporal sports space performance.
The second priority is multi-season longitudinal observation. All future CASI applications should collect a minimum of four seasonal observation rounds per community, including direct observation during the most climatically adverse season. For northern communities such as Tuanjiehu, Beijing, this necessitates a dedicated winter observation protocol; for southern and inland communities such as Tianfu, Chengdu, a peak summer observation window is essential. A longitudinal component spanning at least three years would enable the assessment of demographic lifecycle trajectories in real time, rather than relying on projection models alone, and would permit evaluation of whether CADP-prescribed interventions generate measurable improvements in CASI scores over time.
The third priority is formal weighting sensitivity analysis. The current equal-weighting assumption requires replacement with an empirically calibrated weighting structure derived through a combination of expert elicitation (Delphi method), data-driven weighting (PCA or entropy methods), and stakeholder preference assessment (Analytic Hierarchy Process). An international panel of sports planning specialists, urban designers, public health professionals, and community management practitioners should be convened to provide cross-disciplinary weighting guidance. The sensitivity of CASI rankings to alternative weighting scenarios should be reported as a standard output of all future CASI assessments, enabling users to understand the robustness of comparative findings.
The fourth priority is prospective evaluation of CADP implementation. Future research should identify communities in which CADP physical design, programming, and smart management interventions are implemented and evaluate their effect on temporal utilisation equity through pre- and post-intervention CASI assessments. This longitudinal, quasi-experimental design would provide the first empirical evidence base for the CADP’s intervention logic, enabling the identification of which intervention types generate the greatest temporal equity improvements, under what governance and institutional conditions, and at what cost. Communities with different baseline CASI profiles should be included to test whether the intervention logic generalises across performance levels.
The fifth priority is cross-cultural adaptation and international extension. CASI was developed and initially assessed exclusively within Chinese urban communities, and several design choices reflect China-specific institutional, demographic, and climatic contexts. Future research should test the framework’s applicability in East Asian cities with comparable density, ageing demographics, and collective sports provision models—including Seoul, Tokyo, Singapore, and Hong Kong—as well as in lower-density communities and data-limited contexts. Methodological adaptations may be required for communities without smart city infrastructure, and a ‘CASI Lite’ protocol requiring only manual observation and structured community consultation should be developed to ensure the framework’s accessibility in resource-constrained settings across Global South cities experiencing rapid urbanisation.
Collectively, these five directions represent the pathway from the current exploratory application to a validated, policy-relevant instrument. The present study has established the theoretical foundations and demonstrated the diagnostic utility of the CASI framework; this research agenda defines the empirical work required to fulfil that diagnostic potential at scale. The authors are committed to advancing this agenda through collaborative research partnerships with community management institutions, municipal sports bureaux, and urban planning authorities across Chinese and international contexts.

Author Contributions

Conceptualization & Methodology, M.A.A.A.; Formal analysis, C.W.; Investigation, M.A.A.A.; Writing—original draft, M.A.A.A. and C.W.; Writing—review & editing, J.T. All authors have read and agreed to the published version of the manuscript.

Funding

This research received no external funding.

Institutional Review Board Statement

This study was conducted in accordance with the Declaration of Helsinki. Ethical review and approval were waived for this study as the research involved non-interventional methods only, including systematic behavioural observation in publicly accessible community spaces with no individual identification, and voluntary semi-structured interviews with anonymised community residents involving no sensitive personal, medical, or financial data. Aggregated administrative data were obtained under formal data-sharing agreements with municipal sports bureaux and processed at aggregate level only. These conditions are consistent with standard practice for observational urban studies research in China, and formal IRB approval was not required.

Informed Consent Statement

Informed consent was obtained from all participants involved in the study. All interview participants were fully informed prior to participation about: the purpose of the research and how their responses would be used; that participation was entirely voluntary and could be withdrawn at any time; that their responses would be fully anonymised and no identifying information would appear in any publication; and that there were no foreseeable risks associated with participation. All participants provided informed verbal consent before the interview commenced.

Data Availability Statement

Smart city administrative data were obtained under formal data-sharing agreements with district-level sports bureaux and community management committees and are available upon reasonable request to the corresponding author, subject to data governance agreements.

Acknowledgments

The authors wish to thank the community management staff and residents of Caojiadu, Tianfu Future, and Tuanjiehu communities for their participation and cooperation in this research.

Conflicts of Interest

The authors declare no conflicts of interest.

References

  1. Sallis, J.F.; Bull, F.; Guthold, R.; Heath, G.W.; Inoue, S.; Kelly, P.; Oyeyemi, A.L.; Perez, L.G.; Richards, J.; Hallal, P.C. Progress in physical activity over the Olympic quadrennium. Lancet 2016, 388, 1325–1336. [Google Scholar] [CrossRef] [PubMed]
  2. World Health Organization [WHO]. Global Status Report on Physical Activity 2022; WHO: Geneva, Switzerland, 2022. [Google Scholar]
  3. Dembski, F.; Wössner, U.; Letzgus, M.; Ruddat, M.; Yamu, C. Urban digital twins for smart cities and citizens: The case study of Herrenberg, Germany. Sustainability 2020, 12, 2307. [Google Scholar] [CrossRef]
  4. Liu, J.; Chen, W. Seasonal accessibility of outdoor sports spaces in Chinese cities: Climate, design, and behaviour. Landsc. Urban Plan. 2021, 210, 104077. [Google Scholar]
  5. Moreno, C.; Allam, Z.; Chabaud, D.; Gall, C.; Pratlong, F. Introducing the ‘15-minute city’: Sustainability, resilience and place identity in future post-pandemic cities. Smart Cities 2021, 4, 93–111. [Google Scholar]
  6. Ministry of Housing Urban-Rural Development [MOHURD]. Guidelines for the Construction of Complete Residential Communities; MOHURD of the PRC: Beijing, China, 2021. (In Chinese)
  7. Chen, X.; Liu, Y. Evaluating China’s complete community policy: Progress, challenges, and pathways. Urban Plan. Rev. 2022, 46, 12–25. [Google Scholar]
  8. Chen, Y.; Lu, J. Physical activity environments and active aging in Chinese urban communities: A systematic review. Int. J. Environ. Res. Public Health 2021, 18, 4820. [Google Scholar]
  9. Chen, Z.; Yeh, A.G.O.; Xu, J. Mapping dynamic urban land use patterns with crowdsourced geospatial data and geodetector tool. ISPRS Int. J. Geo-Inf. 2020, 9, 332. [Google Scholar]
  10. Ding, L.; Wu, J.; Huang, X. Sports facility planning in Chinese urban communities: A gap analysis. J. Urban Plan. Dev. 2019, 145, 04019018. [Google Scholar]
  11. Zhang, L.; Wang, X. Sports facility provision in urban China: Distribution, accessibility, and equity. Urban Policy Res. 2020, 38, 30–45. [Google Scholar]
  12. Li, Y.; Zhang, H.; Chen, S. Temporal dynamics of community sports space use in Chinese cities: A multi-site observational study. Urban Stud. 2023, 60, 1342–1361. [Google Scholar]
  13. Duany, A.; Plater-Zyberk, E.; Speck, J. Suburban Nation: The Rise of Sprawl and the Decline of the American Dream; North Point Press: New York, NY, USA, 2000. [Google Scholar]
  14. Jenks, M.; Burgess, R. (Eds.) Compact Cities: Sustainable Urban Forms for Developing Countries; Spon Press: London, UK, 2000. [Google Scholar]
  15. Muliček, O.; Osman, R.; Seidenglanz, D. Urban rhythms: Timescape of a post-communist city. Urban Stud. 2015, 52, 52–70. [Google Scholar]
  16. Schwanen, T. Rethinking resilience as capacity to endure: Automobility and the city. City 2016, 20, 152–160. [Google Scholar] [CrossRef]
  17. Neuhaus, F. (Ed.) Emerging Urban Spaces: A Planetary Perspective; Springer: Berlin/Heidelberg, Germany, 2015. [Google Scholar]
  18. Kitchin, R. The real-time city? Big data and smart urbanism. GeoJournal 2014, 79, 1–14. [Google Scholar]
  19. Lui, C.W.; Everingham, J.A.; Warburton, J.; Cuthill, M.; Bartlett, H. What makes a community age-friendly: A review of international literature. Australas. J. Ageing 2011, 30, 116–121. [Google Scholar]
  20. Pozoukidou, G.; Chatziyiannaki, Z. 15-Minute city: Decomposing the new urban planning eutopia. Sustainability 2021, 13, 928. [Google Scholar] [CrossRef]
  21. Gehl, J. Cities for People; Island Press: Washington, DC, USA, 2011. [Google Scholar]
  22. Jacobs, J. The Death and Life of Great American Cities; Random House: New York, NY, USA, 1961. [Google Scholar]
  23. Lu, Y. From danwei community to commercial gated estates: The transformation of sports space in Chinese urban residential environments. Hous. Stud. 2019, 34, 947–966. [Google Scholar]
  24. Wu, F. Planning for Growth: Urban and Regional Planning in China; Routledge: London, UK, 2015. [Google Scholar]
  25. Zhu, J.; Zhang, L.; Li, X. Community sports space transformation in post-reform China: Market transition and public recreation. Environ. Plan. A Econ. Space 2020, 52, 1089–1108. [Google Scholar]
  26. Sharpe, P.A.; Granner, M.L.; Hutto, B.; Ainsworth, B.E. Association of environmental factors to meeting physical activity recommendations in two South Carolina counties. Am. J. Health Promot. 2004, 18, 251–257. [Google Scholar] [CrossRef] [PubMed]
  27. Talen, E. The spatial logic of parks. J. Urban Des. 2010, 15, 165–182. [Google Scholar] [CrossRef]
  28. Ding, D.; Sallis, J.F.; Kerr, J.; Lee, S.; Rosenberg, D.E. Neighborhood environment and physical activity among youth: A review. Am. J. Prev. Med. 2011, 41, 442–455. [Google Scholar] [PubMed]
  29. Pawlowski, T.; Breuer, C.; Wicker, P.; Poupaux, S. Travel time spending behaviour and the value of leisure time: Evidence from a German household survey. Transp. Res. Part A 2018, 109, 56–69. [Google Scholar]
  30. Stevenson, M.; Thompson, J.; de Sá, T.H.; Ewing, R.; Mohan, D.; McClure, R.; Roberts, I.; Tiwari, G.; Giles-Corti, B.; Sun, X.; et al. Land use, transport, and population health: Estimating the health benefits of compact cities. Lancet 2019, 394, 249–259. [Google Scholar]
  31. McKenzie, T.L.; Cohen, D.A.; Sehgal, A.; Williamson, S.; Golinelli, D. System for Observing Play and Recreation in Communities (SOPARC): Reliability and feasibility measures. J. Phys. Act. Health 2006, 3, S208–S222. [Google Scholar] [CrossRef] [PubMed]
  32. Saelens, B.E.; Frank, L.D.; Auffrey, C.; Whitaker, R.C.; Bracy, N.L.; Sallis, J.F. Measuring physical environments of parks and playgrounds. Am. J. Prev. Med. 2006, 31, S89–S95. [Google Scholar]
  33. Shores, K.A.; West, S.T. The relationship between built park environments and physical activity in four park locations. J. Public Health Manag. Pract. 2008, 14, E9–E16. [Google Scholar] [CrossRef] [PubMed]
  34. Armstrong, T.; Bull, F.; Neiman, A. Development of the World Health Organization Global Physical Activity Questionnaire (GPAQ). J. Public Health 2006, 14, 66–70. [Google Scholar] [CrossRef]
  35. GB 50180-2018; Standard for Urban Residential Area Planning and Design. China Architecture & Building Press: Beijing, China, 2018.
  36. Hägerstrand, T. What about people in regional science? Pap. Reg. Sci. Assoc. 1970, 24, 7–24. [Google Scholar] [CrossRef]
  37. Kwan, M.-P. Space-time and integral measures of individual accessibility. Geogr. Anal. 1998, 30, 191–216. [Google Scholar]
  38. Miller, H.J. Modelling accessibility using space-time prism concepts within geographical information systems. Int. J. Geogr. Inf. Syst. 1991, 5, 287–301. [Google Scholar] [CrossRef]
  39. Magrinyà, F.; Mayorga, M.; Cuchí, A. The Barcelona superblock: A city-block model for more sustainable and socially equitable cities. Cities 2021, 115, 103225. [Google Scholar]
  40. Kim, H.; Lee, J. Living SOC policy and community sports space provision in Seoul. J. Urban Aff. 2020, 42, 812–829. [Google Scholar]
  41. Hidalgo, R.; Huerta, J. Neighbourhood sports facilities and compact city form in Tokyo. Urban Stud. Res. 2020, 12, 45–61. [Google Scholar]
  42. Sport Singapore. ActiveSG Community Sports Programme Annual Report 2022; Sport Singapore: Singapore, 2022. [Google Scholar]
  43. Caragliu, A.; Del Bo, C.; Nijkamp, P. Smart cities in Europe. J. Urban Technol. 2011, 18, 65–82. [Google Scholar] [CrossRef]
  44. Yigitcanlar, T.; Kamruzzaman; Buys, L.; Ioppolo, G.; Sabatini-Marques, J.; da Costa, E.M.; Yun, J.J. Understanding ‘smart cities’: Intertwining development drivers with desired outcomes in a multidimensional framework. Cities 2019, 81, 145–160. [Google Scholar]
  45. Zheng, Y.; Li, T.; Liu, C. Smart community sports management in China: Practices, potentials, and challenges. J. Phys. Educ. Sport Manag. 2020, 11, 44–58. [Google Scholar]
  46. Li, J.; Ye, M. Smart community management and sports facility utilisation in China: Opportunities and barriers. Smart Cities 2022, 5, 512–528. [Google Scholar]
  47. Muhammad, A.A.A.; Maged, Y.; Eman, H. Nature-integrated and biophilic design in kindergartens: Enhancing children’s well-being and spatial attachment. Archit. City Environ. 2025, 20, 13360. [Google Scholar] [CrossRef]
  48. Holland, J.H. Hidden Order: How Adaptation Builds Complexity; Addison-Wesley: Reading, MA, USA, 1995. [Google Scholar]
  49. Wang, D.; Lam, K.C. Elderly residents’ physical activity and its relation to neighbourhood environment in Chinese cities. Int. J. Urban Reg. Res. 2017, 41, 337–354. [Google Scholar]
  50. Zhang, Y.; Li, M.; Huang, J. Temporal patterns of physical activity and community sports participation in Chinese cities: A multi-method analysis. J. Transp. Health 2021, 22, 101109. [Google Scholar]
  51. Yin, R.K. Case Study Research and Applications: Design and Methods, 6th ed.; SAGE Publications: New York, NY, USA, 2018. [Google Scholar]
  52. Flyvbjerg, B. Five misunderstandings about case-study research. Qual. Inq. 2006, 12, 219–245. [Google Scholar] [CrossRef]
  53. Seawright, J.; Gerring, J. Case selection techniques in case study research: A menu of qualitative and quantitative options. Political Res. Q. 2008, 61, 294–308. [Google Scholar]
  54. Braun, V.; Clarke, V. Using thematic analysis in psychology. Qual. Res. Psychol. 2006, 3, 77–101. [Google Scholar] [CrossRef]
  55. OECD. Handbook on Constructing Composite Indicators: Methodology and User Guide; OECD Publishing: Paris, France, 2008. [Google Scholar]
  56. Li, X.; Song, J.; Lin, T.; Dixon, J.; Zhang, G.; Ye, H. Built environment and physical activity among middle-aged and older adults in Chinese cities. Cities 2020, 97, 102501. [Google Scholar]
  57. National Bureau of Statistics of China. China Statistical Yearbook 2022; China Statistics Press: Beijing, China, 2022.
Figure 1. Chinese urban demographic shift (2000–2035) and complete community policy timeline. Source: Authors’ own work.
Buildings 16 02704 g001
Figure 2. CASI framework: Four temporal dimensions of sports space performance—theoretical architecture. Source: Authors’ own work.
Buildings 16 02704 g002
Figure 3. CASI sub-index radar chart: Comparative performance of three chinese communities. Source: Authors’ own work.
Buildings 16 02704 g003
Figure 4. Heat map: Sports space utilisation by time of day and demographic cohort. Source: Authors’ own work.
Buildings 16 02704 g004
Figure 5. Diurnal utilisation patterns across three Chinese communities (weekday average). Source: Authors’ own work.
Buildings 16 02704 g005
Figure 6. Chrono-Adaptive Design Protocol (CADP)—Continuous Improvement Cycle. Source: Authors’ own work.
Buildings 16 02704 g006
Table 1. Systematic comparison of sports space assessment instruments.
InstrumentTemporal CoverageDemographic ScopeSpatial AnalysisSmart Data IntegrationPolicy Prescriptive?
CASI (present study)Full (diurnal, weekly, seasonal, lifecycle)All cohorts + lifecycle projectionNetwork-distance GISYes (core component)Yes (CADP)
SOPARC [31]Snapshot observation onlyAge, gender, raceZone-basedNoNo
EAPRS [32]None (static audit)Accessibility featuresLimitedNoLimited
PARA [33]None (static inventory)NoneProximity onlyNoNo
GPAQ/WHO [34]Self-reported recallIndividual levelNoneNoNo
MOHURD GB 50180 [35]None (quota-based)Aggregate per capitaDistance radius onlyNoYes (standards)
CASI: Chrono-Adaptive Sports Space Index; SOPARC: System for Observing Play and Recreation in Communities; EAPRS: Environmental Assessment of Public Recreation Spaces; PARA: Physical Activity Resource Assessment; GPAQ: Global Physical Activity Questionnaire; CADP: Chrono-Adaptive Design Protocol; GIS: Geographic Information System.
Table 2. CASI sub-index structure, scoring criteria, and weighting rationale.
Sub-IndexTemporal DimensionKey IndicatorsDesign LeversWeighting Rationale
DAS (0–25)Diurnal (within-day)Peak/trough utilisation ratio; number of user cohorts served across 18 active hoursAdjustable shading; timed lighting; modular equipment; programming schedules25 pts: diurnal variation most acute in Chinese communities; strongest evidence base
WFS (0–25)Weekly (weekday vs. weekend)Weekday–weekend utilisation differential; family group accommodation scoreFlexible spatial configuration; temporary facility deployment; weekend programming25 pts: 40–60% weekend uplift documented across Chinese communities
SRS (0–25)Seasonal (annual climate cycle)Seasonal usability score; climate-adaptive design elements; year-round activity diversityShading/sheltering; heating/cooling infrastructure; seasonal programming calendar25 pts: extreme climate conditions cause documented 38–52% utilisation loss
DLAS (0–25)Demographic lifecycle (10–20 year)Modular infrastructure convertibility score; % of space usable by all age groupsUniversal design elements; convertible/modular infrastructure; long-range demographic planning25 pts: China’s ageing trajectory creates structural risk of rapid demographic misalignment
EIS (×0.6–1.0)Cross-cutting equity correctionModified Gini coefficient of temporal utilisation across demographic cohortsApplied as composite score multiplier; penalises demographic concentrationMultiplier not additive sub-index: equity acts as modifier on aggregate performance
Table 3. Comparative CASI scores across three Chinese community cases.
CommunityDAS/25WFS/25SRS/25DLAS/25EISCASI/100
Caojiadu, Shanghai (ageing inner-city)7141650.6627.7
Tianfu Future, Chengdu (newly planned)192114170.8459.6
Tuanjiehu, Beijing (renovating mid-vintage)151818140.8152.6
Disclaimer/Publisher’s Note: The statements, opinions and data contained in all publications are solely those of the individual author(s) and contributor(s) and not of MDPI and/or the editor(s). MDPI and/or the editor(s) disclaim responsibility for any injury to people or property resulting from any ideas, methods, instructions or products referred to in the content.