Review

Biobehavioral Responses to the Built Environment: A Technology-Driven Review of Health Outcomes

by
Naibin Jiang
*,
Chao Chen
,
Zhen Peng
,
Xinyu Li
and
Jianmin Du
College of Architecture and Urban Planning, Qingdao University of Technology, Qingdao 266033, China
*
Author to whom correspondence should be addressed.
Buildings 2026, 16(13), 2611; https://doi.org/10.3390/buildings16132611
Submission received: 20 May 2026 / Revised: 22 June 2026 / Accepted: 24 June 2026 / Published: 29 June 2026
(This article belongs to the Special Issue Green Cities: Designs for Health and Sustainability)

Abstract

Urbanization underscores the critical role of the built environment in shaping human health outcomes. Recently, technology-driven assessment enables a more precise, dynamic, and objective evaluation of individuals’ biobehavioral responses to built environments and their health. However, existing reviews are limited to single technologies, single health outcomes, or specific environmental features. As a result, this narrative review summarizes 269 studies (2003–2025) to examine how such technology-driven methodologies capture the effects of built environments on psychophysiological well-being. Findings reveal a four-stage evolution in methodology from subjective evaluations and single-device monitoring to integrated subjective-objective measures and, more recently, multimodal synergistic frameworks. Accordingly, based on a technology-driven assessment of biobehavioral responses, this review synthesizes a dual-pathway framework linking the built environment to health: (1) psychological responses are mediated through emotion-arousal mechanisms, encompassing 22 key emotions across both positive and negative valences; and (2) physiological outcomes are influenced by behavioral–psychological mediation and direct environmental exposure, encompassing six categories that span from subclinical dysfunction to clinical disease risk. This review thereby provides a framework derived from the reviewed evidence that connects built environments to health through measurable biobehavioral pathways, directly supporting human-centered urban design and assessment.

1. Introduction

Environment and health remain central to societal development, as accelerating urbanization underscores the multifaceted influence of the built environment on physiological, psychological, and social well-being. In this review, the built environment refers to the physical and perceptual attributes of urban spaces that individuals encounter and interact with in daily routines, such as green and blue spaces, building density, and street morphology, which collectively interact with physiological indicators and behavioral responses [1]. When such environmental exposures persist, they eventually are associated with health outcomes. Here, health outcomes refer to measurable changes in psychological and physical well-being attributed to built environment exposures. Examples range from psychological states (e.g., stress, anxiety) [2], to physiological markers (e.g., blood pressure, heart rate variability) [3] and ultimately to chronic conditions including cardiovascular disease (CVD), respiratory issues, and obesity [4,5].
Therefore, the built environment plays a significant role in health promotion and restoration. Psychologically, environmental exposures are tied to emotional outcomes. For example, Chen et al. [6] found that blue–green spaces are associated with neural recovery and reduced anxiety, while Liu et al. [7] reported that such spaces correlate with lower risks of depression and other mental disorders. In addition to blue–green spaces, accessible infrastructure is also linked to mental well-being [8]. Specifically, clean and safe walking spaces and positive street perception are associated with psychological stress relief [9]. Physiologically, access to blue–green spaces enhances physical comfort [10]. Outdoor physical activity, promoted by well-designed infrastructure, is linked to both better physical health and improved perceived recovery [11]. Additionally, perceived environmental characteristics such as affluence, monotony, and vibrancy influence behavioral and interactive patterns, providing a new perspective for linking urban environment to social health [12]. These findings collectively show that the built environment influences health behaviors through physiological, psychological, and social pathways.
Early research on environment and health featured questionnaires [5], video tests, postal surveys and telephone surveys [13]. These methods are valuable for preliminary research, but their limitation lies in slow data processing, which restricts the depth of the investigations. Subsequently, the research method shifted toward a new stage using single-type sensors, referring to portable bio-sensing tools that capture real-time physiological signals in response to environmental exposure. With such tools, researchers could directly measure how the built environment relates to physical and mental responses, from stress and emotions to overall comfort, such as electroencephalography (EEG) and electrocardiogram (ECG). For instance, Song et al. [14] employed blood pressure (BP) monitors to examine the restorative effects of urban forest landscapes on physiological and psychological health. Kim et al. [15] utilized inertial measurement units (IMUs) to collect pedestrian physical responses for improving street safety. Tilley et al. [16] applied EEG to measure the neural responses of older adults during exposure to green spaces. Li et al. [17] used infrared thermography to detect occupants’ thermal comfort conditions. Beyond sensor data, virtual reality (VR) and machine learning (ML) broadened the research scope. VR enables controlled environmental simulations. Asgarzadeh et al. [18] used VR to measure the oppressiveness of streetscapes, observing that tree-covered settings were associated with lower perceived pressure. ML, in turn, helps uncover complex relationships between environmental exposure and physiological responses. Ojha et al. [19] applied ML to analyze the effects of urban spaces on participants’ physiological reactions.
Recent advances in technology have helped speed up research that uses multiple devices. For instance, Browning et al. [20] combined VR with electrodermal activity (EDA) to demonstrate the benefits of nature exposure in promoting body responses and health recovery. Gritzka et al. [21] employed sensors and ML to evaluate the impact of environment changes on employees’ health. Larkin et al. [22] assessed the influence of the built environment on human health using multi-source data and deep learning (DL) algorithms. Torku et al. [23] combined photoplethysmography (PPG), EDA, and GPS to identify stress hotspots in older adults and support age-friendly urban improvements. Luo et al. [24] further applied ECG, EEG and questionnaires to examine the positive effects of blue–green spaces on emotional relaxation and mental health. These integrated approaches address the traditional trade-off between efficiency and precision in urban perception assessment by improving both data processing and research accuracy [25].
Research methodologies in built environment and health have evolved from social science approaches, through single-sensor applications, to contemporary multimodal data fusion. Driven by advances in wearables, sensing technologies, and artificial intelligence (AI), this evolution has shifted paradigms from macro-level correlations to the real-time, micro-scale monitoring of behavior and physiology [6]. It has further promoted the innovative application of human–computer interaction (HCI) in environmental health assessment and proactive intervention, providing new data and methodologies for studying the health effects of the built environment [8]. Together, these monitored phenomena constitute biobehavioral responses. These responses refer to dynamically interacting physiological and behavioral reactions in response to built environment stimuli, which mediate the pathway from exposure to health outcomes.
However, despite the proliferation of new technologies that enable the precise measurement of human responses, no review has yet synthesized how these technology-driven approaches capture the impact of built environments on psychophysiological well-being or integrated the findings into a coherent framework. Therefore, this review aims to construct a framework derived from the reviewed evidence that links built environment exposure to human health outcomes through biobehavioral responses. Ultimately, to achieve this aim, this review is guided by the following research questions: (1) What is the methodological evolution and typology of technology-driven assessment in built environment-health research? (2) By what mechanisms do built environments influence psychological and physiological well-being? (3) How can technology-derived insights be structured into a translational framework for human-centered design?

2. Methodology

2.1. Search Strategy

This review aims to synthesize evidence on the built environment’s influence on human health (psychological, physiological). A comprehensive literature search was conducted primarily in Web of Science and Scopus for the period 2003–2025. Full texts were accessed via platforms including ScienceDirect, MDPI, and other publisher websites. The operationalization of the “built environment” in empirical studies varies widely, often focusing on specific manipulable features. To capture these diverse approaches, our search strategy integrated three keywords: (1) the core concept of “built environment”; (2) physiological, psychological, social health outcomes; and (3) technology for assessment (e.g., “VR”, “multimodal sensing”, “human factors and ergonomics”) relevant to health measurement. This approach covered many related fields, including urban planning, architecture, environmental psychology, public health, and social sciences.
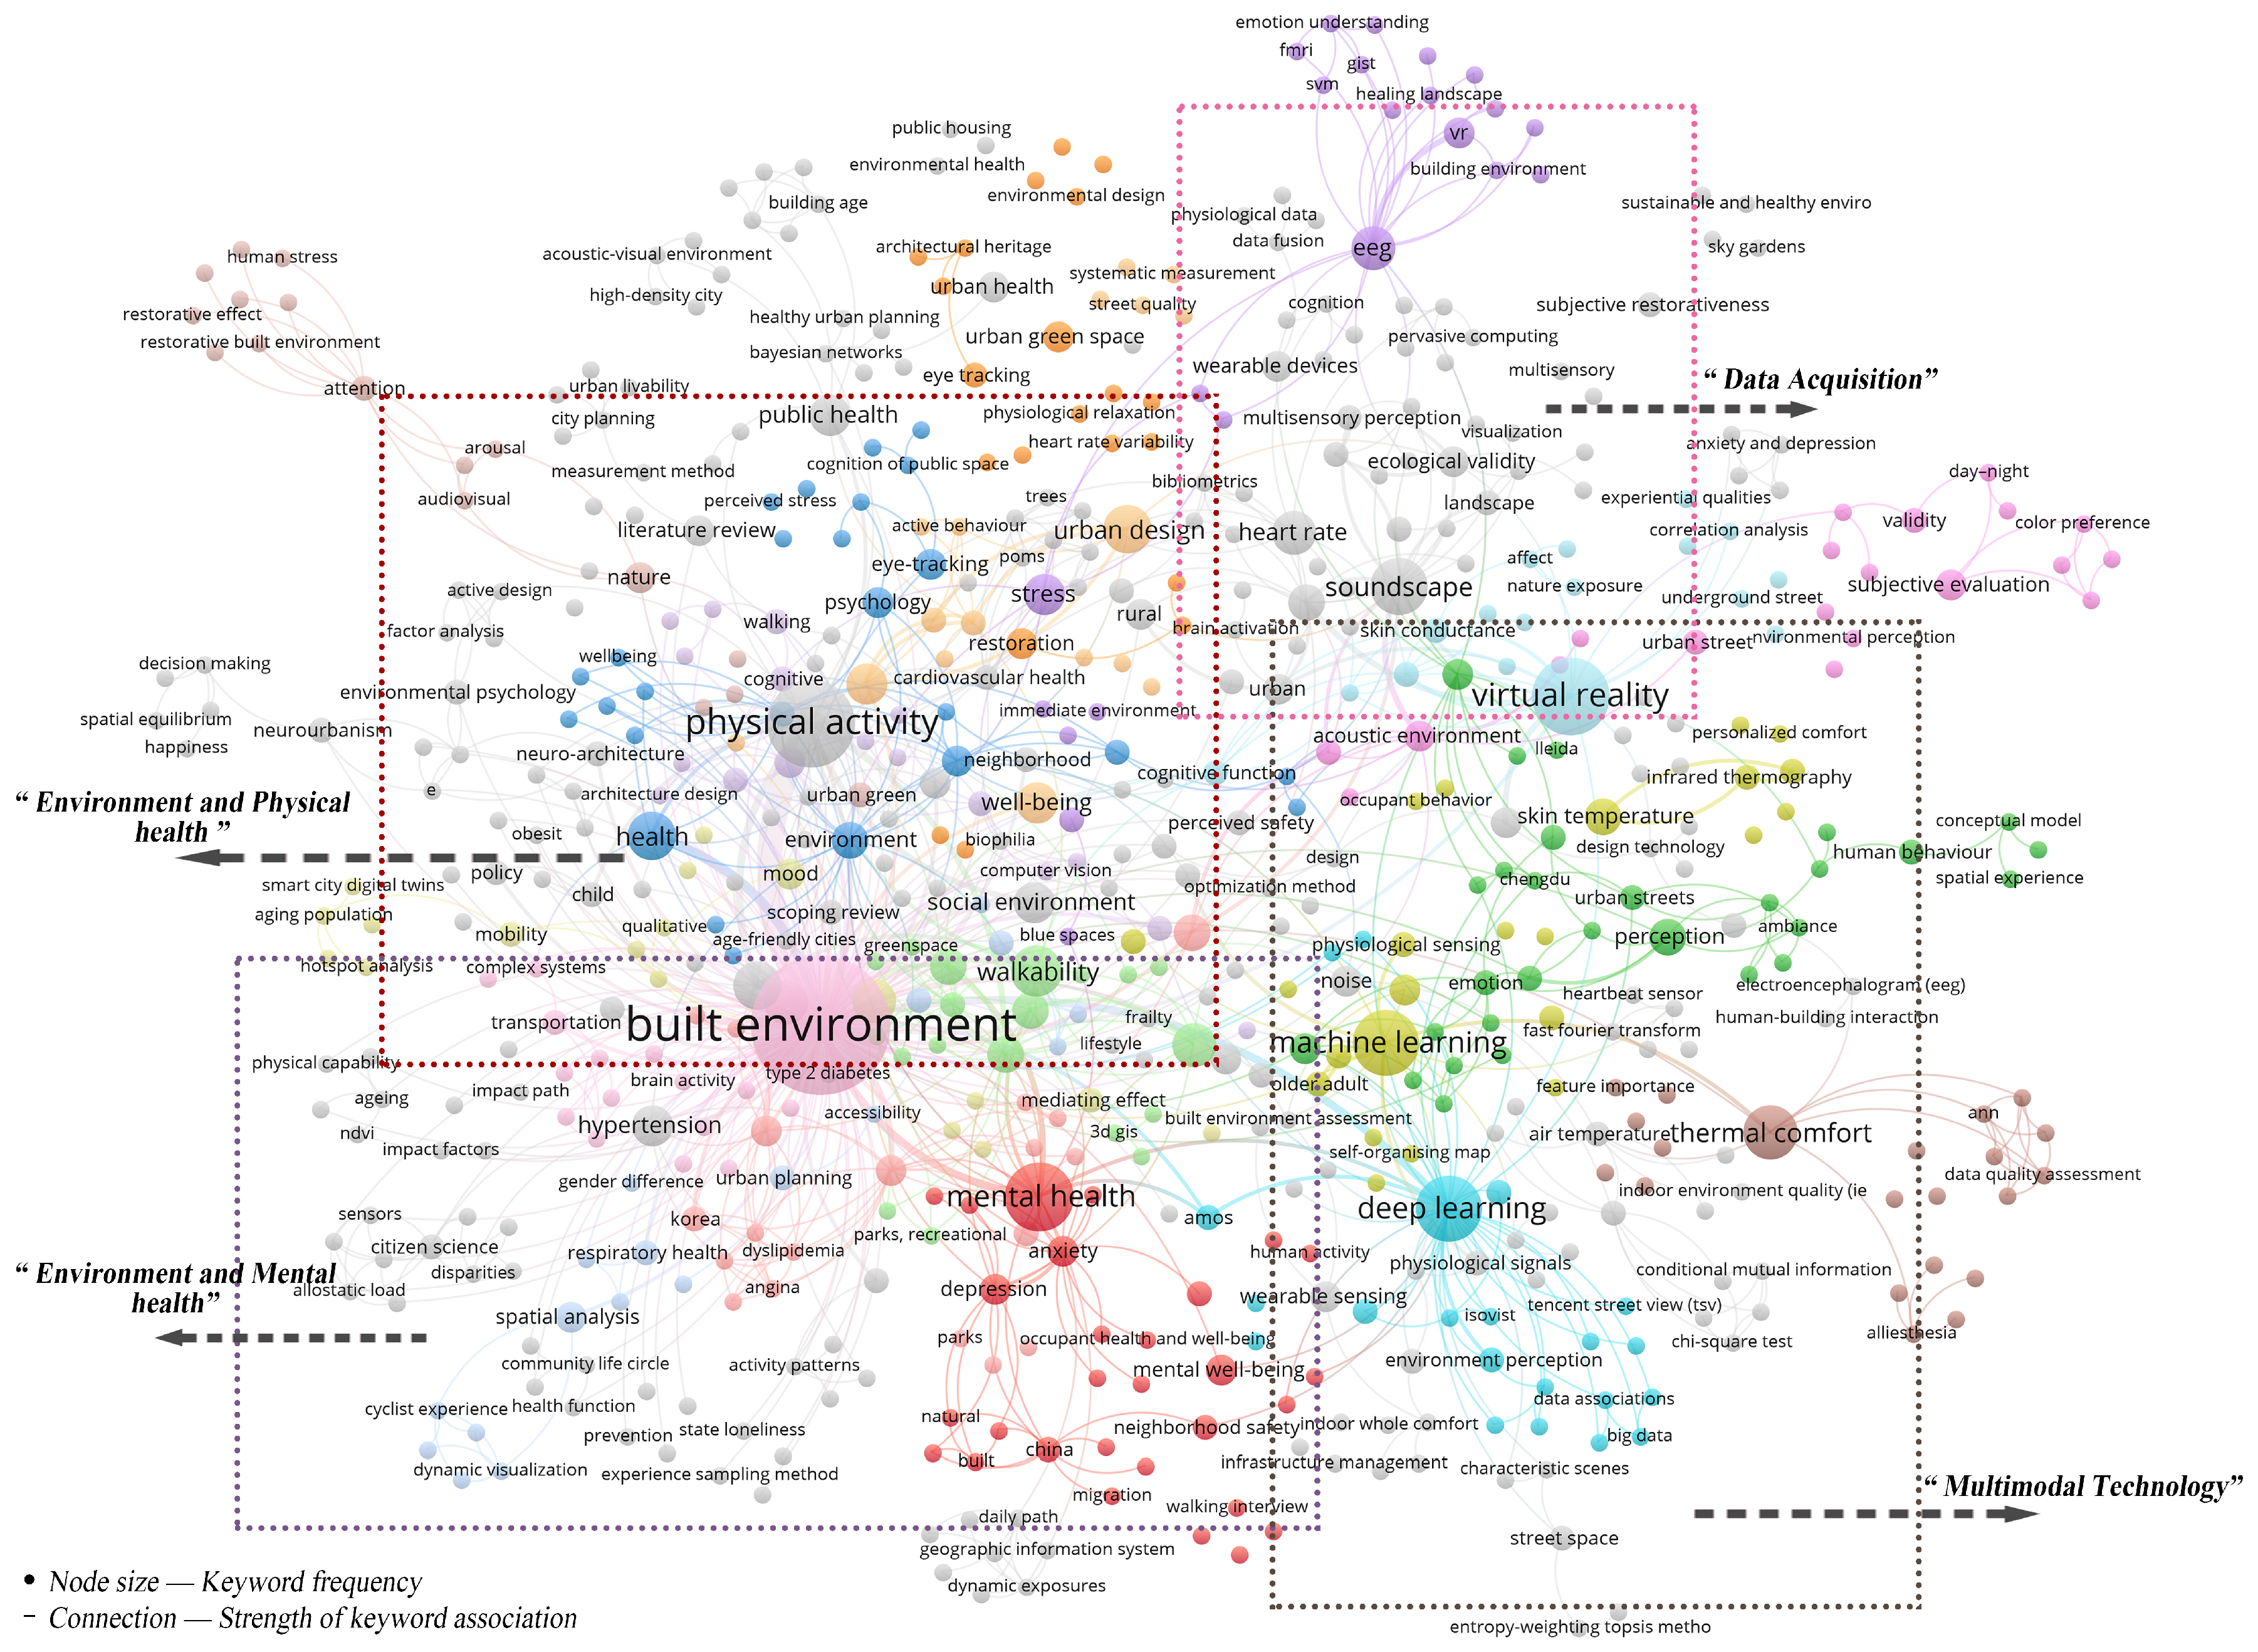
Analysis of the co-occurrence network identifies mental and physical health as primary outcomes linked to the built environment (Figure 1). For physical health, frequent indicators include walkability and individual well-being. These reflect how well people can move and their overall physical condition. For mental health, commonly used terms such as anxiety, stress, and perceived safety reflect how people feel in response to environmental exposures. For methodologies, keywords include sensing devices (e.g., EEG), ML and DL. The frequent use of these terms shows the popularity of emerging technologies in studying how the built environment relates to health. Collectively, the network helps summarize the main research topics and method trends. It pulls together what the field is studying now and how it is studied.

2.2. Literature Selection Process

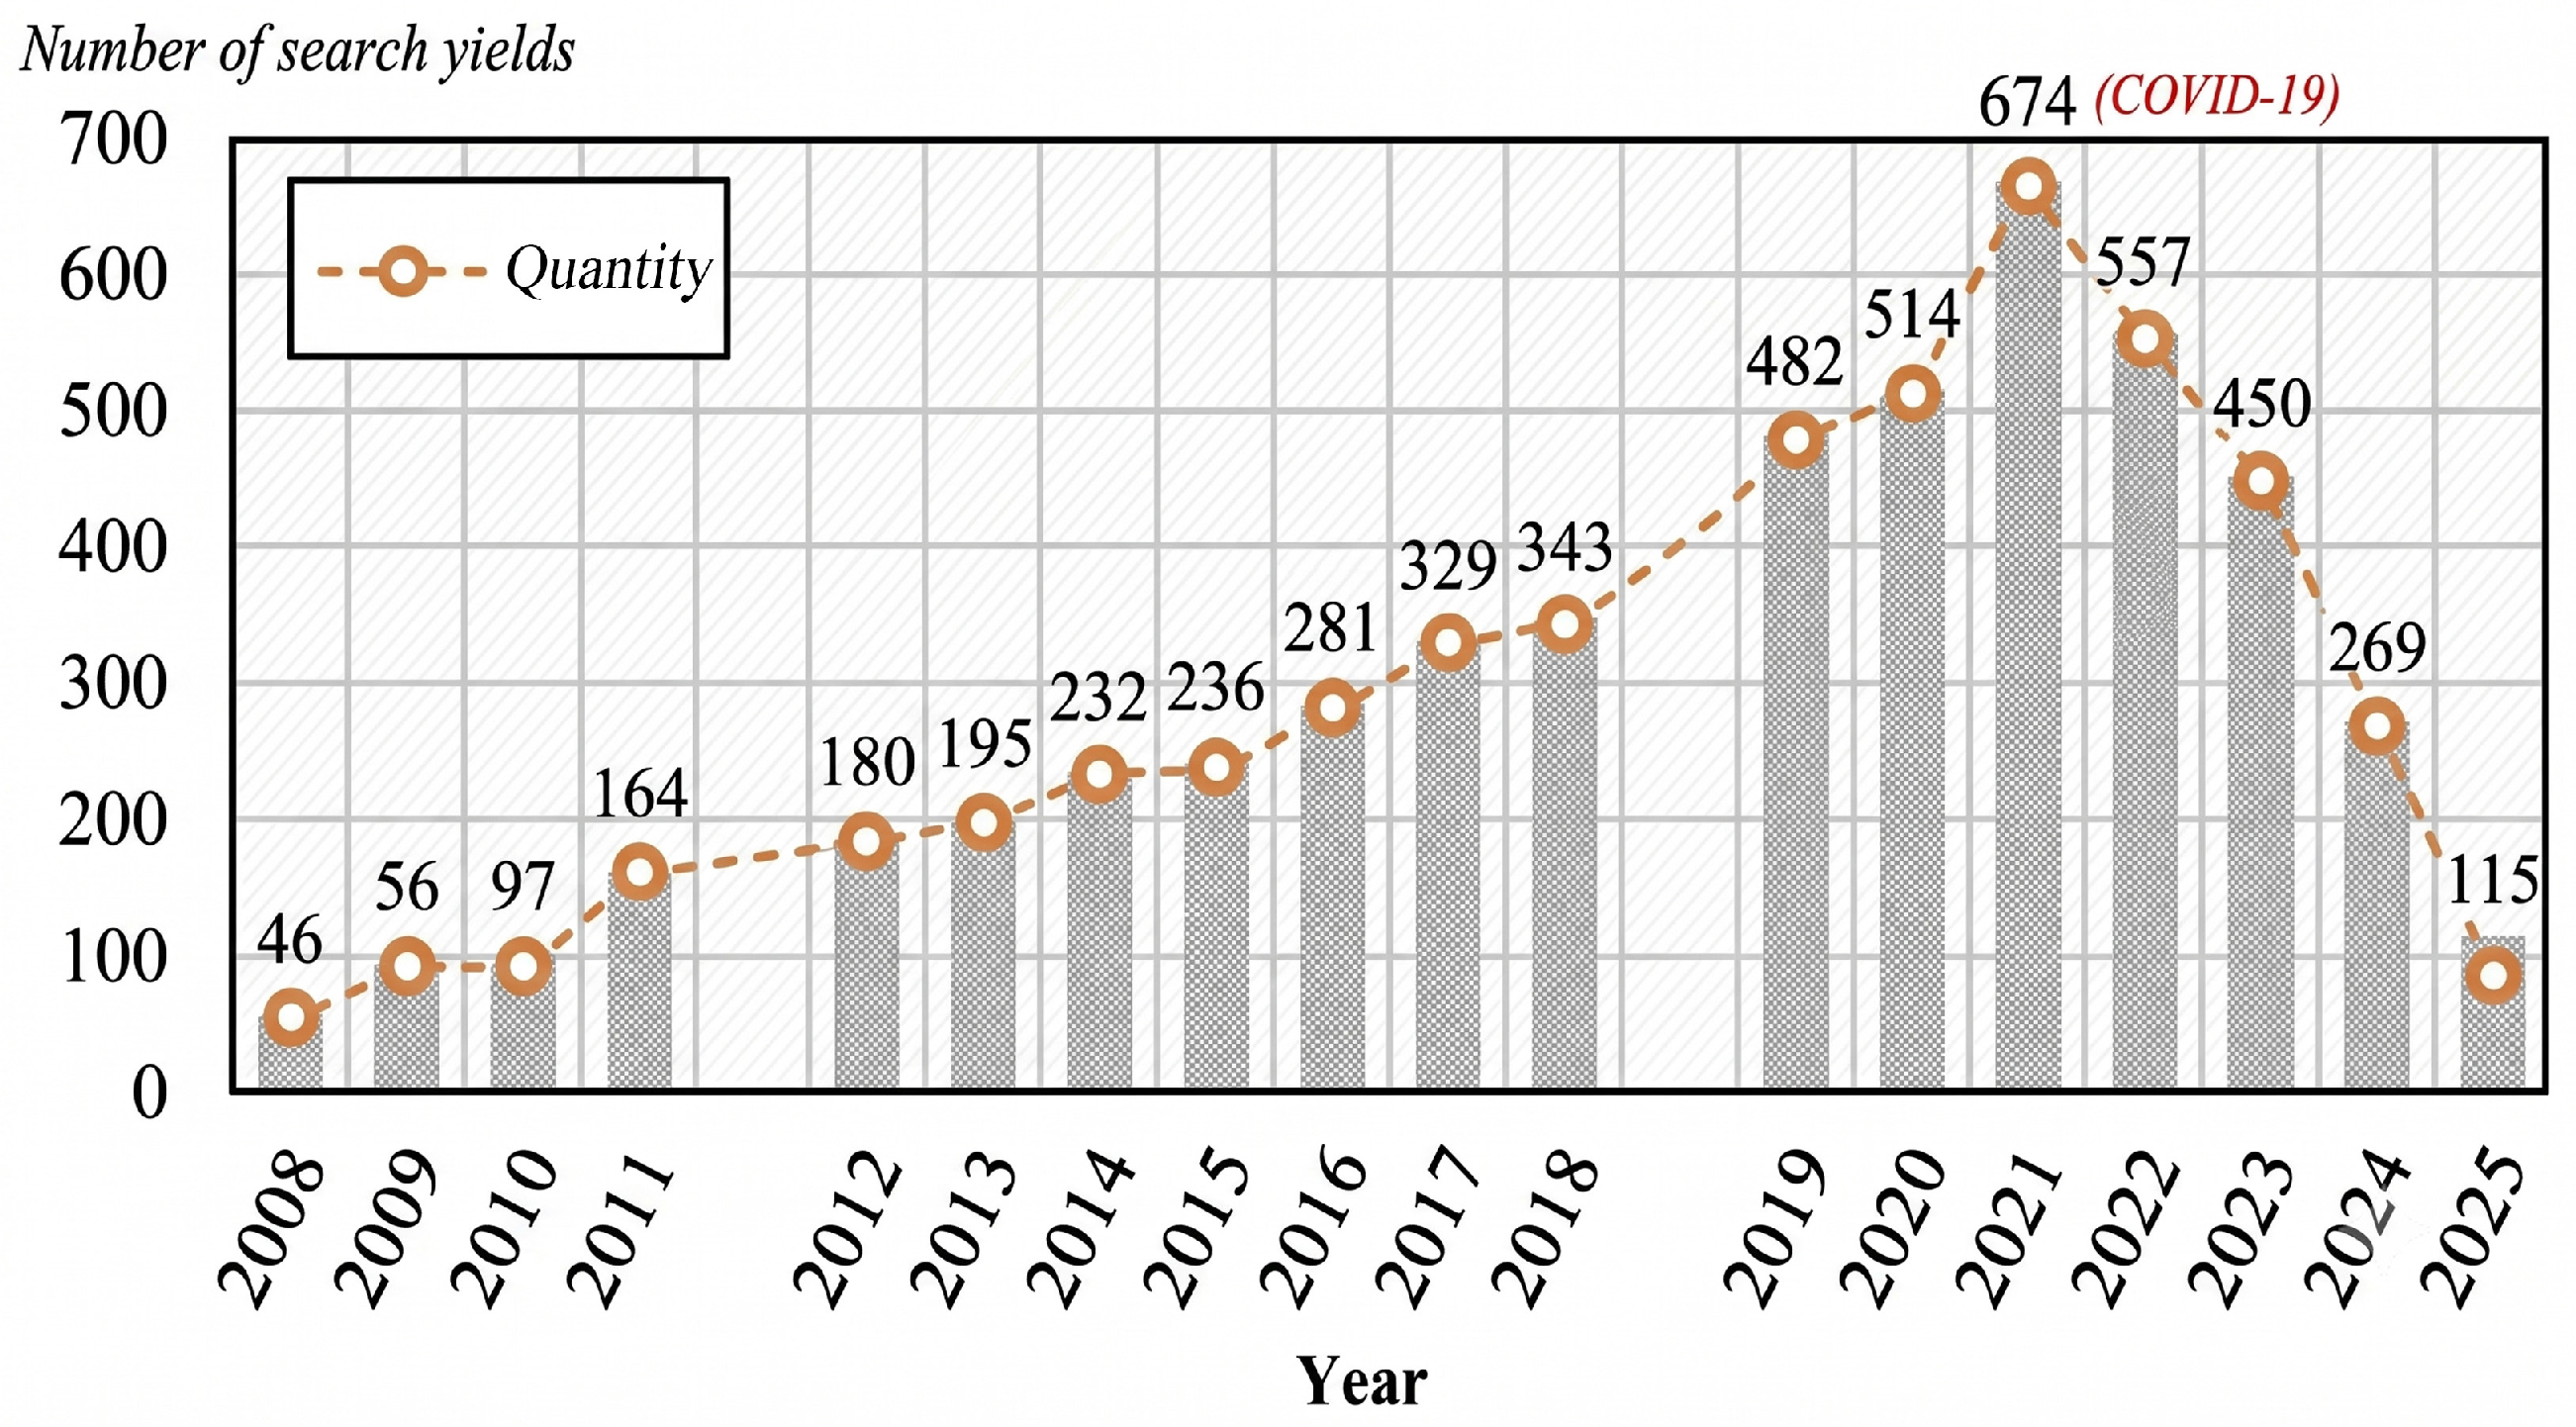
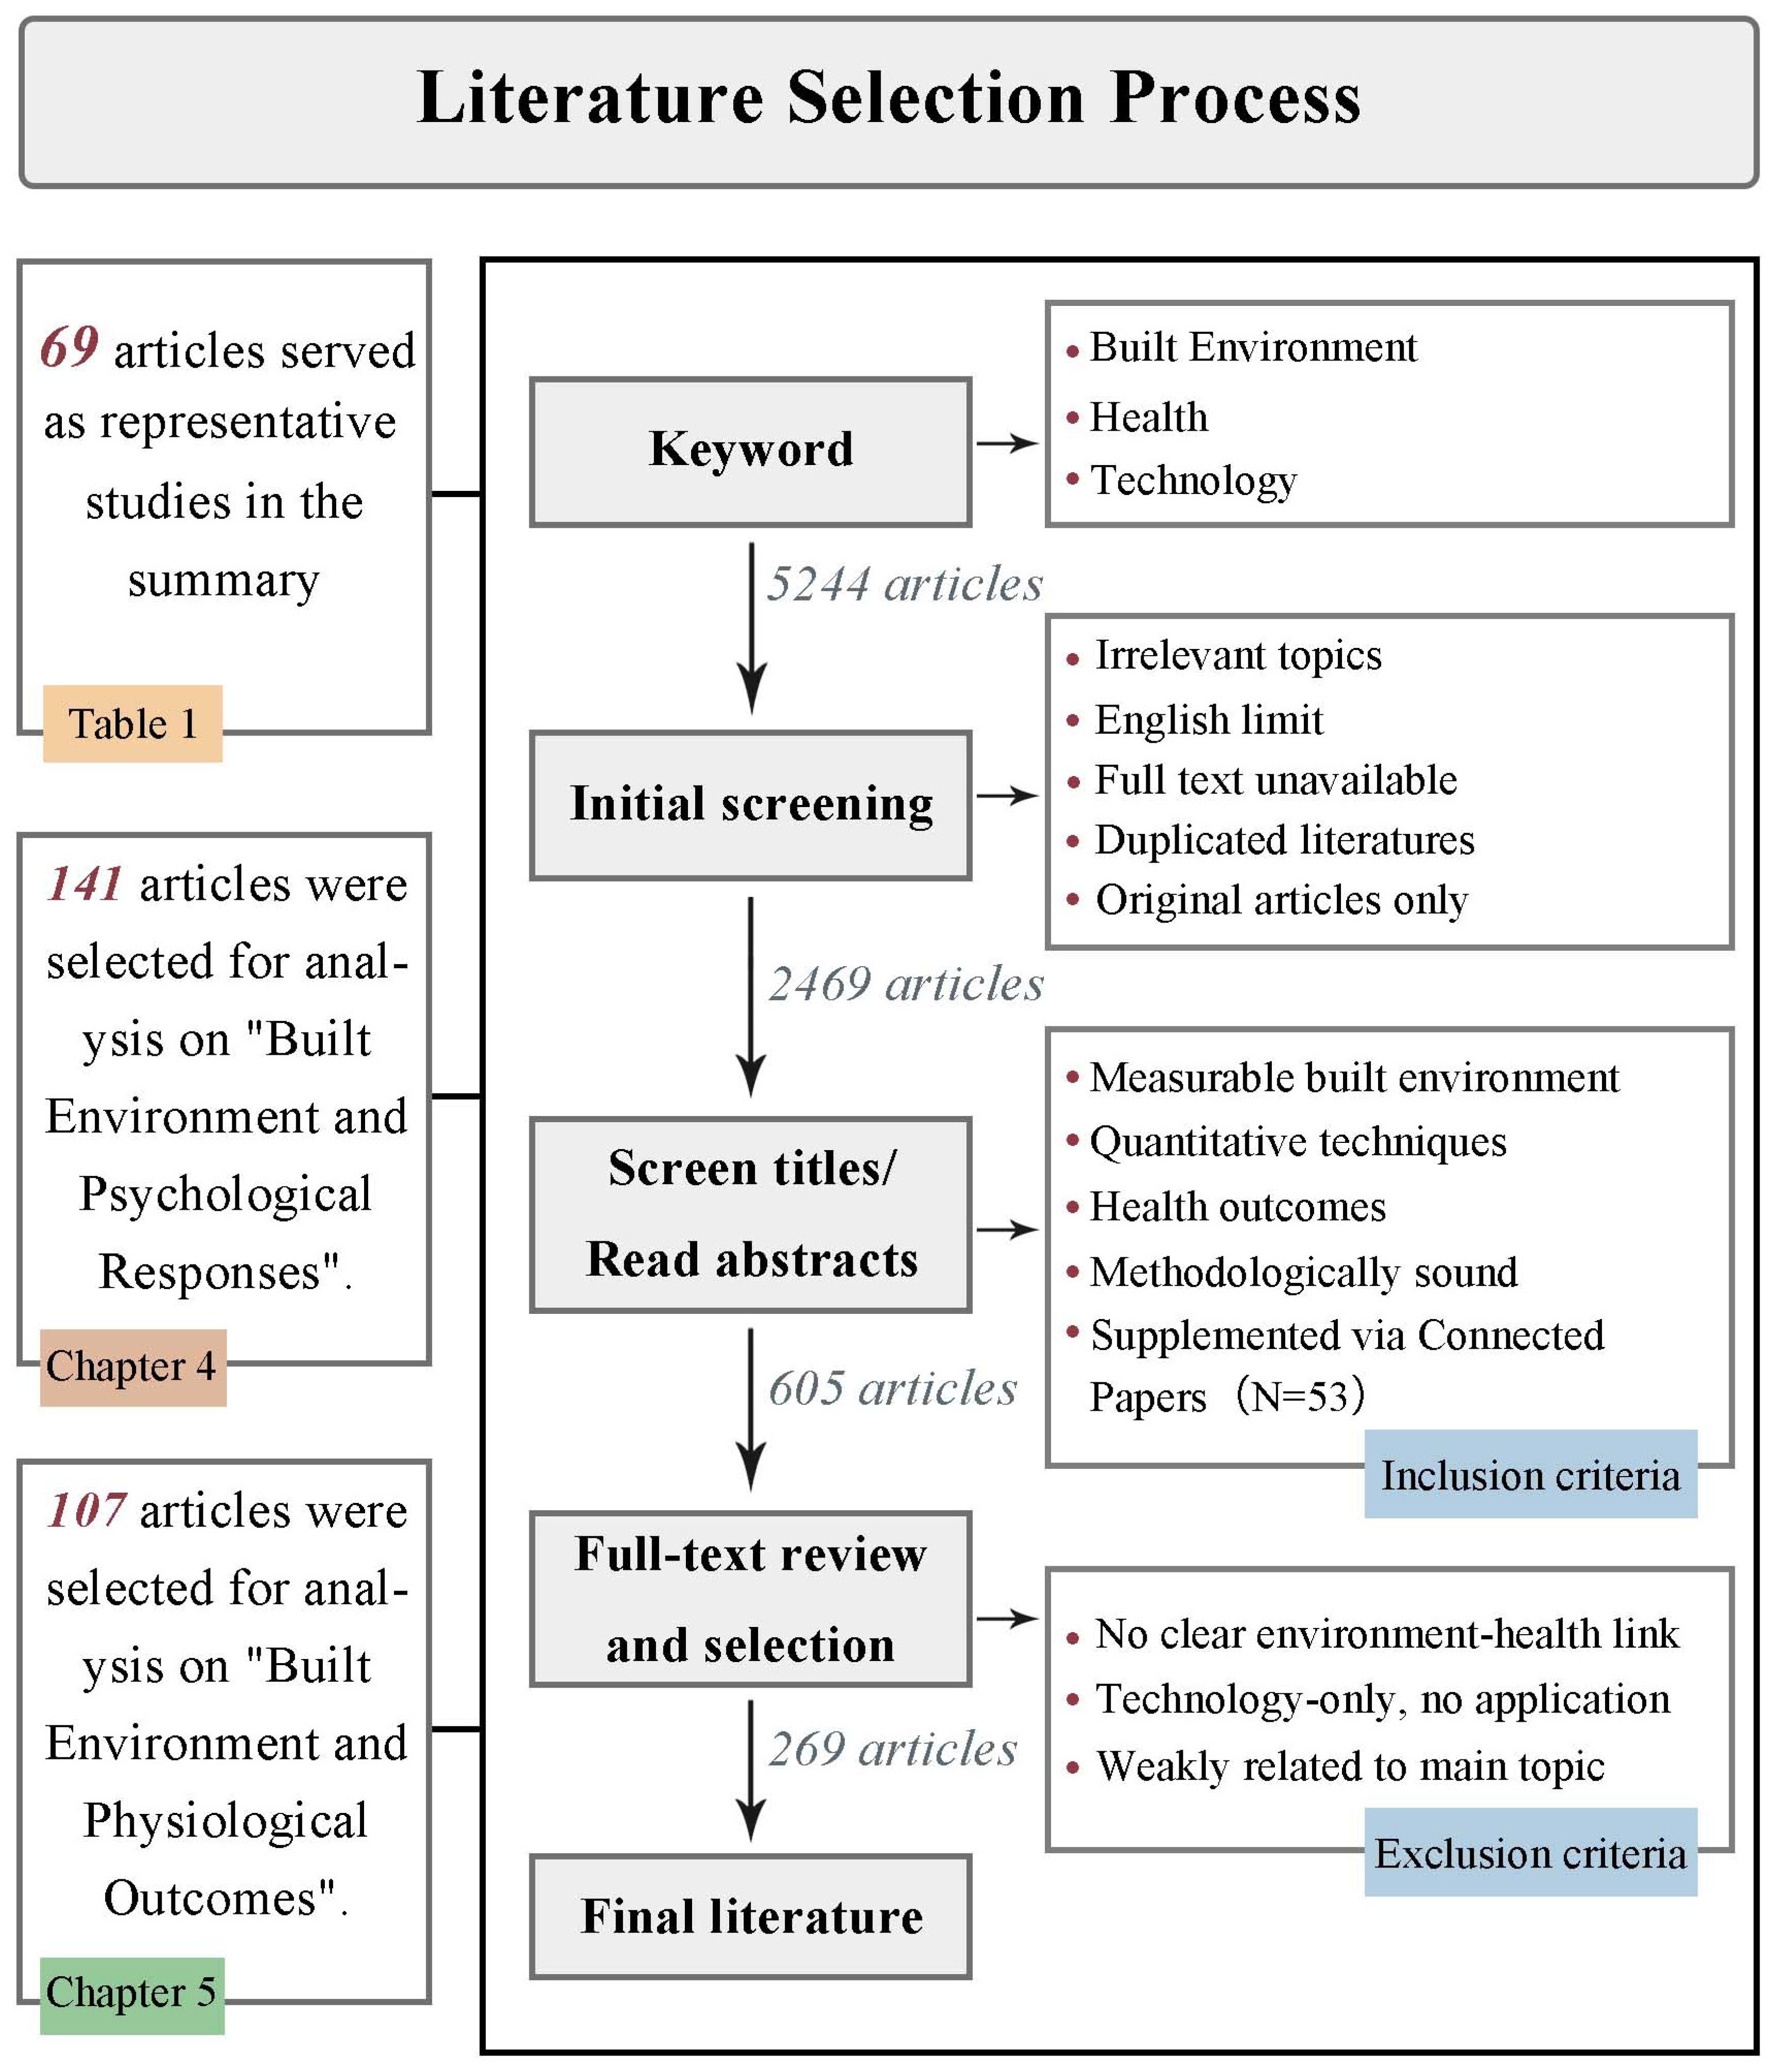
This review investigated how the built environment, human health, and technology assessment work together. A preliminary database search identified 5244 articles, peaking at 674 publications in 2021 due to COVID-19 (Figure 2). After excluding irrelevant topics, non-English studies, duplicates, and non-original articles, 2469 articles remained. Based on title and abstract review, studies were included if they employed sound methodologies and met the following criteria: (1) included measurable features of the built environment as a variable; (2) used quantitative technologies (e.g., sensors, ML, or VR); (3) reported empirical findings on human health outcomes (physical or mental). Then, Connected Papers was used to identify additional relevant studies (n = 53) by tracing citation networks and related works to ensure comprehensive coverage. This left 605 articles for subsequent assessment.
Based on a full-text review, 336 articles were removed for three reasons: (1) no clear link between the built environment and health; (2) technology testing only with no analysis of practical application; (3) not closely related to the main topic. Consequently, 269 high-quality papers were retained for deeper analysis, of which 141 focused on the link between built environment and psychological responses and 107 focused on physiological outcomes. The selection process is illustrated in Figure 3, which is provided for descriptive transparency only. The complete list of the 269 references is presented in Supplementary Table S1. Among these, 69 are summarized in Table 1. To be included, studies must have measurable environmental indicators, clear health outcomes, and statistical results.

3. Analysis of Literature

3.1. Characteristics of Included Studies

Based on the analysis of the 269 selected publications, the literature is primarily distributed across five major fields: built environment and architecture (n = 95), urban planning (n = 44), public health (n = 40), human factors and ergonomics (n = 35), and environmental psychology (n = 33). An additional subset of literature falls within related interdisciplinary fields (n = 22). It is noteworthy that publications have consistently emerged across these domains throughout the study period, reflecting ongoing and interdisciplinary engagement with the relationship between the built environment and individual health.
Geographically, among the 155 articles that reported study locations, research activity was concentrated in three regions: East Asia—China (n = 69) and South Korea (n = 15), the United States (n = 37), and Western Europe—primarily the United Kingdom (n = 21) and Germany (n = 13). Within China, studies were mainly conducted in economically developed cities such as Beijing, Shanghai, Guangzhou, and Hong Kong. In the United States, sample cities included Ypsilanti, Lincoln, and San Francisco. In both countries, research output tends to be higher in more developed economies. This pattern reveals a notable geographical imbalance and unevenness in research focus.
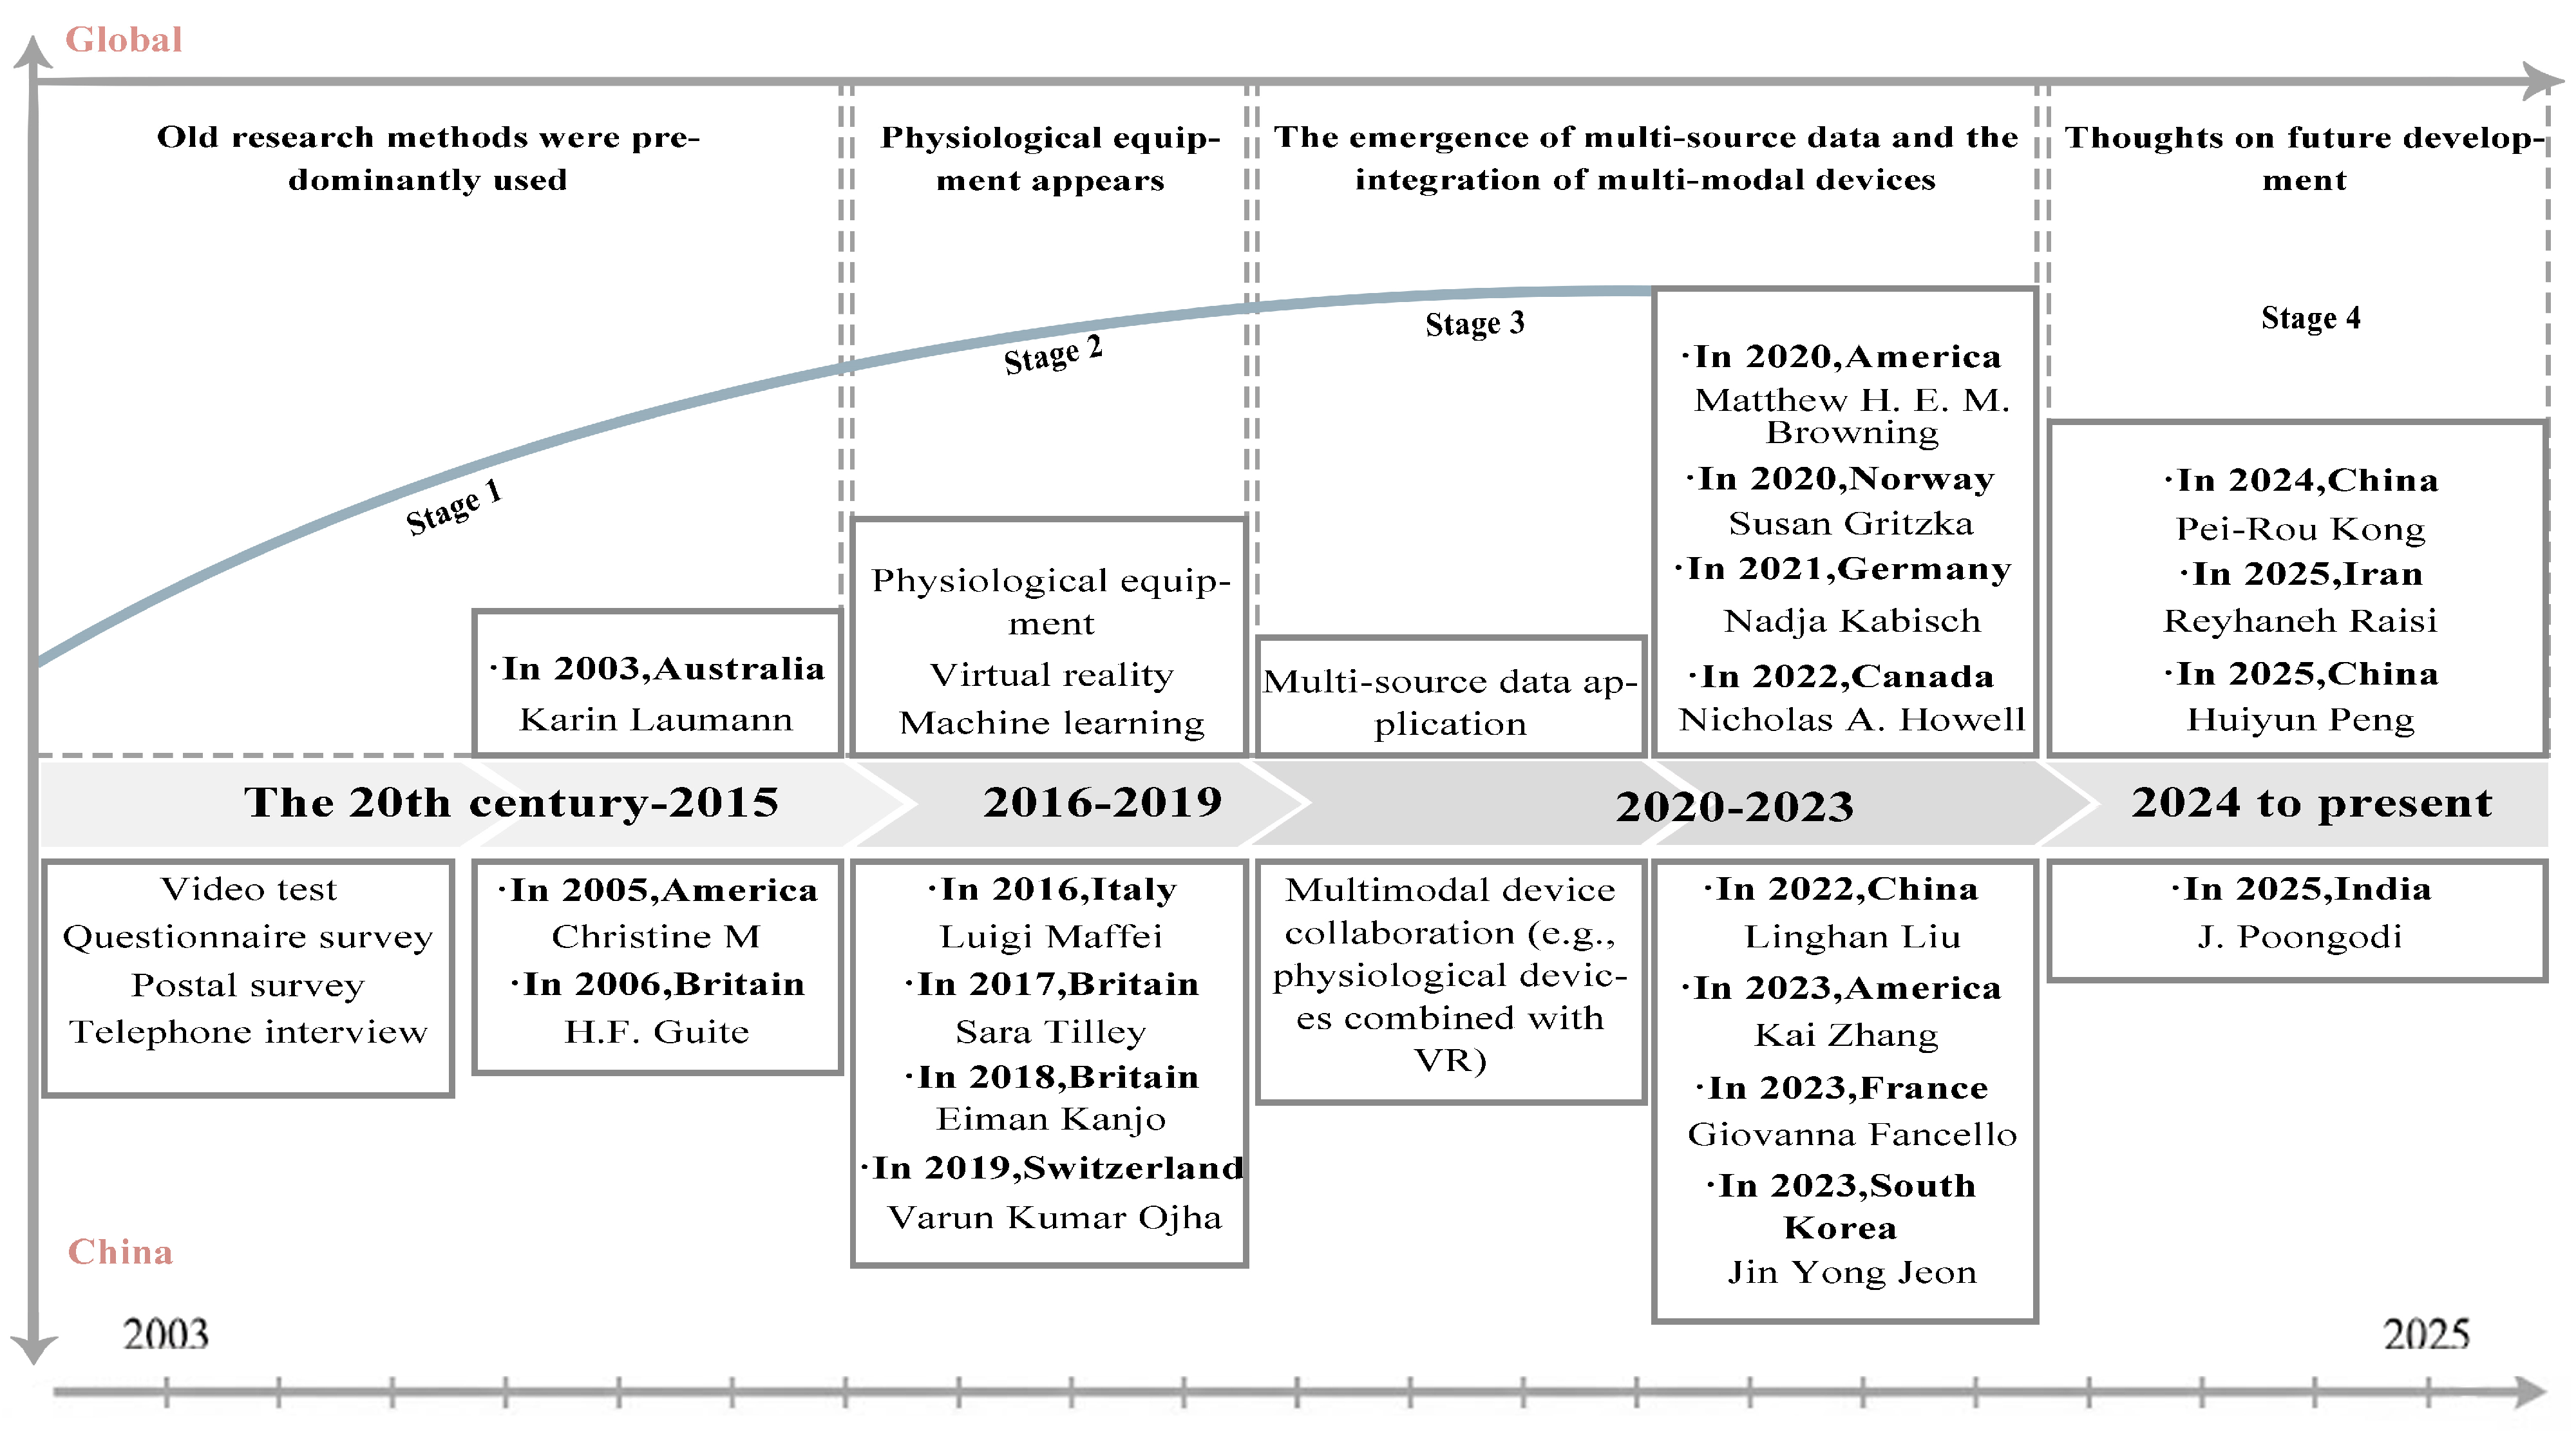
The analysis of the literature from 2003 to the present shows that research methodologies have changed over time. This progression can be categorized into four phases. (1) The subjective assessment phase (n = 29) relied on self-reported data such as questionnaires, surveys, and interviews, which were common before 2015. (2) The single-device objective phase (n = 68), driven by affordable post-2015 wearables and early applications of computer vision and VR, used single physiological sensor to measure how the environment relates to human psychophysiological responses primarily from 2016 to 2019. (3) The integrated subjective–objective phase (n = 102), driven by a COVID-19-induced perspective shift toward integration, adopted a hybrid approach that combined sensor data with subjective reports. This phase emerged from 2020 to 2023. (4) The contemporary multimodal phase (n = 70), driven by mature generative AI and large models, integrated multi-source sensor data, VR, and ML to enable a deeper investigation of human–built environment interactions since 2024 (Figure 4).

3.2. Predominant Technologies

Human–computer interaction research relies on advanced technologies for data acquisition [49], which can be classified into four categories. (1) Physiological sensing technology (n = 87) acquires objective, real-time physiological data from human biosignals for quantitative assessments of individual states [50,51]. (2) VR technology (n = 52) creates controllable simulated environments for the systematic evaluation of user behavior and psychological responses [52,53] to facilitate environmental optimization and enhances user satisfaction [54,55]. (3) ML technology (n = 79) processes complex datasets, builds predictive models, and simulates physiological perception levels in urban environments [56], thereby providing intelligent support for HCI research. (4) Multimodal technology (n = 39) refers to the integration of two or more technologies of the same or different types, enabling the combination of multi-source data to investigate environment and health.

3.2.1. Physiological Sensing Technology

In built environment and health research, sensor technologies—including passive infrared, ultrasound, and biosignal sensing—are widely used to collect physiological and behavioral data. High-precision physiological data are acquired through core techniques such as EEG, ECG, EDA, and electromyography (EMG). These biosignals capture brain activity, muscle activity, and electrodermal activity, which reflect or enable the inference of human physiological and behavioral states in diverse spatial settings [49].
EEG (n = 51) sensors are particularly prevalent in this domain. Researchers now use EEG to identify measurable connections between the environment and how people feel. EEG studies have shown how emotions like anxiety, depression, pleasure, and relaxation relate to physiological signals [31]. For example, studies show that high density is associated with reduced comfort [57], while green spaces are linked to increased relaxation [43]. These effects also depend on personal factors like gender [58]. In addition to EEG, researchers use multiple sensors to study how people respond to environments. ECG measures stress [59], skin conductance measures comfort [60], and eye tracking measures visual perception [61]. Collectively, these studies show that physiological sensing is useful for assessing and improving built environments based on evidence.

3.2.2. Virtual Reality Technology

VR uses simulated 3D environments to create immersive and interactive experiences. It has become an important tool in HCI research. Early studies used AR to build and iteratively improve virtual environments based on user feedback [62]. With better VR technology, researchers compared virtual and real-world settings directly. This allowed them to assess environmental preferences based on real evidence and use the findings to optimize designs [28].
Subsequent advancements in VR hardware, particularly in HOEs and lithography-enabled devices [63], have further catalyzed methodological progress in environment–behavior research. With these tools, the field has moved beyond simply testing simulation feasibility toward understanding how they can be used in practice. VR has been widely adopted to investigate how environmental characteristics influence human perception and well-being. Studies have validated the efficacy of VR in assessing perceptual and physiological responses to natural environments [29,64]. Subsequent research has further applied VR to evaluate the restorative benefits of specific environments such as green spaces and forests [65], while other studies have employed comparative designs to examine different environmental typologies, including rural versus urban landscapes [66] and responses to multisensory architectural stimuli [67].

3.2.3. Machine Learning Technology

Early research primarily focused on engineering-focused domains such as building energy performance prediction [68]. With the increasing integration of architectural and planning disciplines, ML was subsequently applied to dynamic environmental monitoring [69] and progressively extended to the quantitative analysis of human environmental perception. Yin [70] combined mobile sensor data with GIS to predict the audiovisual perception of streetscapes, while Liu et al. [71] automated urban feature assessment using multiple ML models including SVM, AlexNet, and GoogLeNet. Similarly, Zhang et al. [30] used data-driven methods to study how physical environments relate to occupant behavior and health. These works show a key shift in the field. Researchers have moved from predicting physical performance to measuring human perception.
Recent advances in deep learning have further improved the field. Wang et al. [10] used ML to link street walkability to mental health in older adults. Ojha et al. [19] identified key visual factors correlated with physiological responses. Verma et al. [35] built custom deep learning models to study how people perceive audiovisual landscapes. Together, these studies show that data-driven approaches can uncover health-related factors in the built environment. This helps support better design and wellness initiatives.

3.2.4. Multimodal Technology

A complete setup of the framework making use of multiple modalities for each data set to interact and inform each other is termed multimodal [57]. Human perception is inherently multisensory, making unimodal data insufficient for capturing real-world experiences [28]. As technologies advance, multimodal fusion is increasingly adopted for human information acquisition.
Combining these sensors gives a more complete understanding. For instance, using ECG, EDA, and respiration (RESP) together helps explain how landscape elements relate to emotions [51]. Other research found that EMG and heart rate are associated with pleasure in audiovisual environments [72]. A study integrated EEG and ECG signals to analyze participants’ stress levels and emotional responses under different spatial stimuli [73]. In addition, multimodal fusion facilitates information complementarity and enhances data reliability. Combining VR with sensors allows researchers to create controlled, multi-sensory environments. This solves some major problems found in traditional experiments [36]. For example, Wu et al. [74] combined multisensory environmental simulations (sound, light, thermal, and wind) with VR perception to demonstrate that multimodal data fusion can accurately assess the livability and health potential of built environments. Between 2022 and 2024, researchers combined street-view imagery, VR, and ML to make progress in walkability perception, emotion prediction, psychological restoration, and street quality evaluation [75].

3.3. Impact Pathways and Framework

Based on the data collection methods in Section 3.2, this review summarizes key findings on how environmental exposure leads to biobehavioral responses. To achieve this, the evidence is organized into a framework that categorizes exposures based on their relationships with mental and physical health.
(1)
Psychological responses (n = 141): Emotional outcomes are grouped by valence (positive/negative) and arousal (high/low), drawing on both Ekman’s discrete emotion model and Russell’s dimensional model [76]. This classification distinguishes between positive psychological responses (e.g., high-arousal pleasure, low-arousal restoration) and negative psychological responses (e.g., high-arousal anxiety, low-arousal loneliness). It should be noted that the discrete-emotion model is not the only approach to emotion classification. Constructionist [77] and component process [78] models offer alternative pathways, which would yield different categorizations and physiological mappings. The adopted discrete-emotion model reflects its prevalence in built environment–health research and its operational clarity for mapping discrete emotions to environmental features.
(2)
Physiological outcomes (n = 107): Health outcomes in this dimension follow a progression from early physiological and behavioral changes to established disease risks and finally to clinical outcomes. This progression encompasses two main pathways: risk mediated through psychological and behavioral pathways and risk driven by direct environmental exposure.

4. Built Environment and Psychological Responses

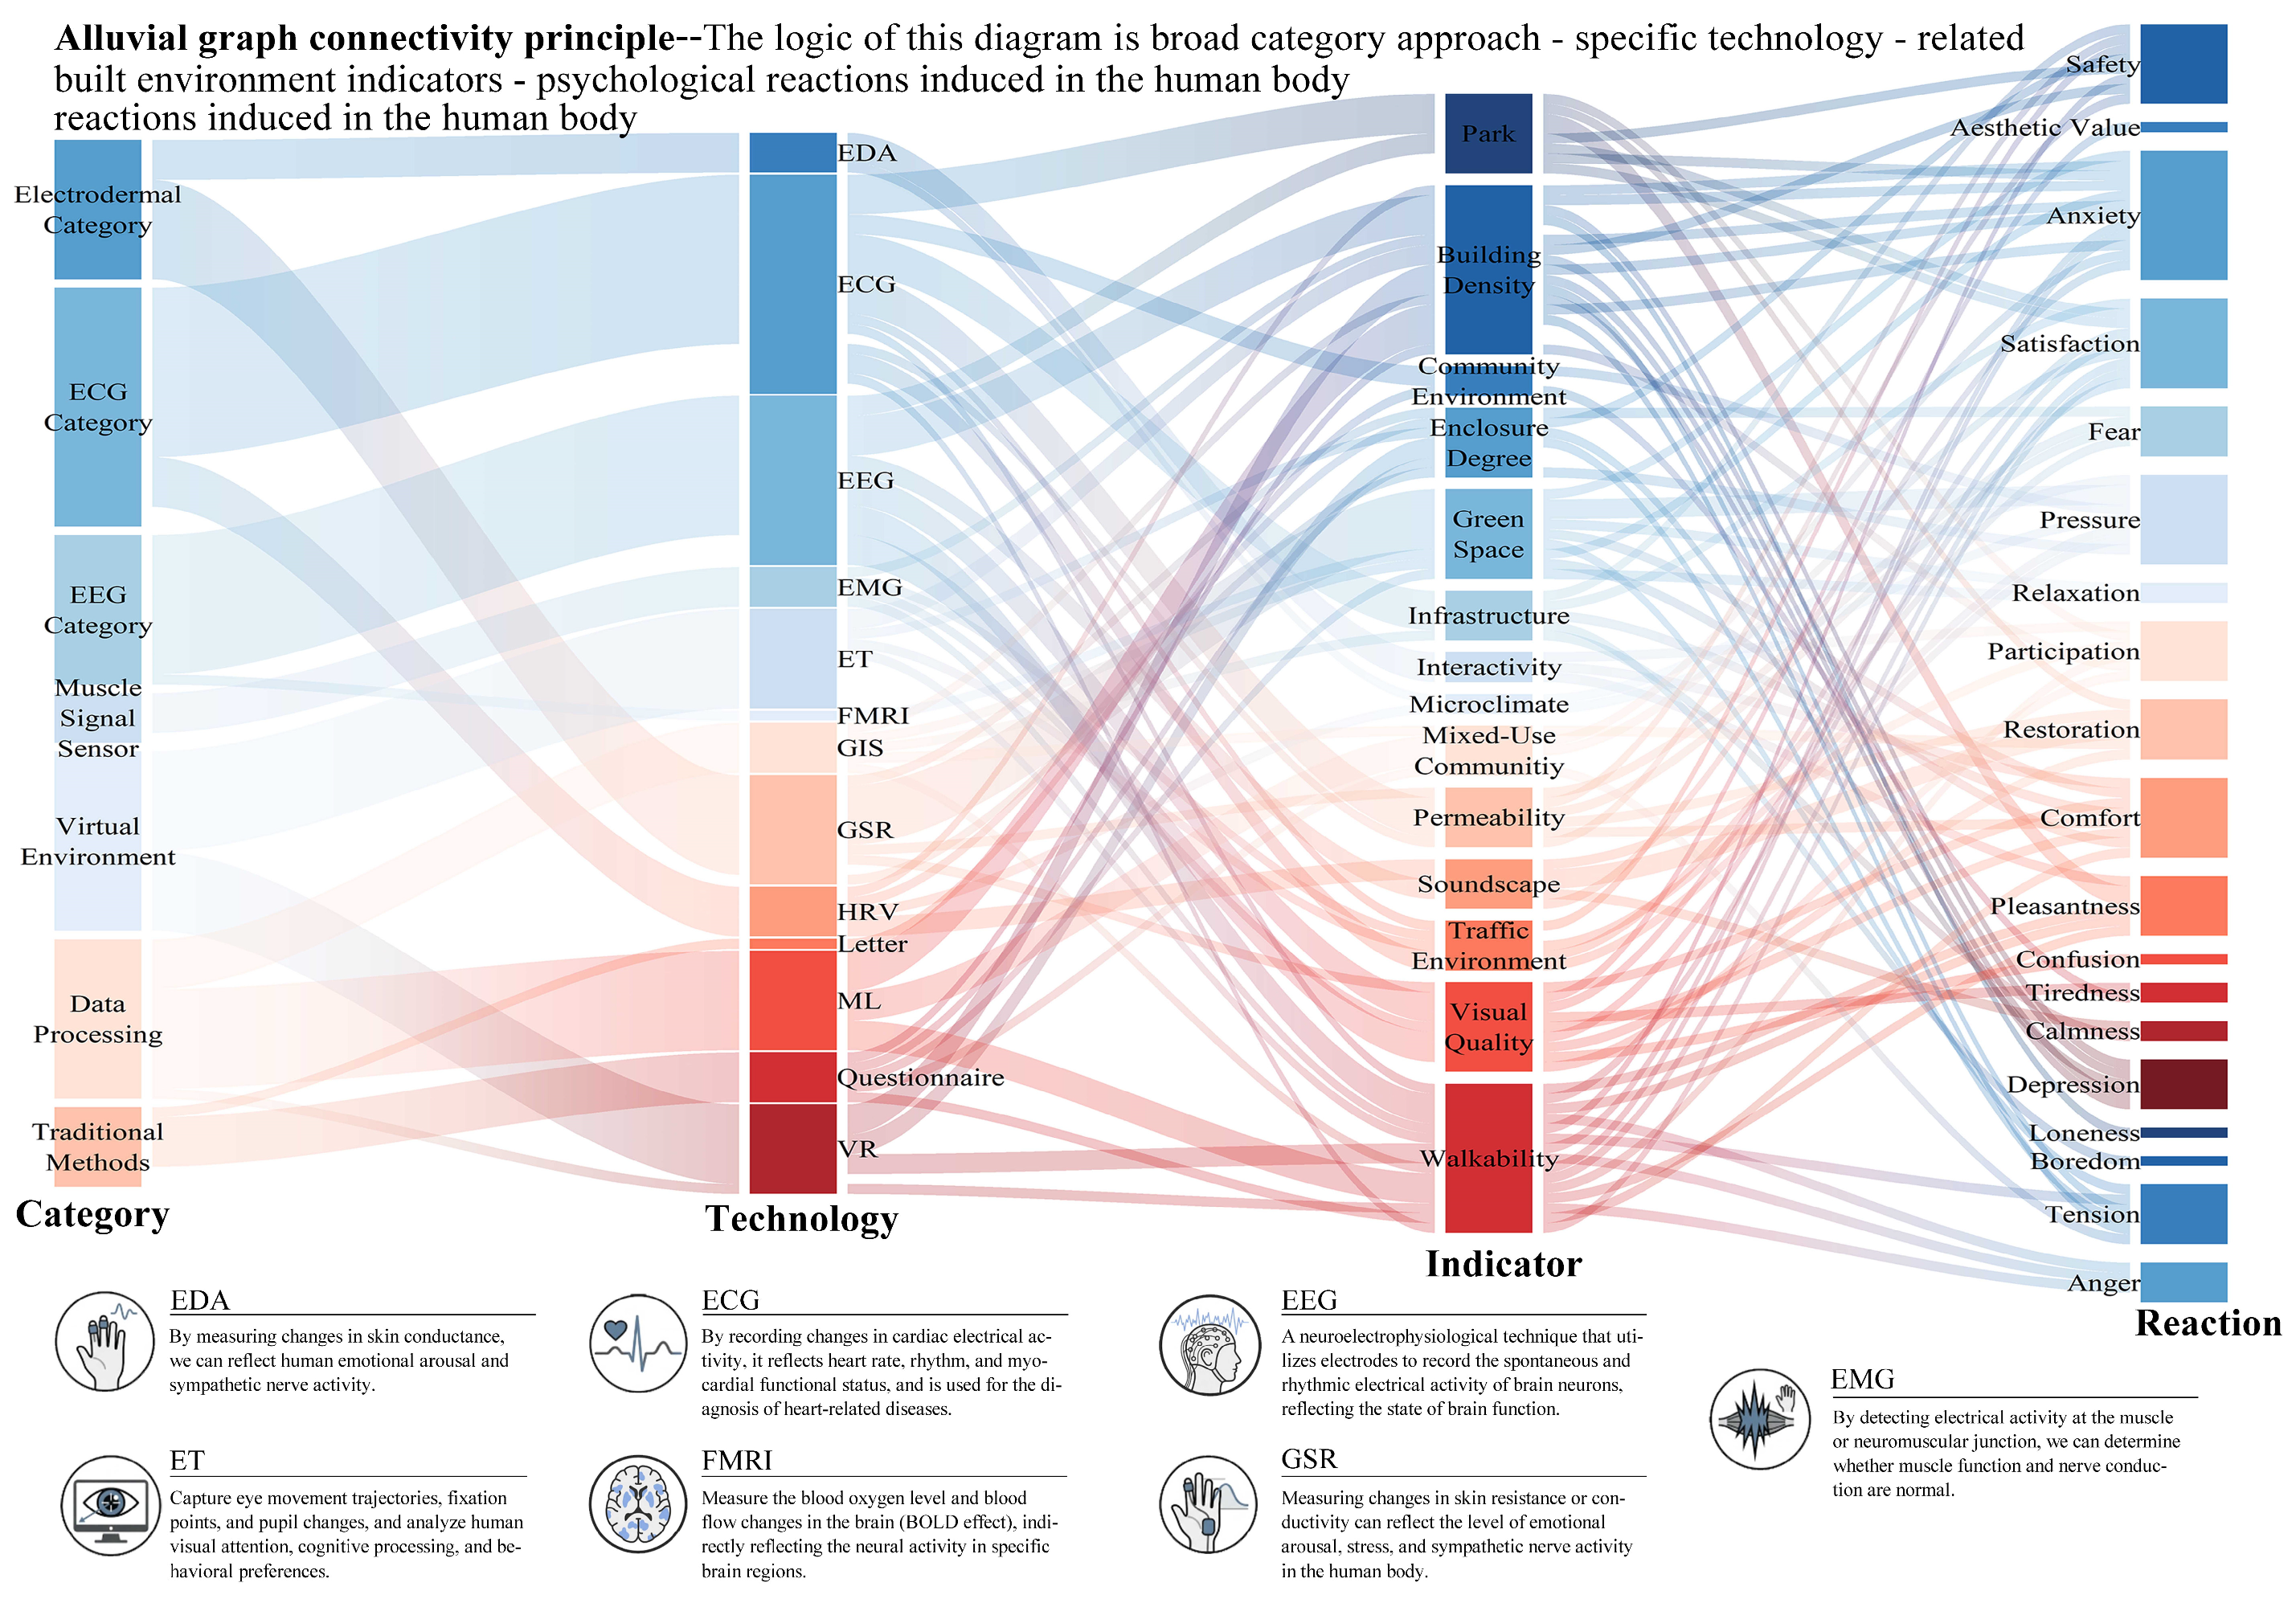
Mental health is increasingly recognized as being related to the dynamic interaction between individual characteristics and environmental factors, among which the urban built environment is a particularly significant correlate [79]. To elucidate the pathways related to this relationship, this study introduces the Technology–Indicator–Response alluvial diagram to visualize how different data acquisition techniques capture the multi-dimensional psychological responses associated with built environment attributes (Figure 5). These responses span high/low-arousal states and exhibit significant contrasts in emotional positive/negative valence (Table 2).

4.1. Positive Psychological Responses

Regarding the association of the built environment and mental well-being, among the 141 articles reviewed, 39 focus on its link to positive experiences and participatory emotions, such as pleasure and satisfaction, while 41 examine its link to emotional restoration and stability, including feelings of calm, safety, and comfort.

4.1.1. High-Arousal Positive Responses

The built environment is critically associated with lower psychological stress and more positive emotional outcomes, namely pleasure and satisfaction, participation and engagement, aesthetic value and leisure value. These outcomes are closely linked to specific environmental features, such as blue–green spaces, parks, the audiovisual environment, and the overall ambiance (e.g., order vs. disorder, simplicity vs. complexity).
Regarding pleasure and satisfaction, natural elements in urban settings have been widely shown to have a significant positive association [80,81]. Research indicates that access to green spaces within a 3 km radius is associated with a reduced risk of psychological anxiety and mood disorders [82]. Zhang et al. [38] further used integrated Empatica 4 wristbands and GPS devices to link blue–green space exposure to increased pleasure. Recent work has extended this inquiry from general exposure to specific multisensory environments. The positive association of natural soundscapes on pleasure and satisfaction has been consistently shown through disparate methodologies, ranging from EMG-based measurement using street view imagery [72] to immersive simulation with first-order ambisonics (FOA) audio in VR environments [83]. In addition to the natural environment, research has also shown that elements like inclusive public spaces, mixed land use, lower building density, and pleasant neighborhood ambience are significant associated with emotional pleasure, arousal, and overall satisfaction [81,84,85].
Pleasurable experiences are associated with increased visits, active participation, and deeper engagement [58]. The relationship between environmental exposure and participatory engagement has been objectively verified through advanced physiological monitoring techniques, including ECG, vectorcardiography (VCG), EDA, chest cardiography (CCG), and HRV analysis [58,86]. For instance, higher greenery and sky-view rates significantly moderate the association between landscape preference on psychological restoration (95% CI), relating to how landscape preference interacts with place attachment [87]. For different age groups, studies have examined how built environments are associated with participation. Older adults show positive associations with accessible greenery, maintained amenities and social opportunities [88], while children’s engagement is related to perceived environmental diversity and reduced noise exposure [89], which are both linked to positive emotional outcomes.
Beyond immediate behavioral outcomes, the pleasure derived from the built environment is critically associated with its aesthetic and leisure value, which in turn is linked to long-term psychological benefits. Initially, studies focused on how visual and atmospheric qualities, from urban morphological complexity and expressive building facades to well-designed green spaces and public spaces, are associated with higher aesthetic preferences and a heightened sense of leisure and relaxation within the environment. For instance, recent studies have employed VR eye tracking and EEG to investigate how distinct visual features relate to perceived pleasure. Similarly, EEG integrated with VR has been utilized to examine the correlations and arousal levels between specific visual and ambient qualities and discrete emotional states [61,90]. Consequently, strategies that mitigate negative elements (e.g., garbage and disorder) while enhancing positive factors (e.g., architectural complexity and historical ambiance) have been shown to be substantially associated with users’ aesthetic perception [91].

4.1.2. Low-Arousal Positive Responses

Unlike high-arousal emotions, which are typically intense and brief, low-arousal positive emotion (e.g., restoration and safety) associated with the built environment are characterized by lower autonomic arousal and longer-lasting states [92]. These subtle states occur when the environment continuously relates to our psychological experience [93]. Research in this area falls into two main categories: one dealing with calmness and restoration and the other dealing with safety and comfort.
The restorative benefits of built environments are well known, especially in public open spaces (POSs) [94,95]. Early studies focused on specific examples, such as activity zones in urban woodlands [96]. Subsequent research has confirmed this finding from multiple perspectives. EEG studies indicate that green exposure is associated with reduced building-induced stress, as well as with relaxation and calmness in the elderly during walking [16], while sensor-based studies indicate an association between vegetated areas and reduced stress [59]. Beyond the well-documented benefits of POS, research has extended to specific visual and physical attributes—such as the residential setting, visual openness, blue spaces, and pedestrian infrastructure—for their role in psychological calmness and restoration [97,98]. Specifically, an ensemble ML model achieved 98.25% accuracy in identifying individual environmental stress by evaluating sidewalk quality and terrain slope. These factors are associated with reduced travel stress and better mental states [23]. Further extending the inquiry into auditory dimensions, an experiment combining natural soundscapes with multimodal physiological monitoring (ECG, EDA, EEG) found that under stress induced by 80 dBA traffic noise, sound levels below 50 dBA facilitated the most robust psychological recovery [99].
The association of the built environment in evoking feelings of safety and comfort is most evident on the neighborhood scale [100]. Raisi et al. [101] concluded that key factors such as green space coverage, population density, and building configuration are closely associated with the perception of environmental safety. By integrating semantic segmentation with ML models, Wu et al. [47] demonstrated the combination of diverse positive visual elements in parks is associated with a higher perceived safety than green spaces alone. Meanwhile, in public spaces, greater accessibility and interactivity are associated with higher engagement and attractiveness, lower individual vigilance, and a stronger sense of security [102]. Furthermore, enhancements to neighborhood walkability and street design have been shown to be linked to residents’ comfort and perceived safety [30,103]. To quantify these relationships, the study employed a GIS-based security rating index (SRI) that linked participants’ addresses with spatial data on urban elements, identifying four streetscape elements (vehicle density, road area proportion, sky visibility, and sidewalk ratio) as the strongest positive correlates of perceived environmental safety. Collectively, these findings suggest that well-designed built environments are associated with safety and comfort. That, in turn, is linked to low-arousal well-being [104].

4.2. Negative Psychological Responses

The built environment is associated with mental health positively or negatively. While its benefits are well studied, more research now focuses on its negative associations. Among 141 studies, 35 link them to high-arousal emotions (e.g., anxiety, fear), and 45 link them to low-arousal states (e.g., chronic stress, fatigue).

4.2.1. High-Arousal Negative Responses

High-arousal negative emotions are typically expressed through acute stress reactions, spanning internally felt states such as anxiety, tension and anger as well as externally elicited perceptions including fear and panic.
Anxiety and tension are closely linked to environmental factors across multiple scales. At the neighborhood level, high floor area ratio and building density, low greening rate have been empirically associated with diminished well-being and heightened anxiety. For instance, a social survey found that residents in spatially deficient communities had a higher probability of reporting lower satisfaction and increased tension with the overall community satisfaction significantly positively correlated with mental health [105]. This relationship extends to the experiential quality of pedestrian environments with eye-tracking evidence revealing that poor walkability—characterized by narrow sidewalks, obstructing parked vehicles, litter, traffic noise, and overall street disorder—is linked to negative emotions (e.g., frustration, anger and disgust) during walking, and effects vary across age and gender groups [106]. Beyond these, MaxEnt-based machine learning and emotional differentiation visualization revealed that access to restorative natural environments also plays a critical role. Inadequate exposure to blue–green spaces has been linked to a higher risk of anxiety and anger [44], and it correlates with the development of sustained tension [107]. Beyond neighborhood-scale factors, building-level attributes such as spatial transparency, enclosure, and indoor temperature have also been shown to significantly associated with collective anxiety [108].
Neighborhood setting is a core correlate of fear perception, as familiarity is generally associated with security. Conversely, environments characterized by poor lighting, damaged sidewalks, and traffic disorder are strongly associated with elevated fear [109]. VR-based EEG experiments indicate that strong spatial enclosure is associated with panic and disorientation [110]. Similarly, combining eye tracking, questionnaires, and a GIS-based analysis of HRV, Lee et al. [111] demonstrated that visually obstructed spaces—such as areas under piloti or with dense vegetation—are associated with fear and panic by reducing perceived openness and accessibility, thereby relating to fear of crime. Gender-sensitive analyses reveal different fear patterns in Lleida’s historic center. Women report greater fear in enclosed, low-visibility traditional spaces without shops or clear exits. Men report greater fear in open, unused, bare, and unmonitored spaces on the periphery of the modern city [39]. Alongside spatial dimensions, microclimatic factors also are associated with such affective states. A thermal comfort study found that most participants associated discomfort in temperature and humidity with the experience of panic states [112].

4.2.2. Low-Arousal Negative Responses

Low-arousal negative emotions typically present as chronic stress, manifesting through psychological states such as oppression, pressure, and loneliness alongside physical sensations including fatigue, unpleasantness, and boredom.
In non-green environments, negative emotions are elevated and show associations with psychological stress [113]. Low-arousal negative emotions, including pressure, loneliness and oppression, are closely associated with the quality and quantity of blue–green spaces [114]. A household survey found that residents in areas with a general lack of green spaces reported poorer health conditions [115]. Recent studies have extended these findings across age groups, highlighting negative effects associated with inadequate blue–green space exposure. Among children, limited access to such spaces has been linked to a higher propensity for depressive symptoms [116], while older adults appear particularly susceptible to psychological pressure when living in environments with limited blue–green spaces [117]. From the perspective of the built environment, negative features such as traffic congestion, community noise, air pollution, enclosed spaces, narrow streets, and aging buildings are more likely to be associated with psychological pressure and loneliness [27,118]. Kabisch et al. [119] demonstrated, via an ECG study measuring HRV and BP, that spatial narrowness, traffic congestion, and excessive building density are associated with elevated systolic and pulse pressure, which are consequently related to stress in individuals. Applying DL to analyze relevant experimental data, Bower et al. [118] and Gijsbers et al. [120] found that urban built environments with poor spatial accessibility, inadequate facilities, and a lack of community public spaces and transportation infrastructure are linked to psychological alienation and higher levels of residents’ loneliness.
Studies of fatigue-and-unpleasantness-related negative emotions have identified spatial layouts and visual complexity as key correlates within built environments. Accumulating evidence demonstrates that psychological fatigue is significantly associated with key urban features, including building density, visual intrusion, spatial openness, and walkability [65,121]. Combining EEG, HRV, and subjective reports, Baumann and Brooks-Cederqvist [57] established that compared with medium-density urban environments, low-density settings are significantly associated with lower unpleasantness and higher perceived safety. Beyond spatial parameters, visual complexity such as façade elements and materials are also significantly associated with psychological comfort. For instance, Bornioli et al. [122], through a simulation experiment, demonstrated that incongruous historic façade elements can evoke unpleasantness. Sun et al. [123], using VR-based testing, confirmed that material texture acts as a key modulator that is directly associated with levels of visual fatigue.
In research on the built environment and mental health, beyond indicators such as blue–green space, density, and walkability, factors like demographics (e.g., age, gender), socioeconomic status (e.g., income, education, housing), and social relations may act as moderators. For instance, Raisi et al. [101] found that gender, age, and social interaction moderate the effects of street-scale design and green space on perceived safety. By relating to safety perceptions via physiological differences and social activities, these variables are associated with emotional and mental health. Similarly, Dong et al. [105] incorporated demographic characteristics, housing conditions, and neighborhood satisfaction and identified that neighborhood capital and housing status are significantly associated with satisfaction and mental health. These factors, such as demographic, residential self-selection and socioeconomic conditions, correlate with both the built environment and health, making alternative explanations that the reviewed studies cannot rule out. Therefore, the extent to which the observed associations reflect the independent effects of the built environment remains unclear.

5. Built Environment and Physiological Outcomes

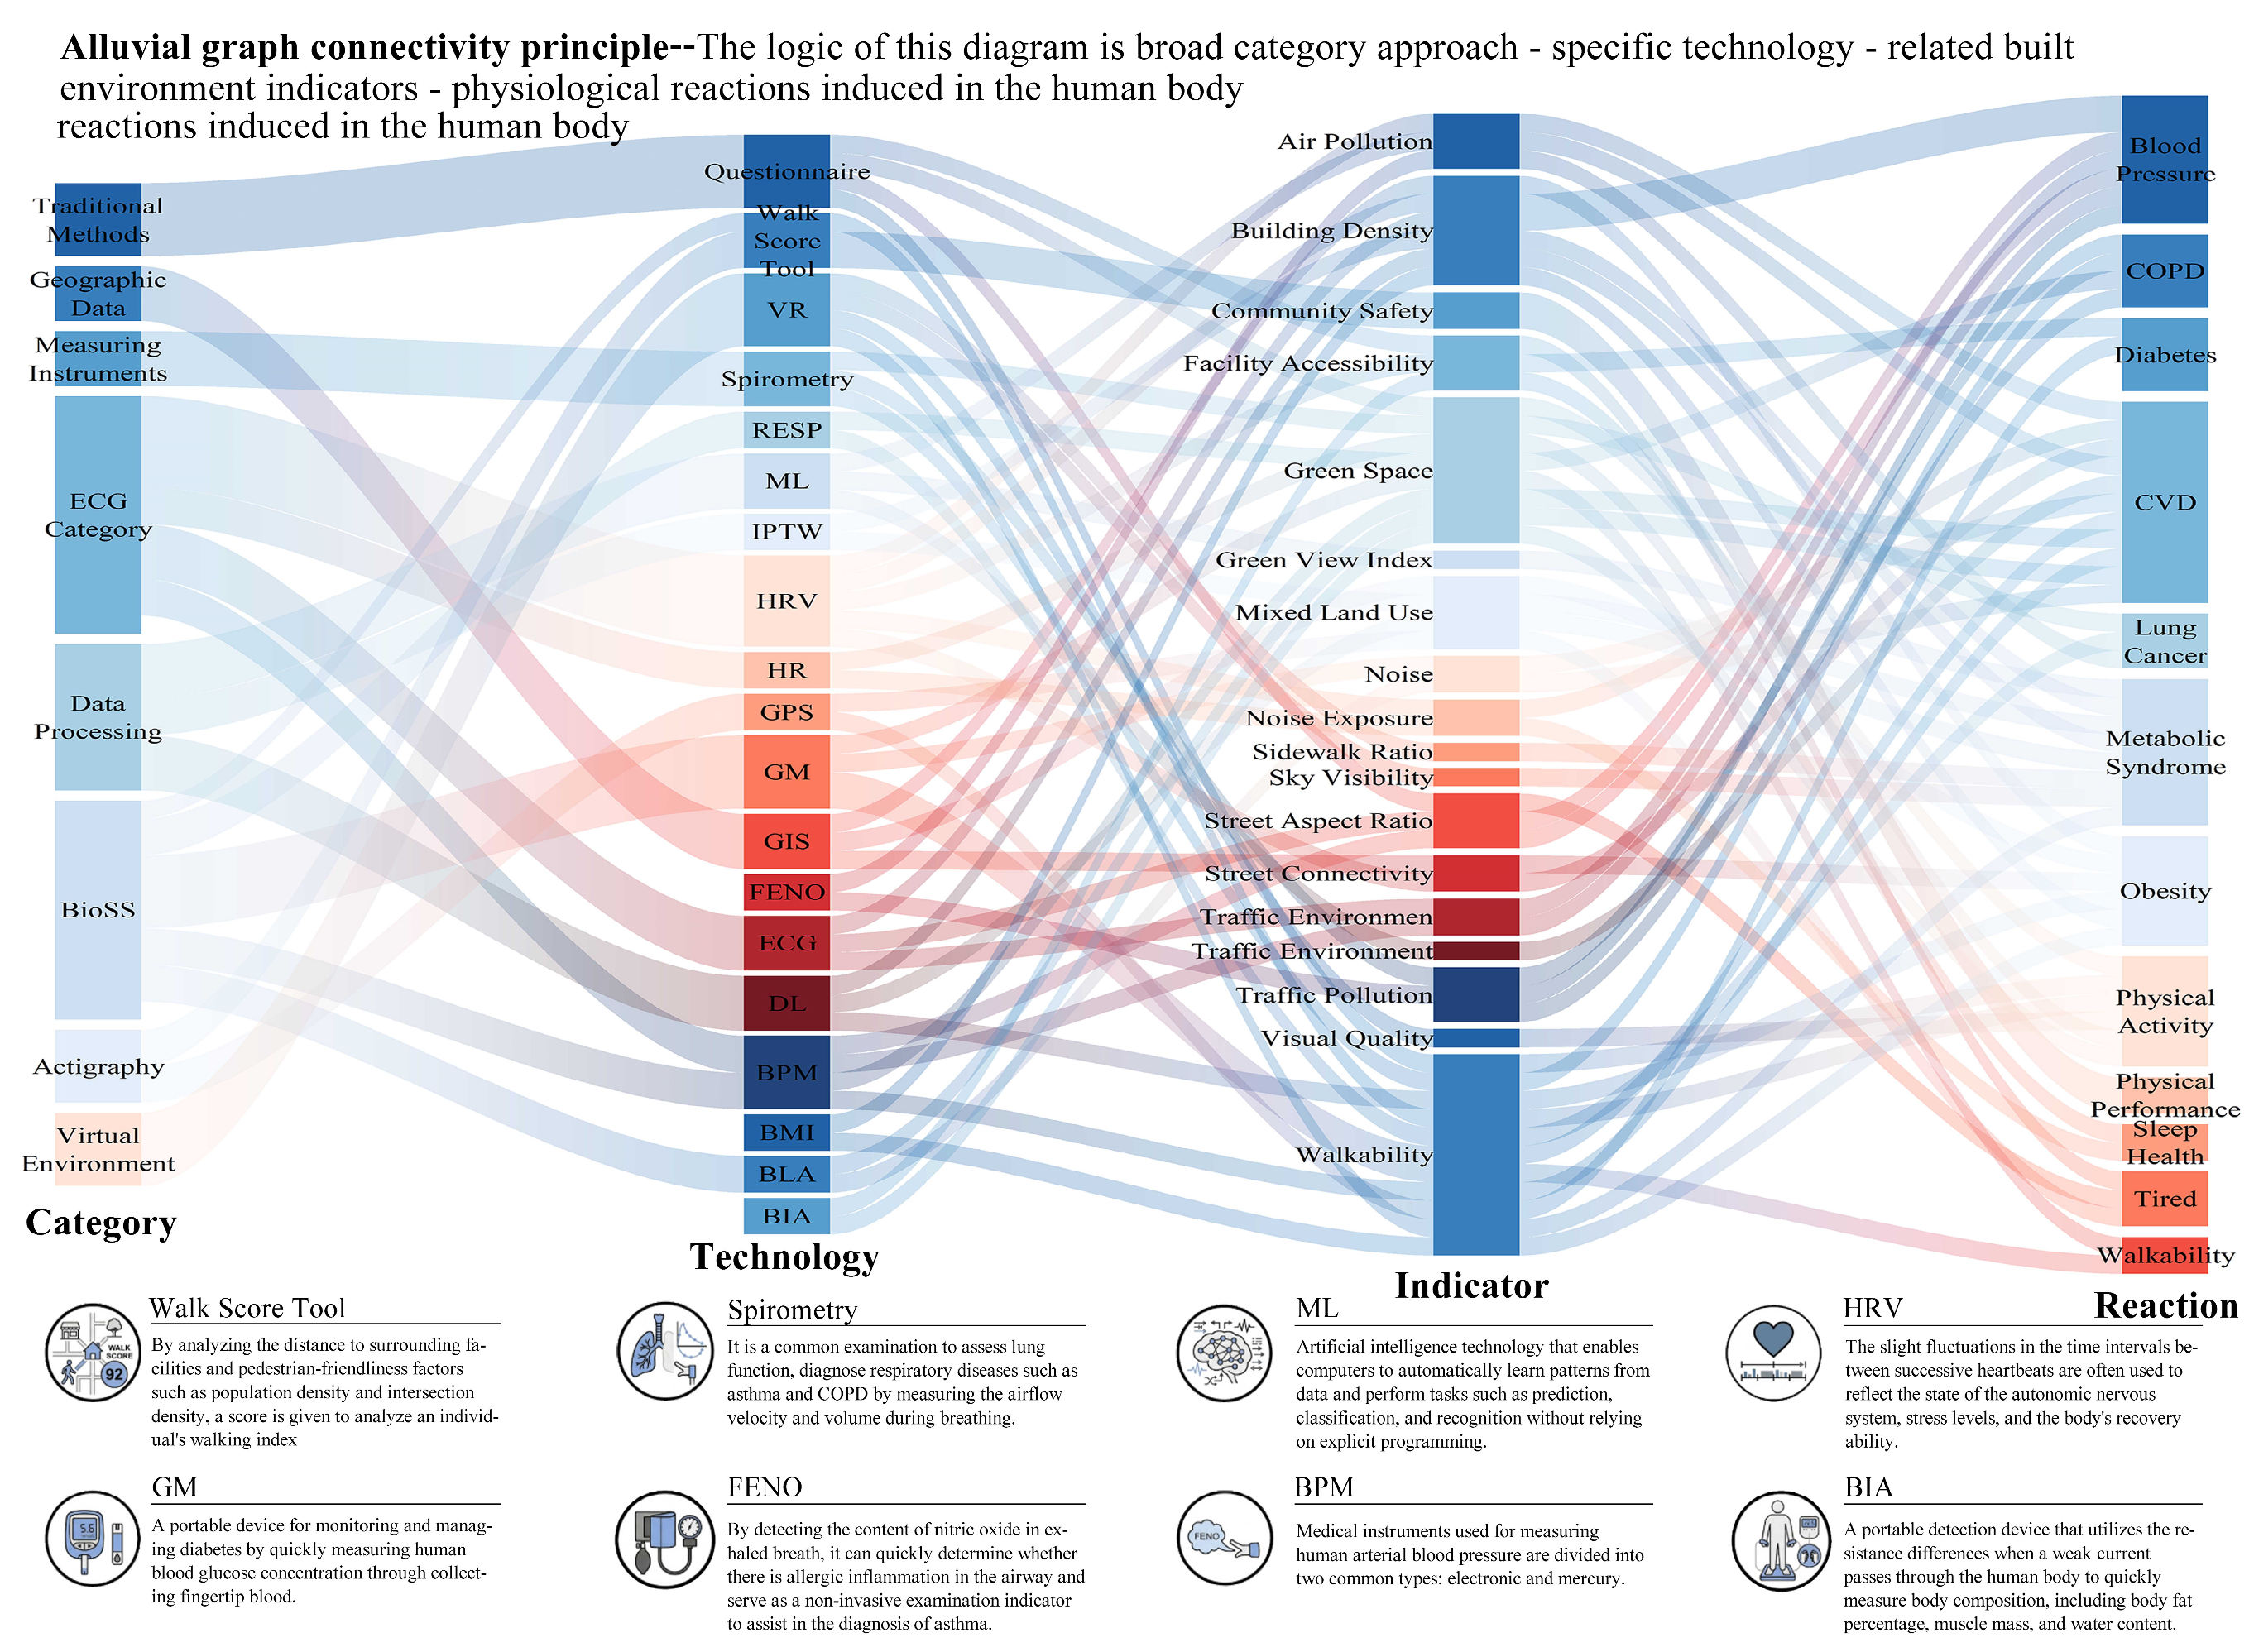
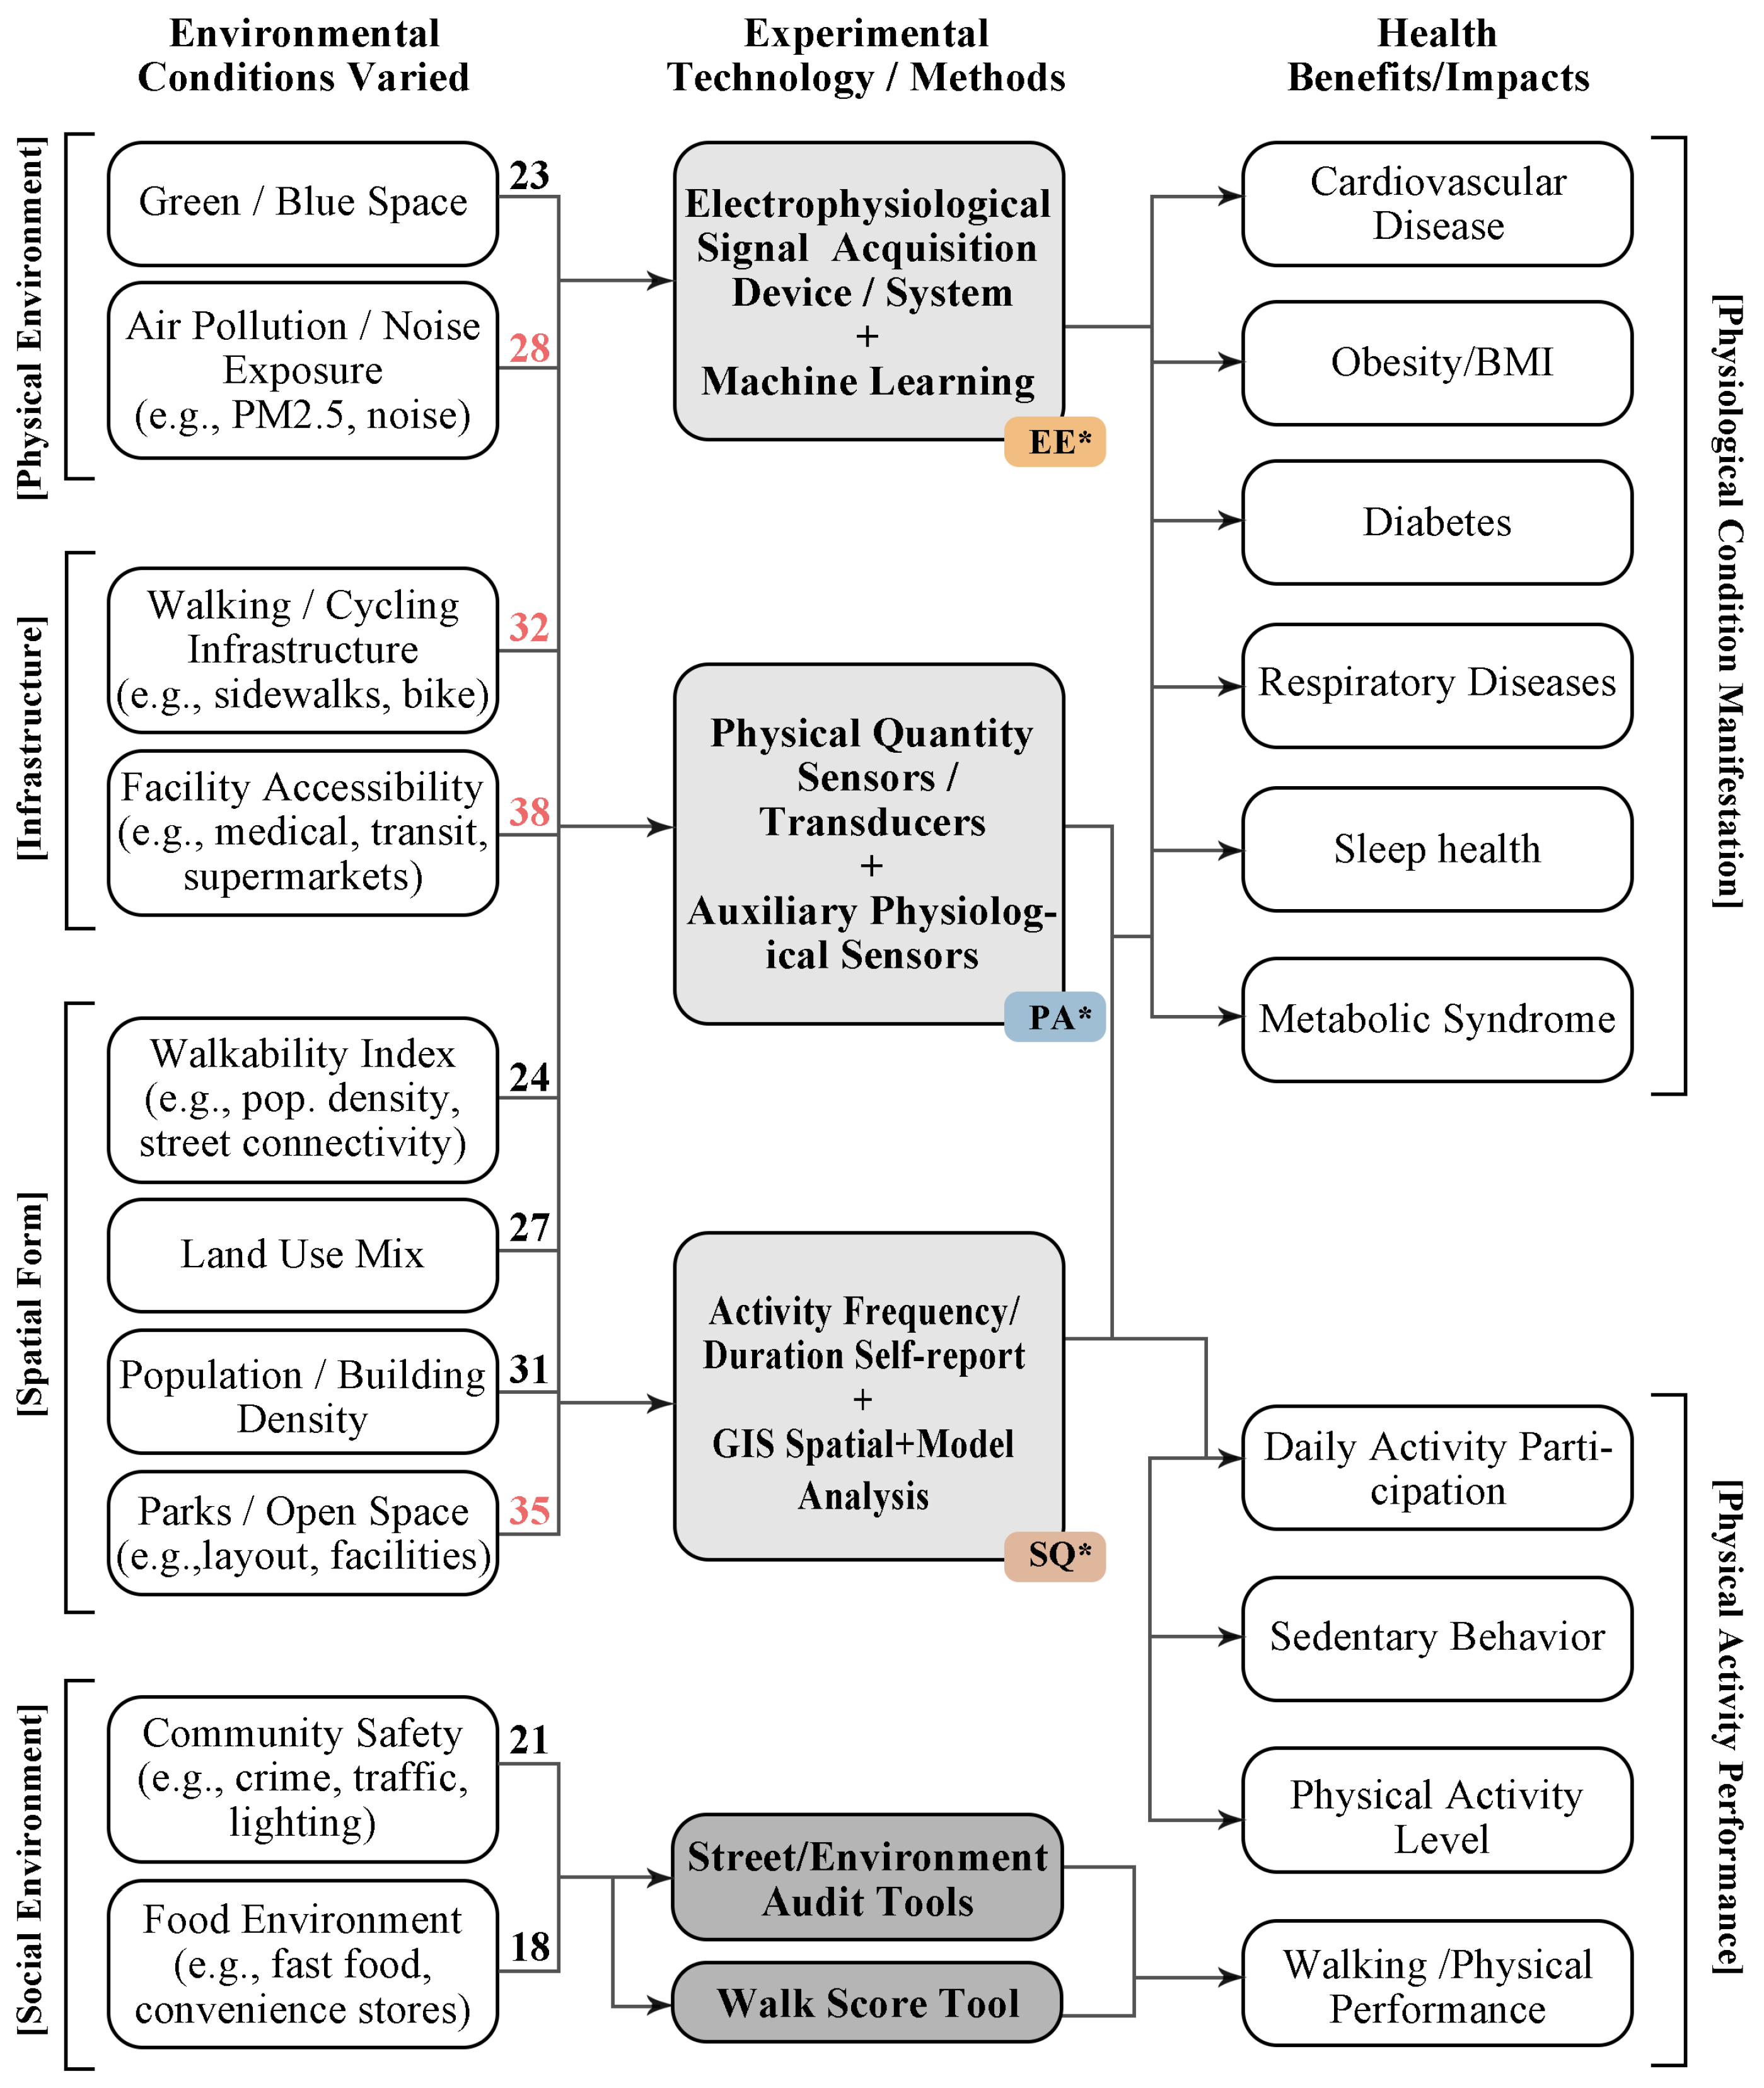
Physical health outcomes are increasingly understood in relation to complex interactions between environmental exposures and physiological susceptibility with the urban built environment serving as a critical correlate. To examine the pathways linking built environment attributes to physical health, this section presents a Technology–Indicator–Reaction alluvial diagram that maps how various measurement technologies capture the physiological responses associated with specific environmental factors (Figure 6). These responses span a continuum from subclinical physiological and behavioral modulations to established disease risks and clinical outcomes (Table 3).

5.1. Impacts on Subclinical Dysfunction

Low-quality built environments are associated with subclinical metabolic dysregulation, which is an early indicator of metabolic disorders such as obesity and dysglycemia. This largely reflects that such environments are associated with lower physical activity. Lack of access to parks or community facilities is linked to reduced physical activity, which correlates with measurable health declines that remain subclinical.

5.1.1. Modulating Physiology and Behavior

Daily physical activity best illustrates how this relationship works. Supportive environments benefit people behaviorally and physiologically. Increased daily walking has been linked to improved glucose regulation [26]. Using GIS and ML, studies have found that walkable streets with higher connectivity and better access to public amenities are correlated with higher physical activity and less sitting time. This behavioral change, in turn, is associated with lower risk of obesity and CVD [124,125]. Therefore, making neighborhoods more walkable and bikeable, expanding green spaces, and improving amenities are associated with higher physical activity and better metabolic health. These changes have the potential to reduce the incidence of obesity and metabolic syndrome [42,126].
The relationship between built environment and health is complex and often non-linear, reflecting how urban amenities interact [127]. This complexity is evident in different findings regarding commercial and recreational facilities. Briggs et al. [33] identified low full-service restaurant density and low county median household income as the strongest environmental correlates of both obesity and poor cardiovascular health with low fitness facility density additionally correlating with poor cardiovascular health behaviors. In contrast, Lee et al. [37] found that higher fast-food outlet density was linked to lower hypertension and stroke risk, whereas poorer access to public sports facilities was associated with a 15% higher risk of dyslipidemia (n = 50,741). These apparent contradictions highlight the importance of broader sociocultural and contextual factors.
Multiple studies have reported associations between supportive built environments and higher daily physical activity as well as lower sedentary behavior. Well-designed infrastructural features, such as blue–green spaces, streets, and public amenities, are associated with the maintenance of metabolic health.

5.1.2. Accumulating Subclinical Dysfunction

Prolonged exposure to such conditions is linked to altered daily activity patterns, which are related to increased disease risk. Evidence shows that exposure to low-quality environments is correlated with impaired physical performance, including early and measurable declines in both neuromuscular and cardiorespiratory function [41]. Using TERRA satellite MODIS data, De Keijzer et al. [34] found that lacking fitness facilities, safe walks, and nature access is associated with increased fatigue along with losses in muscle strength, joint flexibility, and balance. A low-quality built environment, including limited street connectivity, inappropriate residential density, insufficient green space, and low perceived safety, is associated with early functional decline. This decline is characterized by weaker muscle strength and poorer cardiorespiratory fitness [128].
Cumulatively, built environment deficiencies play a key role in metabolic dysregulation and related health outcomes. Early studies established that insufficient amenities and poor connectivity are associated with lower physical activity, reduced energy expenditure, and impaired metabolic regulatory function [129]. Subsequent studies have both corroborated and expanded this link. Ye et al. [32] identified that community environmental deficits are associated with key health indicators, including resident-reported fatigue, obesity, and somatic symptoms. More specifically, by integrating remote sensing monitoring, GIS-based analysis, and subjective perception surveys, studies have linked deficits in green space, public areas, and pedestrian infrastructure to metabolic disorders such as diabetes and obesity after stratification by buffer distance, socioeconomic status (SES), and age [46,130]. Furthermore, perceived and social environmental factors—including low neighborhood safety, weak social cohesion, and poor street connectivity—exacerbate this process. By chronically suppressing residents’ outdoor willingness and activity patterns, these factors correlate with the metabolic dysfunction and suboptimal health status [131].

5.2. Impacts on Disease Risk and Outcomes

Long-term exposure to the built environment may ultimately modulate the risk of specific disease incidence and clinical outcomes. Based on the primary pathways involved, these associations can be categorized into two main types: those mediated chiefly through behavioral and psychological pathways such as diabetes and metabolic syndrome, and those mediated primarily through direct environmental exposure pathways such as CVD and respiratory diseases.

5.2.1. Mediating Risk Through Behavior and Psychology

The built environment is significantly associated with the risk of chronic diseases by constraining or enabling health-promoting behaviors. One pathway is the association between the built environment and physical activity. Compared with favorable built environments, unsupportive built environments (e.g., low greenness, poor walkability and limited access) are associated with a 30–50% increased risk of type 2 diabetes, which is largely due to restricted routine physical activity among residents [132]. Physical activity in blue–green spaces is related to enhanced metabolic function and a lower incidence of metabolic syndrome [133]. Beyond metabolic outcomes, cardiovascular outcomes were also examined. Health surveys of residents in 21 communities have established significant associations between deficits in specific built environment—such as park density, street connectivity, and natural space exposure—and an elevated risk of hypertension [45]. Insufficient physical activity due to environmental constraints, as identified through DL-based pedestrian trajectory analysis, is associated with elevated cardiometabolic risk (CMR) and CVD [48,134]. Consistent with this, GIS-based estimations of green and blue space coverage within 300 m and 1000 m residential buffers have further linked such environmental deficiencies to a higher incidence of other chronic conditions, including inflammatory bowel disease and kidney disease [135].
Beyond restricting physical activity, sustained exposure to adverse built environments is associated with psycho-social distress and impaired mental well-being, which is further linked to disrupted sleep patterns and overall health decline, as evidenced by the structural equation modeling (SEM) of sleep quality data [136]. To examine the interrelationship between mental health and metabolic health, a machine learning study via visualizing BMI data (n = 20,453) identified that poorer mental health is significantly associated with metabolic function. This association remained robust across a suite of sensitivity checks. Further analysis indicated that poorer mental health is linked to smoking behavior, which in turn correlates with metabolic function [137]. Furthermore, using the CES-D scale in 20,533 Chinese residents, a study found that limited green and blue space access is associated with higher psychological distress and risk of somatic symptom disorder [10]. Beyond these psychological effects, among socioeconomically, racially, and ethnically diverse U.S. women, environments that lack walkable and activity-friendly spaces (e.g., parks, green areas, squares) were associated with sleep health by disrupting melatonin secretion [136,138].

5.2.2. Driving Risk Through Environmental Exposure

Long-term exposure to direct physical and chemical stimuli—such as air pollutants and noise in the built environment—shows a strong association with respiratory diseases and CVD.
At urban and regional scales, land-use patterns are related to people’s exposure to environmental hazards. Quantifying land-use patterns with GIS and patch density (PD) analysis, Wang et al. [139] studied 52,009 participants and found that industrial land use, green space reduction, and higher traffic density are correlated with increased COPD mortality. Stucki et al. applied ML to predict disease risk factors, and Yeager et al. conducted a GIS-based study to analyze blood pressure, collectively demonstrating that air pollution, noise, and light pollution are strongly associated with CVD [140,141]. Furthermore, urban sprawl patterns, characterized by low land-use intensity, fragmentation, and inefficient infrastructure, are associated with increased risks of lung cancer and CMR [142]. Collectively, these associations highlight that inadequately planned land development is linked to elevated pollutant exposure and an increased risk of multiple chronic diseases.
At the community and neighborhood scale, characteristics such as green space distribution and air quality correlate with residents’ micro-environmental exposures. Early research established that a reduction in green space quality and quantity during urbanization is associated with an increased incidence of early respiratory dysfunction and allergic diseases [143]. Subsequent studies using GIS and activity trajectory data confirm that green space confers protection by improving local environmental quality—through the reduction in air pollutants (e.g., NO2), noise mitigation, and heat island attenuation—which is linked to a lower incidence of chronic respiratory conditions such as COPD [4]. Beyond respiratory health, insufficient natural space is also associated with the risk of ischemic heart disease (IHD). This association is linked to air pollution (e.g., increased PM2.5) and poorer accessibility [136,144]. Yeager et al. [141] revealed that tree features (e.g., leaf area index) are linked to lower BP. This means vegetation quality, not just its presence, is associated with cardiovascular health. Furthermore, combining Dynaport MoveMonitor data (daily steps, sedentary time) with patient reports, Koreny et al. [40] identified that high population density, long pedestrian streets and elevated NO2 exposure all correlate with clinically diagnosed respiratory diseases. Collectively, the evidence suggests that reducing pollutant exposure and expanding functional green space are key interventions associated with lower risk of both cardiovascular and respiratory disease [145].
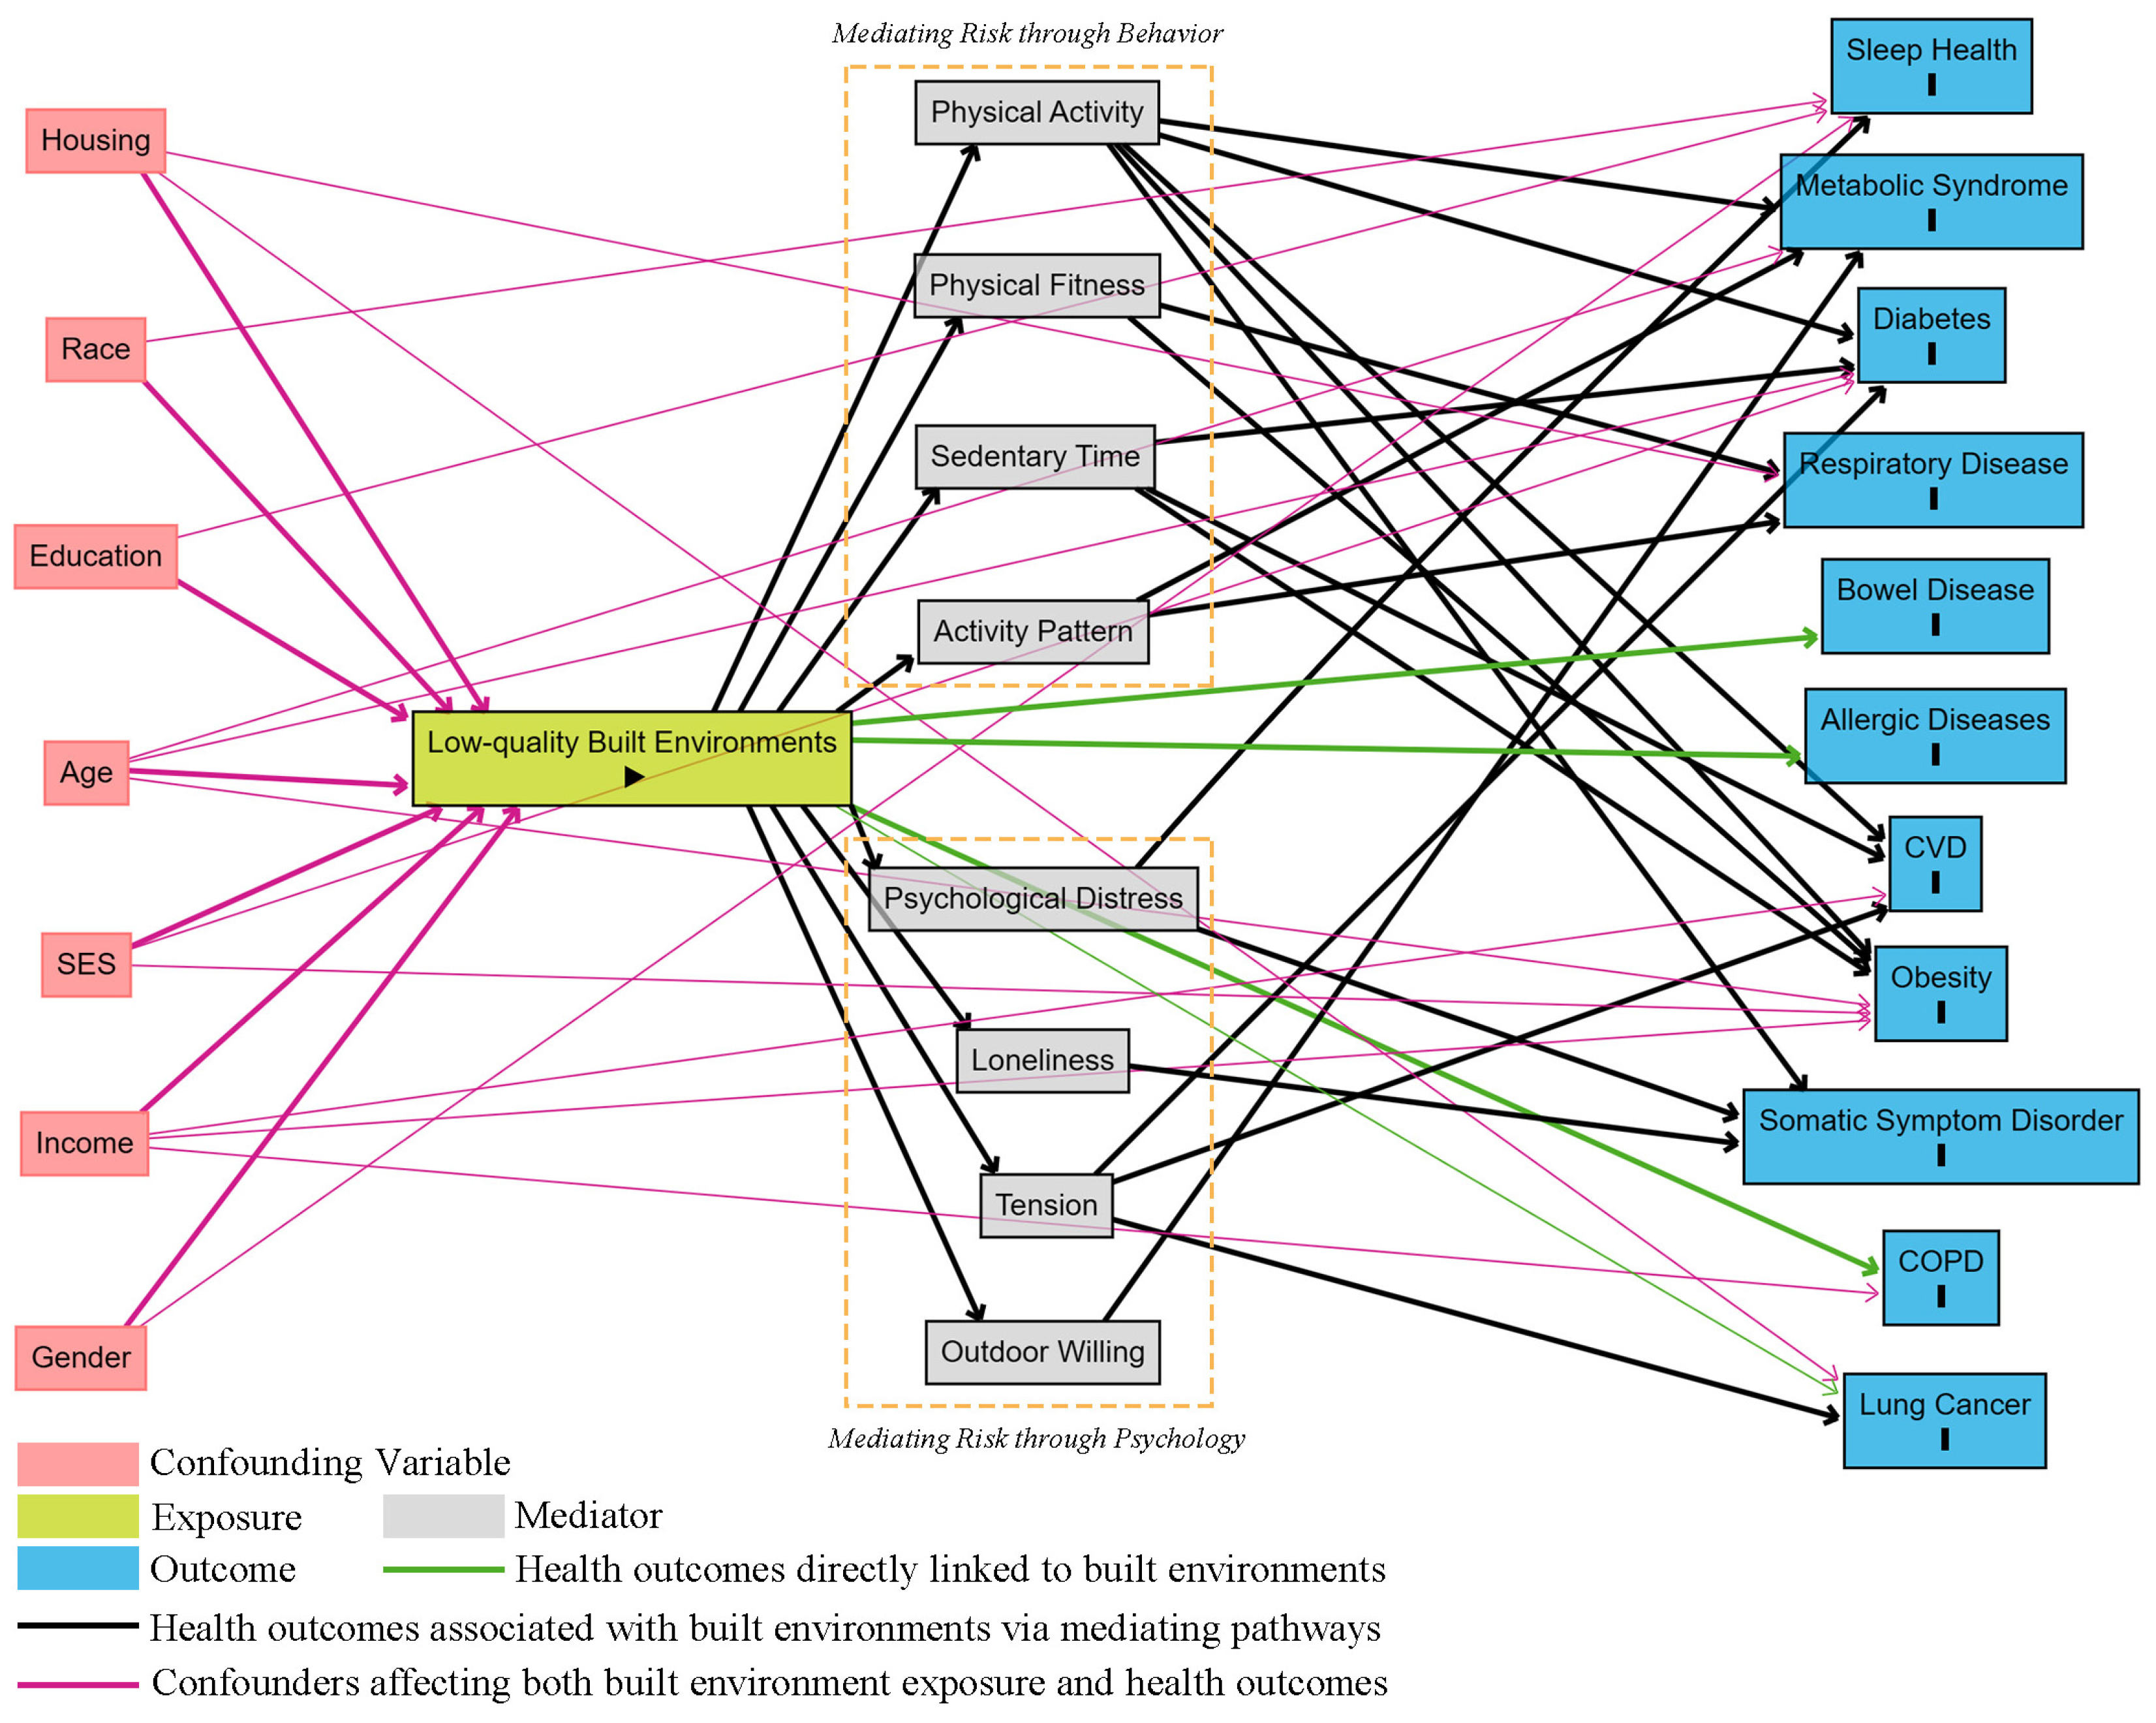
The DAG in Figure 7 encodes the assumed causal structure underlying these pathways. This framework posits that the built environment is associated with physiological outcomes via three pathways. In the behavioral pathway, built environment deficiencies may be associated with reduced physical activity and, consequently, with increased health risks (e.g., obesity, diabetes, metabolic syndrome). It may progress from subclinical dysfunction to clinical outcomes over time. In the psychological pathway, an adverse built environment correlates with elevated psychological distress and tension, which may link to metabolic dysregulation and disease risk via disrupted sleep and unhealthy behaviors (e.g., smoking). In the direct exposure pathway, environmental exposures (e.g., air pollution, noise) are associated with respiratory and cardiovascular systems. Under this DAG, the identification of pathway-specific effects would require conditioning on measured confounders (e.g., socioeconomic status, residential sorting, and sociodemographic characteristics), which may relate to both environmental exposure and health outcomes. This assumes no unmeasured confounding—an untestable condition in observational data. Estimates are therefore associational, not causal, and the pathways are hypothesized rather than proven.
This is supported by evidence showing that these pathways are moderated by socioeconomic status, residential sorting, and cultural background. Gaston et al. [138] found that the health benefits of residential green space for women vary by individual social attributes, including race, age, education, socioeconomic status, and neighborhood poverty. Cerin et al. [142] demonstrated that neighborhood socioeconomic status moderates the associations between built environment attributes and physical activity, blood lipids, and blood pressure.

6. Discussion

This review synthesizes 269 publications to propose a technology-informed biobehavioral framework linking the built environment to human health. The field has evolved in four phases: pre-2015 (traditional surveys), 2016–2019 (single sensors like EEG), 2020–2023 (subjective and objective data), and 2024 onward (multimodal data fusion). This shows a shift from subjective and single-device methods toward integrated, synergistic assessment. Technologies like physiological sensing, VR, and ML have improved how we measure biobehavioral responses to the built environment, which provide empirical support for the proposed dual-pathway framework. The following sections elaborate on how the built environment influences health through psychological and physiological pathways.

6.1. Psychological Pathway

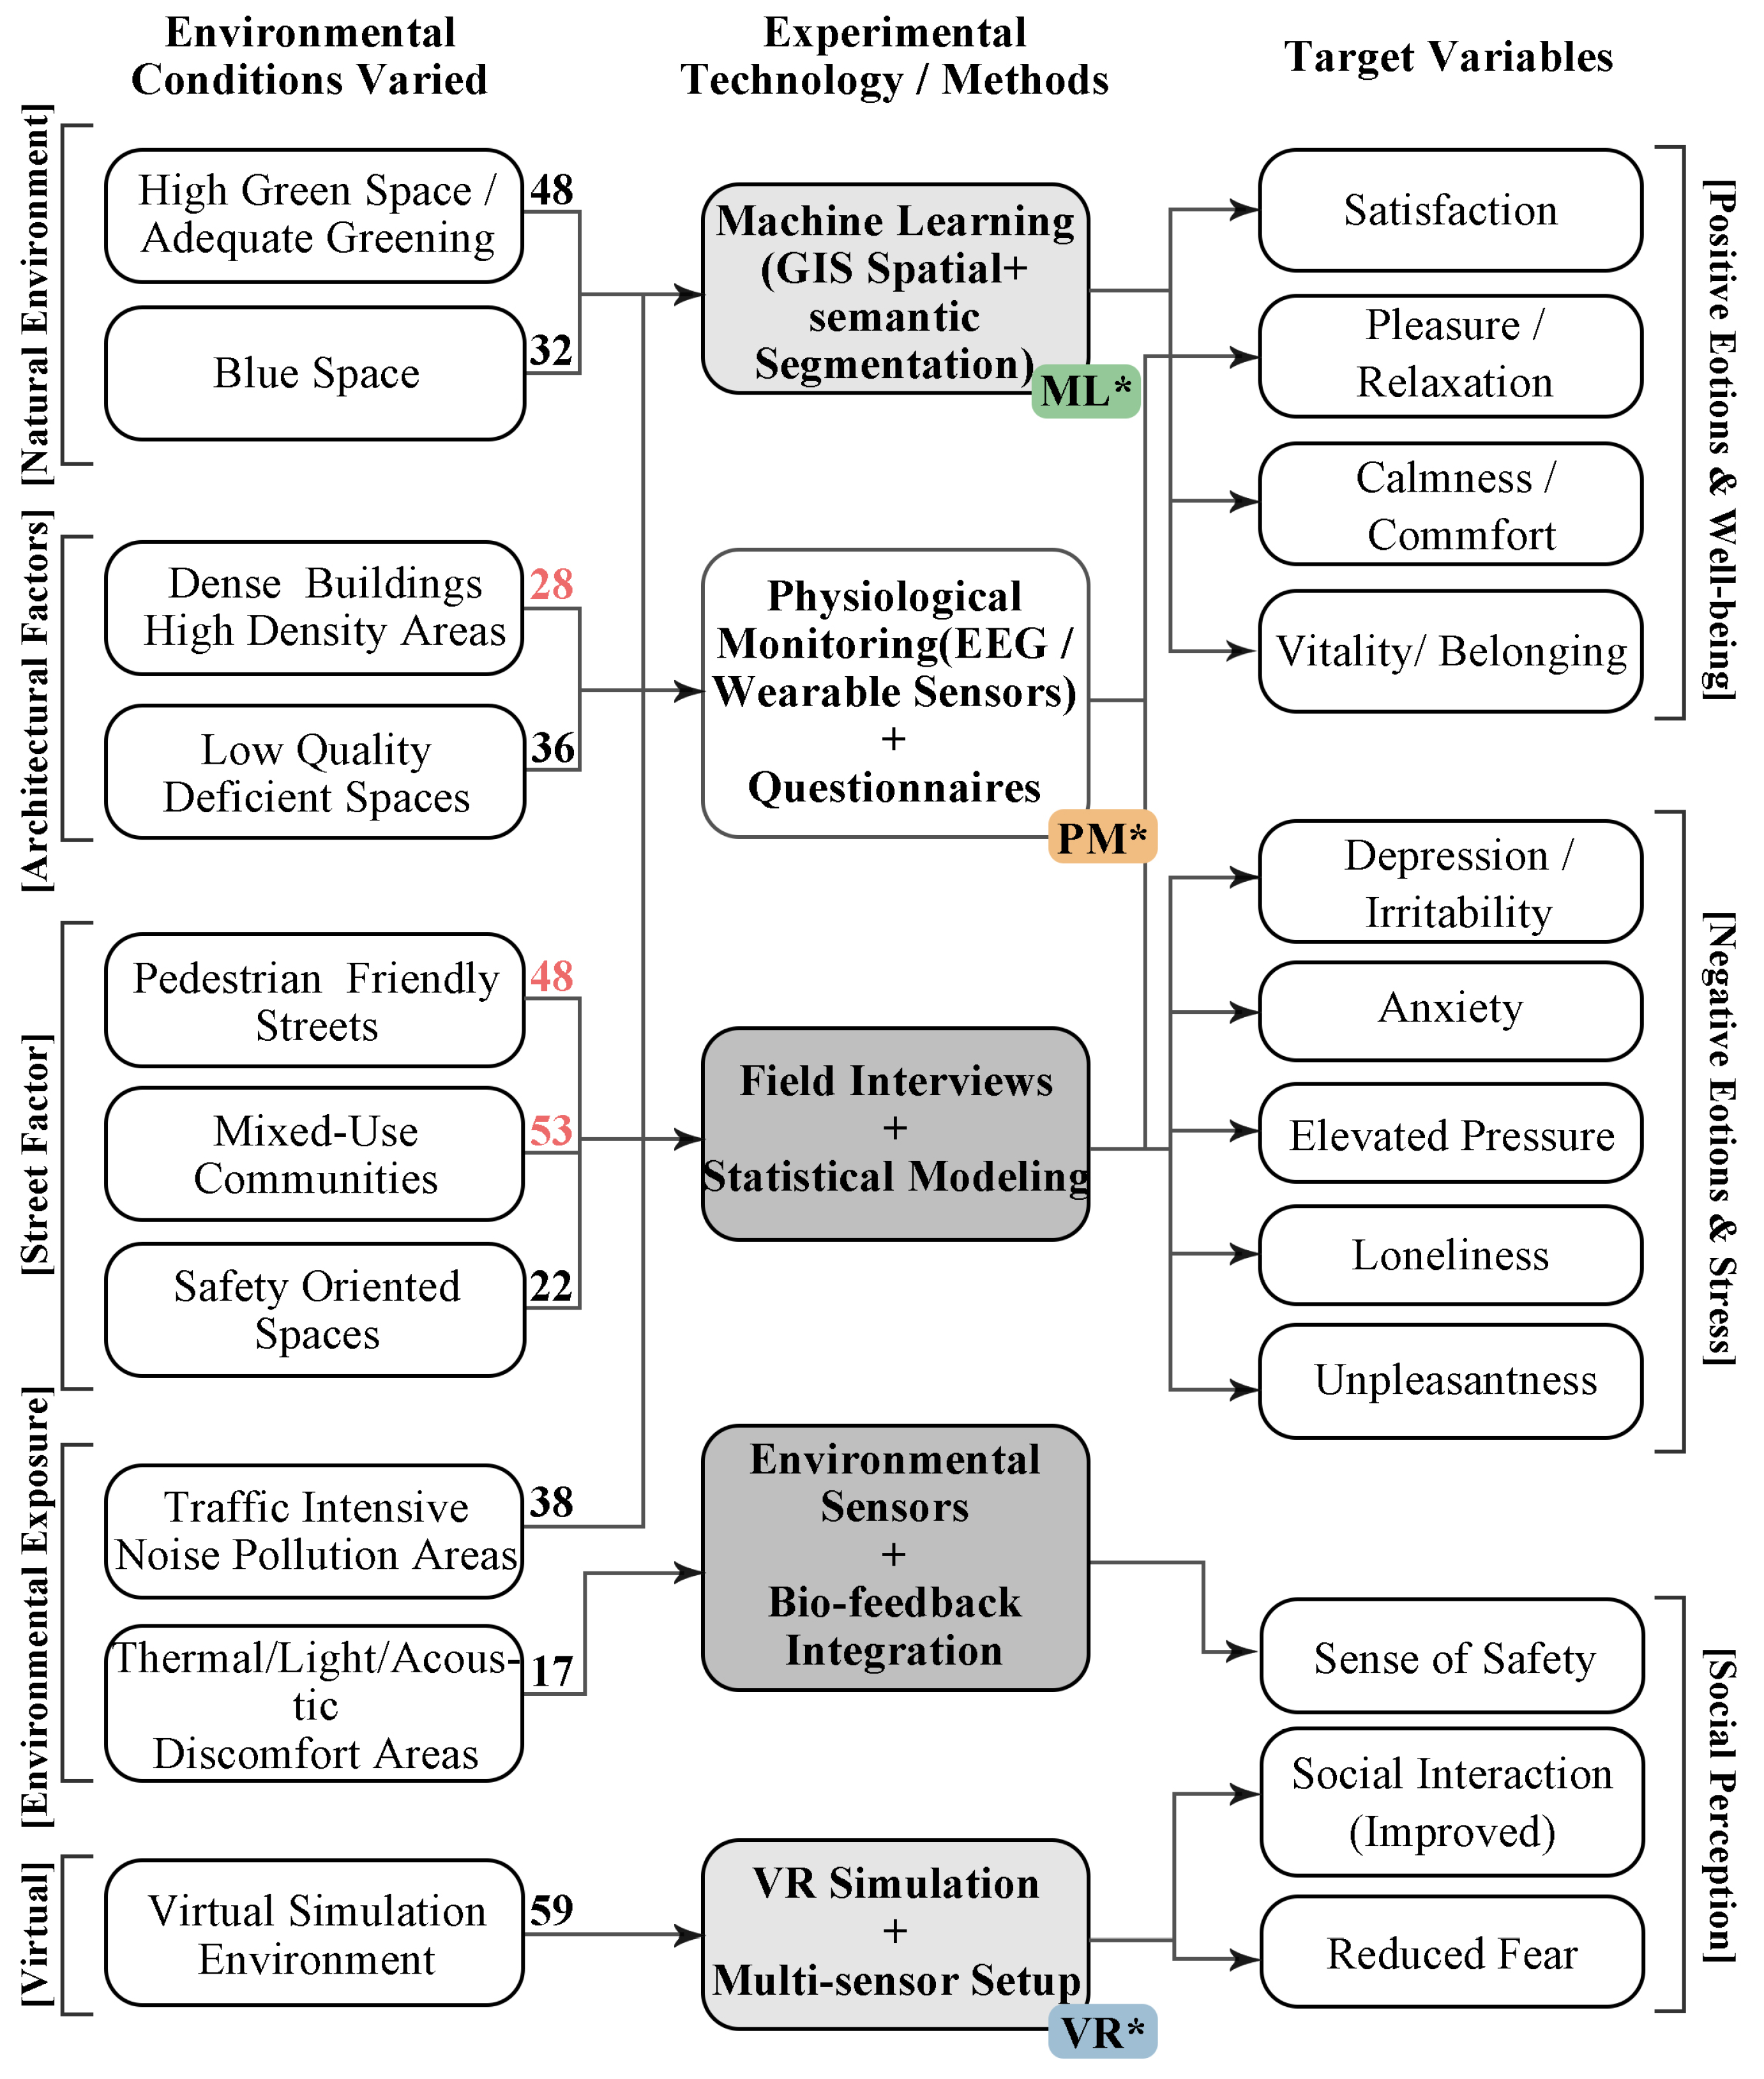
Built environment features, such as blue–green spaces [117] and street walkability [19], influence psycho-affective responses. These include high-arousal positive states (e.g., pleasure, satisfaction), low-arousal positive states (e.g., calmness, comfort), and corresponding negative states (e.g., anxiety, fear, oppression, loneliness). Among the 141 reviewed studies on the psychological responses of built environments, the most common positive emotions comprised 10 categories (e.g., participation, leisure value, relaxation, safety), while negative emotions comprise 12 categories (e.g., tension, panic, stress, fatigue, unpleasantness). More than half of the reviewed studies used EEG, which was followed by ECG, appearing in over 40% of studies. These two techniques were sometimes integrated within a single study. VR has also emerged as a prominent tool in this domain (Figure 8).
Among the reviewed literature, 80 studies (57%) focused primarily on natural environmental elements. Natural features demonstrate significant associations with nearly all emotion types and arousal valences, establishing this category as a central research focus. In terms of positive impacts, blue–green spaces are consistently identified as key correlates to psychological well-being. For example, blue spaces are associated with enhanced pleasure and aesthetic values [98], while restorative green spaces and soundscapes are linked to stress reduction and recovery [97]. Conversely, inadequate access to blue–green spaces appears to be an environmental stressor associated with low-arousal negative effect and chronic psychological distress with observable effects on children and older adults.
Overall, 89 studies examined predominantly human-built environments, though some incorporated natural elements. Indicators included building density (n = 28), street walkability (n = 48), and land-use mix (n = 53) with the community scale receiving particular attention. Excessive density across buildings, facilities, road networks, and spatial enclosure correlates with negative mental health outcomes [108] and is associated with feelings of loneliness, depression, and insecurity through perceived disorder and restricted mobility [120]. Limited accessibility is correlated with lower physical activity and greater psychological dissatisfaction [13]. Conversely, walkable streets, mixed-use development, distinctive architecture, and well-maintained public spaces are positively associated with restorative experiences and satisfaction [91].
In summary, the built environment is associated with mental health outcomes primarily through engagement and restorative experiences. While negative environmental impacts often accumulate over prolonged exposure, the mental health benefits of the built environment are not realized through environmental indicators alone. Instead, these benefits are associated with collective uses, shared interests, and learning processes. For instance, the planning, implementation, and management of blue–green spaces linked to psychological benefits require stakeholders to co-create value around shared interests [146]. Similarly, Sainz-Santamaria found that despite the inherent mental health value of urban green spaces, the unequal distribution and scarcity in low-income communities across Latin America are associated with diminished benefits. Addressing these barriers involves continuous learning processes and adaptive governance [147]. Consequently, this highlights the mediating role of collective uses, shared interests, and learning processes in environmental health interventions. Overlooking these factors when exploring the environment-health relationship may be linked to divergent health outcomes.

6.2. Physiological Pathway

Environmental exposures were linked to physiological outcomes through two primary routes: (1) behavioral–psychological mediation, where environmental design correlates with physical activity, social interaction, or stress, thereby modulating biosignals (e.g., cortisol, HRV); and (2) direct environmental exposure, such as to air pollution or noise, which is correlated with physiological strain. Outcomes spanned from subclinical dysfunction (e.g., obesity, metabolic health) to increased risk of clinical conditions (e.g., CVD, respiratory diseases). Among the 107 studies on physiological outcomes, physiological monitoring devices (e.g., sphygmomanometer, ECG) were the most widely used tools for direct health assessment (n = 70). Physiological health research emphasizes objective measurements of physiological indicators (e.g., BP, BMI) and biomarkers (e.g., glucose, lipid concentrations). These are further integrated with individual activity trajectories and select bioelectrical signals, collectively forming the core technical framework underpinning the investigation of the physiological health pathways presented in Figure 9. For data analysis, 78% (n = 83) employed GIS-based spatial analysis to assess regional variations in physical health in relation to environmental characteristics, while ML was adopted in 53 studies to model associations between environmental features and health outcomes.
Overall, 33 studies addressed individual behavioral regulation, referring to the indirect association between physiological function and environment-related health behaviors. Supportive environments (e.g., high connectivity, good accessibility, well-established facilities, walkability) were associated with reduced risks of CVD, obesity, and metabolic disorders [83,127]. In contrast, deficient environmental conditions (e.g., low perceived safety, inadequate public space) were shown to be associated with behavioral adaptation, which in turn correlates with subclinical dysfunction and significantly elevated disease risk. Chronic conditions related to metabolic disorders—including obesity, diabetes, and hypertension—were addressed in 59% (n = 63) of the studies, representing a central challenge in environment–physical health research. Notably, the improvement of such deficiencies was associated with residents’ willingness to increase physical activity frequency [125,127] and with improved glycemic control, reduced fatigue, and alleviated somatic symptoms [148].
The built environment is linked to disease outcomes (e.g., respiratory diseases, CVD) through two pathways: behavioral–psychological mediation and direct environmental exposure. Regarding behavioral and psychological regulation, unfavorable built environments correlate with lower physical activity due to reduced walkability and limited access to blue–green spaces, which in turn correspond to an elevated risk of type 2 diabetes and hypertension [45,133]. In addition, such environments are also linked to psychological stress and circadian disruption, which are further reflected in metabolic disturbances linked with obesity and somatic symptom disorders [136]. In contrast, direct environmental exposure involves physical and chemical stimuli—including air pollutants and traffic noise—that is associated with physiological harm [99,140]. Moreover, irrational land use, urban sprawl, and green space deficiency correlate with higher pollutant exposure as well as with increased incidence and mortality of respiratory, CVD, lung cancer, and ischemic heart disease [48,144].
In contrast to mental health research, where natural environments dominate, physiological health studies place greater emphasis on accessibility (n = 38), infrastructure (n = 32), public open spaces (n = 35), air and noise pollution (n = 28). These environmental indicators are regarded as relevant to disease risk reduction. Beyond environmental indicators alone, realizing the health benefits of the built environment and reducing disease risk are associated with governance and organizational dimensions. Rigo et al. found that Green Care initiatives—such as therapeutic landscapes and nature-based walking—are closely linked to appropriate organizational arrangements in supporting physical health [149]. Gayles demonstrated that the health benefits of a community-built environment for residents are associated with not only physical features but also organizational arrangements. These arrangements coordinate environmental resources and spatial assets, supporting a shift from exclusive land use toward collective uses [150]. This aligns with insights from community development and social innovation research, which identify the social–organizational dimension of space as a key factor associated with health outcomes [151,152].

6.3. Research Limitation

6.3.1. Limitations of Social Health Research

Defined by the WHO as a core dimension of human health, social health represents the number and quality of meaningful interpersonal connections in living environment [153,154]. Keyes’ five-factor framework (social integration, acceptance, contribution, actualization, and harmony) [155] underpins mainstream metrics of social support networks, community interaction frequency, sense of belonging, and perceived social equity. For built environment and social health research, Qi et al. [156] quantified the associations of neighborhood open space, pedestrian networks, green space, and community facilities with social cohesion and neighborly interaction. Based on a randomized controlled trial, Theall et al. [157] provided causal evidence that built environment renewal is linked to residents’ social well-being and community connectedness.
Despite a solid theoretical foundation, critical limitations remain. The absence of globally standardized metrics and inconsistent indicator selection undermines cross-study comparability. Research on the built environment and social health has been limited by conceptual flatness. Most studies focus on single dimensions such as social cohesion or community attachment. For example, the linear association between park renovation and social cohesion was quantified in a multi-ethnic community study in New York [158]. Similarly, the emotional correlation between public space quality and community belonging was examined without extending to multidimensional constructs such as social integration and social actualization [159]. Another study confined its analysis to built environment and social cohesion correlations, thereby reducing comprehensive social health to a single communal attribute [160].
Current social health measurements rely on superficial indicators (e.g., participation frequency) and overlook the spatially divergent effects of bonding, bridging, and linking social capital [161]. Future research should focus on three priorities: (1) a standardized multidimensional framework to correct the misconception that social health equals social cohesion; (2) refining mechanisms linking built environments to social health and identifying core mediating variables; (3) integrating deeper constructs such as social trust, social contribution, and distributive justice.

6.3.2. Population Heterogeneity and Unequal Exposure

Existing studies quantify group disparities in the built environment exposure by age, gender, socioeconomic status, ethnicity, and migration status using stratified regression and interaction effect tests. However, most studies frame population heterogeneity as a moderator rather than a structural premise across the causal chain from environmental exposure to health outcomes. The intersectional effects of overlapping personal identities remain largely overlooked.
The Social Determinants of Health (SDOH) theory clarifies that the spatial allocation of environmental health risks and benefits follows socioeconomic stratification rather than random distribution [162,163]. Empirical evidence confirms that structural disparities in built environment resources across different social groups are associated with health inequities [164,165]. However, existing built environment research largely overlooks that most studies assume environmental interventions distribute health benefits evenly across social groups, ignoring heterogeneous or adverse effects. Empirical evidence on the mechanisms of green gentrification and regenerative injustice remains scarce. Projects seemingly beneficial for all residents (e.g., urban park construction, street pedestrianization) may raise local living costs, disrupt indigenous social networks, and displace disadvantaged residents, ultimately concentrating health dividends among privileged groups [166,167].
Future research should center population heterogeneity and unequal environmental exposure as core analytical dimensions rather than auxiliary conclusions. Specifically, researchers should establish the health equity assessment system to compare multiply marginalized groups and integrate environmental justice into intervention evaluation.

6.3.3. Absence of Cross-Regional Research

Existing research on the built environment and health exhibits geographic sampling bias and systematic construct validity deficits. A 2024 analysis of 1200 studies found that 78% of empirical studies focused on high-income countries in North America and western Europe, whereas only 6% covered low and lower-middle-income countries [166]. Additionally, the lack of health assessment across contexts undermines cross-study comparability.
First, built environment indicators (e.g., walkability, greenness, block density) lack cross-nationally standardized definitions, as the same indicator often has different meanings and mechanisms across cities due to variations in development and culture. For instance, a “walkable street” in Beijing, San Francisco, and Hamburg varies in road width, vehicle volume, and regulation, which are associated with different impacts on travel behavior and health. This construct compression undermines cross-study comparability by allowing identical scores to reflect unequal environmental conditions [168]. Second, the Uncertain Geographic Context Problem (UGCP) further amplifies cross-border research bias [169]. For instance, European and American residents have larger activity radii than East Asian residents, while low-income populations are restricted to neighborhood-bound activities. Apply uniform spatial scales across such contexts risks biasing effect estimates. Moreover, global research resources are concentrated in high-income cities, and mainstream theories rooted in specific cultural contexts have limited transferability, which may lead to policy mismatches when directly applied elsewhere [170].
Future research should address these methodological issues. A multi-tiered research framework should be developed to cover regions across different developmental gradients. Standardized cross-national comparisons are also needed to identify universal patterns and regional differences. These efforts will help mitigate UGCP-related biases and enhance cross-cultural validity.

7. Conclusions

In the context of rapid urbanization, the built environment has become a key determinant of multidimensional health. This makes studying human–environment interactions timely and urgent. However, existing reviews on environment and health have largely focused on single technologies (e.g., VR [121], ML [77]), single psychological responses (e.g., pleasure [43], perceived safety [101]), single physiological outcomes (e.g., cardiovascular disease [48], obesity [127]), or isolated environmental features (e.g., blue–green space [133], neighborhood environment [108]), resulting in a relatively fragmented research perspective. While multiple disciplines have increasingly focused on this topic, a comprehensive interdisciplinary synthesis of methodological evolution and integrated health impact pathways has remained lacking.
To address this gap, this narrative review advances a coherent framework that positions measurable biobehavioral responses as critical mediators between the built environment and health by synthesizing the evolution of physiological sensing, VR, ML, and multimodal fusion. The framework integrates psychological health via a valence–arousal model and physiological health through a pathway spanning physical activity, subclinical dysfunction, and clinical disease. In doing so, it moves beyond the traditional reliance on single outcomes and single technologies. Based on an analysis of 269 articles retrieved from Web of Science and Scopus, this review makes three primary contributions: (1) tracing the methodology of technology-driven biobehavioral measurement in built environment–health research; (2) synthesizing a dual-pathway framework of emotion–arousal and behavioral–exposure mechanisms connecting built environments to psychophysiological health; and (3) proposing a translational framework based on technology-derived insights to guide human-centered design. These findings can directly inform urban planning, building design, and public health, providing a basis for creating built environments that are both sustainable and health promoting.
However, translating technical findings into urban policies requires a governance perspective rather than just measuring psychophysiological responses. As Brenner, Le Galès, and others argue [152,171,172], the health potential of the built environment is closely linked to governance and policy to bridge the gap between technical precision and implementation. Multiple empirical studies support this perspective. In Guangdong, China, provincial and municipal governments used SBM-DEA and two-way fixed effects models at the city level to reduce regional disparities in environmental resources, potentially improving residents’ health and satisfaction [154]. A study on healing landscapes in Serbia demonstrates the importance of governance interventions. Government land allocation, combined with participation from residents and health organizations in construction and maintenance, is associated with equitable access to restorative spaces and better population health [173]. Likewise, research on green space interventions points to the role of governance. Government rules, social organization efforts, and community involvement in site selection and maintenance—backed by equity tools and MET cost estimation—may contribute to fair outcomes, especially for vulnerable groups [174]. Together, these studies suggest that a governance perspective is important for translate technical precision into implementable, human-centered design.

Supplementary Materials

The following supporting information can be downloaded at https://www.mdpi.com/article/10.3390/buildings16132611/s1, Table S1: Summary of relevant review studies (n = 269).

Author Contributions

Conceptualization, N.J.; methodology, N.J.; software, C.C.; validation, Z.P.; investigation, X.L. and J.D.; resources, N.J.; data curation, C.C.; writing—original draft preparation, N.J.; writing—review and editing, N.J.; funding acquisition, N.J. and Z.P. All authors have read and agreed to the published version of the manuscript.

Funding

This research is financially supported by the MOE (Ministry of Education in China) Liberal Arts and Social Sciences Foundation (Grant No. 24YJCZH115); the Qingdao Natural Science Foundation (Grant No. 25-1-1-84-zyyd-jch); the Shandong Provincial Natural Science Foundation (Grant No. ZR2025QC554) and the Natural Science Foundation of China (Grant No. 52578027).

Data Availability Statement

No new data were created or analyzed in this study.

Acknowledgments

All figures and tables presented in this paper were drawn by the authors. The authors have reviewed and edited the output and take full responsibility for the content of this publication.

Conflicts of Interest

The authors declare no conflicts of interest. The funders had no role in the design of the study; in the collection, analyses, or interpretation of data; in the writing of the manuscript; or in the decision to publish the results.

References

  1. Deng, M.; Jin, W.; Guo, H.; Chen, X.; Wang, Y.; Xu, L.; Zhou, W. The Physiological and Psychological Effects of the Built Environment: Research Progress and Implications. Buildings 2026, 16, 1144. [Google Scholar] [CrossRef]
  2. Cao, Y.; Li, T.; Tribby, C.P.; Chang, D.H.F. Environmental Exposure and Mental Health in Hong Kong: Protocol for a GPS- and Biosensor-Based Observational Study. JMIR Res. Protoc. 2026, 15, e84919. [Google Scholar] [CrossRef] [PubMed]
  3. Niculita-Hirzel, H.; Hirzel, A.H.; Wild, P. A GIS-Based Approach to Assess the Influence of the Urban Built Environment on Cardiac and Respiratory Outcomes in Older Adults. Build. Environ. 2024, 253, 111362. [Google Scholar] [CrossRef]
  4. Zhang, K.; Brook, R.D.; Li, Y.; Rajagopalan, S.; Kim, J.B. Air Pollution, Built Environment, and Early Cardiovascular Disease. Circ. Res. 2023, 132, 1707–1724. [Google Scholar] [CrossRef] [PubMed]
  5. Bishop, I.D.; Rohrmann, B. Subjective Responses to Simulated and Real Environments: A Comparison. Landsc. Urban Plan. 2003, 65, 261–277. [Google Scholar] [CrossRef]
  6. Chen, D.; Yin, J.; Yu, C.-P.; Sun, S.; Gabel, C.; Spengler, J.D. Physiological and Psychological Responses to Transitions between Urban Built and Natural Environments Using the Cave Automated Virtual Environment. Landsc. Urban Plan. 2024, 241, 104919. [Google Scholar] [CrossRef]
  7. Liu, B.-P.; Huxley, R.R.; Schikowski, T.; Hu, K.-J.; Zhao, Q.; Jia, C.-X. Exposure to Residential Green and Blue Space and the Natural Environment Is Associated with a Lower Incidence of Psychiatric Disorders in Middle-Aged and Older Adults: Findings from the UK Biobank. BMC Med. 2024, 22, 15. [Google Scholar] [CrossRef] [PubMed]
  8. Bernardo, F. Impact of the Natural and Built Environment on Human Health: A Perspective from Environmental Psychology. In Environmental Health Behavior; Santos, O., Santos, R.R., Virgolino, A., Eds.; Academic Press: Cambridge, MA, USA, 2024; pp. 101–112. ISBN 9780128240007. [Google Scholar] [CrossRef]
  9. Sun, D.; Zhou, F.; Lin, J.; Yang, Q.; Lyu, M. A Study on Landscape Feature and Emotional Perception Evaluation of Waterfront Greenway. Environ. Res. Commun. 2024, 6, 095023. [Google Scholar] [CrossRef]
  10. Wang, R.; Liu, Y.; Xue, D.; Helbich, M. Depressive Symptoms among Chinese Residents: How Are the Natural, Built, and Social Environments Correlated? BMC Public Health 2019, 19, 887. [Google Scholar] [CrossRef] [PubMed]
  11. Norwood, M.F.; Lakhani, A.; Maujean, A.; Zeeman, H.; Creux, O.; Kendall, E. Brain activity, underlying mood and the environment: A systematic review. J. Environ. Psychol. 2019, 65, 101321. [Google Scholar] [CrossRef]
  12. Ren, Z.; Wang, S.; He, M.; Shi, H.; Zhao, H.; Cui, L.; Zhao, J.; Li, W.; Wei, Y.; Zhang, W.; et al. The Effects of Living Arrangements and Leisure Activities on Depressive Symptoms of Chinese Older Adults: Evidence from Panel Data Analysis. J. Affect. Disord. 2024, 349, 226–233. [Google Scholar] [CrossRef] [PubMed]
  13. Hoehner, C.M.; Brennan Ramirez, L.K.; Elliott, M.B.; Handy, S.L.; Brownson, R.C. Perceived and Objective Environmental Measures and Physical Activity among Urban Adults. Am. J. Prev. Med. 2005, 28, 105–116. [Google Scholar] [CrossRef] [PubMed]
  14. Song, C.; Joung, D.; Ikei, H.; Igarashi, M.; Aga, M.; Park, B.-J.; Miwa, M.; Takagaki, M.; Miyazaki, Y. Physiological and Psychological Effects of Walking on Young Males in Urban Parks in Winter. J. Physiol. Anthropol. 2013, 32, 18. [Google Scholar] [CrossRef] [PubMed]
  15. Kim, H.; Ahn, C.R.; Yang, K. A People-Centric Sensing Approach to Detecting Sidewalk Defects. Adv. Eng. Inform. 2016, 30, 660–671. [Google Scholar] [CrossRef]
  16. Tilley, S.; Neale, C.; Patuano, A.; Cinderby, S. Older People’s Experiences of Mobility and Mood in an Urban Environment: A Mixed Methods Approach Using Electroencephalography (EEG) and Interviews. Int. J. Environ. Res. Public Health 2017, 14, 151. [Google Scholar] [CrossRef] [PubMed]
  17. Li, D.; Menassa, C.C.; Kamat, V.R. Non-Intrusive Interpretation of Human Thermal Comfort through Analysis of Facial Infrared Thermography. Energy Build. 2018, 176, 246–261. [Google Scholar] [CrossRef]
  18. Asgarzadeh, M.; Lusk, A.; Koga, T.; Hirate, K. Measuring Oppressiveness of Streetscapes. Landsc. Urban Plan. 2012, 107, 1–11. [Google Scholar] [CrossRef]
  19. Ojha, V.K.; Griego, D.; Kuliga, S.; Bielik, M.; Buš, P.; Schaeben, C.; Treyer, L.; Standfest, M.; Schneider, S.; König, R.; et al. Machine Learning Approaches to Understand the Influence of Urban Environments on Human’s Physiological Response. Inf. Sci. 2019, 474, 154–169. [Google Scholar] [CrossRef]
  20. Browning, M.H.E.M.; Mimnaugh, K.J.; Van Riper, C.J.; Laurent, H.K.; LaValle, S.M. Can Simulated Nature Support Mental Health? Comparing Short, Single-Doses of 360-Degree Nature Videos in Virtual Reality with the Outdoors. Front. Psychol. 2020, 10, 2667. [Google Scholar] [CrossRef] [PubMed]
  21. Gritzka, S.; MacIntyre, T.E.; Dörfel, D.; Baker-Blanc, J.L.; Calogiuri, G. The Effects of Workplace Nature-Based Interventions on the Mental Health and Well-Being of Employees: A Systematic Review. Front. Psychiatry 2020, 11, 323. [Google Scholar] [CrossRef] [PubMed]
  22. Larkin, A.; Gu, X.; Chen, L.; Hystad, P. Predicting Perceptions of the Built Environment Using GIS, Satellite and Street View Image Approaches. Landsc. Urban Plan. 2021, 216, 104257. [Google Scholar] [CrossRef] [PubMed]
  23. Torku, A.; Chan, A.P.C.; Yung, E.H.K.; Seo, J. Detecting Stressful Older Adults-Environment Interactions to Improve Neighbourhood Mobility: A Multimodal Physiological Sensing, Machine Learning, and Risk Hotspot Analysis-Based Approach. Build. Environ. 2022, 224, 109533. [Google Scholar] [CrossRef]
  24. Luo, W.; Chen, C.; Li, H.; Hou, Y. How Do Residential Open Spaces Influence the Older Adults’ Emotions: A Field Experiment Using Wearable Sensors. Landsc. Urban Plan. 2024, 251, 105152. [Google Scholar] [CrossRef]
  25. Ji, H.; Qing, L.; Han, L.; Wang, Z.; Cheng, Y.; Peng, Y. A New Data-Enabled Intelligence Framework for Evaluating Urban Space Perception. ISPRS Int. J. Geo-Inf. 2021, 10, 400. [Google Scholar] [CrossRef]
  26. Saarloos, D.; Kim, J.-E.; Timmermans, H. The Built Environment and Health: Introducing Individual Space-Time Behavior. Int. J. Environ. Res. Public Health 2009, 6, 1724–1743. [Google Scholar] [CrossRef] [PubMed]
  27. Kim, T.-H.; Jeong, G.-W.; Baek, H.-S.; Kim, G.-W.; Sundaram, T.; Kang, H.-K.; Lee, S.-W.; Kim, H.-J.; Song, J.-K. Human Brain Activation in Response to Visual Stimulation with Rural and Urban Scenery Pictures: A Functional Magnetic Resonance Imaging Study. Sci. Total Environ. 2010, 408, 2600–2607. [Google Scholar] [CrossRef] [PubMed]
  28. Luigi, M.; Massimiliano, M.; Aniello, P.; Gennaro, R.; Virginia, P.R. On the Validity of Immersive Virtual Reality as Tool for Multisensory Evaluation of Urban Spaces. Energy Procedia 2015, 78, 471–476. [Google Scholar] [CrossRef]
  29. Higuera-Trujillo, J.L.; López-Tarruella Maldonado, J.; Llinares Millán, C. Psychological and Physiological Human Responses to Simulated and Real Environments: A Comparison between Photographs, 360° Panoramas, and Virtual Reality. Appl. Ergon. 2017, 65, 398–409. [Google Scholar] [CrossRef] [PubMed]
  30. Zhang, F.; Zhou, B.; Liu, L.; Liu, Y.; Fung, H.H.; Lin, H.; Ratti, C. Measuring Human Perceptions of a Large-Scale Urban Region Using Machine Learning. Landsc. Urban Plan. 2018, 180, 148–160. [Google Scholar] [CrossRef]
  31. Son, Y.J.; Chun, C. Research on Electroencephalogram to Measure Thermal Pleasure in Thermal Alliesthesia in Temperature Step-Change Environment. Indoor Air 2018, 28, 916–923. [Google Scholar] [CrossRef] [PubMed]
  32. Ye, B.; Gao, J.; Fu, H. Associations between Lifestyle, Physical and Social Environments and Frailty among Chinese Older People: A Multilevel Analysis. BMC Geriatr. 2018, 18, 314. [Google Scholar] [CrossRef] [PubMed]
  33. Briggs, A.C.; Black, A.W.; Lucas, F.L.; Siewers, A.E.; Fairfield, K.M. Association between the Food and Physical Activity Environment, Obesity, and Cardiovascular Health across Maine Counties. BMC Public Health 2019, 19, 374. [Google Scholar] [CrossRef] [PubMed]
  34. De Keijzer, C.; Tonne, C.; Sabia, S.; Basagaña, X.; Valentín, A.; Singh-Manoux, A.; Antó, J.M.; Alonso, J.; Nieuwenhuijsen, M.J.; Sunyer, J.; et al. Green and Blue Spaces and Physical Functioning in Older Adults: Longitudinal Analyses of the Whitehall II Study. Environ. Int. 2019, 122, 346–356. [Google Scholar] [CrossRef] [PubMed]
  35. Verma, D.; Jana, A.; Ramamritham, K. Predicting Human Perception of the Urban Environment in a Spatiotemporal Urban Setting Using Locally Acquired Street View Images and Audio Clips. Build. Environ. 2020, 186, 107340. [Google Scholar] [CrossRef]
  36. Reichert, M.; Braun, U.; Lautenbach, S.; Zipf, A.; Ebner-Priemer, U.; Tost, H.; Meyer-Lindenberg, A. Studying the Impact of Built Environments on Human Mental Health in Everyday Life: Methodological Developments, State-of-the-Art and Technological Frontiers. Curr. Opin. Psychol. 2020, 32, 158–164. [Google Scholar] [CrossRef] [PubMed]
  37. Lee, E.Y.; Choi, J.; Lee, S.; Choi, B.Y. Objectively Measured Built Environments and Cardiovascular Diseases in Middle-Aged and Older Korean Adults. Int. J. Environ. Res. Public Health 2021, 18, 1861. [Google Scholar] [CrossRef] [PubMed]
  38. Zhang, Z.X.; Amegbor, P.M.; Sigsgaard, T.; Sabel, C.E. Assessing the association between urban features and human physiological stress response using wearable sensors in different urban contexts. Health Place 2022, 78, 102924. [Google Scholar] [CrossRef] [PubMed]
  39. Paül I Agustí, D.; Guilera, T.; Guerrero Lladós, M. Gender Differences between the Emotions Experienced and Those Identified in an Urban Space, Based on Heart Rate Variability. Cities 2022, 131, 104000. [Google Scholar] [CrossRef]
  40. Koreny, M.; Arbillaga-Etxarri, A.; Bosch De Basea, M.; Foraster, M.; Carsin, A.-E.; Cirach, M.; Gimeno-Santos, E.; Barberan-Garcia, A.; Nieuwenhuijsen, M.; Vall-Casas, P.; et al. Urban Environment and Physical Activity and Capacity in Patients with Chronic Obstructive Pulmonary Disease. Environ. Res. 2022, 214, 113956. [Google Scholar] [CrossRef] [PubMed]
  41. Frehlich, L.; Christie, C.D.; Ronksley, P.E.; Turin, T.C.; Doyle-Baker, P.; McCormack, G.R. The Neighbourhood Built Environment and Health-Related Fitness: A Narrative Systematic Review. Int. J. Behav. Nutr. Phys. Act. 2022, 19, 124. [Google Scholar] [CrossRef] [PubMed]
  42. Westenhöfer, J.; Nouri, E.; Reschke, M.L.; Seebach, F.; Buchcik, J. Walkability and Urban Built Environments—A Systematic Review of Health Impact Assessments (HIA). BMC Public Health 2023, 23, 518. [Google Scholar] [CrossRef] [PubMed]
  43. Elsadek, M.; Deshun, Z.; Liu, B. High-Rise Window Views: Evaluating the Physiological and Psychological Impacts of Green, Blue, and Built Environments. Build. Environ. 2024, 262, 111798. [Google Scholar] [CrossRef]
  44. Tian, T.; Huang, S.; Wu, Y.; Zeng, P.; Liu, Y.; Che, Y. Non-Ecological Factors Affect Human Interaction with Urban Nature and Perception of Cultural Ecosystem Services. Sustain. Cities Soc. 2024, 112, 105643. [Google Scholar] [CrossRef]
  45. Gu, K.; Jing, Y.; Tang, J.; Jia, X.; Zhang, X.; Wang, B. Hypertension Risk Pathways in Urban Built Environment: The Case of Yuhui District, Bengbu City, China. Front. Public Health 2024, 12, 1443416. [Google Scholar] [CrossRef] [PubMed]
  46. Patwary, M.M.; Sakhvidi, M.J.Z.; Ashraf, S.; Dadvand, P.; Browning, M.H.E.M.; Alam, M.A.; Bell, M.L.; James, P.; Astell-Burt, T. Impact of Green Space and Built Environment on Metabolic Syndrome: A Systematic Review with Meta-Analysis. Sci. Total Environ. 2024, 923, 170977. [Google Scholar] [CrossRef] [PubMed]
  47. Wu, S.; Wu, S.; Chen, J.; Pan, C. An Interpretable Machine Learning Approach to Studying Environmental Safety Perception among Elderly Residents in Pocket Parks. Buildings 2025, 15, 3411. [Google Scholar] [CrossRef]
  48. Meijer, P.; Liu, M.; Lam, T.M.; Koop, Y.; Pinho, M.G.M.; Vaartjes, I.; Beulens, J.W.; Grobbee, D.E.; Lakerveld, J.; Timmermans, E.J. Changes in Neighbourhood Walkability and Incident CVD: A Population-Based Cohort Study of Three Million Adults Covering 24 Years. Environ. Res. 2025, 274, 121367. [Google Scholar] [CrossRef] [PubMed]
  49. Ji, W.; Yang, L.; Liu, Z.; Feng, S. A Systematic Review of Sensing Technology in Human-Building Interaction Research. Buildings 2023, 13, 691. [Google Scholar] [CrossRef]
  50. Heikenfeld, J.; Jajack, A.; Rogers, J.; Gutruf, P.; Tian, L.; Pan, T.; Li, R.; Khine, M.; Kim, J.; Wang, J.; et al. Wearable Sensors: Modalities, Challenges, and Prospects. Lab Chip 2018, 18, 217–248. [Google Scholar] [CrossRef] [PubMed]
  51. Zhao, W.; Tan, L.; Niu, S.; Qing, L. Assessing the Impact of Street Visual Environment on the Emotional Well-Being of Young Adults through Physiological Feedback and Deep Learning Technologies. Buildings 2024, 14, 1730. [Google Scholar] [CrossRef]
  52. Ozcelik, G.; Becerik-Gerber, B. Benchmarking Thermoception in Virtual Environments to Physical Environments for Understanding Human-Building Interactions. Adv. Eng. Inform. 2018, 36, 254–263. [Google Scholar] [CrossRef]
  53. Maffei, L.; Masullo, M.; Pascale, A.; Ruggiero, G.; Romero, V.P. Immersive Virtual Reality in Community Planning: Acoustic and Visual Congruence of Simulated vs Real World. Sustain. Cities Soc. 2016, 27, 338–345. [Google Scholar] [CrossRef]
  54. Heydarian, A.; Carneiro, J.P.; Gerber, D.; Becerik-Gerber, B.; Hayes, T.; Wood, W. Immersive Virtual Environments versus Physical Built Environments: A Benchmarking Study for Building Design and User-Built Environment Explorations. Autom. Constr. 2015, 54, 116–126. [Google Scholar] [CrossRef]
  55. Lee, M.; Kim, S.; Kim, H.; Hwang, S. Pedestrian Visual Satisfaction and Dissatisfaction toward Physical Components of the Walking Environment Based on Types, Characteristics, and Combinations. Build. Environ. 2023, 244, 110776. [Google Scholar] [CrossRef]
  56. Le, Q.H.; Kwon, N.; Nguyen, T.H.; Kim, B.; Ahn, Y. Sensing Perceived Urban Stress Using Space Syntactical and Urban Building Density Data: A Machine Learning-Based Approach. Build. Environ. 2024, 266, 112054. [Google Scholar] [CrossRef]
  57. Baumann, O.; Brooks-Cederqvist, B. Multimodal Assessment of Effects of Urban Environments on Psychological Wellbeing. Heliyon 2023, 9, e16433. [Google Scholar] [CrossRef] [PubMed]
  58. Li, Z.; Wang, K.; Hai, M.; Cai, P.; Zhang, Y. Preliminary Study on Gender Differences in EEG-Based Emotional Responses in Virtual Architectural Environments. Buildings 2024, 14, 2884. [Google Scholar] [CrossRef]
  59. Chen, Z.; Schulz, S.; Qiu, M.; Yang, W.; He, X.; Wang, Z.; Yang, L. Assessing Affective Experience of In-Situ Environmental Walk via Wearable Biosensors for Evidence-Based Design. Cogn. Syst. Res. 2018, 52, 970–977. [Google Scholar] [CrossRef]
  60. Chaudhuri, T.; Zhai, D.; Soh, Y.C.; Li, H.; Xie, L. Random Forest Based Thermal Comfort Prediction from Gender-Specific Physiological Parameters Using Wearable Sensing Technology. Energy Build. 2018, 166, 391–406. [Google Scholar] [CrossRef]
  61. Li, N.; Zhang, S.; Xia, L.; Wu, Y. Investigating the Visual Behavior Characteristics of Architectural Heritage Using Eye-Tracking. Buildings 2022, 12, 1058. [Google Scholar] [CrossRef]
  62. Van Veen, H.A.H.C.; Distler, H.K.; Braun, S.J.; Bülthoff, H.H. Navigating through a Virtual City: Using Virtual Reality Technology to Study Human Action and Perception. Future Gener. Comput. Syst. 1998, 14, 231–242. [Google Scholar] [CrossRef]
  63. Xiong, J.; Hsiang, E.-L.; He, Z.; Zhan, T.; Wu, S.-T. Augmented Reality and Virtual Reality Displays: Emerging Technologies and Future Perspectives. Light-Sci. Appl. 2021, 10, 216. [Google Scholar] [CrossRef] [PubMed]
  64. Yu, C.-P.; Lee, H.-Y.; Luo, X.-Y. The Effect of Virtual Reality Forest and Urban Environments on Physiological and Psychological Responses. Urban For. Urban Green. 2018, 35, 106–114. [Google Scholar] [CrossRef]
  65. Tabrizian, P.; Baran, P.K.; Smith, W.R.; Meentemeyer, R.K. Exploring Perceived Restoration Potential of Urban Green Enclosure through Immersive Virtual Environments. J. Environ. Psychol. 2018, 55, 99–109. [Google Scholar] [CrossRef]
  66. Park, S.H.; Lee, P.J.; Jung, T.; Swenson, A. Effects of the Aural and Visual Experience on Psycho-Physiological Recovery in Urban and Rural Environments. Appl. Acoust. 2020, 169, 107486. [Google Scholar] [CrossRef]
  67. Alamirah, H.; Schweiker, M.; Azar, E. Immersive Virtual Environments for Occupant Comfort and Adaptive Behavior Research—A Comprehensive Review of Tools and Applications. Build. Environ. 2022, 207, 108396. [Google Scholar] [CrossRef]
  68. Ascione, F.; Bianco, N.; De Stasio, C.; Mauro, G.M.; Vanoli, G.P. Artificial Neural Networks to Predict Energy Performance and Retrofit Scenarios for Any Member of a Building Category: A Novel Approach. Energy 2017, 118, 999–1017. [Google Scholar] [CrossRef]
  69. Abu Alsheikh, M.; Lin, S.; Niyato, D.; Tan, H.-P. Machine Learning in Wireless Sensor Networks: Algorithms, Strategies, and Applications. IEEE Commun. Surv. Tutor. 2014, 16, 1996–2018. [Google Scholar] [CrossRef]
  70. Yin, L. Street Level Urban Design Qualities for Walkability: Combining 2D and 3D GIS Measures. Comput. Environ. Urban Syst. 2017, 64, 288–296. [Google Scholar] [CrossRef]
  71. Liu, L.; Silva, E.A.; Wu, C.; Wang, H. A Machine Learning-Based Method for the Large-Scale Evaluation of the Qualities of the Urban Environment. Comput. Environ. Urban Syst. 2017, 65, 113–125. [Google Scholar] [CrossRef]
  72. Bogdanov, V.B.; Marquis-Favre, C.; Cottet, M.; Beffara, B.; Perrin, F.; Dumortier, D.; Ellermeier, W. Nature and the City: Audiovisual Interactions in Pleasantness and Psychophysiological Reactions. Appl. Acoust. 2022, 193, 108762. [Google Scholar] [CrossRef]
  73. Aghanejad, R.; Birenboim, A.; Matthys, M.; Claramunt, S.; Perchoux, C. Stressful Urban Walks: An Experimental Design for Measuring Physiological and Psychological Stress in Virtual Urban Environments. Virtual Real. 2026, 30, 45. [Google Scholar] [CrossRef] [PubMed]
  74. Wu, Y.; Wu, Y.; Pan, Y. Sustainability Optimization Method of Built Environment with Integrated Physical Environment and Virtual Perception Simulation: A Case Study of Campus Open Space. Sustainability 2024, 16, 8936. [Google Scholar] [CrossRef]
  75. Ito, K.; Kang, Y.; Zhang, Y.; Zhang, F.; Biljecki, F. Understanding Urban Perception with Visual Data: A Systematic Review. Cities 2024, 152, 105169. [Google Scholar] [CrossRef]
  76. Posner, J.; Russell, J.A.; Peterson, B.S. The Circumplex Model of Affect: An Integrative Approach to Affective Neuroscience, Cognitive Development, and Psychopathology. Dev. Psychopathol. 2005, 17, 715–734. [Google Scholar] [CrossRef] [PubMed]
  77. Barrett, L.F. The theory of constructed emotion: An active inference account of interoception and categorization. Soc. Cogn. Affect. Neurosci. 2017, 12, 1–23. [Google Scholar] [CrossRef] [PubMed]
  78. Scherer, K.R. What Are Emotions? And How Can They Be Measured? Soc. Sci. Inf. 2005, 44, 695–729. [Google Scholar] [CrossRef]
  79. Helbich, M. Toward Dynamic Urban Environmental Exposure Assessments in Mental Health Research. Environ. Res. 2018, 161, 129–135. [Google Scholar] [CrossRef] [PubMed]
  80. Hänsel, K.; Aiello, L.M.; Quercia, D.; Schifanella, R.; Varga, K.Z.; Dietz, L.W.; Constantinides, M. The Experience of Running: Recommending Routes Using Sensory Mapping in Urban Environments. Int. J. Hum.-Comput. Stud. 2025, 201, 103512. [Google Scholar] [CrossRef]
  81. Yang, S.; Dane, G.; Van Den Berg, P.; Arentze, T. Influences of Cognitive Appraisal and Individual Characteristics on Citizens’ Perception and Emotion in Urban Environment: Model Development and Virtual Reality Experiment. J. Environ. Psychol. 2024, 96, 102309. [Google Scholar] [CrossRef]
  82. Nutsford, D.; Pearson, A.L.; Kingham, S. An Ecological Study Investigating the Association between Access to Urban Green Space and Mental Health. Public Health 2013, 127, 1005–1011. [Google Scholar] [CrossRef] [PubMed]
  83. Jeon, J.Y.; Jo, H.I.; Lee, K. Psycho-Physiological Restoration with Audio-Visual Interactions through Virtual Reality Simulations of Soundscape and Landscape Experiences in Urban, Waterfront, and Green Environments. Sustain. Cities Soc. 2023, 99, 104929. [Google Scholar] [CrossRef]
  84. Chen, Q.; Yan, Y.; Zhang, X.; Chen, J. A Study on the Impact of Built Environment Elements on Satisfaction with Residency Whilst Considering Spatial Heterogeneity. Sustainability 2022, 14, 15011. [Google Scholar] [CrossRef]
  85. Lee, S. Satisfaction with the Pedestrian Environment and Its Relationship to Neighborhood Satisfaction in Seoul, South Korea. Sustainability 2022, 14, 9343. [Google Scholar] [CrossRef]
  86. Joudeh, I.O.; Cretu, A.-M.; Bouchard, S.; Guimond, S. Prediction of Continuous Emotional Measures through Physiological and Visual Data. Sensors 2023, 23, 5613. [Google Scholar] [CrossRef] [PubMed]
  87. Li, X.; Zhang, X.; Jia, T. Humanization of Nature: Testing the Influences of Urban Park Characteristics and Psychological Factors on Collegers’ Perceived Restoration. Urban For. Urban Green. 2023, 79, 127806. [Google Scholar] [CrossRef]
  88. Wu, Y.; Zhou, W.; Zhang, H.; Liu, Q.; Yan, Z.; Lan, S. Relationships between Green Space Perceptions, Green Space Use, and the Multidimensional Health of Older People: A Case Study of Fuzhou, China. Buildings 2024, 14, 1544. [Google Scholar] [CrossRef]
  89. Poulain, T.; Sobek, C.; Ludwig, J.; Igel, U.; Grande, G.; Ott, V.; Kiess, W.; Körner, A.; Vogel, M. Associations of Green Spaces and Streets in the Living Environment with Outdoor Activity, Media Use, Overweight/Obesity and Emotional Wellbeing in Children and Adolescents. Int. J. Environ. Res. Public Health 2020, 17, 6321. [Google Scholar] [CrossRef] [PubMed]
  90. Ren, H.; Wang, X.; Zhang, J.; Zhang, L.; Wang, Q. Evaluation of Rural Healing Landscape DESIGN Based on Virtual Reality and Electroencephalography. Buildings 2024, 14, 1560. [Google Scholar] [CrossRef]
  91. Liang, X.; Chang, J.H.; Gao, S.; Zhao, T.; Biljecki, F. Evaluating Human Perception of Building Exteriors Using Street View Imagery. Build. Environ. 2024, 263, 111875. [Google Scholar] [CrossRef]
  92. Fancello, G.; Vallée, J.; Sueur, C.; Van Lenthe, F.J.; Kestens, Y.; Montanari, A.; Chaix, B. Micro Urban Spaces and Mental Well-Being: Measuring the Exposure to Urban Landscapes along Daily Mobility Paths and Their Effects on Momentary Depressive Symptomatology among Older Population. Environ. Int. 2023, 178, 108095. [Google Scholar] [CrossRef] [PubMed]
  93. Zhu, Y.; Du, R. Evaluating the Impact of Urban Landscape Elements on the Sense of Security and Local Belonging-Case Study: Tongdejie, China. Front. Environ. Sci. 2024, 12, 1340394. [Google Scholar] [CrossRef]
  94. Wu, Y.; Wang, L.; Yu, J.; Chen, P.; Wang, A. Improving the Restorative Potential of Living Environments by Optimizing the Spatial Luminance Distribution. Buildings 2023, 13, 1708. [Google Scholar] [CrossRef]
  95. Huang, J.; Song, Y.; Sheng, Y.; Zhang, Y.; Hu, D. Restorative Potential Assessment of Public Open Space in Old Urban Communities in the Context of Aging—A Case Study of Dabeizhuang Community in Maanshan, China. Buildings 2024, 14, 2671. [Google Scholar] [CrossRef]
  96. Korpela, K.M.; Ylen, M.; Tyrvainen, L.; Silvennoinen, H. Favorite Green, Waterside and Urban Environments, Restorative Experiences and Perceived Health in Finland. Health Promot. Int. 2010, 25, 200–209. [Google Scholar] [CrossRef] [PubMed]
  97. Sedghikhanshir, A.; Zhu, Y.; Beck, M.R.; Jafari, A. The Impact of Visual Stimuli and Properties on Restorative Effect and Human Stress: A Literature Review. Buildings 2022, 12, 1781. [Google Scholar] [CrossRef]
  98. Zhang, X.; Lin, E.S.; Yin, J.; Tan, P.Y. Comparison of Urban Spatial Features Associated with Mental Health and Restorative Quality in Residential Neighborhoods. Urban For. Urban Green. 2025, 112, 128975. [Google Scholar] [CrossRef]
  99. Zhang, X.; Shu, R.; Dong, J.; Hu, S.; Tong, Z.; Zhang, X.; Guan, H. Effects of Nature Sounds at Different Sound Levels on the Recovery from Noise-Induced Stress. Build. Environ. 2025, 285, 113573. [Google Scholar] [CrossRef]
  100. Xu, L.; Han, H.; Yang, C.; Liu, Q. The Influence Mechanism of the Community Subjectively Built Environment on the Physical and Mental Health of Older Adults. Sustainability 2023, 15, 13211. [Google Scholar] [CrossRef]
  101. Raisi, R.; Faizi, M.; Khakzand, M. A Systematic Review Framework for Environmental Security Indicators in Neuro-Urbanism and Neuro-Landscape Contexts. Build. Environ. 2025, 284, 113428. [Google Scholar] [CrossRef]
  102. Rahimi, F.B.; Levy, R.M.; Boyd, J.E.; Dadkhahfard, S. Human behaviour and cognition of spatial experience; a model for enhancing the quality of spatial experiences in the built environment. Int. J. Ind. Ergon. 2018, 68, 245–255. [Google Scholar] [CrossRef]
  103. Kwon, J.-H.; Kim, J.; Kim, S.; Cho, G.-H. Pedestrians Safety Perception and Crossing Behaviors in Narrow Urban Streets: An Experimental Study Using Immersive Virtual Reality Technology. Accid. Anal. Prev. 2022, 174, 106757. [Google Scholar] [CrossRef] [PubMed]
  104. Shach-Pinsly, D. Measuring Security in the Built Environment: Evaluating Urban Vulnerability in a Human-Scale Urban Form. Landsc. Urban Plan. 2019, 191, 103412. [Google Scholar] [CrossRef]
  105. Dong, H.; Qin, B. Exploring the Link between Neighborhood Environment and Mental Wellbeing: A Case Study in Beijing, China. Landsc. Urban Plan. 2017, 164, 71–80. [Google Scholar] [CrossRef]
  106. Tavakoli, A.; Douglas, I.P.; Noh, H.Y.; Hwang, J.; Billington, S.L. Psycho-Behavioral Responses to Urban Scenes: An Exploration through Eye-Tracking. Cities 2025, 156, 105568. [Google Scholar] [CrossRef]
  107. Elser, H.; Kruse, C.F.G.; Schwartz, B.S.; Casey, J.A. The Environment and Headache: A Narrative Review. Curr. Environ. Health Rep. 2024, 11, 184–203. [Google Scholar] [CrossRef] [PubMed]
  108. Xiao, J.; Zhao, J.; Luo, Z.; Liu, F.; Greenwood, D. The Impact of Built Environment on Mental Health: A COVID-19 Lockdown Perspective. Health Place 2022, 77, 102889. [Google Scholar] [CrossRef] [PubMed]
  109. Figueiredo, M.; Eloy, S.; Marques, S.; Dias, L. Older People Perceptions on the Built Environment: A Scoping Review. Appl. Ergon. 2023, 108, 103951. [Google Scholar] [CrossRef] [PubMed]
  110. Hu, M.; Simon, M.; Fix, S.; Vivino, A.A.; Bernat, E. Exploring a Sustainable Building’s Impact on Occupant Mental Health and Cognitive Function in a Virtual Environment. Sci. Rep. 2021, 11, 5644. [Google Scholar] [CrossRef] [PubMed]
  111. Lee, S.; Byun, G.; Ha, M. Exploring the Association between Environmental Factors and Fear of Crime in Residential Streets: An Eye-Tracking and Questionnaire Study. J. Asian Archit. Build. Eng. 2024, 23, 1518–1535. [Google Scholar] [CrossRef]
  112. Jiao, Y.; Wang, X.; Kang, Y.; Zhong, Z.; Chen, W. A Quick Identification Model for Assessing Human Anxiety and Thermal Comfort Based on Physiological Signals in a Hot and Humid Working Environment. Int. J. Ind. Ergon. 2023, 94, 103423. [Google Scholar] [CrossRef]
  113. Yin, J.; Zhu, S.; MacNaughton, P.; Allen, J.G.; Spengler, J.D. Physiological and Cognitive Performance of Exposure to Biophilic Indoor Environment. Build. Environ. 2018, 132, 255–262. [Google Scholar] [CrossRef]
  114. D’Acci, L.S. Preferring or Needing Cities? (Evolutionary) Psychology, Utility and Life Satisfaction of Urban Living. City Cult. Soc. 2021, 24, 100375. [Google Scholar] [CrossRef]
  115. Honold, J.; Beyer, R.; Lakes, T.; Van Der Meer, E. Multiple Environmental Burdens and Neighborhood-Related Health of City Residents. J. Environ. Psychol. 2012, 32, 305–317. [Google Scholar] [CrossRef]
  116. Gascon, M.; Triguero-Mas, M.; Martínez, D.; Dadvand, P.; Forns, J.; Plasència, A.; Nieuwenhuijsen, M. Mental Health Benefits of Long-Term Exposure to Residential Green and Blue Spaces: A Systematic Review. Int. J. Environ. Res. Public Health 2015, 12, 4354–4379. [Google Scholar] [CrossRef] [PubMed]
  117. Gong, K.; Wang, C.; Yin, J. Effects of the Natural Environment on the Subjective and Psychological Well-Being of Older People in the Community in China. Buildings 2024, 14, 2854. [Google Scholar] [CrossRef]
  118. Bower, M.; Kent, J.; Patulny, R.; Green, O.; McGrath, L.; Teesson, L.; Jamalishahni, T.; Sandison, H.; Rugel, E. The Impact of the Built Environment on Loneliness: A Systematic Review and Narrative Synthesis. Health Place 2023, 79, 102962. [Google Scholar] [CrossRef] [PubMed]
  119. Kabisch, N.; Püffel, C.; Masztalerz, O.; Hemmerling, J.; Kraemer, R. Physiological and Psychological Effects of Visits to Different Urban Green and Street Environments in Older People: A Field Experiment in a Dense Inner-City Area. Landsc. Urban Plan. 2021, 207, 103998. [Google Scholar] [CrossRef]
  120. Gijsbers, D.; Berg, P.V.D.; Kemperman, A. Built Environment Influences on Emotional State Loneliness among Young Adults during Daily Activities: An Experience Sampling Approach. Buildings 2024, 14, 3199. [Google Scholar] [CrossRef]
  121. Ünal, A.B.; Pals, R.; Steg, L.; Siero, F.W.; Van Der Zee, K.I. Is Virtual Reality a Valid Tool for Restorative Environments Research? Urban For. Urban Green. 2022, 74, 127673. [Google Scholar] [CrossRef]
  122. Bornioli, A.; Parkhurst, G.; Morgan, P.L. The Psychological Wellbeing Benefits of Place Engagement during Walking in Urban Environments: A Qualitative Photo-Elicitation Study. Health Place 2018, 53, 228–236. [Google Scholar] [CrossRef] [PubMed]
  123. Sun, L.; Ding, S.; Ren, Y.; Li, M.; Wang, B. Research on the Material and Spatial Psychological Perception of the Side Interface of an Underground Street Based on Virtual Reality. Buildings 2022, 12, 1432. [Google Scholar] [CrossRef]
  124. Koohsari, M.J.; Shibata, A.; Ishii, K.; Kurosawa, S.; Yasunaga, A.; Hanibuchi, T.; Nakaya, T.; Mavoa, S.; McCormack, G.R.; Oka, K. Built Environment Correlates of Objectively-Measured Sedentary Behaviours in Densely-Populated Areas. Health Place 2020, 66, 102447. [Google Scholar] [CrossRef] [PubMed]
  125. Patel, N.; Nguyen, H.-H.; Van De Geest, J.; Wagtendonk, A.; Raju, M.J.S.; Dadvand, P.; De Hoogh, K.; Cirach, M.; Nieuwenhuijsen, M.; Lam, T.M.; et al. A Walk across Europe: Development of a High-Resolution Walkability Index. Health Place 2025, 96, 103544. [Google Scholar] [CrossRef] [PubMed]
  126. Howell, N.A.; Booth, G.L. The Weight of Place: Built Environment Correlates of Obesity and Diabetes. Endocr. Rev. 2022, 43, 966–983. [Google Scholar] [CrossRef] [PubMed]
  127. Shrestha, S.; Turrell, G.; Dale, M.J.; Carroll, S.J. Associations between the Built Environment and Adult Obesity and the Mediating Role of Physical Activity: A Systematic Review. Obes. Rev. 2025, 26, e13944. [Google Scholar] [CrossRef] [PubMed]
  128. Mueller, W.; Milner, J.; Loh, M.; Vardoulakis, S.; Wilkinson, P. Exposure to Urban Greenspace and Pathways to Respiratory Health: An Exploratory Systematic Review. Sci. Total Environ. 2022, 829, 154447. [Google Scholar] [CrossRef] [PubMed]
  129. Den Braver, N.R.; Lakerveld, J.; Rutters, F.; Schoonmade, L.J.; Brug, J.; Beulens, J.W.J. Built Environmental Characteristics and Diabetes: A Systematic Review and Meta-Analysis. BMC Med. 2018, 16, 12. [Google Scholar] [CrossRef] [PubMed]
  130. Lam, T.M.; Wang, Z.; Vaartjes, I.; Karssenberg, D.; Ettema, D.; Helbich, M.; Timmermans, E.J.; Frank, L.D.; Den Braver, N.R.; Wagtendonk, A.J.; et al. Development of an Objectively Measured Walkability Index for the Netherlands. Int. J. Behav. Nutr. Phys. Act. 2022, 19, 50. [Google Scholar] [CrossRef] [PubMed]
  131. Song, Y.; Liu, Y.; Bai, X.; Yu, H. Effects of Neighborhood Built Environment on Cognitive Function in Older Adults: A Systematic Review. BMC Geriatr. 2024, 24, 194. [Google Scholar] [CrossRef] [PubMed]
  132. Booth, G.L.; Creatore, M.I.; Moineddin, R.; Gozdyra, P.; Weyman, J.T.; Matheson, F.I.; Glazier, R.H. Unwalkable Neighborhoods, Poverty, and the Risk of Diabetes among Recent Immigrants to Canada Compared with Long-Term Residents. Diabetes Care 2013, 36, 302–308. [Google Scholar] [CrossRef] [PubMed]
  133. Wang, X.; Feng, B.; Wang, J. Green Spaces, Blue Spaces and Human Health: An Updated Umbrella Review of Epidemiological Meta-Analyses. Front. Public Health 2025, 13, 1505292. [Google Scholar] [CrossRef] [PubMed]
  134. Münzel, T.; Hahad, O.; Sørensen, M.; Lelieveld, J.; Duerr, G.D.; Nieuwenhuijsen, M.; Daiber, A. Environmental Risk Factors and Cardiovascular Diseases: A Comprehensive Expert Review. Cardiovasc. Res. 2022, 118, 2880–2902. [Google Scholar] [CrossRef] [PubMed]
  135. Liu, M.; Ye, Z.; He, P.; Yang, S.; Zhang, Y.; Zhou, C.; Zhang, Y.; Gan, X.; Qin, X. Relations of Residential Green and Blue Spaces with New-Onset Chronic Kidney Disease. Sci. Total Environ. 2023, 869, 161788. [Google Scholar] [CrossRef] [PubMed]
  136. Lercher, P.; Dzhambov, A.M.; Persson Waye, K. Environmental Perceptions, Self-Regulation, and Coping with Noise Mediate the Associations between Children’s Physical Environment and Sleep and Mental Health Problems. Environ. Res. 2025, 264, 120414. [Google Scholar] [CrossRef] [PubMed]
  137. Kesavayuth, D.; Zikos, V. Mental Health and Obesity. Appl. Econ. Anal. 2024, 32, 41–61. [Google Scholar] [CrossRef]
  138. Gaston, S.A.; Sweeney, M.; Patel, S.; Jennings, V.; Bratman, G.N.; Martinez-Miller, E.; Braxton Jackson, W.; Jones, R.R.; James, P.; Grigsby-Toussaint, D.; et al. Greenspace Proximity in Relation to Sleep Health among a Racially and Ethnically Diverse Cohort of US Women. Environ. Res. 2025, 279, 121698. [Google Scholar] [CrossRef] [PubMed]
  139. Wang, L.; Sun, W.; Zhou, K.; Zhang, M.; Bao, P. Spatial Analysis of Built Environment Risk for Respiratory Health and Its Implication for Urban Planning: A Case Study of Shanghai. Int. J. Environ. Res. Public Health 2019, 16, 1455. [Google Scholar] [CrossRef] [PubMed]
  140. Stucki, L.; Helte, E.; Axelsson, Ö.; Selander, J.; Lõhmus, M.; Åkesson, A.; Eriksson, C. Long-Term Exposure to Air Pollution, Road Traffic Noise and Greenness, and Incidence of Myocardial Infarction in Women. Environ. Int. 2024, 190, 108878. [Google Scholar] [CrossRef] [PubMed]
  141. Yeager, R.; Keith, R.J.; Riggs, D.W.; Fleischer, D.; Browning, M.H.E.M.; Ossola, A.; Walker, K.L.; Hart, J.L.; Srivastava, S.; Rai, S.N.; et al. Intra-Neighborhood Associations between Residential Greenness and Blood Pressure. Sci. Total Environ. 2024, 946, 173788. [Google Scholar] [CrossRef] [PubMed]
  142. Cerin, E.; Chan, Y.; Symmons, M.; Soloveva, M.; Martino, E.; Shaw, J.E.; Knibbs, L.D.; Jalaludin, B.; Barnett, A. Associations of the Neighbourhood Built and Natural Environment with Cardiometabolic Health Indicators: A Cross-Sectional Analysis of Environmental Moderators and Behavioural Mediators. Environ. Res. 2024, 240, 117524. [Google Scholar] [CrossRef] [PubMed]
  143. Nguyen, P.-Y.; Astell-Burt, T.; Rahimi-Ardabili, H.; Feng, X. Green Space Quality and Health: A Systematic Review. Int. J. Environ. Res. Public Health 2021, 18, 11028. [Google Scholar] [CrossRef] [PubMed]
  144. Zhang, J.; Shen, P.; Wang, Y.; Li, Z.; Xu, L.; Qiu, J.; Hu, J.; Yang, Z.; Wu, Y.; Zhu, Z.; et al. Interaction between Walkability and Fine Particulate Matter on Ischemic Heart Disease: A Prospective Cohort Study in China. Ecotoxicol. Environ. Saf. 2025, 290, 117520. [Google Scholar] [CrossRef] [PubMed]
  145. Wang, C.; Sun, X.; Wang, Y.; Bai, Z.; Kang, L.; Xu, B.; Jin, J.; Cao, J.; Mao, Y.; Wei, X.; et al. Associations among Vegetation Cover, Particulate Matter, and Cardiovascular Health in Urban Environments: A Path Analysis. Front. Plant Sci. 2025, 16, 1659005. [Google Scholar] [CrossRef] [PubMed]
  146. Hohmann, C.; Bieker, S.; Truffer, B. Breaking out of the Silo: Collaborative Approaches to Implementing Blue-Green Infrastructure in Urban Areas. Blue-Green Syst. 2025, 7, 95–109. [Google Scholar] [CrossRef]
  147. Sainz-Santamaria, J.; Martinez-Cruz, A.L. Adaptive Governance of Urban Green Spaces across Latin America—Insights amid COVID-19. Urban For. Urban Green. 2022, 74, 127629. [Google Scholar] [CrossRef] [PubMed]
  148. Nguyen, Q.C.; Tasdizen, T.; Alirezaei, M.; Mane, H.; Yue, X.; Merchant, J.S.; Yu, W.; Drew, L.; Li, D.; Nguyen, T.T. Neighborhood Built Environment, Obesity, and Diabetes: A Utah Siblings Study. SSM-Popul. Health 2024, 26, 101670. [Google Scholar] [CrossRef] [PubMed]
  149. Rigo, A.; Pisani, E.; Secco, L. Integrating Green Care Initiatives into Conventional Health Systems: Which Governance Dimensions Can Guide This Process? Int. J. Environ. Res. Public Health 2025, 22, 202. [Google Scholar] [CrossRef] [PubMed]
  150. Gayles, J.G.; Chilenski, S.M.; Penilla, M.L.; Lin, S.; Galinsky, M.; Villarruel, F.; Johnson, P.; Henderson, C.; Newell, J. Organizational Arrangements in Evidence2Success Communities: Enabling Sustainable Community Transformation for Youth Well-Being. Societies 2026, 16, 169. [Google Scholar] [CrossRef]
  151. Moulaert, F.; Swyngedouw, E.; Martinelli, F.; González, S. (Eds.) Can Neighbourhoods Save the City? In Community Development and Social Innovation; Routledge: London, UK, 2010. [Google Scholar] [CrossRef]
  152. Le Galès, P.; Vitale, T. Governing the Large Metropolis. A Research Agenda. 2013. Available online: https://sciencespo.hal.science/hal-01070523 (accessed on 18 May 2025).
  153. World Health Organization. Constitution of the World Health Organization; World Health Organization: Geneva, Switzerland, 1948. [Google Scholar]
  154. World Health Organization. Mental Health and Social Connections; World Health Organization: Geneva, Switzerland, 2025. [Google Scholar]
  155. Keyes, C.L.M. Social well-being. Soc. Psychol. Q. 1998, 61, 121–140. [Google Scholar] [CrossRef] [PubMed]
  156. Qi, J.; Mazumdar, S.; Vasconcelos, A.C. Understanding the Relationship between Urban Public Space and Social Cohesion: A Systematic Review. Int. J. Community Well-Being 2024, 7, 155–212. [Google Scholar] [CrossRef]
  157. Theall, K.P.; Wallace, J.; Tucker, A.; Wu, K.; Walker, B.; Gustat, J.; Kondo, M.; Morrison, C.; Pealer, C.; Branas, C.C.; et al. Building a culture of health through the built environment: Impact of a cluster randomized trial remediating vacant and abandoned property on health mindsets. J. Urban Health 2025, 102, 259–273. [Google Scholar] [CrossRef] [PubMed]
  158. Maffei, J.; Thompson, R.L.; Wyka, K.E.; Tsui, E.; Cohen, N.; Sabounchi, N.; Huang, T.T.-K. Associations between Use of Renovated Urban Parks and Perceptions of Social Cohesion in Diverse New York City Communities. Discov. Public Health 2026, 23, 172. [Google Scholar] [CrossRef] [PubMed]
  159. Ramos-Vidal, I.; De La Ossa, E.D. A Systematic Review to Determine the Role of Public Space and Urban Design on Sense of Community. Int. Soc. Sci. J. 2024, 74, 633–655. [Google Scholar] [CrossRef]
  160. Forrest, R.; Kearns, A. Social Cohesion, Social Capital and the Neighbourhood. Urban Stud. 2001, 38, 2125–2143. [Google Scholar] [CrossRef]
  161. Diez Roux, A.V.; Mair, C. Neighborhoods and Health. Ann. N. Y. Acad. Sci. 2010, 1186, 125–145. [Google Scholar] [CrossRef] [PubMed]
  162. Marmot, M. Social determinants of health inequalities. Lancet 2005, 365, 1099–1104. [Google Scholar] [CrossRef] [PubMed]
  163. Cummins, S.; Macintyre, S. Food environments and obesity—neighbourhood or nation? Int. J. Epidemiol. 2006, 35, 100–104. [Google Scholar] [CrossRef] [PubMed]
  164. Macintyre, S.; Ellaway, A.; Cummins, S. Place Effects on Health: How Can We Conceptualise, Operationalise and Measure Them? Soc. Sci. Med. 2002, 55, 125–139. [Google Scholar] [CrossRef] [PubMed]
  165. Baeten, G.; Listerborn, C.; Persdotter, M.; Pull, E. (Eds.) Housing Displacement: Conceptual and Methodological Issues, 1st ed.; Routledge: London, UK, 2020; ISBN 978-0-429-42704-6. [Google Scholar]
  166. Biswas, S.; Barman, P.; Alam, A. Global Trend of Environmental Health Research: A Comprehensive Bibliometric Analysis. In Population, Environment and Disease; Alam, A., Rukhsana, Biswas, S., Islam, N., Roy, R., Eds.; Springer Nature: Cham, Switzerland, 2024; pp. 21–47. ISBN 978-3-031-67623-9. [Google Scholar]
  167. Wolch, J.R.; Byrne, J.; Newell, J.P. Urban Green Space, Public Health, and Environmental Justice: The Challenge of Making Cities ‘Just Green Enough’. Landsc. Urban Plan. 2014, 125, 234–244. [Google Scholar] [CrossRef]
  168. Spielman, S.E.; Yoo, E. The spatial dimensions of neighborhood effects. Soc. Sci. Med. 2009, 68, 1098–1105. [Google Scholar] [CrossRef] [PubMed]
  169. Kwan, M.-P. The Uncertain Geographic Context Problem. Ann. Assoc. Am. Geogr. 2012, 102, 958–968. [Google Scholar] [CrossRef]
  170. Tuan, Y.-F. Space and Place: The Perspective of Experience; University of Minnesota Press: Minneapolis, MN, USA, 1977. [Google Scholar]
  171. Brenner, N. New Urban Spaces: Urban Theory and the Scale Question; Oxford University Press: New York, NY, USA, 2019; pp. 1–476. [Google Scholar] [CrossRef]
  172. Storper, M.; Scott, A.J. Current Debates in Urban Theory: A Critical Assessment. Urban Stud. 2016, 53, 1114–1136. [Google Scholar] [CrossRef]
  173. Ristić Trajković, J.; Krstić, V.; Nikezić, A.; Petrović, R.; Ilić Gajić, J. Beyond Green: Toward Architectural and Urban Design Scenarios for Therapeutic Landscapes. Land 2026, 15, 114. [Google Scholar] [CrossRef]
  174. Hunter, R.F.; Cleland, C.; Cleary, A.; Droomers, M.; Wheeler, B.W.; Sinnett, D.; Nieuwenhuijsen, M.J.; Braubach, M. Environmental, Health, Wellbeing, Social and Equity Effects of Urban Green Space Interventions: A Meta-Narrative Evidence Synthesis. Environ. Int. 2019, 130, 104923. [Google Scholar] [CrossRef] [PubMed]
Figure 1. A network visualization of keyword co-occurrence (data from Web of Science (2003–2025), analyzed and visualized using VOSviewer 1.6.20).
Buildings 16 02611 g001
Figure 2. Annual pre-screening publications from 2008 to 2025 (earlier years omitted due to negligible output).
Buildings 16 02611 g002
Figure 3. The process of literature selection.
Buildings 16 02611 g003
Figure 4. Timeline of research method (2003–present).
Buildings 16 02611 g004
Figure 5. Technology–Indicator–Response alluvial diagram of built environment and psychological responses.
Buildings 16 02611 g005
Figure 6. Technology–Indicator–Reaction alluvial diagram of built environment and physiological outcomes.
Buildings 16 02611 g006
Figure 7. Directed acyclic graph (DAG) of the assumed pathways between built environment and health outcomes (pathways from reviewed studies; arrows indicate associations; visualized using DAGitty v3.1, https://dagitty.net (accessed on 15 June 2026)).
Buildings 16 02611 g007
Figure 8. Built environment and psychological health impact pathway diagram.
Buildings 16 02611 g008
Figure 9. Built environment and physiological health impact pathway diagram.
Buildings 16 02611 g009
Table 1. Summary of relevant review studies (n = 69).
Author Name (Year)Physical and Mental StatusPositive/NegativeHealth ClassificationOutdoor Built EnvironmentErgonomic
Karin Laumann (2003)Relaxation, AttentionPositivePsychologyPhysical and Nature EnvironmentElectrocardiograph
I.D. Bishop (2003) [5]Activity, NaturalnessPositivePsychologyDaytime and Nighttime EnvironmentVR System
Christine M. Hoehner (2005) [13]Physical AbilityNegativePhysiologyFacilities, TrafficTelephone Interview Tool
H.F. Guite (2006)Depression, DizzinessNegativePsychologyFacilities, Green SpaceQuestionnaire
Qing Zhang (2009)Anger, FearNegativePsychologyColor, Outline, TexturefMRI, EEG, GiST
Dick Saarloos (2009) [26]Physical AbilityPositivePhysiologyWalkability, Connectivity, DensityGlobal Positioning System
Tae-Hoon Kim (2010) [27]Inducement, DepressionNegativePsychologyPhysical and Nature EnvironmentfMRI
Jenny Roe (2011)Energy, ComfortPositivePsychologyPedestrian SpaceHeart Rate Variability (HRV)
Amy Irwin (2011)Pleasure, ComfortPositivePsychologySound Environment (Nature And City)fMRI, ECG, EEG
Cynthia Carlson (2012)Physical AbilityNegativePhysiologyConnectivity, FacilitiesSQ (Self-Questionnaire), BMI
Chorong Song (2013) [14]Anxiety, TensionNegativePsychologyForest Landscape, Urban LandscapeProfile of Mood States (POMS)
Jordan W. Smith (2015)Pleasure, ArousalPositivePsychologySound Environment, VisionVR
Maffei Luig (2015) [28]ConfusionNegativePsychologySound Environment, VisionVR, HMD
Hyunsoo Kim (2016) [15]Safety, PleasurePositivePsychologyStreetIMU, GPS
Ranjit Mohan Anjana (2017)DiabetesNegativePhysiologyStreet, Green SpaceBlood Pressure (BP), Blood Glucose Meter (GM)
Juan Luis Higuera-Trujillo (2017) [29]Pleasure, ArousalPositivePsychologyPhysical EnvironmentEmpatica E4
Fan Zhang (2018) [30]Safety, VitalityPositivePsychologyStreet, BeautyDL, Street View Images (SVI)
Da Li, Carol C. Menassa (2018) [17]PleasurePositivePsychologyTemperature Condition, HumidityFunctional Near-Infrared Spectroscopy Device (fNIRS)
Benjamin (2018)PressureNegativePsychologyStreet, Height, Air QualityEDA, Empatica E4
Young J. Son (2018) [31]PleasurePositivePsychologyTemperature ConditionEEG, ST
Mohammad (2018)Chronic DiseasePositivePhysiologyWalkability, Green SpaceTriaxial Accelerometer (TAA)
Bo Y (2018) [32]Obesity, CVDNegativePhysiologyWalkability, Community QualityFRAIL Scale
Varun Kumar Ojha (2019) [19]Pleasure, RelaxationPositivePsychologyLighting, DustEmpatica E4, Wristband
M. Chandrabose (2019)Obesity, CVDNegativePhysiologyWalkability, AccessibilityEnvironmental Measurement
Michael Francis Norwood (2019) [11]Relaxation, DepressionPositivePsychologyPhysical and Nature EnvironmentEEG, fMRI
Allison C. Briggs (2019) [33]Obesity, CVDPositivePhysiologyDensitySQ, Physical Examination Tool (PA)
Ruoyu Wang (2019) [10]Physical DepressionPositivePhysiologyCommunity Facilities, Green SpaceCenter for Epidemiologic Studies Depression Scale (CES-D)
Carmen de Keijzer (2019) [34]Physical AbilityNegativePhysiologyGreen SpaceTimed Walking Test Tool (TWT)
Tanaya Chaudhuri (2020)PleasurePositivePsychologyAir Quality, Temperature Condition, HumidityST, DL
Kwok Wai Tham (2020)Comfort, ParticipationNegativePsychologyTemperature Condition, HumidityEmpatica E4, PHILIO
Deepank Verma (2020) [35]Depression, BoredomNegativePsychologyStreet, LandscapeSD
Matthew H. E. M. Browning (2020) [20]PressureNegativePsychologyEnclosure DegreeGalvanic Skin Response (GSR), Skin Conductance Level (SCL)
Markus Reichert (2020) [36]Pressure, Depression, DizzinessNegativePsychologyAir Quality, Sound Environment, StreetfNIRS, Magnetoencephalography (MEG)
Lan Wang (2020)Lung Cancer, COPDPositivePhysiologyGreen Space, Industrial LandDatabase
Zhengbo Zou (2021)Pleasure, RelaxationPositivePsychologyVirtual EnvironmentEEG, GSR, PPG
Elena Kalachakra (2021)RelaxationPositivePsychologyTemperature Condition, HumidityOURA, SES
Luyao Xiang (2021)PleasurePositivePsychologyVegetation, Visual RateGPS, SCL
Eun Young Lee (2021) [37]Blood FatPositivePhysiologyCommunity FacilitiesBP, GM
Mariya Geneshka (2021)Depression, Mental DiseaseNegativePsychologyWater Body, Green SpaceSQ
Yunqin Li (2022)Safety, FeasibilityPositivePsychologyVegetation, Sky Enclosure DegreeVR, DL
Zhaoxi Zhang (2022) [38]PleasurePositivePsychologyGreen Space, Water BodyEmpatica E4, GPS
Daniel Paül i Agustí (2022) [39]Fear, DiscomfortNegativePsychologyStreet, Green SpaceHeart Rate (HR)
Jingjing Zhong (2022)Chronic DiseasePositivePhysiologyWalkability, ConnectivityFitbit
Maria Koreny (2022) [40]COPDNegativePhysiologyAir Quality (NO2, PM2.5)GIS, SQ
Levi Frehlich (2022) [41]Physical AbilityNegativePhysiologyWalkability, ConnectivitySelf-Questionnaire (SQ), Bioelectrical Impedance Analyzer (BIA)
Kai Zhang(2023) [4]COPDPositivePhysiologyGreen Space, Air QualityBP, Blood Lactic Acid (BLA)
Sara Eloy (2023)Preference, AttentionNegativePsychologySound EnvironmentVR, Eye Movement Tracker (EM)
Joachim Westenhöfe (2023) [42]BreathPositivePhysiologyCommunity Facilities, Green SpaceBMI, BP
Yi Liao (2023)Physical AbilityNegativePhysiologyPhysical and Nature EnvironmentSQ
Yan Li (2024)Comfort, Restorative propertyPositivePsychologyGreen Space, Garden SpaceSCR, HRV, EEG
Wei Zhao(2024)ArousalPositivePsychologyVisual RateECG, EDA
Mohamed Elsadek (2024) [43]Pleasure, RelaxationPositivePsychologyWater Body, Green SpaceECG, EEG
Wilma Zijlema (2024)Depression, AnxietyNegativePsychologyDensity, Green Space, Air Quality, Traffic ConditionGIS, Land-Use Regression (LUR)
Hélène Niculita-Hirzel (2024) [3]Anxiety, FearNegativePsychologyStreet, DensityGIS
F. S. M. Thompson (2024)PressureNegativePsychologyTransparency, Enclosure DegreeAS
Di Chen (2024) [6]Depression, DizzinessNegativePsychologyGreen SpaceCave Automated Virtual Environment Model, HRV, SCL
Dong Sun (2024) [9]ComfortNegativePsychologyWater Body, Vegetation CoverageEM
Tian Tian (2024) [44]Sense of ValueNegativePsychologyStreet, Water BodyCultural Ecosystem Services (CESs)
Zhiguo Fang (2024)Physical AbilityPositivePhysiologyDensity, Visual RateSQ, BP
Kangkang Gu (2024) [45]Hypertension, Chronic DiseasePositivePhysiologyGreen Space, Leisure SpaceBP
Muhammad (2024) [46]ObesityNegativePhysiologyGreen SpaceSQ
Pouya Molaei (2024)Physical AbilityNegativePhysiologyLand Use Mix and DestinationsGIS, Questionnaire
Shengzhen Wu (2025) [47]Restoration, Safety PerceptionPositivePsychologyWalkability, Road ProportionSemantic Segmentation Tool, ML
Paul Meijer (2025) [48]CVDNegativePhysiologySidewalk Density, WalkabilityGIS, Statistical Analysis
Note: This table presents 69 studies published from 2003 to 2025 in chronological order. Studies with similar factors and methodologies were excluded, while those investigating the same environmental factors using different measurement devices or related indicators were retained. Term Descriptions: (1) fMRI (functional magnetic resonance imaging); (2) GiST (Generalized Search Tree); (3) HMD (Head-Mounted Display, e.g., Z800 3 Dvisor); (4) OURA (Oura Ring—Intelligent Titanium Ring); (5) COPD (Chronic Obstructive Pulmonary Disease).
Table 2. Correlation between built environment and psychological responses (n = 141).
AssociationPositive Response, Restorative Mood Stimulating and ActiveNegative Response, Acute Stress and Chronic StressMeasurement MethodOther Indicators
PleasureRelaxationAnxietyTirednessEEGHeart Rate Variability
ParticipationSafetyTizzyUnpleasantnessECGPupil Activity
Aesthetic valueCalmnessFearBoredomEDA, GSR, SCLSkin Temperature
Leisure valueComfortConfusionDepressionVRBlood Oxygen
SatisfactionRestorationAnger
Repugnance
Pressure
Loneness
MLPulse Rate
Total number80-61-10531
Specific39413545-23
Opposite16283320--
Unrelated-1010-367
Note: (1) Left and right columns indicate high and low arousal, respectively, measurement methods reflect commonly used techniques in the literature; (2) Total number refers to the total count of positive, negative, and other biophysiological indicators, respectively; (3) Specific represents the number of similar emotions or indicators within a column; (4) Opposite: studies on opposite-valence, same-arousal emotions. (5) Unrelated: other emotions or indicators with low frequency, excluded from analysis.
Table 3. Correlation between built environment and physiological outcomes (n = 107).
Analytical ApproachMeasurement MethodEnvironmental FactorHealth OutcomeQuantity
Biosignal sensing/DLBP, BLA, DL (IPTW)Walkability, Green Space, Environmental Noise, WalkabilityCVD32
Biosignal sensing/DLBP, BLA, BMIWalkability, Green Space,
Building Density
Obesity30
Biosignal sensing/DLGM, BP, BLA, DL (IPTW)Walkability, Green Space, Building DensityDiabetes24
Biosignal sensingSpirometry, FeNO, RESP, ECG, EDABlue–Green Space Accessibility, Traffic Environment, Green View IndexLung Cancer COPD22
Biosignal sensingActigraphy, HR, ECGEnvironmental Noise, Green SpaceSleep Health12
Biosignal sensing/DLBP, BLA, DL (IPTW), GISWalkability, Green Space,
Building Density
Metabolic Syndrome7
Notes: (1) 107 articles examined built environment–physical health associations, total cases exceed this count (n > 107) as studies often reported multiple conditions; (2) This table prioritizes frequently reported outcomes to trace non-clinical to clinical transitions, summarizing key environmental indicators and research methods; (3) Listed factors reflect literature trends, not medical conclusions. Term Descriptions: (1) IPTW: Inverse Probability of Treatment Weighting; (2) FeNO: Fractional Exhaled Nitric Oxide.
Disclaimer/Publisher’s Note: The statements, opinions and data contained in all publications are solely those of the individual author(s) and contributor(s) and not of MDPI and/or the editor(s). MDPI and/or the editor(s) disclaim responsibility for any injury to people or property resulting from any ideas, methods, instructions or products referred to in the content.