Article

Upper-Bound Limit Analysis of Slurry Shield Tunnel Face Under Seepage Conditions

1
School of Civil Engineering, Zhengzhou University of Technology, Zhengzhou 450044, China
2
China Railway Engineering Equipment Group Co., Ltd., Zhengzhou 450016, China
*
Author to whom correspondence should be addressed.
Buildings 2026, 16(13), 2561; https://doi.org/10.3390/buildings16132561
Submission received: 5 June 2026 / Revised: 18 June 2026 / Accepted: 23 June 2026 / Published: 26 June 2026
(This article belongs to the Section Building Structures)

Abstract

Ensuring face stability is a pressing concern in slurry shield tunneling under high water pressure. Although slurry infiltration and filter cake formation are known to affect stability, the governing role of seepage forces in the failure mechanisms remains insufficiently understood, and existing models often oversimplify the regulating effect of filter cake permeability. To address this gap, a combined numerical–theoretical approach is developed that explicitly incorporates seepage effects into the failure analysis. A three-dimensional seepage model was developed to simulate transient pore water pressure distribution ahead of the tunnel face, considering filter cake properties, stratum permeability, and applied slurry pressure. Based on the computed seepage field and a wedge-prism composite failure mechanism, an upper-bound limit analysis model was formulated that accounts for the work done by seepage forces. Results reveal a filter cake permeability threshold of 1.0 × 10⁻⁷ m/s, below which further reduction yields negligible stability improvement. Parametric studies quantify the influences of internal friction angle, cohesion, depth-to-diameter ratio, and permeability contrast between soil and filter cake. Validation against field data from the Maliuzhou Tunnel demonstrated that the calculated limit pressures consistently lie below the field-measured slurry pressures, confirming the model’s reliability and its practical utility for guiding slurry pressure selection in complex ground conditions.

1. Introduction

Slurry shield tunneling is the preferred method for constructing subaqueous tunnels in complex hydrogeological strata due to its capability to maintain face stability under high water pressure [1,2]. The technique relies on pressurized slurry to form a low-permeability filter cake on the excavation face, balancing earth and water pressures. However, continuous cutterhead rotation causes recurring cycles of filter cake damage and reformation, leading to unavoidable slurry infiltration into the ground [3,4]. This process alters the seepage field and stress distribution ahead of the face, generating excess pore water pressure and introducing seepage forces that critically influence stability. The governing role of these seepage forces in the failure mechanism, particularly the coupled effect of filter cake and stratum permeability, remains insufficiently understood.
Face stability has been analyzed through theoretical models, numerical simulations [5,6,7], and physical model tests [8,9,10]. Among theoretical approaches, limit equilibrium and limit analysis are widely adopted. Horn [11] proposed the classical wedge–prism failure mode, later extended by Anagnostou and Kovári [12,13] for slurry and earth pressure balance (EPB) shields. The upper-bound theorem offers a rigorous kinematic alternative: Leca and Dormieux [14] introduced a conical collapse mechanism, Soubra [15] refined it into a multi-cone mode, and Subrin and Wong [16] proposed a “Horn Tip” shape. More recently, Liu et al. [17] developed an upper-bound mechanism for partial blowout in large slurry shields. When applied to seepage-coupled problems, limit equilibrium typically treats seepage as a boundary pore pressure condition, whereas upper-bound methods enable direct inclusion of seepage forces as external work—an advantage exploited in this study.
Recent advances have added various complexities. Sun et al. [18] and Zheng et al. [19] employed adaptive lower-bound finite element methods; Di et al. [20] incorporated anisotropic seepage; Hou et al. [21,22] analyzed unsaturated transient conditions; Li et al. [23] and Zhang et al. [24] investigated support pressure under seepage using logarithmic spiral mechanisms. Chen et al. [25] proposed a three-dimensional passive partial failure model, while Yin et al. [26] emphasized the importance of filter cake formation for face stability.
A critical limitation persists: most models simplify slurry pressure as a uniform surface load, neglecting the three-dimensional seepage field induced by slurry infiltration [7,24,27]. Although Broere [28] and Lee et al. [29,30] introduced excess pore pressure into limit equilibrium frameworks, and Perazzelli and Anagnostou et al. [31,32] extended the wedge model using a transverse-slice technique, these approaches did not fully couple seepage force vectors into the mechanical energy balance. The upper-bound theorem has been increasingly adopted for this purpose. Liu [33], Song [34], and Yin [26] embedded seepage effects into three-dimensional failure mechanisms, while Lv et al. [35,36] integrated numerical seepage simulations with a trapezoidal wedge model. Ning et al. [37] recently developed a limit equilibrium model using the infinitesimally thin slice method that explicitly incorporates slurry infiltration-induced excess pore pressure, eliminating a priori assumptions on vertical stress distribution in the failure wedge. Most recently, Pan et al. [38] introduced a heterogeneous dynamic filter cake into upper-bound analysis, demonstrating that spatial and temporal permeability variations significantly affect stability. Concurrently, filter cake formation models have clarified the roles of particle clogging and skeleton compression [39,40]. However, existing studies either treat the filter cake as a perfect membrane or focus on its formation process, without quantifying the impact of its permeability on the three-dimensional failure mode or on the critical slurry pressure.
To address this gap, this study develops a coupled numerical–theoretical framework that explicitly incorporates slurry infiltration effects. The objectives are: (1) to develop a three-dimensional seepage model quantifying transient pore pressure ahead of the face under variable filter cake and stratum permeability; (2) to formulate an upper-bound limit analysis based on a wedge–prism composite failure mechanism, with computed seepage forces integrated as external work; and (3) to derive a closed-form critical slurry pressure solution and validate it against field data from a large-diameter slurry shield tunnel.

2. Methodology

2.1. Three-Dimensional Finite Element Model for the Slurry Shield Tunnel Face

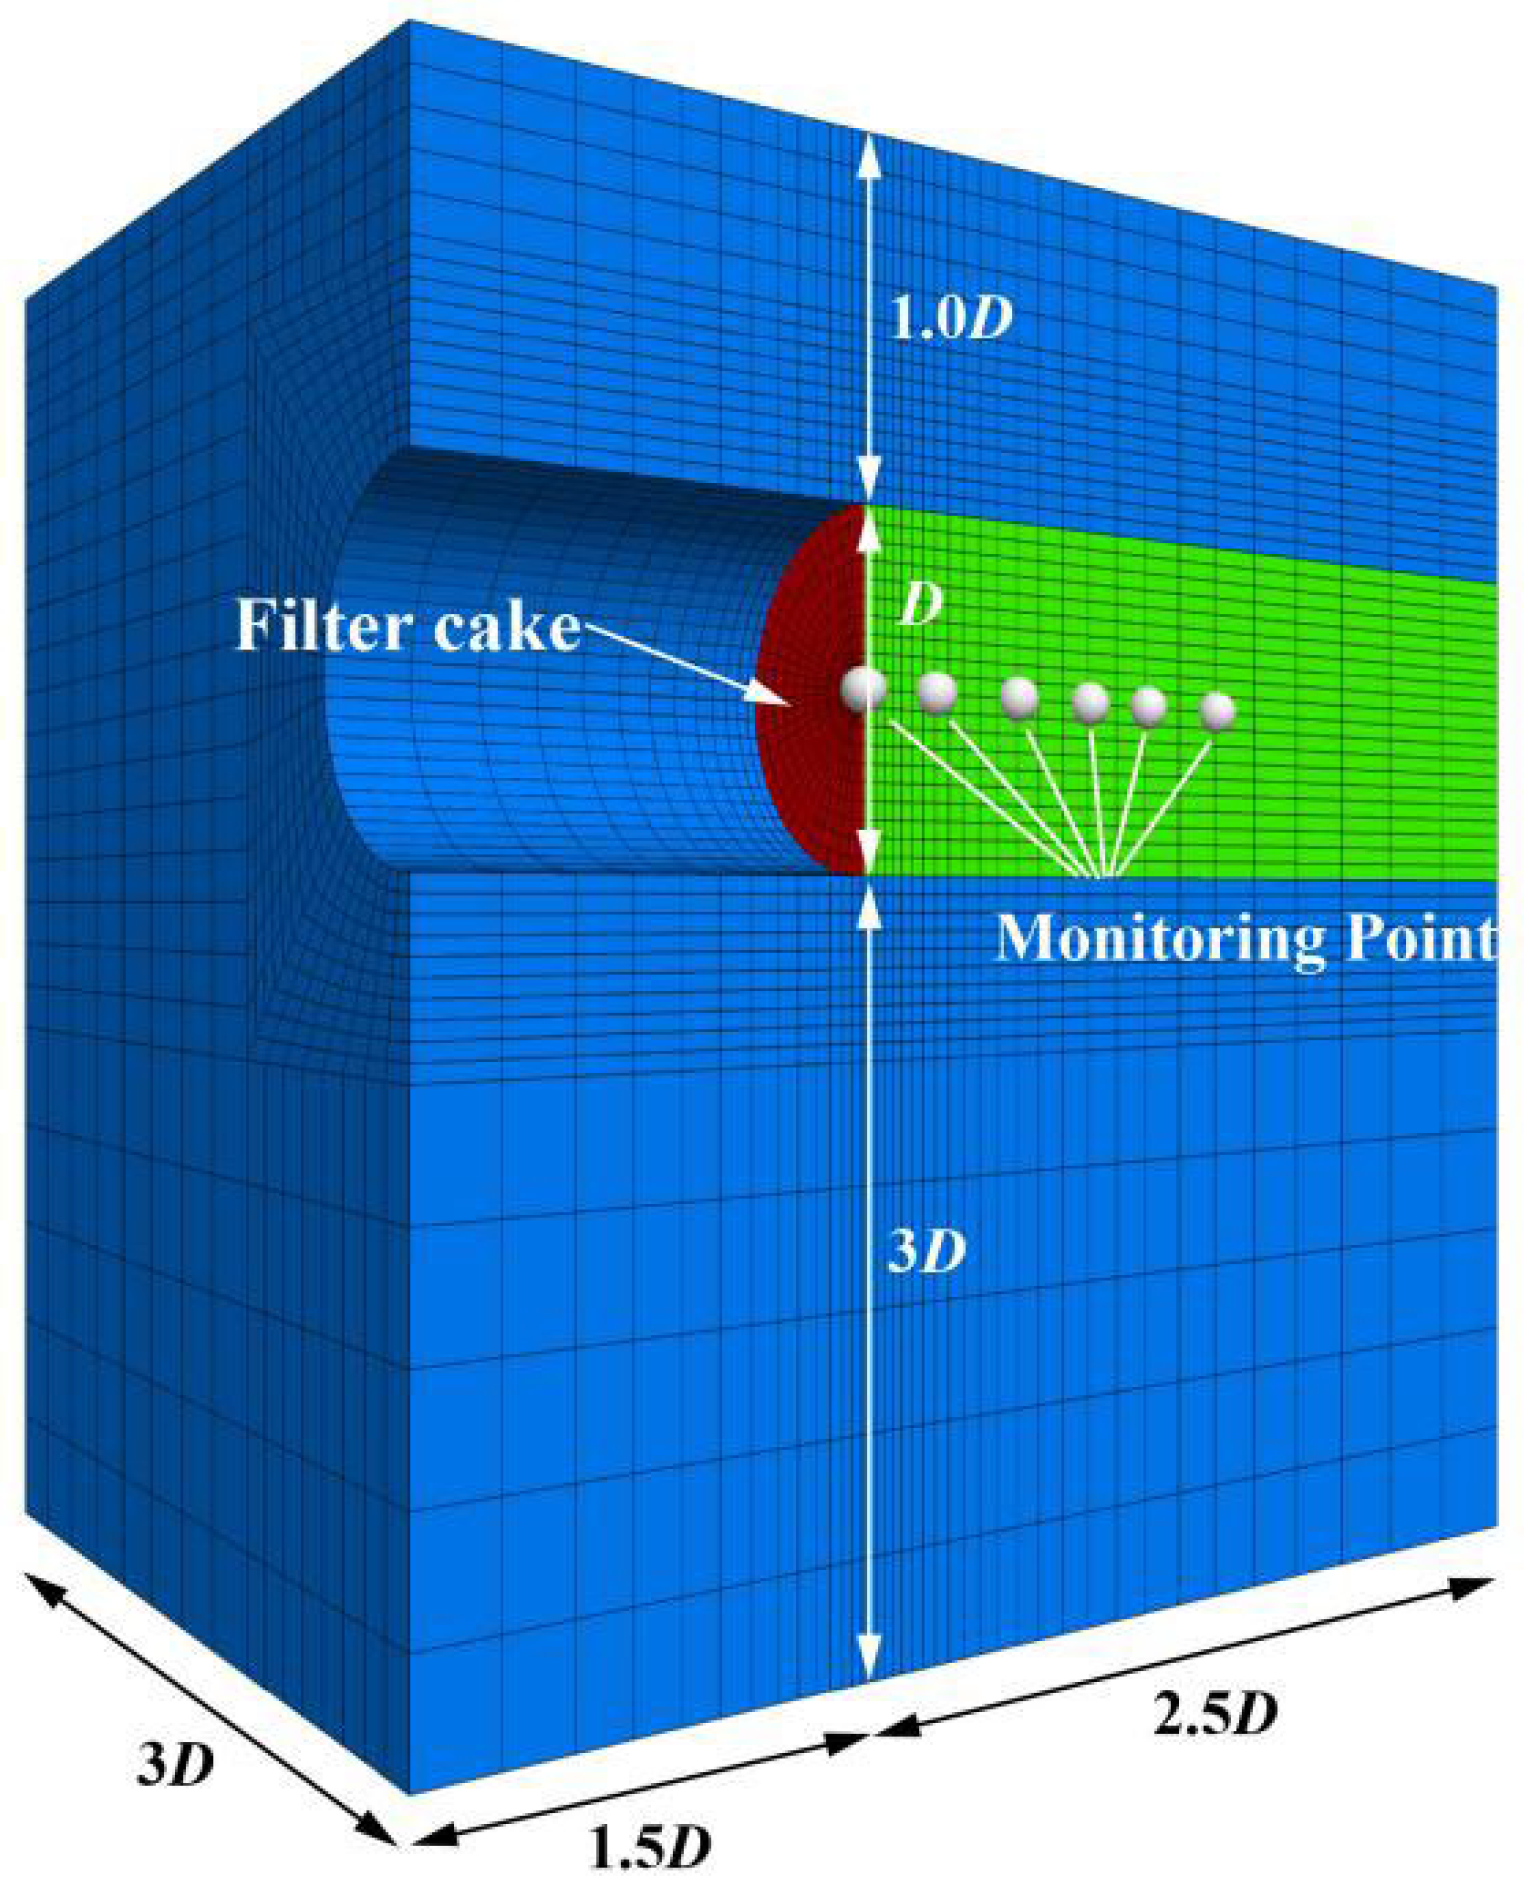
Based on Darcy’s law and the assumption of homogeneous formation permeability, a three-dimensional finite difference model was established solely for seepage analysis to obtain the transient pore water pressure distribution ahead of the tunnel face. No mechanical deformation or excavation-stage simulation is performed in this model; the resulting seepage forces are subsequently input into the upper-bound limit analysis for stability evaluation. The model dimensions were set to 90 m (length) × 60 m (width) × 40 m (height), corresponding to 6D, 4D, and 4D, respectively, for a tunnel diameter of D = 15.0 m. The tunnel burial depth was 1D, and a 0.2 m-thick filter cake was modeled on the excavation face (see Figure 1 for geometry and mesh).

2.1.1. Boundary and Initial Conditions

The lateral boundaries and model bottom were set as impermeable. The ground surface was defined as a fixed zero-pore-pressure boundary, with the groundwater table at the surface. The tunnel lining was also impermeable. The excavation face was the sole permeable boundary, assigned a constant total pressure head equivalent to the slurry pressure. The base-case slurry pressure was 460 kPa, representing the sum of earth and water pressures at the face center plus a 20 kPa surcharge. Comparative cases considered slurry pressures of 440, 420, 400, and 380 kPa, as well as impermeable and zero-pressure face conditions. Slurry pressure was applied with a gradient of 12 kPa/m to reflect its unit weight.
The selection of these hydraulic boundary conditions is justified as follows. The lateral boundaries and model bottom were treated as impermeable because the model domain (6D × 4D × 4D) is sufficiently large to ensure that hydraulic gradients at these boundaries are negligible. A boundary-effect verification confirmed that the pore water pressure at monitoring points located 5D from the tunnel face was negligibly different from that at the domain boundary (6D). The ground surface was defined as a fixed zero-pore-pressure boundary, consistent with the groundwater table being at the surface. The tunnel lining was treated as impermeable, reflecting the low permeability of the concrete segmental lining relative to the surrounding soil. The excavation face was the sole permeable boundary, assigned a constant total pressure head equivalent to the slurry pressure, which was varied across the comparative cases to represent different support conditions [7,41].

2.1.2. Material Parameters

The sandy stratum was assigned a baseline permeability coefficient ks = 1.0 × 10⁻⁴ m/s, representative of a typical medium-to-coarse sand, and a porosity of 0.38. To evaluate parametric sensitivity, additional stratum permeabilities of 5.0 × 10⁻⁵ m/s, 1.0 × 10⁻⁵ m/s, and 1.0 × 10⁻⁶ m/s were also analyzed, spanning the range from fine sand to silty sand. The filter cake permeability km was varied as 1.0 × 10⁻⁴ m/s (no effective cake), 1.0 × 10⁻⁶ m/s (semi-permeable), and 1.0 × 10⁻⁸ m/s (nearly impermeable). These filter cake values are consistent with the range reported for advanced slurry materials [41]. The slurry pressure was applied with a gradient of 12 kPa/m, reflecting the typical unit weight of bentonite slurry. The influence of a slurry infiltration zone was neglected in this idealized model; the implications of this simplification are discussed in Section 2.1.4.

2.1.3. Analysis Procedure

The analysis first obtained the initial in situ pore pressure under hydrostatic conditions. Tunnel excavation was then simulated by applying the transient slurry pressure boundary at the face. Pore water pressure evolution was monitored over time at designated points ahead of the face and at the tunnel crown, center, and invert (Figure 1), corresponding to typical standstill periods in shield advancement.

2.1.4. Model Assumptions

To isolate the governing role of filter cake permeability, the following simplifying assumptions are adopted:
a. 
Seepage-only analysis: The finite element model solves only the groundwater flow equation (Darcy’s law). No mechanical deformation, stress redistribution, or staged excavation is simulated, and no displacement constraints are imposed.
b. 
Homogeneous, isotropic, Darcian seepage: The stratum is treated as a homogeneous isotropic porous medium, and groundwater flow obeys Darcy’s law throughout the domain. Non-Darcy effects under high hydraulic gradients are neglected.
c. 
Neglect of the slurry infiltration zone: The low-permeability transition layer formed by bentonite particle clogging ahead of the face is not explicitly modeled. Omitting this impedance layer yields a conservative (upper-bound) estimate of excess pore pressure, which is prudent for a face-stability assessment.
d. 
Equivalent filter cake: The filter cake is represented as a thin (0.2 m) equivalent continuum with uniform permeability km. This thickness is a numerical convenience to avoid mesh-size singularities and does not represent the physical cake (typically <1 cm). The hydraulic resistance is governed by the ratio km/dm; the modeled seepage field remains equivalent as long as this ratio is preserved.
e. 
Impermeable far-field boundaries: The lateral boundaries, model bottom, and tunnel lining are treated as impermeable. The domain size (6D × 4D × 4D) ensures boundary hydraulic gradients are negligible, as confirmed by a sensitivity check.
f. 
Mesh discretization adequacy: A formal mesh convergence study with systematic grid refinement was not performed, as the primary objective of the numerical model is to provide the seepage force distribution as input to the upper-bound limit analysis rather than to pursue mesh-independent absolute values. The mesh design therefore focused on adequately resolving the steep hydraulic gradient across the filter cake, which dominates the overall hydraulic resistance of the system. Local refinement was applied near the excavation face, with the element size significantly smaller than the cake thickness (on the order of 0.05 m), to ensure that the pressure drop across this low-permeability layer is captured with sufficient resolution. The far-field region was discretized with a coarser mesh, as hydraulic gradients there are negligible. This discretization strategy follows typical practices in seepage finite-element modeling for problems involving high-permeability-contrast layers, where localized refinement is prioritized over uniform grid densification.

2.2. Upper-Bound Limit Analysis with Seepage Forces

2.2.1. Failure Mechanism and Velocity Field

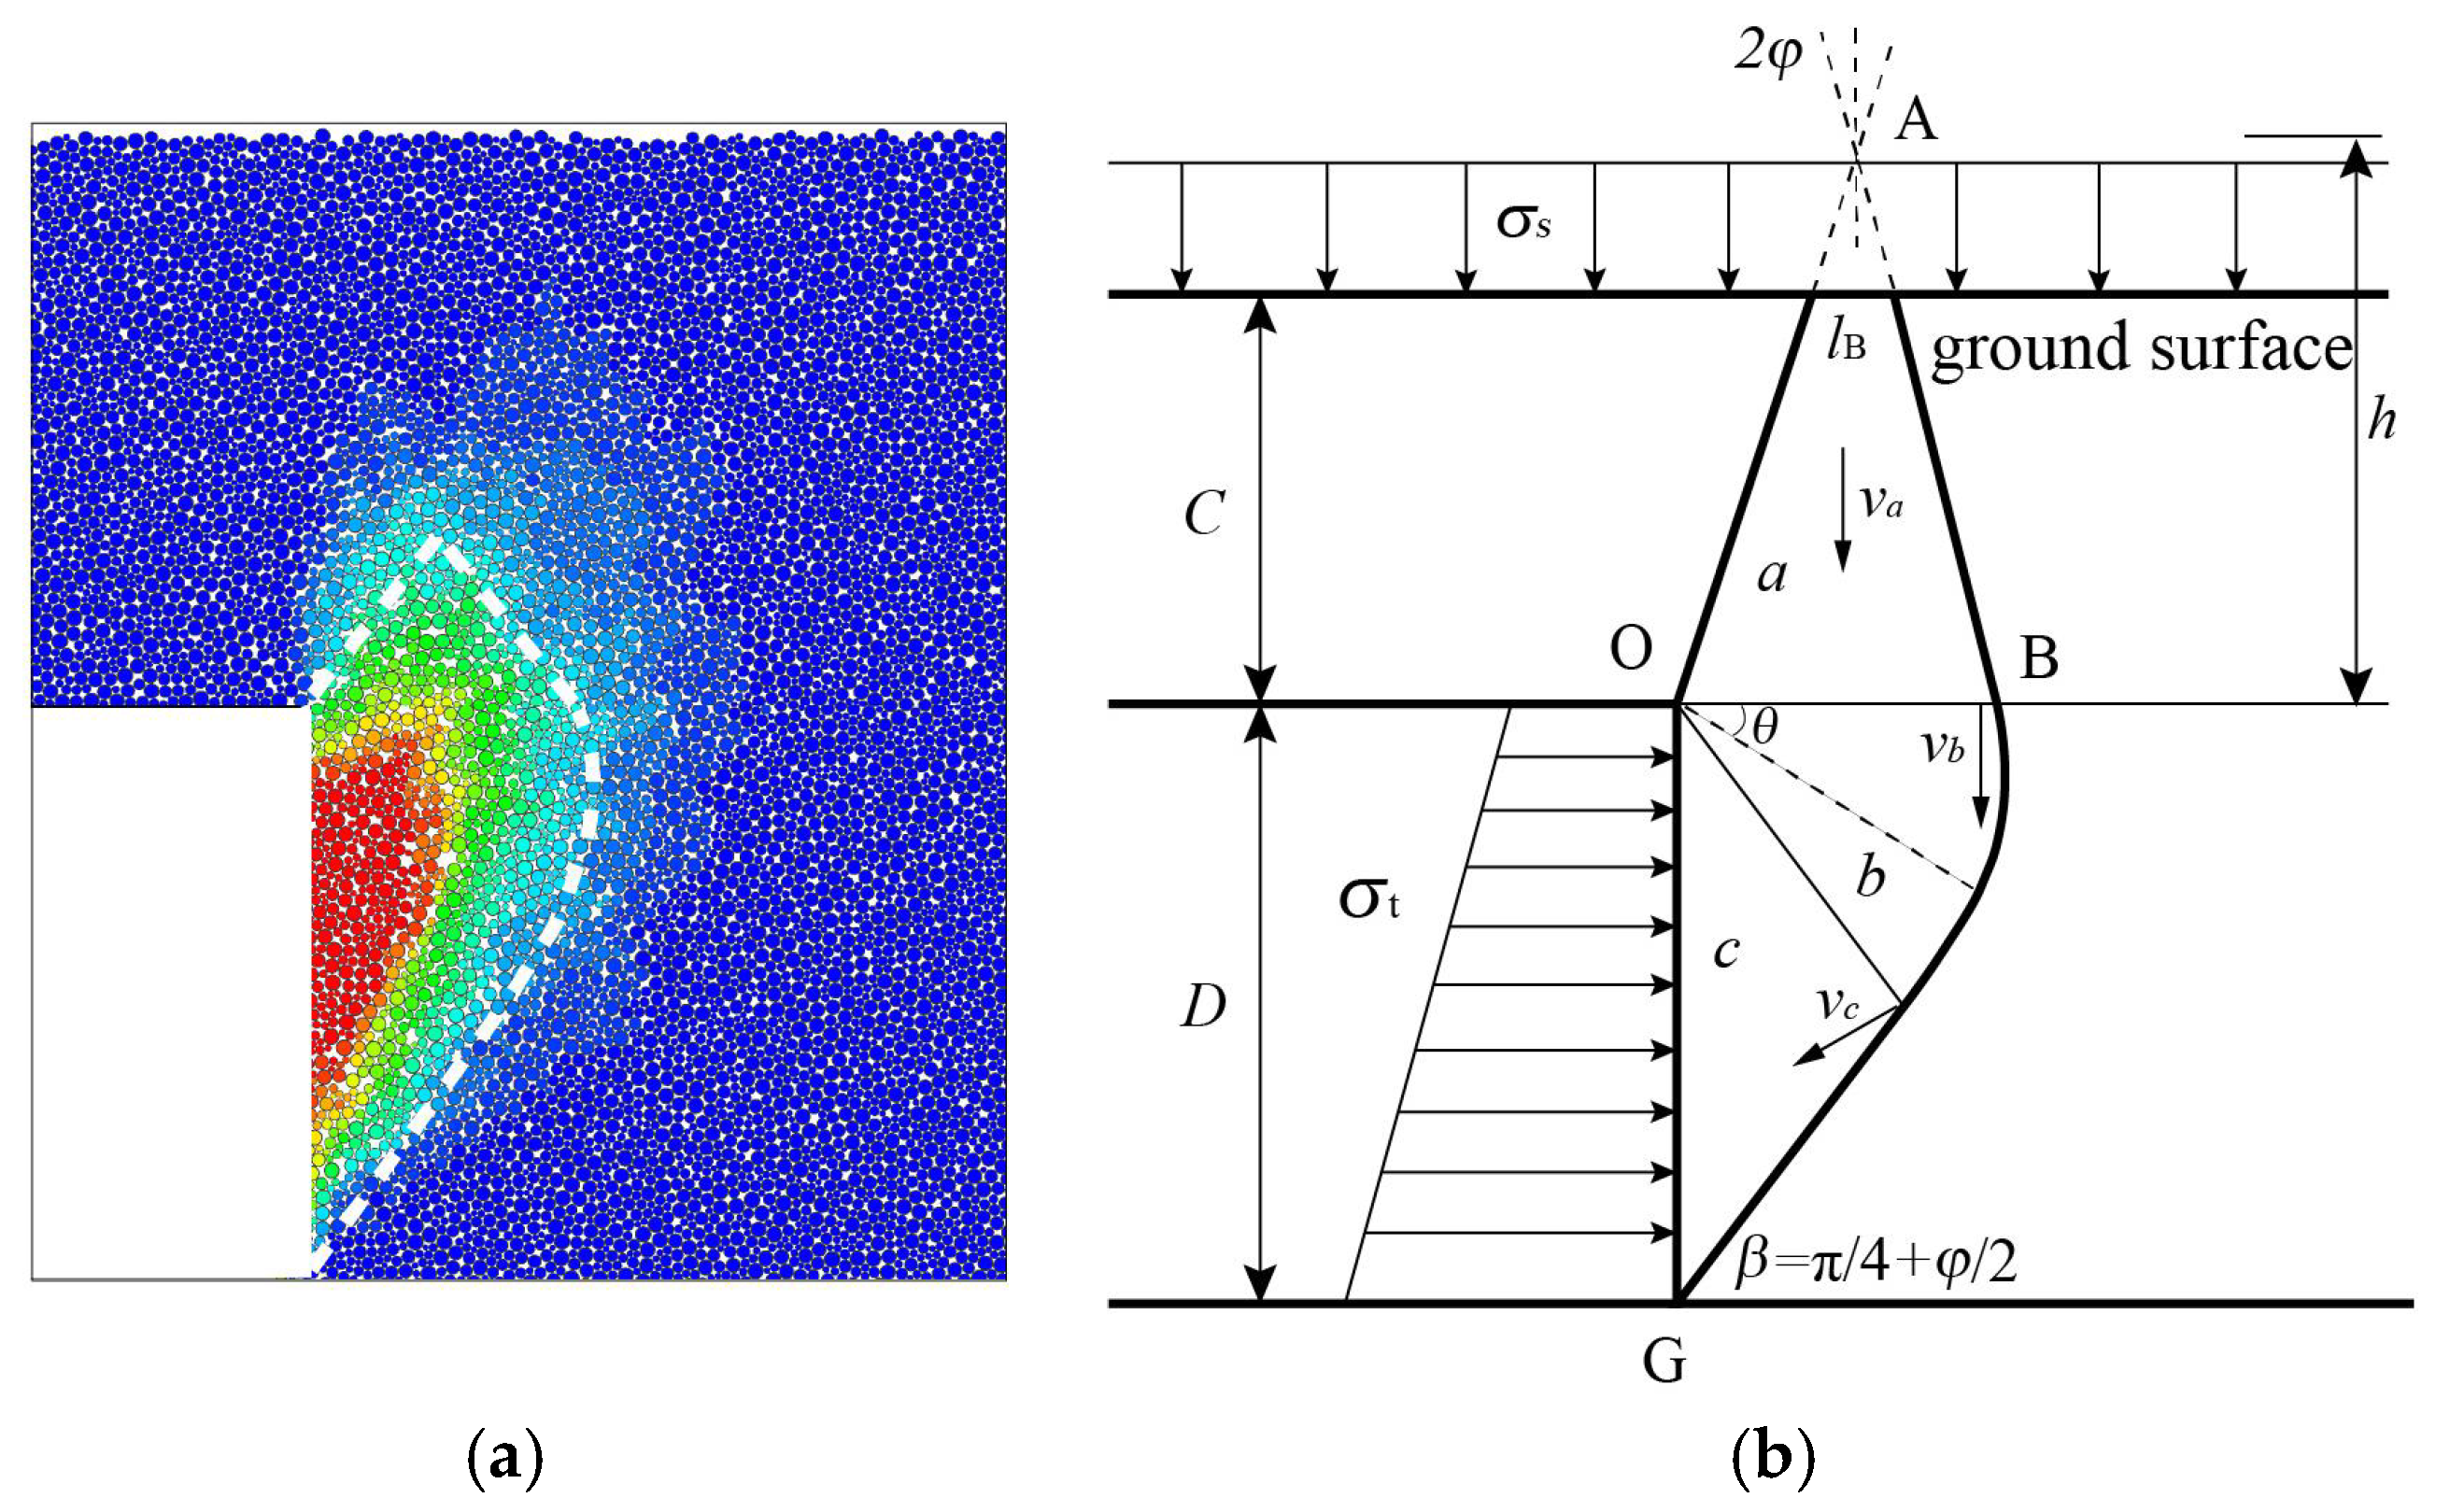
Based on the failure patterns observed in particle flow simulations [10] (Figure 2a), the failure mechanism of the excavation face remains consistent across different stages of instability and does not vary with burial depth. Furthermore, under critical failure conditions, the observed failure mode aligns with the excavation face failure model proposed by Leca et al. [14]. A kinematically admissible failure mechanism is established for upper-bound limit analysis. The proposed three-dimensional composite mechanism comprises rigid blocks including an active wedge (Block a) and a passive zone subdivided into a shear cone (Block b) and a bottom wedge (Block c), as illustrated in Figure 2b).
To apply the theoretical model, the seepage force components (fAx, fAy, fBx, fBy) acting on the failure blocks must be determined quantitatively.

2.2.2. Theoretical Formulation

Based on the theoretical mechanism of the upper-bound limit analysis method, the work rate of seepage forces is incorporated into the formulation. The power PF due to seepage forces depends on their magnitude and spatial distribution. Under seepage conditions, the forces acting on the sliding block can be described in terms of the effective stresses on the soil skeleton, the submerged unit weight of the soil, and the resultant of seepage forces acting on soil particles. Alternatively, the system can be simplified by considering the resultant of the saturated soil weight and the pore water pressure along the sliding boundary. Following the approach of Lv et al. [36] for calculating the power of seepage forces, this study computes the seepage effect via the resultant of pore water pressure and buoyancy on the failure surface. The failure zone is divided into two regions: A and B, where region A corresponds to the wedge block and region B (including block b and block c) comprises the prismatic blocks ahead of the face. The horizontal and vertical components of the seepage force per unit area—denoted as fAx, fAy, and fBx, fBy—in regions A and B are expressed as Equation (1):
f Ax = F Ax A A ,   f Ay = F Ay A A ,   f Bx = F Bx A B ,   f By = F By A B
Owing to the generally low permeability of the filter cake, a hydraulic gradient develops across it as slurry water permeates through, inducing a relatively large horizontal seepage force Fm acting on the cake. Given the small thickness of the filter cake, this seepage force Fm can be regarded as an effective support force applied to the excavation face. Although the slurry pressure decreases significantly after passing through the filter cake, it remains higher than the static pore water pressure, resulting in an excess pore water pressure that continues to propagate into the stratum. Only the seepage forces within the failure mechanism influence face stability; those outside the instability zone have no effect.
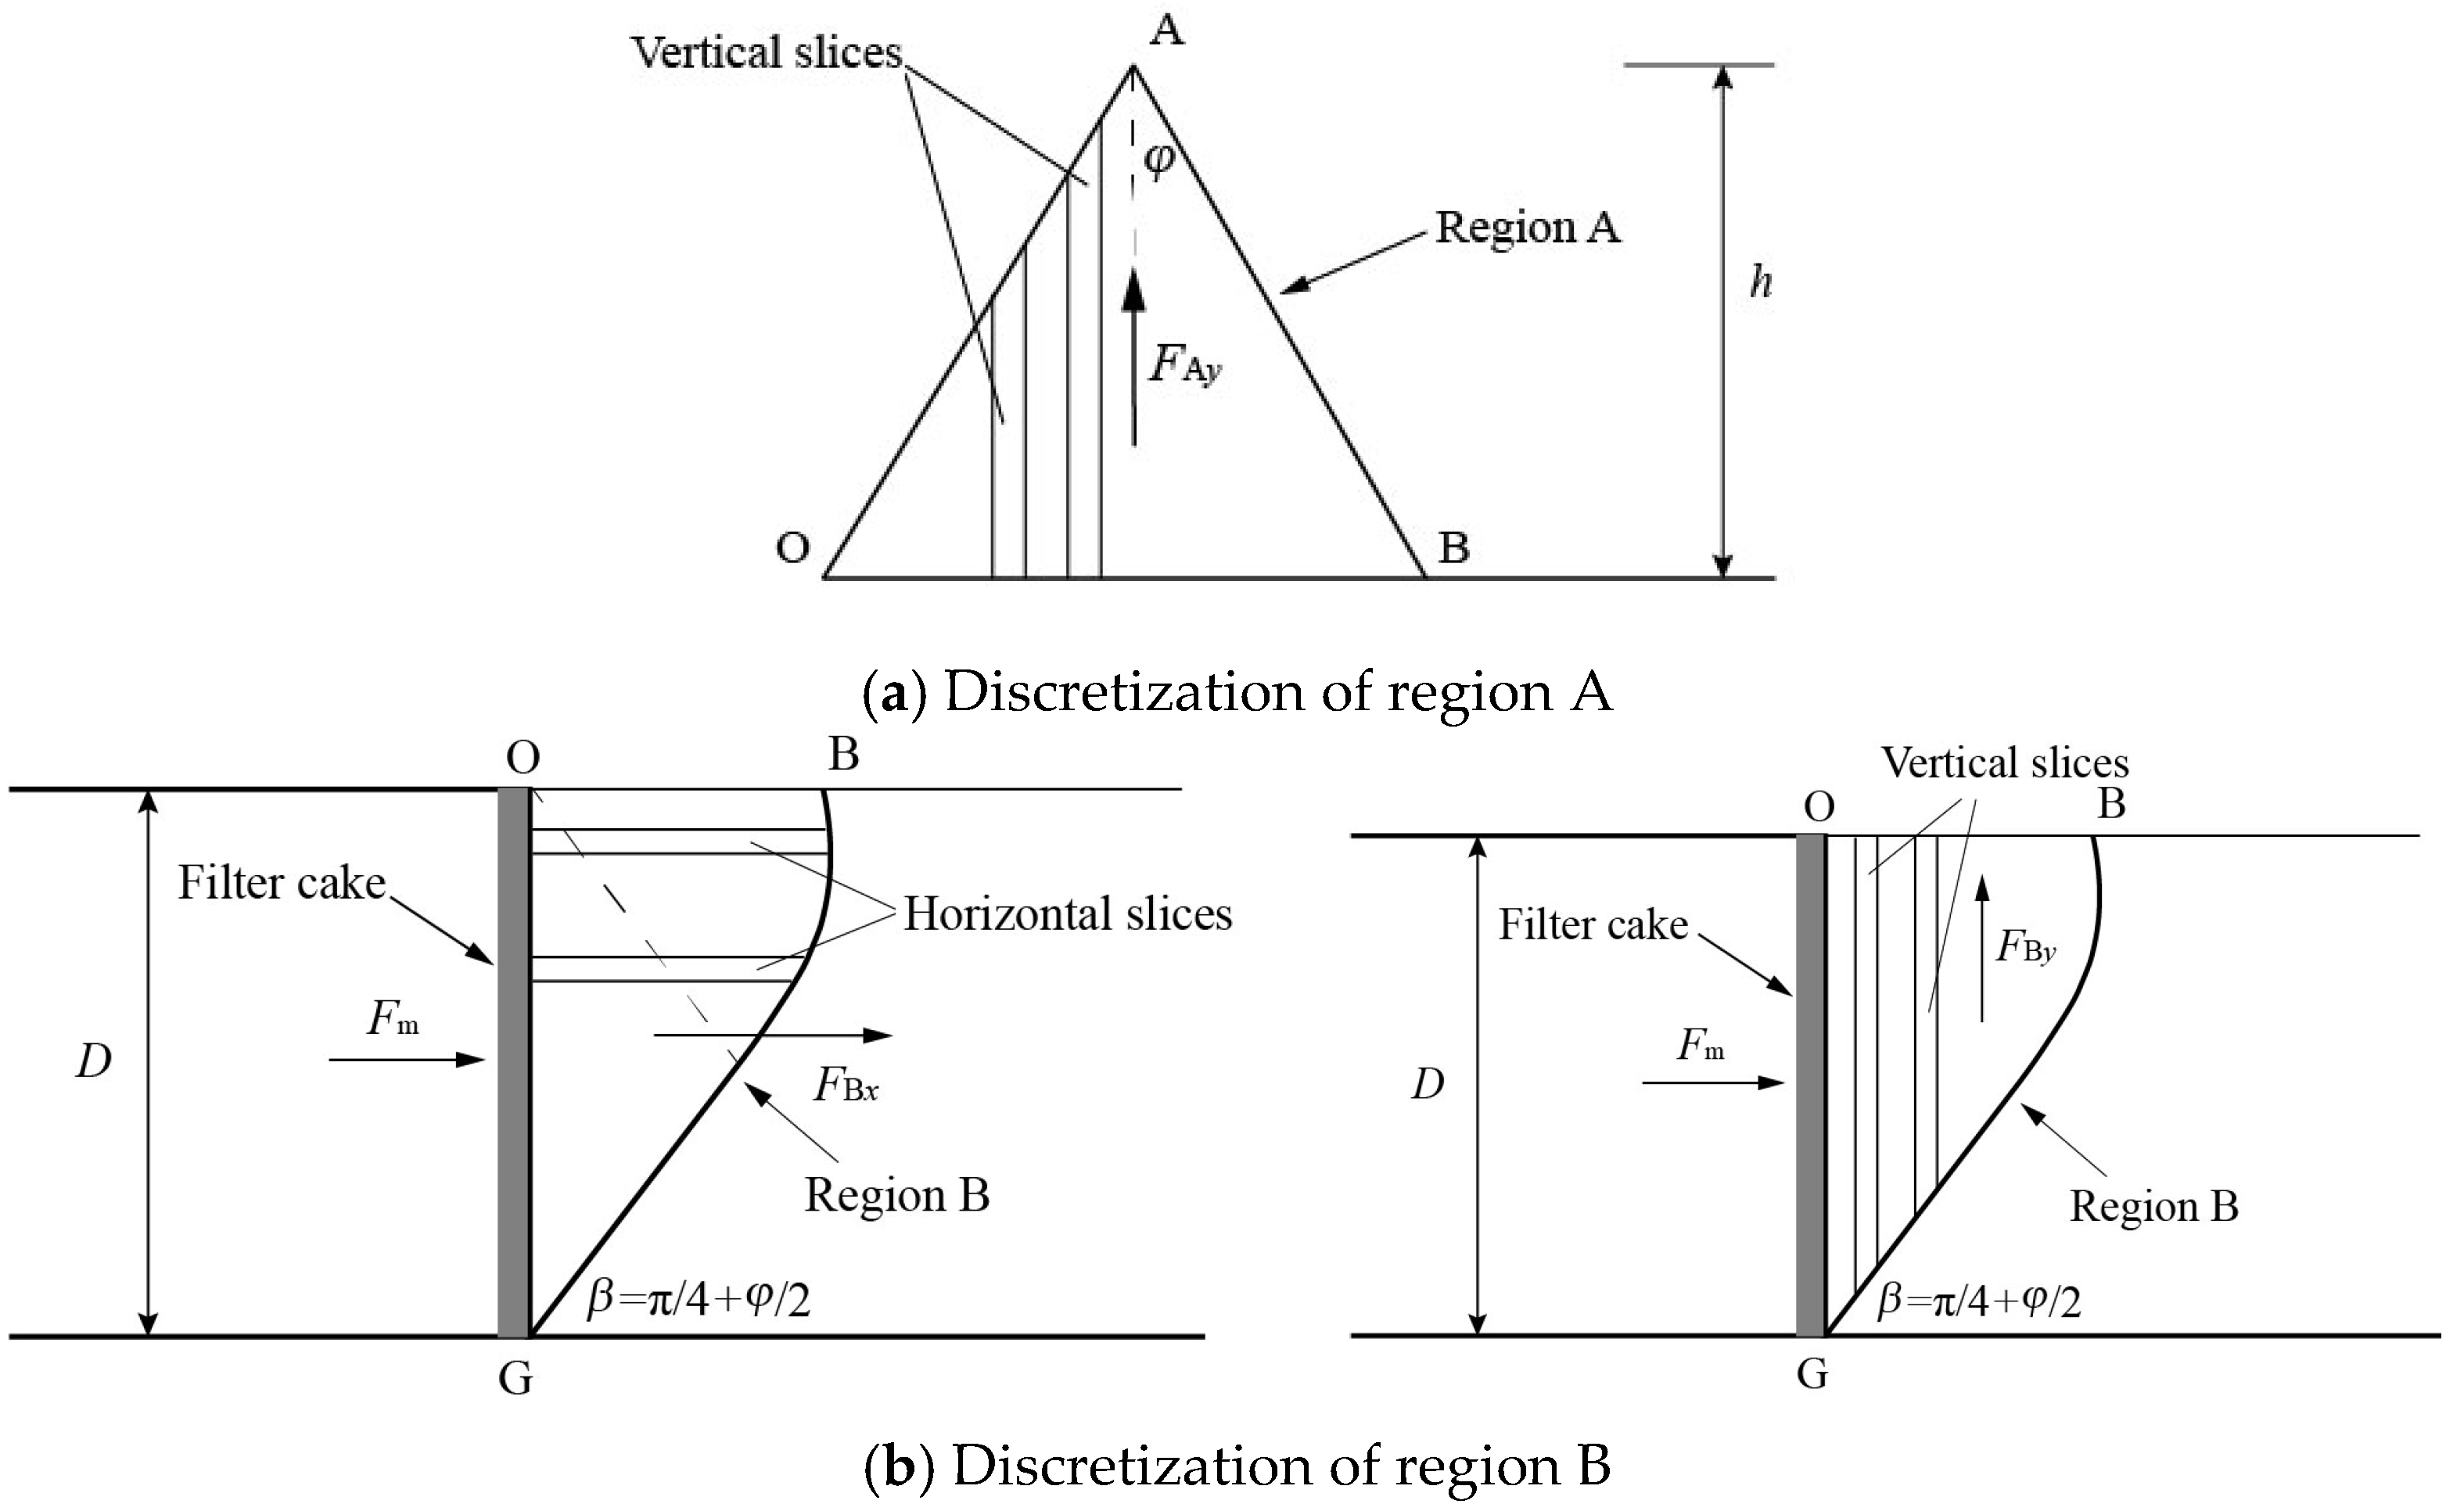
As illustrated in Figure 3, the seepage forces acting on the unstable block include the vertical component FAy on region A, and the horizontal and vertical components FAy on region B. Additionally, the filter cake is subjected to a horizontal seepage force Fm, which can be simplified as a uniformly distributed horizontal load Fm applied over the instability zone, as shown in Figure 3.
According to Equation (1), to determine the critical slurry pressure, it is necessary to compute the horizontal and vertical seepage force components per unit area—denoted as fAx, fAy, and fBx, fBy—acting on region A and B.
In a unit volume of soil, the forces ( fx, fy, fz) exerted by the seepage flow on the soil skeleton are expressed as Equation (2)
f x = γ w h ( x , y , z ) x f y = γ w h ( x , y , z ) y f z = γ w h ( x , y , z ) z
The head function, denoted as h(x,y,z), defines the components of the seepage stress (fx, fy, fz) in their respective directions. Determining the head distribution, which is governed by the steady-state seepage equation, is a prerequisite for calculating the seepage force on the excavation face. The governing differential equation for steady-state seepage is given by Equation (3):
x ( k x h x ) + y ( k y h y ) + z ( k z h z ) = 0
In the formulation, fx, fy and fz denote the permeability coefficients of the stratum in the x, y and z directions, respectively. As theoretical solutions for the head distribution in such settings are often impractical, the head distribution is derived from the pore water pressure patterns established in Section 2.1, which in turn enables the calculation of the seepage force acting on the soil at the excavation face.
The seepage forces on the filter cake and within the failure zone are determined using the strip method. For region A, it is divided uniformly in the horizontal direction into 10 trapezoidal segments of equal width. Using numerical analysis software, the pore water pressure at corresponding points is computed and monitored, allowing the vertical seepage force within each sub-segment to be evaluated. The resulting expression for FAy is as shown in Equation (4):
F Ay = i = 1 10 v i i γ w
In the formula, vi represents the volume of the i-th block, i represents the hydraulic gradient of the i-th block in the vertical direction, and γw represents the specific gravity of water.
Similarly, divide region B horizontally into 10 blocks of equal width and vertically into 15 blocks of equal width for the calculation and analysis of FBy and FBx. Use the same method to calculate the filter cake Fm exerted by the filter cake.
Taking into account the effects of cohesion, additional stress, effective weight and permeability, the critical slurry pressure under seepage conditions can be obtained as Equation (5):
σ t = c N c + γ N γ + q N q + f N F
where Nc, Nγ, Nq, and NF are the dimensionless influence coefficients for cohesion, surcharge, soil self-weight, and seepage force, respectively. Their values are derived from the upper-bound energy balance and depend on the internal friction angle φ and the failure geometry [14,36].

3. Results

3.1. Results of the Seepage Analysis for the Slurry Shield Tunnel Face

(1)
Seepage field distribution and influencing factors
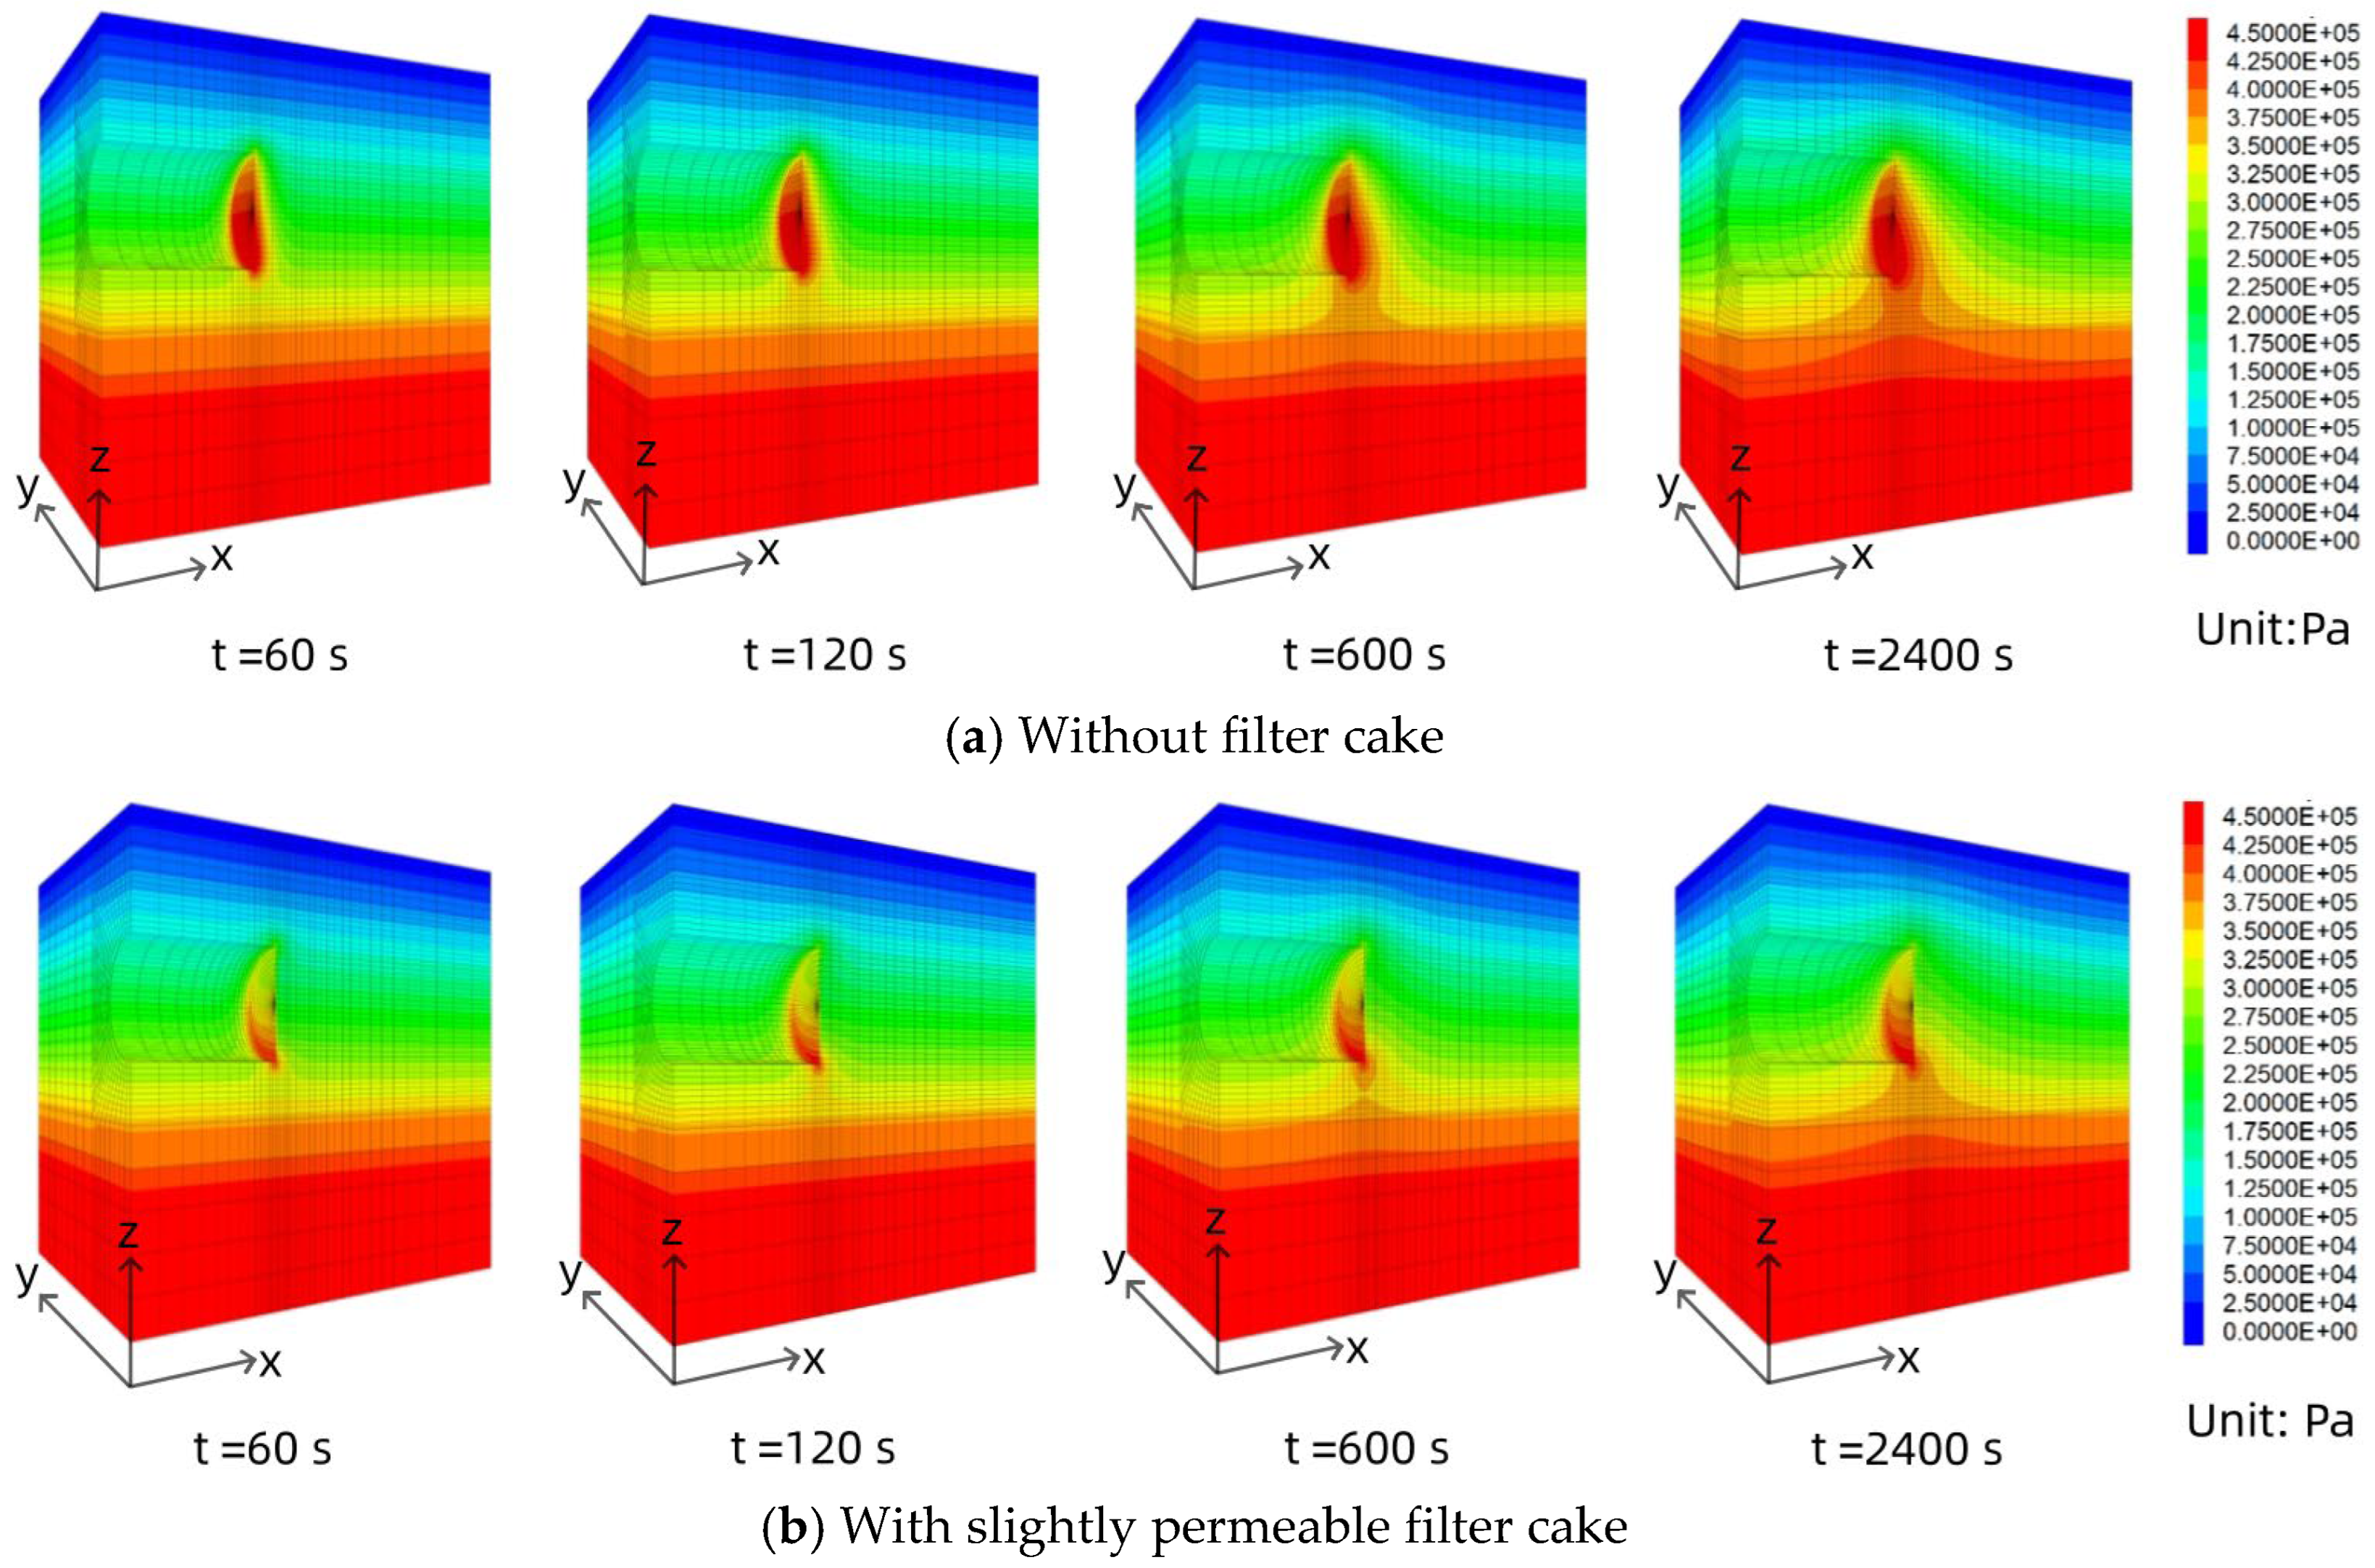
Figure 4 illustrates the pore water pressure distributions at the excavation face under different filter cake permeability conditions. Figure 4a corresponds to a slurry pressure of 460 kPa without an effective filter cake, while Figure 4b shows the case with a slightly permeable filter cake under the same pressure. In the absence of an effective filter cake, the pore water pressure increases rapidly near the excavation face, generating significant excess pore pressure. This excess pressure attenuates with distance from the face, with the growth rate gradually decreasing. Although the pore pressure increases with depth due to the slurry pressure gradient, this increase is partially offset by the initial seepage field. When a slightly permeable filter cake is present, the cake’s sealing effect causes a marked pressure drop within its thickness. Consequently, the resulting excess pore pressure in the soil is substantially lower than in the no-cake scenario, demonstrating the filter cake’s effectiveness in mitigating slurry infiltration and excess pressure development.
(2)
Key influencing factors and trends
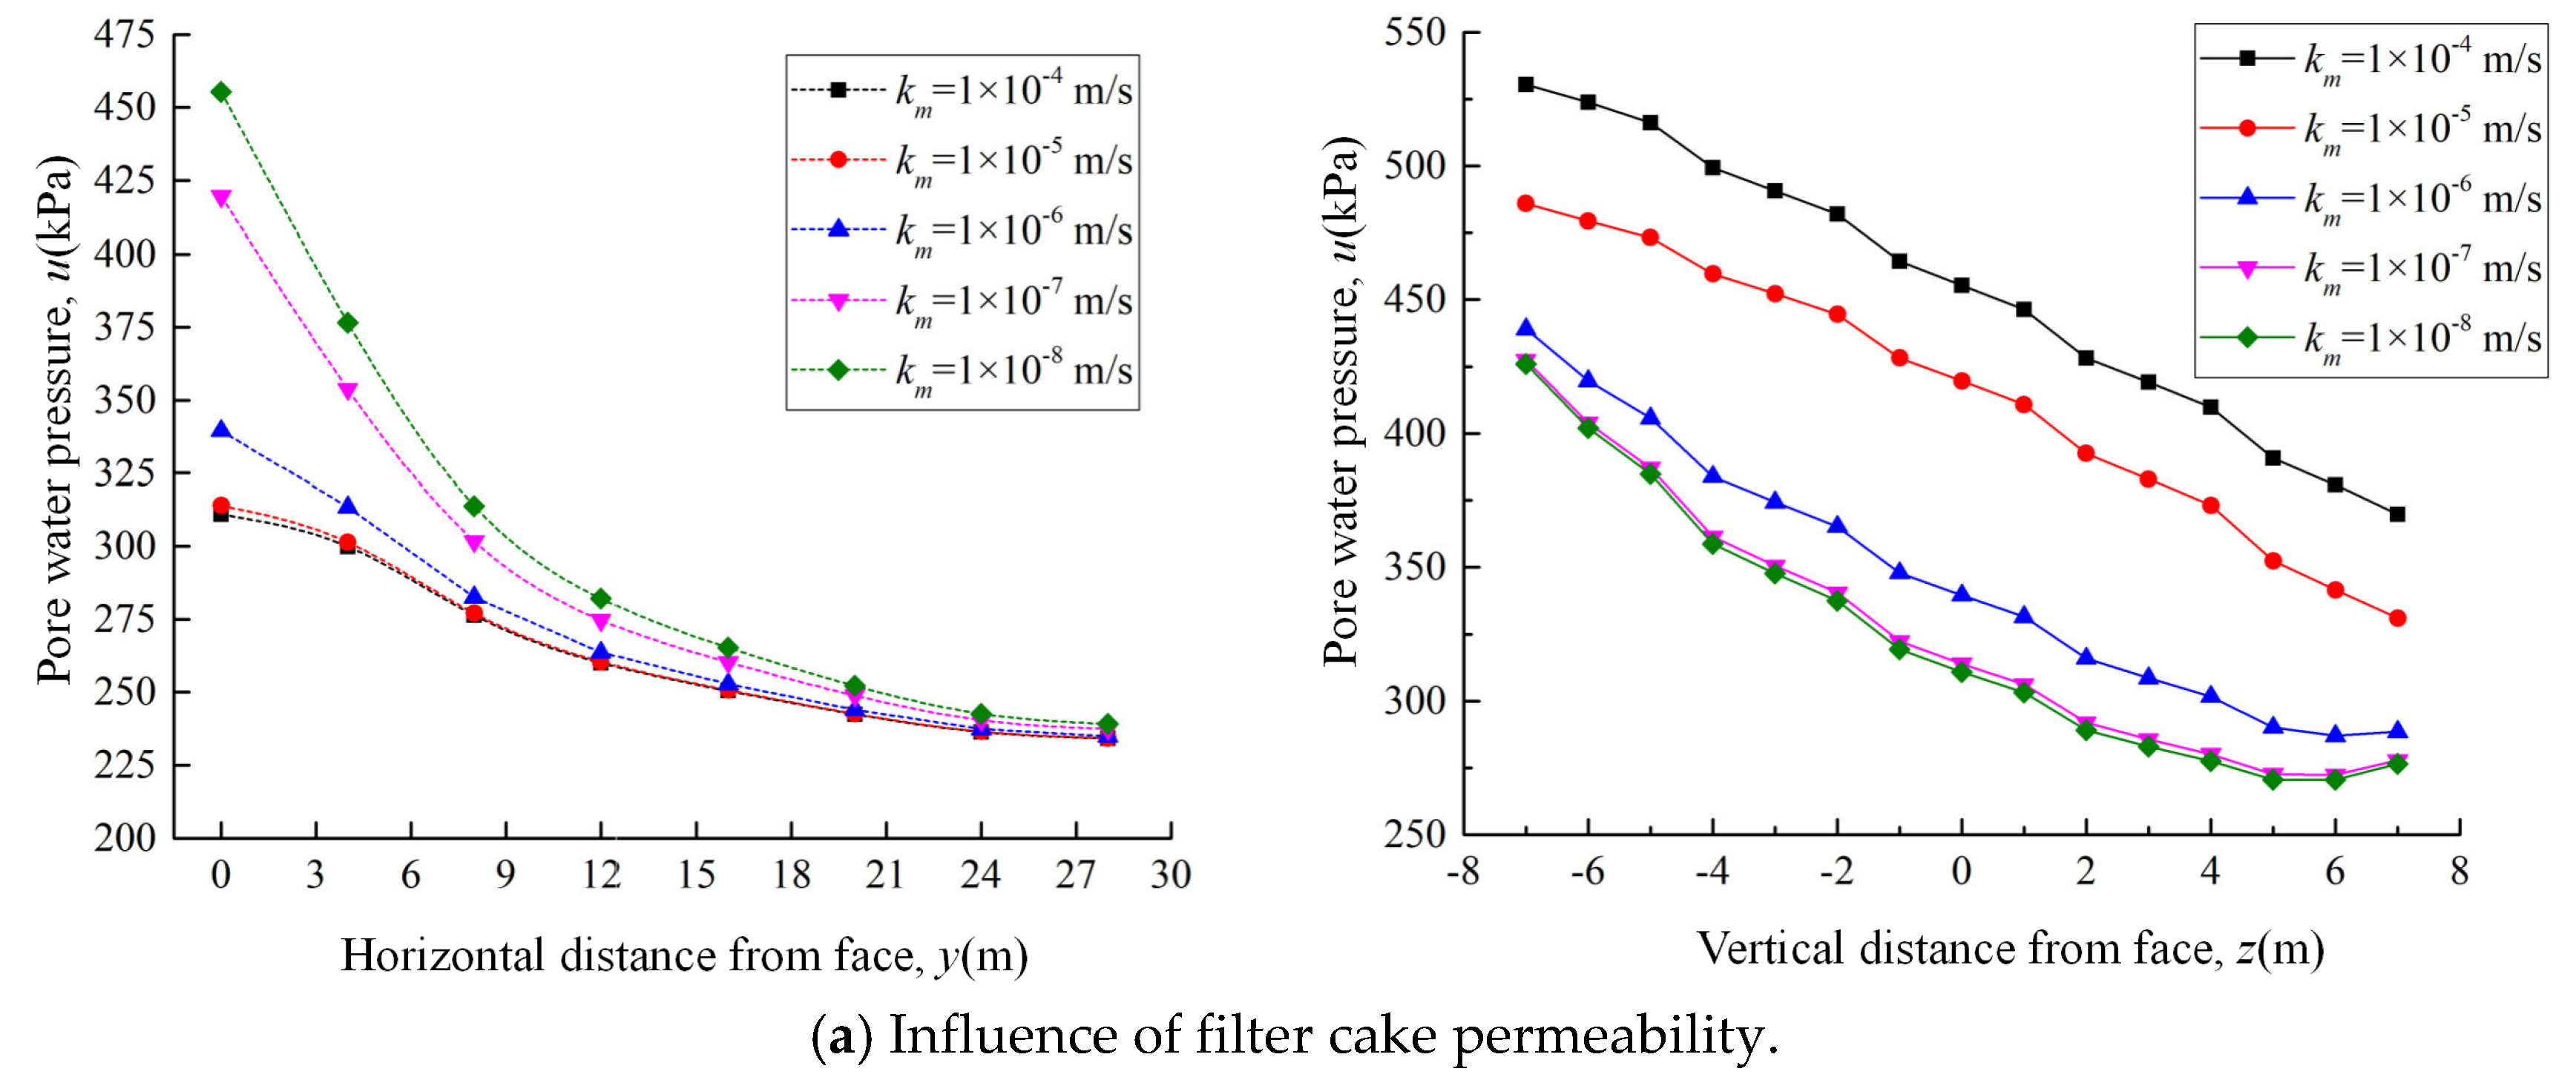
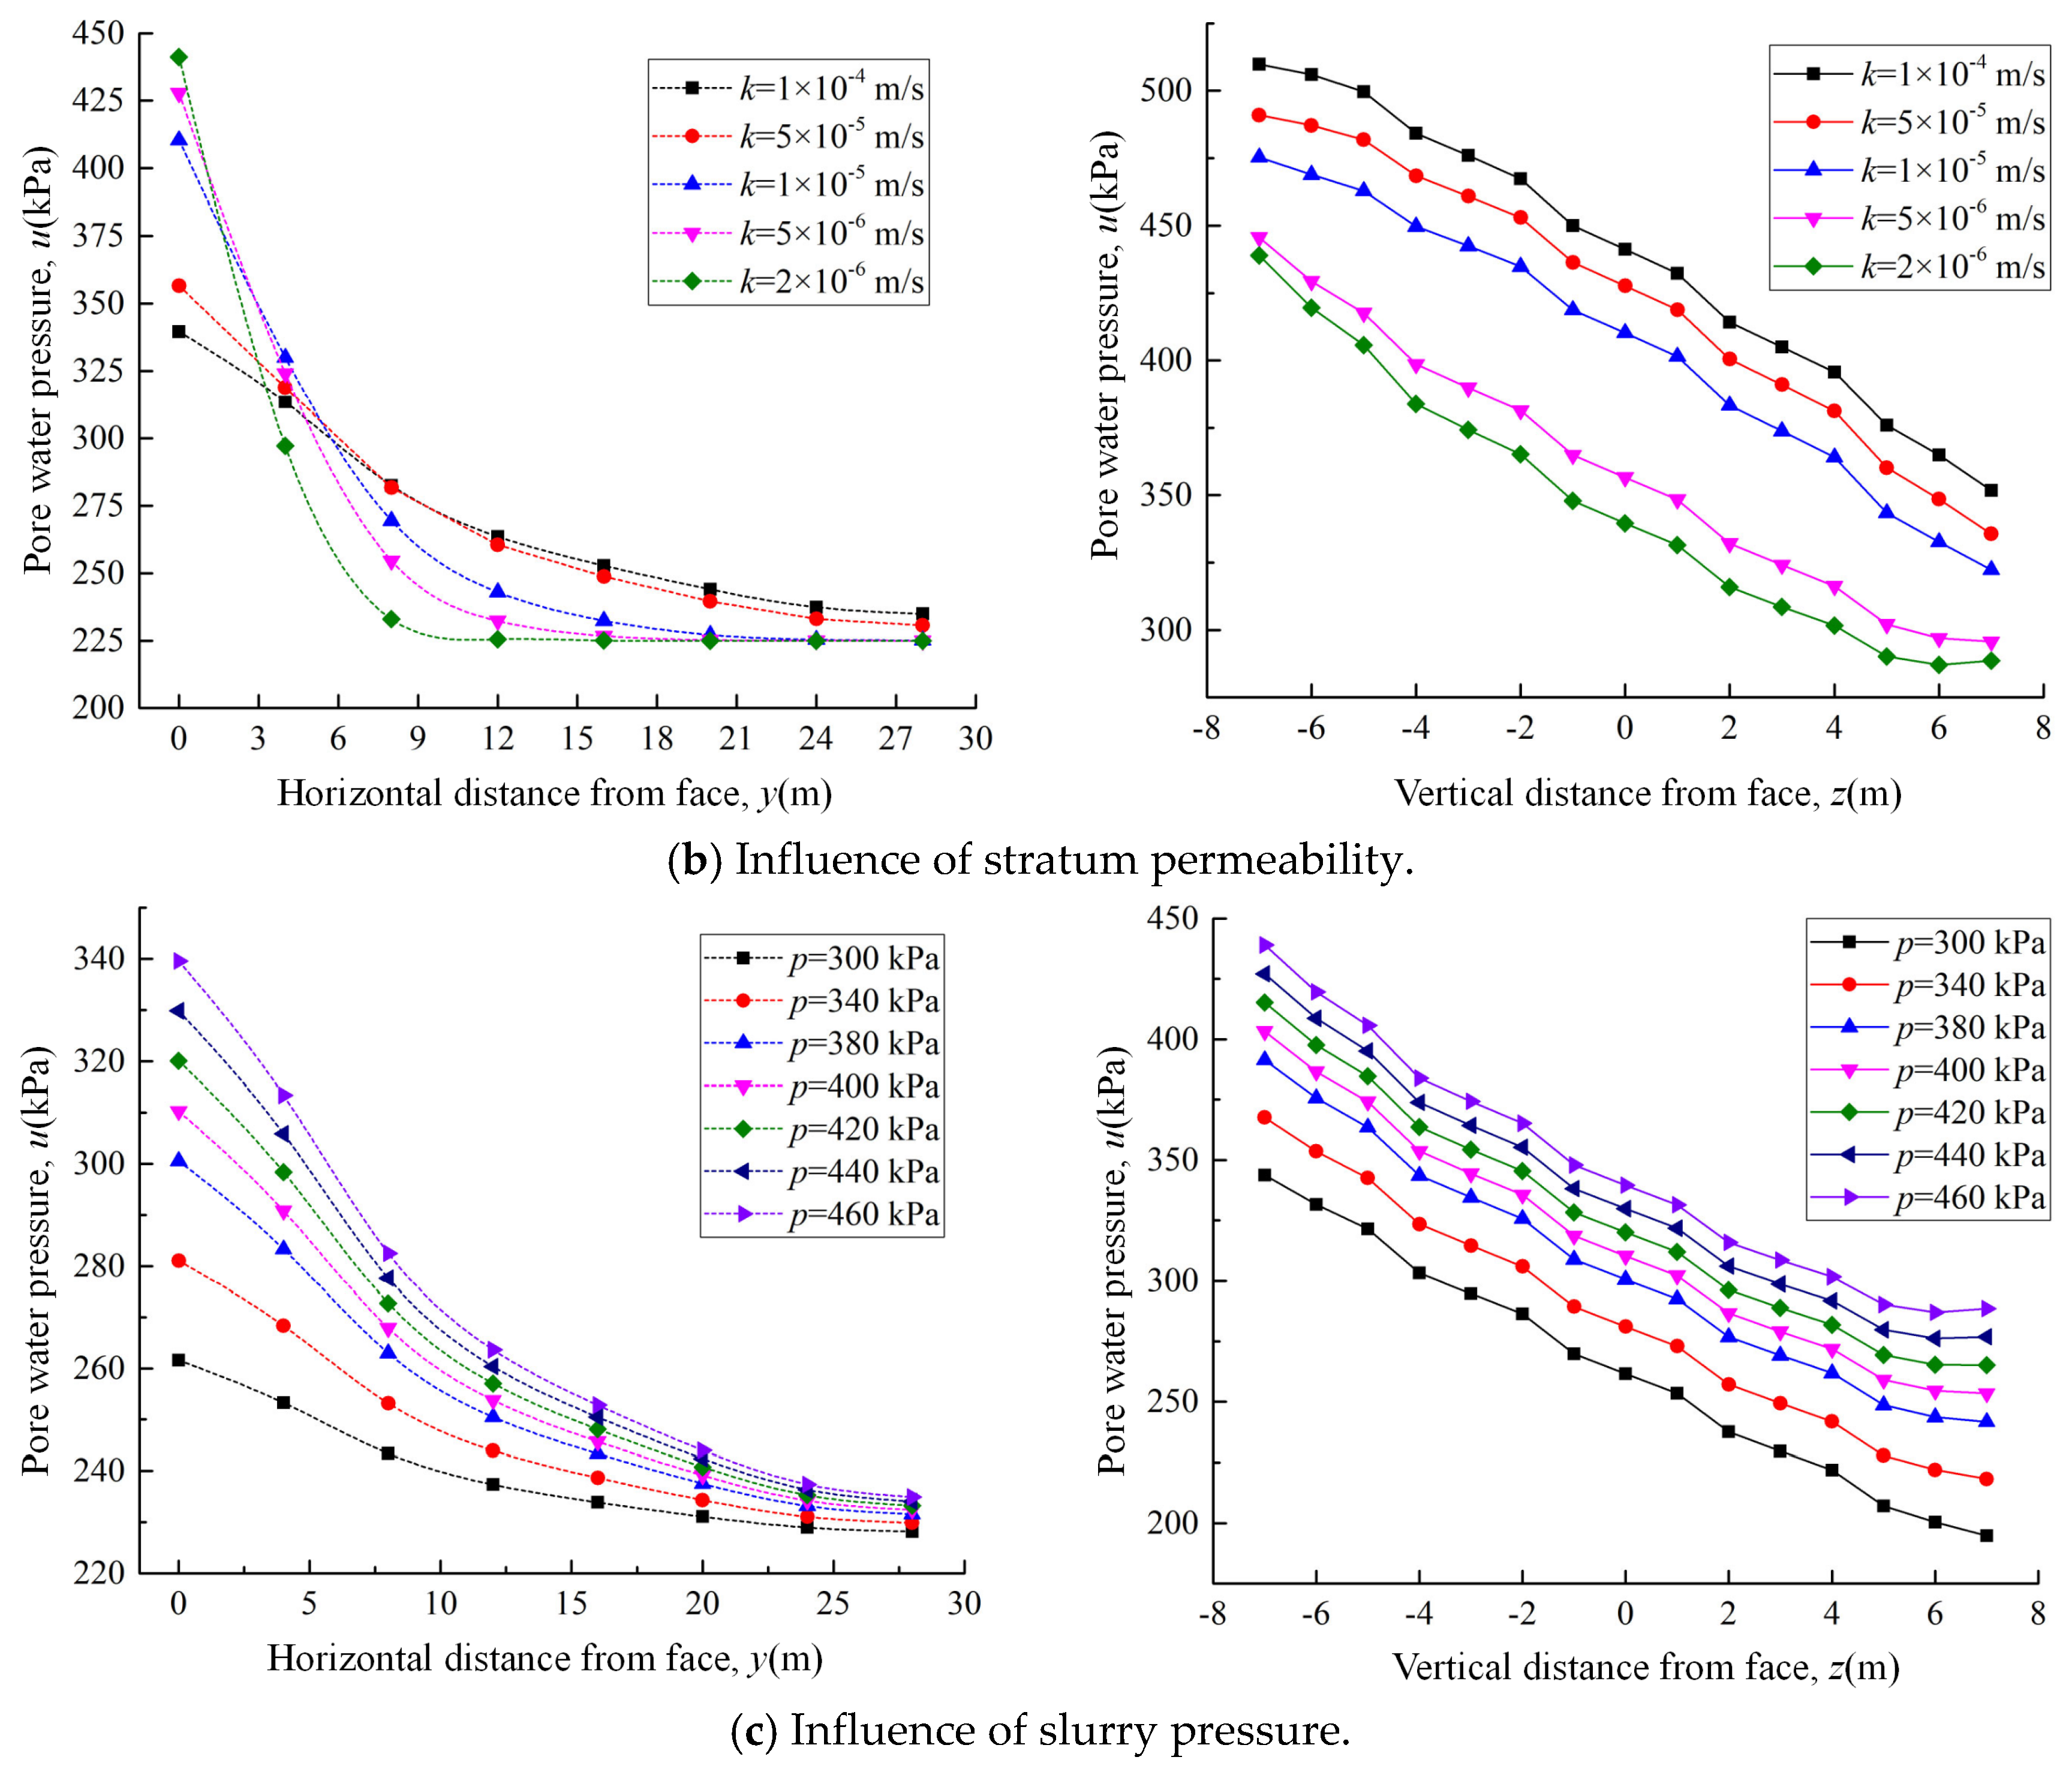
The filter cake plays a dominant role in controlling face seepage. Figure 5a compares pore pressure profiles with and without a filter cake. Without a filter cake, the 100 kPa isobar migrates to approximately 0.3D ahead of the face after 60 s and to nearly 0.5D after 2400 s. With a slightly permeable filter cake (km = 1.0 × 10⁻⁶ m/s), the same isobar remains within 0.1D of the face, confirming the cake’s sealing effect. The effect of cake permeability exhibits a clear threshold: reducing km below 1.0 × 10⁻⁷ m/s brings negligible further reduction in pore pressure (Figure 5b), indicating an optimal lower limit for filter cake design.
Stratum permeability mainly affects the spatial decay rate of excess pore pressure. In high-permeability strata (ks = 1.0 × 10⁻⁴ m/s), the pressure decays gradually, while low-permeability strata (ks = 1.0 × 10⁻⁶ m/s) produce a steep gradient that localizes excess pressure near the face (Figure 5c). The maximum pore pressure ahead of the face increases linearly with the applied slurry pressure.

3.2. Analysis of Seepage Forces and Influencing Factors

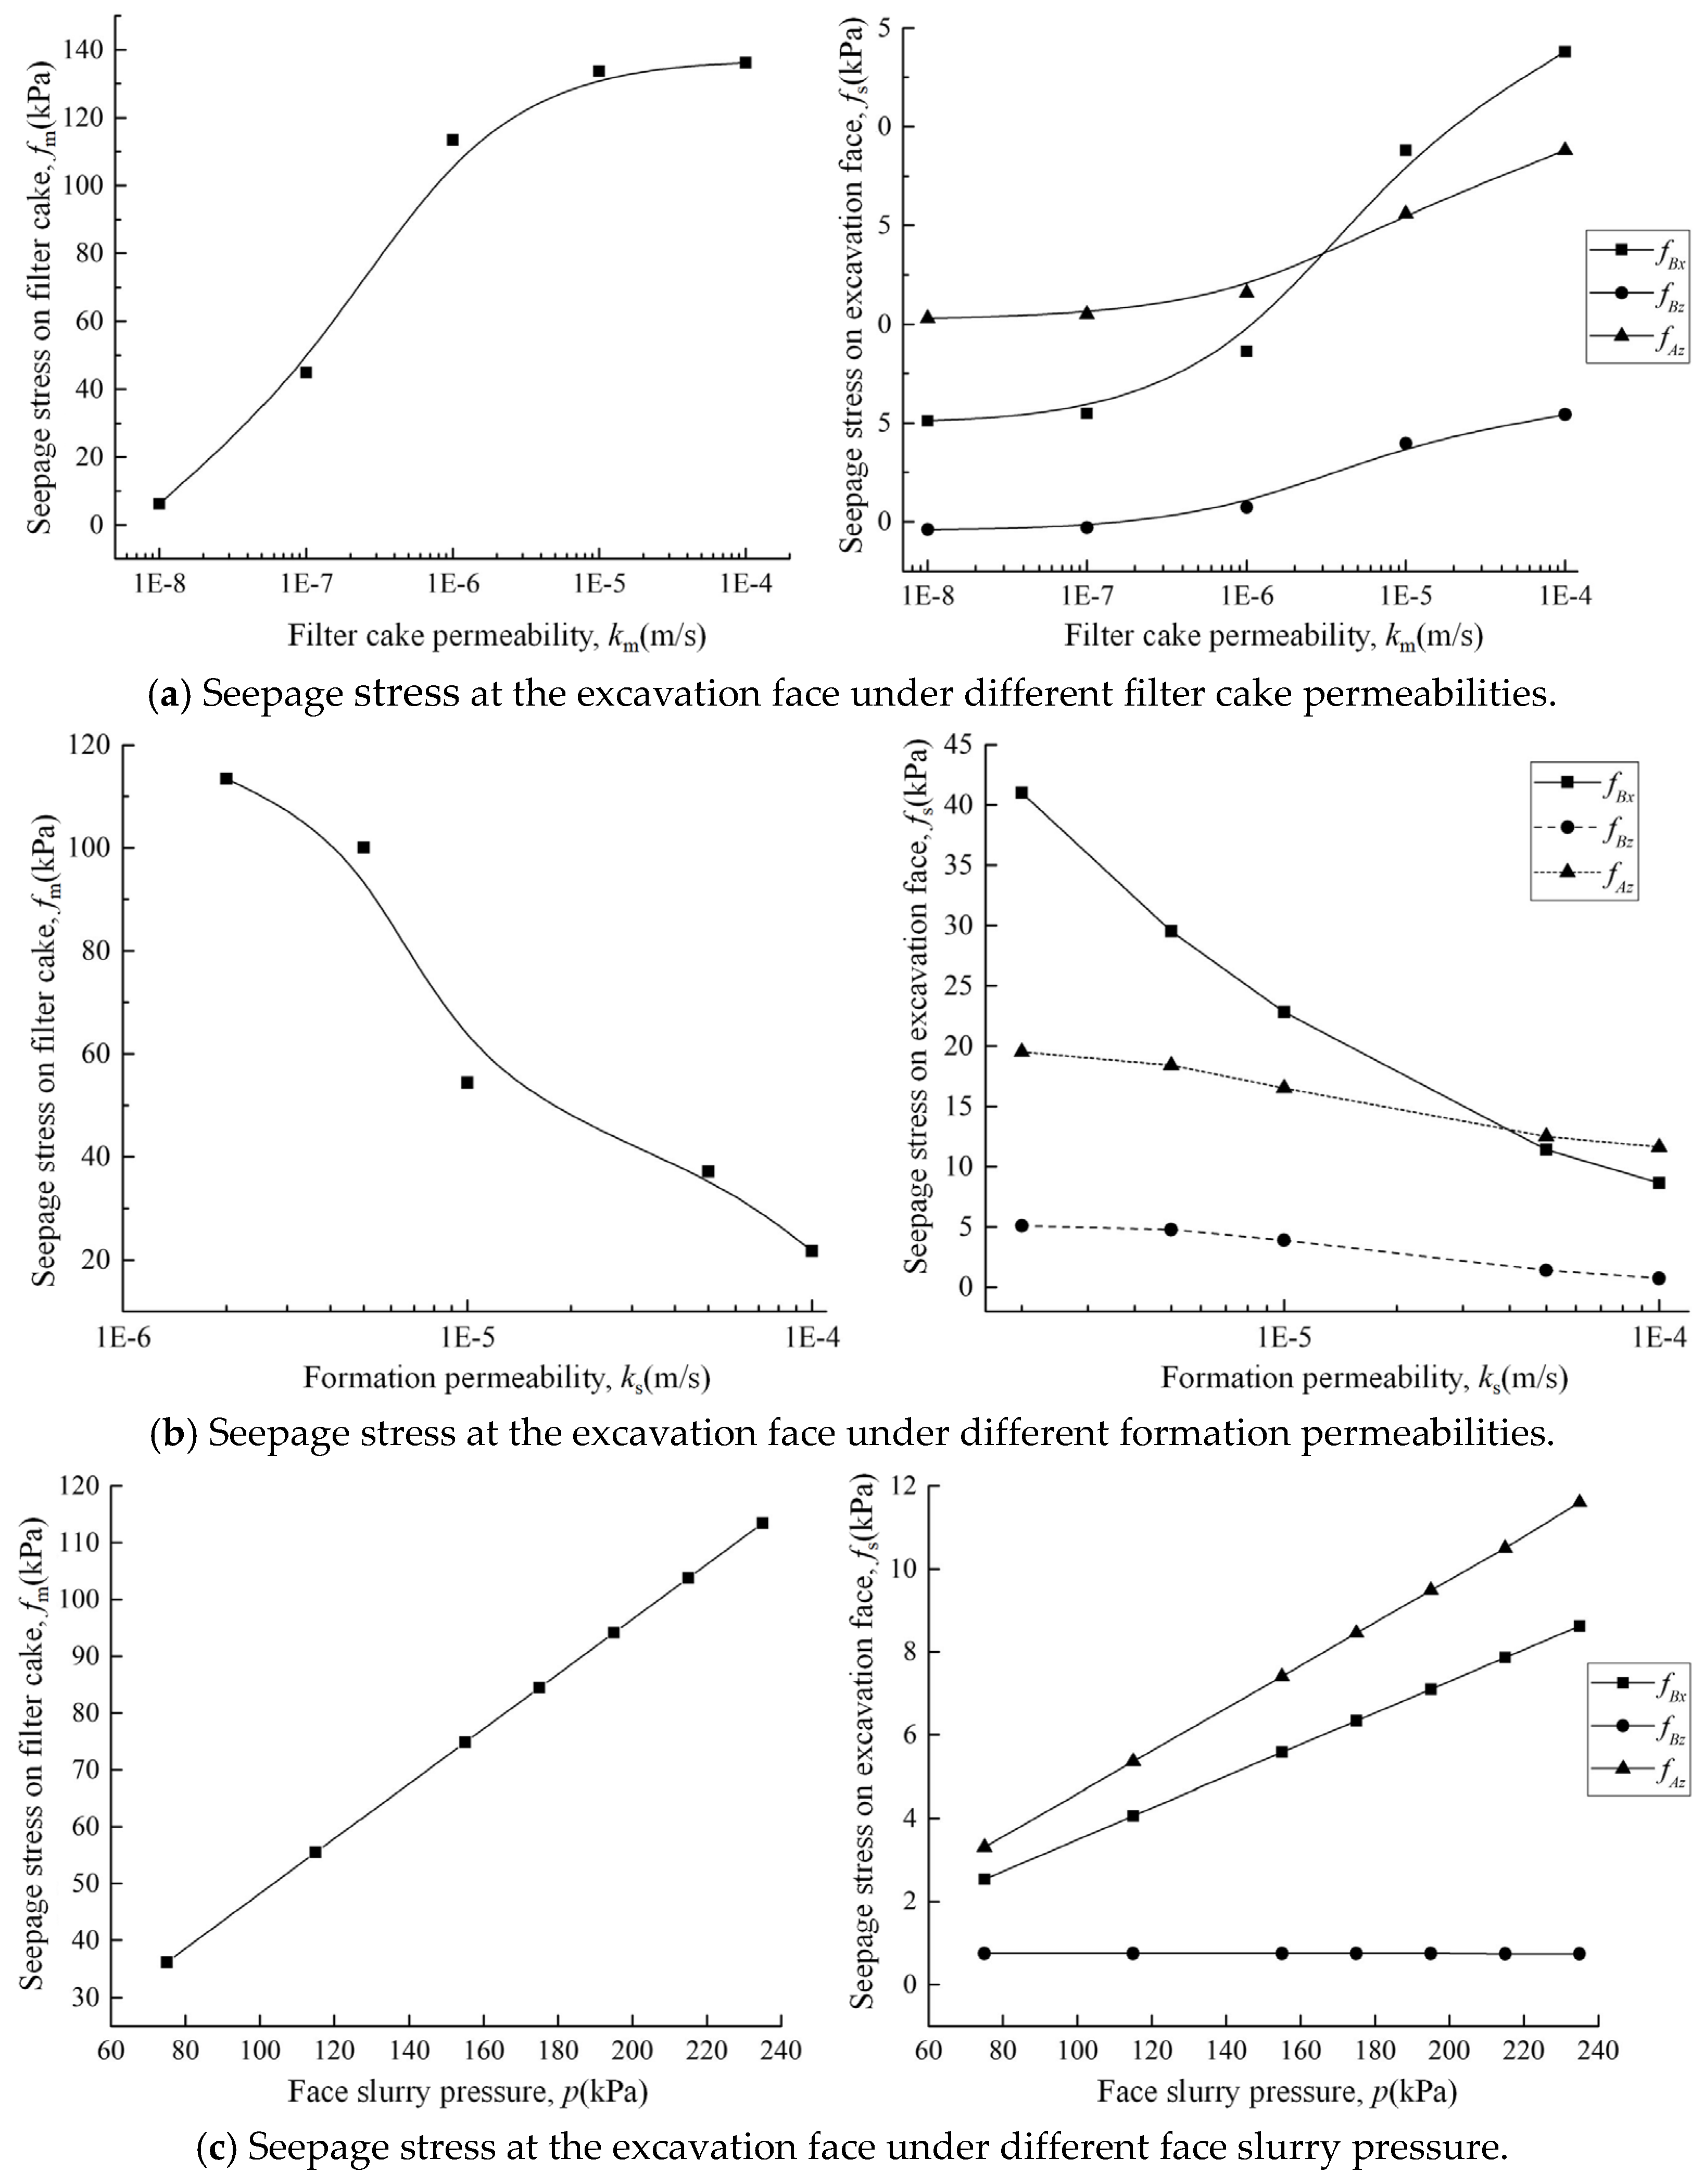
Based on the methodology described above, the seepage forces acting on the filter cake and within the failure zone were calculated separately. These forces are influenced by the permeability coefficient of the filter cake, the permeability of the stratum, and the applied slurry pressure. Each factor was analyzed individually. To investigate the effect of the filter cake permeability, the slurry pressure at the center of the excavation face was set to 460 kPa, the stratum permeability coefficient was fixed at ks = 1.0 × 10⁻⁴ m/s, and the filter cake permeability coefficient km was varied from 1.0 × 10⁻⁸ m/s to 1.0 × 10⁻⁴ m/s in increasing order. The computed seepage forces under different permeability coefficients are presented in Figure 6a. The results indicate that as the filter cake permeability increases, the seepage forces acting on all three blocks in the failure zone increase, and the force on the filter cake itself also rises. However, with increasing km, the proportion of the total seepage force borne by the filter cake relative to that acting on the failure blocks decreases.
To analyze the influence of stratum permeability on the seepage forces acting on both the filter cake and within the failure zone, the slurry pressure at the center of the excavation face was set to 460 kPa, with a fixed filter cake permeability of km = 1.0 × 10⁻⁶ m/s. The stratum permeability coefficient ks was varied in decreasing order across the values: 1.0 × 10⁻⁴, 5.0 × 10⁻⁵, 1.0 × 10⁻⁵, 5.0 × 10⁻⁶, and 2.0 × 10⁻⁶ m/s. The resulting seepage forces under these different permeability conditions are presented in Figure 6b. As stratum permeability increases, the seepage forces on the two blocks in the failure zone decrease, while the seepage force acting on the filter cake decreases more markedly. Moreover, the horizontal seepage force on region B is more sensitive to changes in stratum permeability than the vertical seepage forces on regions A and B.
To evaluate the influence of effective slurry pressure on the seepage forces acting on the filter cake and within the unstable zone, the filter cake permeability was set to km = 1.0 × 10⁻⁶ m/s and the stratum permeability to ks = 1.0 × 10⁻⁴ m/s. The slurry pressure at the center of the excavation face was varied as 300, 340, 380, 400, 420, 440, and 460 kPa, corresponding to effective slurry pressures of 75, 115, 155, 175, 195, 215, and 235 kPa, respectively. The resulting seepage forces under these different pressure conditions are shown in Figure 6c. As the slurry pressure increases, the seepage stress fm on the filter cake, the vertical seepage stress fAy on region A, and the horizontal seepage stress fBx on region B all increase, whereas fBy remains nearly unchanged. The results indicate a clear linear relationship between each of these seepage forces and the effective slurry pressure pe. A linear relationship exists between the seepage forces (fm, fAy and fBx) and the effective slurry pressure pe, expressed as Equation (6):
f m = 0.483 p e f Ay = 0.048 p e f Bx = 0.0365 p e f By = 0.73 kPa

3.3. Critical Slurry Pressure

(1)
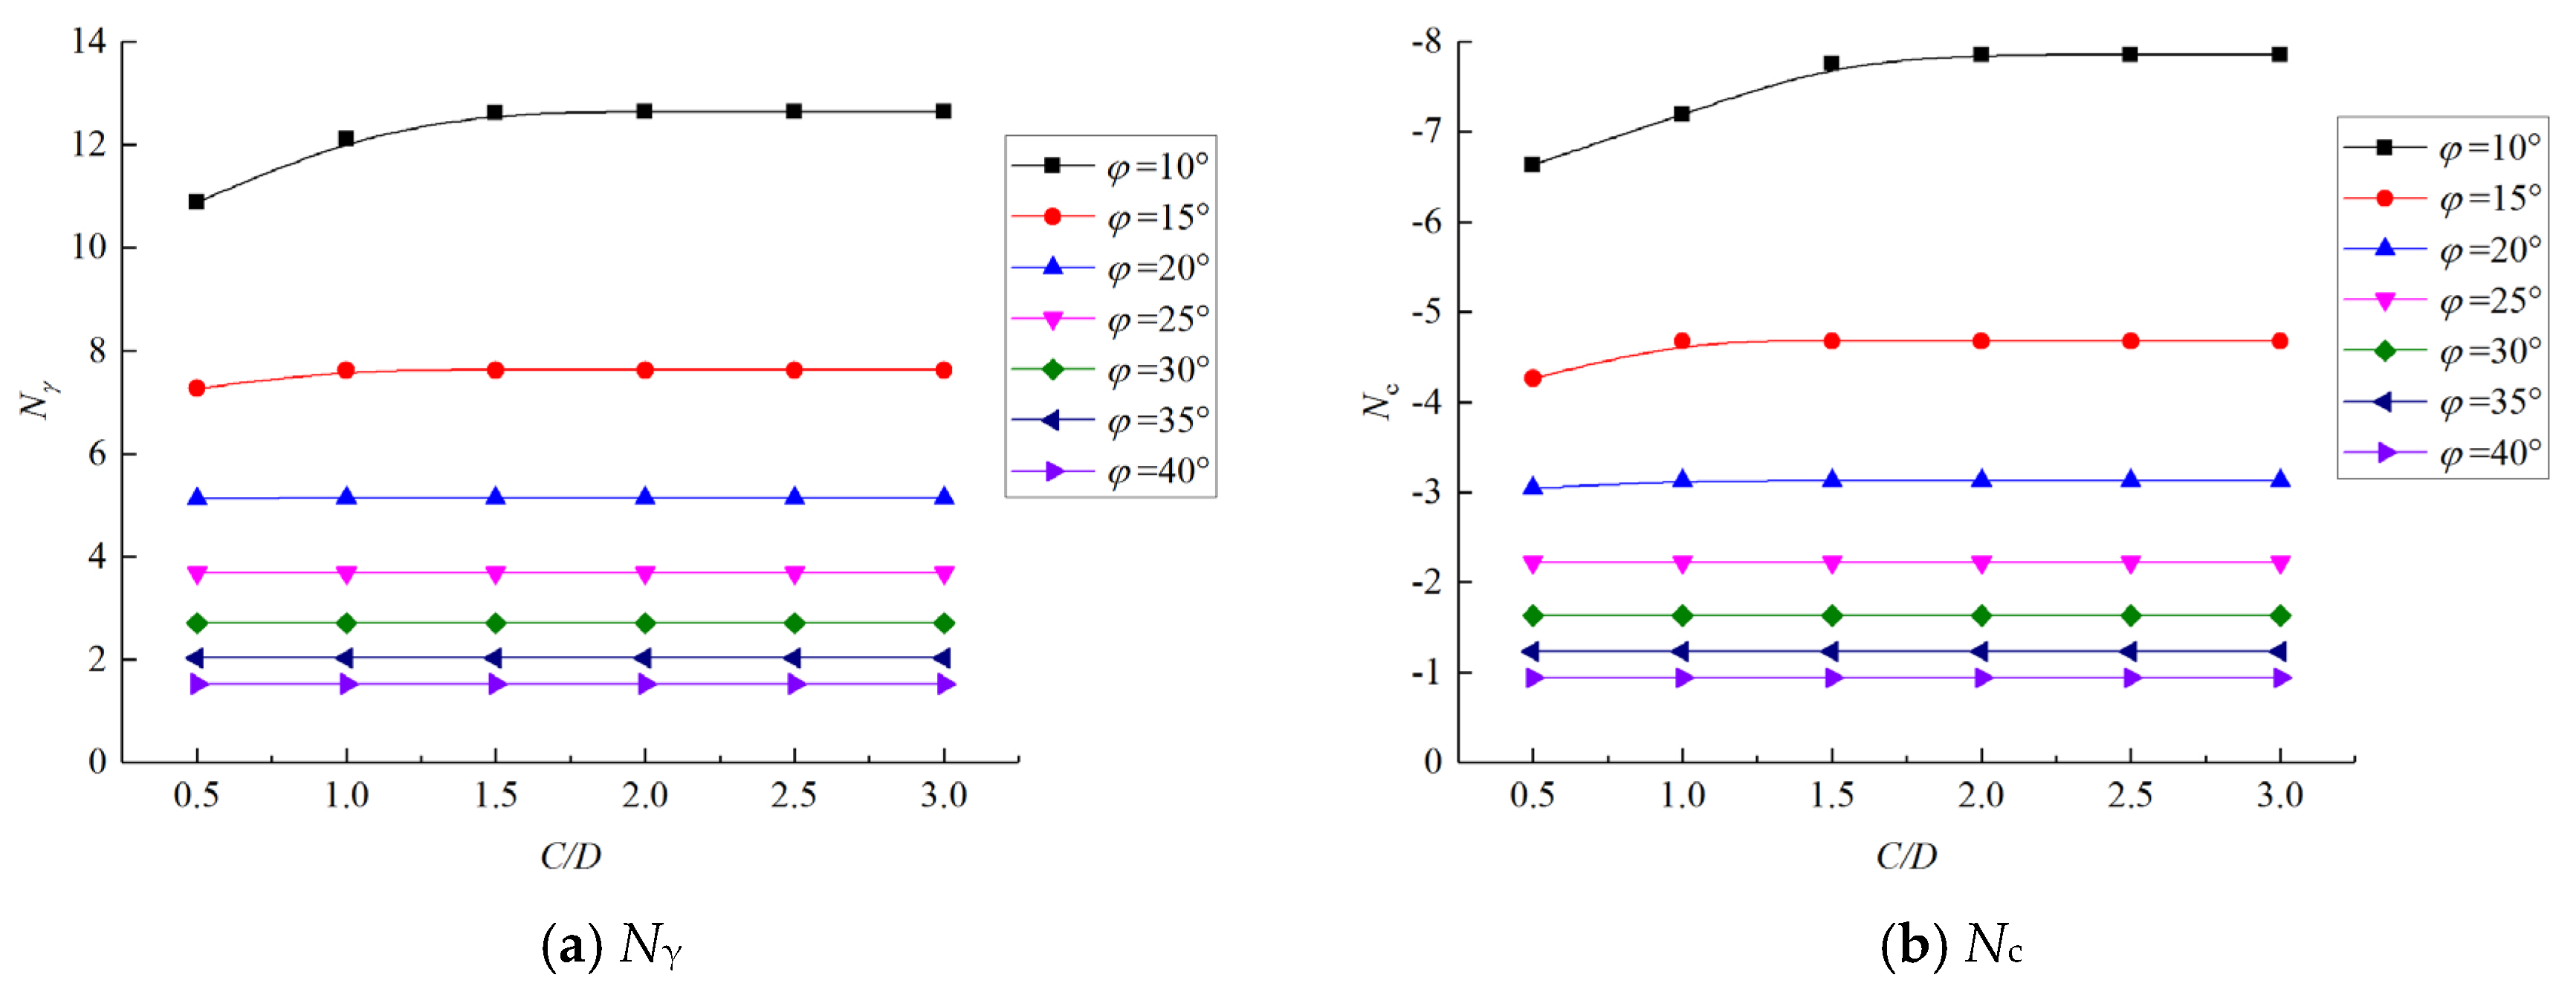
Critical slurry pressure influence coefficient Nγ and Nc
By substituting the relationship between the seepage forces on the filter cake and within the failure zone and the effective slurry pressure (Equation (6)) into the critical slurry pressure equation (Equation (5)), the minimum effective slurry pressure pemin required to maintain excavation face stability—corresponding to σt in the equation—can be obtained.
Figure 7 illustrates the variation in the parameters Nγ and Nc, with burial depth and internal friction angle. The soil internal friction angle φ was varied from 10° to 40°, and the depth ratio C/D was considered over a range of 0.5 to 3.0. The results show that the trends of Nγ and Nc are generally consistent with the variations in the cover-to-diameter ratio C/D and internal friction angle φ. Specifically, under constant burial depth the absolute values of Nγ and Nc decrease gradually as C/D increases, with the rate of decrease slowing at higher friction angles. When φ > 20°, Nγ and Nc exhibit negligible dependence on the depth ratio C/D. For φ = 15° and C/D > 1.0, or for φ = 10° and C/D > 1.5, the parameters also become independent of depth. Under all other conditions, Nγ and Nc, increase gradually with increasing C/D at a fixed internal friction angle [14].
(2)
Influencing factors for critical slurry pressure
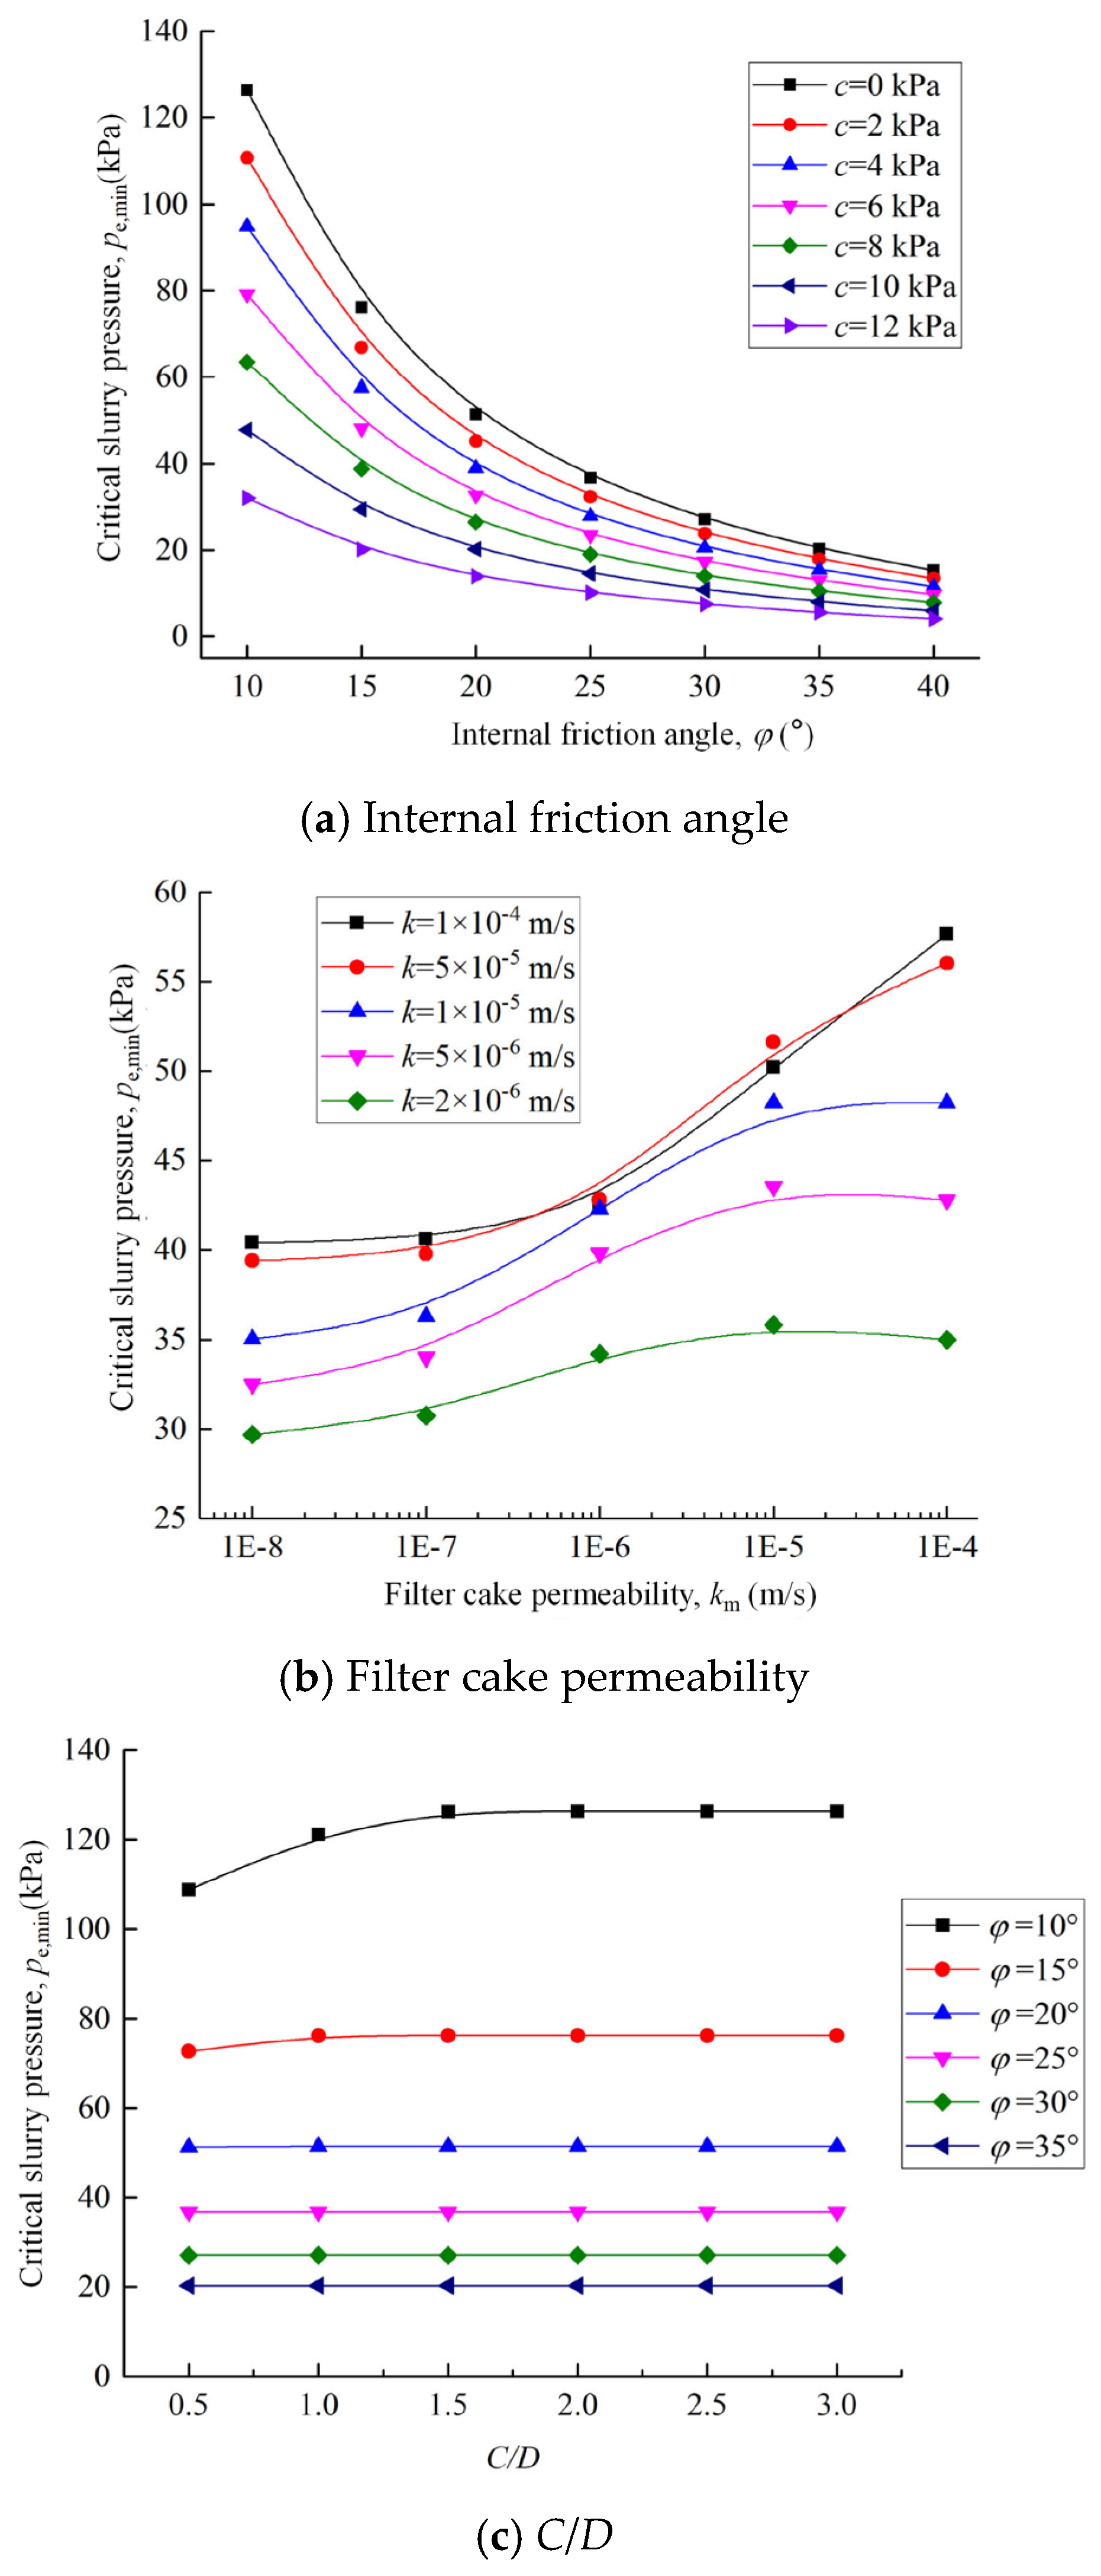
To investigate the influence of the internal friction angle and burial depth on the critical slurry pressure, the following parameters were adopted: a stratum permeability coefficient of ks = 1.0 × 10⁻⁴ m/s, a slightly permeable filter cake at the excavation face with km = 1.0 × 10⁻⁶ m/s, a ground water level at the surface, an effective unit weight of the soil γ = 10 kN/m3, zero cohesion (c = 0 kPa), a burial depth ratio C/D ranging from 0.5 to 3.0, and an internal friction angle φ varying from 10° to 40°. The resulting critical effective slurry pressures are presented in Figure 8. As shown in the Figure, the variation in the critical effective pressure with internal friction angle and burial depth ratio aligns with the behavior of the bearing capacity factors Nγ and Nc. Specifically:
At a given burial depth, the critical effective slurry pressure decreases gradually as the internal friction angle increases, with the rate of decrease diminishing at higher angles.
When φ > 20°, the critical effective slurry pressure becomes independent of the burial depth ratio.
For φ = 15° and C/D > 1.0, or for φ = 10° and C/D > 1.5, the critical pressure remains constant with increasing burial depth.
Under all other combinations, the critical pressure increases gradually with the burial depth ratio for a fixed internal friction angle.
The influence law of formation cohesion on the critical slurry pressure is shown in Figure 8a. Here, the effective weight of the formation is 10 kN/m3, the burial depth ratio C/D is 1.0, the internal friction angle of the soil is set between 10° and 40°, and the cohesion is taken as 0 to 12 kPa. The formation permeability coefficient ks = 1.0 × 10⁻⁴ m/s, the filter cake permeability coefficient km = 1.0 × 10⁻⁶ m/s, and the groundwater level line is at the surface. From the figure, it can be seen that as the cohesion and internal friction angle increase, the critical slurry pressure required to maintain the stability of the excavation face gradually decreases.
To investigate the influence of stratum and filter cake permeability on the critical slurry pressure, the following parameters were adopted: an effective unit weight of stratum γ = 10 kN/m3, a burial depth ratio C/D = 1.0, an internal friction angle φ = 30°, and cohesion c = 0 kPa. The stratum permeability coefficients were set as 1.0 × 10⁻⁴, 5.0 × 10⁻⁵, 1.0 × 10⁻⁵, 5.0 × 10⁻⁵, and 2.0 × 10⁻⁶ m/s, while the filter cake permeability coefficients were taken as 1.0 × 10⁻⁴, 1.0 × 10⁻⁵, 1.0 × 10⁻⁶, 1.0 × 10⁻⁷, and 1.0 × 10⁻⁸ m/s, respectively. The resulting variation in the critical slurry pressure under different permeability coefficients is shown in Figure 8b. It can be observed that under single-factor variation, the critical slurry pressure increases gradually with the increase in the filter cake permeability. Consequently, a higher effective slurry pressure is required to maintain face stability. The stratum permeability also exhibits a positive correlation with the critical slurry pressure. However, when the permeability reaches 5.0 × 10⁻⁵ m/s, the critical slurry pressure shows almost no further change with increasing stratum permeability.

3.4. Case Study—Stability Analysis and Field Validation

The validation of the proposed method follows a four-step procedure: (i) characterization of the composite strata at the selected tunnel sections and determination of equivalent geotechnical parameters via a weighted-average approach; (ii) computation of the transient seepage field using the finite element model described in Section 2.1; (iii) calculation of the seepage force components acting on the failure blocks using the strip method (Section 2.2) and determination of the critical effective slurry pressures via Equation (5); and (iv) comparison of the calculated limit pressures with field-measured slurry pressures.
(1)
Engineering background
The Maliuzhou Transportation Tunnel, located in Zhuhai City, Guangdong Province, China, is a large-diameter subaqueous slurry shield tunnel linking Nanwan District and Hengqin New District. The shield-driven section is approximately 1.1 km long, with an excavation diameter of 14.5 m and a segment outer diameter of 13.3 m. The ring width is 2 m, and the cover depth varies from 7.7 m to 23.0 m along the alignment. The tunnel was excavated using a slurry pressure balance shield machine. The groundwater table is located about 2 m below the ground surface and is hydraulically connected to the Maliuzhou Waterway.
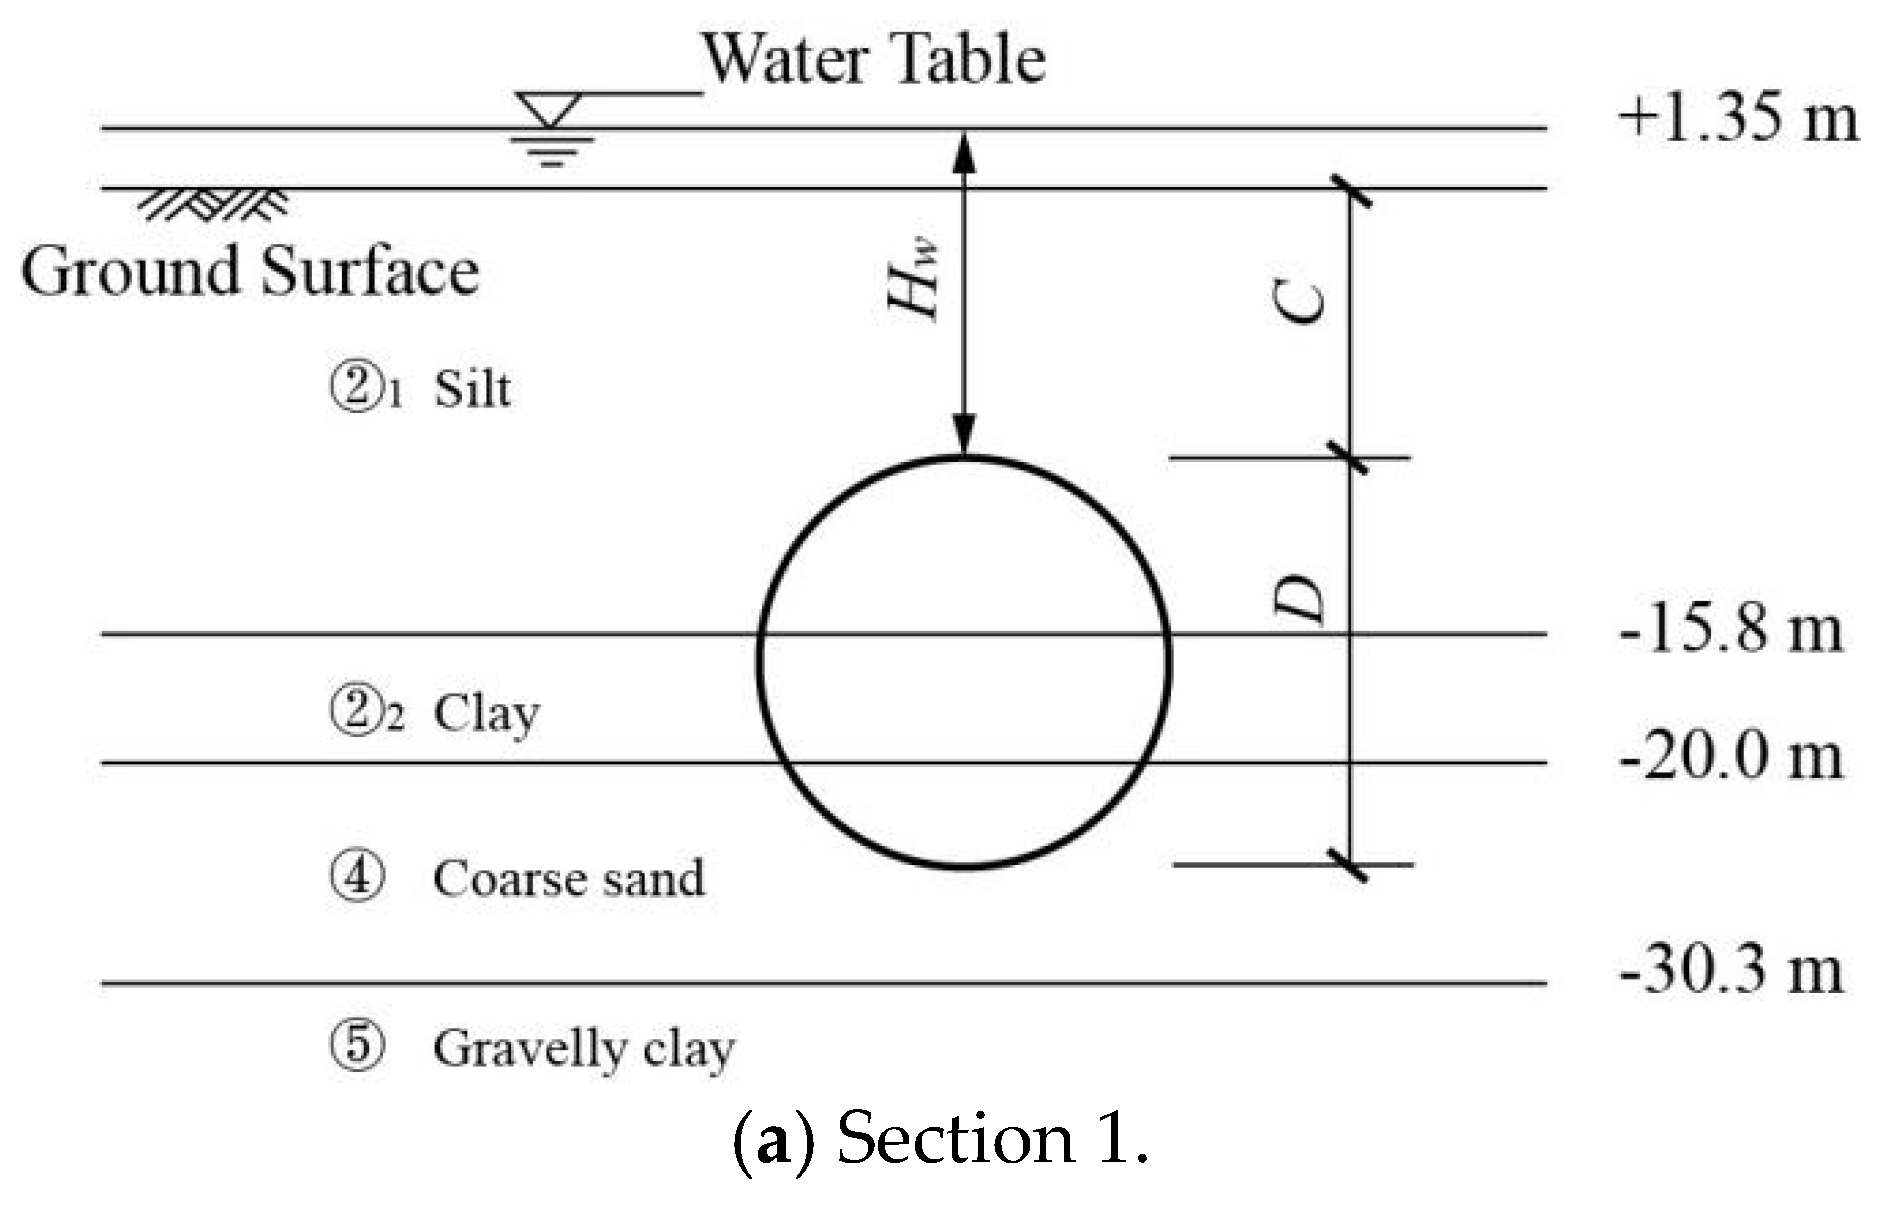
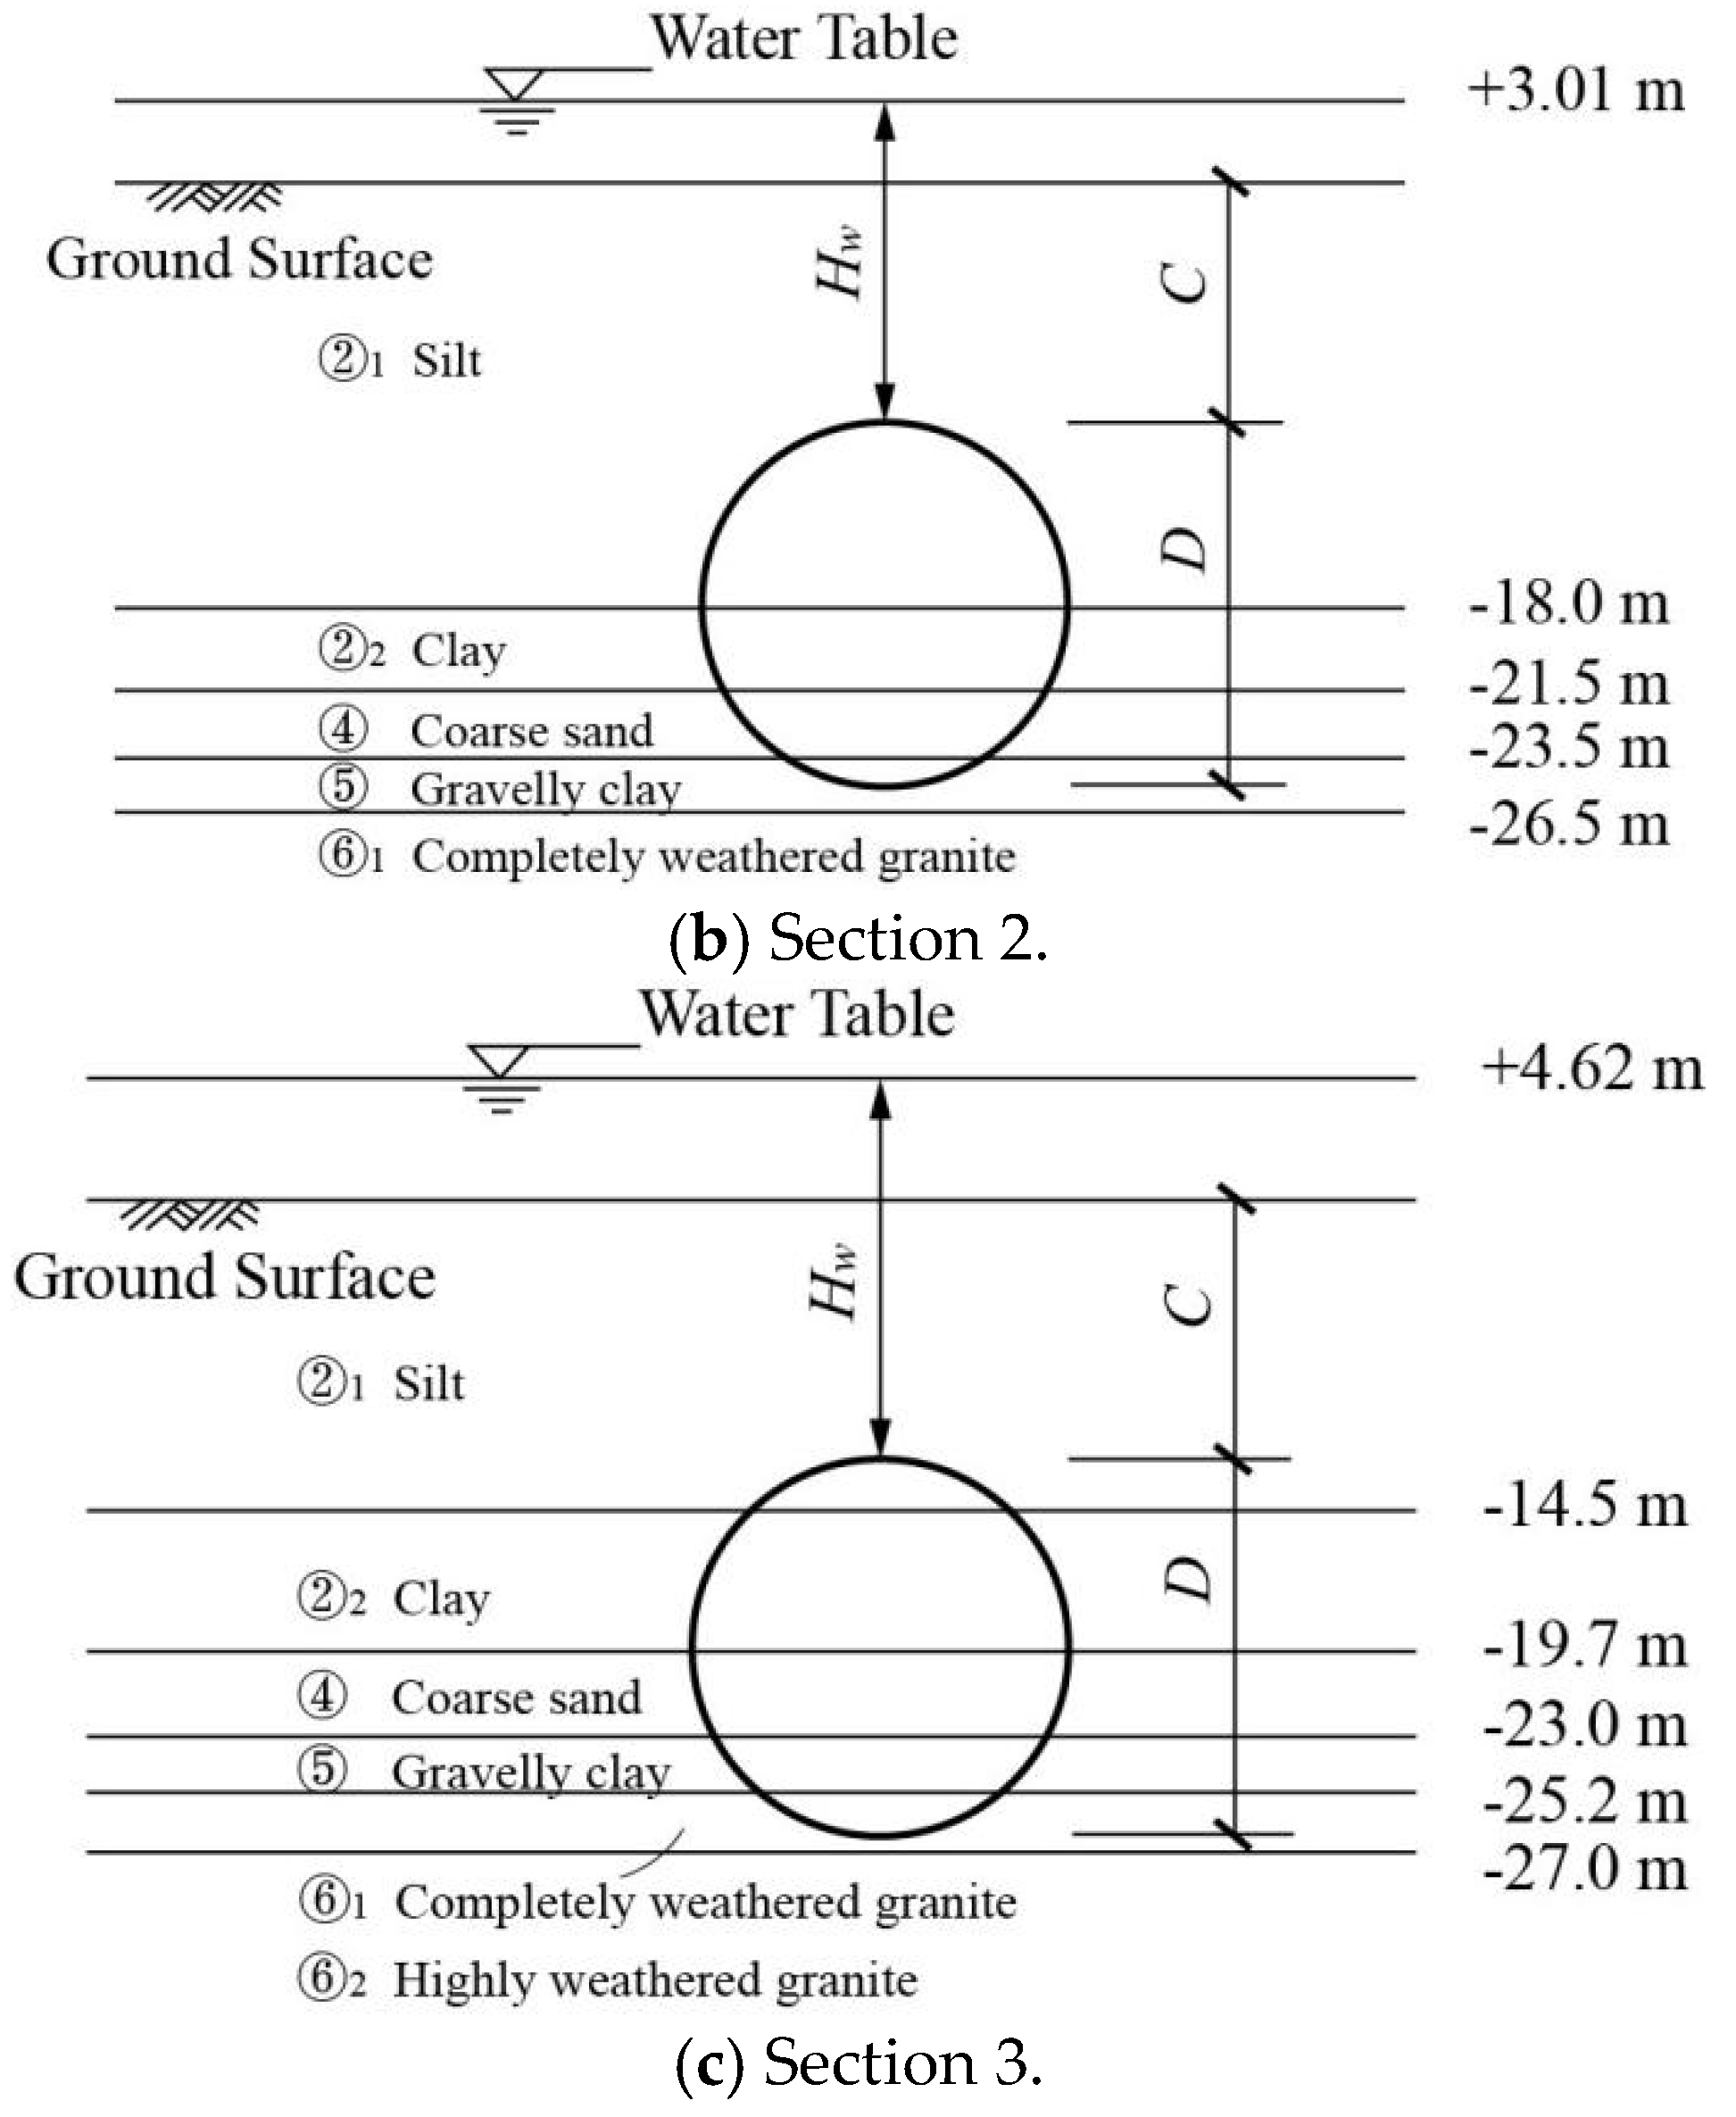
Three representative geological cross-sections within Rings 250–310 are shown in Figure 9. The strata are composite, consisting of silt, clay, coarse sand, gravelly clay, and completely to highly weathered granite. Soil parameters are listed in Table 1.
(2)
Weighted-average parameters for composite strata
Shear strength parameters were determined via consolidated undrained triaxial testing of undisturbed samples, with complete geotechnical properties provided in Table 1. Given the composite nature of the strata in all three sections, a weighted-average procedure based on Perazzelli and Anagnostou [32] was applied to the unit weight and strength parameters over the depth from the tunnel invert to the ground surface. This simplification facilitates stratigraphic modeling, and the resulting averaged parameters are presented in Table 2.
(3)
Critical effective slurry pressures
Using the finite element model described in Section 2.1 [7], the seepage fields for the three sections were computed. The filter cake permeability was set to km = 1.0 × 10⁻⁶ m/s, consistent with the slurry mix design. The seepage force components fAx, fBx, and fBy were calculated via the strip method (Equation (6)).
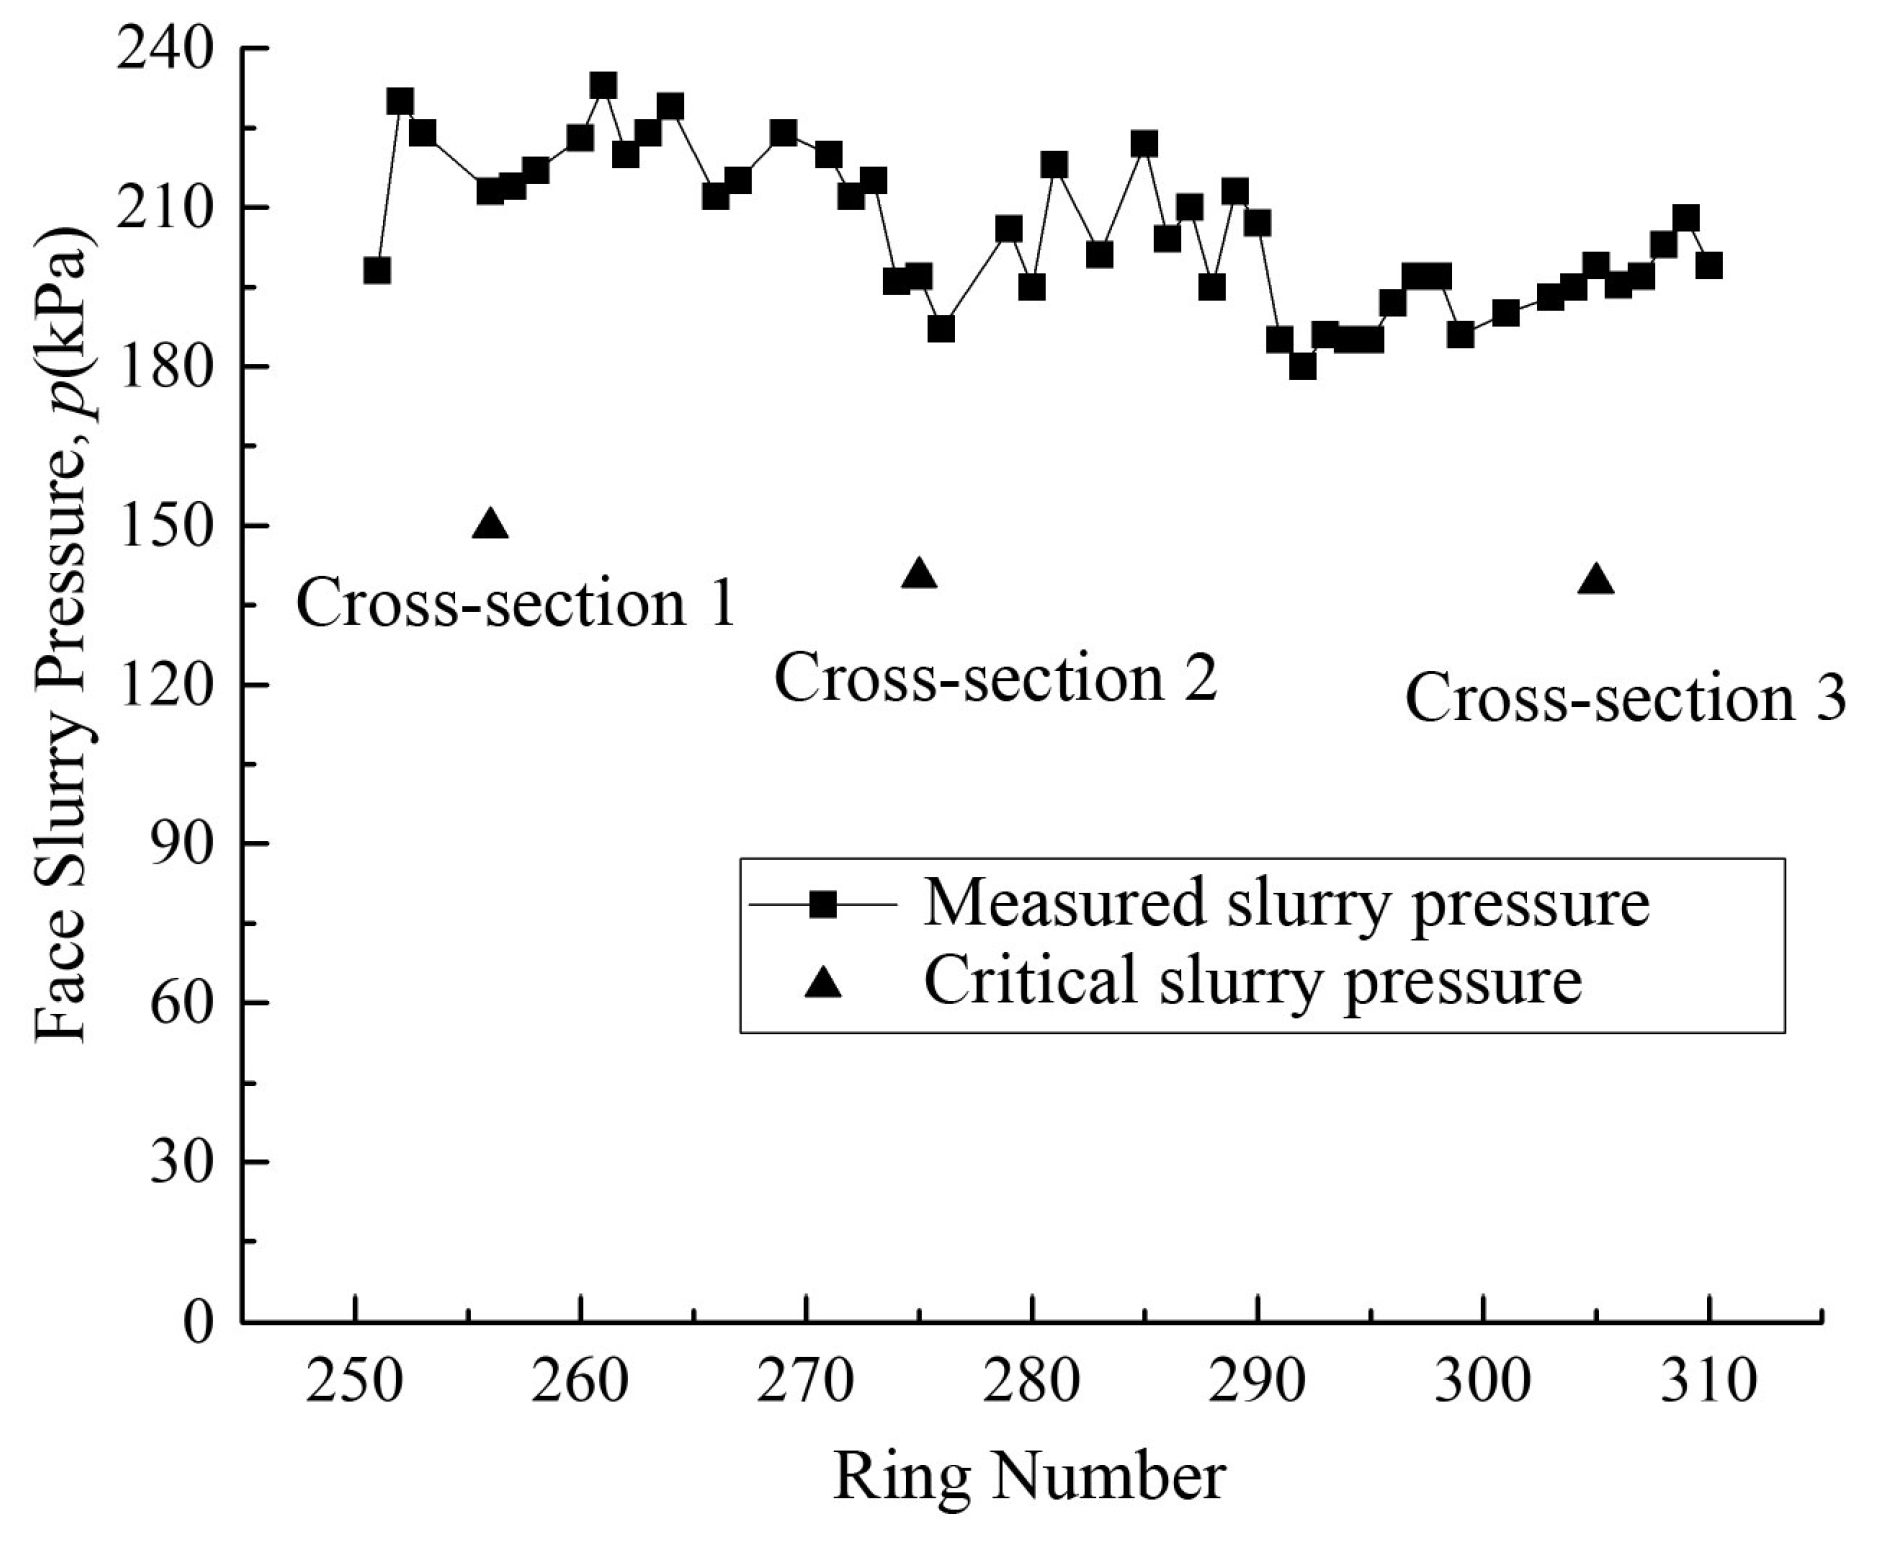
Substituting the computed seepage forces and averaged soil parameters into Equation (5) yields the minimum critical effective slurry pressures: 149.75 kPa (Section 1), 140.37 kPa (Section 2), and 139.31 kPa (Section 3).
(4)
Comparison with field-measured slurry pressures
Critical effective slurry pressures are compared with the field-measured effective slurry pressures (180–240 kPa) for Rings 250–310 in Figure 10. The measured values consistently exceed the theoretical limits, with a safety margin of 1.2–1.7. This confirms that the applied slurry pressure was sufficient to ensure face stability throughout this tunnel segment.
The safety margin reflects both operational practice (operators apply a margin above the theoretical minimum) and the conservative nature of the model (neglecting soil arching and partial filter cake healing [32]). Field monitoring of excavation parameters and riverbed deformation showed no signs of face instability, further supporting the model’s reliability as a lower-bound estimator.

4. Discussion

Compared with classical limit equilibrium methods (e.g., the wedge–prism model proposed by Horn [11] and later extended by Anagnostou and Kovári [12,13]), the present upper-bound framework offers three distinct advantages. First, it directly incorporates the work done by three-dimensional seepage force vectors into the energy balance (Equation (5)), rather than through simplified surcharge terms or a priori assumptions on vertical stress distribution [10,32]. This provides a more rigorous treatment of the seepage–stability coupling. Second, the model explicitly quantifies the permeability threshold effects of both the filter cake and the stratum—specifically, a filter cake permeability threshold of 1.0 × 10⁻⁷ m/s (below which further reduction yields negligible pore pressure decrease) and a stratum permeability ceiling effect at 5.0 × 10⁻⁵ m/s (beyond which the critical pressure becomes insensitive to stratum permeability). These quantitative insights are inaccessible in conventional wedge models that treat the filter cake as either perfectly impermeable or neglect its permeability altogether. Third, the model provides a conservative yet practical lower-bound estimate of the critical support pressure. As demonstrated in the Maliuzhou Tunnel case study, the calculated limit pressures (139–150 kPa) consistently lie below the field-measured values (180–240 kPa), with a safety margin of 1.2–1.7, confirming its reliability as a design tool for guiding slurry pressure selection in complex ground conditions.
The permeability threshold of the filter cake—below 1.0 × 10⁻⁷ m/s, further reduction yields negligible pore pressure decrease—results from the dominant hydraulic resistance of the cake relative to the stratum. When km is sufficiently lower than ks, the total head loss is governed almost entirely by the filter cake, and further reducing km yields diminishing returns. This mechanism also explains why the critical slurry pressure becomes insensitive to stratum permeability beyond 5.0 × 10⁻⁵ m/s (Figure 8b): in highly permeable strata, the hydraulic resistance is overwhelmingly concentrated in the filter cake. The greater sensitivity of horizontal seepage forces to ks arises because horizontal gradients are controlled by the contrast between slurry pressure and in situ pore pressure, whereas vertical gradients are partly gravity-driven and less permeability-dependent.
For engineering practice, the identified threshold provides a quantitative target for slurry mix design, indicating that pursuing ultralow filter cake permeability is unnecessary; resources are better directed toward ensuring rapid filter cake formation and maintaining cake integrity against cutterhead disturbance. For highly permeable strata, optimizing slurry material properties is more effective than further increasing the applied pressure. The closed-form critical pressure expression (Equation (5)) and the seepage force–pressure relationship (Equation (6)) offer a practical estimation tool, and the 1.2–1.7 safety margin observed at the Maliuzhou Tunnel reflects both operational conservatism and the conservative nature of the model, which omits stabilizing factors such as soil arching and partial filter cake healing [32]. In complex construction scenarios, a well-validated theoretical model can provide valuable guidance for parameter selection when its limitations are clearly understood.
Several limitations arising from the modeling assumptions should be acknowledged. First, the model assumes a homogeneous isotropic stratum obeying Darcy’s law; in practice, natural soils are often layered or anisotropic, and non-Darcy flow may occur in coarse granular soils under the high hydraulic gradients that develop across the thin filter cake. Second, the slurry infiltration zone is not explicitly modeled. As discussed in Section 2.1.4, omitting this low-permeability transition layer yields a conservative (upper-bound) estimate of excess pore pressure, which is prudent for face-stability assessment; however, the degree of conservatism cannot be quantified without explicit infiltration modeling. Third, the filter cake is treated as a uniform equivalent layer with constant permeability, without resolving its time-dependent growth or the cyclic damage and non-uniformity induced by cutterhead rotation. Fourth, the stability assessment is quasi-static and does not capture transient pressure fluctuations during shield advance. Finally, a formal mesh convergence study was not performed; the element sizes were selected based on established criteria for seepage finite element analysis (Section 2.1.4), and while the consistency with field observations (Section 3.4) provides indirect support, the numerical accuracy cannot be rigorously quantified without systematic grid refinement. All numerical and analytical models of geotechnical construction processes necessarily adopt simplifying assumptions, and the key is to identify which simplifications are conservative and which may lead to unconservative estimates. Future work should address these limitations through heterogeneous and anisotropic modeling, non-Darcy flow formulations, transient cutterhead—cake interaction, fully three-dimensional limit analysis, and controlled experimental validation.

5. Conclusions

Based on theoretical analysis incorporating a three-dimensional failure mechanism and comprehensive numerical simulations, this study develops an upper-bound limit analysis model for slurry shield tunnel face stability that explicitly accounts for slurry infiltration and the resulting seepage forces. The main findings are summarized as follows:
(1)
The filter cake permeability controls the pore pressure ahead of the face. Its influence diminishes below a threshold of 1.0 × 10⁻⁷ m/s. Pore pressure increases with stratum permeability and slurry pressure, exhibiting gradual variation in permeable strata and sharper gradients in low-permeability layers.
(2)
Seepage forces on the failure blocks and filter cake increase linearly with slurry pressure and filter cake permeability, but decrease with stratum permeability. As filter cake permeability rises, its share of the total seepage force decreases.
(3)
A closed-form solution for the limit slurry pressure is derived by incorporating seepage work into a kinematically admissible failure mechanism. The solution explicitly includes the effects of cohesion, surcharge, soil weight, and seepage.
(4)
The limit pressure decreases with higher cohesion and internal friction angle, shows little dependence on burial depth, and increases with both filter cake and stratum permeability.
(5)
Field data from the Maliuzhou Tunnel (Rings 250–310) show applied slurry pressures (180–240 kPa) consistently above the calculated limit values (139–150 kPa), confirming face stability and validating the model.
The present model assumes homogeneous strata and Darcy-type seepage, and does not incorporate dynamic construction effects or cutterhead–soil interaction. Future studies should address non-homogeneous/permeable formations, non-Darcy flow under high gradients, and the transient coupling between advancing excavation and seepage-stability evolution.

Author Contributions

Y.Z.: Resources, funding acquisition, writing—review and editing. K.S.: Resources, conceptualization, methodology, validation. J.W.: Formal analysis, investigation, data curation, writing—original draft. J.G.: Formal analysis, investigation, data curation, writing—original draft. All authors have read and agreed to the published version of the manuscript.

Funding

This research was supported by the Key Scientific Research Projects of Henan Province Higher Education Institutions (Grant No. 22A410004); the Science and Technology Project of Henan Province (Grant No. 222102320383); the Research Start-up Project for High-level Talents of Zhengzhou University of Technology (Grant No. zggk202104); and the new round of construction project of key academic discipline in Henan Province (Teaching and Research [2023] No.414 issued by Education Department of Henan Province).

Data Availability Statement

Data are contained within the article.

Conflicts of Interest

Author Jianglong Guo was employed by the company China Railway Engineering Equipment Group Co., Ltd. The remaining authors declare that the research was conducted in the absence of any commercial or financial relationships that could be construed as a potential conflict of interest.

Nomenclature

SymbolDefinitionUnit
CCover depth from ground surface to tunnel crownm
DTunnel diameterm
C/DCover-to-diameter ratio
ksPermeability coefficient of stratumm/s
kmPermeability coefficient of filter cakem/s
peEffective slurry pressure at the tunnel face centerkPa
pe,minMinimum critical effective slurry pressurekPa
fAx, fAyHorizontal/vertical component of seepage force per unit area on Region AkN/m3
fBx, fByHorizontal/vertical component of seepage force per unit area on Region BkN/m3
FAyTotal vertical seepage force on Region AkN
FBx, FByTotal horizontal/vertical seepage force on Region BkN
FmSeepage force on filter cakekN
hHydraulic headm
γwUnit weight of waterkN/m3
γEffective unit weight of soilkN/m3
cEffective cohesionkPa
φEffective internal friction angle°
NcBearing capacity factor for cohesion
NγBearing capacity factor for soil weight
NqBearing capacity factor for surcharge
NFInfluence coefficient for seepage force
tTimes
dmThickness of the filter cakem
iHydraulic gradient

References

  1. Vermeer, P.A.; Ruse, N.M.; Marcher, T. Tunnel heading stability in drained ground. Felsbau 2002, 20, 8–18. [Google Scholar]
  2. Li, Y.; Emeriault, F.; Kastner, R.; Zhang, Z.X. Stability analysis of large slurry shield-driven tunnel in soft clay. Tunn. Undergr. Space Technol. 2009, 24, 472–481. [Google Scholar] [CrossRef]
  3. Lv, X.L.; Zhou, Y.C.; Huang, M.S.; Li, F.D. Computation of the minimum limit support pressure for the shield tunnel face stability under seepage condition. Int. J. Civ. Eng. 2017, 15, 849–863. [Google Scholar] [CrossRef]
  4. Chen, R.P.; Tang, L.J.; Ling, D.S.; Chen, Y.M. Face stability analysis of shallow shield tunnels in dry sandy ground using the discrete element method. Comput. Geotech. 2011, 38, 187–195. [Google Scholar] [CrossRef]
  5. Zhang, Z.X.; Hu, X.Y.; Scott, K.D. A discrete numerical approach for modeling face stability in slurry shield tunnelling in soft soils. Comput. Geotech. 2011, 38, 94–104. [Google Scholar] [CrossRef]
  6. Wu, L.; Guan, T.; Lei, L. Discrete element model for performance analysis of cutterhead excavation system of EPB machine. Tunn. Undergr. Space Technol. 2013, 37, 37–44. [Google Scholar] [CrossRef]
  7. Li, W.; Zhang, C.P.; Tan, Z.B.; Ma, M. Effect of the seepage flow on the face stability of a shield tunnel. Tunn. Undergr. Space Technol. 2021, 112, 103900. [Google Scholar] [CrossRef]
  8. Di, Q.G.; Li, P.F.; Zhang, M.J.; Cui, X. Experimental study on stress distribution characteristics of a shield tunnel under passive failure. Eng. Fail. Anal. 2023, 154, 107725. [Google Scholar] [CrossRef]
  9. Yin, X.S.; Chen, R.P.; Meng, F.Y. Influence of seepage and tunnel face opening on face support pressure of EPB shield. Comput. Geotech. 2021, 135, 104198. [Google Scholar] [CrossRef]
  10. Liu, H.; Zhang, Y.; Liu, H. Failure mechanism of face for slurry shield-driven tunnel in sand. KSCE J. Civ. Eng. 2020, 24, 326–335. [Google Scholar] [CrossRef]
  11. Horn, M. Horizontal earth pressure on vertical tunnel fronts. In Landeskonferenz der Ungarischen Tiefbauindustrie; STUVA Düsseldorf: Cologne, Germany, 1961; pp. 7–16. [Google Scholar]
  12. Anagnostou, G.; Kovári, K. The face stability of slurry shield-driven tunnels. Tunn. Undergr. Space Technol. 1994, 9, 165–174. [Google Scholar] [CrossRef]
  13. Anagnostou, G.; Kovári, K. Face stability conditions with earth-pressure-balanced shields. Tunn. Undergr. Space Technol. 1996, 11, 165–173. [Google Scholar] [CrossRef]
  14. Leca, E.; Dormieux, L. Upper and lower bound solutions for the face stability of shallow circular tunnels in frictional material. Géotechnique 1990, 40, 581–606. [Google Scholar] [CrossRef]
  15. Soubra, A.-H. Three-dimensional face stability analysis of shallow circular tunnels. In Proceedings of the International Conference on Geotechnical and Geological Engineering, Melbourne, Australia, 19–24 November 2000. [Google Scholar]
  16. Subrin, D.; Wong, H. Tunnel face stability in frictional material: A new 3D failure mechanism. Comptes Rendus Mécanique 2002, 330, 513–519. [Google Scholar] [CrossRef]
  17. Liu, W.; Zhang, X.; Wu, B.; Huang, Y. An improved mechanism for partial blowout instability of tunnel face in large slurry shield-driven tunnels. Acta Geotech. 2024, 19, 3021–3038. [Google Scholar] [CrossRef]
  18. Sun, R.; Yang, J.S.; Lan, Y.H.; Cai, H.; Zhang, K.; Yang, F. Undrained face stability analysis of dual circular tunnels using three-dimensional adaptive lower bound finite element limit analysis method. Comput. Geotech. 2024, 173, 106484. [Google Scholar] [CrossRef]
  19. Zheng, X.C.; Yang, F.; Shiau, J.; Lai, F.; Dias, D. Unlined length effect on the tunnel face stability and collapse mechanisms in c-ϕ soils: A numerical study with advanced mesh adaptive strategies. Comput. Geotech. 2023, 161, 105576. [Google Scholar] [CrossRef]
  20. Di, Q.G.; Li, P.F.; Zhang, M.J.; Wu, J. Influence of permeability anisotropy of seepage flow on the tunnel face stability. Undergr. Space 2023, 8, 1–14. [Google Scholar] [CrossRef]
  21. Hou, C.T.; Yang, X.L. 3D stability analysis of tunnel face with influence of unsaturated transient flow. Tunn. Undergr. Space Technol. 2022, 123, 104414. [Google Scholar] [CrossRef]
  22. Hou, C.T.; Zhang, Z.L.; Yang, X.L. Three-dimensional tunnel face stability considering the steady-state seepage in saturated and unsaturated regions with changing water levels. Comput. Geotech. 2022, 146, 104741. [Google Scholar] [CrossRef]
  23. Li, T.Z.; Dias, D.; Li, Z.W. Failure potential of a circular tunnel face under steady-state unsaturated flow condition. Comput. Geotech. 2020, 117, 103231. [Google Scholar] [CrossRef]
  24. Zhang, S.L.; Cheng, X.S.; Qi, L.; Zhou, X. Face stability analysis of large diameter shield tunnel in soft clay considering high water pressure seepage. Ocean Eng. 2022, 253, 111283. [Google Scholar] [CrossRef]
  25. Chen, G.H.; Zou, J.F.; Guo, Y.F.; Shu, D.; Li, M. Three-dimensional passive partial failure analysis of the excavation face of a shield tunnel. Int. J. Geomech. 2025, 25, 04025131. [Google Scholar] [CrossRef]
  26. Yin, X.S. Study on the Stability of Shield Tunnel Face Under Seepage Condition Based on Limit Equilibrium Theory. Ph.D. Thesis, Zhejiang University, Hangzhou, China, 2017. [Google Scholar]
  27. Kim, S.H.; Tonon, F. Face stability and required support pressure for TBM driven tunnels with ideal face membrane–Drained case. Tunn. Undergr. Space Technol. 2010, 25, 526–542. [Google Scholar] [CrossRef]
  28. Broere, W. Influence of excess pore pressures on the stability of the tunnel face. In (Re)Claiming the Underground Space; Swets & Zeitlinger B.V.: Lisse, The Netherlands, 2003; pp. 759–765. [Google Scholar]
  29. Lee, I.M.; Nam, S.W. The study of seepage forces acting on the tunnel lining and tunnel face in shallow tunnels. Tunn. Undergr. Space Technol. 2001, 16, 31–40. [Google Scholar] [CrossRef]
  30. Lee, I.M.; Nam, S.W.; Ahn, J.H. Effect of seepage forces on tunnel face stability. Can. Geotech. J. 2003, 40, 342–350. [Google Scholar] [CrossRef]
  31. Perazzelli, P.; Cimbali, G.; Anagnostou, G. Stability under seepage flow conditions of a tunnel face reinforced by bolts. Procedia Eng. 2017, 191, 215–224. [Google Scholar] [CrossRef]
  32. Perazzelli, P.; Anagnostou, G. Tunnel face stability under seepage flow conditions. Tunn. Undergr. Space Technol. 2014, 43, 459–469. [Google Scholar] [CrossRef]
  33. Liu, W. Upper Bound Analysis for the Face Stability of Earth Pressure Balance Shield in Saturated Sandy and Layered Soils Considering Seepage. Ph.D. Thesis, Tongji University, Shanghai, China, 2015. [Google Scholar]
  34. Song, S.G. Study on the Stability of Shield Tunnel Face Under Groundwater Seepage Using Upper Bound Limit Analysis. Ph.D. Thesis, Shandong University, Jinan, China, 2016. [Google Scholar]
  35. Lv, X.L.; Wang, H.R.; Huang, M.S. Upper Bound Solution for the Face Stability of Shield Tunnel below the Water Table. Math. Probl. Eng. 2014, 2014, 727964. [Google Scholar] [CrossRef]
  36. Lv, X.L.; Zhao, Y.C.; Xue, D.W.; Lim, K.W.; Qin, H.L. Numerical modelling of shield tunnel face failure through a critical state sand plasticity model with nonlocal regularization. Comput. Geotech. 2023, 164, 105847. [Google Scholar] [CrossRef]
  37. Ning, J.X.; Huang, M.S.; Yu, J. Tunnel face stability based on the method of infinitesimally thin slices incorporating slurry infiltration. Comput. Geotech. 2025, 188, 107582. [Google Scholar] [CrossRef]
  38. Pan, Q.J.; Hou, C.T.; Xiong, H.; Yang, Z. Three-dimensional tunnel face stability using a new heterogeneous dynamic filter cake. Can. Geotech. J. 2025, 62, 1–22. [Google Scholar] [CrossRef]
  39. Chen, Y.B.; Lv, Y.D.; Ling, D.S.; Ye, X.; Liu, H. A novel filter cake formation model for slurry shield excavation. Transp. Geotech. 2025, 55, 101732. [Google Scholar] [CrossRef]
  40. Liu, K.Q.; Zhao, W.; Wang, Z.C.; Wu, N.; Dias, D. Theoretical model and parameter sensitivity analysis of the filter cake formation during slurry shield tunnelling. Constr. Build. Mater. 2024, 425, 136548. [Google Scholar]
  41. Xu, T.; Wu, X.; Liu, J.; Zhang, D. A biomass-enhanced bentonite slurry for shield tunnelling in the highly permeable soil. Tunn. Undergr. Space Technol. 2024, 147, 105744. [Google Scholar] [CrossRef]
Figure 1. Geometry and dimensions of the slurry shield tunnel model.
Buildings 16 02561 g001
Figure 2. Schematic of the active failure zone in the upper-bound model (a) Particle flow calculation results (adapted from [10]) and (b) Theoretical model of the upper-bound method for limit analysis.
Buildings 16 02561 g002
Figure 3. Discretization scheme of the failure region.
Buildings 16 02561 g003
Figure 4. Pore water pressure distribution under various filter cake conditions.
Buildings 16 02561 g004
Figure 5. Distribution of seepage pressure at the tunnel face.
Buildings 16 02561 g005aBuildings 16 02561 g005b
Figure 6. Seepage force at the excavation face as a function of influencing factors.
Buildings 16 02561 g006
Figure 7. Dependence of Nγ and Nc on burial depth and internal friction angle.
Buildings 16 02561 g007
Figure 8. Influence of key parameters on the critical slurry pressure.
Buildings 16 02561 g008
Figure 9. Typical cross-sections of the shield tunnel.
Buildings 16 02561 g009aBuildings 16 02561 g009b
Figure 10. Measured versus theoretical slurry pressures.
Buildings 16 02561 g010
Table 1. Equivalent geotechnical parameters of the composite strata.
StratumUnit Weight (kN/m3)Effective Cohesion (kPa)Effective Friction Angle (°)Permeability Coefficient (m/s)
Silt16.59.08.06.0 × 10−9
Clay19.330.015.84.35 × 10−8
Coarse sand19.50.028.95.0 × 10−4
Gravelly clay18.319.518.81.5 × 10−7
Completely weathered granite18.944.026.06.88 × 10−8
Highly weathered granite18.978.028.96.88 × 10−8
Table 2. Weighted-average parameters of the composite strata.
SectionUnit Weight (kN/m3)Cohesion (kPa)Internal Friction Angle (°)
Section 117.918.8516.19
Section 217.3012.2811.83
Section 317.7115.1314.14
Disclaimer/Publisher’s Note: The statements, opinions and data contained in all publications are solely those of the individual author(s) and contributor(s) and not of MDPI and/or the editor(s). MDPI and/or the editor(s) disclaim responsibility for any injury to people or property resulting from any ideas, methods, instructions or products referred to in the content.