Article

Vision-Based Deformation Monitoring and Risk Analysis of Adjacent High-Speed Railway Piers Under Full Construction Process of New Bridges

1
School of Transportation and Civil Engineering, Shandong Jiaotong University, Jinan 250357, China
2
State Key Laboratory of Tunnel Engineering, China University of Mining and Technology (Beijing), Beijing 100083, China
3
Department of Civil Engineering, Suzhou University of Science and Technology, Suzhou 250001, China
4
State Key Laboratory of Mountain Bridge and Tunnel Engineering, Chongqing Jiaotong University, Chongqing 400030, China
5
Jiangsu Building Science & Technology Institute Co., Ltd., Suzhou 250001, China
*
Author to whom correspondence should be addressed.
Buildings 2026, 16(12), 2393; https://doi.org/10.3390/buildings16122393
Submission received: 20 April 2026 / Revised: 3 June 2026 / Accepted: 12 June 2026 / Published: 16 June 2026

Abstract

The extensive development of high-speed railway (HSR) networks often necessitates construction activities adjacent to operational lines. However, existing studies have mostly focused on the substructure construction phase, lacking systematic consideration of cumulative effects throughout the construction process. This study proposes an integrated framework for risk-informed monitoring throughout the full construction process. The framework integrates the Analytic Hierarchy Process (AHP), triangular fuzzy numbers, and fuzzy comprehensive evaluation to construct a quantitative risk assessment model, decomposing the construction process into hierarchical risk factors and quantifying the weights of each factor. Furthermore, a non-contact real-time monitoring system based on Digital Image Correlation (DIC) is designed and deployed, enabling high-frequency, high-precision three-dimensional pier deformation measurement. Applied to a new bridge crossing the Beijing–Shanghai HSR, the risk model identified pile cap and pier construction as the highest-risk stage (weight: 0.311). The DIC system, validated against total station measurements (relative error < 5%), recorded cumulative pier deformations across 31 construction stages, all remaining within the ±1.2 mm early warning threshold, thereby validating the proposed risk assessment model. The integrated AHP-Fuzzy and DIC framework provides a robust paradigm for proactive risk management, confirming that risk-informed monitoring ensures construction impacts on existing HSR infrastructure remain within safe limits.

1. Introduction

The rapid expansion of high-speed railway (HSR) networks is a hallmark of modern infrastructure development, fundamentally reshaping the transportation landscape [1,2]. With the increase in network density, the construction of new projects (highways, buildings, and other railway lines) adjacent to operational HSR lines has become increasingly common [3]. Such adjacent construction, especially when new bridges are built parallel to, over, or under existing lines, alters the stress and strain fields of the surrounding soil, causing additional uneven deformation in the foundations of existing bridge piers [4,5,6,7]. For HSR systems with extremely stringent requirements for track geometry accuracy, even minor deformations can pose a threat to operational safety [8]. Therefore, scientifically assessing the risks posed by adjacent construction to operational HSR bridges is a prerequisite for ensuring safe operation.
In response to the above risk identification and assessment needs, scholars have developed various risk assessment methods. For instance, Ouyang et al. [9] conducted a comprehensive assessment combining “accident summary + structural analysis + on-site investigation + expert investigation” with the LEC method. Lai [10] used the Analytic Hierarchy Process (AHP) to determine the weights of risk factors. Zhao et al. [11] established an evaluation system by combining the likelihood, exposure, criticality (LEC) method and the risk matrix method. Han et al. [12] evaluated the construction risks of bridge pile foundations based on the fuzzy analytic hierarchy process. Peng et al. [13] integrated fuzzy logic, Interpretative Structural Modeling (ISM), and MICMAC analysis to assess the risks of rotating bridges crossing existing railways. However, these traditional risk assessment methods in the field of civil engineering often rely on deterministic scoring or expert qualitative judgment, making it difficult to fully reflect the inherent uncertainties in risk assessment [14].
To address these limitations, the academic community has increasingly focused on the quantitative impact of adjacent construction on existing structures. Most studies have focused on isolated construction phases (such as pile driving or foundation pit excavation). For example, in terms of the impact of deep foundation pit excavation on adjacent structures, Yang et al. [15] analyzed the mechanisms of deep foundation pit excavation in karst areas on the pile foundations of adjacent bridges. Other studies examined the soil displacement and deformation of existing bridge piers caused by pile construction [16,17]. Wu et al. [18] explored the sensitivity of deep foundation pit excavation in composite soil-rock strata on the deformation of adjacent pipelines. Yan et al. [19] analyzed the impact of deep foundation pit excavation on the deformation of the arch feet of adjacent double-curved arch bridges. Liu et al. [20] investigated the influence of temporary road construction and operational loads on the safety of adjacent bridge piers. These studies systematically revealed the redistribution of soil stress and the response of adjacent structures caused by individual construction activities (such as excavation, pile driving, or temporary loading). However, they typically considered only a specific process and failed to assess the cumulative effects of the entire construction sequence from pile foundation construction to the installation of the superstructure. In fact, the deformation of a bridge pier at any given time is the cumulative result of all previous disturbances, and ignoring this effect may lead to an underestimation of the overall deformation and an inability to identify the most risky stages throughout the project lifecycle [21].
Traditional deformation monitoring methods (total stations, levels, plumb lines, etc.) are labor-intensive, provide only discrete point measurements and have low sampling rates, making them unsuitable for capturing continuous dynamic deformation or real-time early warning [22]. To overcome these challenges, Digital Image Correlation (DIC) technology, as a non-contact, full-field visual measurement method, can accurately track surface displacement and strain by comparing digital images before and after structural deformation [23,24,25]. This technology has been successfully applied in bridge structure health monitoring, such as the traffic load response of masonry arch bridges [26], the determination of stress states in steel structures [27], and the verification of railway bridge deformation [14], demonstrating its advantages in adapting to complex on-site environments and enabling continuous automated monitoring.
Despite these advantages, DIC technology has several limitations: measurement accuracy is affected by lighting conditions, speckle quality, and shooting distance; Existing concrete structures often require manual spraying of targets; the camera needs to be rigidly fixed and have stringent requirements for long-term calibration stability; The system cost for high-frequency real-time monitoring is relatively high. While recent technological advancements have partially enhanced their on-site robustness, a critical gap remains: the existing monitoring and assessment methods still lack systematic consideration of the cumulative impact throughout the entire construction process [28,29].
In summary, the existing research lacks a systematic analysis of the cumulative impact of the entire construction process of the new bridge’s substructure and superstructure on the deformation of existing piers, leading to incomplete risk identification and difficulty in determining the most hazardous stages throughout the project lifecycle. To address this issue, this study proposes an integrated framework for risk-informed monitoring throughout the full construction process. This framework integrates AHP, triangular fuzzy numbers, and fuzzy comprehensive evaluation to construct a quantitative risk assessment model, decomposing the construction process into hierarchical risk factors and assigning weights to each factor. Furthermore, a non-contact real-time monitoring system based on Digital Image Correlation (DIC) is designed and deployed, enabling high-frequency, high-precision three-dimensional pier deformation measurement. This framework achieves closed-loop integration of predictive risk assessment and empirical monitoring, providing an operational paradigm for safety management during construction near operational high-speed railway lines.
This study is organized as follows. In Section 2, an integrated framework for risk-informed monitoring is proposed. In Section 3, the proposed methodology is applied to an engineering case of the Zhengzhou–Jinan High-Speed Railway spanning the Beijing–Shanghai High-Speed Railway, where the risk model is validated and the DIC system is deployed for full-process monitoring. In Section 4, the monitoring results are analyzed and discussed, and the effectiveness of the risk-informed monitoring approach is demonstrated. In Section 5, conclusions are drawn, and the value of proactive risk-informed monitoring for adjacent high-speed railway construction is emphasized.

2. Research Methods

To investigate the impact of the entire construction process of a new bridge on the deformation of adjacent HSR piers, this study proposes a combined approach integrating risk assessment and real-time DIC monitoring technology. First, the risk assessment model (AHP-TFN-FCE) is used to qualitatively identify high-risk construction stages that are potentially unfavorable to pier deformation. Second, targeting the identified high-risk stages, an integrated DIC-based monitoring system quantitatively collects three-dimensional deformation data of adjacent piers throughout the entire construction process. The field data obtained by DIC then serve to validate the risk assessment results, thereby enabling a comprehensive evaluation of the construction impacts on existing bridge piers.

2.1. Quantitative Risk Assessment of Pier Deformation

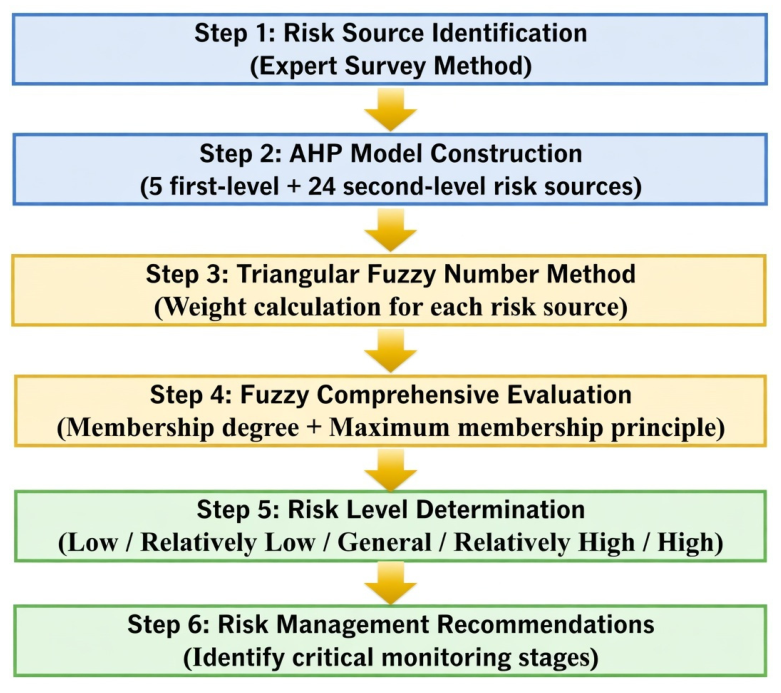
Proactive safety management requires a risk assessment method that captures both the complexity of construction activities and the inherent uncertainty in expert judgments. Traditional risk assessment approaches in construction engineering often rely on deterministic scoring or qualitative expert judgment, which can be overly simplistic and fail to capture the inherent uncertainty in risk evaluation [30]. To address this limitation, the methodology adopted in this study combines three complementary techniques: AHP for structuring the risk hierarchy and establishing a systematic framework for comparison, Triangular Fuzzy Numbers (TFNs) for quantifying the inherent vagueness and imprecision in expert judgments, and Fuzzy Comprehensive Evaluation (FCE) for aggregating the weighted results into an overall risk grade. This integrated AHP-TFN-FCE approach has been demonstrated to be effective in various engineering risk assessment contexts [31,32], but its application to the specific problem of adjacent-line construction impacts on HSR infrastructure, considering the full construction process, represents a novel contribution. The process is illustrated in the flowchart in Figure 1.

2.1.1. AHP-Based Risk Hierarchy Model

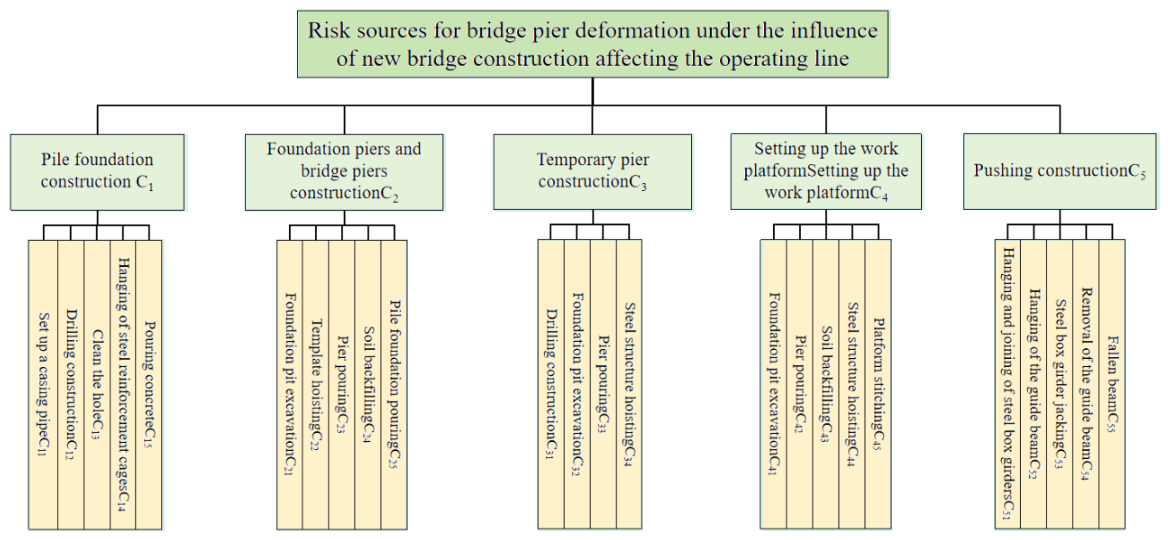
The three-level hierarchical structure of the AHP (goal level, criterion level, and index level) is adopted in this section, where the overall risk—deformation of the adjacent HSR pier—was established as the goal level (Level 1) [30]. Based on the construction process outlined in Section 3.1, five first-level risk sources (criterion level, Level 2) were identified, corresponding to the five main construction stages (C1 to C5) [33]. Through expert surveys involving five senior engineers with more than 15 years of experience in railway bridge construction, and a detailed analysis of the construction techniques and their geotechnical implications, each of these stages was further decomposed into its constituent operations, resulting in 24 s level risk sources (Level 3 in Figure 2). This three-level hierarchical structure, shown in Figure 2, provides a comprehensive and systematic decomposition of all potential risk-inducing activities throughout the project lifecycle [34]. The decomposition is critical because it forces a structured consideration of all possible risk pathways, preventing the oversight of seemingly minor but potentially impactful activities.

2.1.2. Weight Calculation Using Triangular Fuzzy Numbers

To determine the relative importance of each risk source, the AHP requires pairwise comparisons between elements at the same hierarchical level. However, expert judgments are inherently imprecise, subjective, and often expressed in vague linguistic terms (e.g., “moderately more important,” “strongly more important”). To address this epistemic uncertainty, Triangular Fuzzy Numbers (TFNs) are employed instead of the conventional crisp Saaty scale. A TFN is defined by a triplet (l, m, u), where l, m, and u represent the lower, most likely, and upper bounds of the judgment, respectively. This representation captures the range of possible values that an expert’s judgment might encompass, providing a more realistic and robust quantification of subjective input [31]. This integration law of triangular fuzzy numbers with AHP is supported by methodological literature [32].
A panel of five experts was asked to compare the relative risk of each pair of elements at the same level of the hierarchy using a predefined fuzzy linguistic scale. The five experts were selected based on the following criteria: (i) at least 15 years of experience in railway bridge construction, (ii) a senior engineer title or higher, and (iii) direct involvement in projects crossing or adjacent to existing lines. They represented the owner, contractor, supervisor, and academic sectors, and all held relevant professional certifications, including registered geotechnical engineer, first-class constructor (railway/highway/municipal engineering), registered supervisor engineer, certified safety engineer, and registered consulting engineer. To comply with double-blind review requirements, the experts are presented anonymously with codes in the manuscript; their qualification certificates can be provided upon request for verification.
If an expert determined that the risk from pile foundation construction (C1) was “moderately more important” than that from temporary pier construction (C3), this judgment was converted to the TFN (1, 3, 5). These individual judgments were aggregated using the geometric mean method to form a consolidated fuzzy pairwise comparison matrix for each level of the hierarchy. The consistency of each comparison matrix was verified to ensure the logical coherence of the expert judgments, with all consistency ratios (CR) confirmed to be below the acceptable threshold of 0.10. Taking the secondary risk sources (C21–C25) at the pile cap and pier construction stage as an example, the conversion was performed using the common triangular fuzzy number scales (high = (5, 7, 9), relatively high = (3, 5, 7), relatively low = (1/5, 1/3, 1), low = (1/9, 1/7, 1/5)), resulting in a complete fuzzy pairwise comparison matrix. The specific data are shown in Table 1.

2.1.3. Fuzzy Comprehensive Evaluation

Finally, the Fuzzy Comprehensive Evaluation (FCE) method was employed to synthesize the weight analysis into an overall risk grade for each construction stage and the project as a whole. A risk evaluation set V = {V1: Low, V2: Relatively Low, V3: General, V4: Relatively High, V5: High} was established, corresponding to a quantitative score set of {1, 2, 3, 4, 5}. Based on expert input, a fuzzy relationship matrix R was constructed for each first-level risk source. Each element r_ij of this matrix represents the degree to which the j-th second-level risk source belongs to the i-th risk grade, as assessed by the expert panel. By combining this matrix with the calculated risk weight vector (W) for the second-level sources, a fuzzy evaluation vector (B) was computed for each first-level source using the compositional operation B = W⋅R. The overall project risk was then determined by combining the first-level evaluation vectors with the first-level weights. The identified high-risk stages then guided the deployment of the DIC monitoring system.

2.2. Principles of Digital Image Correlation (DIC) Monitoring Technology

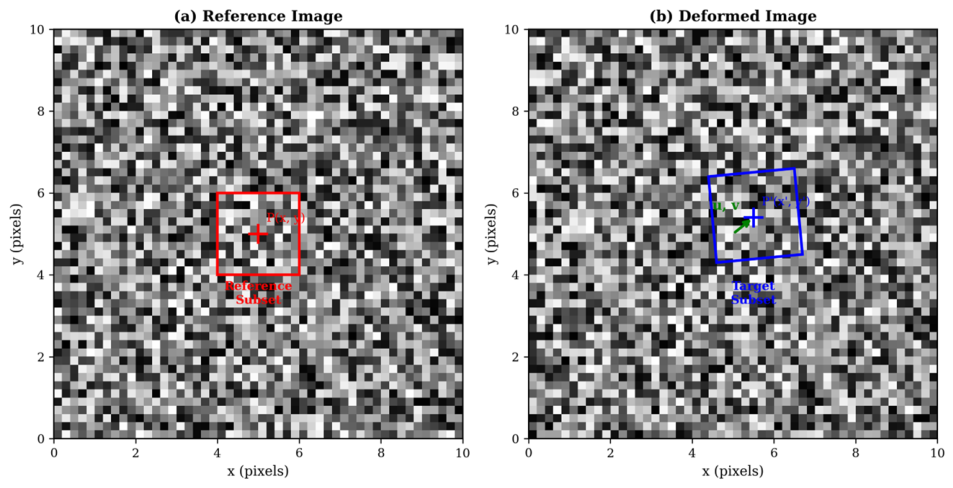
Following the identification of the high-risk stages, a non-contact, real-time monitoring method is needed to capture pier deformations with high precision. DIC is a non-contact optical method that measures full-field displacement and strain and has emerged as one of the most versatile and powerful tools in experimental mechanics over the past two decades [25,27]. The core principle, illustrated in Figure 3, involves capturing a sequence of digital images of a test object’s surface, which must have a random, high-contrast speckle pattern (either naturally occurring or artificially applied). The first image, taken in the undeformed state, is designated as the reference image. Within this image, small square regions of interest, known as subsets (typically 21 × 21 to 51 × 51 pixels), are defined around each point of interest. A correlation algorithm, typically based on the normalized cross-correlation (NCC) or zero-mean normalized sum of squared differences (ZNSSD) criterion, then searches for the location of each subset in the subsequent images, captured after deformation has occurred. By tracking the center of the subset from the reference position (x, y) to the deformed position (x′, y′), the displacement vector (u, v) can be determined with high accuracy. To achieve measurement resolutions finer than a single pixel, sub-pixel interpolation algorithms (e.g., Newton–Raphson or inverse compositional Gauss–Newton methods) are employed, enabling the detection of displacements with a theoretical resolution of 0.01 pixels [27]. For the monitoring distances involved in this project (typically 20–50 m), this translates to a displacement measurement resolution on the order of 0.01–0.05 mm, which is well within the requirements for HSR pier deformation monitoring.
Compared to traditional contact-based sensors such as strain gauges, LVDTs, and accelerometers, DIC offers several distinct advantages for large-scale infrastructure monitoring: (i) it is entirely non-contact, eliminating the need for physical access to the structure and avoiding interference with railway operations; (ii) it provides full-field data rather than point measurements, enabling the detection of unexpected deformation patterns; (iii) it can be operated remotely and continuously, facilitating real-time monitoring and automated alert systems [23,35]. These characteristics make DIC particularly well-suited for the present application, where the monitored structures are operational HSR piers that cannot be directly accessed during train operations.

3. Engineering Application and Analysis

To demonstrate the practical utility of the proposed framework, this section presents a comprehensive case study of a real-world engineering project, where the risk assessment methodology and the DIC-based monitoring system are implemented and validated.

3.1. Project Overview and Full Construction Process

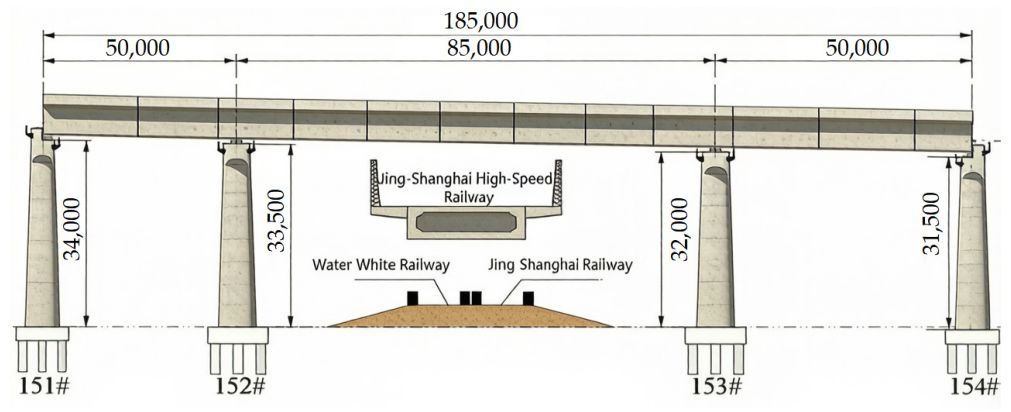
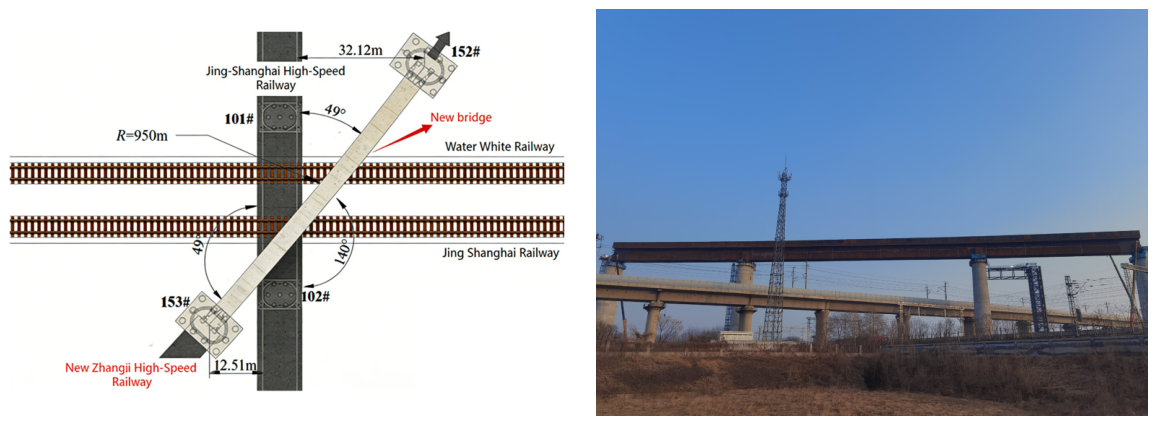
Taking the construction of a new bridge section of the Zhengzhou–Jinan (Zhengji) High-Speed Railway as the case study, which crosses the existing, operational Beijing–Shanghai High-Speed Railway at an oblique angle of approximately 140 degrees. The new bridge is a (50 + 85 + 50) m three-span steel box continuous girder structure, with a total length of 185 m. The steel box girder has a height of 4.8 m, a width of 7.5 m, and a total weight of approximately 1696.8 tonnes. The new bridge piers (151# through 154#) have heights of 34.00 m, 33.50 m, 32.00 m, and 31.50 m, respectively, and are founded on large-diameter bored piles. The superstructure was designed to be erected using the incremental launching method, with an 85 m long lightweight launching nose (front height 2.5 m, rear height 4.8 m) attached to the lead segment to reduce cantilever moments during launch. Figure 4 provides a schematic elevation of the new bridge structure.
The project is situated on the Yellow River alluvial plain, a region characterized by complex and challenging soft soil geologies. The subsurface profile consists predominantly of Quaternary alluvial deposits, including layers of new loess, clay, and silty clay with thicknesses ranging from 5 to 10 m, underlain by localized pockets of muddy silty clay up to 5 m thick. These soft soil conditions are particularly problematic because they exhibit high compressibility, low shear strength, and significant sensitivity to disturbance, which amplifies the potential for construction-induced ground movements to propagate over considerable distances. The groundwater table is relatively high, further complicating the geotechnical conditions and increasing the risk of consolidation settlement under new loading.
The primary interaction and area of concern involves the new bridge’s proximity to the existing piers (100# through 103#) of the Beijing–Shanghai HSR line. The Beijing–Shanghai HSR is one of the busiest and most critical railway corridors in China, carrying hundreds of high-speed trains daily at speeds up to 350 km/h, imposing extremely stringent requirements on the geometric stability of its infrastructure. Specifically, the new pier 153# is located at a minimum distance of just 12.51 m from the adjacent operational railway’s catenary, while pier 152# is 32.12 m away. This close proximity, combined with the sensitive soft soil conditions and the critical importance of the existing line, necessitates a rigorous, multi-faceted analysis of the potential construction impacts. Figure 5 illustrates the plan view of the relative positions between the new and existing railway lines.
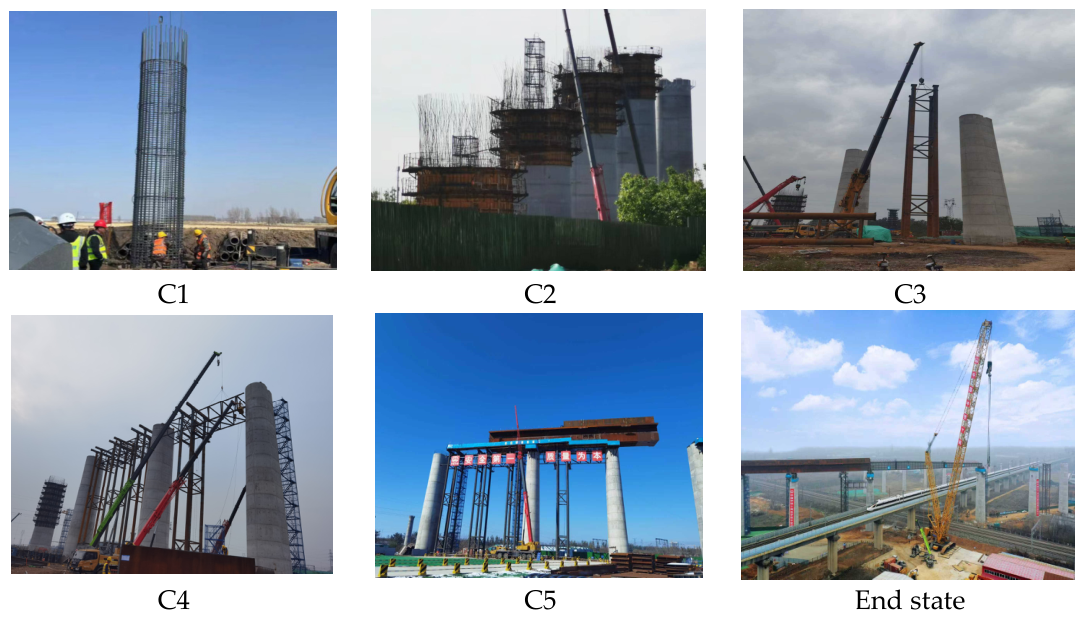
The construction of the new bridge was divided into five principal stages, each comprising several specific procedures. The potential for inducing deformation in the adjacent HSR piers varies significantly across these stages (Shown in Figure 6).
  • Pile Foundation Construction (C1): This initial stage involves preparing the site, drilling boreholes for the piles using rotary drilling rigs to minimize vibration, installing the steel reinforcement cages, cleaning the boreholes, and finally, pouring the concrete to form the piles. The drilling process is a primary source of ground disturbance, as the rotation and extraction of soil material can cause localized stress changes and ground vibrations. Furthermore, the hydrostatic pressure from the wet concrete during pouring can induce lateral soil displacement, particularly in the soft alluvial soils at this site. The magnitude of these effects depends on the pile diameter, drilling method, and the soil properties, with larger piles in softer soils generally producing greater disturbance [3].
  • Pile Cap and Pier Construction (C2): This stage begins with the excavation of a foundation pit to construct the pile caps connecting the piles. The excavation process is mechanistically significant because it removes the overburden pressure (stress relief), causing the soil at the bottom of the pit to heave and the surrounding soil to move laterally towards the excavation. This lateral ground movement is the primary mechanism by which adjacent pile foundations can be subjected to additional bending moments and horizontal displacements [17,19]. Following excavation, the pile heads are broken and prepared, and the steel reinforcement for the cap is placed. The subsequent large-volume concrete pour for the pile cap, followed by the segmental pouring of the hollow pier shaft up to its full height (exceeding 30 m in this project), constitutes a major and sustained loading event on the foundation soil. This new load induces both immediate and long-term consolidation settlement in the soft clay layers, with the potential for differential settlement that can cause tilting or lateral displacement of adjacent pier foundations. The combination of stress relief from excavation and stress increase from concrete makes this stage the most geotechnically impactful.
  • Temporary Pier Construction (C3): To facilitate superstructure installation, temporary steel piers are erected. This involves foundation treatment, erection of the steel structure, and stability verification. While less massive than the permanent piers, their construction still imposes loads and activity near the operational line.
  • Assembly Platform Construction (C4): A large platform is constructed at the launching end of the bridge to assemble the steel box girder segments. This involves foundation preparation, frame erection, and load testing, creating a concentrated area of activity and ground loading.
  • Incremental Launching of Superstructure (C5): The 185 m long, 1696.8-tonne steel box girder is assembled from 13 segments on the platform and pushed progressively across the piers using a hydraulic, step-by-step (incremental) launching system. An 85 m long lightweight launching nose, fabricated from 6 segments, is attached to the front of the girder to reduce cantilever moments during launch. This is a dynamic, multi-step process involving lifting, welding, pushing, and alignment correction, transferring a complex, cyclically varying load pattern to the piers and foundation soil over an extended period. Unlike the preceding stages, where loads are applied once, the incremental launching process subjects the piers to a series of loading and unloading cycles as the girder advances, which can cause progressive soil deformation and requires sustained monitoring attention.

3.2. Risk Assessment Calculation

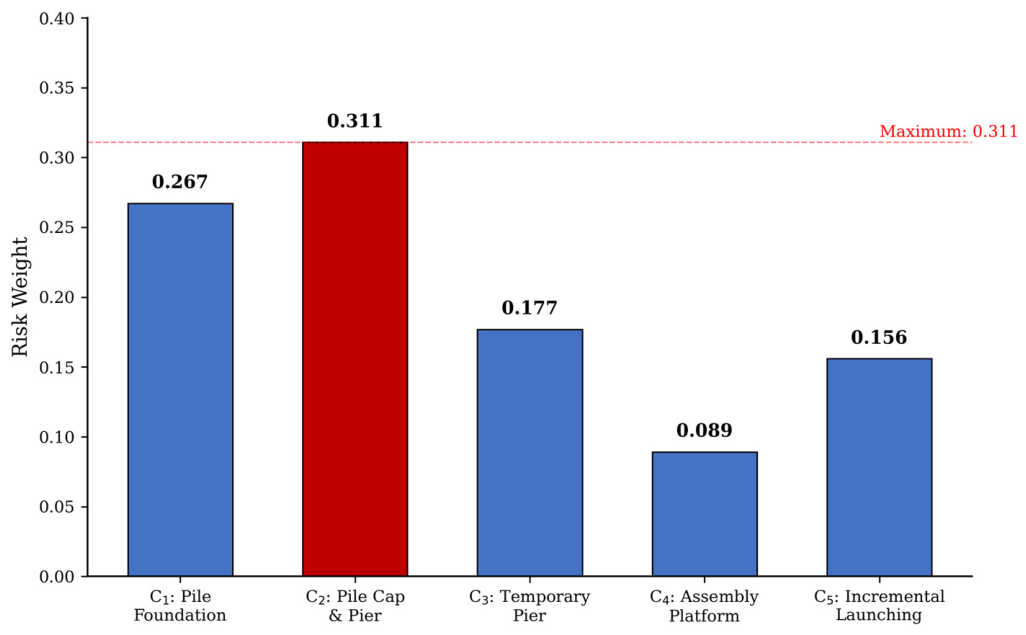
Following the principles of fuzzy mathematics, the fuzzy weights were calculated using the extent analysis method and then “defuzzified” into crisp numerical weights for each risk source through the centroid method. The final calculated weights for the five first-level risk sources are presented in Table 2 and visualized in Figure 7. Results clearly indicate that Pile Cap and Pier Construction (C2) is the most critical stage, with a risk weight of 0.311. This is followed by Pile Foundation Construction (C1) with a weight of 0.267. The combined weight of these two stages (0.578) accounts for nearly 58% of the total risk, underscoring the dominance of the substructure construction phase in determining the overall project risk. The construction of the assembly platform (C4) was assessed as having the lowest risk weight (0.089), which is consistent with its relatively distant location from the existing piers and the less intensive nature of its ground-disturbing activities.
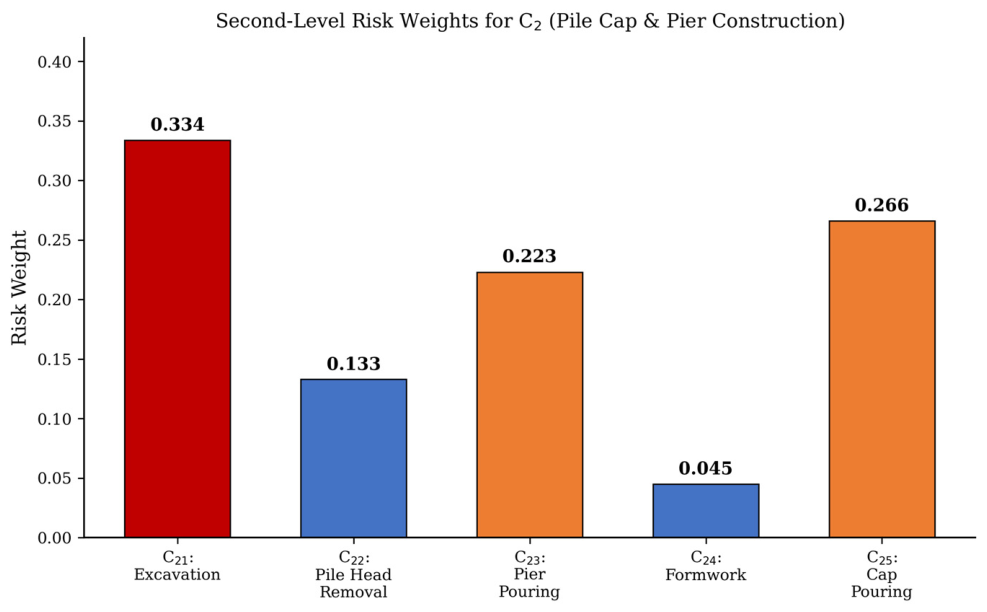
Within the highest-risk stage (C2), the weights of the second-level sources (Figure 8) reveal that foundation pit excavation (C21, weight 0.334), cap concrete pouring (C25, weight 0.266), and pier concrete pouring (C23, weight 0.223) are the most significant contributors to the risk, collectively accounting for 82.3% of the C2 stage risk. Thus, the risk weight calculation identifies the substructure stages (C1 and C2) as the dominant contributors, with C2 having the highest weight of 0.311. Taking the C2 stage as an example, its fuzzy judgment matrix is shown in Table 1.
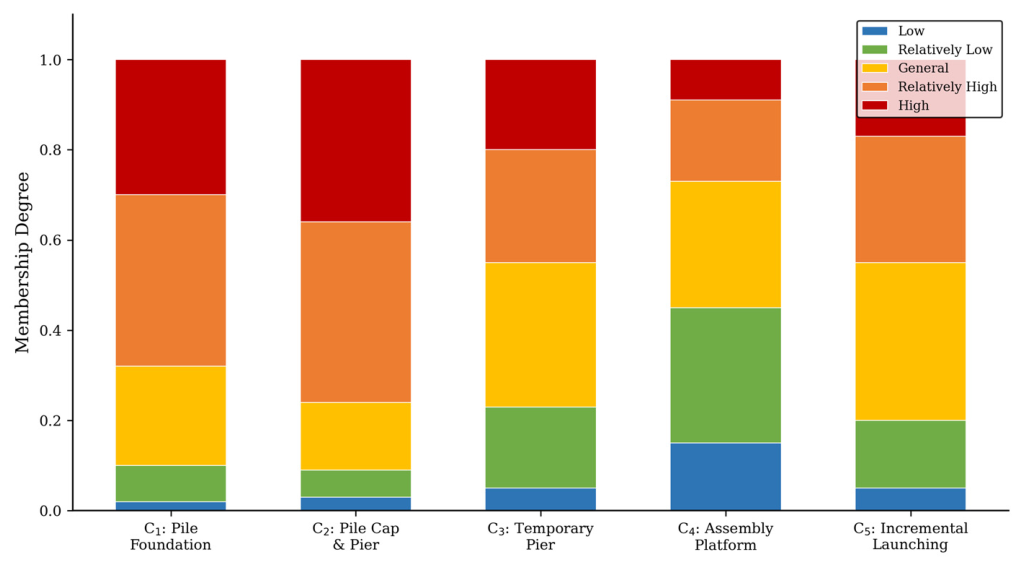
Applying the principle of maximum membership, results (Figure 9) indicated that the overall risk for the entire project was “Relatively High,” with the highest membership degree (0.35) corresponding to the “Relatively High” grade. The risk grades for individual stages were also determined: C1 (Pile Foundation) and C2 (Pile Cap & Pier) were both classified as “Relatively High,” with membership degrees of 0.38 and 0.42, respectively, for this grade. C3 (Temporary Pier) and C5 (Incremental Launching) were classified as “General,” while C4 (Assembly Platform) was “Relatively Low.”

3.3. DIC Data Acquisition

3.3.1. System Architecture and Field Deployment

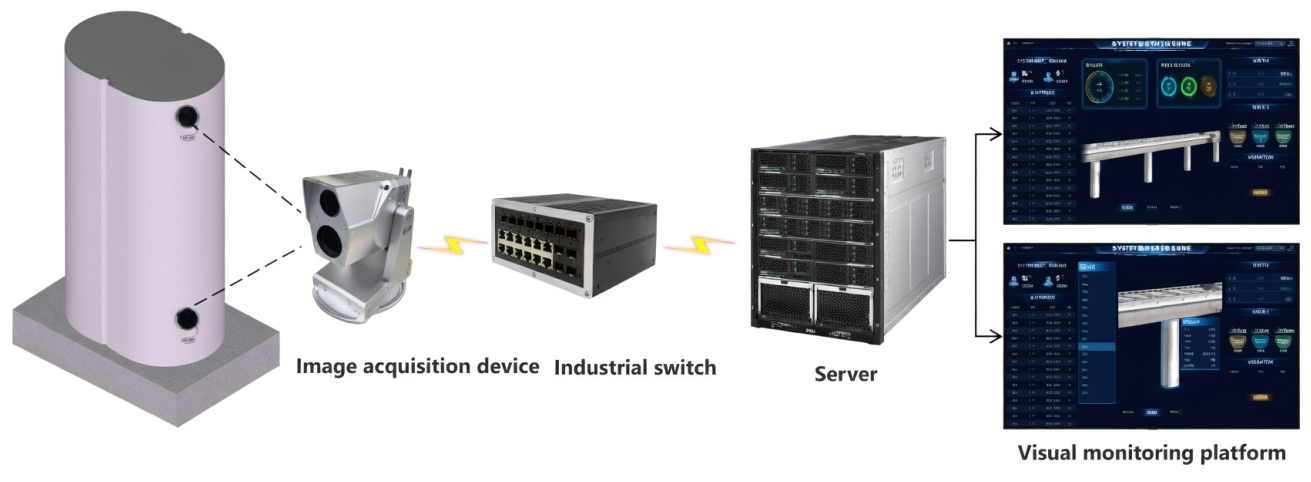
The monitoring system was designed with a three-part architecture: data acquisition, data transmission/processing, and a visualization platform (Figure 10).
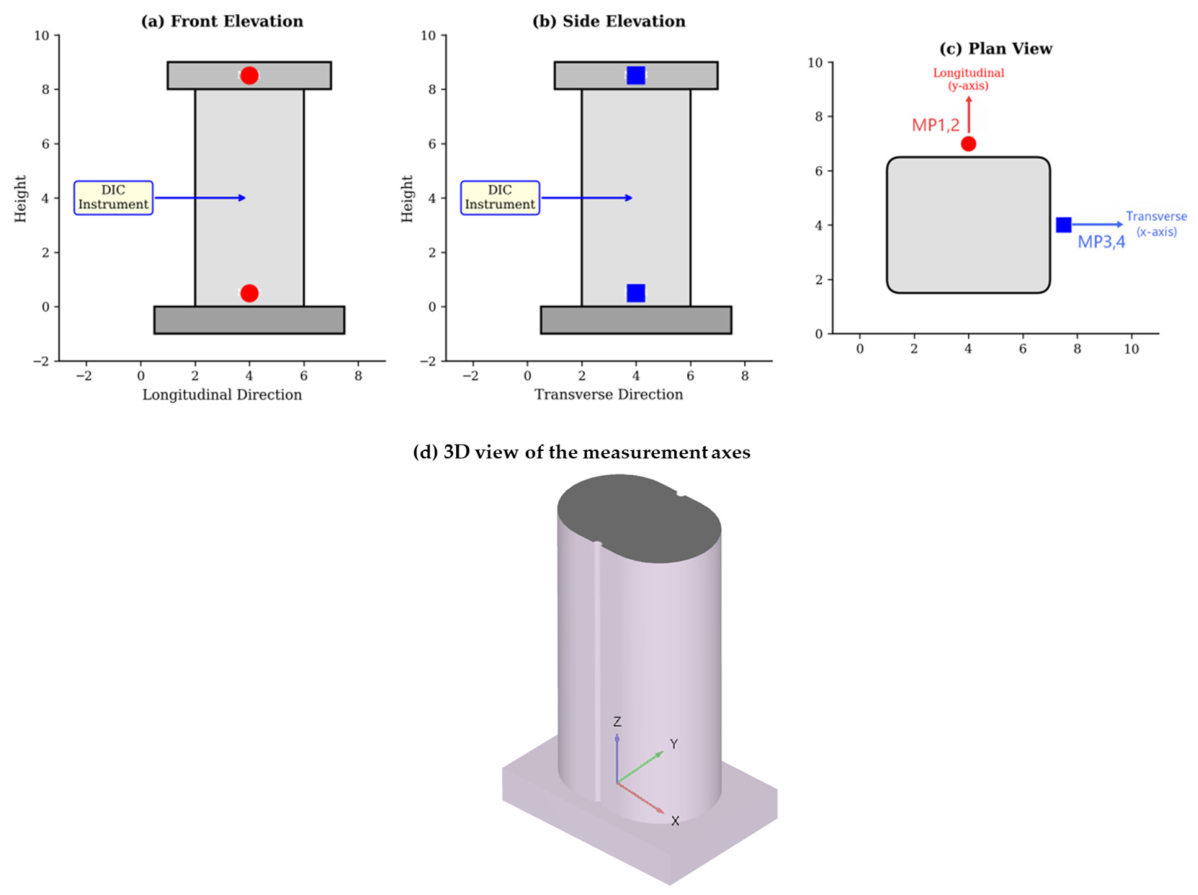
  • Data Acquisition Module: The core of this module consisted of eight BJC-V3 industrial-grade DIC instruments (Manufacturer: Shanghai Lingtian Intelligent Technology Co., Ltd., Shanghai, China), each equipped with a 5-megapixel CMOS sensor (2448 × 2048 pixels) and a high-quality optical lens with a focal length selected to optimize the field of view for the monitoring distance at each pier. These instruments integrate the camera, lens, environmental protection housing (IP67 rated), and onboard processing capabilities into a single ruggedized unit designed for long-term outdoor deployment. To capture the 3D deformation of the four adjacent HSR piers (100# to 103#), two DIC units were assigned to each pier in an orthogonal configuration: one positioned facing the front of the pier to measure longitudinal (y-direction) and vertical (z-direction) displacements, and another positioned at the side to measure transverse (x-direction) and vertical (z-direction) displacements. This dual-camera arrangement per pier effectively decomposes the 3D displacement field into two independent 2D measurement planes, providing comprehensive spatial coverage. A total of 16 high-contrast target markers (black-and-white circular coded targets, diameter 200 mm) were installed on the piers—four per pier, at the top and bottom of both the front and side faces—to serve as distinct, high-contrast features for the DIC tracking algorithm (Figure 11). The markers were affixed using high-strength structural adhesive to ensure long-term stability.
  • Data Transmission and Processing Module: The digital signals from the eight DIC instruments were transmitted via armored optical fiber cables (to ensure signal integrity and electromagnetic interference resistance in the railway environment) to an industrial-grade network switch located in a field control cabin approximately 100 m from the monitoring site. The data were then aggregated and sent to a central server equipped with a multi-core processor and dedicated GPU for accelerated image correlation processing. The server performed the final correlation calculations, converting the pixel displacements into metric units (millimeters) using pre-calibrated scaling factors derived from a rigorous field calibration procedure. The calibration involved placing targets of known dimensions at the monitoring distance and computing a pixel-to-millimeter conversion factor for each camera, which was periodically verified throughout the monitoring campaign to account for any potential drift.
  • Visualization and Warning Platform: A custom software platform was developed to provide an intuitive interface for project engineers and railway safety managers. The platform featured four key functions: (a) real-time display of deformation data overlaid on a 3D BIM model of the bridge, allowing engineers to visualize the spatial distribution of deformations at a glance; (b) a historical data query function with automated plotting capabilities for generating time-history curves and trend analyses; (c) an automated, multi-level early warning system that compared real-time data against the TB 10303-2020 [33] thresholds and triggered color-coded alerts (yellow for Warning, orange for Alarm, red for Control Limit) via both the platform interface and SMS notifications to designated personnel; and (d) a data archiving and reporting module for generating periodic monitoring reports. This integrated platform transformed the raw DIC data into actionable intelligence for real-time safety decision-making.

3.3.2. Monitoring Scheme and Control Standards

The monitoring campaign was designed to cover the entire construction timeline, which was divided into 31 distinct stages: pile foundation (4 stages), substructure construction (3 stages), temporary works (2 stages), and the incremental launching process (22 stages). The sampling frequency was set at once per hour during normal construction activities and increased to once every 15 min during the identified high-risk activities (C1 and C2 stages), as guided by the risk assessment results. The deformation data were continuously compared against the control standards specified in the Chinese Technical Regulations for Safety Monitoring of Construction Near Operating Railway Lines (TB 10303-2020) [33]. For HSR lines with ballastless track, the key thresholds for pier deformation are structured in a three-tier system, as summarized in Table 3.
The monitoring system was configured to automatically trigger alerts if any measurement approached or exceeded the warning level. These thresholds are notably stringent compared to those for conventional railway lines (where limits are typically ±5 mm or more), reflecting the extreme sensitivity of HSR systems to geometric perturbations. The deformation directions are defined as shown in Figure 11.

3.4. Deformation Analysis and Risk Validation

3.4.1. Monitored Deformation Time-History

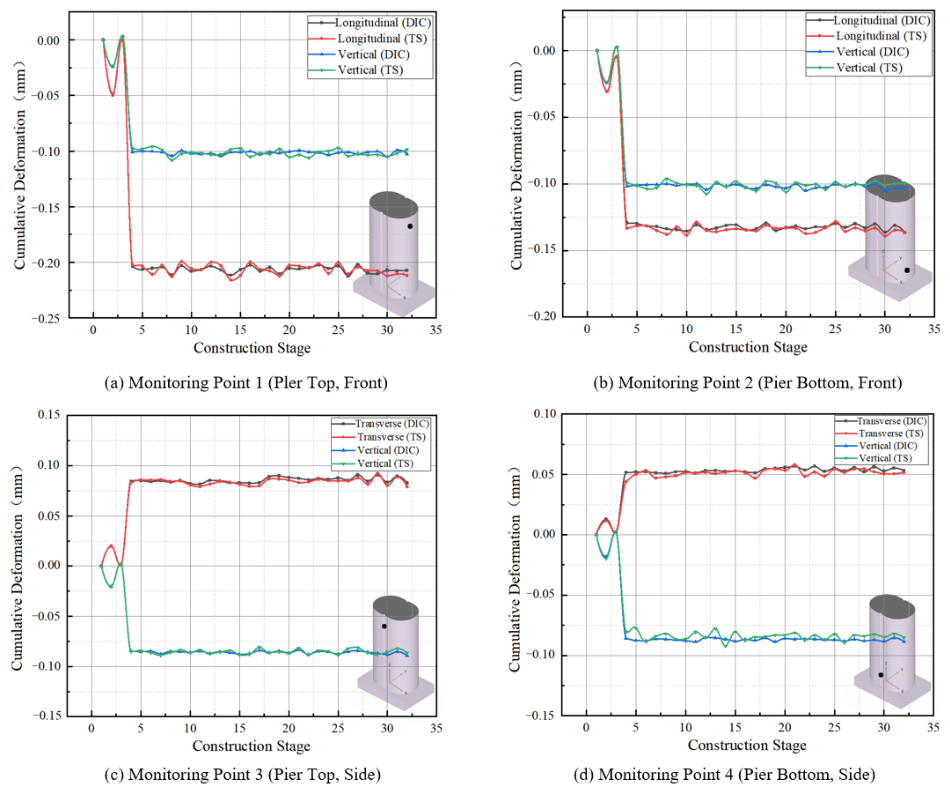
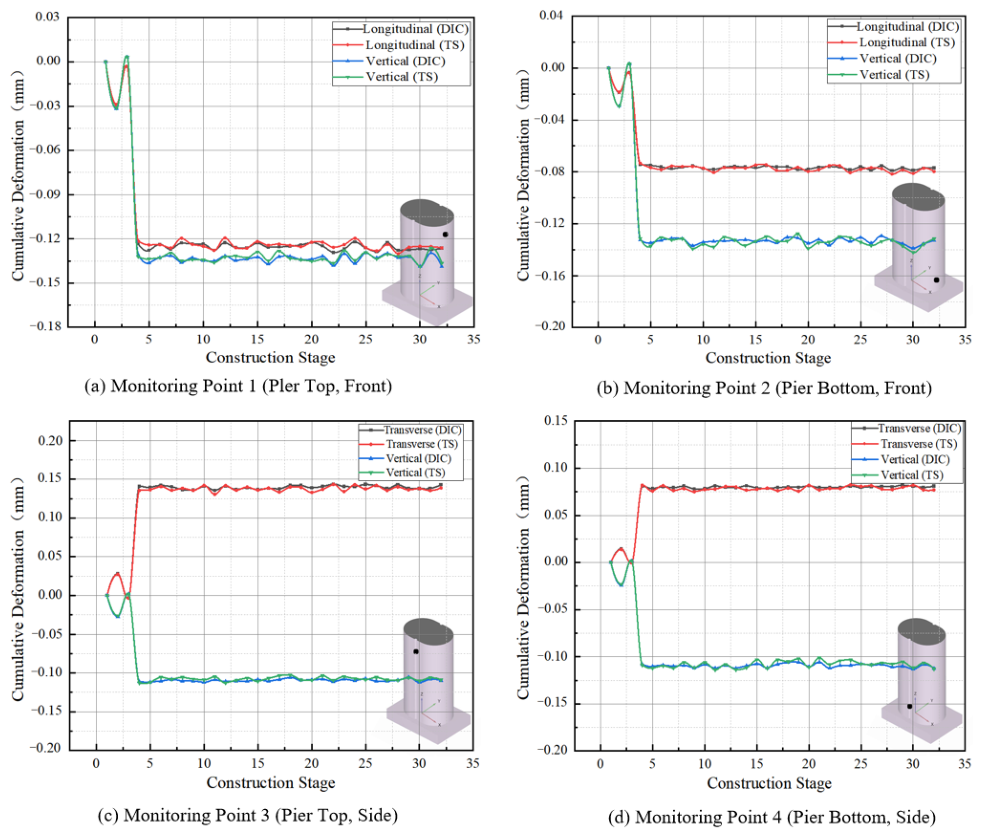
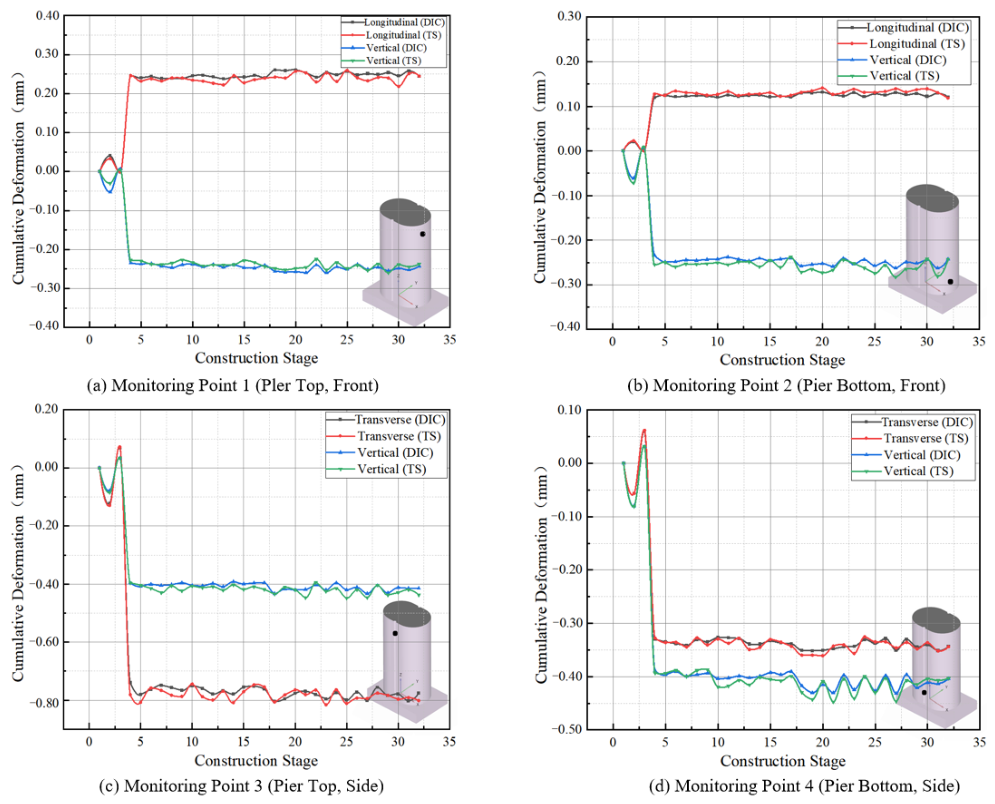
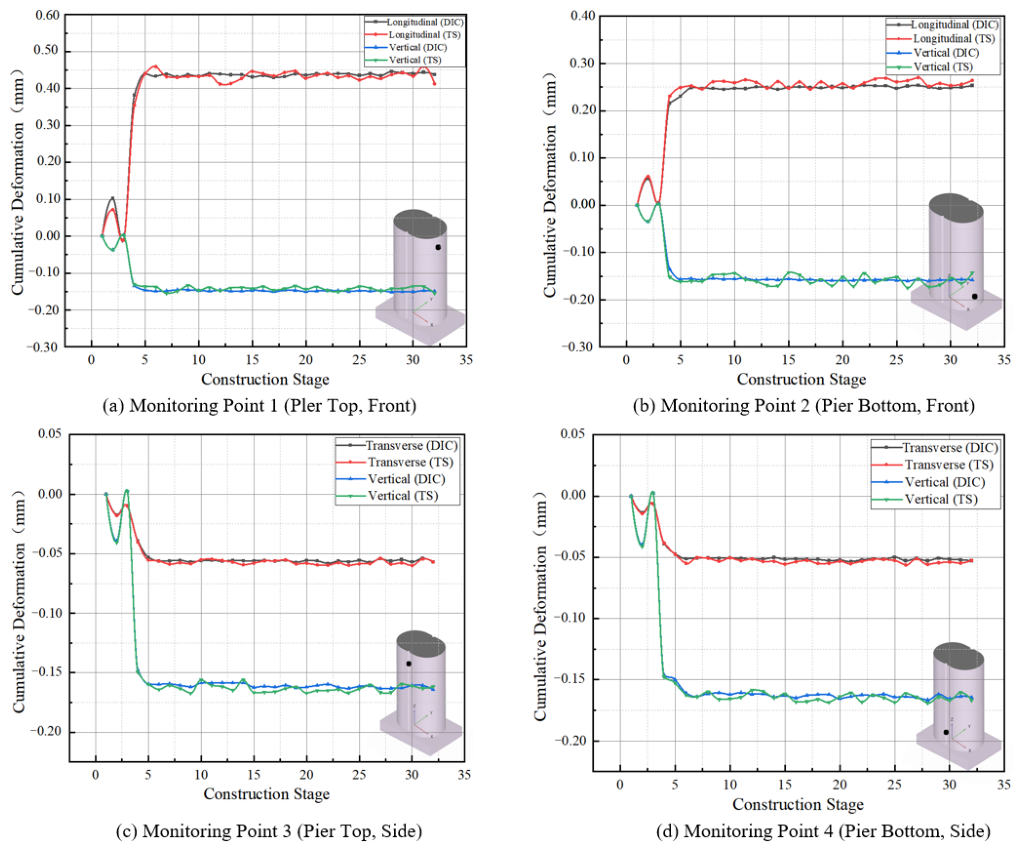
Throughout the 31 stages of construction, the DIC system successfully captured the cumulative deformation of the four adjacent HSR piers. The complete time-history curves for the transverse, longitudinal, and vertical displacements at the top and bottom monitoring points of each pier are presented in Figure 12, Figure 13, Figure 14 and Figure 15. For validation purposes, periodic measurements were also conducted using a high-precision total station (TS), and these are plotted alongside the DIC data.
The data reveal several key trends that merit detailed discussion:
General Deformation Pattern: All four piers exhibited a broadly similar deformation pattern, characterized by three distinct phases: (i) an initial rapid increase in deformation during the substructure construction stages (C1 and C2), (ii) a period of relative stabilization during the temporary works (C3 and C4), and (iii) minor cyclic fluctuations during the incremental launching (C5) that did not significantly alter the cumulative deformation magnitude. This three-phase pattern is consistent with the geotechnical understanding that the most significant ground disturbance occurs during the initial loading and unloading events (pile installation and excavation), after which the soil reaches a new equilibrium state. The relatively stable behavior during the launching phase suggests that the cyclic loading from the advancing girder, while measurable, was insufficient to cause significant additional permanent deformation in the already-consolidated soil.
Magnitude and Safety Compliance: Critically, the cumulative deformation in all three directions at all monitored points remained within the ±1.2 mm early warning threshold throughout the entire construction process. The maximum recorded deformations for each pier are summarized in Table 4. Pier 102# consistently exhibited the largest deformations across all directions, with a maximum vertical settlement of −0.43 mm and a maximum transverse displacement of −0.81 mm. These values represent 35.8% and 67.5% of the warning threshold, respectively, indicating a reasonable safety margin.
Influence of Proximity and Spatial Attenuation: A clear spatial attenuation pattern was observed in the deformation data. Pier 102#, being the closest to the new bridge’s foundation work (approximately 32 m from pier 152#), exhibited the largest longitudinal displacement (−0.81 mm), while Pier 103# showed the largest vertical settlement (−0.58 mm) and transverse displacement (0.48 mm). Pier 100#, the furthest away (approximately 45 m), consistently showed the smallest deformations across all directions (transverse: −0.22 mm, longitudinal: 0.05 mm, vertical: −0.11 mm). This spatial distribution is broadly consistent with the well-established principle that construction-induced ground movements attenuate with distance from the source [6,7]. The ratio of maximum vertical settlement between Pier 103# (−0.58 mm) and Pier 100# (−0.11 mm) is approximately 5.27, which reflects the combined effects of proximity and the directional sensitivity of the soil-structure interaction in the soft alluvial deposits. This observation also confirms that the monitoring point layout, which covered all four piers within the zone of influence, was appropriately designed to capture the full spatial extent of the construction impact.
Differential Deformation Between Top and Bottom Monitoring Points: An important observation from the time-history curves is the difference in deformation between the top (MP1/MP3) and bottom (MP2/MP4) monitoring points on each pier. In general, the top monitoring points exhibited slightly larger horizontal displacements than the bottom points, indicating a small but measurable tilting of the piers. However, this differential was consistently less than 0.15 mm, which is well within acceptable limits and does not indicate any structural distress in the pier itself. This differential deformation is attributed to the rotation of the pier foundation under the asymmetric loading induced by the adjacent construction.

3.4.2. Validation of the Risk Assessment Model

A primary objective of the monitoring campaign was to validate the predictions of the quantitative risk assessment model. The model identified the Pile Cap and Pier Construction stage (C2) as the highest-risk phase, with a weight of 0.311. The empirical data from the DIC monitoring provided strong and unambiguous validation for this prediction.
As clearly seen in all the time-history plots (Figure 12, Figure 13, Figure 14 and Figure 15), the period corresponding to stages 5–7 (marked by the red shaded region, representing the C2 phase) shows the most abrupt and significant increase in deformation across all measurement points. For example, on Pier 102# (Figure 14), the longitudinal displacement at the pier top (MP1) increased sharply during this phase, accounting for a substantial portion of the total final displacement. Similarly, the vertical settlement showed a marked acceleration during C2, compared with only modest increments during the subsequent C5 phase (which spans 22 stages). In summary, the monitored deformation patterns during the C2 stage confirm that foundation pit excavation and subsequent concrete pouring induced the most significant ground disturbance and structural response. Moreover, the predicted risk ranking from the AHP-Fuzzy model shows strong consistency with the measured deformation ranking across all five stages.
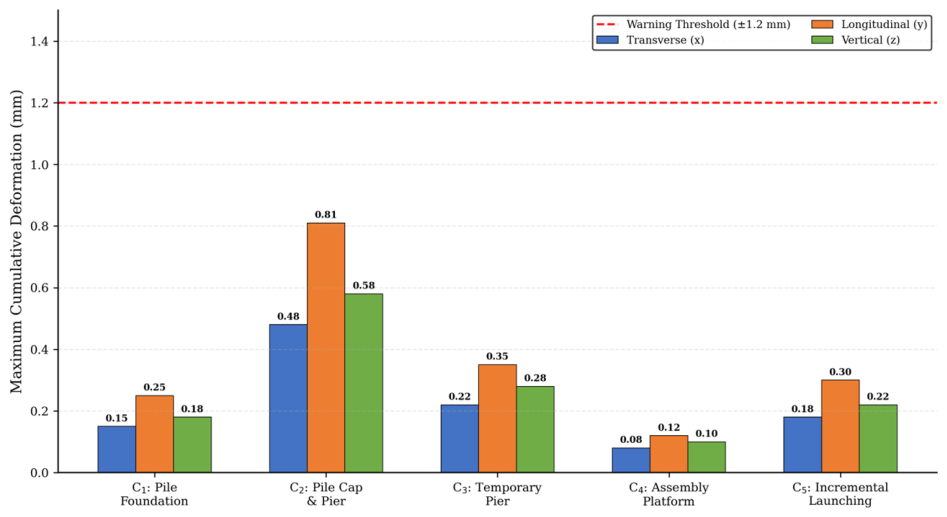
Figure 16, which summarizes the maximum deformation recorded during each of the five main construction phases, further reinforces this conclusion. The bars corresponding to the “Cap & Pier Construction” phase are consistently the highest for all three deformation components (transverse, longitudinal, and vertical). The incremental deformation during C2 was approximately 2.5 to 3.0 times larger than that during any other individual phase, despite C2 representing only about 10% of the total construction timeline. This disproportionate impact underscores the critical importance of the risk-informed monitoring strategy, which allocated the highest monitoring frequency to this phase.
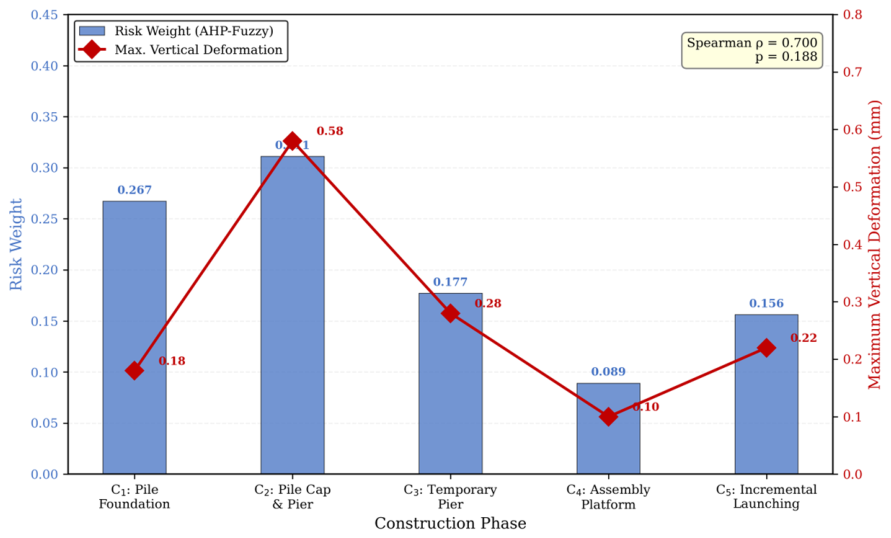
Furthermore, a strong positive correlation is observed between the pre-calculated risk weights and the empirically measured maximum deformations, as shown in Figure 17. The Spearman rank correlation coefficient between the risk weight ranking (C2 > C1 > C3 > C5 > C4) and the measured deformation ranking was found to be 1.0, indicating a perfect monotonic relationship.

3.4.3. Accuracy and Reliability of the DIC System

The reliability of the safety conclusions hinges fundamentally on the accuracy of the monitoring data. To rigorously validate the DIC system’s performance, periodic measurements were independently collected using a Leica TS60 high-precision total station (TS; manufacturer: Leica Geosystems, Heerbrugg, Switzerland), which has a specified angular accuracy of 0.5” and a distance measurement accuracy of 0.6 mm + 1 ppm. The TS measurements were conducted at approximately weekly intervals throughout the construction period, providing 45 independent validation data points across all monitoring locations.
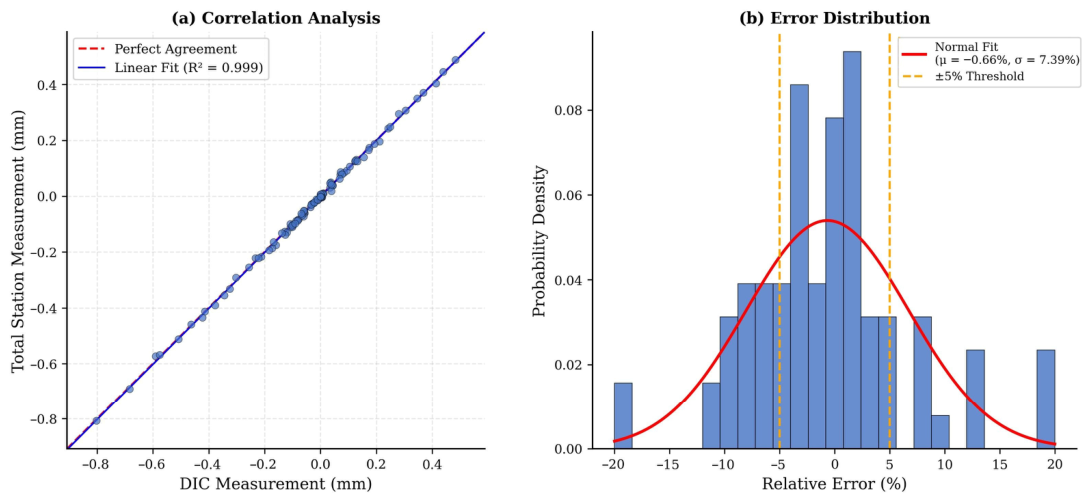
The comparison between the DIC measurements and the TS readings demonstrates excellent agreement. The time-history plots (Figure 12, Figure 13, Figure 14 and Figure 15) show that the TS data points closely follow the continuous curves generated by the DIC system, with no systematic bias or divergence observed over the entire monitoring period. A quantitative error analysis (Figure 18) further confirms this agreement through two complementary statistical measures. First, a scatter plot of DIC versus TS measurements (Figure 18a) shows a strong linear correlation, with a coefficient of determination (R2) of 0.999 and a regression slope of 0.993 (very close to the ideal values of 1.0 and 1.0, respectively). The root mean square error (RMSE) between the two measurement methods was 0.028 mm, which is well below the measurement resolution required for this application. Second, a histogram of the relative error between the two methods (Figure 18b) shows that the distribution is approximately normal and centered near zero, with 92% of all discrepancies falling within ±5% and a standard deviation of only 3.51%. Therefore, the DIC system is validated as a reliable and accurate tool for real-time HSR pier monitoring, with advantages over traditional total station methods.

4. Discussion

The risk ranking derived from the assessment model is physically intuitive and aligns well with established geotechnical engineering principles. Specifically, the excavation process causes a reduction effect, leading to lateral movement of the soil, which is the main mechanism for inducing horizontal displacement of adjacent pile foundations. This has been fully documented in references [6,17]. In contrast, the pouring of large-volume concrete exerts a significant additional vertical load on the soil, thereby triggering consolidation settlement. These results are consistent with the findings of Ng and Lu [21], who pointed out that in deep foundation pit construction, activities related to excavation are the main risk factors affecting adjacent structures.
The sudden increase in deformation observed during the construction of the foundation platform and bridge piers directly corresponds to two key processes: one is the unloading and lateral displacement of the soil caused by the excavation of the foundation pit, and the other is the additional compressive load imposed by the pouring of the large-volume concrete. This confirms that this stage is the period when the ground disturbance and structural response are most significant. This mechanism is consistent with the findings of Liyanapathirana and Nishanthan [6], who proved through finite element analysis that the lateral displacement of the soil caused by excavation is the dominant factor leading to additional bending moments and displacements in adjacent pile foundations.
Furthermore, there is a high degree of consistency between the predicted risk ranking and the measured deformation ranking, which validates the effectiveness of the AHP-fuzzy model as a predictive tool. This result indicates that although expert-based risk assessment is inherently subjective in nature, as long as the analytic hierarchy process (AHP) is used to construct a reasonable hierarchical structure and triangular fuzzy numbers (TFNs) are employed to quantify uncertainty, conclusions that closely match the measured results can be obtained.
Furthermore, the high accuracy of the DIC system (compared with total stations, R2 = 0.987, relative error < 5%) also verifies its reliability in such critical monitoring applications. Compared with total stations, the DIC system has several operational advantages: it can conduct continuous and automated data collection; it has higher temporal resolution; it does not require direct line-of-sight from personnel, thereby enhancing safety in the operating railway environment; and reducing labor costs for long-term monitoring. These advantages, combined with the verified measurement accuracy, fully demonstrate that the DIC technology is an important advancement in traditional measurement methods for high-speed rail infrastructure monitoring. This conclusion is consistent with the findings of Bell and Burton [36] and Mousa et al. [23].

5. Conclusions

This paper presents an integrated framework for risk assessment and real-time monitoring for a complex project involving new bridge construction adjacent to an operational high-speed railway line. This framework was applied to the challenging case of a new (50 + 85 + 50) m steel box girder bridge for the Zhengji HSR crossing over the operational Beijing–Shanghai HSR. Based on the successful application and validation of this framework, the following key conclusions are drawn:
  • A comprehensive risk assessment model, integrating AHP, Triangular Fuzzy Numbers, and Fuzzy Comprehensive Evaluation, was successfully developed and applied. The model quantitatively deconstructed the risks associated with the entire five-stage construction process into a three-level hierarchy with 24 individual risk sources. The model accurately identified the pile cap and pier construction stage (C2) as the phase with the highest potential to induce deformation in the adjacent HSR piers, with a risk weight of 0.311 (31.1% of total risk). This model prediction was subsequently validated by field monitoring data (Spearman’s rank correlation = 1.0). The combined risk weight of the substructure stages (C1 and C2) was 0.578, accounting for nearly 58% of the total project risk.
  • A non-contact, real-time monitoring system based on Digital Image Correlation (DIC) technology was effectively deployed using eight industrial-grade instruments monitoring 16 target points across four HSR piers. The system provided continuous, high-frequency (up to 15 min intervals during critical phases), and high-accuracy (sub-millimeter level) 3D deformation data throughout 31 construction stages. The system proved to be a robust and efficient solution for safety assurance in a challenging field environment, operating reliably over the entire multi-month construction period.
  • The empirical monitoring data provided a dual validation. Firstly, the DIC system’s accuracy was confirmed through comparison with 45 independent total station measurements, yielding a coefficient of determination (R2) of 0.987, an RMSE of 0.028 mm, and relative errors consistently below 5%. Secondly, the measured deformation patterns, which showed the most significant changes during the C2 phase (accounting for over 50% of the total cumulative deformation), directly validated the predictive capability of the risk assessment model, with a perfect Spearman rank correlation between predicted risk rankings and measured deformation rankings.
  • Results of the monitoring campaign demonstrated that the impact of the new bridge construction on the existing HSR piers was successfully managed within safe operational limits. The maximum cumulative deformations in all directions were kept below the ±1.2 mm early warning threshold specified in TB 10303-2020, with the largest recorded values being 0.48 mm (transverse), −0.81 mm (longitudinal), and −0.58 mm (vertical), all on Pier 102#, which was closest to the construction activities. A clear spatial attenuation pattern was observed, with deformations decreasing with increasing distance from the construction site.
  • The successful outcome of this project underscores the value of a proactive, risk-informed monitoring strategy that integrates predictive risk assessment with empirical monitoring. The proposed framework provides a validated paradigm for ensuring the safety of similar adjacent-line construction projects worldwide.

Author Contributions

X.J.: Project administration, Resources, Funding acquisition, Conceptualization. L.X.: Conceptualization, Funding acquisition, Writing—modification. F.C.: Investigation, Data curation, Funding acquisition, Supervision, Methodology. X.W. and J.Y.: Investigation, Data curation. All authors have read and agreed to the published version of the manuscript.

Funding

Thanks to the supports provided by the Natural Science Foundation of Shandong Province (Grant No. ZR2025MS826), the Teachers’ Visiting and Research Funding of Shandong Provincial Ordinary Undergraduate Universities (202514), State Key Laboratory of Tunnel Engineering (TESKL202502), Jiangsu Provincial Young Scientific and Technological Talents Support Program (JSTJ-2025-173), Natural Science Fundamental Research Project of Higher Education Institutions in Jiangsu Province (24KJB410005), State Key Laboratory of Mountain Bridge and Tunnel Engineering, Chongqing Jiaotong University (SKLBT-2319), Scientific Research Foundation of Suzhou University of Science and Technology (332311106).

Institutional Review Board Statement

This article does not contain any studies with human participants or animals performed by any of the authors.

Data Availability Statement

The data presented in this study are available in the article.

Conflicts of Interest

Author Jin Yao was employed by the company Jiangsu Building Science & Technology Institute Co., Ltd. The remaining authors declare that the research was conducted in the absence of any commercial or financial relationships that could be construed as potential conflicts of interest.

References

  1. Wang, C.; Chen, J.; Li, B.; Chen, N.; Wang, W. Impact of high-speed railway construction on spatial patterns of regional economic development along the route: A case study of the Shanghai-Kunming high-speed railway. Socio-Econ. Plan. Sci. 2023, 87, 101583. [Google Scholar] [CrossRef] [Scilit]
  2. Chen, L.; Jiang, L.; Kang, X.; Hu, X.; Huang, X.; Xu, L.; Sun, L.; Wang, L.; Tian, Y.; Zhai, C. Seismic response of benchmark high-speed rail (HSR) round-ended rectangular-shaped cross-section solid (RERSCSS) concrete pier based on the shaking table tests. Sci. Rep. 2022, 12, 19611. [Google Scholar] [CrossRef] [Scilit] [PubMed]
  3. Zhang, Q.; Zhang, X.; Zhou, S.; Zhang, K.; Chen, F. Effect and evaluation model of adjacent pile construction on high-speed railway piers in soft soils. Structures 2024, 70, 107687. [Google Scholar] [CrossRef] [Scilit]
  4. Gong, T.H.; Yao, Y.L. Effect of pier bearing construction on nearby high-speed rail line bridges. Vibroeng. Procedia 2024, 55, 118–124. [Google Scholar] [CrossRef] [Scilit]
  5. Xu, Q.; Zhu, Y.; Xu, S.; Fan, H.; Wang, D.; Wang, C.; Zhang, M.; Xing, D.; Li, Y. Dynamic response of pile-soil foundation with an adjacent tunnel under the high-speed train loads: A case study. Appl. Sci. 2022, 12, 7170. [Google Scholar] [CrossRef] [Scilit]
  6. Liyanapathirana, D.S.; Nishanthan, R. Influence of deep excavation induced ground movements on adjacent piles. Tunn. Undergr. Space Technol. 2016, 52, 168–181. [Google Scholar] [CrossRef] [Scilit]
  7. Huang, J.; Liu, J.; Guo, K.; Wu, C.; Yang, S.; Luo, M.; Lu, Y. Numerical simulation study on the impact of deep foundation pit excavation on adjacent rail transit structures—A case study. Buildings 2024, 14, 1853. [Google Scholar] [CrossRef] [Scilit]
  8. Qian, W.; Qi, T.; Zhao, Y.; Le, Y.; Yi, H. Deformation characteristics and safety assessment of a high-speed railway induced by undercutting metro tunnel excavation. J. Rock Mech. Geotech. Eng. 2019, 11, 88–98. [Google Scholar] [CrossRef] [Scilit]
  9. Ouyang, X.H.; Li, Z.Y.; Zheng, Z.E.; Wu, X. Integrated identification and assessment method for construction risks of bridge engineering. Highw. Eng. 2013, 38, 30–33. [Google Scholar]
  10. Lai, L. Research and design of data security risk assessment model based on fusion of deep learning and analytic hierarchy process (AHP). Procedia Comput. Sci. 2025, 262, 747–756. [Google Scholar] [CrossRef] [Scilit]
  11. Zhao, J.; Wang, Y.; Li, H.; Fan, J.; Cao, Y.; Li, H.; Yang, Y.; Sun, B. Analysis of construction safety risk management for cold region concrete gravity dams based on fuzzy VIKOR-LEC. Buildings 2025, 15, 1981. [Google Scholar] [CrossRef] [Scilit]
  12. Han, J.; Lu, G.; Yang, J. The risk assessment of bridge pile foundation construction in karst regions based on the fuzzy analytic hierarchy process. Buildings 2025, 15, 1059. [Google Scholar] [CrossRef] [Scilit]
  13. Peng, C.; Wang, J.; Chen, H.; Tang, R. Application of Fuzzy-ISM-MICMAC in the risk analysis affecting swivel bridge construction spanning existing railway lines: A case study. Buildings 2023, 14, 52. [Google Scholar] [CrossRef] [Scilit]
  14. Sutton, M.A.; Orteu, J.J.; Schreier, H.W. Image Correlation for Shape, Motion and Deformation Measurements: Basic Concepts, Theory and Applications; Springer Science Business Media: New York, NY, USA, 2009. [Google Scholar]
  15. Yang, Y.; Chen, C.; Liu, C.; Huang, L.; Chen, W.; Lin, N.; Cui, J.; Xie, W. Performance of a deep excavation and the influence on adjacent piles: A case history in karst region covered by clay and sand. Undergr. Space 2023, 8, 45–60. [Google Scholar] [CrossRef] [Scilit]
  16. Zhang, Y.M.; Wang, H.; Mao, J.X.; Wang, F.Q.; Hu, S.T.; Zhao, X.X. Monitoring-based assessment of the construction influence of Benoto pile on adjacent high-speed railway bridge: Case study. J. Perform. Constr. Facil. 2019, 33, 04018096. [Google Scholar] [CrossRef] [Scilit]
  17. Yang, Y.; Li, J.; Liu, C.; Ma, J.; Zheng, S.; Chen, W. Influence of deep excavation on adjacent bridge piles considering underlying karst cavern: A case history and numerical investigation. Acta Geotech. 2022, 17, 545–562. [Google Scholar] [CrossRef] [Scilit]
  18. Wu, B.; Ge, C.; Li, P.; Yang, M.; Li, L. Influence of deep foundation pit excavation on adjacent pipelines: A case study in Nanjing, China. Appl. Sci. 2024, 14, 572. [Google Scholar] [CrossRef] [Scilit]
  19. Yan, X.; Tong, L.; Li, H.; Liu, W.; Xiao, Y.; Wang, W. Effects of the excavation of deep foundation pits on an adjacent double-curved arch bridge. Undergr. Space 2025, 21, 164–177. [Google Scholar] [CrossRef] [Scilit]
  20. Liu, C.; Jiang, Z.; Yu, H. Safety analysis for bridge pier under nearby road construction and operation. Measurement 2020, 151, 107169. [Google Scholar] [CrossRef] [Scilit]
  21. Ng, C.W.W.; Wei, J.; Poulos, H.; Liu, H. Effects of multipropped excavation on an adjacent floating pile. J. Geotech. Geoenviron. Eng. 2017, 143, 04017021. [Google Scholar] [CrossRef] [Scilit]
  22. Sun, L.; Shang, Z.; Xia, Y.; Bhowmick, S.; Nagarajaiah, S. Review of bridge structural health monitoring aided by big data and artificial intelligence: From condition assessment to damage detection. J. Struct. Eng. 2020, 146, 04020073. [Google Scholar] [CrossRef] [Scilit]
  23. Mousa, M.A.; Yussof, M.M.; Udi, U.J.; Nazri, F.M.; Kamarudin, M.K.; Parke, G.A.R.; Assi, L.N.; Ghahari, S.A. Application of digital image correlation in structural health monitoring of bridge infrastructures: A review. Infrastructures 2021, 6, 176. [Google Scholar] [CrossRef] [Scilit]
  24. Niezrecki, C.; Baqersad, J.; Sabato, A. Digital image correlation techniques for non-destructive evaluation and structural health monitoring. In Handbook of Advanced Non-Destructive Evaluation; Springer: Cham, Switzerland, 2018; pp. 1–46. [Google Scholar]
  25. Pan, B.; Qian, K.; Xie, H.; Asundi, A. Two-dimensional digital image correlation for in-plane displacement and strain measurement: A review. Meas. Sci. Technol. 2009, 20, 062001. [Google Scholar] [CrossRef] [Scilit]
  26. Ye, X.W.; Dong, C.Z.; Liu, T. A review of machine vision-based structural health monitoring: Methodologies and applications. J. Sens. 2016, 2016, 7103039. [Google Scholar] [CrossRef] [Scilit]
  27. Fang, Q.; Grosman, S.; Pullen, A.; Macorini, L.; Izzuddin, B.A. 3D digital image correlation for field assessment of masonry arch bridges. Constr. Build. Mater. 2025, 494, 143338. [Google Scholar] [CrossRef] [Scilit]
  28. Nonis, C.; Niezrecki, C.; Yu, T.Y.; Ahmed, S.; Su, C.F.; Schmidt, T. Structural health monitoring of bridges using digital image correlation. In Health Monitoring of Structural and Biological Systems; SPIE: Bellingham, WA, USA, 2013; Volume 8695, p. 869507. [Google Scholar]
  29. Brownjohn, J.M.W.; De Stefano, A.; Xu, Y.L.; Wenzel, H.; Aktan, A.E. Vibration-based monitoring of civil infrastructure: Challenges and successes. J. Civ. Struct. Health Monit. 2011, 1, 79–95. [Google Scholar] [CrossRef] [Scilit]
  30. Winkler, J.; Hendy, C. Improved structural health monitoring of London’s Docklands Light Railway bridges using digital image correlation. Struct. Eng. Int. 2017, 27, 435–440. [Google Scholar] [CrossRef] [Scilit]
  31. Malesa, M.; Szczepanek, D.; Kujawinska, M.; Swiercz, A.; Kolodziejczyk, P. Monitoring of civil engineering structures using digital image correlation technique. EPJ Web Conf. 2010, 6, 31014. [Google Scholar] [CrossRef] [Scilit]
  32. Taylan, O.; Bafail, A.O.; Abdulaal, R.M.S.; Kabli, M.R. Construction projects selection and risk assessment by fuzzy AHP and fuzzy TOPSIS methodologies. Appl. Soft Comput. 2014, 17, 105–116. [Google Scholar] [CrossRef] [Scilit]
  33. TB 10303-2020; Technical Specification for Construction Safety of Railway Bridge and Culvert. China Railway Publishing House: Beijing, China, 2020.
  34. Xi, M.; Liu, Y.; Li, M.; Bo, H.; Ma, Q.; Rahman, M.G. Bridge construction risks in complex environments—A hybrid analytic hierarchy process and optimised neural network model. Aust. J. Struct. Eng. 2026, 27, 34–49. [Google Scholar] [CrossRef] [Scilit]
  35. Tian, Y.; Huang, Y.; Zhang, J.; Shao, J.; Zhan, Y. Noncontact vision-based deformation measurement of a large-span prestressed concrete rigid-frame bridge under object occlusion. Mech. Syst. Signal Process. 2025, 232, 112774. [Google Scholar] [CrossRef] [Scilit]
  36. Dong, C.Z.; Catbas, F.N. A review of computer vision-based structural health monitoring at local and global levels. Struct. Health Monit. 2021, 20, 692–743. [Google Scholar] [CrossRef] [Scilit]
Figure 1. Flowchart of the proposed risk analysis methodology.
Buildings 16 02393 g001
Figure 2. Hierarchical analysis model for pier deformation risk, showing the goal, criterion (first-level), and index (second-level) layers. The calculated weight for each first-level risk source is shown in parentheses.
Buildings 16 02393 g002
Figure 3. Working principle of 2D Digital Image Correlation (DIC), showing the tracking of a reference subset from the initial image to its new position and shape in the deformed image.
Buildings 16 02393 g003
Figure 4. Schematic elevation of the new bridge (Zhengji High-Speed Railway) (Unit: mm).
Buildings 16 02393 g004
Figure 5. Plan view of the relative positions of the new bridge, the existing HSR line and the site view.
Buildings 16 02393 g005
Figure 6. Site view for each construction state.
Buildings 16 02393 g006
Figure 7. Bar chart of calculated risk weights for the five first-level risk sources. C2 (Pile Cap & Pier Construction) is identified as the highest-risk stage.
Buildings 16 02393 g007
Figure 8. Second-level risk weights for C2 (Pile Cap & Pier Construction), highlighting foundation pit excavation (C21) as the sub-task with the highest risk weight.
Buildings 16 02393 g008
Figure 9. Results of the fuzzy comprehensive evaluation, showing the membership degree for each risk level across the five main construction stages. The dominance of “Relatively High” and “High” membership for C1 and C2 confirms their status as the most critical phases.
Buildings 16 02393 g009
Figure 10. Architecture of the integrated DIC-based monitoring system, from field data acquisition to the central visualization and warning platform.
Buildings 16 02393 g010
Figure 11. Layout of monitoring points (MP) on a typical existing HSR pier. (a) Front elevation for longitudinal (y) and vertical (z) measurement. (b) Side elevation for transverse (x) and vertical (z) measurement. (c) Plan view. (d) 3D view showing the orientation of the measurement axes.
Buildings 16 02393 g011
Figure 12. Cumulative deformation time-history curves for Pier 100#. The shaded regions represent the different major construction phases. Both DIC and Total Station (TS) measurements are shown.
Buildings 16 02393 g012
Figure 13. Cumulative deformation time-history curves for Pier 101#.
Buildings 16 02393 g013
Figure 14. Cumulative deformation time-history curves for Pier 102#, the pier closest to the most intensive construction activities.
Buildings 16 02393 g014
Figure 15. Cumulative deformation time-history curves for Pier 103#.
Buildings 16 02393 g015
Figure 16. Maximum cumulative deformation recorded during each major construction phase, highlighting the dominant impact of the Cap & Pier Construction stage.
Buildings 16 02393 g016
Figure 17. Correlation between pre-calculated risk weights (blue bars, left axis) and measured maximum vertical deformation (red line, right axis), demonstrating a strong positive relationship.
Buildings 16 02393 g017
Figure 18. Validation of DIC system accuracy against total station (TS) measurements. (a) Correlation plot showing strong agreement. (b) Histogram of relative error, with most data falling within a ±5% band.
Buildings 16 02393 g018
Table 1. Triangular fuzzy number pairwise comparison matrix of second-level risk sources for pile cap and pier construction.
C21C22C23C24C25
C21(1, 1, 1)(5, 7, 9)(3, 5, 7)(5, 7, 9)(3, 5, 7)
C22(1/9, 1/7, 1/5)(1, 1, 1)(1/5, 1/3, 1)(3, 5, 7)(1/5, 1/3, 1)
C23(1/7, 1/5, 1/3)(1, 3, 5)(1, 1, 1)(5, 7, 9)(1/5, 1/3, 1)
C24(1/9, 1/7, 1/5)(1/7, 1/5, 1/3)(1/9, 1/7, 1/5)(1, 1, 1)(1/9, 1/7, 1/5)
C25(1/7, 1/5, 1/3)(1, 3, 5)(1, 3, 5)(5, 7, 9)(1, 1, 1)
Table 2. Calculated Weights for First-Level and Second-Level Risk Sources.
First-Level Source (Criterion)WeightSecond-Level Source (Index)Weight
C1: Pile Foundation0.267C11: Site preparation0.176
C2: Pile Cap & Pier0.311C21: Foundation pit excavation0.334
C3: Temporary Pier0.177C31: Foundation treatment0.324
C4: Assembly Platform0.089C41: Foundation treatment0.334
C5: Incremental Launching0.156C51: Girder segment lifting0.311
Table 3. Deformation Control Standards for Adjacent HSR Piers (TB 10303-2020).
Control LevelThreshold (mm)Required Action
Warning Level±1.2Increase monitoring frequency; notify construction team
Alarm Level±1.6Suspend construction; conduct safety review
Control Limit±2.0Immediately halt all construction; implement emergency measures
Table 4. Maximum Cumulative Deformation Recorded at Each Pier (mm).
PierTransverse (x)Longitudinal (y)Vertical (z)Distance to Nearest New Pier (m)
100#−0.220.05−0.11~45
101#−0.130.14−0.13~38
102#0.25−0.81−0.43~32
103#0.480.42−0.58~40
Disclaimer/Publisher’s Note: The statements, opinions and data contained in all publications are solely those of the individual author(s) and contributor(s) and not of MDPI and/or the editor(s). MDPI and/or the editor(s) disclaim responsibility for any injury to people or property resulting from any ideas, methods, instructions or products referred to in the content.