Article

Stage-Sensitive Risk Structure Analysis in Construction Digital Transformation: An Unsupervised Learning-Enhanced DEMATEL–ISM Framework


1
School of Economics and Management, Tongji University, Shanghai 200092, China
2
Laboratory of High Quality Urban Development and Strategic Decision, Tongji University, Shanghai 200092, China
3
Sandholm Associates, Tegnergatan 40, 113 59 Stockholm, Sweden
4
Centre for Engineering Research, School of Physics, Engineering and Computer Science, University of Hertfordshire, Hatfield AL10 9AB, UK
*
Author to whom correspondence should be addressed.
Buildings 2026, 16(12), 2386; https://doi.org/10.3390/buildings16122386
Submission received: 28 May 2026 / Revised: 10 June 2026 / Accepted: 11 June 2026 / Published: 15 June 2026

Abstract

Digital transformation projects in the construction sector are usually implemented through staged processes involving changing technical conditions, organizational priorities and expert participation. Existing risk assessment studies are often based on static or single-round models, thus limiting their ability to support structural comparisons when assessments are repeated under changing project conditions. To address this issue, this study proposes an unsupervised learning-enhanced DEMATEL–ISM framework for stage-sensitive risk structure analysis in construction digital transformation. DEMATEL and ISM are used to identify causal roles and hierarchical relationships among risk factors within each assessment round, while K-means clustering and principal component analysis are introduced to extract historical relational patterns and incorporate them into subsequent structural modeling. The framework is applied to a digital transformation project in a large construction enterprise using a two-round expert assessment with partial panel continuity. The results show that the baseline structure is mainly driven by tangible resources and strategic planning, whereas the follow-up structure places greater emphasis on data management and intangible organizational capabilities. Comparative and robustness analyses further indicate that the main structural interpretation is not driven by the enhancement layer, threshold selection, panel reduction or individual expert judgement. This study offers a decision-support approach for updating risk structures across assessment rounds and for adjusting risk governance as construction digital transformation progresses.

1. Introduction

Digital transformation has become an important driver of change in the construction industry, reshaping project delivery processes, organizational structures, data management practices and coordination mechanisms within the built environment [1]. For construction enterprises, digital transformation refers to the use of digital technologies and data to reshape business processes, operational management, organizational coordination and value creation. In practice, such transformation is often implemented through enterprise-level transformation projects or staged digitalization tasks managed by internal project teams. These projects may involve Building Information Modeling (BIM) platform deployment, smart-site system implementation, project data infrastructure, enterprise databases, data asset management, integrated project management systems, collaborative platforms, data governance mechanisms and data-driven decision-making tools. These activities are interrelated organizational change processes through which construction enterprises adjust workflows, data standards, management routines and coordination mechanisms.
Compared with incremental digitalization, such transformation involves heterogeneous technologies, cross-functional coordination and new decision-making mechanisms [2,3]. During implementation, managerial priorities, information conditions, coordination arrangements and operational requirements may change [4]. In the construction context, technologies such as BIM, smart-site systems and digital platforms give these transformation projects clear industry-specific characteristics, because they connect enterprise management with project delivery, design coordination, construction execution, data handover and lifecycle information management. As a result, the risk structure of construction digital transformation projects is unlikely to remain fixed; it may evolve as implementation moves from preparation-oriented resource mobilization toward data governance, platform coordination and organizational embedding.
Risk assessment is therefore central to construction digital transformation. Prior studies have developed various models to support risk identification, evaluation and prioritization. Multi-criteria approaches, including enhanced failure mode and effects analysis (FMEA), have been useful for ranking risk factors and supporting operational-level evaluation [5,6]. These methods provide decision-makers with structured tools for identifying high-risk elements. In complex digital transformation projects, however, risk ranking alone provides only a partial basis for intervention. Such projects involve technical systems, organizational routines, data governance and inter-organizational collaboration, where risks are often mutually embedded [7]. Prioritization-oriented approaches may therefore offer limited insight into how risks interact, propagate and become structurally embedded within the broader transformation system [8,9].
From a systems perspective, managing digital transformation risk requires more than identifying high-priority factors [10]. In construction digitalization initiatives, risks are usually coupled across technical, organizational, data-related and inter-organizational domains. As projects move from early preparation to operational implementation, the structural roles of risks may also change. Some factors may function as deep drivers, some may act as intermediate transmission mechanisms and others may appear as surface-level outcomes [11]. In this study, risk structure refers to the configuration of directional influence, causal role and hierarchical dependence among risk factors. Without explicitly modeling these relationships, decision-makers may find it difficult to identify leverage points or anticipate the system-wide effects of targeted interventions [12,13]. This issue is particularly relevant in project-based digital transformation environments, where risk assessments may be repeated at different stages to reflect changing organizational conditions, technical requirements and managerial understanding [14].
Structural analysis methods provide a useful perspective for examining such relationships by revealing causal dependencies and hierarchical interactions within complex project systems. Among these approaches, the combined use of the Decision-Making Trial and Evaluation Laboratory (DEMATEL) and Interpretive Structural Modeling (ISM) has been widely adopted for analyzing causal relationships and hierarchical structures among system factors [15,16]. DEMATEL quantifies the direction and strength of influence among factors, while ISM organizes these relationships into an interpretable hierarchy. By integrating influence analysis with interpretive structural modeling, DEMATEL–ISM enables the identification of driving factors, intermediate linkages and dependent outcomes within a system, thereby providing a clearer system-level view of risk interactions than ranking-oriented approaches [17].
Most existing DEMATEL–ISM studies are designed for single-round structural diagnosis. Once the analysis is completed, the derived structure is usually treated as a relatively stable representation of the system [18]. This assumption is difficult to maintain in construction digital transformation projects. Repeated assessments conducted under different project conditions may generate different structural configurations. These differences may reflect changes in project priorities, implementation contexts or risk mechanisms; they may also be affected by variations in expert judgement, information availability and assessment emphasis [19,20]. In practice, the expert panel involved in risk assessment is rarely fixed across all stages of a transformation project. Early-stage assessments may rely more heavily on strategic planners, project managers and technical consultants, whereas later-stage assessments may involve data managers, system operators, implementation specialists or platform service providers. Such variation reflects the changing knowledge requirements of staged construction digitalization and needs to be considered in the modeling design.
This creates a methodological challenge: how can risk structures be compared and updated when project conditions and expert participation vary across assessment rounds? Conventional DEMATEL–ISM provides limited support for this challenge. Recent structural and dynamic risk-analysis approaches have extended DEMATEL–ISM through fuzzy sets, analytic network process (ANP), MICMAC, Bayesian networks and system dynamics, improving uncertainty representation, interdependence-based prioritization, probabilistic updating and feedback-loop analysis. These approaches provide valuable methodological extensions, yet most applications remain oriented toward either single-setting structural analysis or dynamic modeling assumptions that differ from repeated expert-based structural comparison. When each round is modeled independently, a change in causal role or hierarchical position may indicate a meaningful shift in the risk system, while also reflecting changes in expert judgement, information availability, assessment emphasis or panel composition [21]. Direct comparison of independently generated structures therefore provides an unstable basis for stage-sensitive risk governance. A framework is needed that retains the interpretability of DEMATEL–ISM while incorporating historical relational patterns into subsequent assessments in a controlled manner.
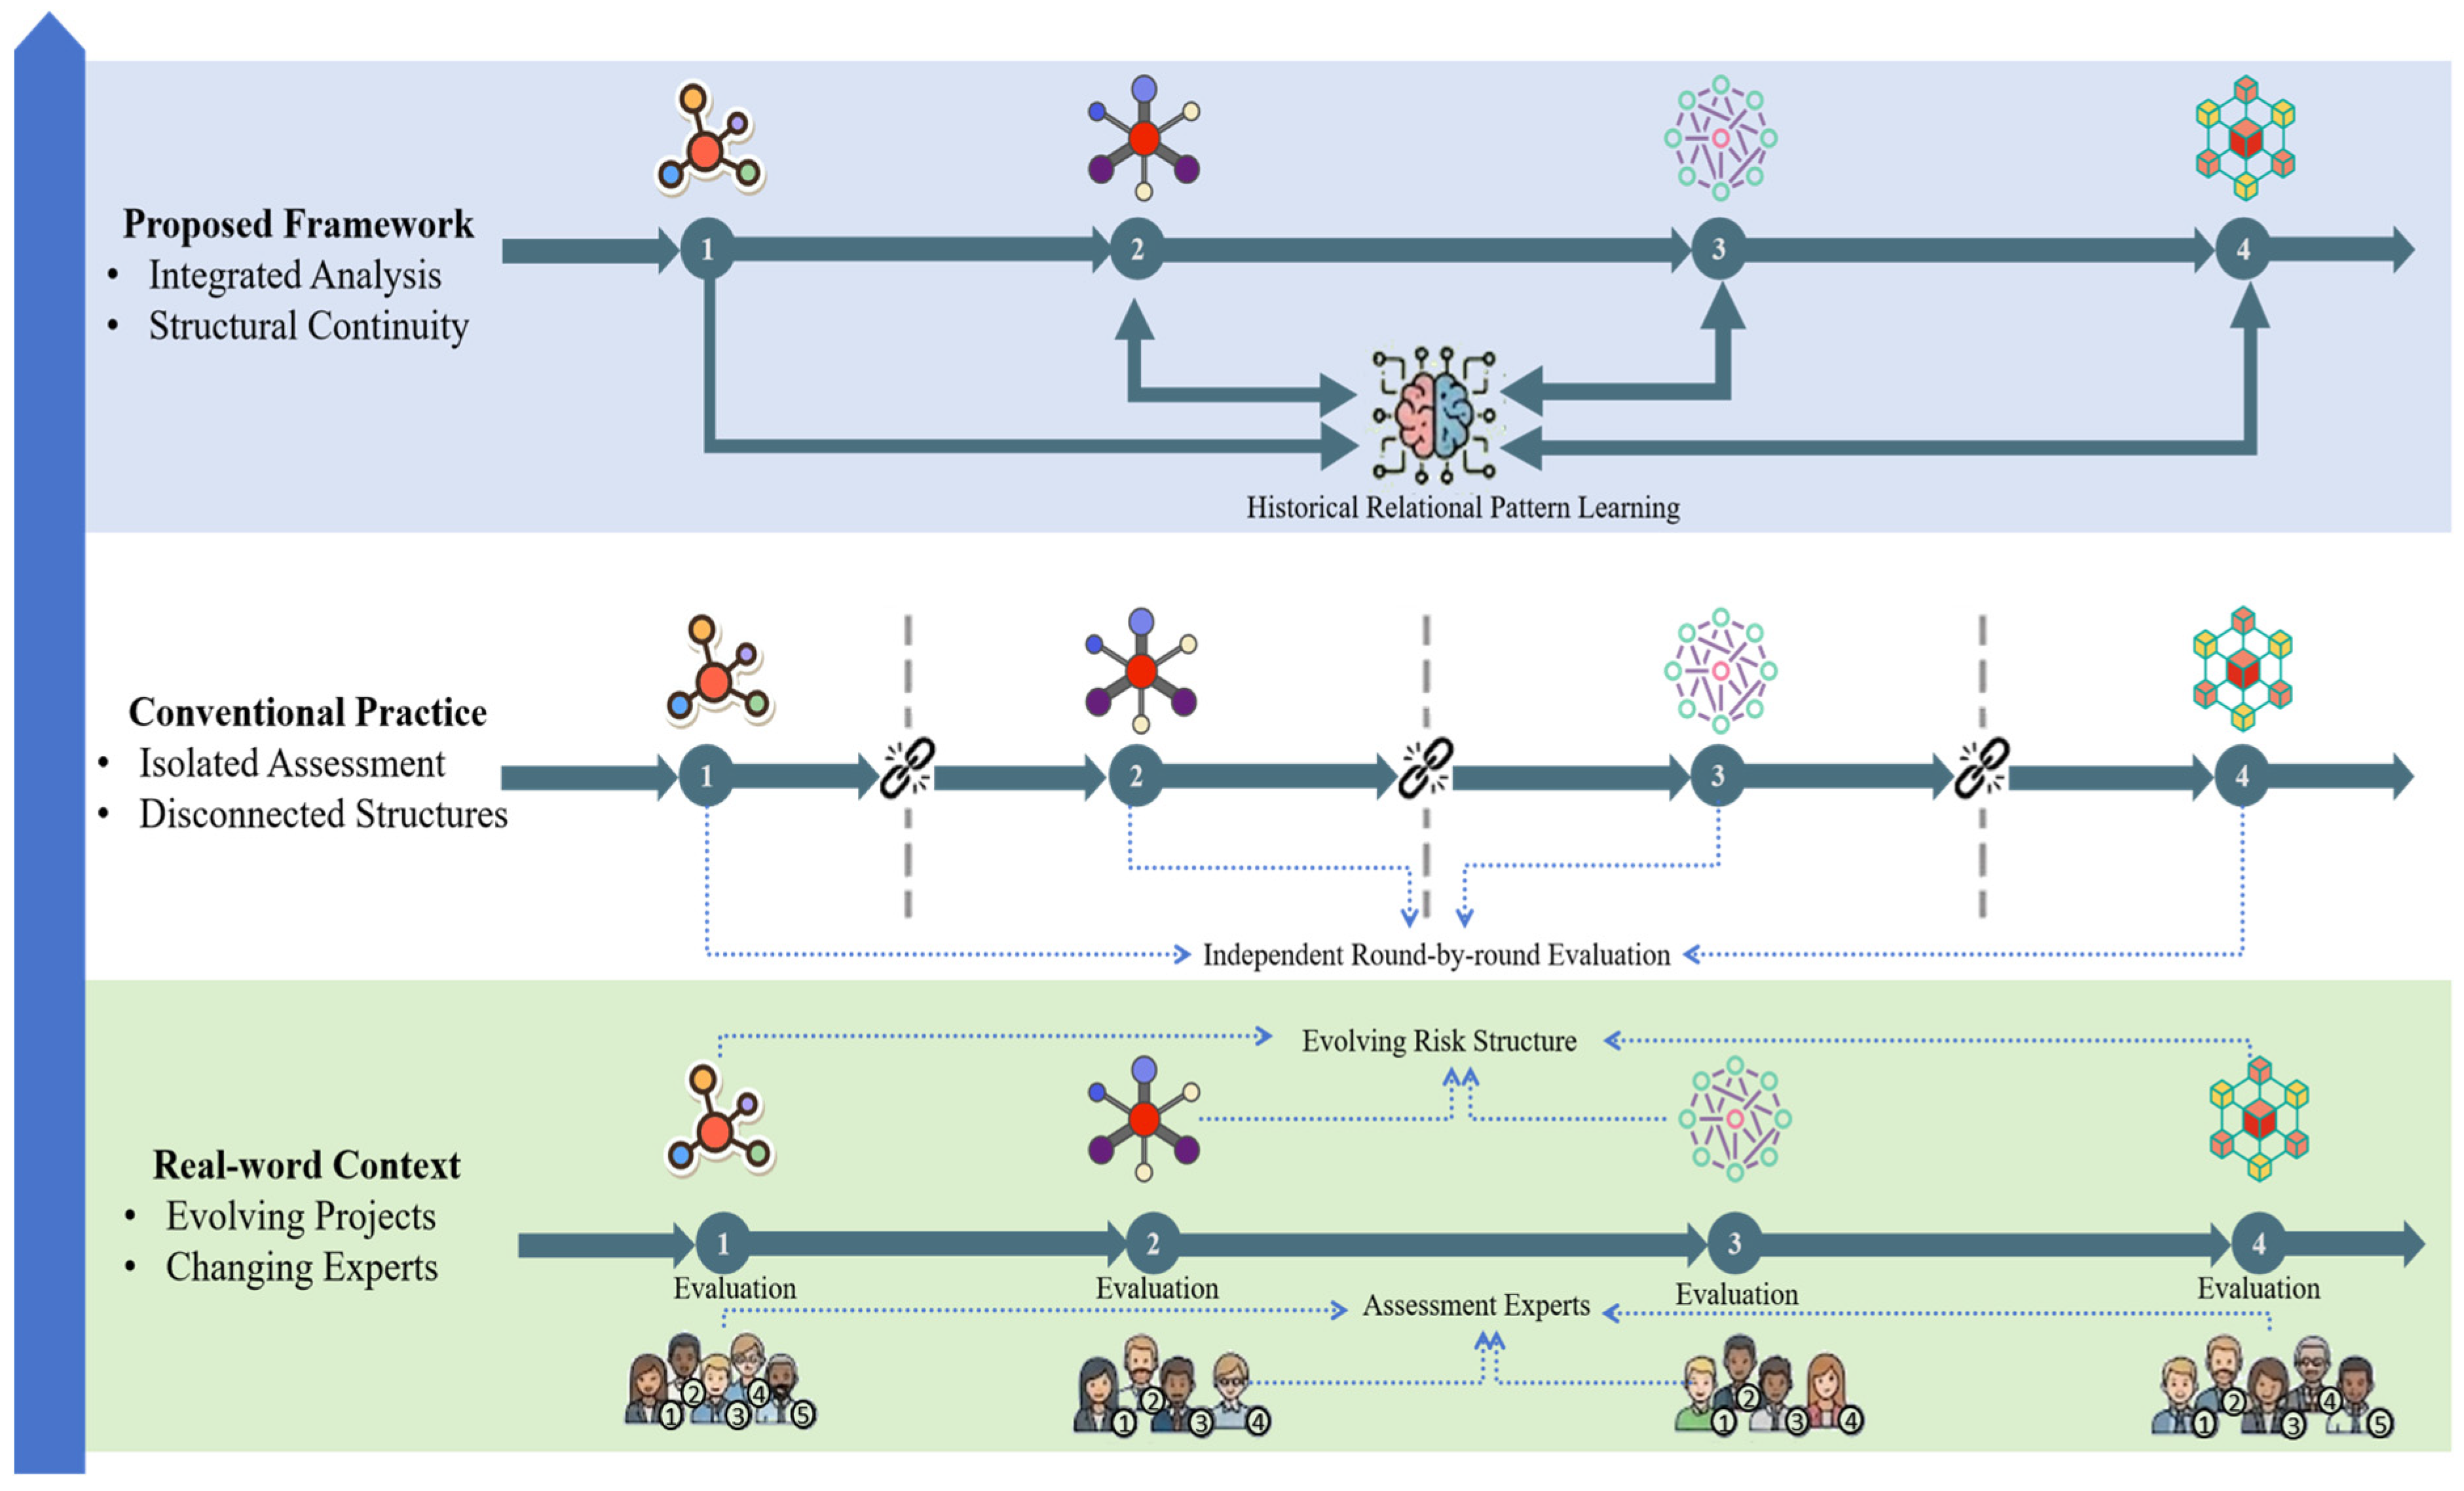
Figure 1 illustrates the methodological motivation and positioning of the proposed framework. In construction enterprise digital transformation projects, risk assessment may be conducted repeatedly as the project moves through different implementation stages. Across assessment rounds, project conditions evolve, available information changes and the expert panel may also vary. In conventional practice, each round is often modeled independently, which makes cross-round structural differences difficult to interpret. The proposed framework addresses this issue by learning historical relational patterns from previous rounds and incorporating them into subsequent DEMATEL–ISM modeling. In this way, repeated evaluations are linked into an integrated analytical process, and structural continuity can be maintained while preserving the interpretability of expert-based risk analysis.
To address this challenge, this study develops an unsupervised learning-enhanced DEMATEL–ISM framework for stage-sensitive risk structure analysis in construction digital transformation. DEMATEL–ISM is retained as the core method for identifying causal roles and hierarchical relationships among risk factors within each assessment round. Unsupervised learning is incorporated as an enhancement layer to extract relational patterns from previous influence matrices and incorporate them into subsequent structural modeling. Specifically, K-means clustering is used to identify groups of risk factors with similar influence profiles, while principal component analysis is used to capture dominant relational directions in the influence data. Through this design, the framework supports multi-round structural updating while preserving the expert-driven and interpretable nature of DEMATEL–ISM.
The proposed framework is applied to a digital transformation project in a large construction enterprise. Two rounds of expert evaluation conducted under different assessment conditions are used to examine how the framework supports structural comparison and interpretation across stages. The application evaluates whether the proposed framework can provide a more consistent and interpretable basis for analyzing risk structure changes when project conditions and expert participation vary across assessment rounds.
This study makes three main contributions. First, it reframes digital transformation risk assessment in construction as a multi-round structural updating problem that goes beyond conventional risk prioritization. This perspective emphasizes that the managerial significance of a risk factor depends on its causal role and hierarchical position within the broader system. Second, it extends DEMATEL–ISM from single-round structural diagnosis to controlled multi-round structural updating. The framework uses K-means clustering and principal component analysis (PCA) to extract historical relational patterns and support structural comparison across heterogeneous assessment rounds while retaining the expert-driven interpretability of DEMATEL–ISM. Third, it provides a construction management-oriented decision-support approach for stage-sensitive risk governance in digital transformation projects. The framework helps project managers and construction enterprises interpret how risk drivers, transmission factors and outcome-related risks may be reorganized as implementation moves from preparation-oriented resource mobilization toward data-dependent operation, platform coordination and organizational embedding.

2. Literature Review

2.1. Digital Transformation Risks in Construction

Digital transformation in construction is no longer discussed only as the adoption of isolated tools such as BIM, digital twins, sensors or platform systems. It is increasingly viewed as a broader organizational and inter-organizational transition involving changes in workflows, governance arrangements, information integration and stakeholder coordination across the project lifecycle [22,23]. For construction enterprises, digital transformation also involves the use of digital technologies and data to reshape business processes, operational management, organizational coordination and value creation. In this context, digitalization processes are often fragmented and uneven, shaped by technological readiness, strategic alignment, institutional support, skills development and ecosystem-level collaboration. As a result, digital transformation risks arise from the combined influence of technological, organizational, market and governance conditions.
Existing research on digital transformation risks in construction can be broadly grouped into three streams. The first focuses on technology adoption and implementation barriers. BIM-related research forms an important part of this stream because BIM is one of the most widely adopted digital technologies in construction project management. At the project level, BIM supports model-based design coordination, clash detection, construction planning, quantity take-off, schedule and cost integration, quality control and digital handover [24]. Its implementation also introduces management requirements concerning model accuracy, information delivery standards, data exchange, model ownership, role allocation, common data environments and coordination among designers, contractors, consultants and owners [25]. Therefore, BIM-related risks are often associated with interoperability problems, insufficient standards, weak model coordination, uneven modeling capability, unclear information requirements and limited BIM management capacity [26]. Related studies on smart-site systems, digital platforms, sensors and project data systems further highlight risks associated with infrastructure gaps, data fragmentation, weak data quality, platform incompatibility and uneven digital readiness across firms or regions. These studies indicate that technology-related risks concern not only tool adoption, but also the management, integration and use of digital technologies in construction project and enterprise workflows.
The second stream examines organizational and managerial constraints. These studies highlight weak strategic commitment, fragmented responsibilities, resistance to process redesign, capability shortages, inadequate change management and limited digital governance capacity [27]. In construction enterprises, these organizational issues are closely connected with the management implications of digital technologies. BIM-enabled project coordination requires clear model management responsibilities, data standards, collaborative workflows and information delivery procedures [28,29]. Smart-site implementation requires coordination between site monitoring, quality and safety management, platform operation and project-level data feedback [30]. Enterprise data systems and digital platforms require data ownership, data-quality control, cross-departmental governance mechanisms and data-driven management routines [31]. As a result, organizational risks and technology-management risks often become intertwined during construction digital transformation.
The third stream addresses networked and stakeholder-dependent risks, such as low trust, poor information sharing, misaligned incentives, regulatory uncertainty and weak coordination among clients, contractors, consultants, suppliers and public agencies [22]. Digital transformation in construction frequently depends on cross-organizational data exchange and collaborative use of digital platforms. BIM-enabled coordination, digital handover and lifecycle information management involve multiple participants with different responsibilities, data standards, contractual positions and incentives [32]. Weak stakeholder coordination may therefore affect the quality, continuity and usefulness of digital information across project and organizational boundaries [33]. These studies suggest that digital transformation risks in construction are structurally interdependent, where problems in one domain may trigger or amplify constraints in others across the system.
A further feature of the construction context is that digital transformation unfolds through projects, programs and staged organizational initiatives [34]. As firms move from early digital preparation to deeper operational embedding, the locus of risk may also shift. Early-stage concerns are often associated with strategic commitment, resource mobilization, technology selection and initial platform construction, whereas later-stage problems tend to concentrate around data governance, cross-platform integration, workflow adaptation, sustained collaborative use and organizational learning. Recent studies on digital transformation management in construction and on human-centered change management both point to this processual character: transformation success depends on how organizations continuously adapt structures, routines, roles and data practices over time. This implies that digital transformation risk in construction should be analyzed as an evolving system rather than as a fixed list of barriers [3].

2.2. Structural Analysis Methods

Because construction digital transformation involves multiple mutually reinforcing constraints, structural analysis methods have become increasingly relevant for risk studies that go beyond simple ranking or frequency-based identification [5]. Unlike approaches that treat risks as independent evaluation items, structural methods aim to uncover how factors influence one another, which elements operate as deep drivers and how downstream outcomes emerge from layered causal relations. This logic is especially useful in project-based construction environments, where decision contexts are characterized by significant uncertainty and complexity, and risks may interact across technical, organizational, and external domains [35]. Earlier construction risk research using system dynamics also emphasized interaction structures and feedback mechanisms in understanding risk [36].
Among structural methods, the DEMATEL–ISM combination is particularly suitable for this purpose. DEMATEL identifies the direction and strength of causal influence among factors [37]. ISM then organizes these relationships into a hierarchical structure that distinguishes deep, intermediate, and surface-level elements. The broader DEMATEL literature shows that the method has been widely used to analyze complex interdependencies across management and engineering contexts, because it offers an interpretable way to separate driving from dependent factors and to visualize system structure [17]. In construction-related studies, DEMATEL–ISM and its extensions have been applied to digital technology adoption barriers, construction schedule and safety risks, emergency response capability, prefabricated building supply-chain resilience, smart-city resilience and construction project risk evaluation [38,39,40,41]. These applications demonstrate the value of DEMATEL–ISM for revealing risk architecture and supporting system-level interpretation.
Recent hybrid DEMATEL studies have further extended this structural logic by integrating methods such as MICMAC, ANP, system dynamics and other analytical modules to strengthen factor classification, priority derivation, interdependence analysis or feedback simulation [42,43,44,45,46]. These studies confirm the methodological flexibility of DEMATEL–ISM as a structural decision-support tool. Their dominant analytical focus, however, remains the identification, classification or prioritization of system factors within a given assessment context. Limited attention has been paid to how DEMATEL–ISM structures can be compared and updated when assessments are repeated under changing project conditions, changing information availability and partial expert-panel continuity.
This gap is important for construction digital transformation. Commonly identified risks, such as limited digital capabilities, fragmented governance, data management challenges and weak inter-organizational coordination, are closely interconnected. Their influence depends both on their individual importance and on how they interact with other factors in the broader transformation system. As digital transformation projects move across stages, these interactions may also change. Structural approaches such as DEMATEL–ISM therefore provide a useful foundation for examining risk relationships, while the repeated-assessment setting requires an additional mechanism for maintaining continuity between structural models across rounds.

2.3. Limitations of Existing Applications

Two limitations remain evident in the existing literature. First, most DEMATEL–ISM applications in construction and digitalization research are based on a single round of expert judgement, after which the resulting causal map or hierarchical structure is treated as a relatively stable representation of the system [47,48]. This approach is methodologically convenient and useful for structural diagnosis within a specific assessment setting. However, it is less suitable for construction digital transformation projects, where organizational priorities, technical conditions, data practices and collaboration arrangements may change across implementation stages. Even when existing studies acknowledge that digital transformation is phased or adaptive, the structural modeling process itself usually remains static.
Second, dynamic risk analysis in the wider construction literature is usually pursued through system dynamics, Bayesian updating, dynamic quantitative models or real-time monitoring frameworks [14,49]. These approaches provide valuable support for modeling temporal changes, feedback processes and probabilistic updating. However, they do not directly address a specific problem in expert-based structural modeling: how to compare DEMATEL–ISM structures when repeated assessments are conducted under changing project conditions and potentially different expert participation. In construction digital transformation projects, repeated assessments are often necessary because different stages involve different information, managerial concerns and technical requirements. At the same time, expert judgement may be affected by framing, uncertainty, available information and panel composition [50,51]. As a result, direct comparison of independently generated DEMATEL–ISM structures may lead to unstable or ambiguous interpretations. To clarify the methodological positioning of this study, Table 1 compares several established structural and dynamic risk-analysis approaches. The comparison focuses on their suitability for the specific task addressed in this study: updating and comparing expert-derived risk structures across repeated assessments of construction digital transformation projects.
These approaches provide useful tools for probabilistic inference, prioritization, uncertainty representation and dynamic simulation. However, the specific problem addressed in this study is different: repeated expert-based DEMATEL–ISM assessments need to be compared and updated when project conditions, information availability and expert participation change across rounds. The proposed framework is positioned to address this problem by retaining the causal-role and hierarchy interpretation of DEMATEL–ISM while introducing a controlled mechanism for cross-round structural continuity.
This limitation is particularly important for construction digital transformation projects. These projects are staged, organizationally heterogeneous and dependent on changing stakeholder configurations. Expert panels may therefore vary across assessment rounds, as the project itself involves different actors and knowledge requirements at different stages. The methodological issue is to provide a structured basis for comparing and updating risk structures under such heterogeneous assessment conditions.
What is still missing is a framework that preserves the interpretability of DEMATEL–ISM while improving the continuity of structural comparison across assessment rounds. In response, this study proposes an unsupervised learning-enhanced DEMATEL–ISM framework. The purpose of introducing unsupervised learning is to extract relational patterns from earlier influence matrices and incorporate them into subsequent structural modeling. In this way, the framework addresses the gap between static expert-based structure identification and the practical need for multi-round risk structure updating in construction digital transformation.

3. Methodology

3.1. Methodological Positioning and Framework Overview

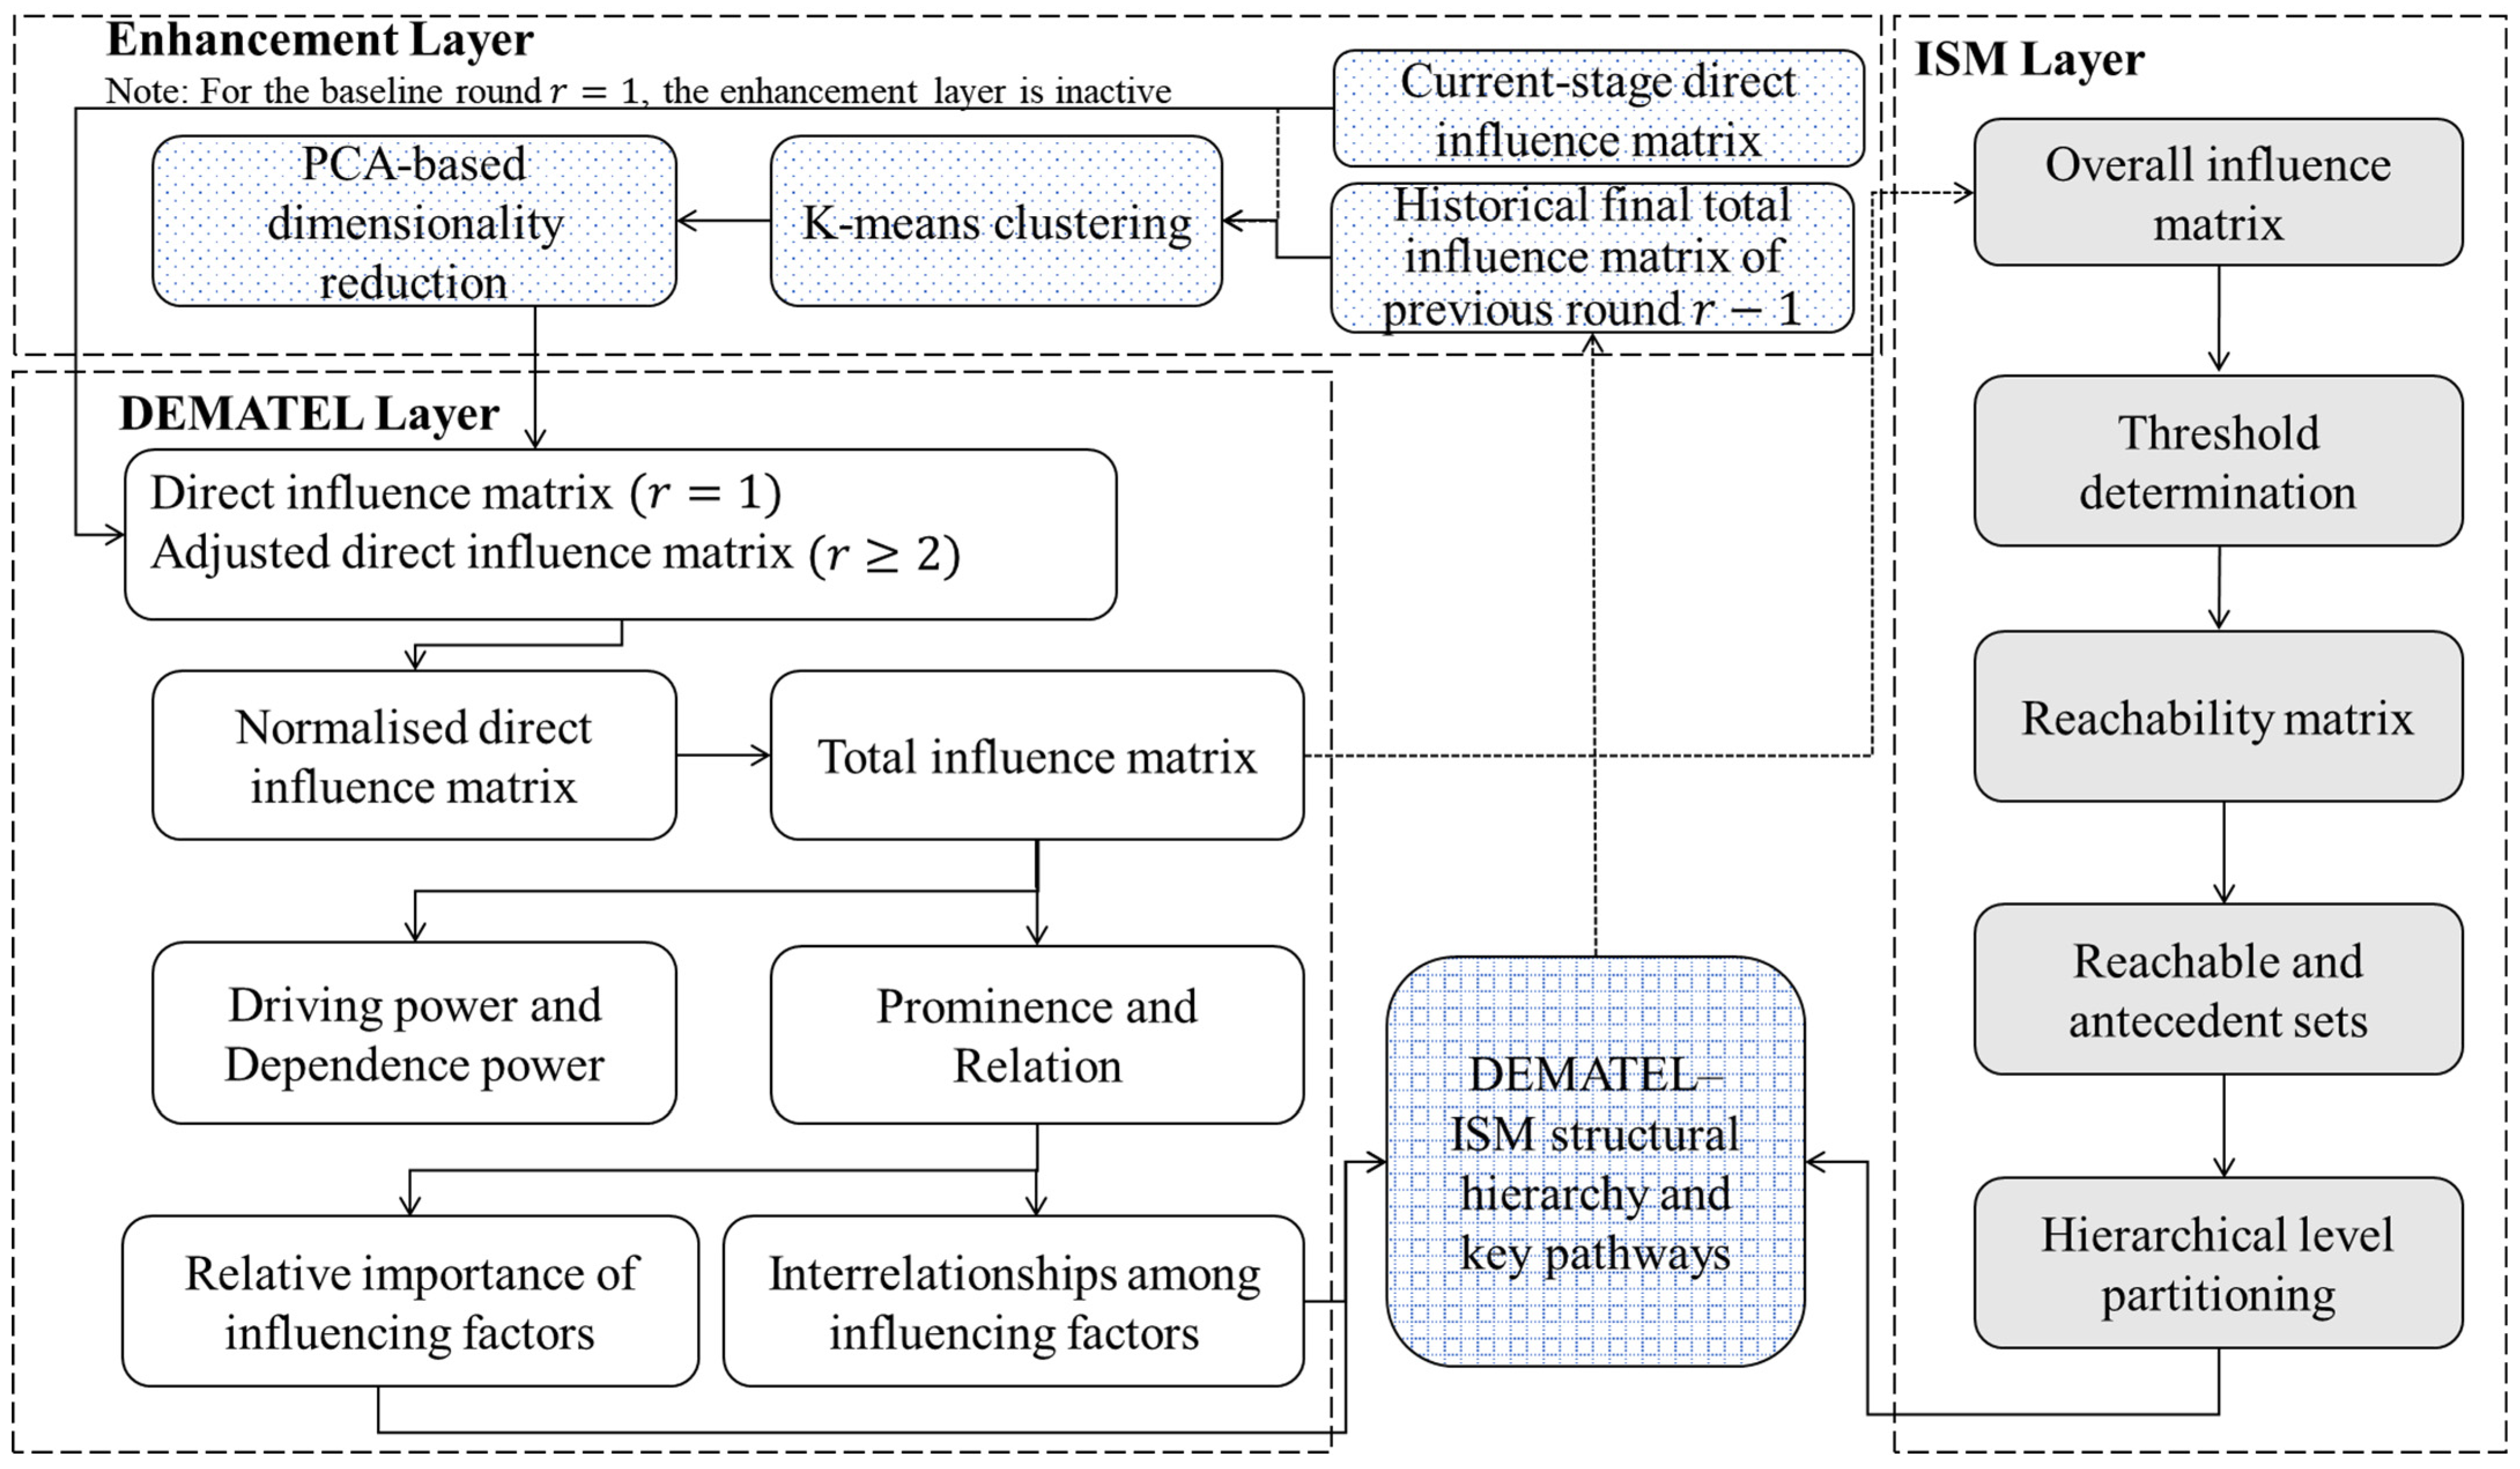
This study develops an unsupervised learning-enhanced DEMATEL–ISM framework for multi-round risk structure analysis in construction digital transformation projects. The framework is designed for assessment settings in which project conditions, available information and expert participation may vary across stages. Hence, it incorporates historical relational patterns into subsequent modeling so that risk structures can be updated and compared in a more consistent and interpretable manner. The directional influence relationships among construction digital transformation risks are difficult to observe directly from routine project data. The framework therefore uses expert elicitation as the primary input for structural modeling. The purpose of the model is to organize, aggregate and examine expert knowledge about inter-factor influence relationships through a transparent structural procedure.
The framework consists of three conceptual layers: a DEMATEL layer, an ISM layer and an unsupervised-learning enhancement layer. The DEMATEL and ISM layers jointly construct the structural representation of risk interactions within each assessment round. The enhancement layer introduces historical structural information from previous rounds to support comparison and updating under changing assessment conditions. Through this design, the framework retains the expert-driven and interpretable nature of DEMATEL–ISM while improving its applicability to staged construction digital transformation projects.
In each assessment round, DEMATEL is applied to construct the influence matrix based on expert evaluations of pairwise relationships among identified risk factors. The resulting total influence matrix represents the strength and direction of interactions within the risk system and provides the basis for identifying driving and dependent roles among risk factors. These relational patterns describe how risks influence one another within a given assessment setting. The ISM layer then translates these influence relationships into an interpretable hierarchical structure. By organizing risk factors into multiple levels, ISM distinguishes deep drivers, intermediate transmission factors and surface-level outcomes within the risk hierarchy. This representation allows the structural architecture of the risk system to be examined within each assessment round.
To support multi-round structural comparison, the framework introduces an enhancement layer that incorporates historical structural information into subsequent assessment rounds. Unsupervised-learning techniques are applied to the influence matrices obtained in previous rounds to extract relational patterns embedded in earlier structural results. In this study, K-means clustering is used to identify groups of risk factors with similar influence profiles, while PCA captures dominant relational directions within the influence data [52]. These techniques are selected because they are transparent, interpretable and compatible with the expert-driven logic of DEMATEL–ISM. K-means provides a clear grouping mechanism for factors with similar historical influence profiles, which can be directly converted into a cluster-based structural similarity matrix. PCA provides a parsimonious way to identify the dominant relational direction in the historical influence matrix and to convert this information into factor-level structural weights. Alternative approaches, such as hierarchical clustering, fuzzy clustering or nonlinear dimensionality-reduction methods, may capture richer patterns, but they also introduce additional modeling choices, including dendrogram cut-off rules, membership parameters, embedding settings or larger data requirements. These additional choices may reduce interpretability in a small expert-based DEMATEL–ISM setting. The structural patterns extracted from earlier rounds are then incorporated into the current influence matrix through matrix-level adjustment. In this way, current expert evaluations are interpreted in relation to previously observed structural patterns.
Figure 2 presents the overall analytical framework. In the initial assessment round, the procedure corresponds to a standard DEMATEL–ISM analysis. In subsequent rounds, relational patterns derived from previous structural results are incorporated through the enhancement layer. The framework therefore supports risk structure updating and comparison across assessment rounds while allowing current project conditions and expert evaluations to influence the resulting structure.

3.2. Construction Steps of the Framework

Based on the framework described above, the construction procedure consists of the following analytical steps.
  • Step 1. Risk factor identification and influence matrix construction.
Risk factors are identified through a combination of systematic literature review and expert consultation in the field of construction digital transformation. Let S = { S 1 , S 2 , , S n } denote the set of n risk factors, and E = e 1 , e 2 , , e q denote the panel of q experts. All experts are assumed to have equal importance, expressed as 1 q . To quantify the pairwise influence relationships among these factors, expert surveys are conducted, in which evaluations are provided by domain specialists with substantial professional experience in construction digital transformation-related fields and complementary functional backgrounds [53].
To capture nuanced expert judgements, a five-point evaluation scale ranging from 0 (no influence) to 4 (very strong influence) is adopted, as shown in Table 2 [48]. For each assessment round r ( r = 1 , 2 , , R ) , each expert, e φ E ( φ = 1 , 2 , , q ) , employs the scoring method to evaluate the degree of influence of factor S i on factor S j . The aggregated expert judgements are then used to construct the direct influence matrix, X ( r ) [47]:
X ( r ) = x i j ( r ) n × n = φ = 1 q 1 q x i j φ ( r ) n × n = 0 x 1 n x n 1 0 n × n
where x i j ( r ) represents the average influence of factor S i on factor S j given by all the experts in the r th assessment round for i , j = 1 , 2 , , n , r = 1 , 2 , , R , φ = 1 , 2 , , q .
  • Step 2. Normalization of the direct influence matrix.
To ensure comparability across factors, the direct influence matrix, X ( r ) , is normalized into matrix A ( r ) for r = 1 , 2 , , R , with all elements bounded within using [0, 1] [41]:
A ( r ) = X ( r ) max 1 i n j = 1 n x i j ( r )
where the denominator represents the maximum row sum of matrix X ( r ) , ensuring that all elements of A ( r ) lie within the interval [0, 1]. This normalization also guarantees that the spectral radius of A ( r ) is less than one.
  • Step 3. Derivation of the total influence matrix.
For the r th assessment round, the total influence matrix, B ( r ) = b i j ( r ) n × n , which captures both direct and indirect effects, is obtained as follows [41]:
B ( r ) = A ( r ) + A ( r ) 2 + + A ( r ) n = A ( r ) I A ( r ) n 1 I A ( r )
For computational convenience, the following equivalent form is used [41]:
B ( r ) = A ( r ) I A ( r ) 1
where I denotes the identity matrix, and r = 1 , 2 , , R .
  • Step 4. Identification of causal influence characteristics.
Based on the total influence matrix, B ( r ) , four indicators, namely driving power, f i ( r ) ; dependence power, e i ( r ) ; prominence, ε i ( r ) ; and relation, δ i ( r ) , in assessment round, r , are derived by the following [48]:
f i ( r ) = j = 1 n b i j ( r )
e i ( r ) = j = 1 n b j i ( r )
ε i ( r ) = f i ( r ) + e i ( r )
δ i ( r ) = f i ( r ) e i ( r )
where i = 1 , 2 , , n , r = 1 , 2 , , R .
Prominence reflects the overall importance of a factor, while the sign of relation index distinguishes driving factors from dependence ones.
  • Step 5. Construction of the overall influence structure.
For assessment round, r , the sum of the identity matrix and the total influence matrix constitutes the overall influence matrix, D ( r ) = d i j ( r ) n × n , which can be constructed by the following [47]:
D ( r ) = I + B ( r )   r = 1 , 2 , , R
  • Step 6. Reachability matrix generation.
To simplify the structural representation, a threshold, λ , is applied to the overall influence matrix, D ( r ) . Following common practice, λ is determined as the mean plus the standard deviation of all elements in D ( r ) . The resulting reachability matrix, H ( r ) = h i j ( r ) n × n , can be constructed by the following [16]:
h i j ( r ) = 0 ,   d i j ( r ) < λ 1 ,   d i j ( r ) λ
where if h i j ( r ) = 0 , then there is no connection path between factor S i and S j . If h i j ( r ) = 1 , then there is a connection path between factor S i and S j , i , j = 1 , 2 , , n , r = 1 , 2 , , R .
The robustness of the resulting hierarchical structure under alternative threshold schemes is further examined in the application section.
  • Step 7. Hierarchical decomposition of the risk system
For each factor S i in assessment round r , the reachable set Q ( S i ) ( r ) and the antecedent set P ( S i ) ( r ) of factor S i can be determined by [17]:
Q ( S i ) ( r ) = S j | S j S , h i j ( r ) = 1
P S i ( r ) = S j | S j S , h j i ( r ) = 1
where i , j = 1 , 2 , , n , r = 1 , 2 , , R .
A factor, S i , is assigned to the current hierarchical level if it satisfies the following condition, denoted as follows [17]:
Q S i ( r ) = Q S i ( r ) P S i ( r ) ,   i = 1 , 2 , , n ,   r = 1 , 2 , , R
This condition means that factor S i does not influence any additional factors within the system and thus represents a top-level element in the current hierarchical partition. Once the factors at the current level are identified, the corresponding rows and columns are removed from the reachability matrix, H ( r ) , in assessment round, r .
  • Step 8. Construction of the Hierarchical Risk Structure.
Step 7 is repeated until all factors are assigned to hierarchical levels. This iterative partitioning process produces a multi-level structure that distinguishes surface factors, intermediate transmission factors and deep driving factors.
  • Step 9. Baseline structural analysis and cross-round pattern learning.
To support multi-round structural comparison, the analysis distinguishes between the baseline assessment round ( r = 1 ) and subsequent assessment rounds ( r 2 ) . In the baseline round, the standard DEMATEL–ISM procedure (Steps 1–8) is applied to obtain the initial total influence matrix. For subsequent rounds, historical structural information obtained from previous assessments is incorporated to extract stable relational patterns within the evolving risk system.
Let B ^ ( r ) = b ^ i j ( r ) n × n denote the final total influence matrix of assessment round, r , and then we have the following formula:
B ^ ( r ) = B ( 1 ) , r = 1 B a d ( r ) , r 2
b ^ i j ( r ) = b i j ( 1 ) , r = 1 b i j a d ( r ) , r 2
where B a d ( r ) is the adjusted total influence matrix, and b i j a d ( r ) is the adjusted element in B a d ( r ) .
For the baseline round ( r = 1 ) , no structural enhancement is applied. The standard DEMATEL-ISM procedure, namely Steps 1–8, can be directly performed on X ( 1 ) to obtain the total influence matrix, B ( 1 ) .
For each subsequent round ( r 2 ) , relational information from the previous assessment round is used to extract historically observed structural patterns. Specifically, the final total influence matrix, B ^ ( r 1 ) , obtained in the previous assessment round, r 1 , serves as the input for unsupervised learning, which aims to identify structurally similar factors and dominant relational directions.
Based on the learned clustering structure and principal component analysis, a cluster-based structural similarity matrix and a driving-weighting matrix are constructed, as detailed in Step 10.
  • Step 10. Structural pattern learning using unsupervised methods.
For each dynamic assessment round, r ( r 2 ) , unsupervised-learning techniques are employed to extract stable relational patterns from the historical final total influence matrix, B ^ ( r 1 ) , obtained in the previous round, r 1 . This step aims to identify factors with similar historical influence profiles and dominant relational directions in the previous assessment matrix.
Let b ^ i ( r 1 ) = ( b ^ i 1 r 1 , b ^ i 2 r 1 , , b ^ i n r 1 ) be the final influence vector of factor S i derived from B ^ ( r 1 ) for the previous assessment round, r 1 , where r = 2 , , R . To identify groups of risk factors with similar causal roles, K-means clustering is applied to the influence vector, b ^ i ( r 1 ) .
Let c k ( r 1 ) = ( c k 1 r 1 , c k 2 r 1 , , c k n r 1 ) denote the centroid of cluster, k , for the assessment round, r 1 . The Euclidean distance [54] between factor S i and centroid c k ( r 1 ) is constructed as follows:
d b ^ i ( r 1 ) , c k ( r 1 ) = p = 1 n b ^ i p ( r 1 ) c k p ( r 1 ) 2
where p denotes the dimensionality of the feature space, d ( . , . ) represents the distance between two p dimensional vectors, i , p = 1 , 2 , , n , r = 2 , , R , k = 1 , 2 , , K , 1 K n and K N + .
At the initial stage of the K-means procedure, the cluster centroids, c k r 1 k = 1 , 2 , , K , are initialized by randomly selecting K influence profile vectors from the set b ^ i r 1 i = 1 , 2 , , n . Then, the centroids can be calculated by the following formula [55]:
c k ( r 1 ) = 1 G k ( r 1 ) S i G k ( r 1 ) b ^ i ( r 1 ) , k = 1 , 2 , , K , r = 2 , 3 , , R
where G k ( r 1 ) and G k ( r 1 ) , respectively, represent the set and number of factors in cluster k for the assessment round, r 1 . After convergence, each factor is assigned a cluster label expressed by c r 1 ( S i ) .
The structural distance between factor S i and S j is derived by the following formula:
d b ^ i ( r 1 ) , b ^ j ( r 1 ) = p = 1 n b ^ i p ( r 1 ) b ^ j p ( r 1 ) 2
where i , j , p = 1 , 2 , , n , r = 2 , , R .
The cluster-based enhancement coefficient, α i j ( r ) , for assessment round, r , is defined as follows [56]:
α i j ( r ) = 1 + η , i = j 1 + η 1 d b ^ i ( r 1 ) , b ^ j ( r 1 ) d max ( r 1 ) , i j   a n d   c r 1 S i = c r 1 ( S j ) 1 , i j   a n d   c r 1 ( S i ) c r 1 ( S j )
where d max ( r 1 ) = max i , j d b ^ i ( r 1 ) , b ^ j ( r 1 ) , and η is a scaling coefficient controlling the strength of within-cluster enhancement. In this study, η is set to 0.5 as a moderate enhancement coefficient. This setting provides limited within-cluster reinforcement while avoiding excessive dependence on historically observed clusters and preserving the dominant information contained in the current expert evaluations [54,55,56]. The resulting coefficients, α i j r ( i , j = 1 , 2 , , n ) , are assembled into a structural similarity matrix, U ( r ) = α i j r n × n .
For each dynamic round, r 2 , to identify dominant driving patterns, PCA is applied to the historical final total influence matrix, B ^ ( r 1 ) , containing influence vectors b ^ i r 1 ( i = 1 , 2 , , n ) . And the covariance matrix is expressed as follows [57]:
Σ ( r 1 ) = 1 n i = 1 n b ^ i ( r 1 ) b ¯ ( r 1 ) b ^ i ( r 1 ) b ¯ ( r 1 ) T
where b ¯ ( r 1 ) is the mean influence vector of the final total influence matrix, B ^ ( r 1 ) .
Let v ( r 1 ) = ( v 1 r 1 , , v n r 1 ) T be the eigenvector associated with the largest eigenvalue of the covariance matrix, Σ ( r 1 ) . Then the PCA-based driving weight of factor S i is calculated by the following formula [58]:
ω i r = v i r 1 2 i = 1 n v i r 1 2
where ω i r reflects the contribution of factor S i to the leading principal component, which captures the dominant variance of the system.
Based on this contribution, a structural weighting coefficient, β i ( r ) , is defined as follows:
β i r = 1 + γ ω i r
where 0 < γ < 1 and is a scaling parameter controlling the contribution of PCA results.
In this study, γ is set to 0.5 as a moderate weighting coefficient to balance structural sensitivity and robustness. This setting incorporates PCA-derived historical information in a controlled manner [59,60], so that historically dominant relational directions can inform the updated matrix without suppressing new influence patterns in the current assessment.
W ( r ) = diag β 1 r , β 2 r , , β n r , r 2 .
  • Step 11. Influence matrix updating based on structural reinforcement.
According to the cluster-based structural similarity matrix, U ( r ) , and the diagonal driving-weighting matrix, W ( r ) , the direct influence matrix for the current assessment round, r , is dynamically adjusted. The adjusted direct influence matrix is defined as follows [61]:
X a d ( r ) = X ( 1 ) , r = 1 W ( r ) X ( r ) U ( r ) , r 2
where denotes the Hadamard product. Both U ( r ) and W ( r ) are derived from the historical structural learning procedure described above.
Through this matrix-level adjustment, structural information learned from the final influence matrix of the preceding assessment round is incorporated into the current evaluation. The updated matrix is still constructed from the current direct influence matrix, while the cluster-based similarity matrix and PCA-derived driving weights provide bounded structural reference from the previous round. Therefore, the enhancement mechanism improves cross-round continuity while allowing new influence patterns in the current expert assessment to reshape the resulting structure.
The adjusted matrix, X a d ( r ) , is then used as the input for Steps 2–8 to derive the normalized matrix, the total influence matrix and the corresponding ISM-based hierarchical structure for the current round. The threshold, λ ( r ) , is recalculated based on the updated overall influence matrix, ensuring that the resulting structure remains responsive to the current assessment conditions. Through this process, the framework supports structural updating across assessment rounds while limiting excessive dependence on historically observed patterns.
All the aforementioned numerical analyses, including matrix calculations, DEMATEL–ISM modelling, K-means clustering, principal component analysis, and robustness analyses, were implemented in Python 3.9 (Python Software Foundation, Wilmington, DE, USA) using the Spyder 6.1 integrated development environment (Spyder Project Contributors).

4. Case Study

This section uses an enterprise-level digital transformation project undertaken by a large construction group headquartered in Shanghai, China, as an application-based evaluation of the proposed framework. The group is a comprehensive construction enterprise engaged in engineering design, project delivery, infrastructure development and related management services. In recent years, the organization has actively promoted digital transformation initiatives to improve operational efficiency, strengthen information integration and enhance decision-making capabilities across different business units.
The selected case concerns an enterprise-level digital transformation project implemented within the organization. The initiative aimed to support enterprise-wide digital integration and management optimization through the development of an integrated digital platform. The platform was designed to facilitate information sharing, process coordination and data connectivity across multiple business and administrative functions. Key activities included improving project-related information exchange, enhancing cross-departmental collaboration, integrating digital records from different operational units, strengthening data governance and improving the efficiency of internal management and project-support processes. The project also incorporated digital technologies and management practices commonly adopted in the construction industry, including BIM-enabled coordination, digital monitoring tools, data management systems and platform-based collaboration mechanisms.
The challenges and risks encountered during implementation were associated with interactions among technological, organizational and managerial factors, including resource allocation, digital capability, data management, technical infrastructure, strategic planning, organizational adaptation and inter-organizational coordination. These characteristics reflect the multidimensional nature of construction digital transformation. They also make the case suitable for examining whether the proposed framework can capture evolving relationships among risk factors and support interpretable risk-structure updating under changing assessment conditions.

4.1. Data Collection

Data were collected through a structured expert survey conducted between June and July 2025. Ethical approval for the study was granted by the Ethics Committee of Tongji University. The first-round assessment involved a panel of ten experts, which falls within the range commonly adopted in DEMATEL–ISM-based risk analysis and decision-support studies.
The experts were selected according to the characteristics of the case project and the broader requirements of construction enterprise digital transformation. Since the case project focused on internal digital platform development, data connectivity, process coordination, data governance and management-process digitalization within a construction group, the assessment required experts who could evaluate risk relationships from complementary construction, management and digital transformation-related perspectives. The panel therefore included experts from engineering design, project consultancy, real estate development, construction execution, scientific research, quality inspection and public-sector project supervision. All experts had substantial professional experience in construction-related contexts and direct exposure to digital technologies, digital management practices or digital transformation initiatives relevant to the case. Their professional diversity helped reduce dependence on a single disciplinary viewpoint and supported a balanced evaluation of inter-factor influence relationships in the specific case context [53]. The expert profiles are summarized in Table 3.
The set of influencing factors used for structural risk analysis was developed through a structured refinement process grounded in prior research and expert deliberation. In earlier research, a comprehensive risk taxonomy for digital transformation projects in construction enterprises was developed to support quantitative risk prioritization [5]. Building on this foundation, the present study re-examines these risk elements from a structural modeling perspective. The aim is not to reproduce the full operational indicator system, but to identify a manageable set of structurally meaningful factors for pairwise influence assessment in DEMATEL–ISM.
This refinement is necessary because construction digital transformation risks are embedded in project-based, multi-actor and lifecycle-spanning processes. Digital transformation in construction involves not only enterprise-level strategy, but also BIM-enabled design coordination, smart-site implementation, project data exchange, platform integration, supply-chain collaboration and digital handover. Because DEMATEL–ISM requires experts to evaluate directional relationships among all factor pairs, an excessively large indicator set would increase the cognitive burden of expert judgement. Conceptually related indicators were therefore consolidated into ten higher-level factors. To avoid ambiguity, Table 4 specifies the concrete meaning of each factor in the context of construction digitalization. As a result, ten influencing factors were established for the case study, denoted as S = { A 1 , A 2 , B 1 , B 2 , , E 2 } .
Before the pairwise assessment, the experts were provided with a project briefing that described the case background, the main digital transformation tasks, the factor definitions in Table 4 and the evaluation scale. The briefing clarified that the case project focused on internal digital platform development, data connectivity, process coordination, data governance and management-process digitalization within a construction group, while also involving construction-specific digital technologies such as BIM-enabled coordination, digital monitoring tools and platform-based collaboration mechanisms. This procedure was used to ensure that all experts evaluated the same project context, understood the construction-specific meaning of each factor and provided more consistent directional influence judgements.
The analysis was conducted in two assessment rounds. The first round served as the baseline structural assessment. In this round, all ten experts independently evaluated the pairwise influence relationships among the ten risk factors using the same five-point scale. The individual direct influence matrices were then aggregated using the arithmetic mean to represent the group assessment.
A second-round assessment was subsequently conducted with five experts from the original panel. This arrangement reflects a common condition in construction digital transformation projects: as implementation progresses, expert participation may change because of organizational arrangements, expert availability and shifting technical requirements. The five experts involved in the second round had all participated in the first-round assessment, which preserved partial continuity of the expert panel while allowing for the assessment setting to reflect realistic variation in expert participation. Although the five second-round experts were drawn from the original panel, the design was not a fully balanced longitudinal panel. Therefore, the robustness analysis later compares the original ten-expert baseline with a same-five baseline and further conducts a leave-one-expert-out check for the follow-up assessment.
Both rounds used the same risk factor system, evaluation scale and pairwise influence assessment procedure. The second-round data were therefore treated as follow-up expert evaluations under changed project and panel conditions. This design allows the proposed framework to be examined in a setting where assessment conditions vary across rounds while the measurement framework remains consistent.
The purpose of the two-round case study is to examine whether the proposed framework can support structurally interpretable comparison and updating when repeated expert assessments are conducted under heterogeneous project and expert-participation conditions.

4.2. Results and Discussion

4.2.1. Causal Role Identification (Round 1)

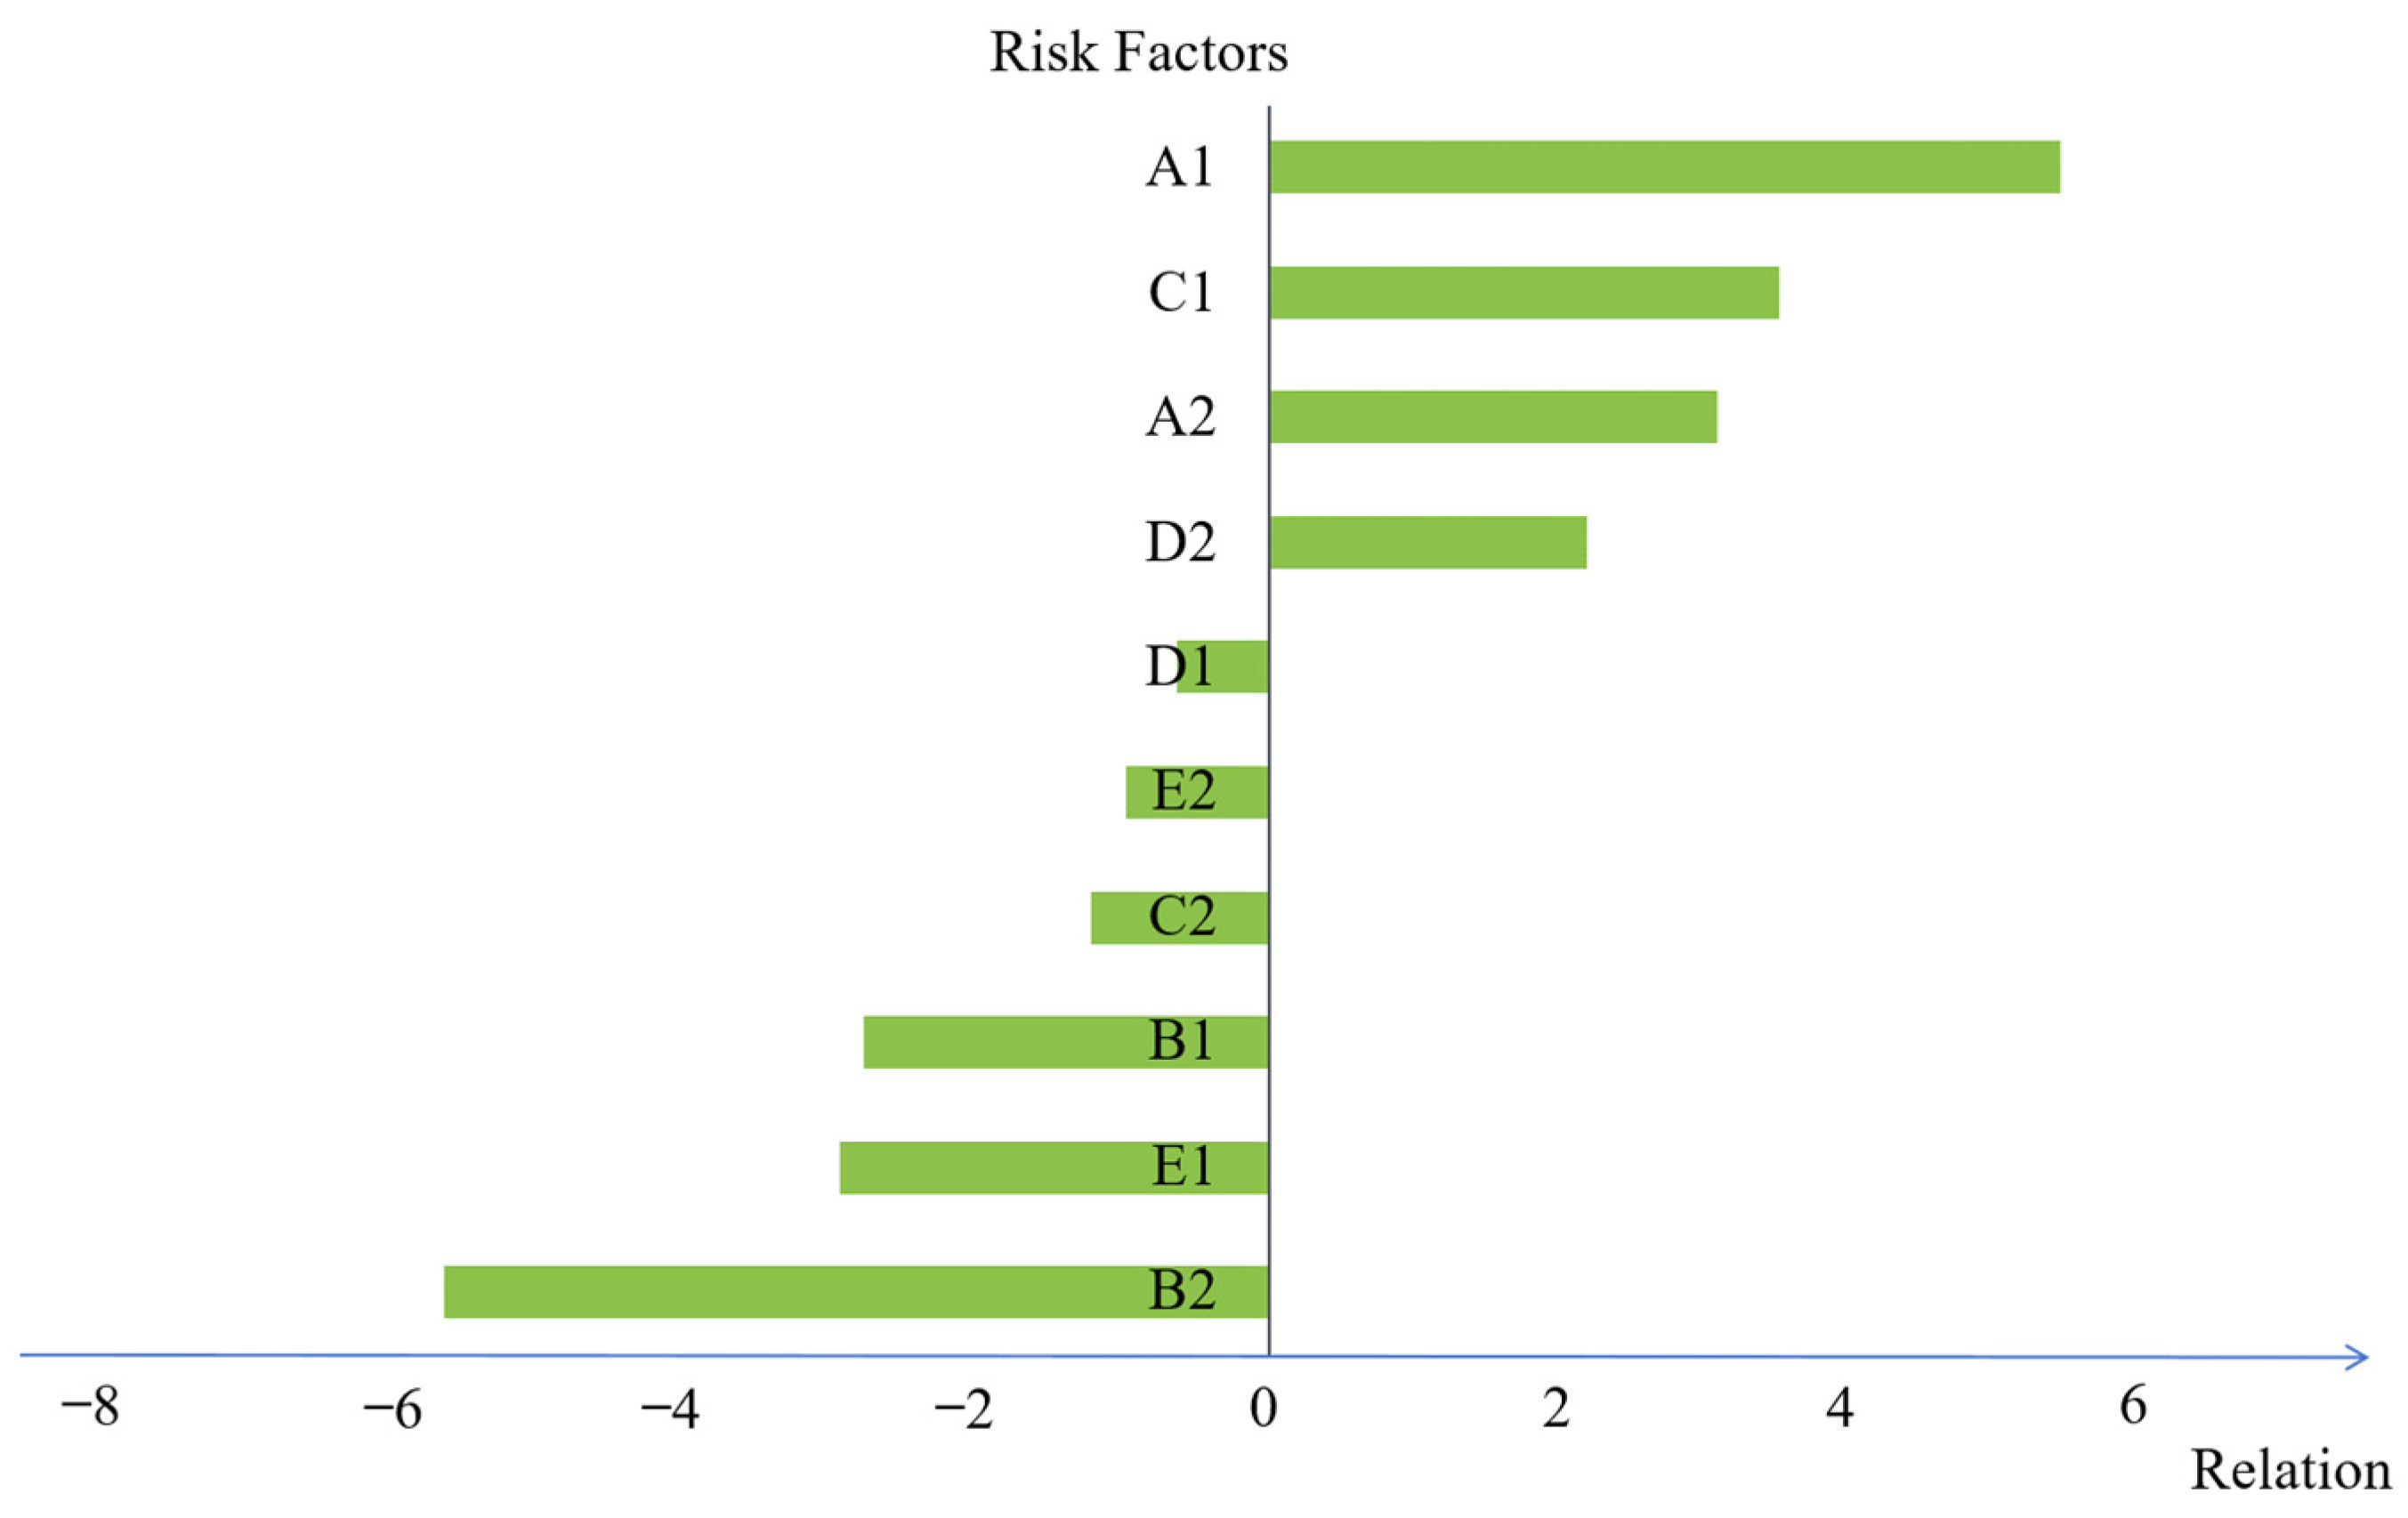
Based on the DEMATEL results, the causal relationship diagram for the first assessment round is shown in Figure 3. The results indicate clear differentiation in the causal roles of the ten risk factors.
The factor Tangible Resources (A1) exhibits the strongest positive relation value and emerges as the dominant cause-type factor in the baseline structure. This result indicates that the availability of funding, equipment, software and platform resources plays a foundational role during the early stage of construction digital transformation. In construction enterprises, digital initiatives usually require substantial investment in BIM platforms, smart-site systems, project data infrastructure and system integration. Insufficient tangible resources may therefore constrain technological deployment, project data exchange and cross-organizational digital collaboration [62,63].
Strategic Planning (C1) is also identified as an important cause-type factor. This reflects the role of strategic alignment and implementation planning in shaping digital transformation risks at the project level. Construction digitalization often involves multiple projects, fragmented organizational units and heterogeneous engineering systems [80]. Without a clear transformation roadmap, responsibility allocation and investment sequencing, digital tools may be adopted inconsistently across projects, creating downstream coordination and implementation problems [64].
Intangible Resources (A2) and Enterprise Environment (D2) also show positive relation values, although their driving effects are weaker than those of A1 and C1. These two factors represent the organizational capability and internal institutional conditions that support the translation of resources and strategies into project practices [64,73,74]. Digital competence, accumulated BIM experience, data-driven management capability, leadership support and internal coordination conditions influence whether construction enterprises can absorb and operationalize digital technologies across project teams.
In contrast, Technical Infrastructure (B1), Data Management (B2), Organizational Development (C2), Market Environment (D1), Supply-Chain Collaboration (E1) and Service Support (E2) show negative relation values and are classified as effect-type factors in the baseline assessment. These factors are more closely associated with the operational manifestations of upstream constraints. For example, interoperability problems, data inconsistency, weak platform support and poor digital coordination among project participants may appear during implementation, but their occurrence is often shaped by earlier decisions on resources, strategy and organizational readiness [8].

4.2.2. Hierarchical Structure Interpretation (Round 1)

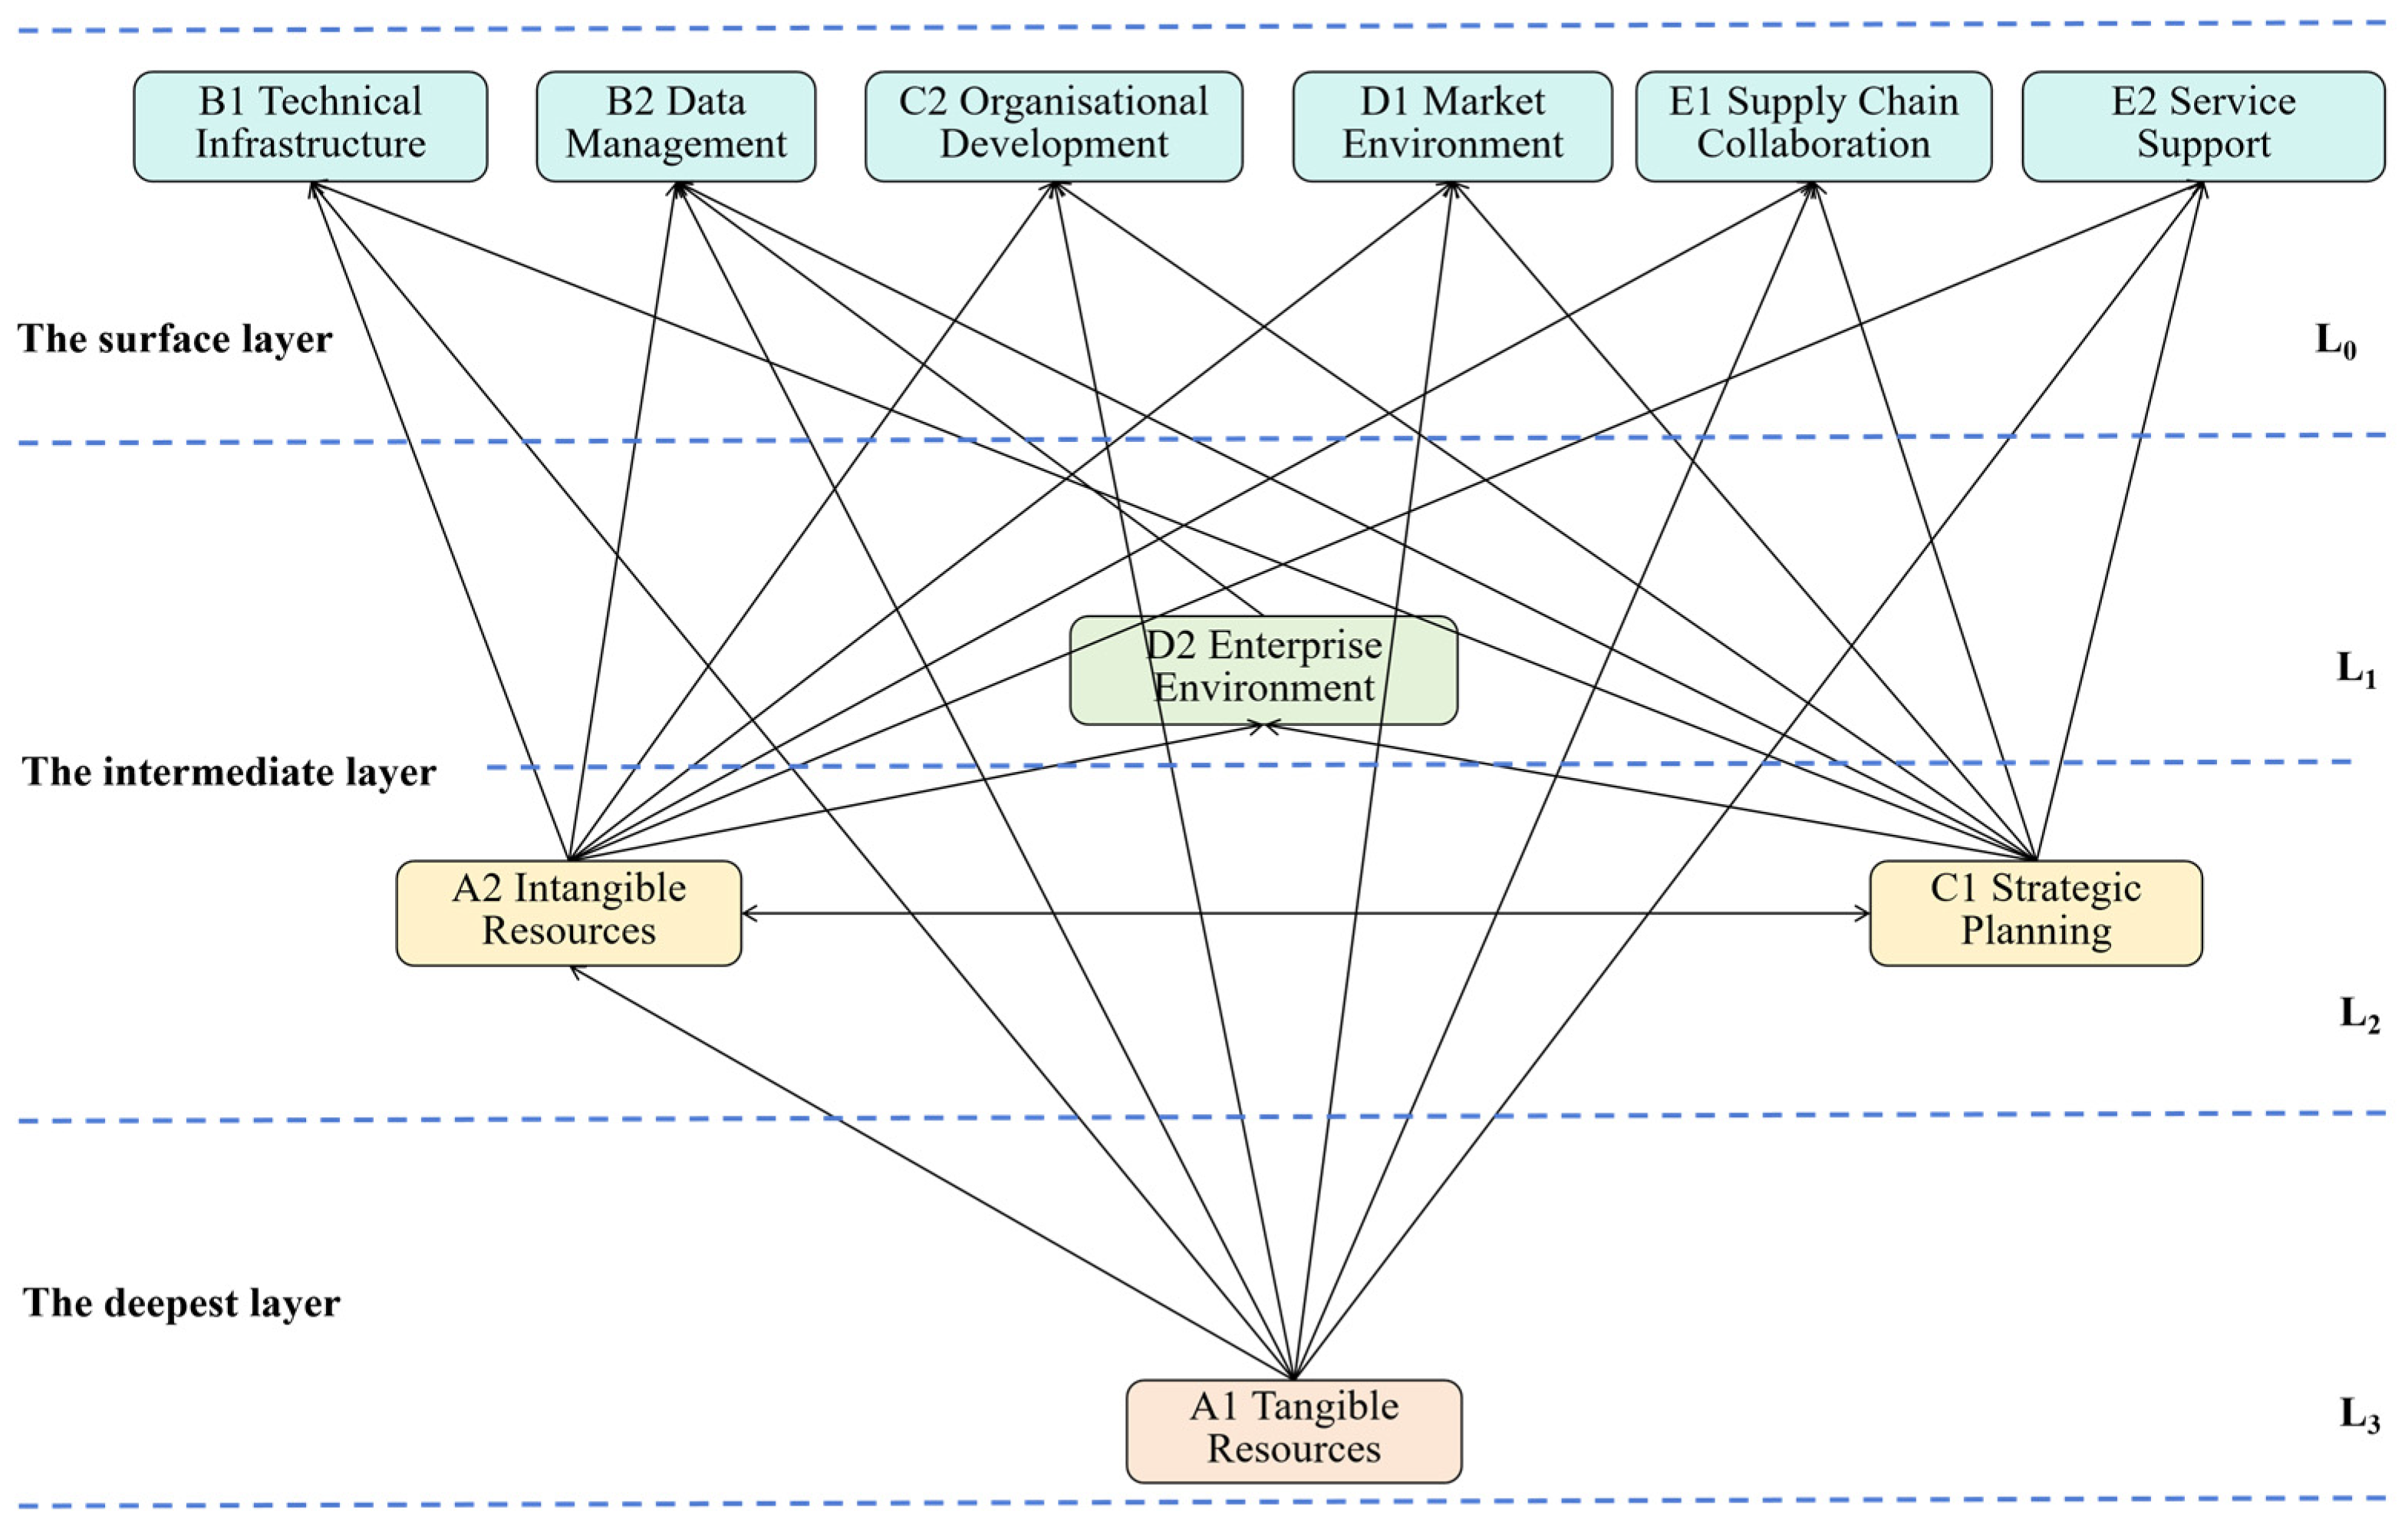
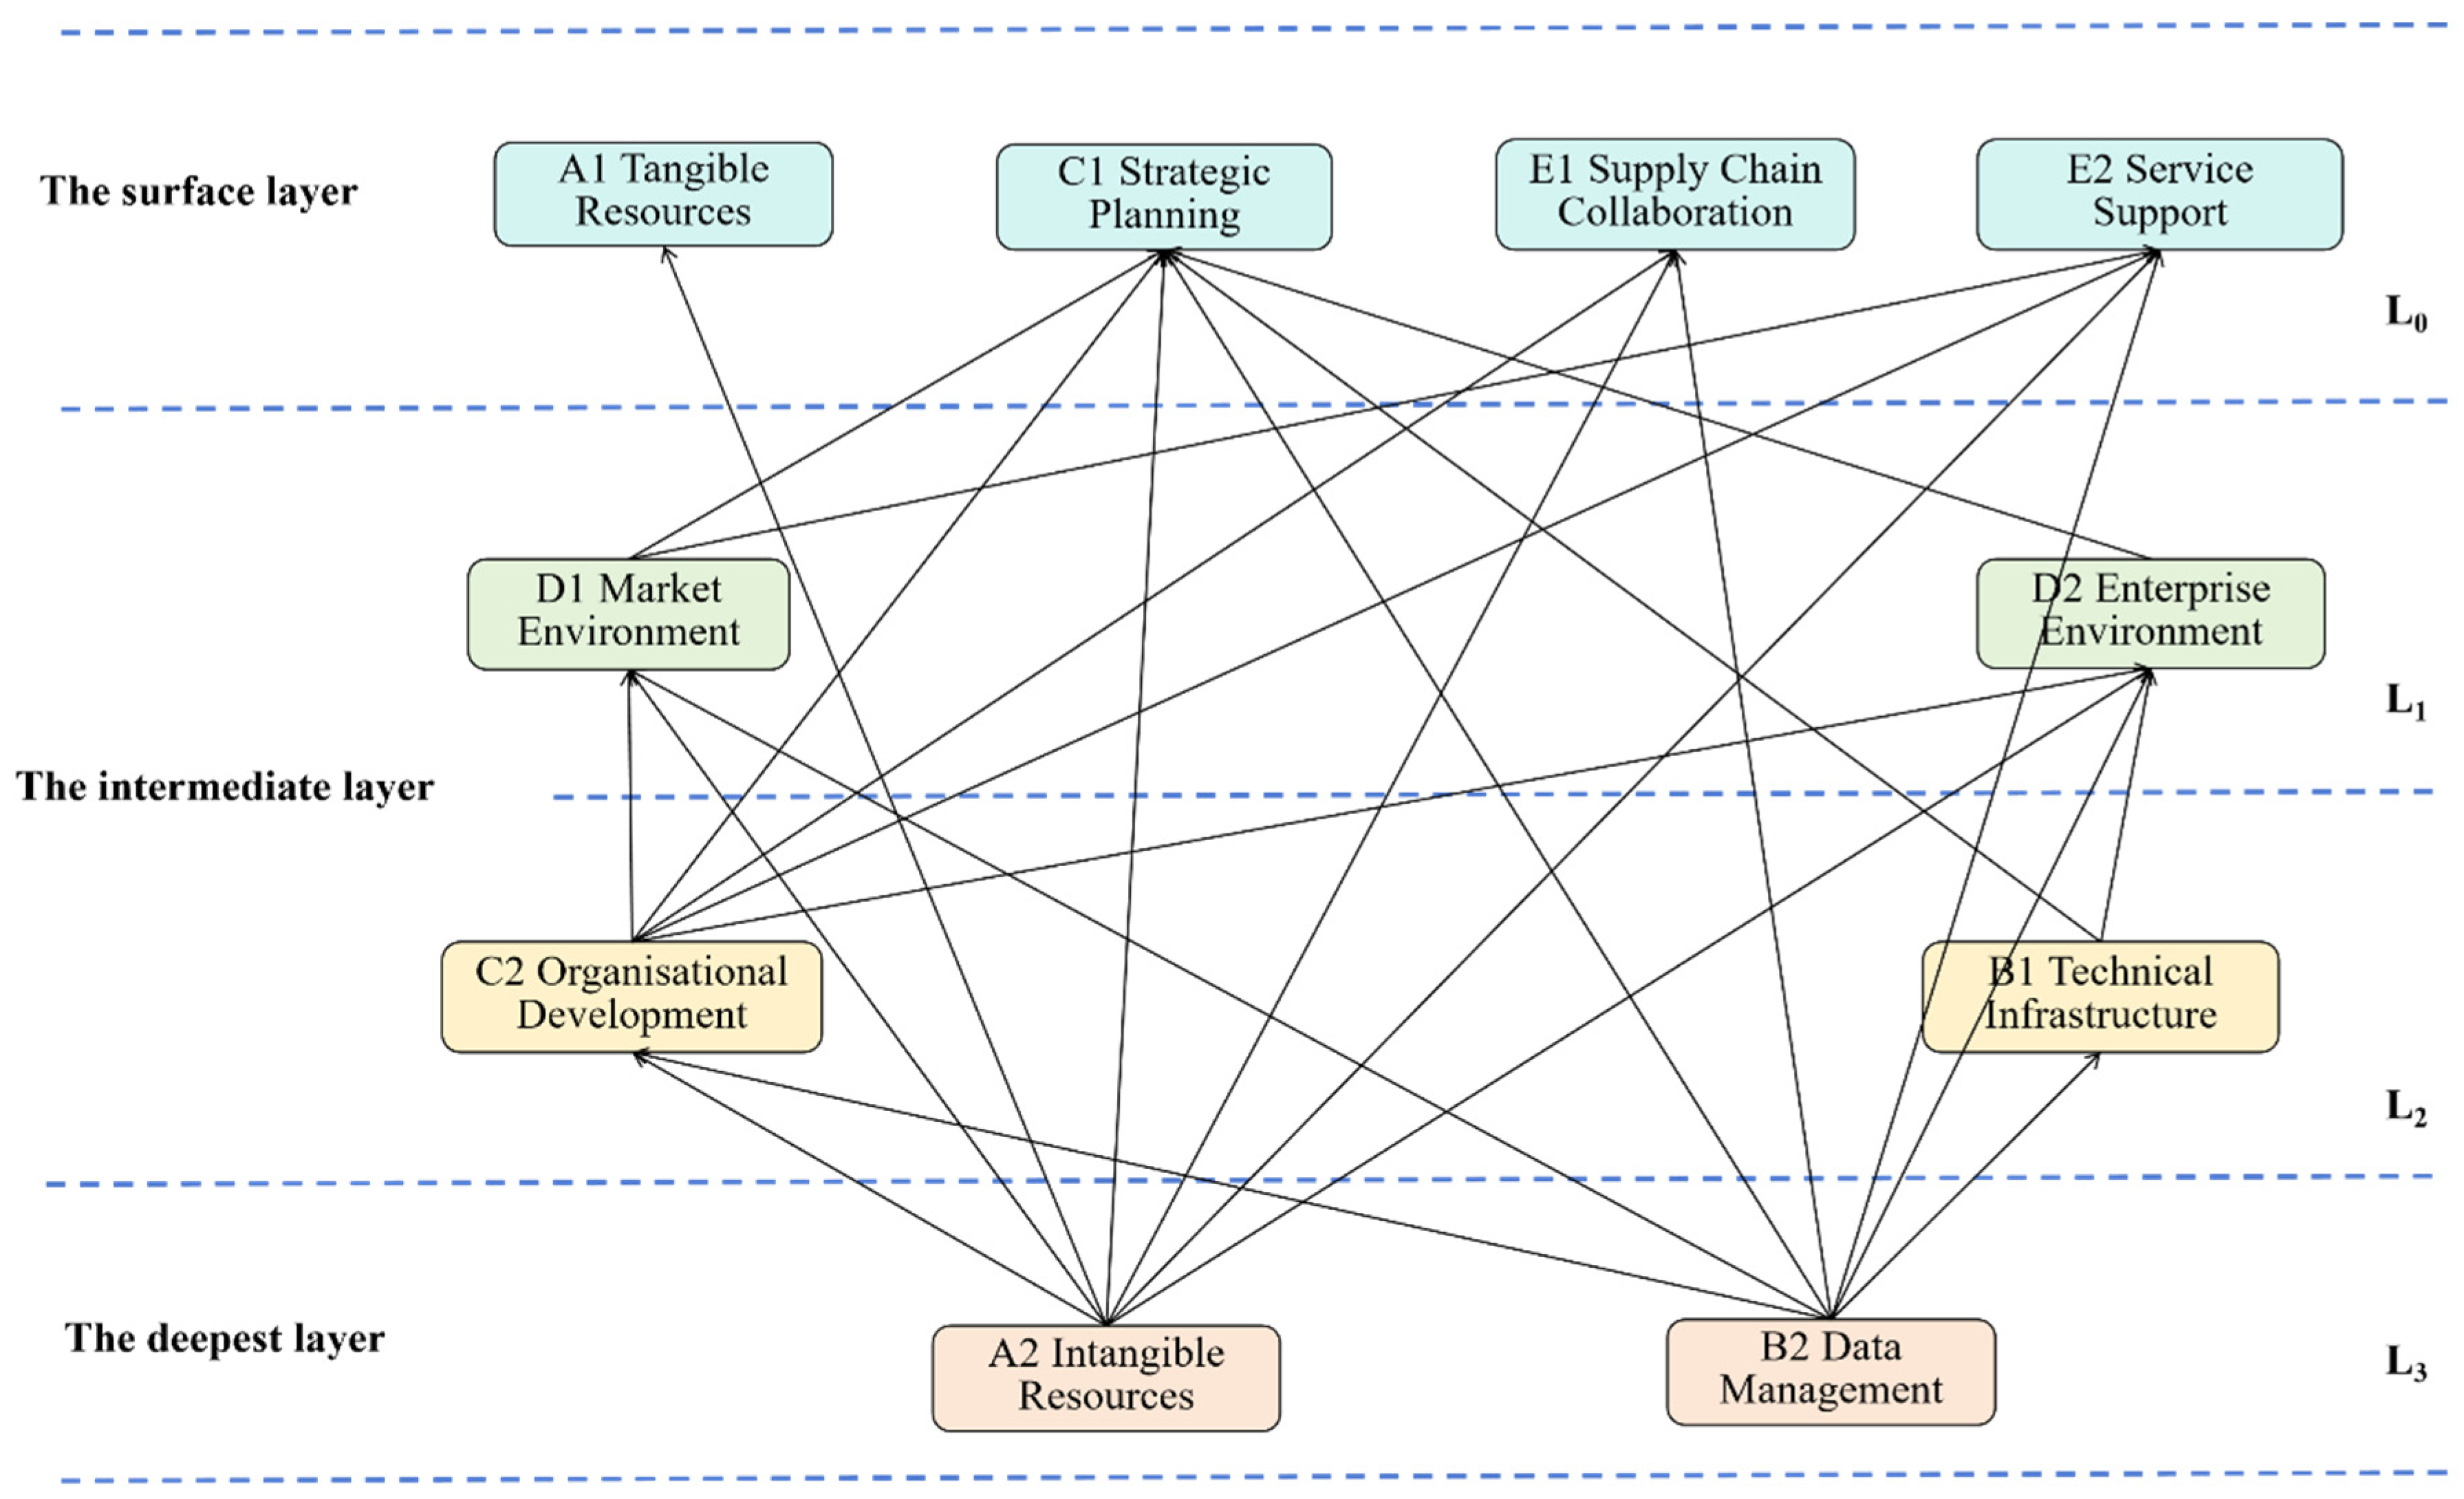
The ISM results further reveal the hierarchical configuration of risk factors in the baseline assessment. Based on the reachability analysis, the risk system is organized into four layers, as shown in Figure 4.
The Tangible Resources (A1) factor occupies the deepest layer of the hierarchy. This position confirms its role as a source-level constraint in the baseline risk structure [81]. In construction digital transformation projects, resource availability determines whether the enterprise can establish the digital foundations required for BIM deployment, smart-site implementation, data infrastructure construction and platform integration. Weaknesses at this level can propagate upward by limiting subsequent technological adoption, data management and project-level digital coordination [12].
Strategic Planning (C1), Intangible Resources (A2) and Enterprise Environment (D2) are located in the intermediate layers. These factors function as transmission conditions between foundational resources and operational outcomes. Strategic planning shapes the alignment between enterprise-level transformation objectives and project-level implementation paths. Intangible resources affect whether project teams possess the skills and knowledge required to work with digital tools. The enterprise environment influences whether internal governance, culture and incentives support digital adoption. Together, these factors determine whether resource inputs can be converted into effective digital construction practices [8].
Technical Infrastructure (B1), Data Management (B2), Organizational Development (C2), Market Environment (D1), Supply-Chain Collaboration (E1) and Service Support (E2) appear in the upper layers. Their positions indicate that they depend on multiple upstream conditions. In practical construction digitalization, problems such as fragmented project data, weak interoperability, insufficient platform support and poor supply-chain information sharing are often visible at the operational level. The ISM hierarchy suggests that these problems should be interpreted in relation to deeper resource, strategic and organizational conditions [82].
The baseline hierarchy therefore presents a resource- and strategy-driven risk structure. Tangible resources form the deepest structural foundation, while strategic planning, intangible capability and enterprise environment mediate the translation of digital resources into project practices. Operational risks related to technology, data and collaboration appear closer to the surface. This baseline structure provides the reference point for interpreting the follow-up assessment.

4.2.3. Causal Reconfiguration (Round 2)

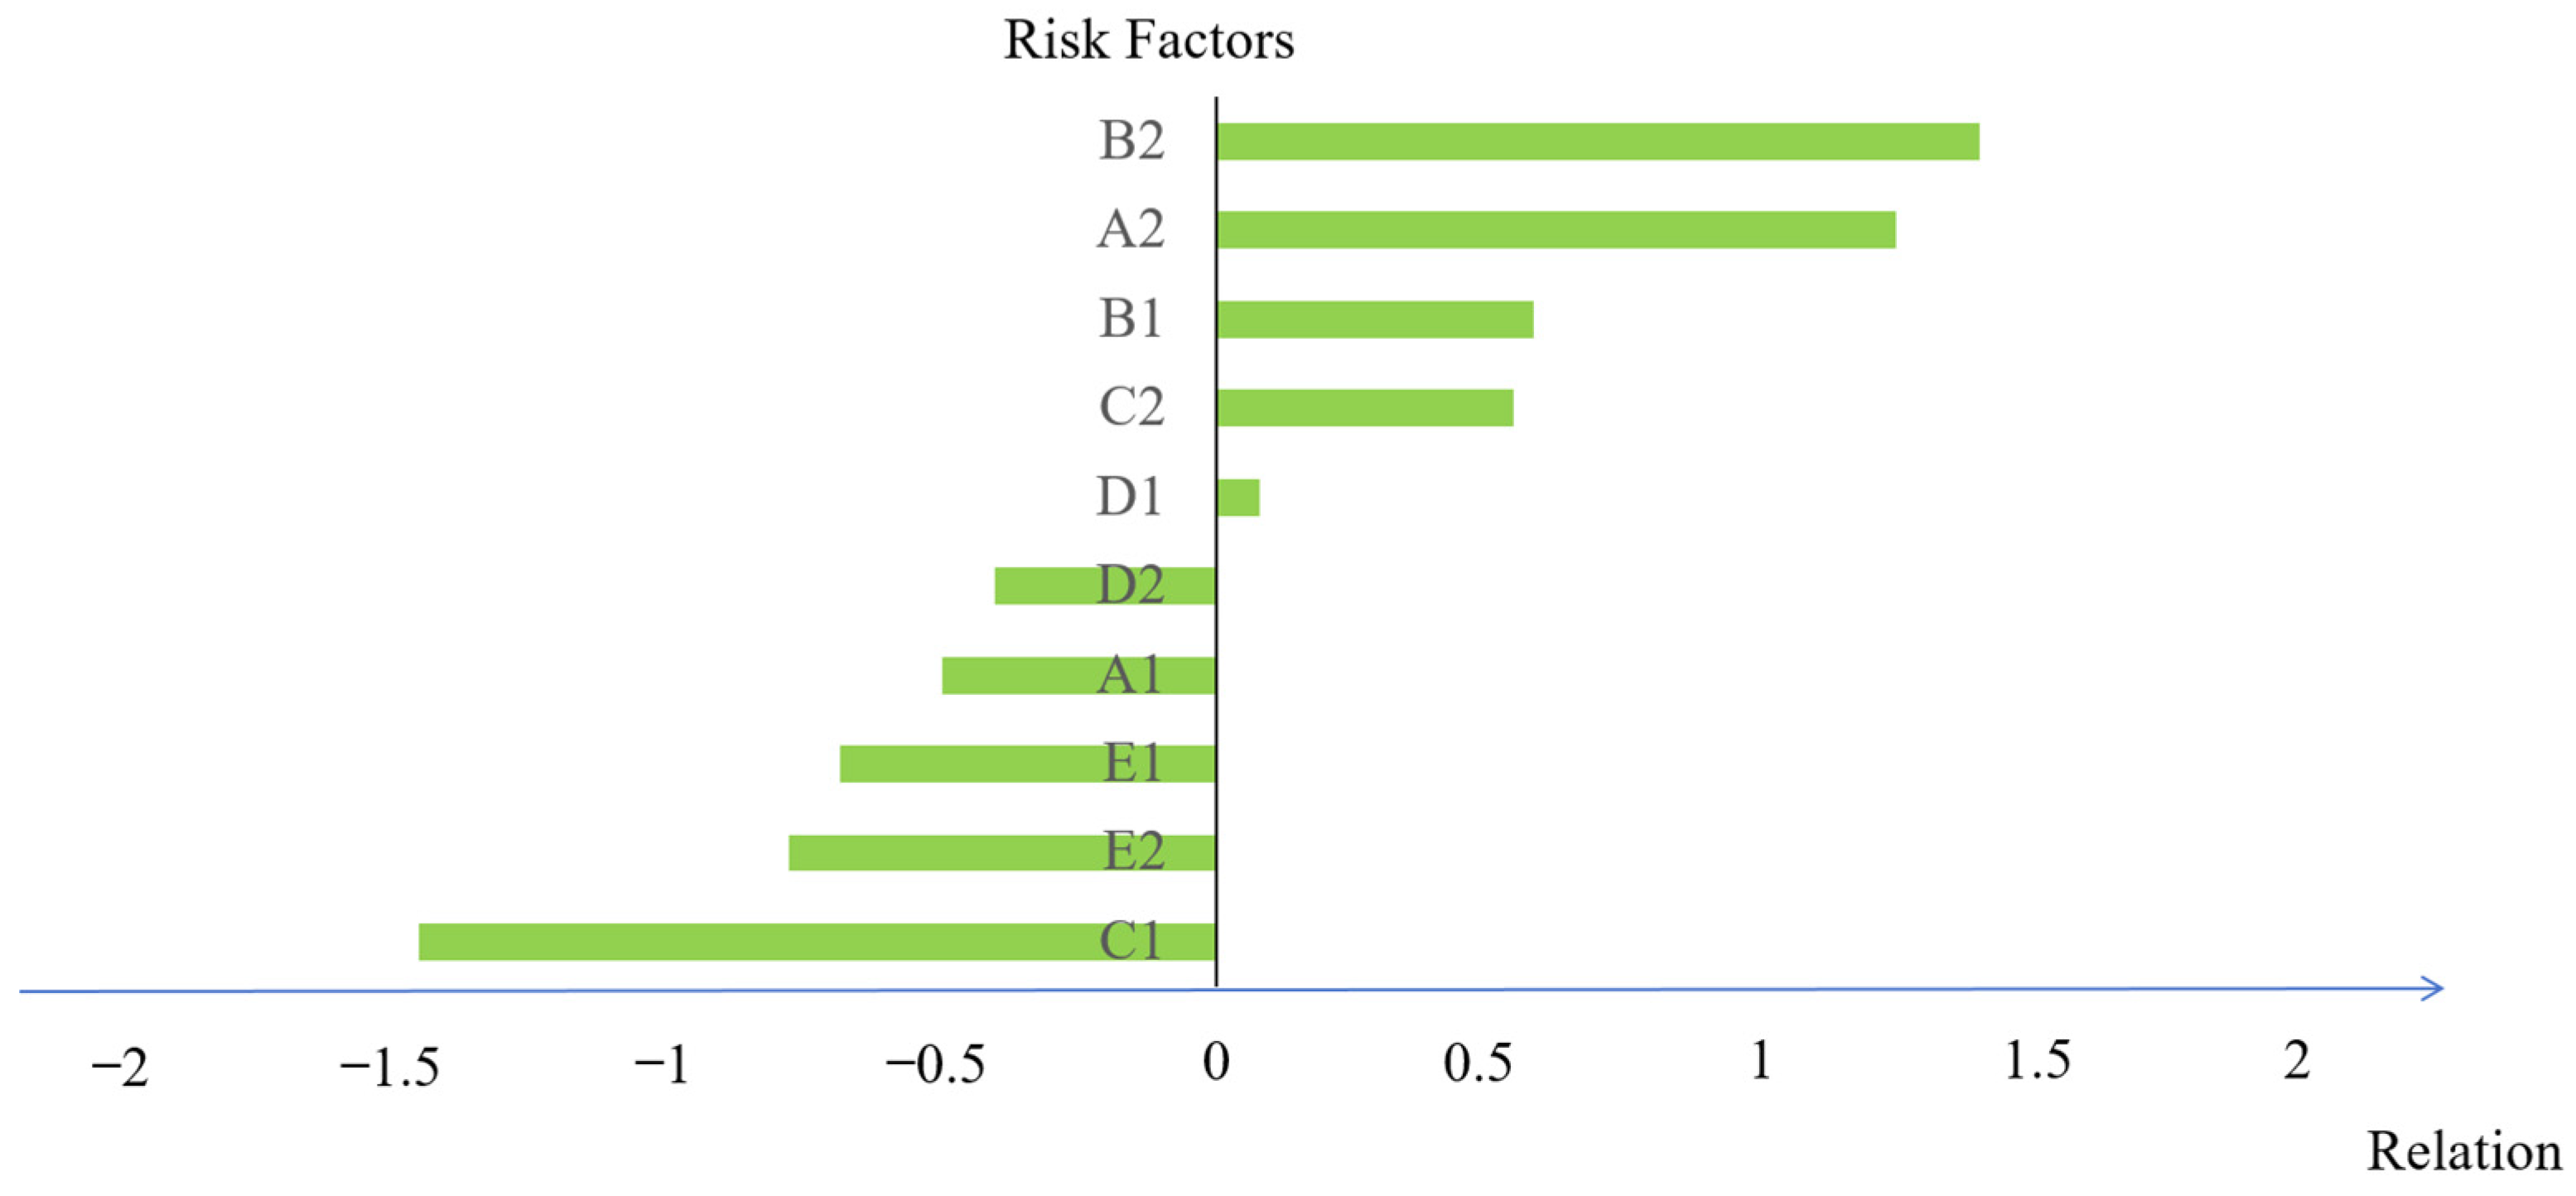
To examine structural updating under changed assessment conditions, the second-round analysis was conducted using follow-up evaluations provided by five experts from the original panel. The resulting causal relationship diagram is shown in Figure 5, based on the results in Appendix A.
Compared with the baseline assessment, the second-round results show a clear reconfiguration of causal roles. Data Management (B2) and Intangible Resources (A2) emerge as the two strongest cause-type factors, exhibiting the highest positive relation values. Technical Infrastructure (B1) and Organizational Development (C2) also show positive relation values and function as secondary driving factors. Market Environment (D1) remains slightly on the cause side, although its driving effect is relatively weak.
By contrast, Enterprise Environment (D2), Tangible Resources (A1), Supply-Chain Collaboration (E1) and Service Support (E2) show negative relation values and are classified as effect-type factors. Strategic Planning (C1) presents the strongest negative relation value, indicating that in the follow-up assessment, it functions primarily as an outcome-related factor rather than as an independent source of influence.
This causal reconfiguration suggests that the structural emphasis of risk influence shifts from preparation-oriented conditions toward implementation-oriented capabilities. In the baseline assessment, Tangible Resources (A1) and Strategic Planning (C1) acted as major driving factors. In the follow-up assessment, however, Data Management (B2) and Intangible Resources (A2) become the main sources of influence. This pattern is consistent with an implementation-oriented assessment context in which project data governance, digital competence and organizational learning become more salient. The shift may also reflect changes in available information, expert attention and assessment emphasis as the digital transformation project becomes more operationally embedded.

4.2.4. Hierarchical Restructuring (Round 2)

Building on the second-round DEMATEL results, the ISM-based hierarchical structure under the follow-up assessment is shown in Figure 6. The updated hierarchy remains organized into four layers, allowing comparison with the baseline structure shown in Figure 4.
In the follow-up assessment, Intangible Resources (A2) and Data Management (B2) jointly occupy the deepest layer of the hierarchy. This indicates that organizational digital capability and project data governance become the fundamental structural constraints in the updated risk system. Compared with Round 1, where Tangible Resources (A1) formed the deepest structural foundation, the deepest layer in Round 2 shifts toward capability- and data-related factors.
Technical Infrastructure (B1) and Organizational Development (C2) are located in the upper intermediate layer. Their positions suggest that technological connectivity and organizational adaptation serve as transmission mechanisms between deep structural constraints and operational outcomes. Market Environment (D1) and Enterprise Environment (D2) form another intermediate layer, indicating that external and internal contextual conditions mediate the effects of deeper capability and data-related constraints.
Tangible Resources (A1), Strategic Planning (C1), Supply-Chain Collaboration (E1) and Service Support (E2) appear in the surface layer. Their surface-level positions should be interpreted in structural terms. Under the follow-up assessment, these factors are more likely to reflect the effects of deeper data, capability and organizational conditions.

4.2.5. Structural Interpretation Across Assessment Rounds

In conventional DEMATEL–ISM applications, each assessment round is usually analyzed as an independent structural representation of the system [15]. When the method is applied to repeated assessments, direct comparison of independently generated structures may be difficult because observed differences can have multiple sources. They may reflect changes in project priorities, implementation tasks and risk mechanisms; they may also arise from changes in information availability, expert judgement, assessment framing or panel composition [83,84]. The observed transition from a resource- and strategy-oriented baseline structure to a capability- and data-oriented follow-up structure is therefore interpreted as a stage-sensitive structural reconfiguration under changed assessment conditions.
The proposed framework addresses this issue by incorporating historical relational patterns into the follow-up assessment. The enhancement mechanism uses the baseline structural information as a reference for updating the subsequent influence matrix. It provides a more consistent basis for comparing causal roles and hierarchical positions under heterogeneous assessment conditions. The comparison between the two rounds shows a coherent shift in structural emphasis. In the baseline assessment, Tangible Resources (A1) and Strategic Planning (C1) play central driving roles, and the Tangible Resources (A1) factor occupies the deepest hierarchical layer. In the follow-up assessment, Data Management (B2) and Intangible Resources (A2) become the strongest cause-type factors and jointly occupy the deepest layer. The consistency between the DEMATEL causal roles and the ISM hierarchical positions strengthens the interpretation that the updated structure reflects a coordinated change in the risk configuration.
At the matrix level, this interpretation is supported by the enhancement mechanism, which reinforces historically observed relational patterns while allowing current expert evaluations to reshape the updated structure. Similar logic is found in pattern recognition-based structural analysis, where relational similarities are used to support more stable interpretation of complex systems [85,86]. In this study, the unsupervised-learning layer plays a comparable role by helping identify relational patterns that support cross-round structural comparison.
From a construction digitalization perspective, the results suggest a shift from a resource- and strategy-driven baseline structure to a capability- and data-driven follow-up structure. This is consistent with the staged implementation logic of construction digital transformation: early assessments tend to emphasize resource mobilization and strategic alignment, while later assessments place greater emphasis on project data governance, digital capability and organizational embedding. The proposed framework therefore supports stage-sensitive risk governance by helping decision-makers interpret how structural priorities may change when assessment conditions and expert participation vary across rounds.

4.3. Comparative Validation and Robustness Analysis

Since the framework relies on expert-elicited influence relationships, the credibility of the results is examined through comparative and robustness analyses. First, the comparison with conventional DEMATEL–ISM examines whether the enhancement layer changes the main information contained in the current expert assessment. Second, the threshold sensitivity analysis tests whether the ISM hierarchy depends on a single binarization rule. Third, the expert-panel robustness analysis examines whether the cross-round interpretation is sensitive to panel reduction or individual expert judgement.

4.3.1. Comparison with Conventional DEMATEL–ISM

To examine the effect of the unsupervised-learning enhancement layer, the second-round expert evaluation data were also analyzed using conventional DEMATEL–ISM without incorporating historical relational patterns. The comparison is used as an ablation check. A large deviation from the conventional results would indicate possible distortion caused by the enhancement layer. A largely consistent structure would suggest that the enhancement layer supports structural updating while preserving the main information contained in the second-round assessment.
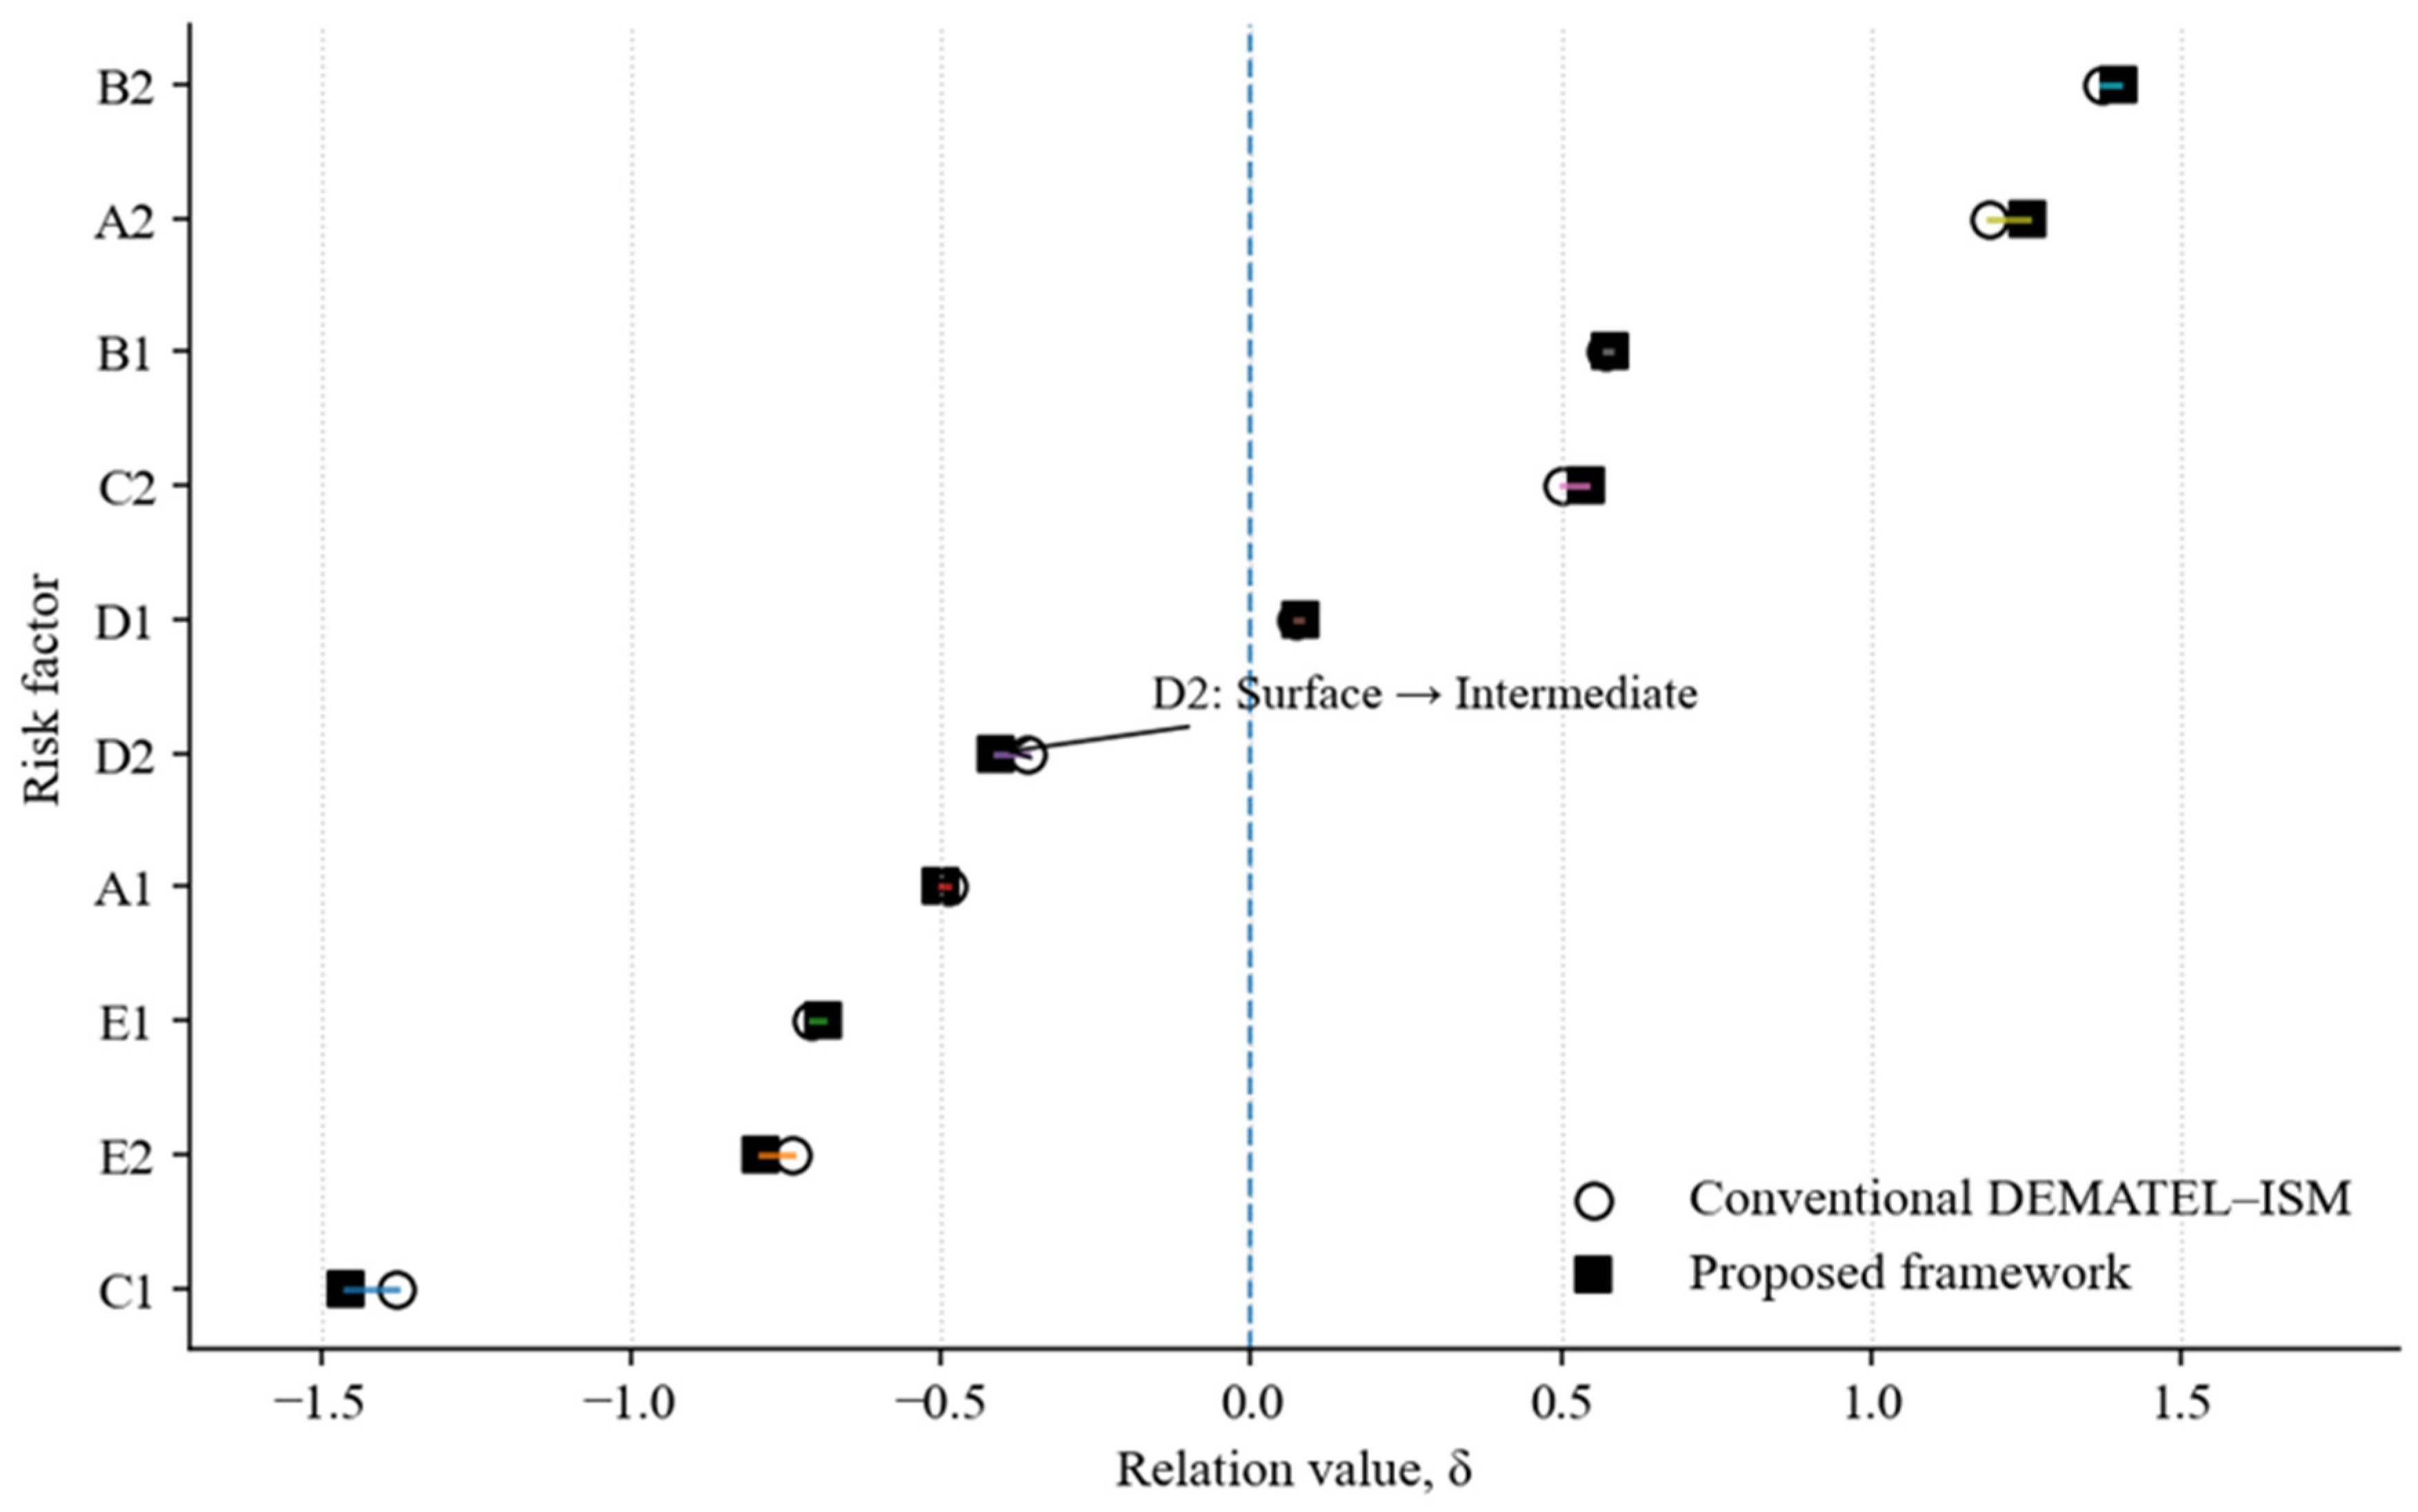
Figure 7 compares the relation values obtained from conventional DEMATEL–ISM and the proposed framework. The two sets of results are highly consistent. In both analyses, Data Management (B2) and Intangible Resources (A2) are identified as the strongest cause-type factors. Technical Infrastructure (B1) and Organizational Development (C2) remain positive cause-type factors, while Tangible Resources (A1), Strategic Planning (C1), Enterprise Environment (D2), Supply-Chain Collaboration (E1), and Service Support (E2) remain effect-type factors. Market Environment (D1) stays close to the boundary between cause-and-effect groups.
This consistency indicates that the enhancement layer does not artificially overturn the second-round expert assessment. The shift toward Data Management (B2) and Intangible Resources (A2) is already embedded in the follow-up expert evaluation and is preserved by the proposed framework. The comparison also provides a check on possible historical over-reinforcement. If the enhancement layer placed excessive weight on the baseline structure, the follow-up results would be pulled back toward the Round 1 resource- and strategy-oriented pattern. However, both the conventional and enhanced analyses identify B2 and A2 as the dominant follow-up drivers. The added value of the proposed framework therefore lies in linking the follow-up structure to the baseline structural configuration through historical relational patterns, while maintaining the main structural signal contained in the current assessment.
The main structural difference concerns Enterprise Environment (D2). Under conventional DEMATEL–ISM, D2 remains in the surface layer, whereas under the proposed framework, it moves to an intermediate hierarchical position. This adjustment does not change its effect-type causal role. It provides a more connected interpretation of how internal organizational conditions mediate between deeper data- and capability-related constraints and surface-level outcomes. The comparison suggests that the proposed framework preserves the core causal pattern of the conventional analysis while improving the continuity and interpretability of multi-round structural updating.

4.3.2. Threshold Sensitivity Analysis

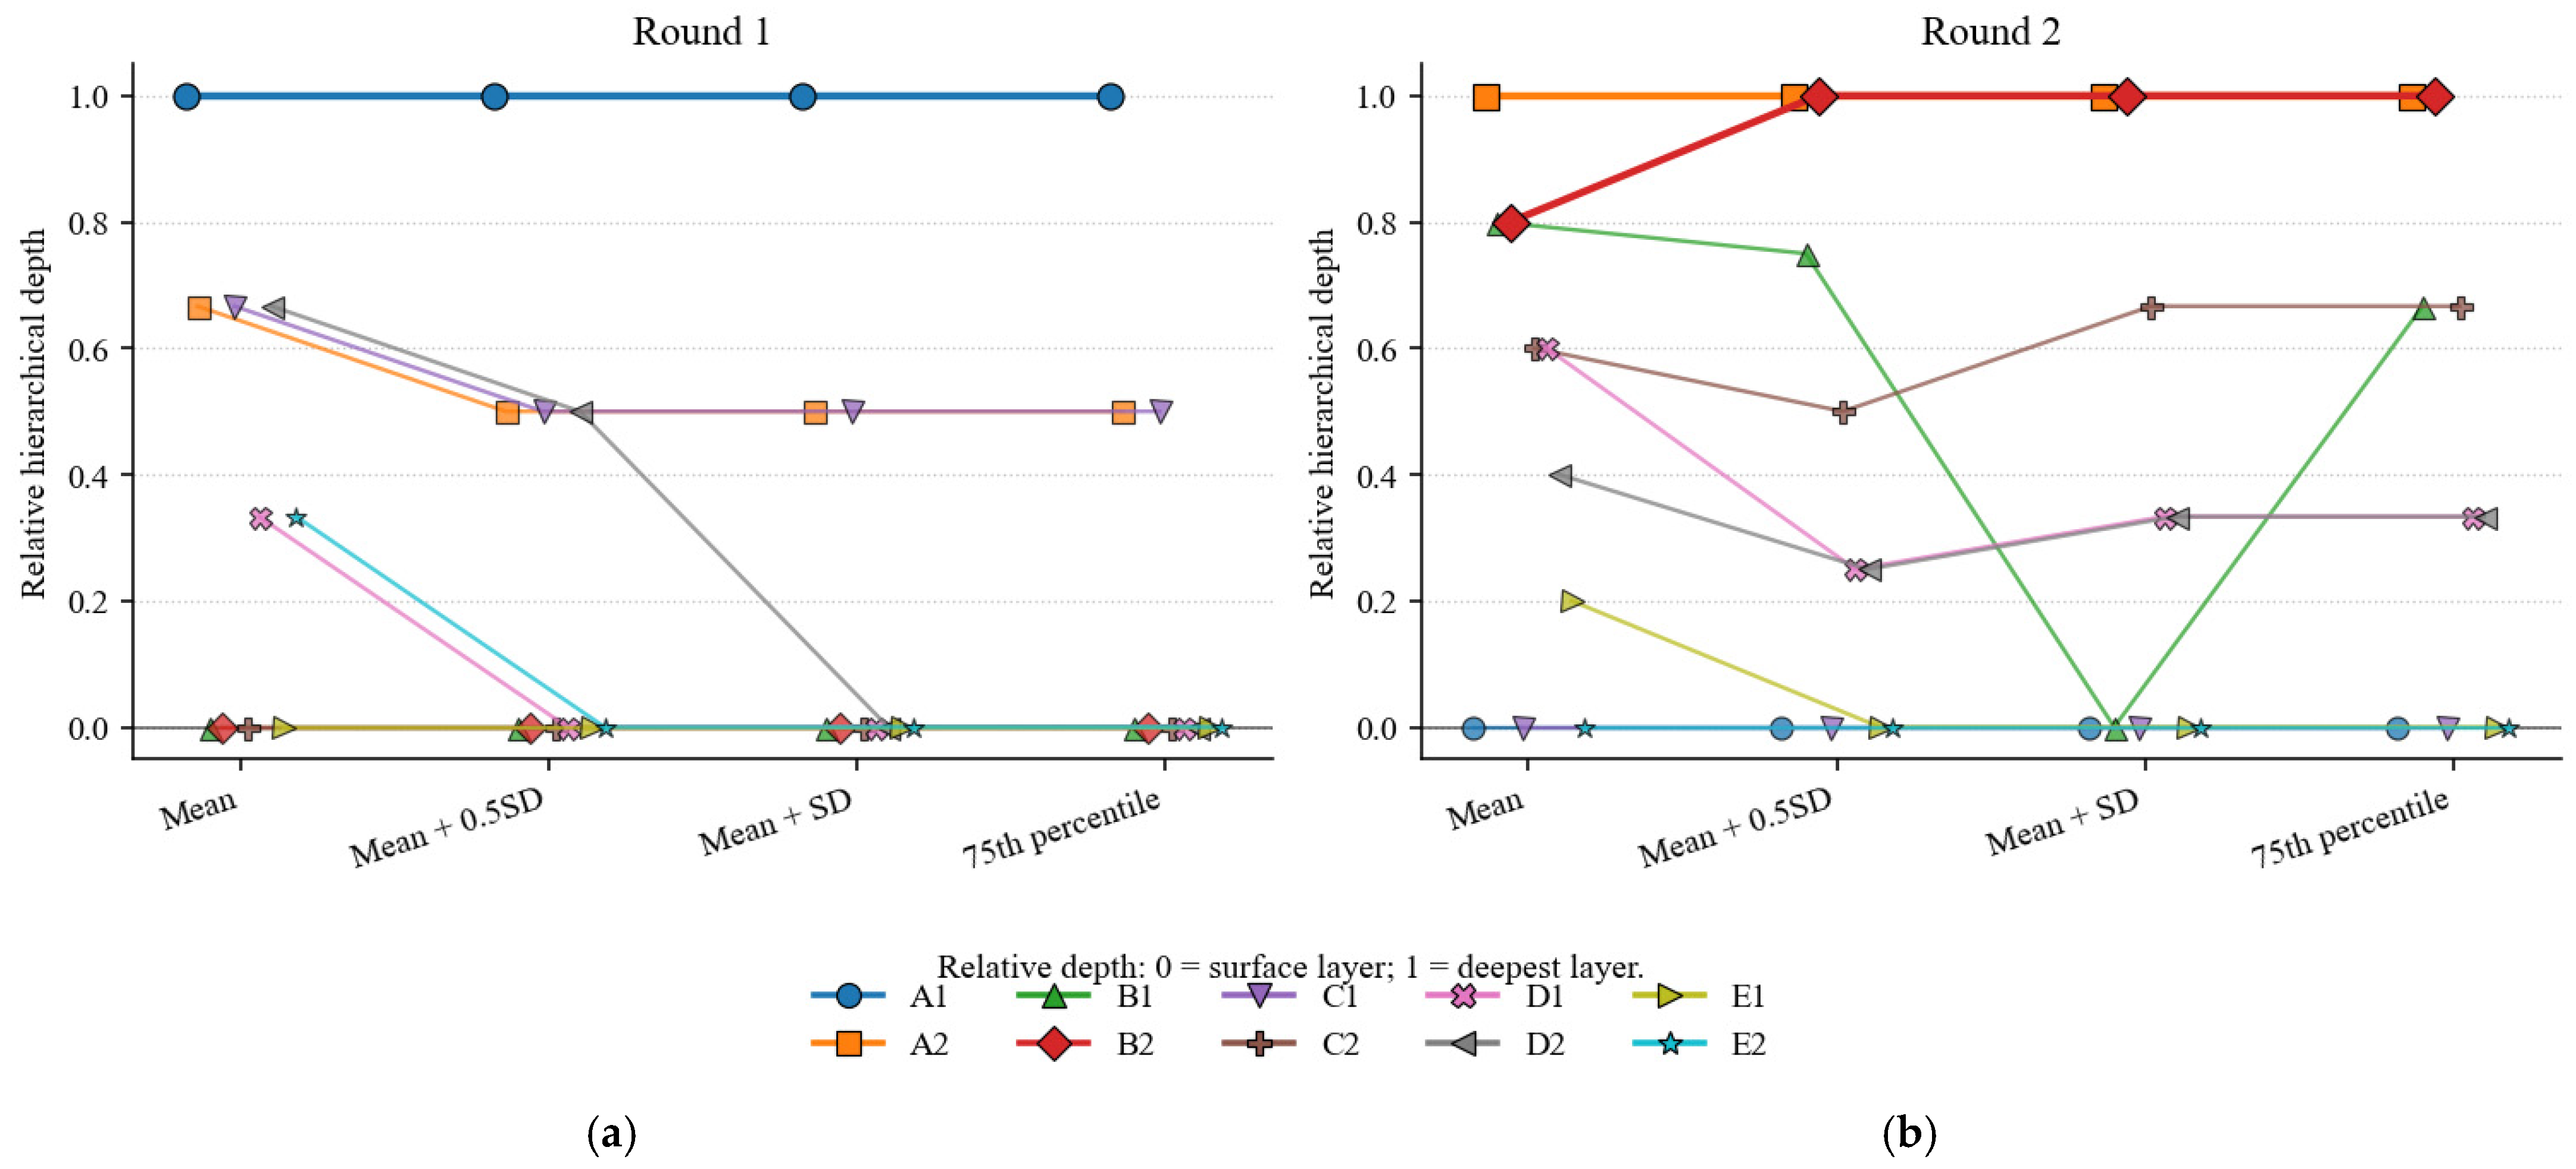
Because ISM hierarchical decomposition depends on the threshold used to binarize the overall influence matrix, a threshold sensitivity analysis was conducted to examine whether the main hierarchical findings depend on a single threshold rule. Four threshold schemes were tested: the mean threshold, the mean plus half standard deviation threshold, the mean plus standard deviation threshold used in the main analysis and the 75th percentile threshold. The thresholds were calculated from the off-diagonal elements of the overall influence matrix, so that self-reachability on the diagonal did not affect the retention of inter-factor influence relationships.
Figure 8 presents the relative hierarchical depth of each factor under the alternative threshold schemes. The vertical axis ranges from 0 to 1, where 0 denotes the surface layer and 1 denotes the deepest layer. In Round 1, the Tangible Resources (A1) factor remains at the deepest position across all threshold schemes. This indicates that the baseline structure is robustly resource-driven, even when the threshold criterion changes. In Round 2, Intangible Resources (A2) remains at the deepest position across all threshold schemes. Data Management (B2) is also located at or close to the deepest layer: it is slightly below the deepest position under the mean threshold, but it jointly occupies the deepest layer, with A2, under the remaining three threshold schemes. This supports the interpretation that the follow-up structure is primarily capability- and data-driven.
The sensitivity analysis shows that the main cross-round interpretation is not an artefact of a single binarization rule. Although some intermediate and surface-level factors move as the threshold changes, the core structural contrast remains stable: the baseline assessment is dominated by Tangible Resources (A1), whereas the follow-up assessment is dominated by Intangible Resources (A2) and Data Management (B2). This strengthens the robustness of the proposed structural interpretation.

4.3.3. Robustness Under Partial Expert-Panel Continuity

Because the follow-up assessment was conducted by five experts from the original ten-member panel, an additional robustness analysis was performed to examine whether the observed structural shift was mainly caused by the change in expert-panel composition. Two checks were conducted. First, the baseline assessment was recalculated using only the same five experts who participated in the follow-up assessment. Second, a leave-one-expert-out analysis was conducted for the follow-up assessment by removing one expert at a time and recalculating the DEMATEL–ISM results.
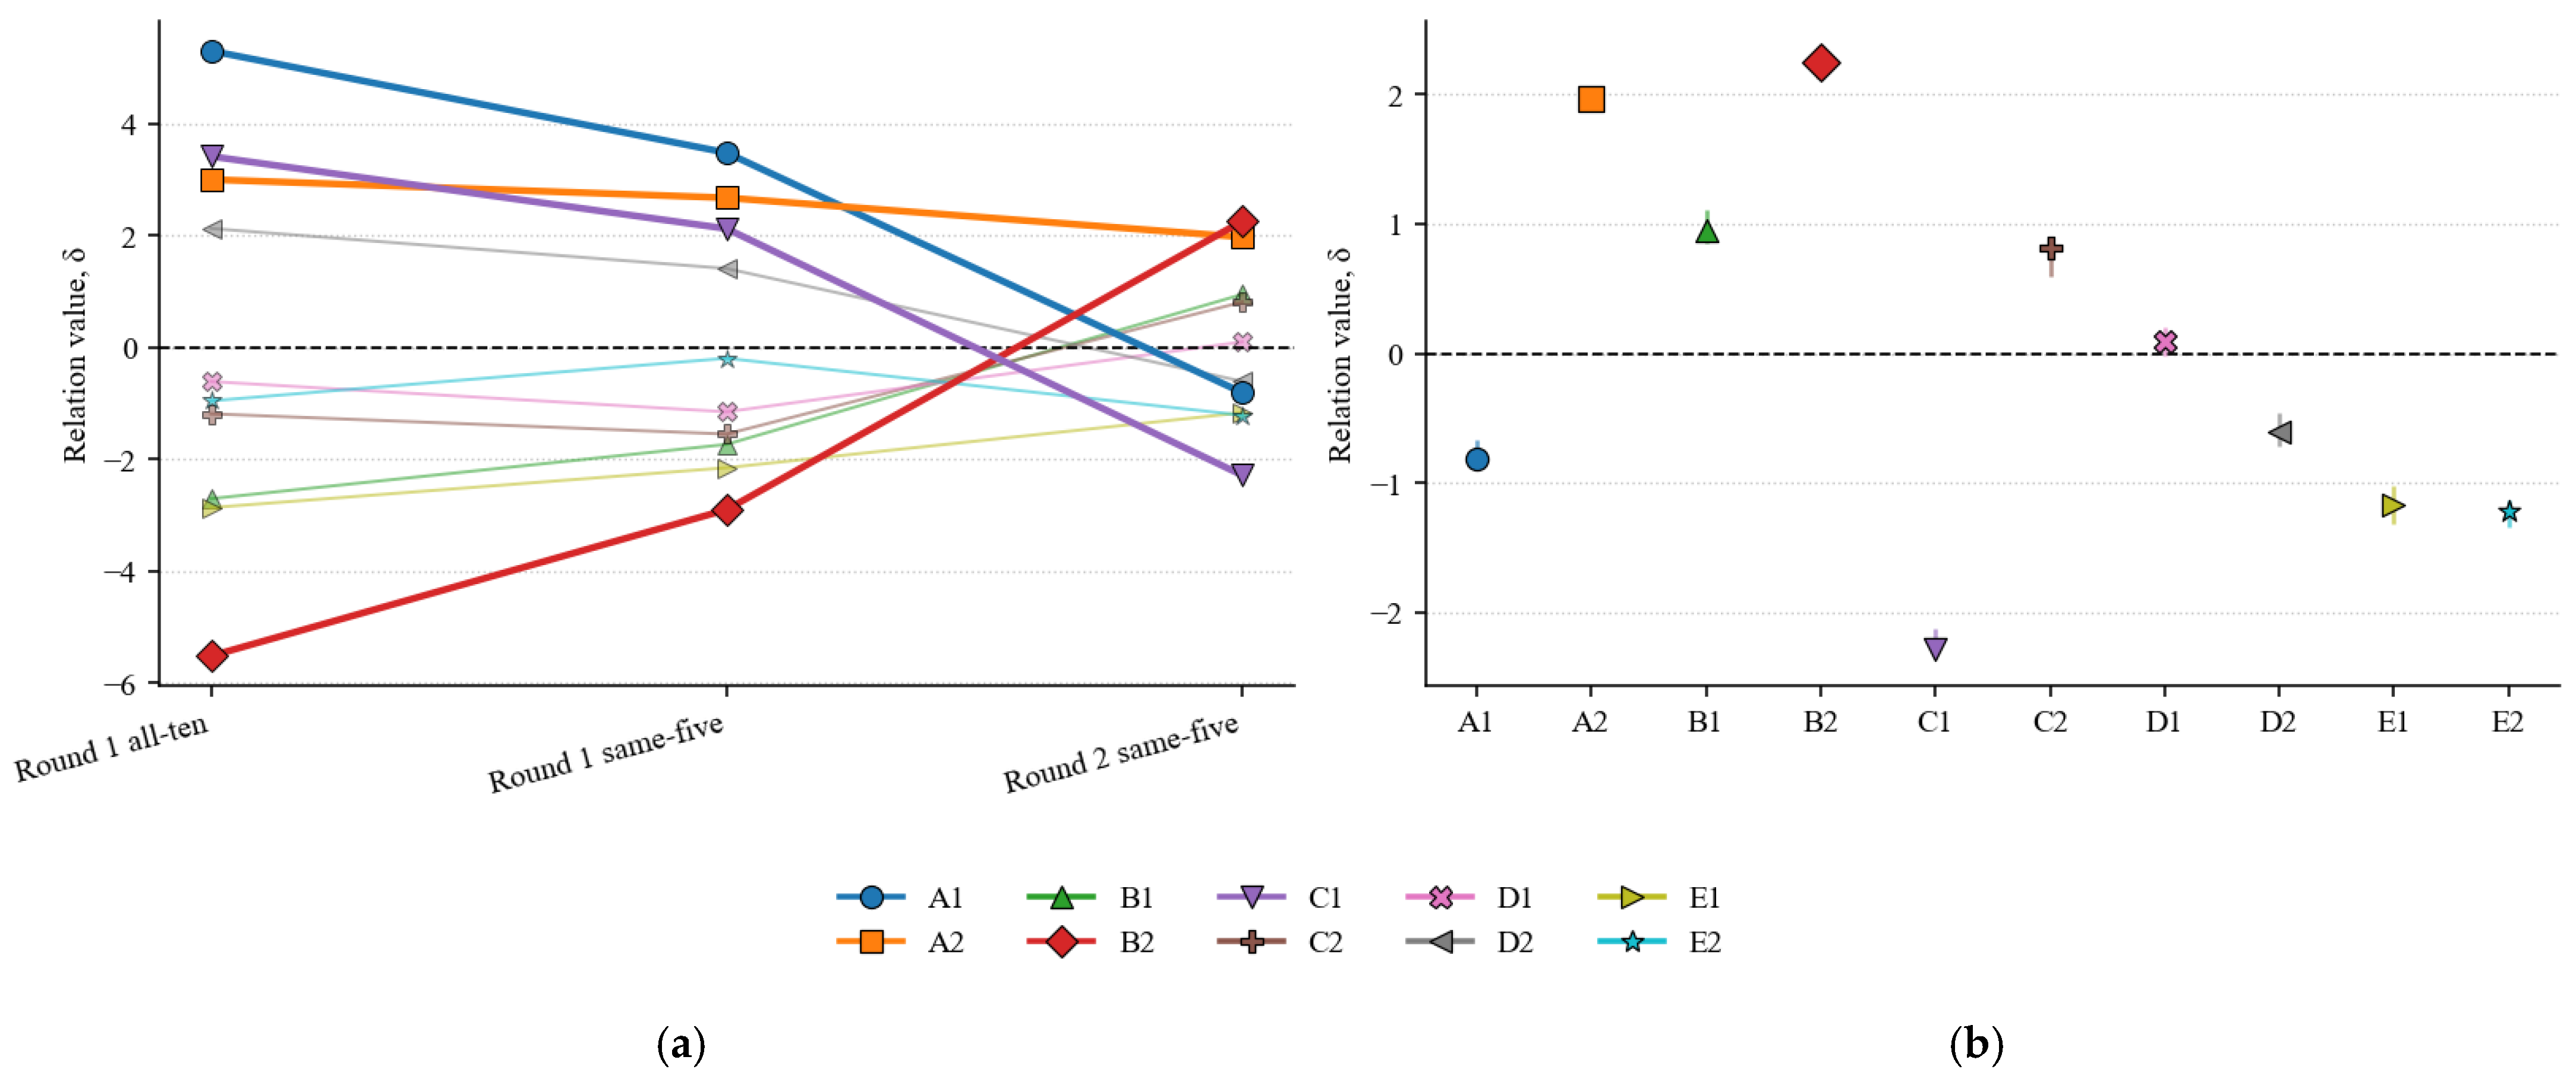
Figure 9a compares the relation values under three conditions: the original ten-expert baseline, the same-five baseline and the same-five follow-up assessment. Reducing the baseline panel from ten experts to the same five experts changes the magnitude of some relation values, but it does not reproduce the follow-up structure. In the same-five baseline, Tangible Resources (A1), Intangible Resources (A2), Strategic Planning (C1) and Enterprise Environment (D2) remain positive cause-type factors, while Data Management (B2) remains a strong effect-type factor. This pattern is still consistent with a preparation-oriented risk structure. By contrast, in the same-five follow-up assessment, Data Management (B2) becomes the strongest cause-type factor, followed by Intangible Resources (A2), Technical Infrastructure (B1) and Organizational Development (C2). Strategic Planning (C1), which is a cause-type factor in the baseline, becomes the strongest effect-type factor in the follow-up assessment.
This matched-panel comparison suggests that the observed cross-round shift cannot be explained solely by the reduction in expert-panel size. If panel reduction were the main driver, the same-five baseline would already show a structure similar to the follow-up assessment. Instead, the same-five baseline remains dominated by preparation-oriented factors, whereas the follow-up assessment shifts toward data, capability, technology and organization-related drivers. This supports the interpretation that the structural difference reflects changes in assessment conditions and risk emphasis, with expert composition playing a limited role.
Figure 9b reports the leave-one-expert-out results for the follow-up assessment. The interval for each factor represents the range of relation values obtained after removing one of the five experts. Data Management (B2) and Intangible Resources (A2) remain positive and dominant in all leave-one-expert-out runs. More importantly, both factors consistently occupy the deepest hierarchical layer after each expert is removed. This indicates that the core follow-up structure is not driven by any single expert’s judgement.
The expert-panel robustness analysis supports the credibility of the cross-round interpretation. The same-five baseline does not reproduce the follow-up structure, indicating that the shift toward Data Management (B2) and Intangible Resources (A2) is not merely a result of reducing the expert panel. The leave-one-expert-out results further show that the two core follow-up drivers remain stable after individual expert removal. These findings suggest that the updated structure is supported by a consistent expert-elicited pattern rather than by panel reduction or a single expert’s judgement.

5. Conclusions and Implications

5.1. Contributions

This study proposed an unsupervised learning-enhanced DEMATEL–ISM framework for analyzing risk structures in construction digital transformation projects. The framework keeps DEMATEL–ISM as the main tool for identifying causal roles and hierarchical relationships, and uses relational patterns from previous assessment rounds to inform subsequent modeling. This design extends DEMATEL–ISM from single-round structural diagnosis to multi-round structural updating.
The main contribution lies in how the framework handles repeated expert assessments. In project-based digital transformation settings, assessments are often conducted more than once. Project conditions change, available information changes, and expert participation may also change. Separate modeling of each round can make structural differences difficult to interpret. The proposed framework connects assessment rounds by using previously observed influence patterns as a reference for later modeling. Current expert judgement remains the primary input, while historical relational information provides continuity for cross-round comparison.
The case application shows that the framework can identify changes in causal roles and hierarchical positions while retaining the dominant information contained in the current expert evaluation. The comparative and robustness analyses further support the credibility of the main interpretation across enhancement-layer comparison, threshold sensitivity, expert-panel continuity and individual-expert removal. The framework therefore provides a defensible basis for stage-sensitive risk analysis in construction digital transformation projects.

5.2. Structural Insights

The case results show a shift in the structural logic of risk factors across the two assessment rounds. In the baseline assessment, the structure is mainly shaped by preparation-oriented conditions, especially tangible resources and strategic planning. In the follow-up assessment, the main structural constraints shift toward data management and intangible organizational resources.
The value of this finding lies in the consistency between the DEMATEL and ISM results. The shift appears in both causal roles and hierarchical positions, indicating a coordinated reorganization of the risk structure. This consistency gives more confidence that the observed change reflects a system-level structural pattern, instead of isolated numerical fluctuation. The finding should be read as a stage-sensitive structural pattern observed under changing assessment conditions, where project progression, information availability, expert attention and implementation priorities jointly shape the interpretation of risk relationships.
For construction digital transformation, the results suggest that risk governance be adjusted according to the changing structural role of risk factors. At an early stage, resource allocation and strategic planning may define the structural foundation of the risk system. As implementation progresses, data governance, digital competence, BIM experience and organizational learning may become more influential. Managerial attention should therefore follow the changing causal and hierarchical roles of risks across assessment rounds.

5.3. Practical Implications

For construction enterprises, the framework provides a practical basis for tracking how risk structures change during digital transformation. At the early stage, managers should pay close attention to resource allocation, platform investment, digital infrastructure and strategic alignment. These factors determine whether BIM systems, smart-site technologies, project data platforms and digital management tools can be deployed effectively.
At the implementation stage, attention should gradually shift toward data governance and organizational capability. This includes data standardization, data quality control, cross-platform data sharing, lifecycle data handover, BIM-based collaboration and data-driven decision-making among project teams. In BIM-enabled transformation projects, BIM managers or digital delivery coordinators can support this shift by linking model coordination with data standards, data-quality control and organizational learning mechanisms. These issues may become deep structural constraints even when funding, platforms and strategic plans are already in place.
The framework is also useful when the expert panel changes across assessment rounds. This is common in construction digital transformation projects, where early assessments may involve strategic planners and project managers, while later assessments may rely more on data managers, system operators or implementation specialists. By linking current assessments to previous structural patterns, the proposed method helps decision-makers interpret new results in relation to earlier risk configurations.

5.4. Limitations and Future Research

This study has several limitations. First, the case study is based on one construction enterprise and one digital transformation project. The case focused on internal digital platform development, data connectivity, process coordination, data governance and management-process digitalization within a construction group. Future research could apply the framework to different types of construction digital transformation projects, enterprise sizes and digitalization contexts to test its broader applicability.
Second, although the follow-up assessment involved five experts from the original panel and robustness checks were conducted, the study is not a full longitudinal design with repeated assessments from all initial experts. The current design also leaves project-stage progression, expert attention, information availability and assessment context partly intertwined. Future studies could collect multi-period expert evaluations from larger and more stable panels to examine structural updating across implementation stages. In addition, expert composition should be matched more explicitly to the dominant technological and managerial focus of the target project. For BIM-centered projects, future applications should include more BIM managers, digital delivery coordinators, model coordinators and common data environment managers; for platform-, data-governance- or smart-site-oriented projects, experts in platform operation, data governance, smart construction and enterprise management systems should be added.
Third, the analysis relies mainly on expert judgement. Future research could combine expert assessment with operational data from BIM platforms, project management systems, smart-site monitoring systems, digital delivery records, AI-powered management tools or enterprise data platforms [87]. Such data could help validate whether the structural changes identified through expert assessment are reflected in data-quality records, issue-tracking logs, model coordination records, digital handover records or project delivery outcomes, thereby improving the contextual validity and accuracy of expert-elicited structural results.
Finally, this study uses K-means clustering and PCA because they are interpretable and compatible with DEMATEL–ISM. Future research could compare alternative clustering, dimensionality-reduction, graph-learning or semi-supervised methods to examine whether different pattern-learning techniques improve structural updating and managerial interpretability. Future studies could also explore integration with fuzzy DEMATEL, ANP, Bayesian networks or system dynamics, especially when the research objective extends from structural updating to uncertainty modeling, priority derivation, probabilistic inference or dynamic simulation.

Author Contributions

Conceptualization, T.L. and J.Y.; methodology, T.L. and H.L.; software, T.L.; validation, T.L., E.S. and L.Z.; formal analysis, T.L.; investigation, T.L.; resources, L.Z.; data curation, T.L.; writing—original draft preparation, T.L.; writing—review and editing, E.S. and H.L.; visualization, T.L.; supervision, J.Y.; project administration, E.S.; funding acquisition, H.L. and J.Y. All authors have read and agreed to the published version of the manuscript.

Funding

This research received no external funding.

Data Availability Statement

Data are contained within the article.

Conflicts of Interest

Author Emil Sörqvist was employed by the company Sandholm Associates. The remaining authors declare that the research was conducted in the absence of any commercial or financial relationships that could be construed as a potential conflict of interest.

Appendix A

Table A1. Direct influence matrix (Round 1).
A1A2B1B2C1C2D1D2E1E2
A103.43.52.72.32.62.42.22.43.2
A21.902.52.42.93.332.82.83.5
B12.11.503.62.12.41.42.21.81.6
B21.61.51.801.81.91.71.621.9
C12.22.93.12.7032.52.93.23.4
C21.92.71.81.82.4032.62.11.7
D12.42.42.11.52.52.202.42.82.3
D22.42.922.33.12.92.602.62.6
E11.91.72.12.32.41.71.92.202
E21.72.52.93.121.83.12.120
Table A2. Normalised direct influence matrix (Round 1).
A1A2B1B2C1C2D1D2E1E2
A10.000.150.160.120.100.120.110.100.110.14
A20.080.000.110.110.130.150.130.130.130.16
B10.090.070.000.160.090.110.060.100.080.07
B20.070.070.080.000.080.080.080.070.090.08
C10.100.130.140.120.000.130.110.130.140.15
C20.080.120.080.080.110.000.130.120.090.08
D10.110.110.090.070.110.100.000.110.130.10
D20.110.130.090.100.140.130.120.000.120.12
E10.080.080.090.100.110.080.080.100.000.09
E20.080.110.130.140.090.080.140.090.090.00
Table A3. Total influence matrix (Round 1).
A1A2B1B2C1C2D1D2E1E2
A11.782.202.242.282.182.212.192.132.202.26
A21.892.112.232.302.232.272.252.192.252.31
B11.451.651.611.801.681.711.661.651.681.70
B21.251.441.471.441.461.481.461.421.481.49
C11.952.272.312.362.172.312.282.242.312.36
C21.571.851.841.891.851.771.881.821.851.86
D11.631.881.891.931.891.901.801.851.921.93
D21.822.112.112.182.132.152.131.972.132.17
E11.431.641.681.741.681.671.671.641.601.70
E21.611.881.921.991.881.891.931.841.891.84
Table A4. Driving power, dependence power, prominence and relation (Round 1).
FactorsDriving Power
f i
Dependence Power
e i
Prominence
ε i
Relation
δ i
A121.6816.3838.055.30
A222.0319.0341.063.00
B116.5919.2935.88−2.70
B214.3819.8934.27−5.52
C122.5719.1541.723.41
C218.1719.3637.53−1.19
D118.6319.2537.88−0.61
D220.8918.7739.662.13
E116.4519.3235.77−2.86
E218.6719.6238.29−0.96
Table A5. Normalized direct influence matrix (Round 2).
A1A2B1B2C1C2D1D2E1E2
A10.000.090.060.040.080.040.050.090.060.04
A20.120.000.100.100.120.110.100.140.100.10
B10.060.050.000.140.060.110.100.120.090.08
B20.070.080.160.000.110.110.110.110.160.10
C10.080.060.060.040.000.060.040.090.050.06
C20.100.090.060.060.120.000.140.120.100.14
D10.070.070.040.040.110.100.000.060.130.17
D20.070.060.060.060.150.060.060.000.110.12
E10.060.070.080.090.100.060.060.060.000.04
E20.050.060.060.060.060.110.100.060.040.00
Table A6. Total influence matrix (Round 2).
A1A2B1B2C1C2D1D2E1E2
A10.160.230.210.190.280.220.220.270.240.23
A20.380.250.360.330.470.390.380.450.400.41
B10.290.270.240.340.370.360.350.380.370.36
B20.340.330.420.260.460.400.400.430.460.42
C10.230.200.210.180.200.220.200.260.230.24
C20.340.320.310.290.430.270.400.400.380.43
D10.280.270.260.240.380.320.230.320.360.41
D20.270.250.260.240.400.270.280.240.340.35
E10.240.230.260.250.330.260.250.280.210.25
E20.230.230.240.220.300.290.290.270.260.22
Table A7. Driving power, dependence power, prominence and relation (Round 2).
FactorsDriving Power
f i
Dependence Power
e i
Prominence
ε i
Relation
δ i
A12.262.765.02−0.50
A23.822.586.401.25
B13.332.756.070.58
B23.922.526.451.40
C12.173.635.80−1.46
C23.553.016.560.54
D13.072.996.050.08
D22.903.306.20−0.41
E12.573.265.82−0.69
E22.543.325.86−0.79

References

  1. Yang, Y.; Zhang, S.J.; Hua, Y.Y.; Wang, H. Mapping the digital transformation of AEC industry: Content analysis of digital public policy in China. Dev. Built Environ. 2025, 21, 100621. [Google Scholar] [CrossRef] [Scilit]
  2. Verhoef, P.C.; Broekhuizen, T.; Bart, Y.; Bhattacharya, A.; Dong, J.Q.; Fabian, N.; Haenlein, M. Digital transformation: A multidisciplinary reflection and research agenda. J. Bus. Res. 2021, 122, 889–901. [Google Scholar] [CrossRef] [Scilit]
  3. Vial, G. Understanding digital transformation: A review and a research agenda. J. Strateg. Inf. Syst. 2019, 28, 118–144. [Google Scholar] [CrossRef] [Scilit]
  4. Warner, K.S.; Wäger, M. Building dynamic capabilities for digital transformation: An ongoing process of strategic renewal. Long. Range Plan. 2019, 52, 326–349. [Google Scholar] [CrossRef] [Scilit]
  5. Li, T.; You, J.X.; Aktas, E.; Dong, Y.X.; Yang, M.Y. Risk assessment for digital transformation projects in construction Enterprises: An enhanced FMEA model. Expert. Syst. Appl. 2025, 274, 126991. [Google Scholar] [CrossRef] [Scilit]
  6. Liu, H.C.; Wang, L.E.; Li, Z.W.; Hu, Y.P. Improving risk evaluation in FMEA with cloud model and hierarchical TOPSIS method. IEEE Trans. Fuzzy Syst. 2019, 27, 84–95. [Google Scholar] [CrossRef] [Scilit]
  7. Hosseini, S.; Ivanov, D.; Dolgui, A. Review of quantitative methods for supply chain resilience analysis. Transp. Res. E Logist. Transp. Rev. 2019, 125, 285–307. [Google Scholar] [CrossRef] [Scilit]
  8. Leveson, N.G. Applying systems thinking to analyze and learn from events. Saf. Sci. 2011, 49, 55–64. [Google Scholar] [CrossRef] [Scilit]
  9. Ivanov, D. Supply chain viability and the COVID-19 pandemic: A conceptual and formal generalisation of four major adaptation strategies. Int. J. Prod. Res. 2021, 59, 3535–3552. [Google Scholar] [CrossRef] [Scilit]
  10. Padovano, A.; Ivanov, D. Towards resilient and viable supply chains: A multidimensional model and empirical analysis. Int. J. Prod. Res. 2025, 63, 6252–6290. [Google Scholar] [CrossRef] [Scilit]
  11. Scholten, K.; Stevenson, M.; van Donk, D.P. Dealing with the unpredictable: Supply chain resilience. Int. J. Oper. Prod. Manag. 2019, 40, 1–10. [Google Scholar] [CrossRef] [Scilit]
  12. Meadows, D. Thinking in Systems: International Bestseller; Chelsea Green Publisher: White River Junction, VT, USA, 2008. [Google Scholar]
  13. Garg, R.K. Data to decision-making: An analysis of business analytics applications. Int. J. Commun. Netw. Inf. Secur. 2024, 16, 374–386. [Google Scholar]
  14. Flyvbjerg, B. What you should know about megaprojects and why: An overview. Proj. Manag. J. 2014, 45, 6–19. [Google Scholar] [CrossRef] [Scilit]
  15. Si, S.L.; You, X.Y.; Liu, H.C.; Zhang, P. DEMATEL technique: A systematic review of the state-of-the-art literature on methodologies and applications. Math. Probl. Eng. 2018, 2018, 3696457. [Google Scholar] [CrossRef] [Scilit]
  16. Guo, X.T.; Yang, Z.J.; Sun, J.; Zhang, Y.L. Impact pathways of emerging ITs to mitigate supply chain vulnerability: A novel DEMATEL-ISM approach based on grounded theory. Expert. Syst. Appl. 2023, 239, 122398. [Google Scholar] [CrossRef] [Scilit]
  17. Du, Y.W.; Li, X.X. Hierarchical DEMATEL method for complex systems. Expert. Syst. Appl. 2021, 167, 113871. [Google Scholar] [CrossRef] [Scilit]
  18. Yuan, H.; Du, W.B.; Ma, X.Z.; Liu, J.; Li, L.Y. Critical factors to influence the illegal dumping behavior of construction and demolition waste: An ISM-DEMATEL analysis. Dev. Built Environ. 2023, 14, 100159. [Google Scholar] [CrossRef] [Scilit]
  19. Qiao, W.; Ju, Y.; Dong, P.; Tiong, R.L.K. How to realize value creation of digital transformation? A system dynamics model. Expert Syst. Appl. 2024, 244, 122667. [Google Scholar] [CrossRef] [Scilit]
  20. Fasolo, B.; Morton, A.; Winterfeldt, D. Behavioural issues in portfolio decision analysis. In Portfolio Decision Analysis; Springer: Berlin/Heidelberg, Germany, 2011; pp. 149–165. [Google Scholar]
  21. Marozzi, M.; Bolzan, M.; Di Zio, S. Robust weighted aggregation of expert opinions in futures studies. Ann. Oper. Res. 2024, 342, 1471–1493. [Google Scholar] [CrossRef] [Scilit]
  22. Han, Y.; Du, H.Y.; Zhao, C.Y. Development of a digital transformation maturity model for the construction industry. Eng. Constr. Archit. Manag. 2025, 32, 4384–4412. [Google Scholar] [CrossRef] [Scilit]
  23. Nyqvist, R.; Peltokorpi, A.; Lavikka, R.; Ainamo, A. Building the digital age: Management of digital transformation in the construction industry. Constr. Manag. Econ. 2025, 43, 262–283. [Google Scholar] [CrossRef] [Scilit]
  24. Rui, S.; Makanae, K.; Liu, J.; Wu, J.; Fujiu, M.; Morisaki, Y. A Mixed-Method Comparative Analysis of BIM Technology Adoption in China’s and Japan’s Construction Sectors. Buildings 2025, 15, 2234. [Google Scholar] [CrossRef] [Scilit]
  25. Awe, M.; Malhi, A.; Budka, M.; Mavengere, N.; Dave, B. Towards 4D BIM: A systematic literature review on challenges, strategies and tools in leveraging AI with BIM. Buildings 2025, 15, 1072. [Google Scholar] [CrossRef] [Scilit]
  26. Pittri, H.; Godawatte, G.; Esangbedo, O.; Antwi-Afari, P.; Bao, Z. Exploring barriers to the adoption of digital technologies for circular economy practices in the construction industry in developing countries: A case of Ghana. Buildings 2025, 15, 1090. [Google Scholar] [CrossRef] [Scilit]
  27. Wang, K.; Xu, X.; Mao, P.; Deng, X.; Cao, D. Digital transformation and organizational readiness: Evidence from Chinese construction SMEs with a dynamic managerial capabilities lens. Eng. Constr. Archit. Manag. 2026, 33, 5783–5819. [Google Scholar] [CrossRef] [Scilit]
  28. Parece, S.; Resende, R.; Rato, V. BIM-based life cycle assessment: A systematic review on automation and decision-making during design. Build. Environ. 2025, 282, 113248. [Google Scholar] [CrossRef] [Scilit]
  29. Liu, Y.; Huang, H.; Gao, G.; Ke, Z.; Li, S.; Gu, M. Dataset and benchmark for as-built BIM reconstruction from real-world point cloud. Autom. Constr. 2025, 173, 106096. [Google Scholar] [CrossRef] [Scilit]
  30. Gao, R.; Yan, G.; Wang, Y.; Yan, T.; Niu, R.; Tang, C. Construction of a Real-Scene 3D Digital Campus Using a Multi-Source Data Fusion: A Case Study of Lanzhou Jiaotong University. ISPRS Int. J. Geo-Inf. 2025, 14, 19. [Google Scholar] [CrossRef] [Scilit]
  31. Alwashah, Z.; Sweis, G.J.; Abu Hajar, H.; Abu-Khader, W.; Sweis, R.J. Challenges to adopt digital construction technologies in the Jordanian construction industry. Constr. Innov. 2025, 25, 1610–1630. [Google Scholar] [CrossRef] [Scilit]
  32. Zhang, J.; Luo, H.; Xu, J. Towards fully BIM-enabled building automation and robotics: A perspective of lifecycle information flow. Comput. Ind. 2022, 135, 103570. [Google Scholar] [CrossRef] [Scilit]
  33. Wang, K.; Guo, F.; Zhang, C.; Schaefer, D. From Industry 4.0 to Construction 4.0: Barriers to the digital transformation of engineering and construction sectors. Eng. Constr. Archit. Manag. 2024, 31, 136–158. [Google Scholar] [CrossRef] [Scilit]
  34. Oesterreich, T.D.; Teuteberg, F. Understanding the implications of digitisation and automation in the context of Industry 4.0: A triangulation approach and elements of a research agenda for the construction industry. Comput. Ind. 2016, 83, 121–139. [Google Scholar] [CrossRef] [Scilit]
  35. Love, P.E.; Matthews, J.; Ika, L.A. Fast-and-frugal heuristics: An exploration into building an adaptive toolbox to assess the uncertainty of rework. Prod. Plan. Control 2025, 36, 251–266. [Google Scholar] [CrossRef] [Scilit]
  36. Kajumulo, K.; Matindana, J.; Mohamed, F. Modelling of safety performance in building construction projects using system dynamics approach in Tanzania. Safety 2024, 10, 57. [Google Scholar] [CrossRef] [Scilit]
  37. Ebrahimi, M.; Daneshvar, D.; Valmohammadi, C. Using a comprehensive DEMATEL-ISM-MICMAC and importance–performance analysis to study sustainable service quality features. J. Econ. Adm. Sci. 2025, 41, 2093–2113. [Google Scholar] [CrossRef] [Scilit]
  38. Zheng, X.; Chen, Z.W.; Wu, C.L.; Bai, J.; Huo, T.; Skitmore, M. Exploring complexity attributes and their interdependence of emergency hospital projects: A content analysis and DEMATEL-ISM research. Eng. Constr. Archit. Manag. 2025; in press. [CrossRef] [Scilit]
  39. Zhang, P.; He, Y.D.; Zhang, Y.B.; Li, R.; Wu, B. Hierarchical Analysis for Construction Risk Factors of Highway Engineering Based on DEMATEL-MMDE-ISM Method. Sustainability 2025, 18, 116. [Google Scholar] [CrossRef] [Scilit]
  40. Cheng, J.; Fan, X.J.; Tian, L.; Li, J. Uncovering the Drivers and Pathways of Carbon Emissions in Smart City: An Integrated DEMATEL–ISM–System Dynamics Approach. Buildings 2025, 16, 99. [Google Scholar] [CrossRef] [Scilit]
  41. Feng, X.; Ni, B.; Du, X.Y. A DEMATEL–ISM combined approach for analyzing influencing factors of resilience in the prefabricated building supply chain. Eng. Constr. Archit. Manag. 2025; in press. [CrossRef] [Scilit]
  42. Kitson, N.K.; Constantinou, A.C.; Guo, Z.; Liu, Y.; Chobtham, K. A survey of Bayesian Network structure learning. Artif. Intell. Rev. 2023, 56, 8721–8814. [Google Scholar] [CrossRef] [Scilit]
  43. Hui, W. Modeling social relationship strength in HR systems: A DEMATEL-ANP approach for the railway sector. Cogent Bus. Manag. 2026, 13, 2640668. [Google Scholar] [CrossRef] [Scilit]
  44. Kuzu, A.C. Application of fuzzy DEMATEL approach in maritime transportation: A risk analysis of anchor loss. Ocean Eng. 2023, 273, 113786. [Google Scholar] [CrossRef] [Scilit]
  45. Muhsen, Y.R.; Al-Hchaimi, A.A.J.; Alnoor, A.; Chew, X.; Khaw, K.W.; Božanić, D. Towards smart system architectures: A fuzzy MCDM-based evaluation of application mapping strategies. Yugosl. J. Oper. Res. 2025. [Google Scholar] [CrossRef] [Scilit]
  46. Ataee, S.; Lopes, M.; Relvas, H. Environmental comfort in urban spaces: A systematic literature review and a system dynamics analysis. Urban Clim. 2025, 60, 102340. [Google Scholar] [CrossRef] [Scilit]
  47. Li, R.; Lu, Y. Toward a resilient and smart city: Analysis on enablers for smart city resilience using an integrated DEMATEL–ISM–ANP method. Technol. Forecast. Soc. Change 2025, 215, 124081. [Google Scholar] [CrossRef] [Scilit]
  48. Shi, X.; Liu, Y.; Ma, K.; Gu, Z.; Qiao, Y.; Ni, G.; Ojum, C.; Opoku, A.; Liu, Y. Evaluation of risk factors affecting the safety of coal mine construction projects using an integrated DEMATEL-ISM approach. Eng. Constr. Archit. Manag. 2025, 32, 3432–3452. [Google Scholar] [CrossRef] [Scilit]
  49. Zhong, H.; Chen, L.; Afari, M.; Bao, Z.; Chen, K. Dynamic risk assessment of tower crane operations by integrating functional resonance analysis method and Bayesian network. Dev. Built Environ. 2025, 23, 100699. [Google Scholar] [CrossRef] [Scilit]
  50. Cooke, R. Experts in Uncertainty: Opinion and Subjective Probability in Science; Oxford University Press: Oxford, UK, 1991. [Google Scholar]
  51. Więckowski, J.; Kizielewicz, B.; Sałabun, W. Fuzzy RANCOM: A novel approach for modeling uncertainty in decision-making processes. Inform. Sci. 2025, 694, 121716. [Google Scholar] [CrossRef] [Scilit]
  52. Ikotun, A.M.; Ezugwu, A.E.; Abualigah, L.; Abuhaija, B.; Heming, J. K-means clustering algorithms: A comprehensive review, variants analysis, and advances in the era of big data. Inform. Sci. 2023, 622, 178–210. [Google Scholar] [CrossRef] [Scilit]
  53. Zhang, Z.-X.; Wang, L.; Wang, Y.-M.; Martinez, L. A novel alpha-level sets based fuzzy DEMATEL method considering experts’ hesitant information. Expert Syst. Appl. 2023, 213, 118925. [Google Scholar] [CrossRef] [Scilit]
  54. Huang, Y.; Huo, Z.; Fan, Y.L. DRA: A data reconstruction attack on vertical federated k-means clustering. Expert Syst. Appl. 2024, 250, 123807. [Google Scholar] [CrossRef] [Scilit]
  55. Ay, M.; Ozbaet, L.; Kulluk, S.; Gulmez, B.; Ozturk, G.; Ozer, S. FC-Kmeans: Fixed-centered K-means algorithm. Expert Syst. Appl. 2023, 211, 118656. [Google Scholar] [CrossRef] [Scilit]
  56. Jeon, D.; Lee, C. Grouping research proposals with funding agency requirements: A contextualized language model and constrained K-means clustering approach. Expert Syst. Appl. 2025, 259, 125242. [Google Scholar] [CrossRef] [Scilit]
  57. Yang, X.; Chen, J.F.; Gu, X.; He, R.R.; Wang, J. Sensitivity analysis of scalable data on three PCA related fault detection methods considering data window and thermal load matching strategies. Expert Syst. Appl. 2023, 234, 121024. [Google Scholar] [CrossRef] [Scilit]
  58. Jafarzadegan, M.; Safi-Esfahani, F.; Beheshti, Z. Combining hierarchical clustering approaches using the PCA method. Expert Syst. Appl. 2019, 137, 1–10. [Google Scholar] [CrossRef] [Scilit]
  59. Dai, Z.L.; Hu, L.C.; Sun, H.J. Robust generalized PCA for enhancing discriminability and recoverability. Neural Netw. 2025, 181, 106814. [Google Scholar] [CrossRef] [Scilit]
  60. Zhang, X.; Cheng, S.; Zhang, Y.F.; Wang, J.; Wang, S.Y. An attention-PCA based forecast combination approach to crude oil price. Expert Syst. Appl. 2024, 240, 122463. [Google Scholar] [CrossRef] [Scilit]
  61. Wu, Y.; Zhu, Z.Y.; Liu, F.H.; Chrysos, G.G.; Cevher, V. Extrapolation and spectral bias of neural nets with hadamard product: A polynomial net study. Adv. Neural Inf. Process. Syst. 2022, 35, 26980–26993. [Google Scholar]
  62. Kargas, A.; Gialeris, E.; Komisopoulos, F.; Lymperiou, A.; Salmon, I. Digital maturity and digital transformation strategy among Greek small and medium enterprises. Adm. Sci. 2023, 13, 236. [Google Scholar] [CrossRef] [Scilit]
  63. Liu, S.; Zhao, H.; Kong, G.W. Enterprise digital transformation, breadth of ownership and stock price volatility. Int. Rev. Financ. Anal. 2023, 89, 102713. [Google Scholar] [CrossRef] [Scilit]
  64. Oludapo, S.; Carroll, N.; Helfert, M. Why do so many digital transformations fail? A bibliometric analysis and future research agenda. J. Bus. Res. 2024, 174, 114528. [Google Scholar] [CrossRef] [Scilit]
  65. Syed, R.; Bandara, W.; Eden, R. Public sector digital transformation barriers: A developing country experience. Inform. Polity 2023, 28, 5–27. [Google Scholar] [CrossRef] [Scilit]
  66. Linderoth, H.C.; Elbanna, A.R.; Jacobsson, M. Barriers for Digital Transformation: The Role of Industry. In Proceedings of the 29th Australasian Conference on Information Systems (ACIS), Sydney, NSW, Australia, 10–13 December 2018; pp. 1–13. [Google Scholar]
  67. Zhu, F.; Yan, X. Research on influencing factors of construction enterprise digital transformation based on ISM-AHP. Constr. Econ. 2022, 43, 66–73. [Google Scholar]
  68. Sun, J.; Gong, X.; Zhang, H.; Su, X. Strategic path for high-quality development of construction industry driven by digitalization. Strateg. Stud. CAE 2021, 23, 56–63. [Google Scholar] [CrossRef] [Scilit]
  69. Pfnür, A.; Wagner, B. Transformation of the real estate and construction industry: Empirical findings from Germany. J. Bus. Econ. 2020, 90, 975–1019. [Google Scholar] [CrossRef] [Scilit]
  70. Papavasiliou, S.; Gorod, A.; Reaiche, C. System of systems engineering governance framework for digital transformation: A case study of an Australian large government agency. Syst. Eng. 2024, 27, 267–283. [Google Scholar] [CrossRef] [Scilit]
  71. Christodoulou, I.P.; Wasim, J.; Reinhardt, R.J.; Ivanov, K. The strategic role of middle managers in the formulation and implementation of digital transformation projects. Strateg. Change 2022, 31, 613–622. [Google Scholar] [CrossRef] [Scilit]
  72. Narbariya, S.; Nayeem, M.A.; Gupta, R. Does HPWS amplify employees’ change readiness for digital transformation? A study through the “work-from-anywhere” prism. Pers. Rev. 2022, 51, 1948–1966. [Google Scholar] [CrossRef] [Scilit]
  73. Saihi, A.; Ben-Daya, M.; As’ad, R. Underpinning success factors of maintenance digital transformation: A hybrid reactive Delphi approach. Int. J. Prod. Econ. 2023, 255, 108701. [Google Scholar] [CrossRef] [Scilit]
  74. Ghafoori, A.; Gupta, M.; Merhi, M.I.; Gupta, S.; Shore, A.P. Toward the role of organizational culture in data-driven digital transformation. Int. J. Prod. Econ. 2024, 271, 109205. [Google Scholar] [CrossRef] [Scilit]
  75. Barragan, K.E.; Hassan, S.S.; Meisner, K.; Bzhalava, L. Dynamics of digital change–measuring the digital transformation and its impacts on the innovation activities of SMEs. Eur. J. Innov. Manag. 2025, 28, 1625–1648. [Google Scholar] [CrossRef] [Scilit]
  76. Forcael, E.; Ferrari, I.; Opazp-Vega, A.; Pulido-Arcas, J.A. Construction 4.0: A literature review. Sustainability 2020, 12, 9755. [Google Scholar] [CrossRef] [Scilit]
  77. Bode, M.; Daneva, M.; van Sinderen, M.J. Characterising the digital transformation of IT consulting services–Results from a systematic mapping study. IET Softw. 2022, 16, 455–477. [Google Scholar] [CrossRef] [Scilit]
  78. Szalavetz, A. Digital transformation–enabling factory economy actors’ entrepreneurial integration in global value chains? Post-Communist Econ. 2020, 32, 771–792. [Google Scholar] [CrossRef] [Scilit]
  79. Li, Y.Q.; Ding, H.; Li, T. Path research on the value chain reconfiguration of manufacturing enterprises under digital transformation–a case study of B company. Front. Psychol. 2022, 13, 887391. [Google Scholar] [CrossRef] [Scilit] [PubMed]
  80. Li, T.; You, J.; Lou, S. Risk Identification for Digital Transformation in Construction Enterprises: A Hybrid Topic Modeling and Inductive Coding Framework. Buildings 2026, 16, 647. [Google Scholar] [CrossRef] [Scilit]
  81. Dangerfield, B. Systems thinking and system dynamics: A primer. In Discrete-Event Simulation and System Dynamics for Management Decision Making; Wiley Online Library: Hoboken, NJ, USA, 2014; pp. 26–51. [Google Scholar]
  82. Chen, Y.; Zhu, L.P.; Hu, Z.G.; Chen, S.; Zheng, X.Z. Risk propagation in multilayer heterogeneous network of coupled system of large engineering project. J. Manag. Eng. 2022, 38, 04022003. [Google Scholar] [CrossRef] [Scilit]
  83. Morgan, M.G. Use (and abuse) of expert elicitation in support of decision making for public policy. Proc. Natl. Acad. Sci. USA 2014, 111, 7176–7184. [Google Scholar] [CrossRef] [Scilit]
  84. Montibeller, G.; von Winterfeldt, D. Cognitive and motivational biases in decision and risk analysis. Risk Anal. 2015, 35, 1230–1251. [Google Scholar] [CrossRef] [Scilit]
  85. Zhang, L.J.; Cheng, S.X.; Chang, C.K.; Zhou, Q. A pattern-recognition-based algorithm and case study for clustering and selecting business services. IEEE Trans. Syst. Man. Cybern. A Syst. Hum. 2011, 42, 102–114. [Google Scholar] [CrossRef] [Scilit]
  86. Gámiz, M.L.; Navas-Gómez, F.; Nozal-Cañadas, R.; Raya-Miranda, R. Unsupervised and supervised learning for the reliability analysis of complex systems. Qual. Reliab. Eng. Int. 2023, 39, 2637–2658. [Google Scholar] [CrossRef] [Scilit]
  87. Wang, Z.; Gao, R.; Hu, X. AI-powered NUN-SEDFN framework for addressing sparse data challenges in geotechnical parameter prediction. Adv. Eng. Inform. 2025, 65, 103226. [Google Scholar] [CrossRef] [Scilit]
Figure 1. Methodological motivation and positioning of the proposed framework.
Buildings 16 02386 g001
Figure 2. Framework for multi-round structural updating of digital transformation risks.
Buildings 16 02386 g002
Figure 3. Causal relationship diagram of risk factors (Round 1).
Buildings 16 02386 g003
Figure 4. Hierarchical structure of risk factors in the project (Round 1).
Buildings 16 02386 g004
Figure 5. Causal relationship diagram of risk factors (Round 2).
Buildings 16 02386 g005
Figure 6. Hierarchical structure of risk factors in the project (Round 2).
Buildings 16 02386 g006
Figure 7. Comparison between conventional and the proposed DEMATEL–ISM in Round 2.
Buildings 16 02386 g007
Figure 8. Threshold sensitivity of relative hierarchical depth under alternative schemes: (a) Round 1, and (b) Round 2.
Buildings 16 02386 g008
Figure 9. Robustness analysis under partial expert-panel continuity: (a) matched-panel comparison, and (b) leave-one-expert-out intervals for Round 2 relation values.
Buildings 16 02386 g009
Table 1. Methodological positioning against alternative structural risk-analysis approaches.
ApproachMain UseMain RequirementsSuitability for This Study
Bayesian networks/dynamic Bayesian networks [42]Probabilistic risk inferenceNetwork structure, prior/conditional probabilities and sufficient elicitation or observation dataUseful for probability updating, but less direct for comparing DEMATEL–ISM causal roles and hierarchies across expert-assessment rounds
ANP-based DEMATEL hybrids [43]Interdependence-based priority weightsPairwise comparisons and supermatrix constructionUseful for priority derivation, but less focused on structural continuity between repeated assessments
Fuzzy DEMATEL/fuzzy MCDM [44,45]Uncertainty-aware expert evaluationFuzzy scales, membership functions, aggregation and defuzzification rulesUseful for handling judgement vagueness, while cross-round structural updating requires additional design
System dynamics [46]Feedback simulation over timeCausal loop diagrams, stock–flow equations and parameter calibrationUseful for dynamic simulation, but less aligned with matrix-based structural comparison under limited project data
Conventional DEMATEL–ISM [16]Causal-role and hierarchy identificationExpert pairwise influence judgementsEffective for single-round structural diagnosis; limited in linking repeated assessment rounds
Table 2. Evaluation scale for the influence of risk factors.
Degree of InfluenceLevel
0No influence
1Weak influence
2Moderate influence
3Strong influence
4Very strong influence
Table 3. Experts’ profiles.
ExpertPosition/TitleExpertiseYears of Experience
1Real estate project managerProject management and smart buildings11
2Structural design engineerDigital modeling and BIM technology9
3Design engineerLarge-scale structural design and simulation5
4University professorSeismic design and geological disaster prevention23
5Special project researcherOffshore structure design and digital management9
6Engineering inspection managerDigital monitoring and quality control of existing buildings18
7Housing and construction officialSmart city planning and project review13
8Project consultantDigital transformation strategies for construction enterprises7
9Commercial real estate directorDigital marketing and commercial project management8
10Construction researcherConstruction technology and smart construction6
Table 4. Influencing factors for the risk hierarchy analysis.
IDFactorSpecific MeaningReference
A1Tangible ResourcesFunding, equipment, software and platform resources required for BIM deployment, smart-site systems, project data infrastructure and multi-project digital integration.[62,63,64]
A2Intangible ResourcesDigital competence, experience, data-driven management capability and organizational learning accumulated across construction project teams.[64,65]
B1Technical InfrastructureCompatibility, maturity and connectivity of construction-oriented digital systems, including BIM platforms, smart-site technologies and project management systems.[66,67]
B2Data ManagementStandardization, quality control, sharing and reuse of project data across design, construction, delivery and operation stages.[68,69]
C1Strategic PlanningAlignment between enterprise-level digital transformation strategy and project-level implementation paths, investment sequencing and delivery objectives.[62,70]
C2Organizational DevelopmentAdjustment of organizational structures, project routines, digital roles, training mechanisms and performance arrangements for digital construction practices.[71,72]
D1Market EnvironmentExternal pressure from clients, competitors, policy requirements and industry digitalization trends affecting construction enterprises’ transformation decisions.[70,73]
D2Enterprise EnvironmentInternal culture, leadership support, incentive arrangements and cross-departmental coordination conditions shaping digital adoption in construction enterprises.[74,75]
E1Supply-Chain CollaborationDigital coordination and information sharing among owners, designers, contractors, subcontractors, suppliers, consultants and operators across project delivery.[76,77]
E2Service SupportAvailability and reliability of consulting, training, maintenance and technical services for platforms, smart-site systems and other construction digital tools.[78,79]
Disclaimer/Publisher’s Note: The statements, opinions and data contained in all publications are solely those of the individual author(s) and contributor(s) and not of MDPI and/or the editor(s). MDPI and/or the editor(s) disclaim responsibility for any injury to people or property resulting from any ideas, methods, instructions or products referred to in the content.