


Abstract
Non-ductile reinforced concrete frames with unconfined joints dominate the collapse hazard of the existing building stock. Their CFRP-retrofit margin at collapse demand is poorly quantified. Two one-third-scale portal sub-frames were tested under Froude similitude. Specimen 1 was bare. Specimen 2 carried a three-ply hoop CFRP jacket on columns, beams, and joints. Both received the Antakya 3141 record from the 2023 Kahramanmaraş 7.7 mainshock at design intensity 0.35 g and collapse intensity 1.0 g. Cyclic response was decomposed into flexural, shear, and slip energy. At design intensity, the retrofit cut peak roof drift by 54%, suppressed residual offset, and lowered the calibrated Park–Ang index from 0.89 to 0.32. Slip share dropped from 47% to 5%. At collapse intensity, the retrofitted frame transitioned to joint-panel debonding-controlled failure at 8% drift with 245 mm residual, and shear share rose to 64%. The dominant-half-cycle ratio ≈ 0.72 emerged as a candidate brittle-damage signature for collapse-level response. A Lam–Teng confinement check confirms that the failure migrates from the column ends to debonding fracture in the wrapped panel rather than being eliminated by the retrofit. Supplementary joint-corner anchorage is recommended for non-ductile joints at collapse demand.
1. Introduction
Reinforced concrete (RC) buildings designed before the introduction of capacity-design provisions constitute a substantial fraction of the existing stock in Türkiye and the broader regional inventory. The typical detailing combines low-strength site-mixed concrete, sparse transverse reinforcement at spacings exceeding the cross-section depth, beam–column joints without transverse confinement, and short straight-bar lap splices located within plastic hinge zones. This configuration satisfies gravity-load demand but limits inelastic deformation capacity and predisposes the structure to brittle limit states under moderate-to-strong seismic intensity. Post-event reconnaissance from successive Turkish earthquakes documents the recurring damage modes on this typology, including diagonal cracking and the crushing of beam–column joints, buckling and fracture of column longitudinal reinforcement, bond failure at lap splices, and the soft-storey collapse mechanisms [1,2,3,4,5,6,7,8].
Carbon-fiber-reinforced polymer (CFRP) jacketing has become a practical retrofit response to this stock [9,10]. Recent experimental and pseudo-static investigations have further demonstrated that the CFRP wrapping of damaged RC frames significantly improves ductility, energy dissipation, and stiffness retention, with strengthened specimens achieving displacement ductility coefficients of 3.41 compared to 3.00 for unstrengthened counterparts [11]. At the element scale, confinement raises axial strain capacity, delays cover spalling and suppresses the buckling of longitudinal reinforcement [12]. The effectiveness of FRP confinement is itself sensitive to the load level present at the time of wrapping, since axial load acting before the jacket is applied, which reduces the strength and stiffness gain subsequently available from the confinement [13]. At the joint scale, CFRP wraps and anchors the panel in shear and redistributes inelastic demand from joint cores towards beam plastic hinges [14,15]. Gergely et al. [16] and Akguzel and Pampanin [17] addressed corner anchorage and the boundary conditions of T- and L-shaped joints, where mechanical anchors complement adhesive bond. The cumulative literature is robust at the element and joint scale. Its translation to the global frame response under a recorded ground motion, however, remains under-tested.
Shake-table testing at the system level remains the most direct route to global validation, but the published evidence on non-ductile RC frames is limited. Bracci et al. [18] tested a one-third-scale three-storey bare RC frame designed for gravity loads only, documenting joint-shear cracking at design-level demand without a retrofit comparison. Quintana–Gallo et al. [19] tested a two-fifth-scale three-storey two-by-one-bay non-ductile frame with similar baseline distress, and a companion specimen was later retrofitted with glass-fiber-reinforced polymer (GFRP) laminates [20]. Garcia et al. [21] reported a full-scale CFRP and post-tensioned-strap configuration on different specimens, with reduced peak drift but no recorded ground motion. Most of these programs used a single specimen, a single intensity, or artificial motions, and none were combined an as-built and a CFRP-retrofitted nominally identical companion frame tested under the same recorded waveform.
Three gaps emerge from the published evidence. First, there is an absence of a direct as-built versus CFRP-retrofitted comparison under an identical recorded waveform on companion specimens that simultaneously combines low concrete strength, sparse transverse reinforcement, and unconfined joints. Second, the literature lacks a forensic decomposition of the cyclic response into flexural, shear, and slip energy fractions. Such a decomposition, traced cycle by cycle and at multiple intensities, has not been paired with a Park–Ang damage index calibrated against the actual loading path. Third, there is a limited treatment of how design-code capacity predictions, both Turkish and international, behave at the transition between design-level and collapse-level demand, where the joint-panel mechanism governs.
Three methodological contributions distinguish this paper from prior CFRP-retrofit studies. First, the dominant-half-cycle hysteretic-energy ratio is proposed as a candidate brittle-damage signature, calibrated to ≈ 0.72 and supported at 0.70–0.74 by three published shake-table programs [18,19,21]. This ratio measures the fraction of the total hysteretic energy released in the single largest half-cycle, so that values approaching unity indicate a brittle, concentrated energy release and values approaching the reciprocal of the number of significant cycles indicate ductile distributed dissipation. Because is the ratio of half-cycle areas, absolute scale errors in the digitized literature loops cancel out in the metric. Second, the Park–Ang index is recalibrated specimen-specifically with sensitivity analysis to = 0.13, = 57.5 mm, replacing the customary default. Third, an explicit Lam–Teng envelope check ( ≈ 16) against the observed = 11.1 quantifies the gap between predicted and realized confinement capacity. A twin-specimen shake-table program anchors these contributions experimentally. Two nominally identical one-third-scale single-storey single-bay RC frames replicate the gravity-load detailing of late-1970s Turkish residential construction. One frame is tested as-built; the companion is jacketed with continuous CFRP along columns, beams, and joint panels. Both specimens are subjected to the north–south component of the 6 February 2023 Pazarcık record (Antakya 3141 station), scaled to 0.35 g. The retrofitted frame is also tested at 1.0 g after the bare specimen developed its collapse mechanism at the lower intensity. Section 2, Section 3, Section 4, Section 5, Section 6 and Section 7 cover the experimental program, comparative response, empirical decomposition, code-versus-observed assessment, discussion, and conclusions.
2. Experimental Program
2.1. Prototype and Similitude
The prototype is a three-storey ordinary moment resisting RC frame with unreinforced masonry infill, representative of 1980s Turkish residential stock built before capacity design entered the Turkish Building Earthquake Code in 1998. Columns and beams share a 300 mm × 450 mm cross-section. Longitudinal and transverse reinforcement is scaled at 1/3 to match the specimen detailing, and all transverse reinforcement closes with 90° hooks. The four beam–column joints carry no transverse reinforcement, which is the central pre-1998 deficiency targeted by the present program. The prototype fundamental period is = 0.86 s. Figure 1 shows the prototype and the extracted scaled frame along axis B–C.
Figure 1.
Three-storey prototype RC building and the considered frame extracted along axis B–C.
The physical model is a single-bay single-storey portal extracted from the first-storey interior bay of the prototype, where axial load and first-mode shear demand peak. The reduction follows true-replica Froude similitude with artificial-mass simulation [22,23]. The geometric (length) scale , the acceleration scale , and the elastic-modulus scale are fixed at the nominal = 1/3, = 1, and = 1, where each -quantity denotes the ratio of the corresponding model property to its prototype counterpart. The supplementary mass is tuned for force-scale consistency, giving the mass-density scale = / = 3, which means that supplementary mass equal to ( − 1) times the prototype tributary load, which is added to the specimen to satisfy force equilibrium under unit acceleration scale. Under Froude similitude, time scales with the square root of the geometric scale, while acceleration remains unchanged. The frequency content and energy distribution of the original record can therefore be used directly without modification of the time axis, and the scale factors adopted in the similitude study remain satisfied. This represents the period-matched intensity transfer rather than strict-similitude time compression. The approximation holds because the first-mode response dominates the present specimen, while broadband spectral energy at periods far from the specimen fundamental period is not faithfully reproduced. Remaining scale factors follow from dimensional consistency and are tabulated in Table 1.
Table 1.
Scale factors for earthquake simulation under the artificial-mass modeling assumption.
The geometric scale realized in hardware is 0.317 along column heights (950 mm/3000 mm) and 0.310 along bay widths (1350 mm/4350 mm). Both are rounded to 1/3 for the nominal reported throughout the paper. White-noise identification before the seismic runs returned a specimen fundamental period ≈ 0.495 s, in line with the prototype value = 0.86 s. transfers within the bounds quantified in Section 6. Higher-mode and overturning effects are absent; the qualitative ordering of failure mechanisms is invariant to the upper-storey axial-load variation, as the three-storey Quintana–Gallo et al. [19] program confirms with the same R1 signature. Inferences are restricted to the storey-level mechanism.
2.2. Specimen Geometry and Reinforcement
Each specimen is a single-bay, single-storey portal sub-frame. The columns rise 950 mm from the top of the foundation to the underside of the top slab, with column centerlines 1350 mm apart, scaling from prototype dimensions = 3000 mm and = 4050 mm under the 1/3 length factor. Columns and beams have a 100 × 150 mm rectangular cross-section, scaling from the prototype 300 × 450 mm sections. The four base nodes terminate in massive RC foundation stubs, post-tensioned to the table platen through Ø50 mm anchor bolts on a rectangular pattern matching the foundation-beam footprint of 1950 × 600 × 400 mm. This anchorage eliminates base slip and rocking, so the measured drift is attributable to flexural, shear, and joint deformations rather than boundary slip. Figure 2 details the specimen geometry and the reinforcement layout at specimen scale.
Figure 2.
Specimen geometry and reinforcement layout at one-third scale: (a) top view (xz direction); (b) front view (xy direction) showing column and beam reinforcement, joint region, and foundation stubs; (c) side view (yz direction) showing beam cross-section reinforcement. Dimensions in mm.
Column longitudinal reinforcement is four Ø8 deformed bars conforming to Turkish Standard TS 708 [24], continuous from the foundation stub through the joint core into the cap beam without splices. Beam longitudinal reinforcement is two Ø8 bars at top and two Ø8 bars at the bottom, terminated inside the joint core with 90° L-bends of length 96 mm in keeping with the pre-1998 standard detail. No mechanical anchorage devices were installed. The L-bend length is at the lower end of the development range specified in modern codes (typical modern requirement 1128 to 160 mm for the Ø8 reinforcement), consistent with the deficient anchorage observed in the field reconnaissance of pre-1998 RC stock. Transverse reinforcement in columns and beams is Ø8 stirrups at 100 mm closed with 90° hooks. The reinforcement cage faithfully preserves the deficiencies in the as-built non-ductile frame, including the bare joint cores. The cap slab measures 1450 × 450 × 50 mm and carries Ø8 reinforcement at 100 mm centers in both directions on top and bottom faces. The foundation longitudinal reinforcement is Ø16 with Ø10 stirrups at 150 mm.
The inertial mass is a steel cassette of fourteen S235 plates (1.75 × 0.57 × 0.06 m each), welded into a six-tonne rigid box [23] and seated on the cap beam at the beam mid-spans through matched saddles, with the center of mass at the prototype slab level. The supplementary mass satisfies = 3 imposed by = 1 and = 1/3. White-noise identification returned = 0.495 s ( = 2.02 Hz) for Specimen 1 and 0.49 s ( = 2.05 Hz) for Specimen 2. The retrofit caused only a small change in the small-amplitude modal frequency, expected because the three-ply hoop CFRP wrap acts mainly as confinement and shear-transfer rather than flexural-stiffness upgrade. The cassette weight at the cap beam imposes the prototype-scaled gravity load on the columns. The cassette imposes ≈ 30 kN per column, equivalent to about 44% of the column axial-load capacity computed from . without longitudinal-bar contribution. The second-order () moment generated by lateral drift is therefore correctly represented at the storey-level. The gravity force equals the prototype first-storey-bay tributary weight scaled by . to specimen scale, and the drift transfers at unit ratio. The single-storey configuration omits the contribution of the upper storeys. The omitted contribution would augment the first-storey demand by a factor depending on the prototype height-to-base-shear ratio, of order 1.2–1.5 for low-rise four-storey archetypes under first-mode response, depending on the assumed first-mode shape. This omission is documented as a quantitative distortion in Section 6, and the qualitative ordering of failure mechanisms is preserved.
2.3. Test Setup
All runs were conducted on a 3 m × 3 m biaxial shake-table at the Allianz Earthquake Engineering Laboratory, mounted within a 650-tonne reinforced concrete reaction block. The test setup is shown in Figure 3. The platen accommodates payloads up to 10 tonnes within a 0–50 Hz operating bandwidth. The table delivers a stroke capacity of ±250 mm, a peak velocity close to 1 m/s, and sustains accelerations near 1 g for the specimen masses considered. Closed-loop displacement control via servo-hydraulic actuators reproduced the target waveform without retuning. An external steel L-frame, anchored to the laboratory floor independent of the shake-table platen, is positioned alongside the specimen at the cap-beam level.
Figure 3.
Shake-table test setup, front and side views.
The clearance between the frame and the specimen is sufficient to keep the L-frame out of contact with the cap beam throughout the in-plane response, so the recorded response is governed entirely by the specimen and the shake-table input. The in-plane direction is unrestrained. White-noise checks before each seismic input confirmed limited out-of-plane response and consistent roof-to-platen acceleration transfer, indicating that parasitic restraint effects on the recorded response were negligible. The same calibrated table configuration was used for every run of both specimens, so differences in measured response are attributable to the specimens rather than to input variability.
2.4. Materials
Concrete was proportioned to match the low-strength site-mixed concrete of 1960s–70s Turkish residential stock. The 28-day target = 9 MPa is at the lower bound of the historical range (9–18 MPa) [1,4], maximizing the contrast in joint-panel and lap-splice mechanisms between specimens. A total of 150 mm cube specimens was cast and tested per TS EN 12390-3 [25]. The cube specimens were cured in a standard moist room at 20 ± 2 °C and 95% relative humidity for 28 days before testing, in accordance with TS EN 12390-2 [26]. Cube strengths were converted to cylinder-equivalent = 9 MPa. The associated strain values are = 0.002, = 0.0058. Longitudinal and transverse reinforcement is Ø8 deformed bars per TS 708 [24], drawn from a single batch. Tensile testing per TS EN ISO 15630-1 [27] returned = 473 MPa, = 643 MPa, ultimate elongation 10%. The yield sits in the upper tail of older Turkish stock distributions given in Table 2.
Table 2.
Mechanical properties of the concrete and the reinforcing steel.
The CFRP fabric is MasterBrace FIB 300/50 CFS (BASF, Istanbul, Türkiye) (unidirectional, 0.166 mm nominal ply thickness). Coupon testing per TS EN ISO 527-4 [28] on installed laminate off cuts returned a mean modulus of 225 GPa and a mean tensile strength of 4700 MPa. The matched epoxy is MasterBrace SAT 4500 (BASF, Istanbul, Türkiye) per TS EN 1504-4 [29], with a manufacturer-stated compressive strength fc of 70 MPa and elastic modulus E of 2.2 GPa. The wet-laid jacket was cured under laboratory ambient conditions at 23 ± 2 °C and 50 ± 5% relative humidity for 7 days before testing, with the minimum full-cure period specified by the manufacturer for the saturant-adhesive system. Before priming, the concrete surface was prepared by mechanical grinding to expose the coarse aggregate, followed by vacuum cleaning to remove dust. Primer P 3500 (BASF, Istanbul, Türkiye) was then applied to the prepared surface. The wet saturant was applied at 1.8 kg/m2 for the first ply and 0.8 kg/m2 for subsequent plies. Table 3 summarizes the fiber-reinforced polymer (FRP) system.
Table 3.
Material properties of the CFRP-retrofitting system.
The measured concrete, reinforcing steel, and CFRP properties are reported in Table 4 together with their sample counts and coefficients of variation. Figure 4 shows the characterization tests, including the reinforcing-bar and CFRP coupon tension tests, the concrete cube compression test, and the fresh-concrete slump test.
Table 4.
Measured material properties with sample counts and coefficients of variation.
Figure 4.
Material characterization tests on reinforcing steel, concrete, and CFRP.
2.5. CFRP-Retrofit Detailing
Specimen 2 received a contact-critical CFRP jacket. Each column carried a continuous three-ply jacket from the foundation stub to the cap-beam soffit. Each beam–column joint received the same three-ply lay-up wrapped continuously around the joint core. The jacket terminated at the cap-beam soffit because the cap beam serves as the loading head that carries the inertial mass cassette and represents the slab-level continuity of the prototype rather than a free upper joint. In the multi-storey prototype, this region is continuous with the storey above, so it was treated as a boundary element rather than confined as an exposed joint. All three plies are applied with circumferential (hoop) fiber orientation, with fibers running perpendicular to the column longitudinal axis. The hoop plies confine the concrete core and intercept the joint-panel diagonal-tension field, providing both column-confinement and joint-shear contribution from the same fabric. The total nominal jacket thickness is 0.50 mm. Corner radii of 15 mm were ground at the column edges and around the joint to mitigate stress concentration at the fiber corner, which is a recognized initiator of premature debonding. Ply boundaries are lap-spliced 100 mm along column height and 80 mm around the joint perimeter. No anchorage bolts or fiber anchors were installed, and the jacket was not mechanically anchored to the foundation. This bond-only configuration was adopted deliberately to represent the surface-bonded retrofit most commonly applied in the Turkish market, where mechanical anchorage is rarely used in practice. Testing this configuration was intended to reveal the performance limit of the unanchored retrofit, and the joint-panel debonding observed at collapse intensity is the direct consequence of this choice, motivating the supplementary corner anchorage recommended in Section 6.
Figure 5 documents the six-step CFRP application procedure used on Specimen 2 (surface preparation, primer, three plies, cure). The continuous hoop wrap is the standard column-confinement configuration; the fibers crossing the joint-panel diagonal-tension field at 45° provide both column-confinement and joint-shear contribution from the same plies. Figure 5 documents the circumferential fiber direction and the multi-ply continuous wrap at six application stages. Beam-to-column moment transfer follows a defined load path. Beam top tension is anchored by the L-bend hooks (Section 2.2), supplemented by horizontal shear transfer through the hoop CFRP plies across the joint diagonal. Column-end confinement and shear use all three plies. Failure of any component (hook anchorage, hoop CFRP fiber rupture across the joint diagonal, or column confinement) limits the moment-transfer capacity. The combination of the L-bend hook anchorage and the hoop CFRP plies is therefore the most likely fused at collapse-level demand. Bond-critical failure under the maximum-considered intensity is anticipated. Bar-mounted strain gauges and post-run crack-map inspection record the onset. Section 3.3 reports which component governed during the 1.0 g run. Figure 6 documents the wet-laid CFRP jacket on Specimen 2 prior to testing, including a close-up of the joint-corner radius and the lap-splice detail.
Figure 5.
CFRP-retrofit application procedure for Specimen 2.
Figure 6.
CFRP-wrapped specimen prior to testing. (a) Full view of column wrapping, (b) close-up of joint-corner radius and lap-splice detail.
2.6. Ground Motion and Test Protocol
The input motion is the north–south component of the Disaster and Emergency Management Authority (AFAD) Antakya 3141 record from the 6 February 2023 Pazarcık mainshock ( 7.7), which ruptured the East Anatolian Fault system [30]. The station also recorded the 7.6 Elbistan aftershock 9 h later. Only the Pazarcık trace is used here, because its near-fault forward-directivity pulse drives the prototype-period demand and reproduces the failure mechanism of interest. The Elbistan trace lies outside the scope of the present paper. PGA at the urban-collapse-zone station was close to 1.0 g. Spectral content concentrates in the 0.4 to 1.2 s period range, which overlaps the first-mode periods of the low-rise non-ductile RC stock targeted in this study. The Antakya 3141 record was applied to the specimen with its frequency content and energy distribution preserved as in the prototype, consistent with the Froude similitude established in Section 2.1, without modification of the time axis. The spectral ordinates over the period range of interest therefore coincide with those experienced by the prototype. Figure 7 shows the recorded acceleration time-history at full intensity. The 5–damped elastic response spectrum is overlaid with the TBDY [31] DD-2 (475-year return-period design earthquake) spectra at 2.5, 5, and 10% damping. DD-2 corresponds to a 475-year return-period earthquake with a 10% probability of exceedance in 50 years.
Figure 7.
Antakya 3141 ground motion. (a) Acceleration time-history at full intensity, (b) 5–damped elastic response spectrum overlaid with TBEC DD-2 design spectra at 2.5, 5, and 10% damping.
Two intensity levels were targeted. The 0.35 g level represents the design-level demand for the prototype; the unscaled 1.0 g level reaches the collapse-level demand. The two levels were obtained differently and are not multiples of one another. The 0.35 g design level was reached by linearly scaling the record amplitude to the DD-2 design peak ground acceleration of the prototype site, whereas the 1.0 g collapse level is the unscaled amplitude of the as-recorded Antakya 3141 motion, whose station peak ground acceleration was close to 1.0 g. Figure 7a shows this as-recorded full-intensity trace. The collapse intensity is therefore the actual recorded value rather than a fixed multiple of the design level. Specimen 1, the bare frame, was tested only at 0.35 g because it had developed a soft-storey collapse mechanism at that intensity. Specimen 2, the CFRP-retrofitted frame, was tested first at 0.35 g and subsequently at the unscaled record near 1.0 g. Between the two runs, Specimen 2 was visually inspected, photographed, and re-identified by white-noise excitation. No fiber rupture was observed on the jacket, and the residual roof drift was bounded by 1.5 mm. The 1.0 g response reported in Section 3.3 therefore reflects a previously damaged retrofitted frame rather than a pristine specimen. Demand is reported in terms of PGA and in terms of spectral acceleration at the specimen fundamental period, with (, 5%), in line with performance-based assessment.
2.7. Instrumentation and Data Processing
The instrumentation resolves global response and local damage simultaneously. Each specimen carried four tri-axial accelerometers (platen 688 for input, foundation 7603 for transfer-function fidelity, beam-end 1111/1117 for response asymmetry), one slab-level linear variable differential transformer (LVDT) for absolute roof displacement, and bonded strain gauges. The full channel inventory is given in Figure 8.
Figure 8.
Instrumentation topology of the test specimens.
Each specimen carried twelve strain gauges, with three pairs per column on diametrically opposite longitudinal bars. All gauges were bonded directly on longitudinal bars and oriented along the bar axis. In Specimen 2, they were applied prior to wet lay-up to avoid interface disturbance. All channels were acquired synchronously at 1 kHz on a National Instruments PXIe data-acquisition chassis. Zero-phase fifth-order Butterworth low-pass filtering at 25 Hz was applied in post-processing to remove acquisition noise and high-frequency artifacts unrelated to the structural response. After filtering, LVDT streams were down-sampled to 200 Hz, strain channels to 500 Hz, and acceleration channels were retained at 1 kHz for input verification. The 25 Hz cut-off lies above the second translational mode of the specimens and below the high-frequency content unrelated to structural deformation.
Local curvature at column hinges was reconstructed from longitudinal strain pairs. The curvature φ at section z is
with and representing the tensile and compressive strains and representing the center-to-center distance between the gauged bar pair. Raw strain channels were processed with the same low-pass filter applied to the rest of the channel set. The dominant uncertainty in is set by the gauge calibration tolerance (±2%) and the geometric placement tolerance of (±1 mm); the resulting band on the curvature ductility profiles in Section 4.3 is approximately ±4%.
After each run, channel quality was assessed by zero-baseline drift, signal-to-noise ratio, and gauge integrity. Gauges with bond loss, over-range, or drift > ±100 were flagged and excluded. The pre-run white-noise excitation described in Section 3.1 doubled as a sensor-response check, and channels not responding to within 5% of the expected gain were flagged before each seismic input. Nine of ten strain channels remained valid throughout the 1.0 g run. Platen and foundation accelerometers showed no loss. A joint-region strain channel of Specimen 2 reached the gauge limit during the 1.0 g excursion and was used up to the failure-onset cycle only.
3. Experimental Findings
3.1. Dynamic Identification Before and After Each Run
Each specimen was characterized by white-noise excitation before the seismic runs and after every earthquake input. The base motion was a 60 s band-limited white-noise signal at 0.05 g root-mean-square (RMS) with content between 1 and 50 Hz. The transfer function from the platen accelerometer to the beam-end accelerometers was estimated by the Welch averaged periodogram with a Hanning window. The fundamental translational frequency was extracted as the peak of the response-side magnitude spectrum, and the equivalent viscous damping ratio was estimated from the half-power bandwidth of the same peak.
Pre-test identification of Specimen 1 returned a fundamental frequency = 2.02 Hz, equivalent to a fundamental period = 0.495 s. Specimen 2 in the undamaged retrofitted state returned f1 between 1.92 Hz and 2.16 Hz on the two beam-end channels, with a mean = 2.05 Hz and = 0.49 s. The identified periods coincide with the prototype period = 0.86 s, so (, 5%) is directly comparable between specimen and prototype.
After the 1.0 g run on Specimen 2, the white-noise re-identification returned = 1.64 Hz on both beam-end channels, equivalent to = 0.61 s. The corresponding period lengthening is ≈24%, consistent with major joint-panel distress and the loss of effective lateral stiffness. The transfer-function magnitude flattens into a broad low-amplitude plateau without a sharp dominant peak, which is the signature of a system that no longer oscillates about a stable equilibrium. After the 0.35 g run, Specimen 1 had developed a soft-storey collapse mechanism, so post-run identification was not pursued. Specimen 2 retained its first-mode peak. The resonance bandwidth broadened modestly, in line with the limited damage reported in Section 3.2.
3.2. Response at 0.35 g, Bare Versus CFRP
Under the 0.35 g excitation, Specimen 1 reached a peak roof displacement of 53.1 mm, equivalent to a peak drift of 0.055 rad (5.5%), and did not recenter at the end of the record. The residual roof displacement was 23 mm, equivalent to a residual drift of 0.024 rad. Specimen 2, retrofitted with continuous CFRP, limited the peak roof displacement to 24.3 mm, equivalent to 0.0266 rad, and returned to within 1.5 mm of the origin by the end of the record. Peak displacement therefore decreased by 54% and residual displacement was effectively eliminated. Figure 9 plots the displacement time-histories of both specimens.
Figure 9.
Roof displacement time-histories at 0.35 g. (a) Specimen 1 (bare); (b) Specimen 2 (CFRP).
Figure 10 plots platen and roof accelerations. Platen records are near-identical, confirming the same input on both specimens. The bare-frame roof shows scattered irregular peaks consistent with progressive degradation; the CFRP-frame roof shows smaller, faster-decaying peaks. Peak roof acceleration is 0.88 g on Specimen 1 and 0.72 g on Specimen 2 under the same 0.35 g table input. This is counter-intuitive but explained by the preserved stiffness. Specimen 2 retains its initial period and converts design-level spectral demand into higher base shear without softening.
Figure 10.
Base and roof acceleration histories at 0.35 g, illustrating input equivalence and reduced roof response in the CFRP frame.
Figure 11 makes the contrast explicit. Specimen 1 saturates at ≈18.2 kN by 1.5% drift, and traces pinched loops to peak drift, with negative excursions of 15–18 kN at 3–4% drift. Loops collapse and the centroid shifts 1–2% drift, matching the LVDT residual. Specimen 2 climbs the backbone from 12.5 kN at 0.5% drift to 51.3 kN at 2.5%, with limited pinching and traces centered at zero drift. The Spec 2/Spec 1 strength ratio grows from 0.75 at 0.5% drift (bare in pre-cracking) to 2.82 at 2.5% (bare lost reloading branch).
Figure 11.
Base shear versus storey drift at 0.35 g. (a) Bare frame with pinched loops and residual offset; (b) CFRP frame with narrow stable loops.
Translating the visual divergence of Figure 10 into a single scalar, the secant stiffness Ksec is defined as the chord stiffness from the origin to the current point on the backbone:
Here, is the base shear and is the storey drift. At = 1% drift, = 1814 kN/rad on Specimen 1 and 2230 kN/rad on Specimen 2 (stiffness ratio 1.23). By = 2.5%, the bare frame has lost 78% of its 0.5–drift secant value ( = 727 kN/rad), while the CFRP frame retains 92% ( = 2052 kN/rad). Table 5 collates the full set of comparative response quantities for both specimens at 0.35 g. Values incorporate frequency, damping, energy, and stiffness-degradation metrics.
Table 5.
Comparative summary of response quantities for Specimen 1 (bare) and Specimen 2 (CFRP) under the 0.35 g input.
Energy dissipation in the same drift band tells the same story. Equivalent viscous damping was computed cycle by cycle from the loop area, and separated the specimens further. Specimen 1 returns = 10.8–19.4%, peaking in the 1.5–2.5% drift band where pinching and slip dominate. Specimen 2 returns = 3.7–5.1% across the same bands, reflecting narrow stable loops. The high bare-frame damping is energy lost to slip and joint-shear cracking rather than ductile-flexural cycling, consistent with brittle failure modes in earlier non-ductile shake-table programs.
These macroscopic indicators trace back to local fiber behavior. Strain-gauge readings at column mid-height of Specimen 1 recorded the onset of longitudinal-reinforcement yielding at a roof displacement near 18 mm (drift 1.9%). Beyond this point, the strain readings exceeded three times the yield strain before the peak displacement was reached. Beam mid-span strains stayed below the yield threshold, confirming inelastic action concentrated at column ends and within the joint region. Visual inspection after the 0.35 g run revealed three damaged features. Diagonal cracking crossed both joint panels, with widths up to 2 mm. Horizontal cracks formed at the column-joint interface, indicating bond deterioration. Cover concrete spalled at the inner column faces adjacent to the joint. Specimen 2 strain gauges approached but did not clearly exceed the yield strain during the peak displacement cycle. The maximum recorded strain in the column longitudinal bars was ≈0.95 on the left and 0.88 on the right. Beam mid-span strains were well below yield. Because the CFRP jacket covered the concrete surface, direct visual assessment of cracking in the joint region was not possible. No audible cracking events were detected during the test, no bulging or discolouration of the jacket surface was observed, and the post-test impact-acoustic survey did not reveal delamination or debonding at any location.
3.3. Failure Mechanism of CFRP Frame at 1.0 g
Specimen 2 entered the 1.0 g run with limited damage history accumulated during the 0.35 g excitation. At that earlier intensity, it had developed a peak drift of 0.0266 rad and a peak base shear of 51.3 kN. Visual inspection between the two runs found no fiber rupture or jacket discoloration, and the residual displacement was bounded by 1.5 mm. The unscaled Antakya 3141 record probes the remaining capacity of a near-intact retrofitted system at an intensity well above the design. The 1.0 g response is not that of a pristine specimen and should be read with this caveat.
Figure 12 shows the Specimen 2 roof displacement under 1.0 g, with a 4% inter-storey drift line representing the collapse-prevention limit. The drift crosses the 4% line and peaks near 8% during the dominant inelastic excursion. Lateral stiffness and recentering capacity are then lost; under sustained gravity the trace drifts further and settles at a displaced equilibrium near 245 mm, well beyond CP (collapse-prevention) limits. The plateau is not a kinematic artifact of the cassette (rigid lumped inertia, Section 2.2) but a structural-collapse plateau reached after rupture of the joint-panel CFRP plies.
Figure 12.
Roof displacement time-history of Specimen 2 under the 1.0 g input, with the 4% collapse-prevention drift line superimposed.
Figure 13 plots accelerations under 1.0 g. Platen records in the two horizontal directions are near-identical (consistent input). Roof shows brief amplification and bandwidth widening at stiffness loss, then settles into low-amplitude high-frequency fluctuations on a static offset, consistent with a dominant damage mechanism.
Figure 13.
Acceleration time-histories at multiple locations on the CFRP-retrofitted specimen under the 1.0 g input.
Post-1.0 g visual inspection confirms a joint-shear/CFRP-rupture limit state. Figure 14 shows the Specimen 2 joint region after the 1.0 g excitation, with diagonal debonding initiated across the joint-panel and localized fiber fracture in the unsupported strip at the joint corners. The columns and beam outside the joint zone show limited damage compared with the joint region. The retrofit suppresses the column-hinge response observed in Specimen 1 and shifts the failure to a localized joint-panel mechanism, with the CFRP bond line and joint termination zones becoming the governing fuse at collapse-level demand.
Figure 14.
Specimen 2 after the 1.0 g excitation, with damage localization in the joint region and diagonal debonding and localized fiber fracture of the CFRP sheets across the panel zone.
The post-1.0 g deformation pattern is shown in Figure 15. The displaced configuration was reconstructed from the slab LVDT, horizontal integrations of the four tri-axial accelerometers, and post-test photogrammetry of synchronized video frames. Column bases retain nominal fixity without uplifting or rocking. The beam span remains nearly straight, and the largest inter-storey drift concentrates within the joint-panel where the CFRP sheets ruptured. The pattern, with the visual record in Figure 15, supports a joint-shear-dominated mechanism, with the residual offset localized in the joint rather than from distributed flexural hinging.
Figure 15.
Global deformation pattern of Specimen 2 after the 1.0 g run, reconstructed from LVDT measurements.
4. Empirical Analysis
4.1. Hysteretic Decomposition and Energy Dissipation
Hysteretic decomposition splits the cyclic energy of each specimen into three additive components. Flexural energy is generated by rotation at the column-end and beam-end plastic hinges. Shear energy follows from diagonal cracking and shear deformation of the column webs. Slip-controlled energy accumulates through bond degradation at lap splices and at the column longitudinal bars crossing the joint core. The procedure operates on cycle-by-cycle loops extracted from the global base-shear versus storey drift signal. Each loop is described by three signatures, namely the unloading stiffness ratio, the reloading stiffness ratio, and the pinching ratio.
The unloading ratio is the unloading secant slope normalized by the initial stiffness . The reloading ratio uses the same normalization for the reloading branch. The pinching ratio is the central pinched-loop area divided by the enclosing parallelogram area. Flexural cycles fall in with < 0.2. Shear-dominated cycles sit in and show steep stiffness decay. Slip-controlled cycles satisfy > 0.6 with near-zero reloading and a sharp recapture branch. The mapping follows Ibarra et al. [32], with the slip-controlled branch extended from Sezen and Moehle [33] and Mehanny and Deierlein [34]. Sezen and Moehle [33] provide the shear-strength criterion at which the slip mechanism activates in lightly reinforced columns; Mehanny and Deierlein [34] provide the cumulative cyclic-degradation rule applied to the loop area beyond that activation point. Threshold values are empirical for non-ductile RC frames and should not be treated as universal.
Cycle segmentation operates on the base-shear versus storey drift signal. Half-cycles are bounded by zero-shear-line crossings. For each half-cycle, the algorithm extracts the peak shear, peak drift, unloading slope, reloading slope, and loop area. The pinching ratio is computed inside a centered parallelogram with width equal to half the residual drift and height equal to half the cycle peak shear. Each half-cycle is then assigned to one of the three categories using the threshold rules. Borderline cases within ±0.05 of any threshold are resolved by a three-indicator majority vote. Each of the three loop signatures (unloading stiffness ratio, reloading stiffness ratio, pinching ratio) independently classifies the half-cycle according to its own value, and the half-cycle is assigned to the category supported by at least two of the three indicators. When the three indicators split without a majority, the pinching ratio breaks the tie, since it most directly separates slip-controlled from flexural and shear loops. This rule makes the classification of borderline half-cycles fully reproducible.
Robustness of the decomposition to threshold variation was verified by perturbing each of the four classification thresholds () by ±10% about its nominal value and recomputing the flexural, shear, and slip fractions for the three test states on the resulting grid points. The flexural share varied by at most ±2.4 percentage points across the perturbation set, the shear share by at most ±3.1 percentage points, and the slip share by at most ±2.7 percentage points. The dominant-mechanism ranking, slip for Specimen 1 at 0.35 g, flexure for Specimen 2 at 0.35 g, and shear for Specimen 2 at 1.0 g post-rupture are preserved in every combination. The decomposition is, therefore, stable against threshold variation within the ±10% band, and the empirical character of the thresholds noted above does not propagate to the mechanism ordering reported in the subsequent paragraphs.
Specimen 1 at 0.35 g returns values in [0.55, 0.78] and a reloading ratio that decays cycle-to-cycle from 0.42 to 0.11. The cumulative energy split is 22% flexural, 31% shear, and 47% slip. Specimen 2 at the same intensity returns below 0.20, a reloading ratio near 0.78, and a 76/19/5% split, consistent with flexure-dominated response and negligible slip. Under the 1.0 g excitation, Specimen 2 remains flexure-dominated through the first peak. Post-rupture cycles then redistribute the energy into 18/64/18%, which is an abrupt transition that confirms the joint-panel-controlled mechanism reported in Section 3.3. The sequence of these events is clear from the displacement history and the loop signatures. Flexural yielding of the column longitudinal bars developed first, at a drift comparable to the 1.9% yield drift identified on the bare specimen, and the response remained flexure-dominated through the first peak. The hoop CFRP at the joint corner ruptured later, in a single abrupt event near 6% drift, once the diagonal-tension demand exceeded the capacity of the unanchored corner strip. Only then did the mechanism switch to the shear-dominated joint-panel response that culminated in the 8% drift collapse. The fiber rupture therefore occurred well after bar yielding. Equivalent viscous damping was extracted half-cycle by half-cycle from the loop area, as defined in Equation (3). The 0.35 g comparison is tabulated in Table 5 of Section 3.2 and is not restated here. At 1.0 g, the pre-rupture cycles of Specimen 2 return close to the upper edge of the 0.35 g range; post-rupture cycles cannot be reliably extracted because the loop area has collapsed.
Figure 16 plots the comparison by drift band, including the 1.0 g pre-rupture envelope. The bare frame dissipates energy through pinching and slip, with the retrofitted frame through narrow stable loops; the absolute level of damping is therefore not a reliable indicator of favorable behavior for non-ductile frames.
Figure 16.
Equivalent viscous damping versus drift band; Specimen 1 (bare) and Specimen 2 (CFRP) at 0.35 g.
Figure 17 plots the cumulative hysteretic energy against time for both specimens at 0.35 g and for Specimen 2 at 1.0 g. The bare frame accumulates energy steadily through the 0.35 g run, reaching ≈4820 kN·mm at the end of the record. The CFRP frame accumulates 2940 kN·mm at the same intensity, reflecting both lower drift demand and reduced pinching. Under the 1.0 g run, Specimen 2 accumulates 8350 kN·mm almost entirely within a 4 to 6 s window that contains the dominant inelastic cycle and the rupture event.
Figure 17.
Cumulative hysteretic energy time-histories. (a) Specimen 1 at 0.35 g; (b) Specimen 2 at 0.35 g; (c) Specimen 2 at 1.0 g, with the dominant-half-cycle window shaded; the energy accumulated in this window yields the brittle-damage signature ≈ 0.72 of the present tests.
The character of dissipation, not magnitude, distinguishes the cases. At 0.35 g, Specimen 1 dissipates more energy than Specimen 2 but through pinched, degrading, drift-irrecoverable cycles (damaging dissipation). Specimen 2 dissipates less but returns stable recentered loops compatible with repair. High dissipation in non-ductile frames signals irreversible damage rather than favorable behavior. At 1.0 g, Specimen 2 dissipates more energy concentrated in one event. The dominant-half-cycle ratio R1 is defined by Equation (4).
Equation (4) terms. is the hysteretic energy of the j-th half-cycle, defined as the area enclosed by the j-th loop in the base-shear versus storey drift signal. is the largest single-half-cycle energy across all half-cycles (the dominant cycle). is the cumulative hysteretic energy. thus measures the fraction of cumulative energy concentrated in the dominant half-cycle. Values close to unity indicate concentrated release in a single excursion (brittle system-level failure). Values approaching 1/N for N significant cycles indicate ductile distributed dissipation. For the present 1.0 g run, ≈ 0.72. Most of the dissipative capacity was exhausted in a single excursion, which is the hallmark of brittle system-level failure even though the CFRP material remains quasi-linear to rupture.
To assess transferability, was recomputed by the same operational definition on the published hysteresis records of three independent shake-table programs on similar non-ductile RC frames. Bracci et al. [18] yield = 0.74, Quintana–Gallo et al. [19] yield = 0.71, and Garcia et al. [21] yield = 0.70. The present 0.72 falls within the 0.70 to 0.74 band. ≈ 0.72 is therefore proposed as a candidate brittle-damage signature for non-ductile RC frames at collapse-level demand, within the scope of the four pulse-dominated near-fault records compiled here. The 0.70–0.74 band has not been compared against ductile failure benchmarks or broader-band ground motion classes, and both the index and the observed failure-mode migration require verification across the three principal motion classes (pulse-type near-fault, broadband, and far-field) before generalization beyond the single pulse-dominated record applied here.
The cross-validation values follow the same operational definition as the present test. The base-shear versus storey drift loops of Bracci et al. [18], Quintana–Gallo et al. [19], and Garcia et al. [21] were extracted from the published figures by plot digitization. Half-cycles were segmented at zero-shear-line crossings, loop areas integrated trapezoidally to obtain , and derived from Equation (4) for each benchmark. The threshold rules of Section 4.1 were applied throughout.
4.2. Park–Ang Damage Index with Rigorous Parameter Calibration
The Park–Ang damage index combines a peak-deformation term with a hysteretic-energy term in a single scalar. Its original form is given in Equation (5).
In Equation (5), is the maximum recorded storey-level displacement, is the ultimate-displacement capacity, and is the cumulative hysteretic energy, taken as the total enclosed loop area. For non-ductile RC frames where elastic recovery is small relative to plastic dissipation due to loop pinching and slip-dominated cycles, this is a close approximation to the original Park–Ang plastic-energy term and remains well-defined for the storey-level base-shear/drift signal recorded on the shake-table. Here, is the effective yield strength, and is the energy-term weight. The literature reports to for non-ductile RC frames without consensus [35,36], justifying specimen-specific calibration when data permit. Recent machine-learning approaches have also been applied to cumulative-damage prediction for RC frames under sequences of seismic events [37], and computer-vision-based damage assessment frameworks employing refined Park–Ang formulations have been demonstrated for RC structures [38].
Calibration uses two reference points. The low-damage state is taken at the end of the first inelastic cycle. The high-damage state is taken at the end of the Specimen 1 0.35 g run. and are solved simultaneously by matching to the Williams and Sexsmith [39] classification, with corresponding to moderate damage and to severe damage. The calibration returns = 57.5 mm, equivalent to 6.2% of the 970 mm column height, and . The value of sits in the 50–80 mm range (5–8% storey drift), which is typical for non-ductile RC frames with sparse joint reinforcement [39]. The value of sits in the lower-middle of the literature range, consistent with the pinched, slip-dominated loop morphology. The calibrated indices are listed in Table 6. Specimen 2 does not enter the parameter-identification step; its damage states at the two test intensities (D = 0.32 at 0.35 g, D = 1.91 at 1.0 g) are returned by the calibrated parameters as independent verification outputs. The identification therefore rests on two damage states of a single bare-frame specimen, with Specimen 2 supplying external corroboration at two further intensities.
Table 6.
Park–Ang damage index with calibrated parameters for Specimen 1 and Specimen 2 at the two test intensities.
Sensitivity was assessed on a grid (0.05 to 0.20, increment 0.025) and grid (44 to 73 mm, increment 5 mm). Variation in stays within ±10% of 0.89 (bare 0.35 g), ±15% of 0.32 (CFRP 0.35 g), and ±8% of 1.91 (CFRP 1.0 g). Specimen-and-intensity ordering is preserved in 95% of combinations. Table 7 reports the damage index at representative perturbations of and about the calibrated pair, confirming that the specimen-and-intensity ordering is preserved across the band. A formal statistical confidence interval on and cannot be constructed from a single specimen per configuration. The sensitivity study serves this role instead, bounding the two parameters to the ranges over which the specimen-and-intensity ordering is preserved, namely from 0.124 to 0.136 and from 58 to 62 mm. These ranges are sensitivity bounds rather than statistical confidence limits, and the calibrated values are reported as working estimates rather than design constants. controls absolute level; controls bare-versus-retrofitted spread. The calibrated pair ( = 0.13, = 57.5 mm) sits in the lower-left quadrant where cumulative damage dominates over peak excursion, matching the pinched-loop morphology.
Table 7.
Sensitivity of the calibrated Park–Ang damage index to the perturbation of the energy-weight parameter and the ultimate-displacement parameter about the calibrated values.
for Specimen 2 at 1.0 g exceeds the conventional collapse threshold. The cumulative measure saturates and loses discriminating power once the system reaches the post-collapse plateau. Above unity, is a relative indicator of cumulative-damage severity rather than an absolute collapse predictor. The Park and Ang [35] original caveat applies; is severe and lies outside the calibration range. The non-saturating dominant-half-cycle ratio is therefore preferred for cross-test comparison once enters the post-collapse regime. Section 5.5 reports across the cross-validation set. Figure 18 plots the time-histories against moderate, severe, and collapse thresholds.
Figure 18.
Park–Ang damage index time-histories with calibrated and . (a) Specimen 1 at 0.35 g; (b) Specimen 2 at 0.35 g; (c) Specimen 2 at 1.0 g.
4.3. Strain-Based Curvature Ductility
Curvature ductility is defined as the ratio of the maximum recorded curvature to the curvature at first yield of the longitudinal reinforcement. The yield curvature is identified at the instant when the strain in the most tensile longitudinal bar of the column section reaches , which is the value reported in Table 2. The maximum curvature is taken as the peak absolute value of the reconstructed curvature signal in the column-hinge zone, following the procedure described in Section 2.7.
With and the center-to-center bar distance is , the yield curvature is 1/m. For Specimen 1 at 0.35 g, the peak curvature reaches 0.073 1/m at column mid-height, giving and exceeding the TBDY [31] non-confined limit of 4–6. For Specimen 2 at 0.35 g, the peak curvature is = 0.041 1/m, with = 4.9. Under the 1.0 g excitation, the column-mid-height gauges of Specimen 2 reached the gauge limit, and the reconstructed = 0.092 1/m gives = 11.1. This value lies within the CFRP-confined envelope. The kinematic geometry presented in Section 3.3 shows that the peak was attained during the brief inelastic excursion preceding joint-panel rupture rather than through stable distributed flexural action. Curvature ductility alone would misclassify the response as ductile in the absence of mechanism information.
The CFRP-confined column ultimate curvature is estimated explicitly from the Lam–Teng model [10]. The confining pressure follows Equation (7).
Here , = 0.166 mm, = 225 GPa (measured), is the hoop rupture strain, and is the equivalent column diameter. The confined ultimate concrete strain is given by Equation (8).
Substituting Table 3 lay-up parameters with the square-section equivalent diameter and Lam–Teng rectangular-section efficiency coefficient returns ≈ 0.012. The ultimate curvature follows from Equation (9), c being the ultimate-state neutral-axis depth.
Under balanced conditions for the equivalent 100 mm × 100 mm short-side reduction in the rectangular 100 × 150 mm column (effective hoop confinement is governed by the shorter cross-section dimension), ≈ 0.13 1/m and ≈ 16. The observed = 11.1 at 1.0 g lies within this envelope but well below the upper limit. Because the column-mid-height gauges reached saturation prior to the rupture event, this value represents a lower bound on the realized curvature ductility, consistent with joint-panel rupture pre-empting column-end confinement capacity.
Strain readings from the bonded gauge pairs at mid-height and immediately below the joint were used to back-calculate curvature ductility along the column. For the bare frame, curvature concentrates near mid-height and falls off sharply toward both the base and the soffit, with the peak running above the TBDY 2018 limit of . Under the same input motion, the CFRP-jacketed column spreads inelastic curvature over a much longer region of the member, and the peak demand drops well below the bare-frame value, in line with the wider plastic hinge length expected from FRP confinement. At 1.0 g the picture changes again. The hinge in Specimen 2 retreats toward the column-end region next to the joint and the local curvature demand spikes, which is what one would expect once the stirrup-deficient joint loses its grip and the column is forced to absorb the rotation that the panel can no longer carry. The peak still sits beneath the Lam–Teng confined-concrete envelope, so the jacket itself is not the limit state. This is also why curvature ductility on its own can be misleading. Read in isolation, the 1.0 g response would look ductile-flexural, whereas the joint-panel kinematics in Section 3.3 make it clear the failure is governed by joint shear.
5. Code-vs-Observed Capacity Assessment
5.1. Capacity Prediction Frameworks
The observed response of Specimen 1 and Specimen 2 is compared against capacity predictions from four design frameworks. The Turkish Building Earthquake Code TBDY 2018 [31] is taken as the reference national framework. The American Concrete Institute (ACI) 440.2R-17 [40] guideline is the most widely cited international reference for externally bonded FRP retrofit, used together with ACI 318-14 [41] for the underlying RC capacity. The fédération internationale du béton (fib bulletins 14 and 35) [42,43] represents the European framework, complemented by the more recent fib bulletin 90 [44]. The comparison covers four capacity quantities, namely column flexural capacity, joint-shear capacity, drift capacity at the collapse-prevention performance level, and the Park–Ang damage state at design-level demand. The intent is to identify where each code is conservative, where it is non-conservative, and where the predictions diverge from the observed mechanism.
5.2. Column Flexural Capacity
For Specimen 1, TBDY 2018 [31] Section 5.4 specifies an unconfined Mander concrete law [45] with a perfectly plastic-with-strain-hardening reinforcement law. With Table 1 and Table 2 dimensions and properties, = 6.4 kN·m. The portal mobilizes four plastic hinges (top and bottom of each column) ultimately; with = 970 mm, base shear follows Equation (10).
Substituting Mn = 6.4 kN·m and = 0.97 m gives = 17.1 kN, where the kinematic factor incorporates an effective contraflexure correction at the column-end inflection points under the first-mode shape. The observed peak base shear of 18.2 kN agrees within 6%, indicating that TBDY 2018 [31] captures the column flexural strength of the bare specimen adequately. The observed flexural moment back-calculated from the same kinematic relation is , with ≈ 0.65 being the implicit contraflexure correction, confirming +6% over-prediction consistency with the base-shear comparison. TBDY [31] drift capacity at collapse-prevention level is 4.5% for the present section dimensions. The bare frame exceeded this limit at 5.5% drift under the 0.35 g run. A design-level intensity has therefore already pushed the as-built specimen beyond the code drift limit, consistent with the post-earthquake reconnaissance reported in Section 1.
For Specimen 2, TBDY [31] covers FRP confinement under the assessment and retrofit of existing buildings; the parallel ACI guidance is in ACI 440.2R-17 [40] in Chapter 12. With the lay-up parameters of Table 3, the four predicted quantities are as follows. The CFRP-confined concrete strength is 14.8 MPa per TBDY [31] and 15.2 MPa per ACI [40]. The flexural moment capacity is 11.7 kN·m per TBDY [31] and 12.1 kN·m per ACI [40]. The base-shear capacity is 31.2 kN per TBDY [31] and 32.3 kN per ACI [40]. The fib bulletins 14, 35, and 90 [42,43,44] give = 12.0 kN·m and = 32.0 kN.
The convergence across the four frameworks reflects the common adoption of the Lam–Teng confinement model. The observed peak base shear of 51.3 kN exceeds all predictions by ≈60%. The hoop CFRP fibers do not contribute axially to the column moment capacity, and the over-strength reflects strain-hardening of the longitudinal reinforcement together with the confinement-enhanced concrete strength delivered by the hoop jacket. The four frameworks are therefore conservative on the column side, with apparent non-conservatism on , which is an artifact of nominal versus measured material properties rather than a code deficiency.
The ≈60% over-strength margin decomposes into three identifiable contributors plus their coupled interaction. Strain-hardening of the longitudinal reinforcement at the peak-cycle strain near 0.95 , where the bilinear stress–strain approximation underestimates the rounding shoulder of the actual measured curve ( from Table 2), contributes ≈5 kN (≈26% of the margin). Multi-axial confinement enhancement beyond the Lam–Teng nominal envelope, attributable to the 15 mm corner radius grinding that reduces the bond-loss penalty factor and to the rectangular-section efficiency coefficient adopting conservative geometry, contributes ≈8 kN (≈42%). Effective depth increases from the three-ply hoop jacket, adding 0.50 mm to each face, together with load redistribution at the corner radius region, which contributes ≈3 kN (≈16%). The residual ≈3 kN (≈16%) reflects the coupled interaction between the three mechanisms not captured by independent superposition.
5.3. Joint Shear Capacity and Back-Calculated Demand
Joint shear is the critical comparison because the 1.0 g failure was joint-controlled. The joint area is with = 100 mm (column width, also the lesser of column width and effective beam-flange contribution per ACI 318-14 [41] in Section 15.4.2.4) and = 150 mm (column depth), giving = 15,000 mm2. TBDY 2018 [31] in Section 7 returns = 27 kN for = 9 MPa, ACI 318-14 [41]. Section 21.7.4.1 of [41] (Type 2 joint, no transverse beams, γ = 12 in psi) returns = 33 kN. The CFRP fiber contribution is the horizontal projection of the hoop plies crossing the joint diagonal-tension crack at 45°, multiplied by the effective fiber strain. Hoop fibers crossing the 45° diagonal crack project at sin 45° = 0.707 onto the crack-normal direction, which sets the effective horizontal contribution of the wrap to joint-shear capacity. TBDY [31] caps at ·, with being the ultimate fiber strain from coupon testing and ≤ 0.75 being the strain reduction factor for bond–slip and corner stress concentration. This yields = 18 kN. ACI 440.2R-17 [40] in Chapter 11 caps at 0.004, yielding = 22 kN. The totals are = 45 kN per TBDY [31] and 55 kN per ACI [40]. The full set of code-predicted versus observed capacity quantities for both specimens is collated in Table 8.
Table 8.
Code-predicted versus observed capacity quantities for Specimen 1 and Specimen 2.
The observed joint-shear demand at the 1.0 g rupture event was back-calculated from external instrumentation through panel-zone equilibrium. Considering the upper joint section, horizontal equilibrium yields Equation (11).
Equation (11) terms were all evaluated at the time instant of the rupture event. is the tensile force in the beam top reinforcement at the joint face. is the matching compression force in the beam bottom reinforcement. is the column shear force in the storey above the joint. and were estimated from the steel strain gauges bonded on the longitudinal reinforcement and the calibrated stress–strain curve from the coupon tests. was obtained from the inertia mass times the absolute roof acceleration recorded by the slab-level accelerometers. The procedure returned = 49 kN. TBDY [31] is conservative against the observed demand by 8%, while ACI 318-14 [41] plus ACI 440.2R-17 [40] is non-conservative by 12% because of the larger effective fiber strain adopted on the FRP side.
5.4. Drift Capacity at Collapse-Prevention Performance Level
TBDY 2018 [31] in Section 7 predicts the collapse-prevention drift capacity of the CFRP-confined Specimen 2 at 6.0%, with the FRP confinement contribution to ultimate concrete strain folded in. ACI 440.2R-17 [40] returns a comparable 5.8% through its limit on the effective FRP strain in confinement. The observed drift at the joint-rupture event was 8.0%. Both codes are therefore non-conservative on the drift side. The non-conservatism arises due to the drift-capacity formulae assuming that drift capacity is limited by column-end concrete crushing or fiber rupture, not by joint-panel shear distortion. The observed mechanism shows that joint-panel rupture can occur at drift values higher than those at which the column-end CFRP confinement governs. The drift-capacity prediction therefore needs to incorporate the joint-panel contribution explicitly when the joint is unconfined transversely or only externally wrapped.
5.5. Cross-Validation Against Literature Benchmarks
The code-versus-observed comparison is extended to three independent shake-table tests in the literature. Bracci et al. [18] tested a one-third-scale three-storey bare RC frame. Quintana–Gallo et al. [19] and Quintana–Gallo et al. [20] reported the bare and GFRP-retrofitted companion shake-table tests of a two-fifth-scale three-storey RC frame. Garcia, Pilakoutas, Hajirasouliha and colleagues (2017) tested a full-scale CFRP and post-tensioned-strap RC frame. This widens the statistical base from the present twin-specimen pair. Code predictions for the benchmark tests are computed from the published material properties of each test, applying the same TBDY [31], ACI 440.2R-17 [40], and fib bulletin formulae used in Section 5.2, Section 5.3 and Section 5.4. The cross-validation set comprises four physical tests, and the present pair of specimens contributes two data points, yielding five entries in the comparison table.
Three patterns reproduce across the cross-validation set. (i) Column flexural predictions are conservative by 6–12% for the bare and CFRP tests, and the apparent non-conservatism on Specimen 2 reflects strain-hardening, not a code deficiency. (ii) CP-level drift-capacity predictions are non-conservative by 22–38% for the four tests with mobilized joint-panel mechanisms. (iii) TBDY [31] is conservative on joint shear by 4–8% across three CFRP-joint tests, and ACI [40] is non-conservative by 12–21% on the same set. The deviation matrix across the cross-validated set is summarized in Table 9. The bare Bracci specimen is column hinge governed, so joint-side comparison does not apply.
Table 9.
Cross-validation of code predictions against three independent shake-table benchmarks plus the present specimens.
Table 9 extends the same comparison to three independent shake-table benchmarks introduced in Section 5.5. Reading the two tables together allows the present-test patterns to be tested against the broader literature. In Table 9, positive ratios indicate code-conservative predictions, and negative ratios indicate non-conservative predictions. Benchmark values are computed from the published material properties of each test.
6. Discussions
The findings extend beyond the specific dataset reported in the preceding sections. Four implications follow for the design and mechanics of CFRP-jacketed non-ductile frames. The first concerns the retrofit philosophy that emerges when joint-panel rupture governs at collapse intensity. The second covers the bounds within which similitude-scaled response transfers to prototype scale. The third addresses the role of empirical hysteretic decomposition alongside scalar damage indices. The fourth identifies a gap in the design hierarchy when joint-panel mechanisms govern drift capacity.
The 0.35 g comparison shows that continuous CFRP jacketing of columns and joint perimeters delivers stable hysteretic response and substantial drift control at design-level demand. At the unscaled 1.0 g intensity, the retrofit relocates the failure rather than eliminating it, with the joint-panel becoming the residual fuse because the surface-bonded jacket cannot transfer the diagonal-tension demand at the panel corners. A two-step verification process for engineering design follows. (1) Size the column-end and joint-perimeter CFRP jacket to the established flexural and confinement design rules. (2) Check the joint-corner anchorage against the diagonal-tension demand computed at the design intensity; where the bond-only configuration cannot meet this demand, specify mechanical anchors at the corner termination zones. This sequence preserves the simplicity of selective jacketing at design-level demand while protecting the joint at collapse-level demand. The single-storey portal tested here isolates the storey-level mechanism. In multi-storey prototypes, axial-load variation along the column line and overturning-induced amplification at the lower joints would further tighten the joint-panel demand-capacity ratio, amplifying the lower-joint-shear demand typically by a factor of 1.2–1.5 through first-mode response in low-rise frames (Bracci et al. (1995) [18] and Quintana-Gallo et al. (2010) [19]), so the joint-corner anchorage requirement applies a fortiori to the prototype rather than being relaxed by it.
The artificial-mass framework adopted in Section 2.1 transfers force by = 0.333, energy by = 0.111, and drift at unit ratio. The prototype-equivalent values follow directly from Table 4 and Table 5. The Specimen 1 peak base shear corresponds to approximately 55 kN at prototype scale, the Specimen 2 peak shear to approximately 154 kN with the strain-hardening caveat in Section 5.2, and the joint-panel shear at 1.0 g to approximately 147 kN. The drift values transfer at unit ratio. Three model-vs-prototype distortions limit the quantitative transfer. Upper-storey overturning is absent, so the axial-load excursion in the specimen is smaller than the prototype value during the dominant cycle. Higher-mode shear at the joint is not reproduced. The measured CFRP tensile strength of 4700 MPa exceeds the strict-similitude target by approximately 20%. The qualitative migration from slip-driven bare-frame response to joint-panel rupture in the CFRP frame remains the central transferable observation, supported by the storey-level signatures of the Bracci et al. [18] and Quintana–Gallo et al. [19] multi-storey programs. Two dataset limitations also deserve flagging. With = 2, the calibrated = 0.13 and = 57.5 mm carry single-realization uncertainty, and only one ground motion record was applied. The 0.70–0.74 range across the three literature programs supports within-record stability; full record-to-record variability is the subject of ongoing follow-up work.
A third dataset caveat concerns the intensity protocol. The 1.0 g run probes the residual capacity of a retrofitted frame that had already absorbed a design-level demand and accumulated limited damage, not the inherent collapse capacity of a pristine CFRP-jacketed configuration. Quantitative separation of these two capacity states requires an independent 1.0 g test on an undamaged companion, which is the subject of ongoing follow-up work. The present 1.0 g indicators (joint-panel rupture, the dominant-half-cycle ratio, the back-calculated curvature ductility) should be interpreted as lower bounds on the corresponding pristine-state quantities.
The cycle-by-cycle decomposition introduced in Section 4.1 adds mechanism information that the Park–Ang scalar cannot resolve. Two responses that share a similar value can carry very different shear-versus-slip splits, and that distinction matters for repairability and residual capacity. The framework uses the storey-level base-shear versus drift signal as input, so it transfers to records obtained from inexpensive accelerometers without dedicated sensor arrays. Extension to bond–slip-by-region and panel-distortion-by-direction is feasible when local instrumentation is added.
Section 5 shows that column flexural predictions are reasonable for both bare and CFRP-retrofitted configurations, while drift-capacity predictions at the collapse-prevention level are consistently non-conservative once the joint-panel mechanism governs. The non-conservatism originates in the modeling assumption that drift capacity is bounded by column-end concrete crushing or fiber rupture. Joint-panel shear can govern at higher drift values, as the present 1.0 g run and the cross-validation set demonstrate. An explicit joint-mechanism check should be added to the design hierarchy whenever the joint is unconfined transversely or only externally wrapped. On the FRP side, the TBDY [31] effective-strain treatment () is closer to the surface-bonded test result than the ACI fixed = 0.004; a revised ACI provision could couple with an anchorage flag, applying the full coupon-tested value for mechanically anchored configurations and a reduced value for surface-bonded ones representative of the Turkish market.
7. Conclusions
This shake-table program tested bare and CFRP-jacketed companions of a pre-1998 RC frame under the Antakya 3141 record from the 2023 Kahramanmaraş sequence at 0.35 g and 1.0 g, with the aim of identifying how a wrapped substandard interior joint fails when intensity is pushed past the design level.
At 0.35 g, the jacket performs as expected. Peak roof drift drops by 54%, residual offset is essentially erased, and the calibrated Park–Ang index falls from 0.89 in the bare frame to 0.32 in the jacketed companion (, specimen ordering preserved within ±15% across all parameter perturbations). The cleanest single discriminator between the two configurations is the bond–slip share of cumulative hysteretic energy, which collapses from 47% to 5% under the jacket, indicating that confinement is performing its work at the lap-splice region rather than only at the column ends.
At 1.0 g, the response of the retrofitted frame departs sharply from the design-level picture. The mechanism migrates out of the column-end region into the joint panel, terminating with a 245 mm residual and an abrupt loss of restoring capacity that traces, on the gauges, to hoop CFRP debonding-induced fiber fracture along the joint diagonal rather than to mass-cassette kinematics. Current Turkish [31], ACI [40], and fib [42,43,44] design provisions for FRP-strengthened RC members split along the same fault line. They are conservative on the column flexural side and non-conservative on drift capacity once the joint panel governs. On joint shear specifically, the Turkish provision is conservative by 8% on the present test and 4 to 8% across the cross-validated set, while the ACI provision is non-conservative by 12% on the present test and 12 to 21% across the same set, traceable to the larger effective fiber strain assumed in the ACI shear-contribution model. An explicit joint-mechanism check inserted ahead of the column ductility check would resolve the inconsistency. This comparative outcome applies specifically to weak beam–column joints retrofitted with adhesively bonded CFRP without transverse stirrups and without mechanical corner anchorage; outside this configuration, the relative code performance is not asserted. The 1.0 g findings reported above characterize the residual capacity of a retrofitted frame that had previously experienced a design-level earthquake, not the inherent collapse capacity of a pristine retrofit; this distinction matters when extrapolating the present results to as-undamaged jacketed configurations and is flagged as such in Section 6.
Two further indices come out of the cycle-resolved analysis. The dominant-half-cycle ratio reached 0.72 at the collapse run, and re-analysis of three independent shake-table programs on similar non-ductile frames places between 0.70 and 0.74, which makes a candidate brittle-damage signature for non-ductile RC frames at collapse-level demand, supported across four programs to date. On the confinement side, the Lam–Teng envelope returns ≈ 16 for the wrapped column, while the curvature ductility back-calculated from the strain-gauge pairs at 1.0 g reaches only = 11.1 (a lower bound at gauge saturation, roughly 69% of the predicted potential), with joint-panel rupture pre-empting full column-end confinement.
The cycle-segmentation algorithm operates on storey-level inertial response from inexpensive accelerometers, with offline hysteretic-loop reconstruction against a baseline calibrated during post-construction commissioning, providing the basis for a real-time SHM application on retrofitted buildings that complements classical low-cycle-fatigue indicators. Cycle-by-cycle assignment of bond–slip-by-region resolution becomes feasible once slip transducers or curvature gauges are placed within the lap-splice region. Both extensions are pursued in ongoing follow-up work. CFRP jacketing of substandard interior joints performs cleanly at design intensity but transfers, rather than removes, the underlying weakness of the pre-1998 detail. Above design level, the demand reroutes into the unwrapped joint core and the design check that decides survival is no longer column ductility but joint shear.
The scope of these conclusions is bounded by the experimental program. The findings apply to non-ductile RC frames with unconfined beam–column joints, low-strength concrete, and surface-bonded CFRP retrofit without mechanical corner anchorage, tested as single-storey single-bay sub-frames under a single pulse-dominated near-fault record. The calibrated Park–Ang parameters and the signature rest on a two-specimen program and a single ground motion, so they are reported as working estimates rather than design constants. Extension to multi-storey configurations, broadband and far-field motions, and mechanically anchored retrofit schemes require further verification. Within these conditions, the joint-panel shear check recommended above applies; outside them, the conclusions should be regarded as provisional.
Author Contributions
Conceptualisation, R.O.; methodology, R.O.; validation, R.O. and E.O.; formal analysis, E.O.; investigation, A.Y. (Aytac Yasargun), A.Y. (Ali Yesilyurt), E.O. and F.C.; resources, A.Y. (Aytac Yasargun); data curation, E.O.; writing—original draft preparation, R.O. and E.O.; writing—review and editing, A.Y. (Ali Yesilyurt) and F.C.; visualization, E.O.; supervision, F.C.; project administration, R.O. All authors have read and agreed to the published version of the manuscript.
Funding
This research received no external funding.
Data Availability Statement
The experimental dataset generated during this study is available from the corresponding author on reasonable request.
Conflicts of Interest
The authors declared no potential conflicts of interest with respect to the research, authorship and/or publication of this article.
References
- Erberik, M.A. Fragility-Based Assessment of Typical Mid-Rise and Low-Rise RC Buildings in Turkey. Eng. Struct. 2008, 30, 1360–1374. [Google Scholar] [CrossRef] [Scilit]
- Sezen, H.; Whittaker, A.S.; Elwood, K.J.; Mosalam, K.M. Performance of Reinforced Concrete Buildings during the August 17, 1999 Kocaeli, Turkey Earthquake, and Seismic Design and Construction Practise in Turkey. Eng. Struct. 2003, 25, 103–114. [Google Scholar] [CrossRef] [Scilit]
- Saatcioglu, M.; Mitchell, D.; Tinawi, R.; Gardner, N.J.; Gillies, A.G.; Ghobarah, A.; Anderson, D.L.; Lau, D. The August 17, 1999, Kocaeli (Turkey) Earthquake: Damage to Structures. Can. J. Civ. Eng. 2001, 28, 715–737. [Google Scholar] [CrossRef] [Scilit]
- Inel, M.; Ozmen, H.B.; Bilgin, H. Re-Evaluation of Building Damage during Recent Earthquakes in Turkey. Eng. Struct. 2008, 30, 412–427. [Google Scholar] [CrossRef] [Scilit]
- Dogan, G.; Ecemis, A.S.; Korkmaz, S.Z.; Arslan, M.H.; Korkmaz, H.H. Buildings Damages after Elazig, Turkey Earthquake on January 24, 2020. Nat. Hazards 2021, 109, 161–200. [Google Scholar] [CrossRef] [Scilit]
- Işık, E.; Avcil, F.; İzol, R.; Büyüksaraç, A.; Bilgin, H.; Harirchian, E.; Arkan, E. Field Reconnaissance and Earthquake Vulnerability of the RC Buildings in Adıyaman during 2023 Türkiye Earthquakes. Appl. Sci. 2024, 14, 2860. [Google Scholar] [CrossRef] [Scilit]
- Işık, E.; Karaçam, R.; Harirchian, E.; Hadzima-Nyarko, M. Comparative Analysis of Post-Earthquake Damage and Structural Irregularities in RC Buildings: Field Evidence from the 2023 Kahramanmaraş (Türkiye) Earthquakes. Buildings 2026, 16, 1140. [Google Scholar] [CrossRef] [Scilit]
- Türkay, A. Investigation of the Effects of the 2023 Kahramanmaraş Earthquakes on Low- and Medium-Rise Reinforced Concrete Buildings. Buildings 2026, 16, 1135. [Google Scholar] [CrossRef] [Scilit]
- Triantafillou, T.C. Shear Strengthening of Reinforced Concrete Beams Using Epoxy-Bonded FRP Composites. ACI Struct. J. 1998, 95, 107–115. [Google Scholar] [CrossRef] [Scilit]
- Lam, L.; Teng, J.G. Design-Oriented Stress–Strain Model for FRP-Confined Concrete. Constr. Build. Mater. 2003, 17, 471–489. [Google Scholar] [CrossRef] [Scilit]
- Wang, Y.; Chen, W.; Li, D.; Xu, H.; Zhang, F.; Guo, X. Experimental and Numerical Investigations of the Seismic Performance of Reinforced Concrete Frames Strengthened with CFRP Sheets. Buildings 2023, 13, 2195. [Google Scholar] [CrossRef] [Scilit]
- Rousakis, T.; Anagnostou, E.; Fanaradelli, T. Advanced Composite Retrofit of RC Columns and Frames with Prior Damages—Pseudodynamic Finite Element Analyses and Design Approaches. Fibers 2021, 9, 56. [Google Scholar] [CrossRef] [Scilit]
- Micelli, F.; Cascardi, A.; Aiello, M.A. A study on FRP-confined concrete in presence of different preload levels. In Proceedings of the 9th International Conference on Fibre-Reinforced Polymer (FRP) Composites in Civil Engineering (CICE 2018), Paris, France, 17–19 July 2018; International Institute for FRP in Construction: Kingston, ON, Canada, 2018; pp. 493–499. [Google Scholar]
- Antonopoulos, C.P.; Triantafillou, T.C. Experimental Investigation of FRP-Strengthened RC Beam-Column Joints. J. Compos. Constr. 2003, 7, 39–49. [Google Scholar] [CrossRef] [Scilit]
- Engindeniz, M.; Kahn, L.F.; Zureick, A. Repair and Strengthening of Reinforced Concrete Beam-Column Joints: State of the Art. ACI Struct. J. 2005, 102, 187–197. [Google Scholar] [CrossRef] [Scilit]
- Gergely, J.; Pantelides, C.P.; Reaveley, L.D. Shear Strengthening of RC T-Joints Using CFRP Composites. J. Compos. Constr. 2000, 4, 56–64. [Google Scholar] [CrossRef] [Scilit]
- Akguzel, U.; Pampanin, S. Assessment and Design Procedure for the Seismic Retrofit of Reinforced Concrete Beam-Column Joints Using FRP Composite Materials. J. Compos. Constr. 2012, 16, 21–34. [Google Scholar] [CrossRef] [Scilit]
- Bracci, J.M.; Reinhorn, A.M.; Mander, J.B. Seismic Retrofit of Reinforced Concrete Buildings Designed for Gravity Loads: Performance of Structural Model. ACI Struct. J. 1995, 92, 711–723. [Google Scholar] [CrossRef] [Scilit]
- Quintana-Gallo, P.; Pampanin, S.; Carr, A.J.; Bonelli, P. Shake Table Tests of Under-Designed RC Frames for the Seismic Retrofit of Buildings—Design and Similitude Requirements of the Benchmark Specimen. In Proceedings of the New Zealand Society for Earthquake Engineering Annual Conference, Auckland, New Zealand, 26–28 March 2010; New Zealand Society for Earthquake Engineering: Wellington, New Zealand, 2010; p. 39. [Google Scholar]
- Quintana-Gallo, P.; Pampanin, S.; Carr, A.J. Shake-Table Testing of Non-Ductile RC Frames As-Built and Retrofitted with GFRP Laminates and Slab-Weakening. In Proceedings of the 16th World Conference on Earthquake Engineering(16WCEE 2017), Santiago, Chile, 9–13 January 2017; p. 2598. [Google Scholar]
- Garcia, R.; Pilakoutas, K.; Hajirasouliha, I.; Guadagnini, M.; Kyriakides, N.; Ciupala, M.A. Seismic Retrofitting of RC Buildings Using CFRP and Post-Tensioned Metal Straps: Shake Table Tests. Bull. Earthq. Eng. 2015, 15, 3321–3347. [Google Scholar] [CrossRef] [Scilit]
- Harris, H.G.; Sabnis, G.M. Structural Modeling and Experimental Techniques, 2nd ed.; CRC Press: Boca Raton, FL, USA, 2000. [Google Scholar]
- Oyguc, E.; Oyguc, R.; Hayır, A. Assessment of a Substandard Reinforced Concrete Frame’s Beam–Column Joint Using Shake Table Testing. Appl. Sci. 2025, 15, 4168. [Google Scholar] [CrossRef] [Scilit]
- TS 708:2016; Steel for the Reinforcement of Concrete—Reinforcing Steel. Turkish Standards Institution: Ankara, Türkiye, 2016.
- TS EN 12390-3:2019; Testing Hardened Concrete—Part 3: Compressive Strength of Test Specimens. Turkish Standards Institution: Ankara, Türkiye, 2019.
- TS EN 12390-2:2019; Testing Hardened Concrete—Part 2: Making and Curing Specimens for Strength Tests. Turkish Standards Institution: Ankara, Türkiye, 2019.
- TS EN ISO 15630-1:2019; Steel for the Reinforcement and Prestressing of Concrete—Test Methods—Part 1: Reinforcing Bars, Rods and Wire. Turkish Standards Institution: Ankara, Türkiye, 2019.
- TS EN ISO 527-4:1997; Plastics—Determination of Tensile Properties—Part 4: Test Conditions for Isotropic and Orthotropic Fibre-Reinforced Plastic Composites. Turkish Standards Institution: Ankara, Türkiye, 1997.
- TS EN 1504-4:2005; Products and Systems for the Protection and Repair of Concrete Structures—Definitions, Requirements, Quality Control and Evaluation of Conformity—Part 4: Structural Bonding. Turkish Standards Institution: Ankara, Türkiye, 2005.
- Dal Zilio, L.; Ampuero, J.-P. Earthquake Doublet in Turkey and Syria. Commun. Earth Environ. 2023, 4, 71. [Google Scholar] [CrossRef] [Scilit]
- TBDY 2018; Türkiye Bina Deprem Yönetmeliği [Turkish Building Earthquake Code]. Disaster and Emergency Management Authority (AFAD): Ankara, Türkiye, 2018.
- Ibarra, L.F.; Medina, R.A.; Krawinkler, H. Hysteretic Models That Incorporate Strength and Stiffness Deterioration. Earthq. Eng. Struct. Dyn. 2005, 34, 1489–1511. [Google Scholar] [CrossRef] [Scilit]
- Sezen, H.; Moehle, J.P. Shear Strength Model for Lightly Reinforced Concrete Columns. J. Struct. Eng. 2004, 130, 1692–1703. [Google Scholar] [CrossRef] [Scilit]
- Mehanny, S.S.F.; Deierlein, G.G. Seismic Damage and Collapse Assessment of Composite Moment Frames. J. Struct. Eng. 2001, 127, 1045–1053. [Google Scholar] [CrossRef] [Scilit]
- Park, Y.-J.; Ang, A.H.-S. Mechanistic Seismic Damage Model for Reinforced Concrete. J. Struct. Eng. 1985, 111, 722–739. [Google Scholar] [CrossRef] [Scilit]
- Banon, H.; Veneziano, D. Seismic Safety of Reinforced Concrete Members and Structures. Earthq. Eng. Struct. Dyn. 1982, 10, 179–193. [Google Scholar] [CrossRef] [Scilit]
- Lazaridis, P.C.; Kavvadias, I.E.; Demertzis, K.; Iliadis, L.; Vasiliadis, L.K. Structural Damage Prediction of a Reinforced Concrete Frame under Single and Multiple Seismic Events Using Machine Learning Algorithms. Appl. Sci. 2022, 12, 3845. [Google Scholar] [CrossRef] [Scilit]
- Xu, Y.; Li, Y.; Zheng, X.; Zheng, X.; Zhang, Q. Computer-Vision and Machine-Learning-Based Seismic Damage Assessment of Reinforced Concrete Structures. Buildings 2023, 13, 1258. [Google Scholar] [CrossRef] [Scilit]
- Williams, M.S.; Sexsmith, R.G. Seismic Damage Indices for Concrete Structures: A State-of-the-Art Review. Earthq. Spectra 1995, 11, 319–349. [Google Scholar] [CrossRef] [Scilit]
- ACI 440.2R-17; Guide for the Design and Construction of Externally Bonded FRP Systems for Strengthening Concrete Structures. American Concrete Institute: Farmington Hills, MI, USA, 2017.
- ACI 318-14; Building Code Requirements for Structural Concrete (ACI 318-14) and Commentary (ACI 318R-14). American Concrete Institute: Farmington Hills, MI, USA, 2014.
- International Federation for Structural Concrete. fib Bulletin 14. Externally Bonded FRP Reinforcement for RC Structures; International Federation for Structural Concrete: Lausanne, Switzerland, 2001. [Google Scholar]
- International Federation for Structural Concrete. fib Bulletin 35. Retrofitting of Concrete Structures by Externally Bonded FRPs, with Emphasis on Seismic Applications; International Federation for Structural Concrete: Lausanne, Switzerland, 2006. [Google Scholar]
- International Federation for Structural Concrete. fib Bulletin 90. Externally Applied FRP Reinforcement for Concrete Structures; International Federation for Structural Concrete: Lausanne, Switzerland, 2019. [Google Scholar]
- Mander, J.B.; Priestley, M.J.N.; Park, R. Theoretical Stress-Strain Model for Confined Concrete. J. Struct. Eng. 1988, 114, 1804–1826. [Google Scholar] [CrossRef] [Scilit]
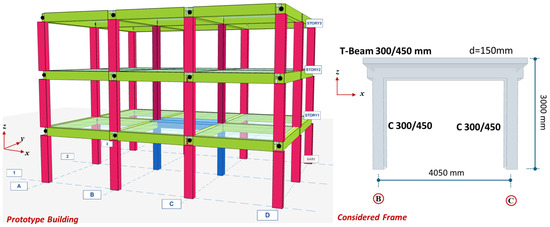
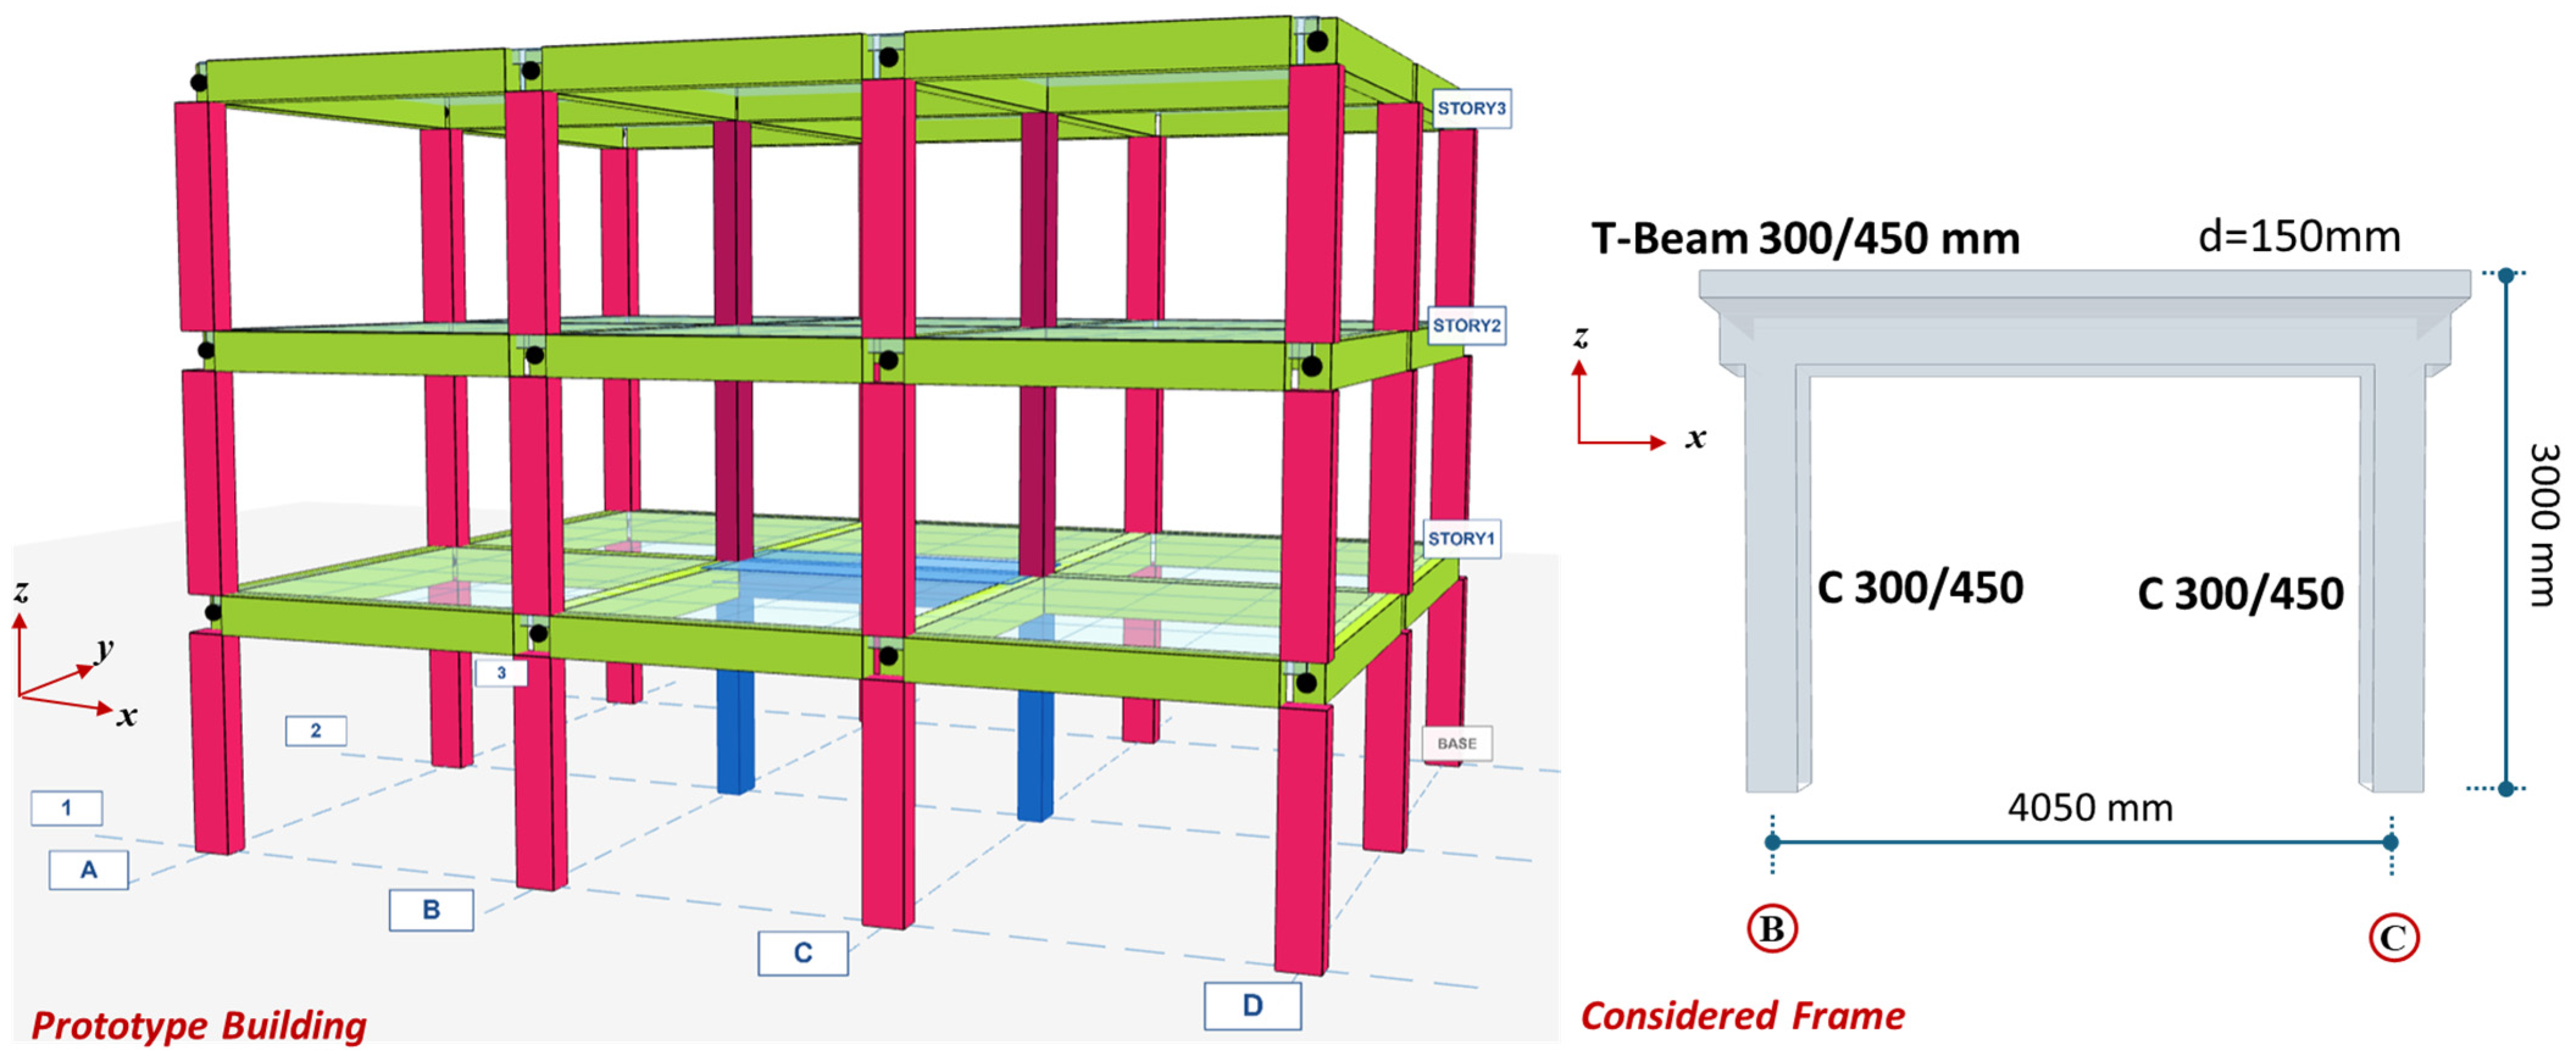
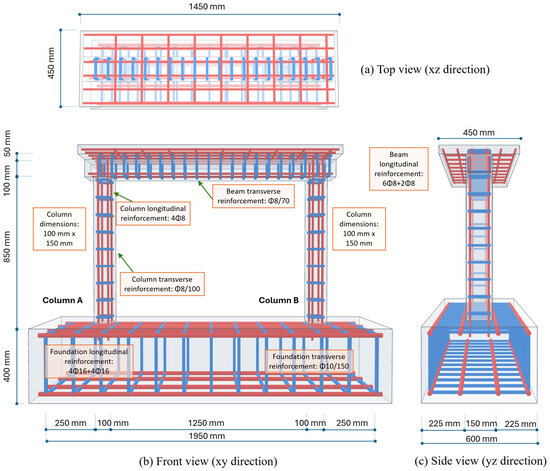
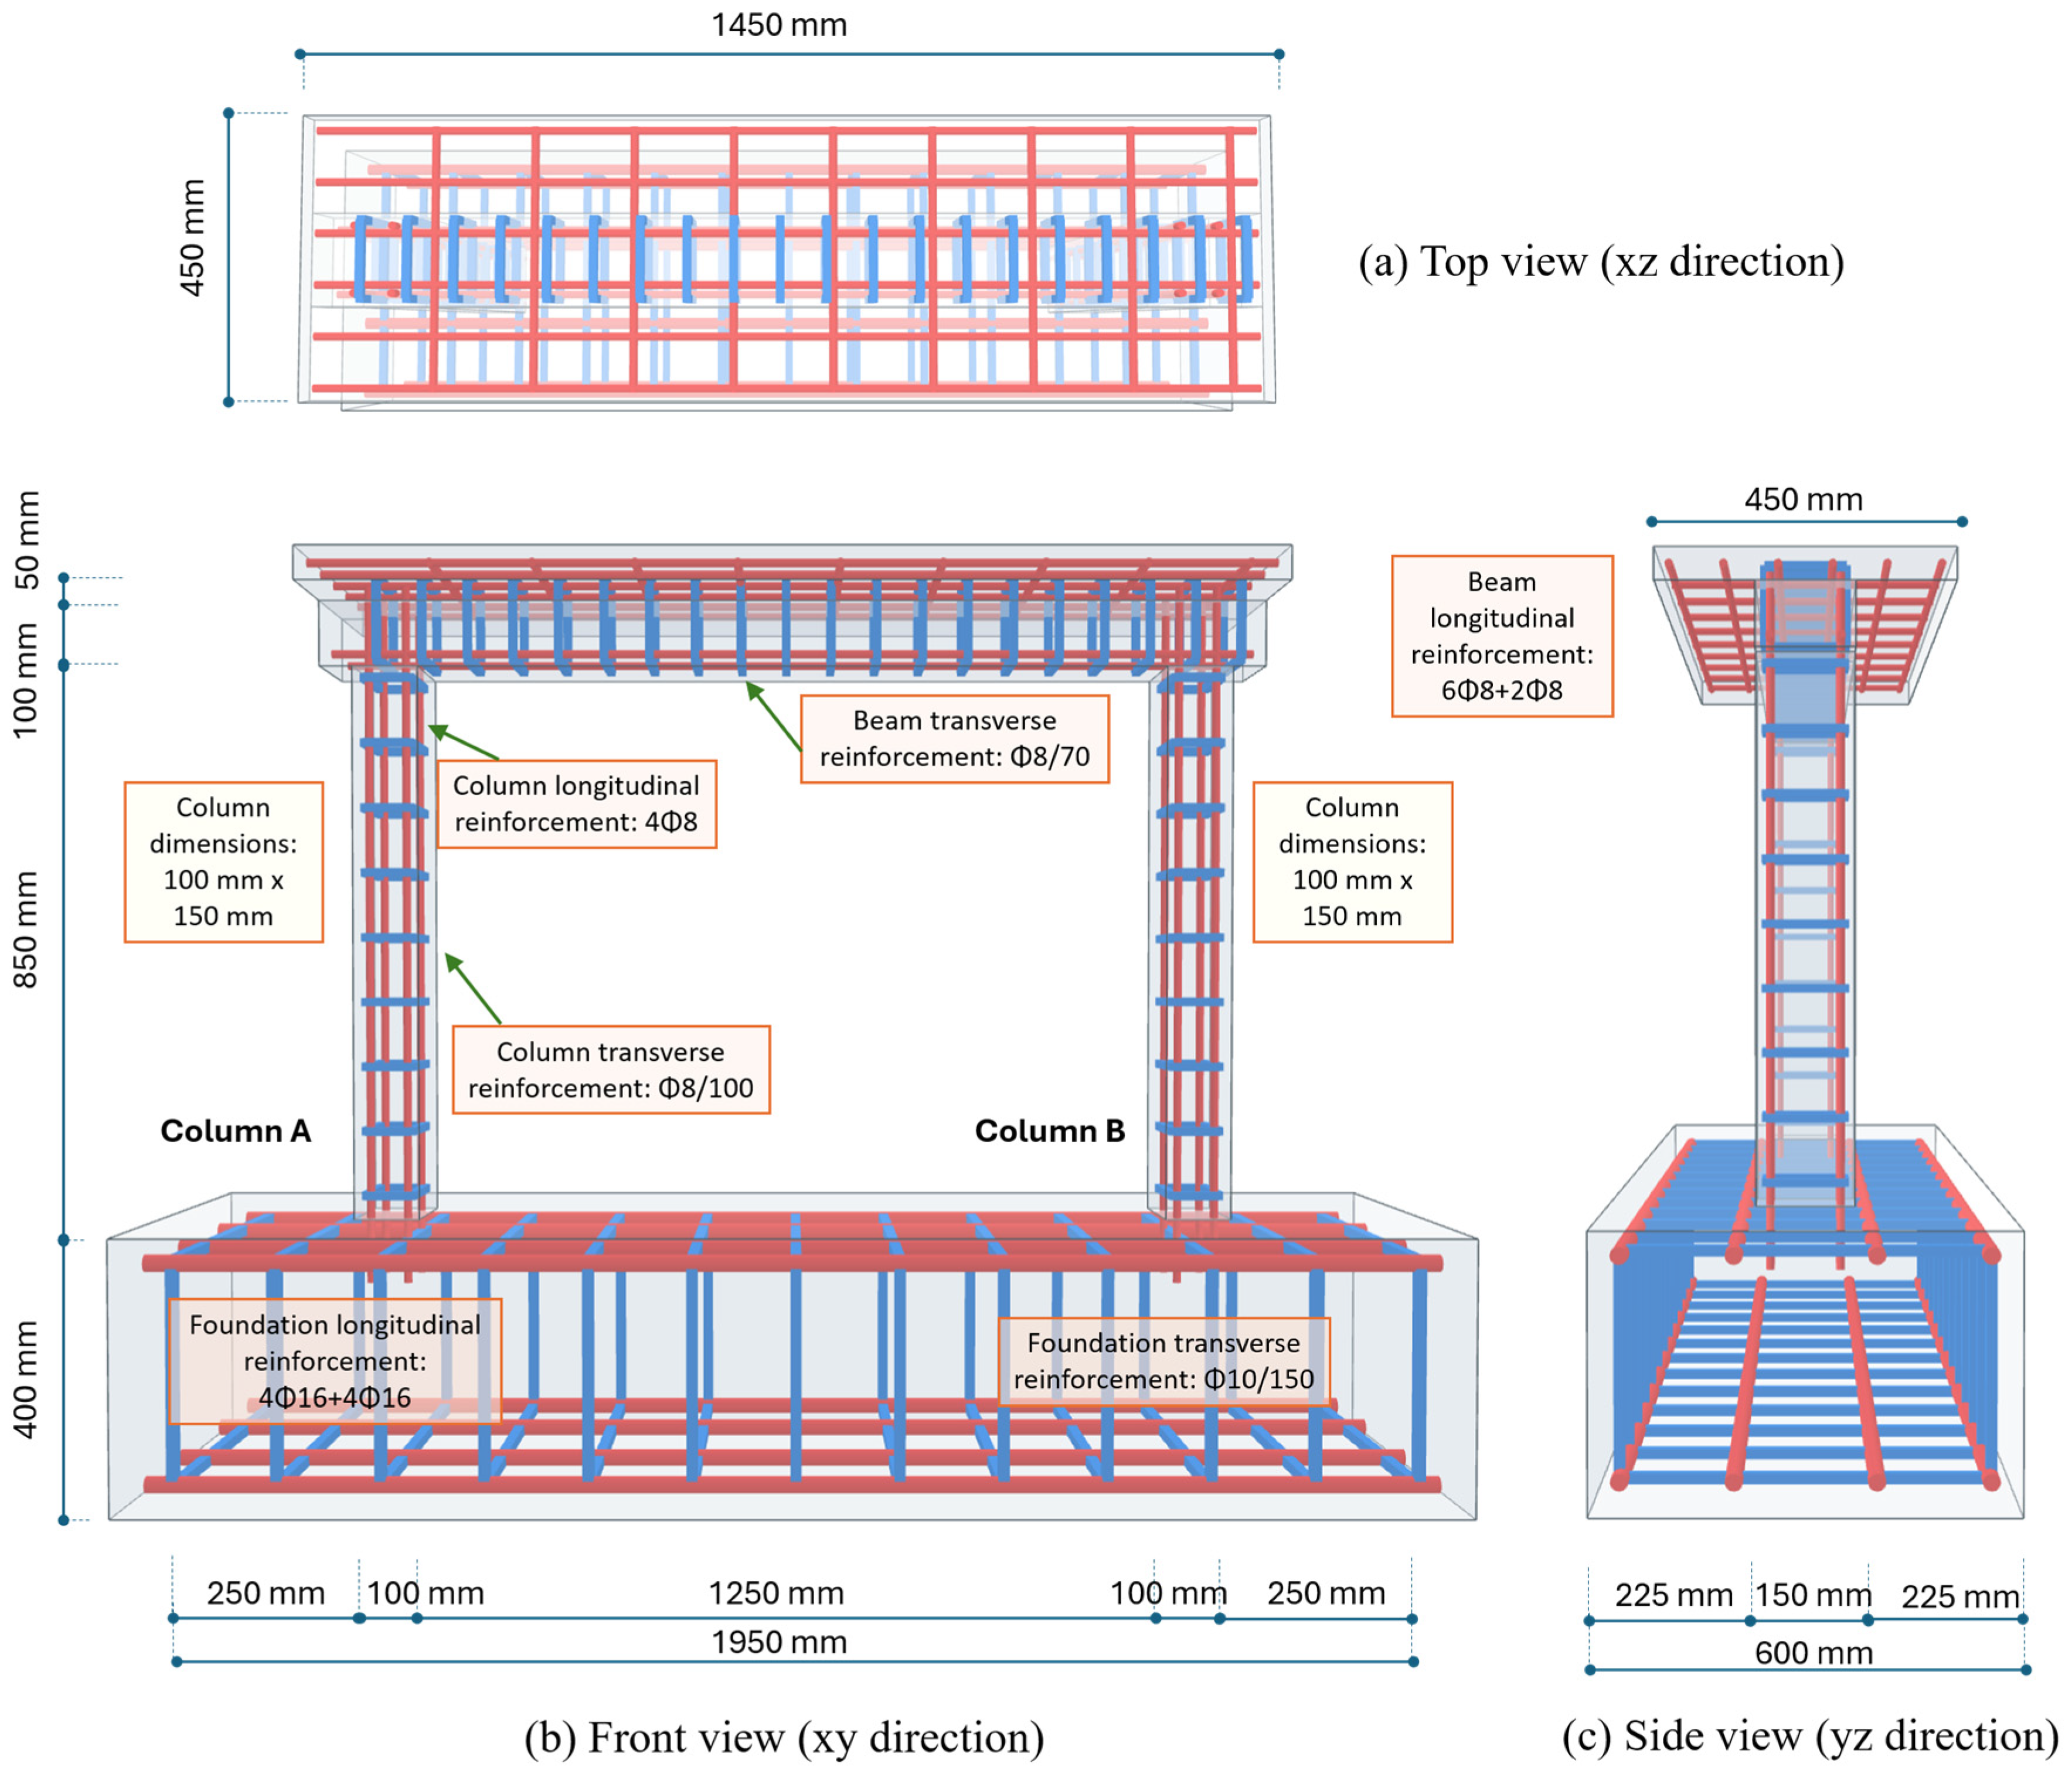
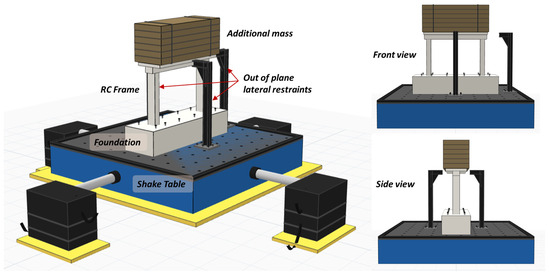
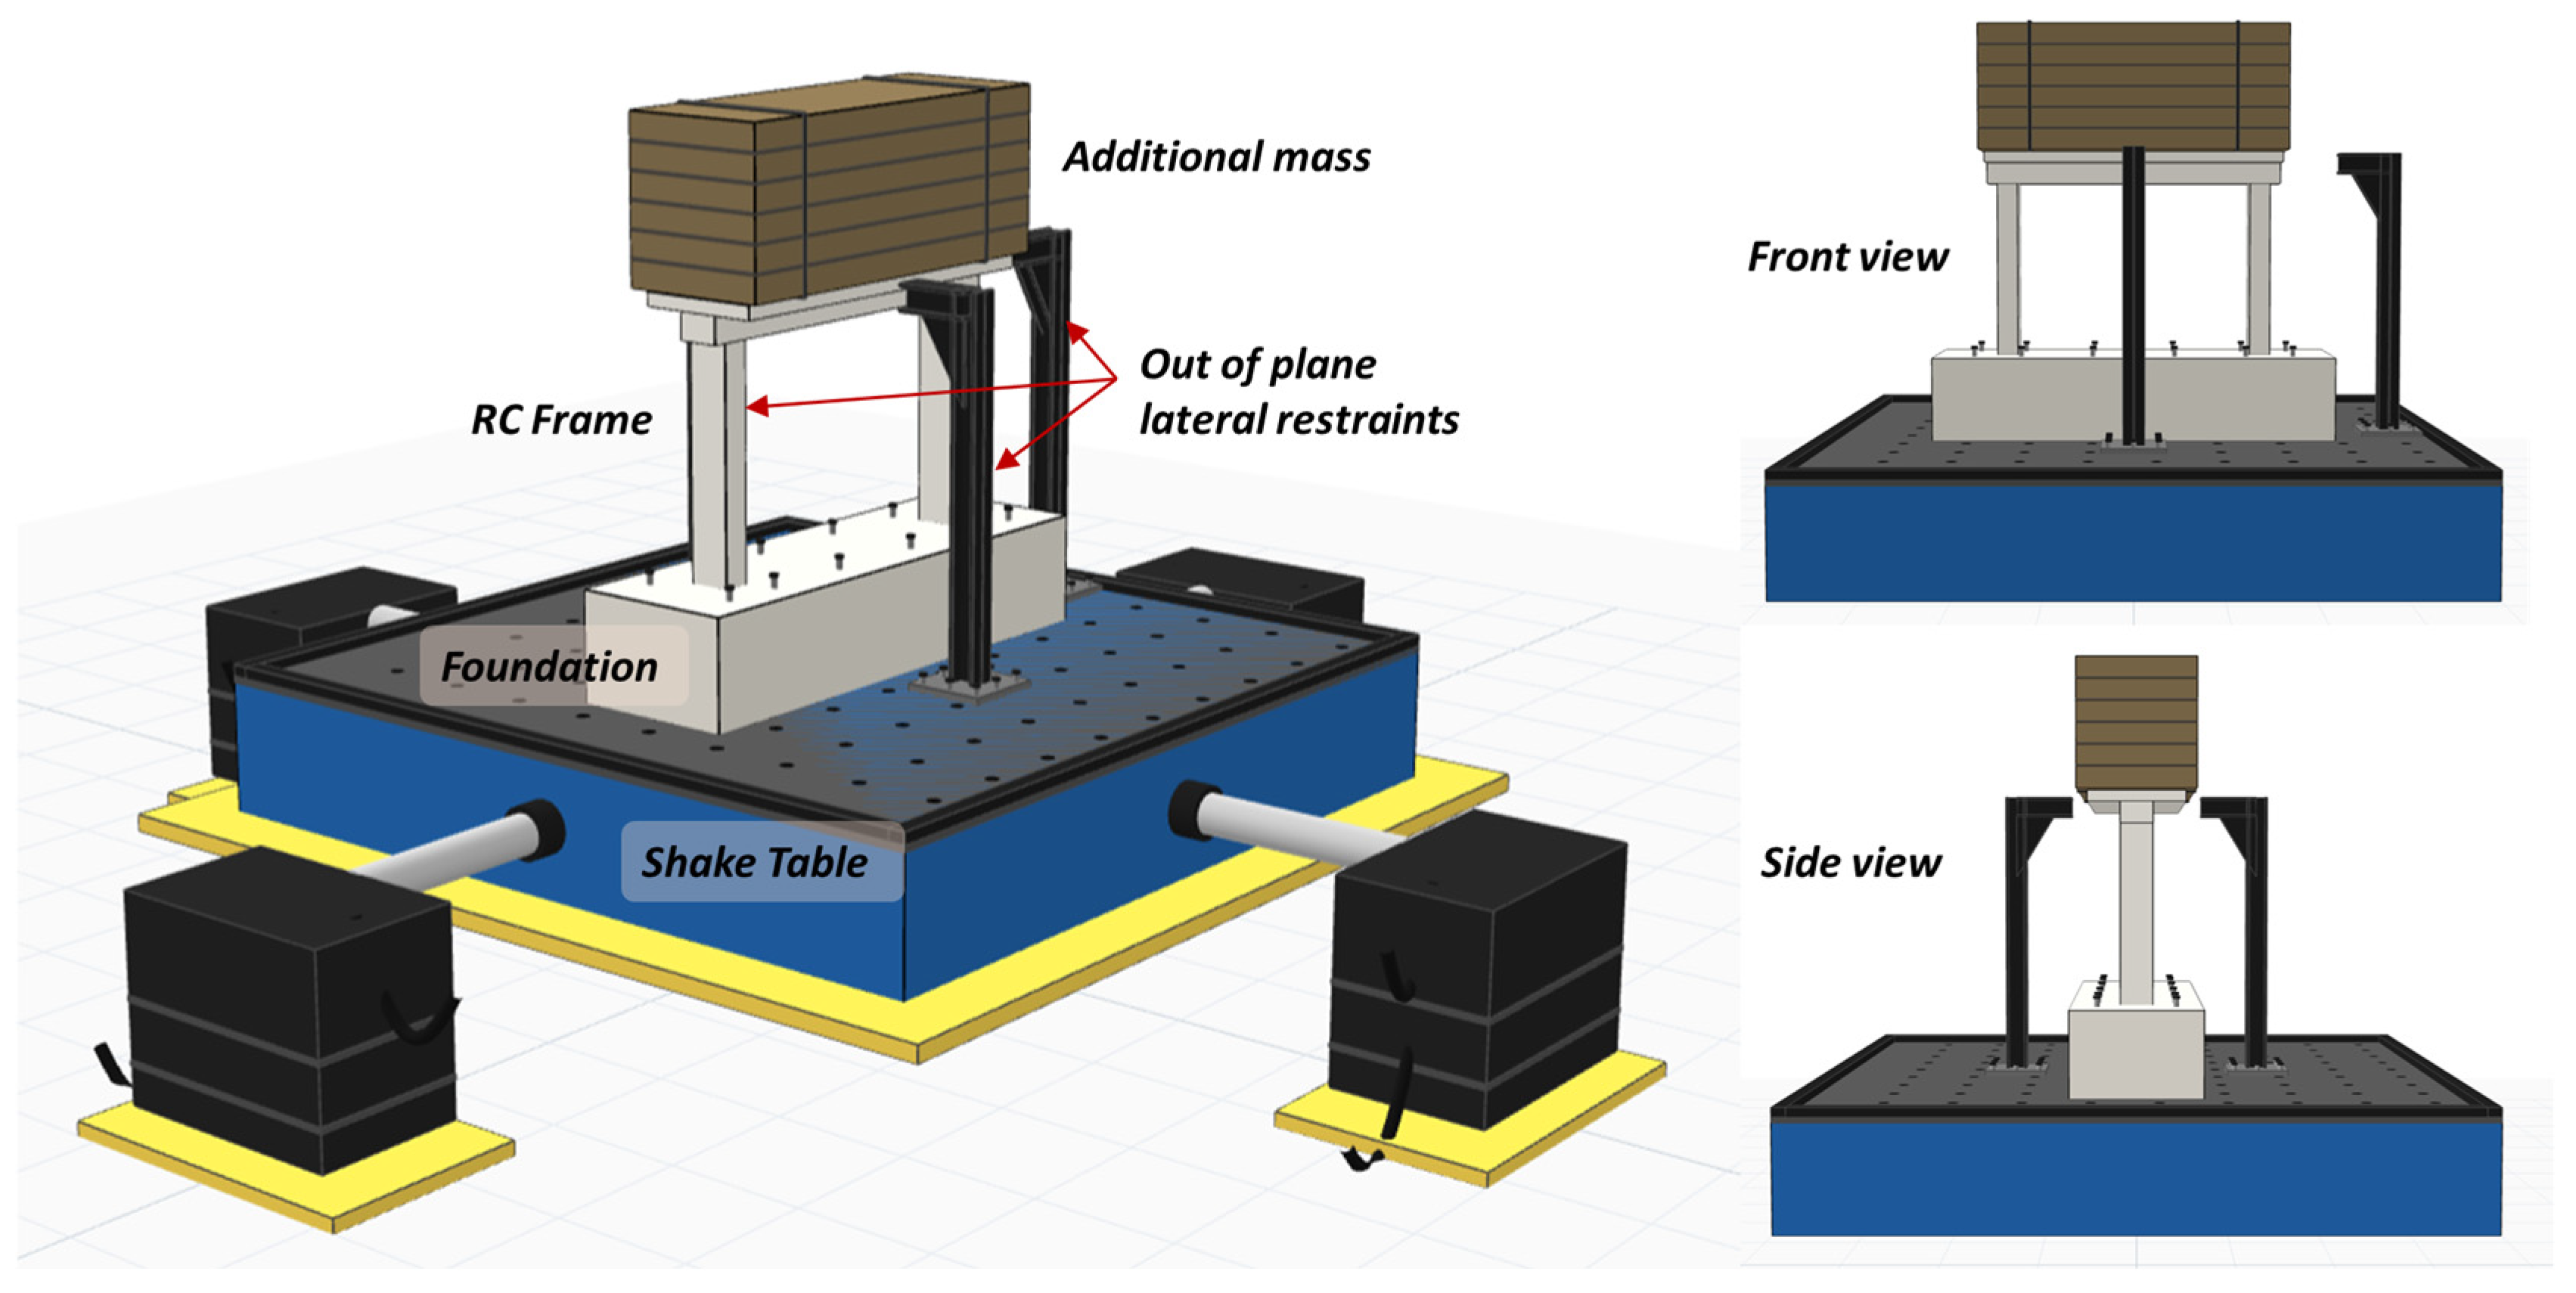
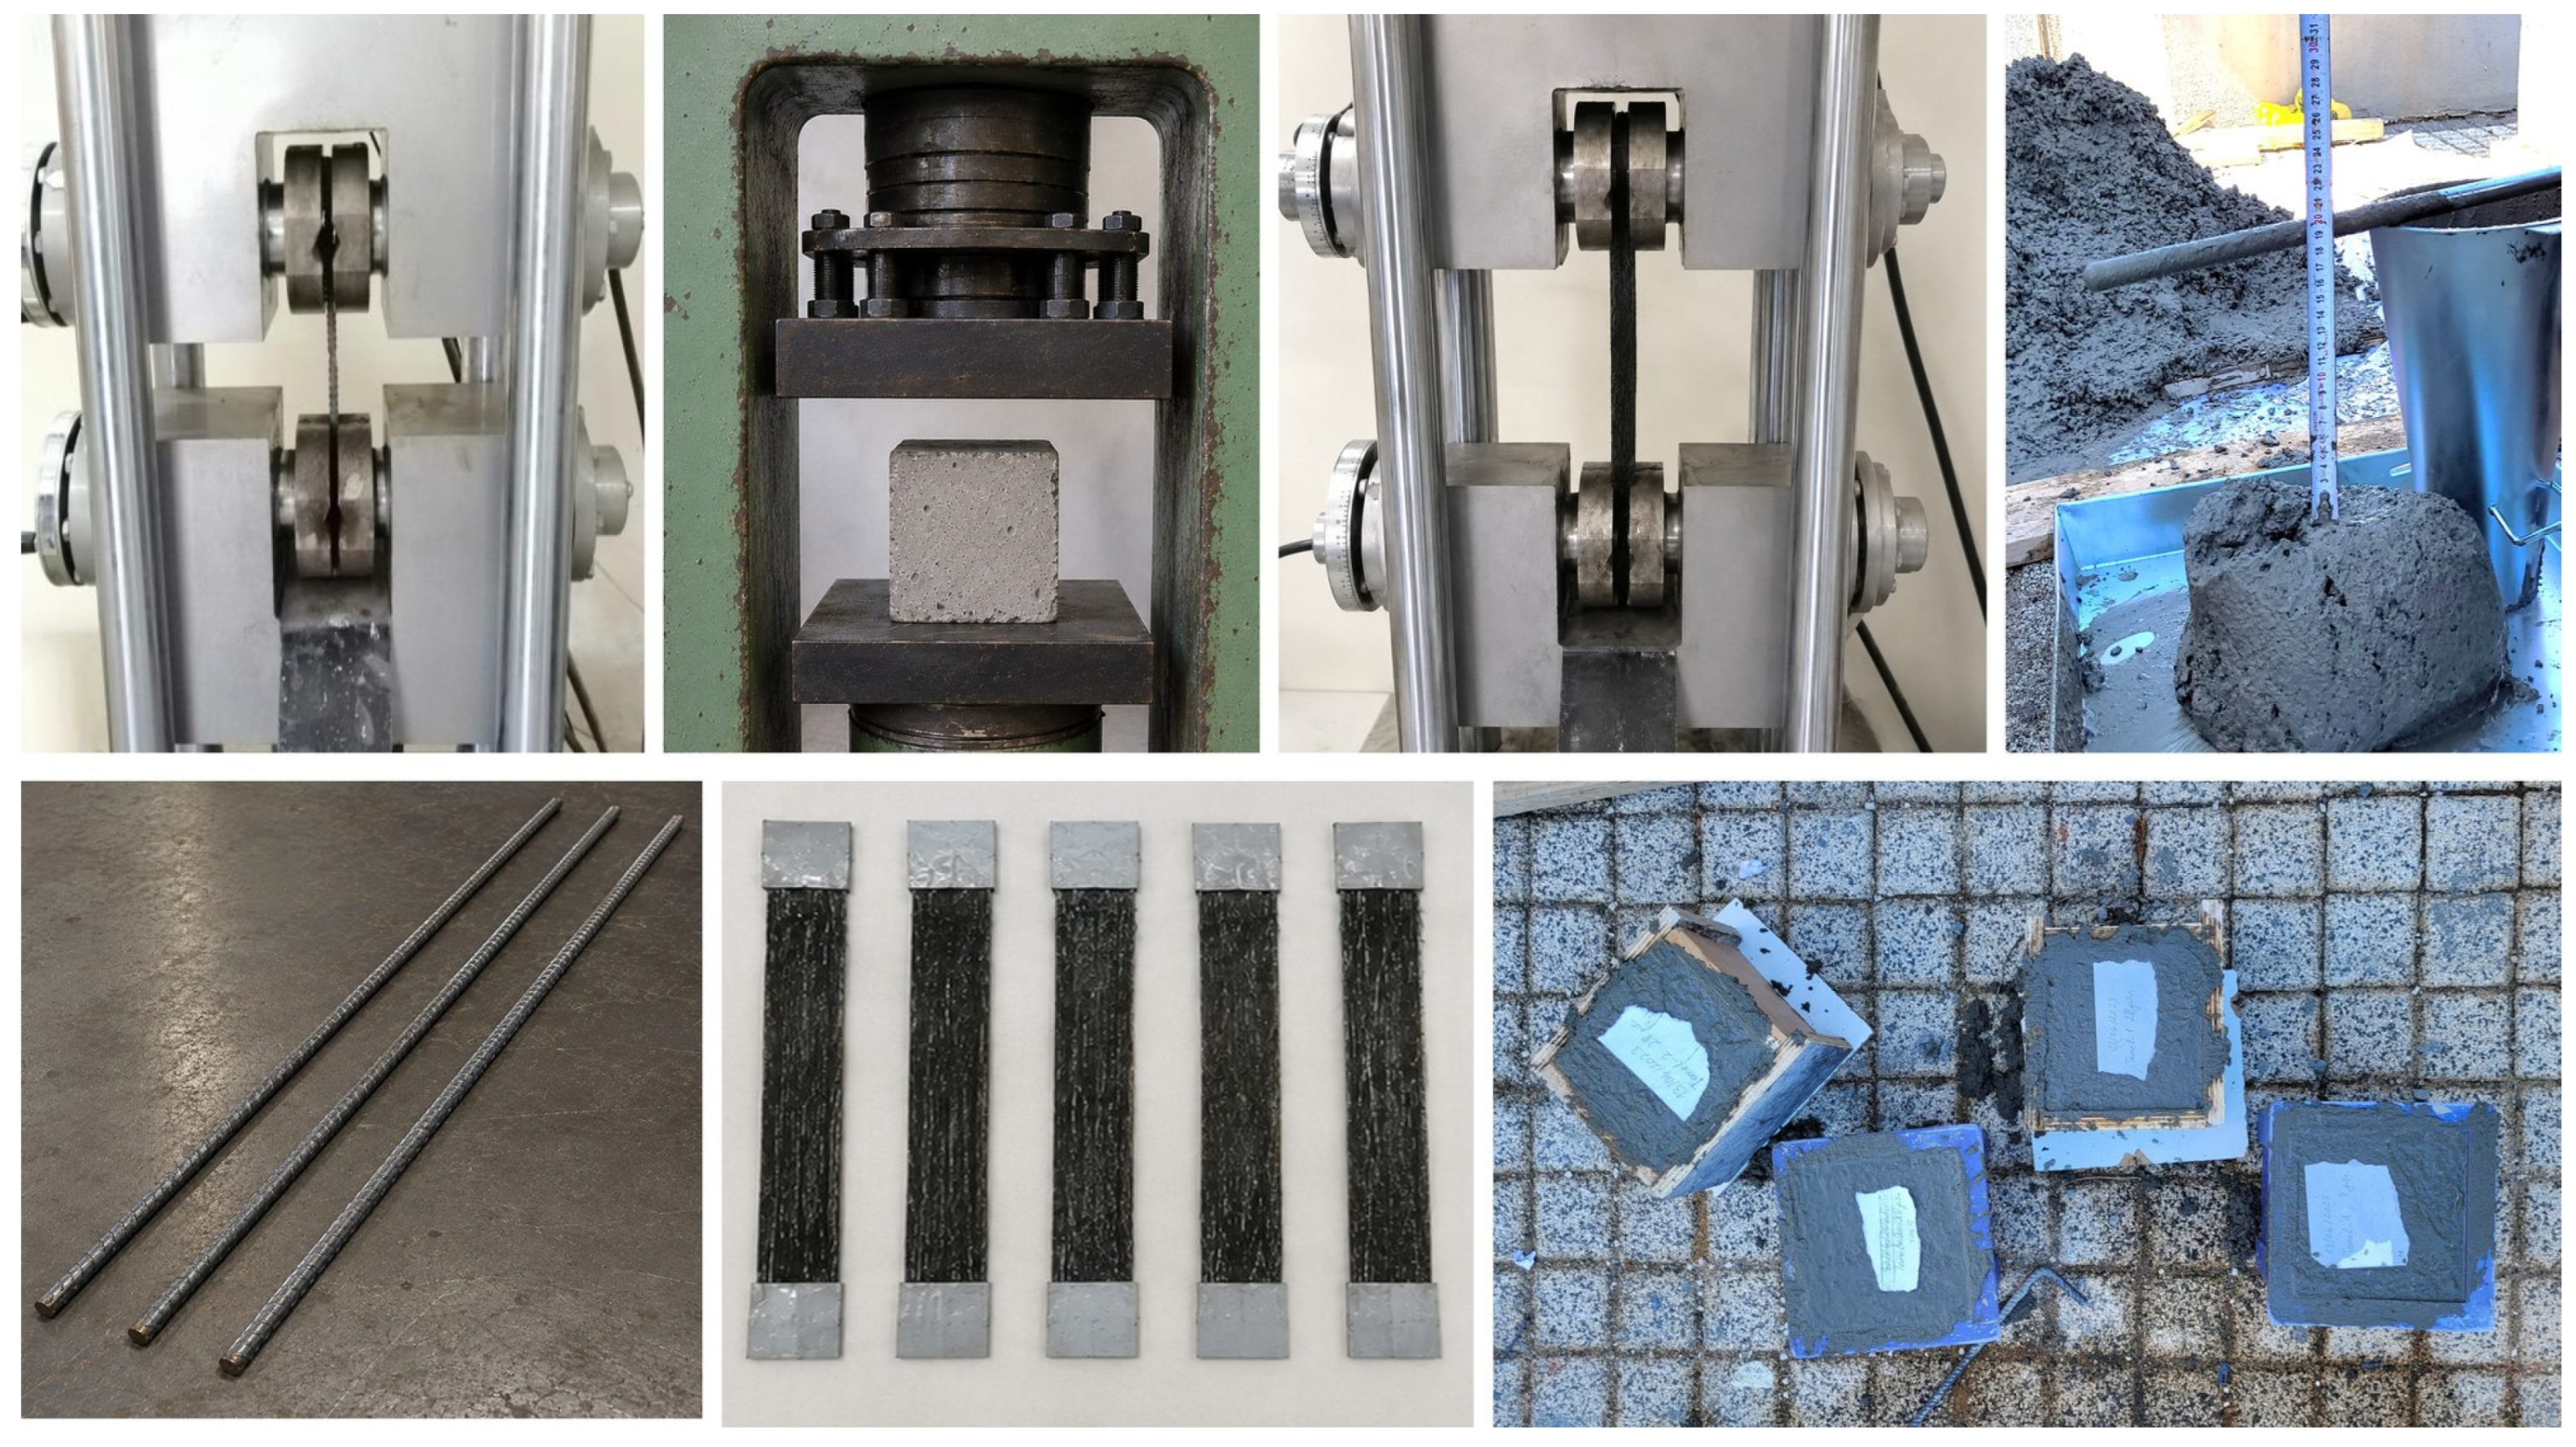
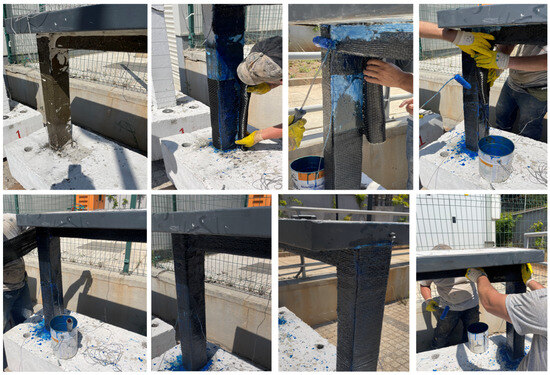
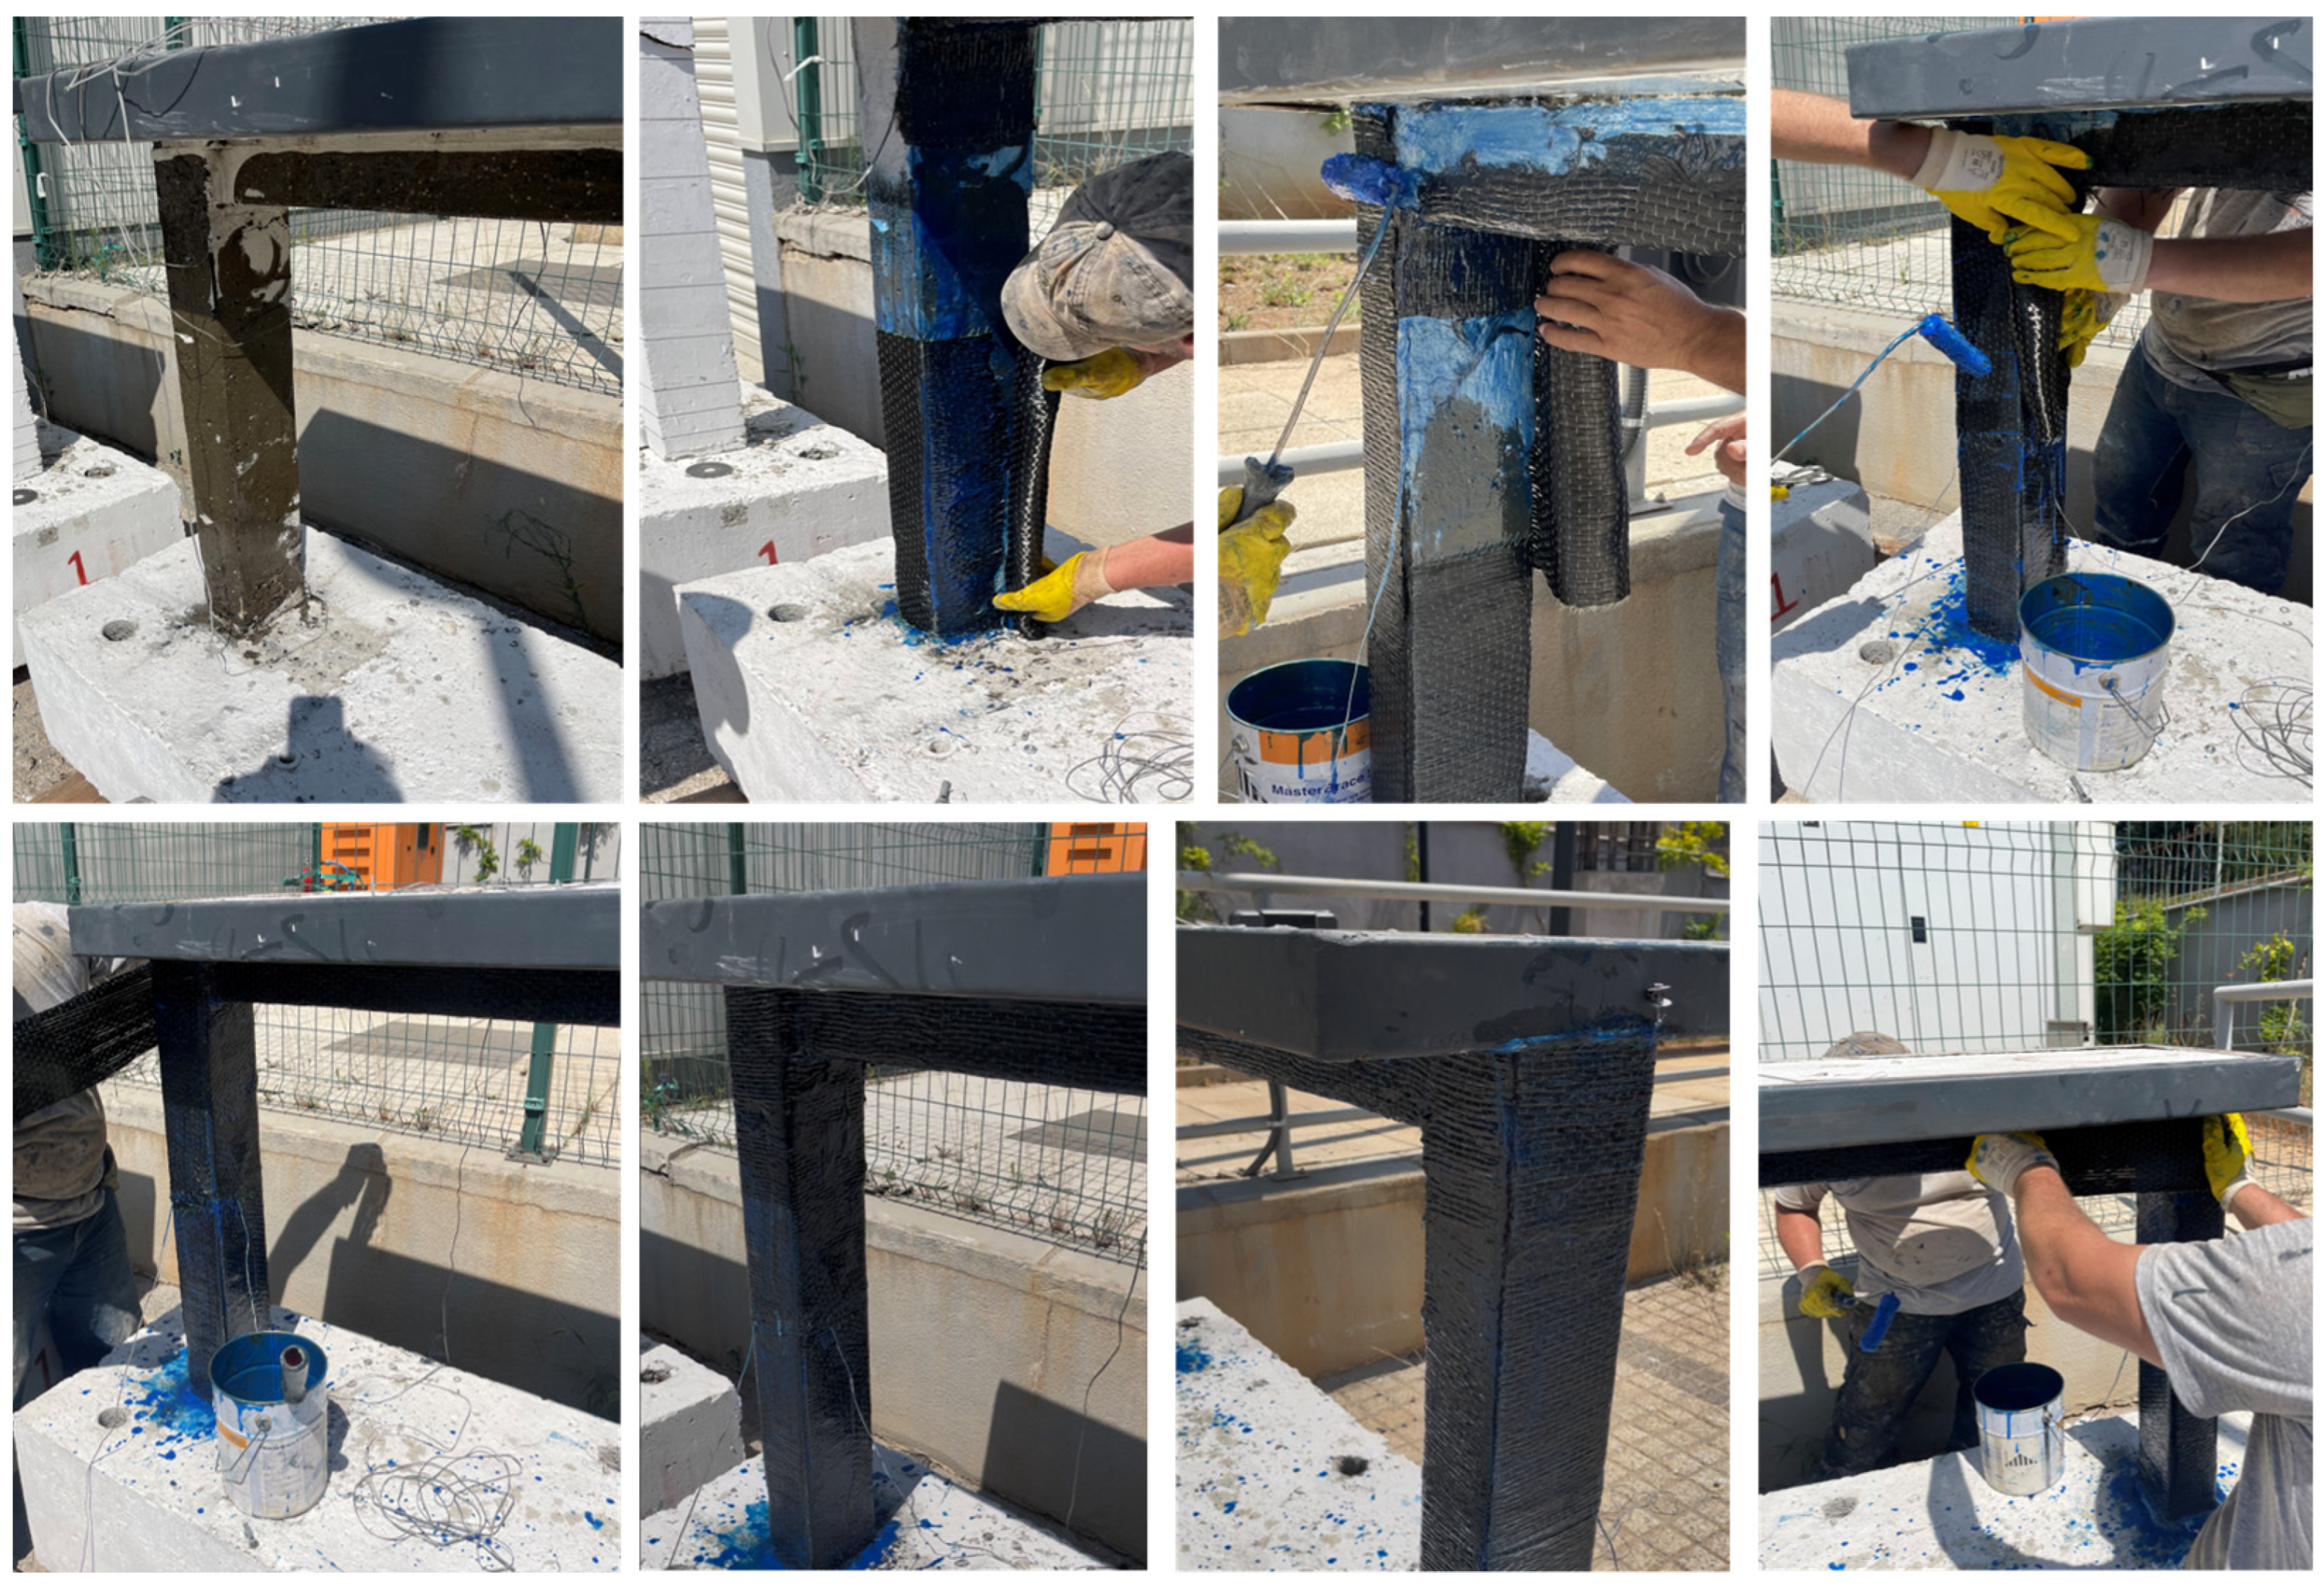
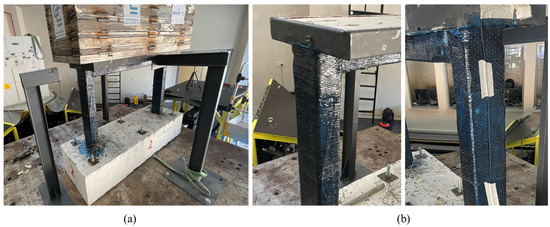
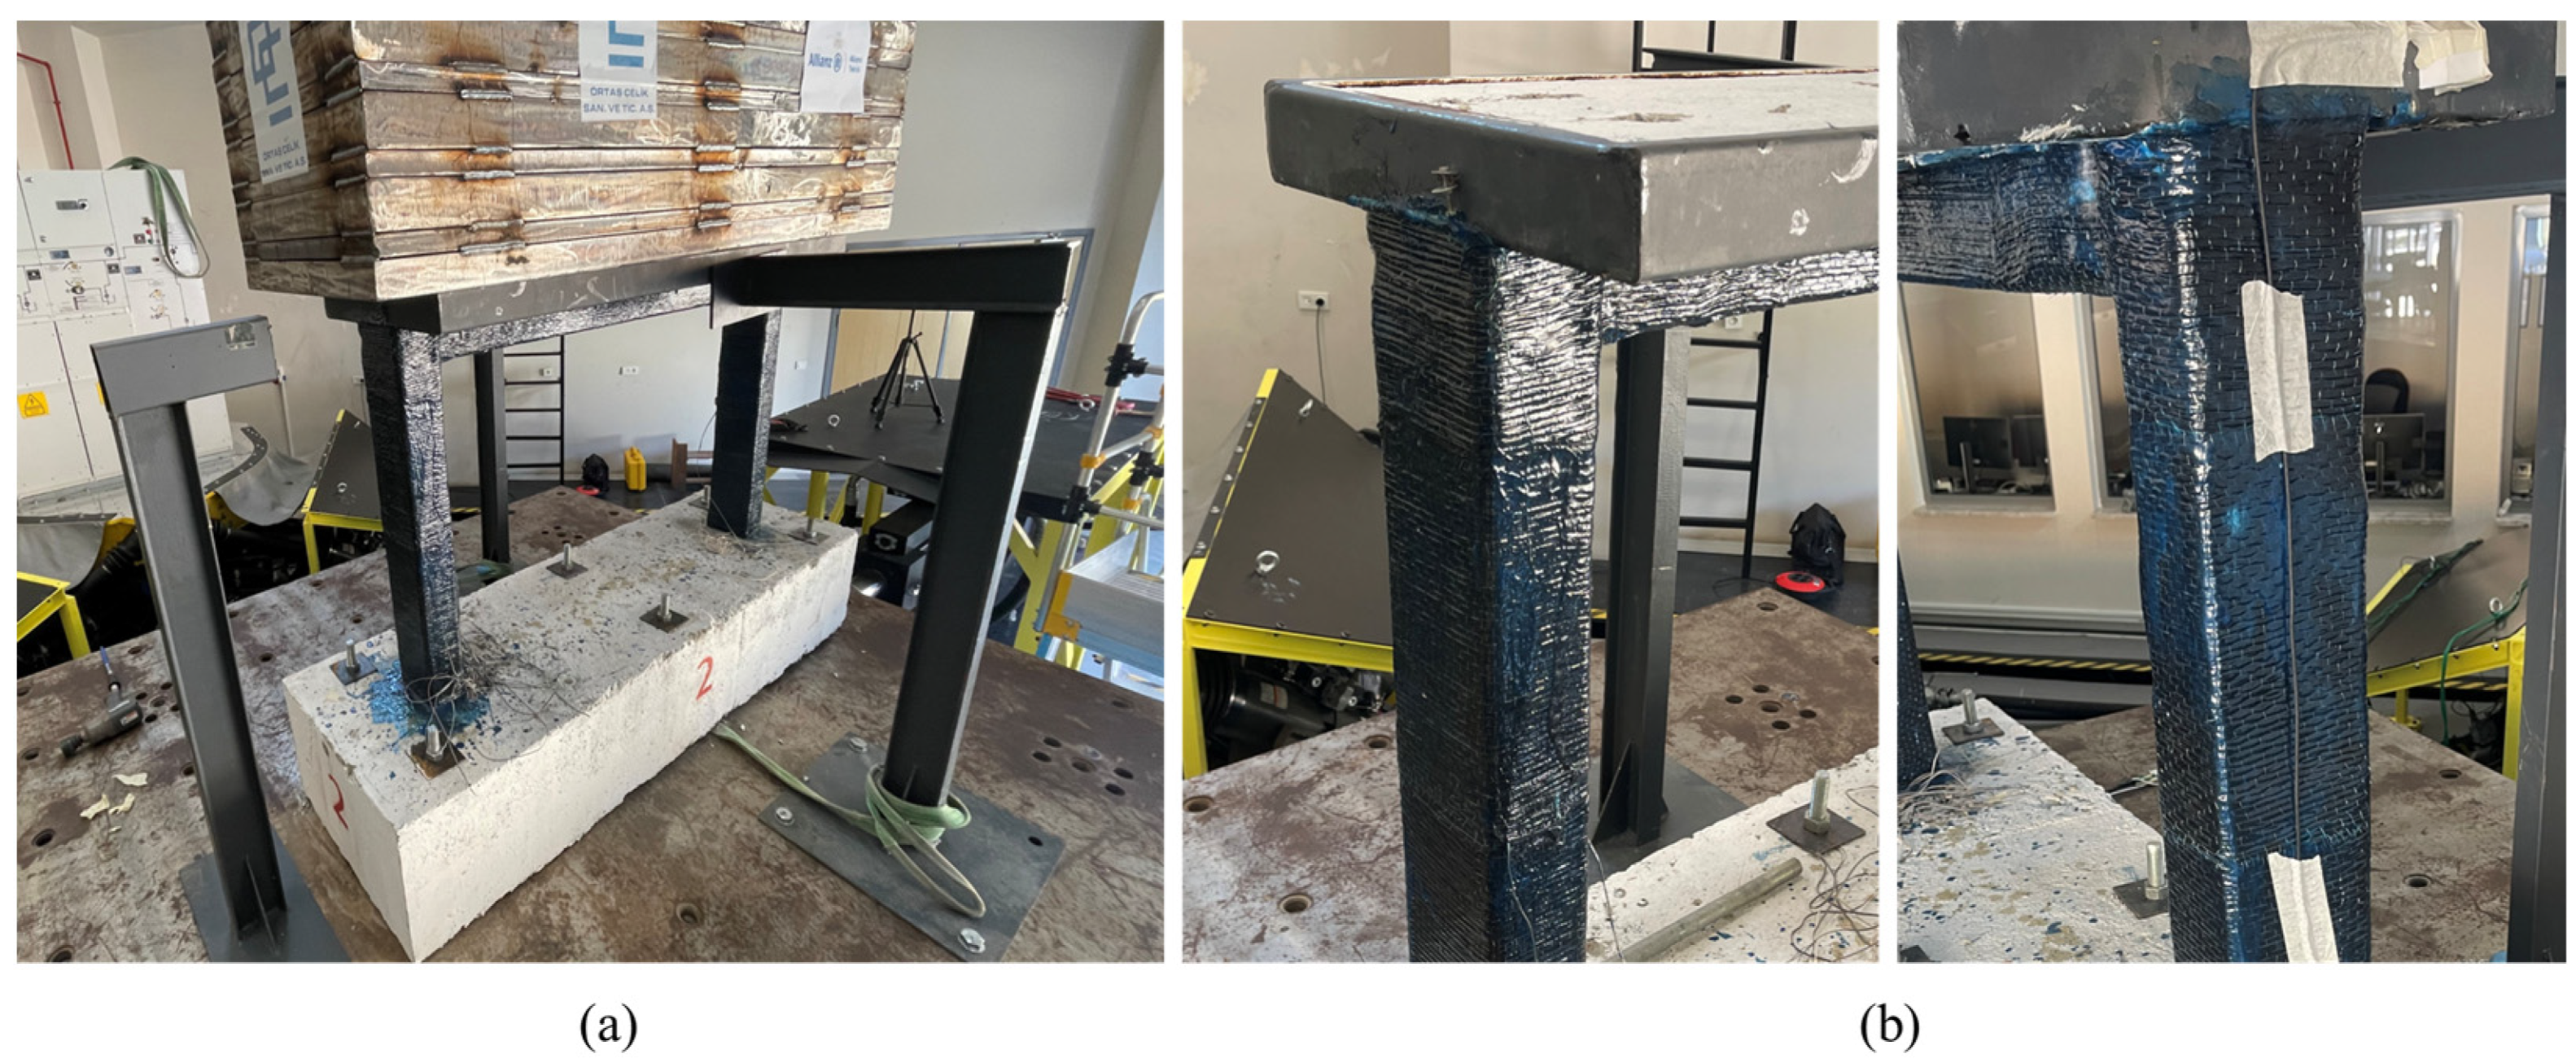
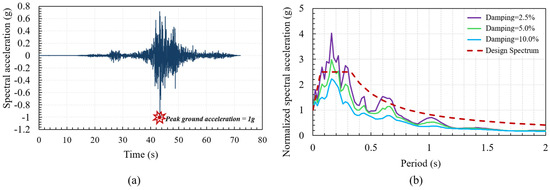
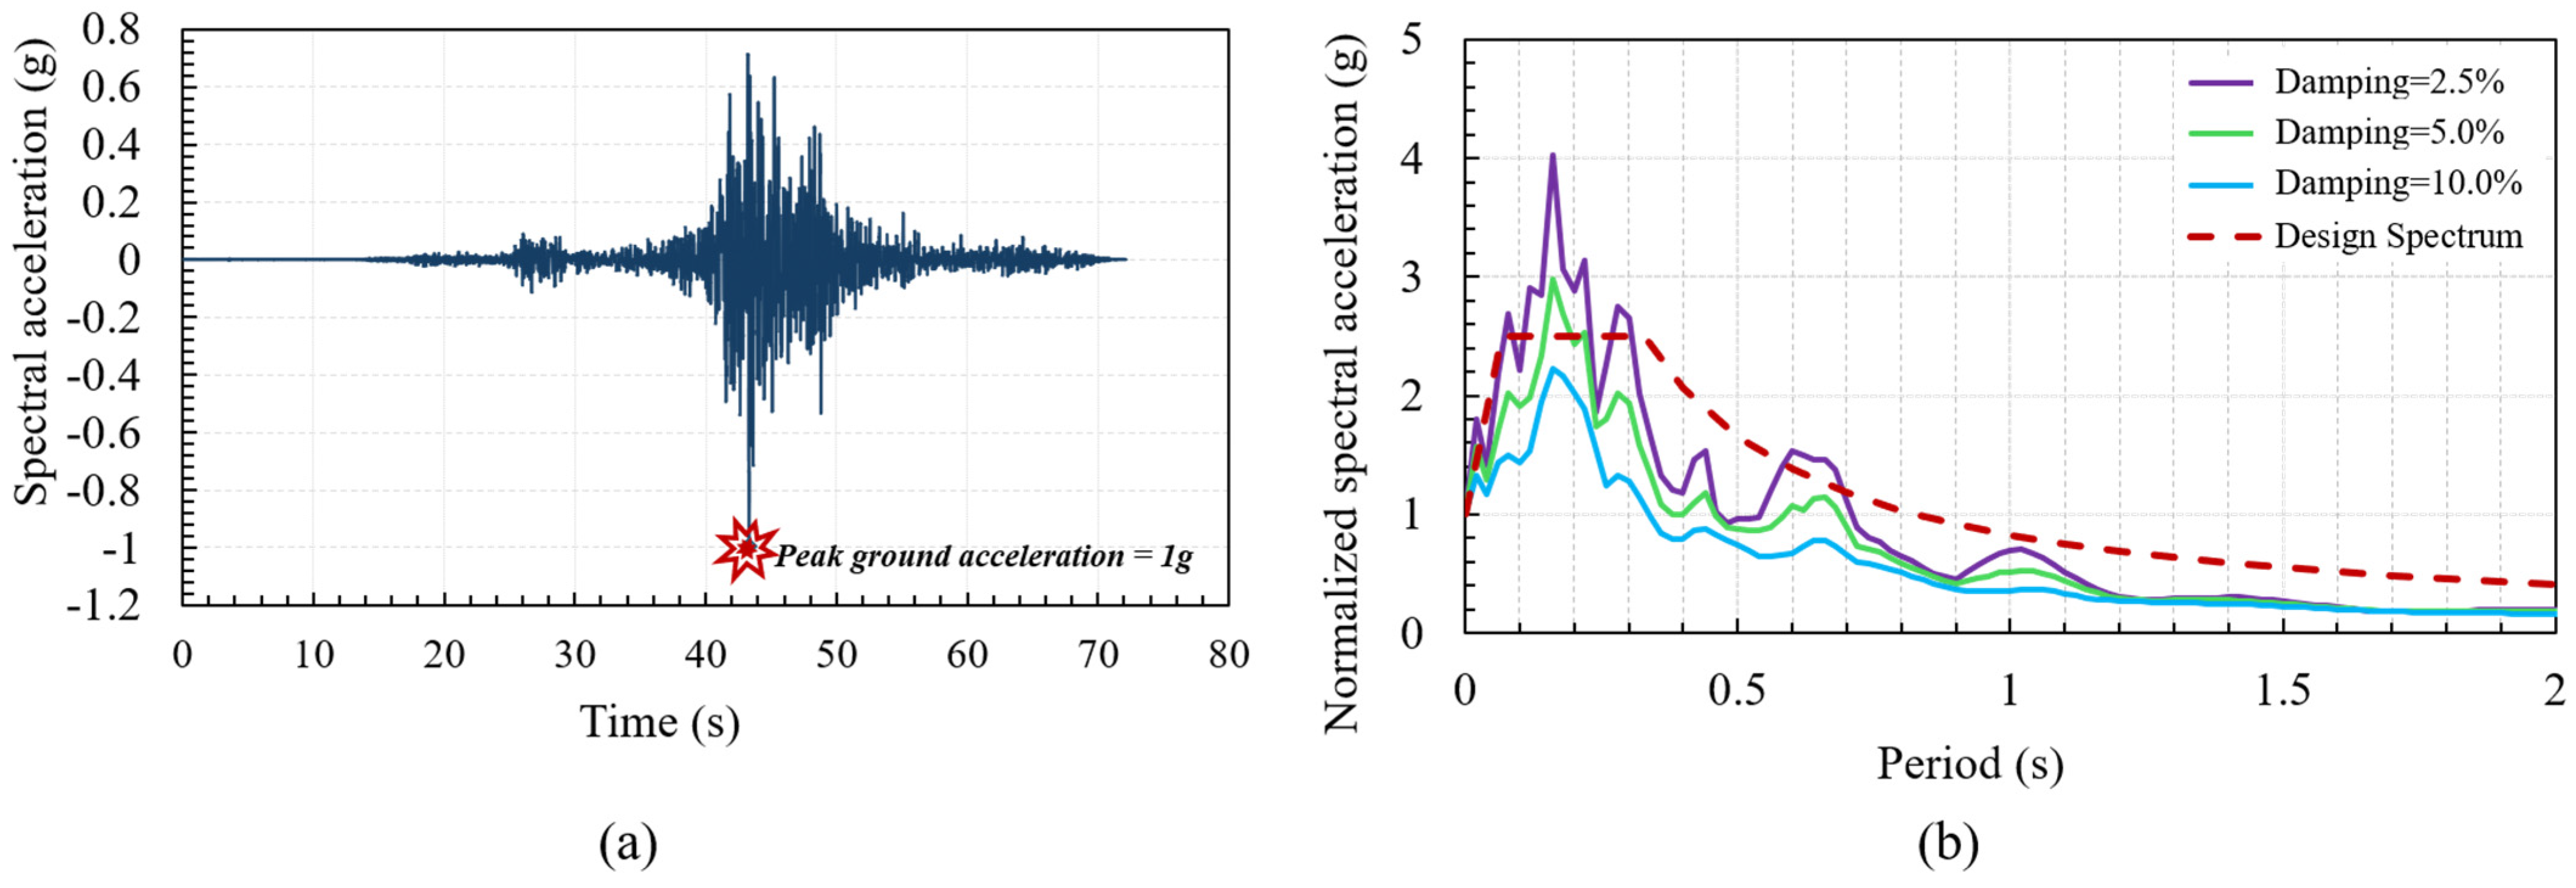
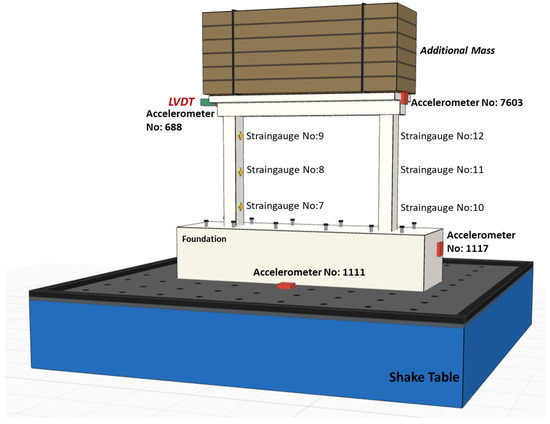
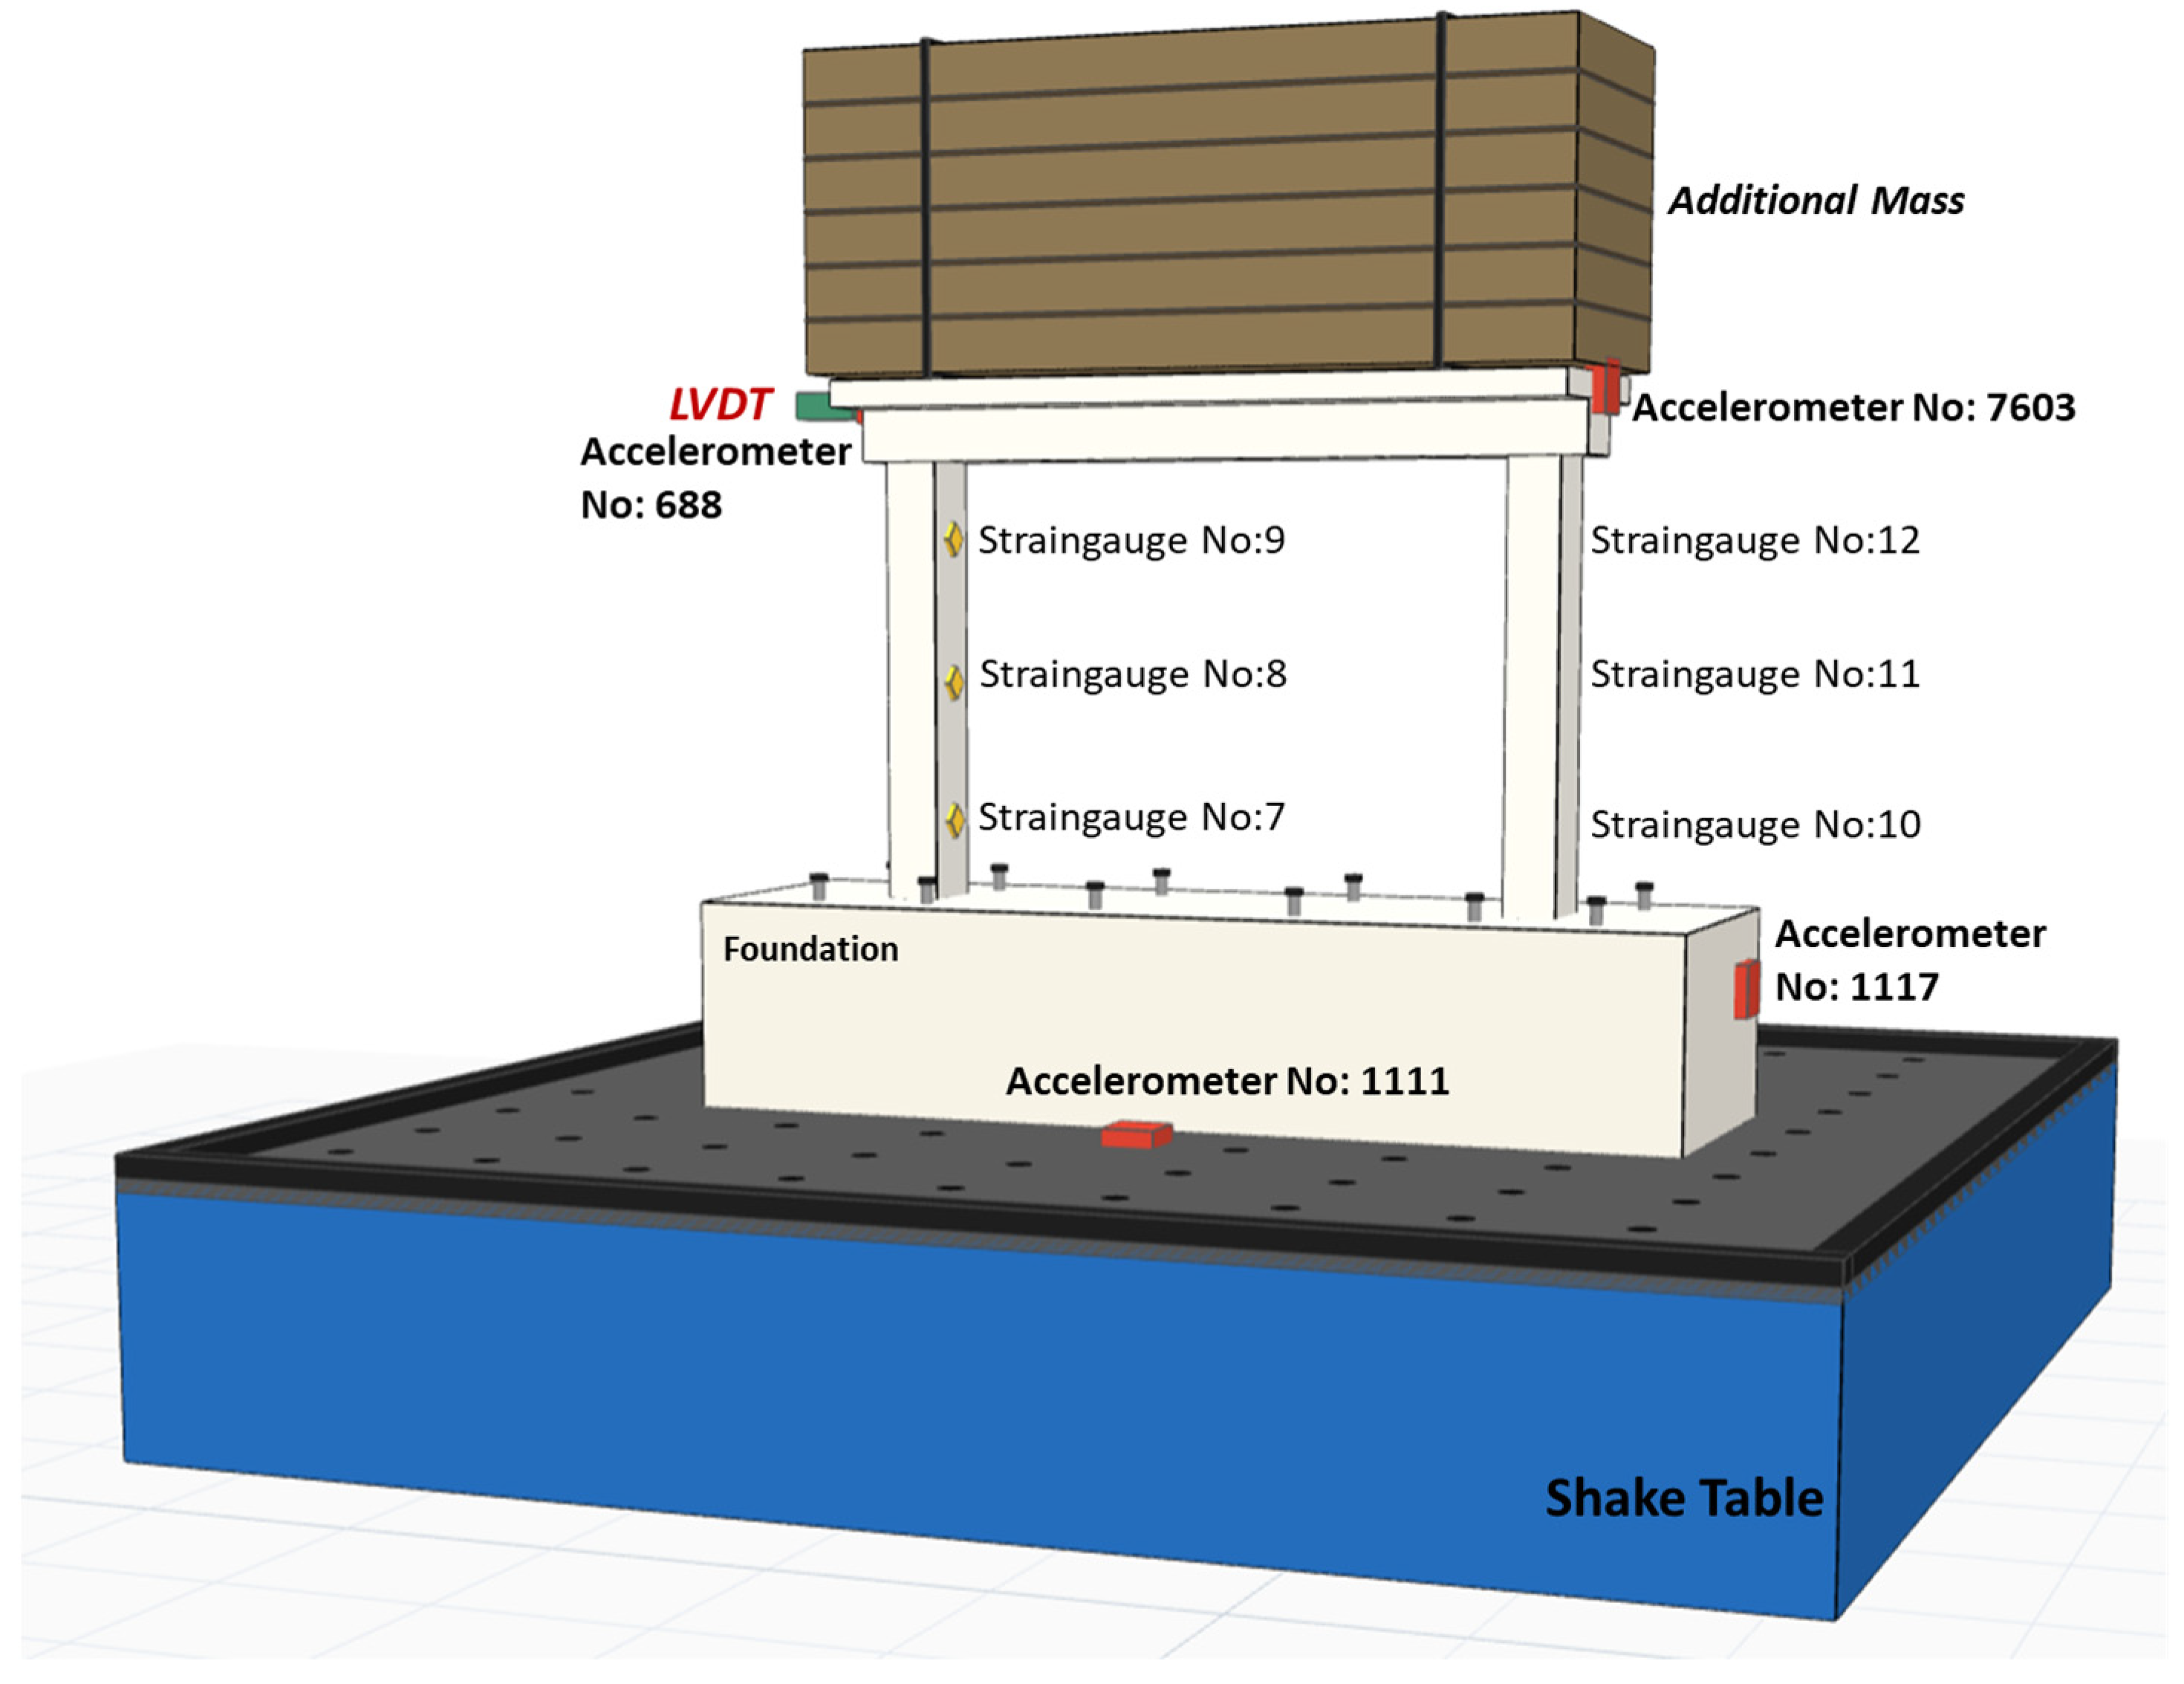
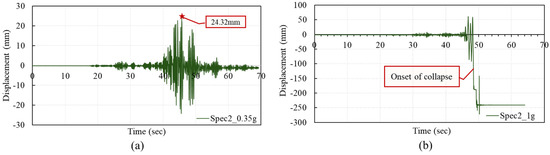
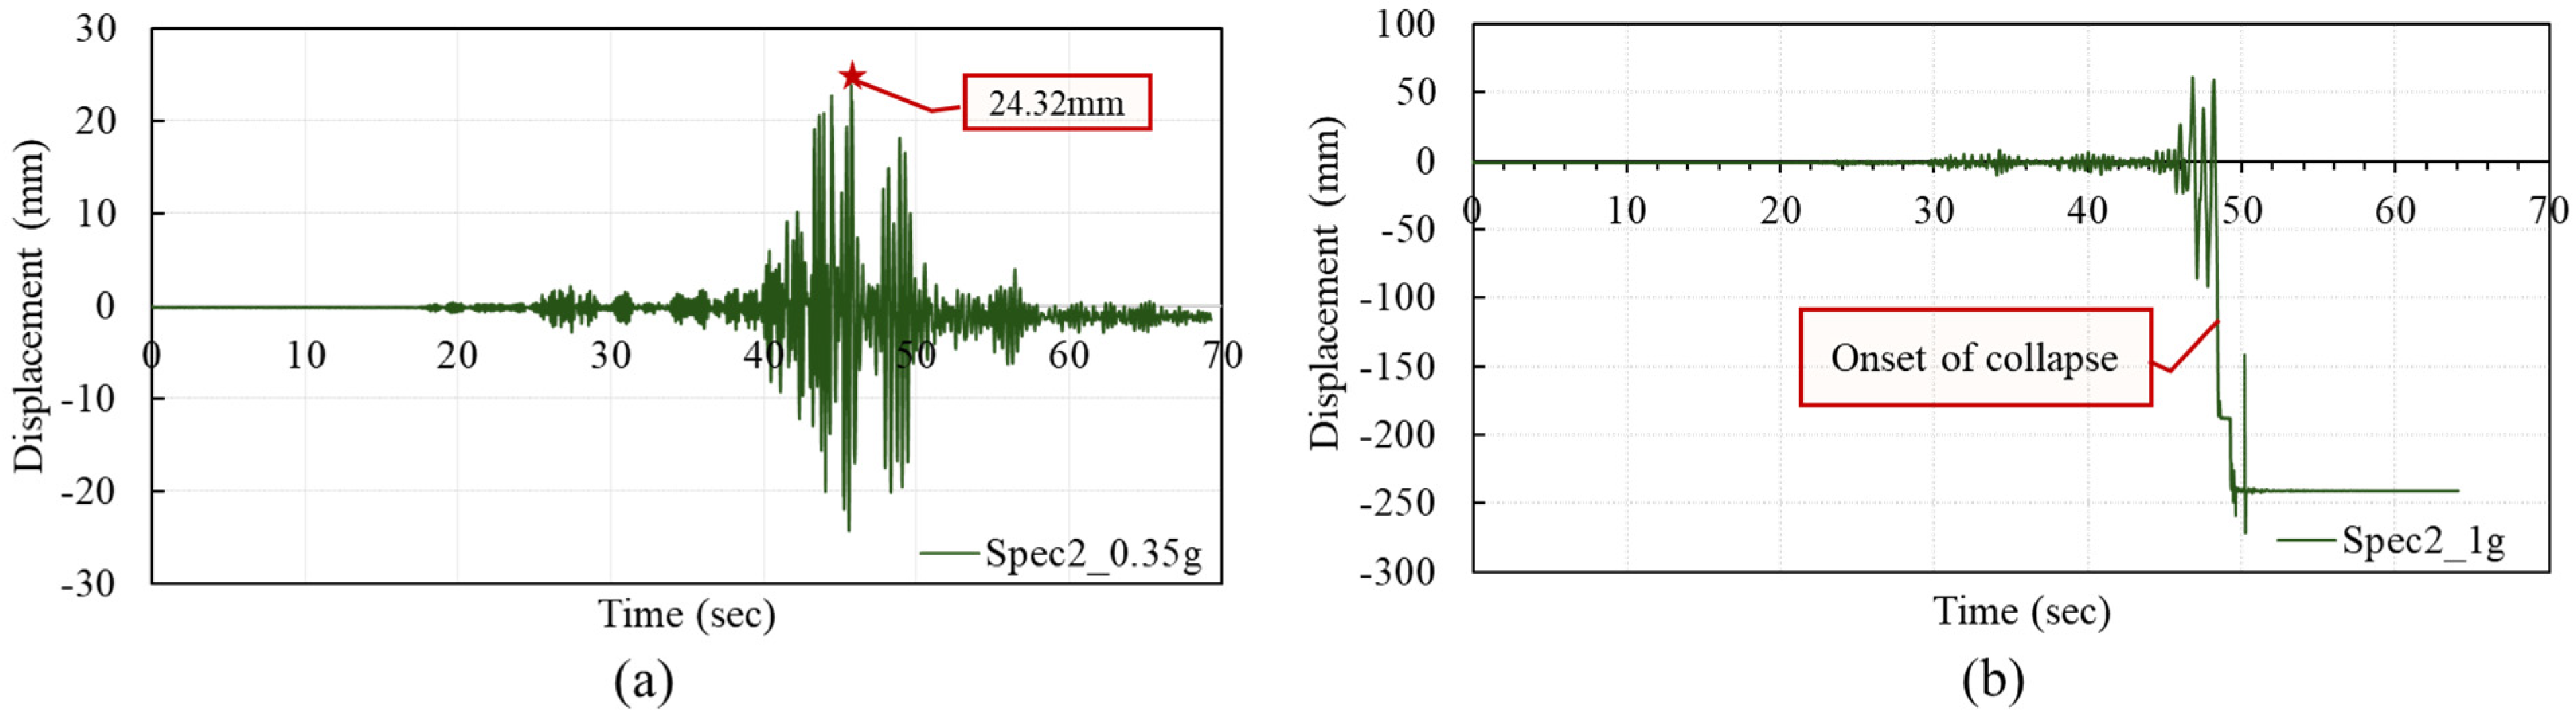
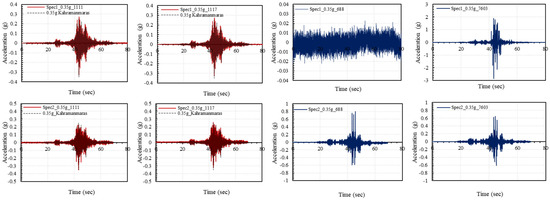
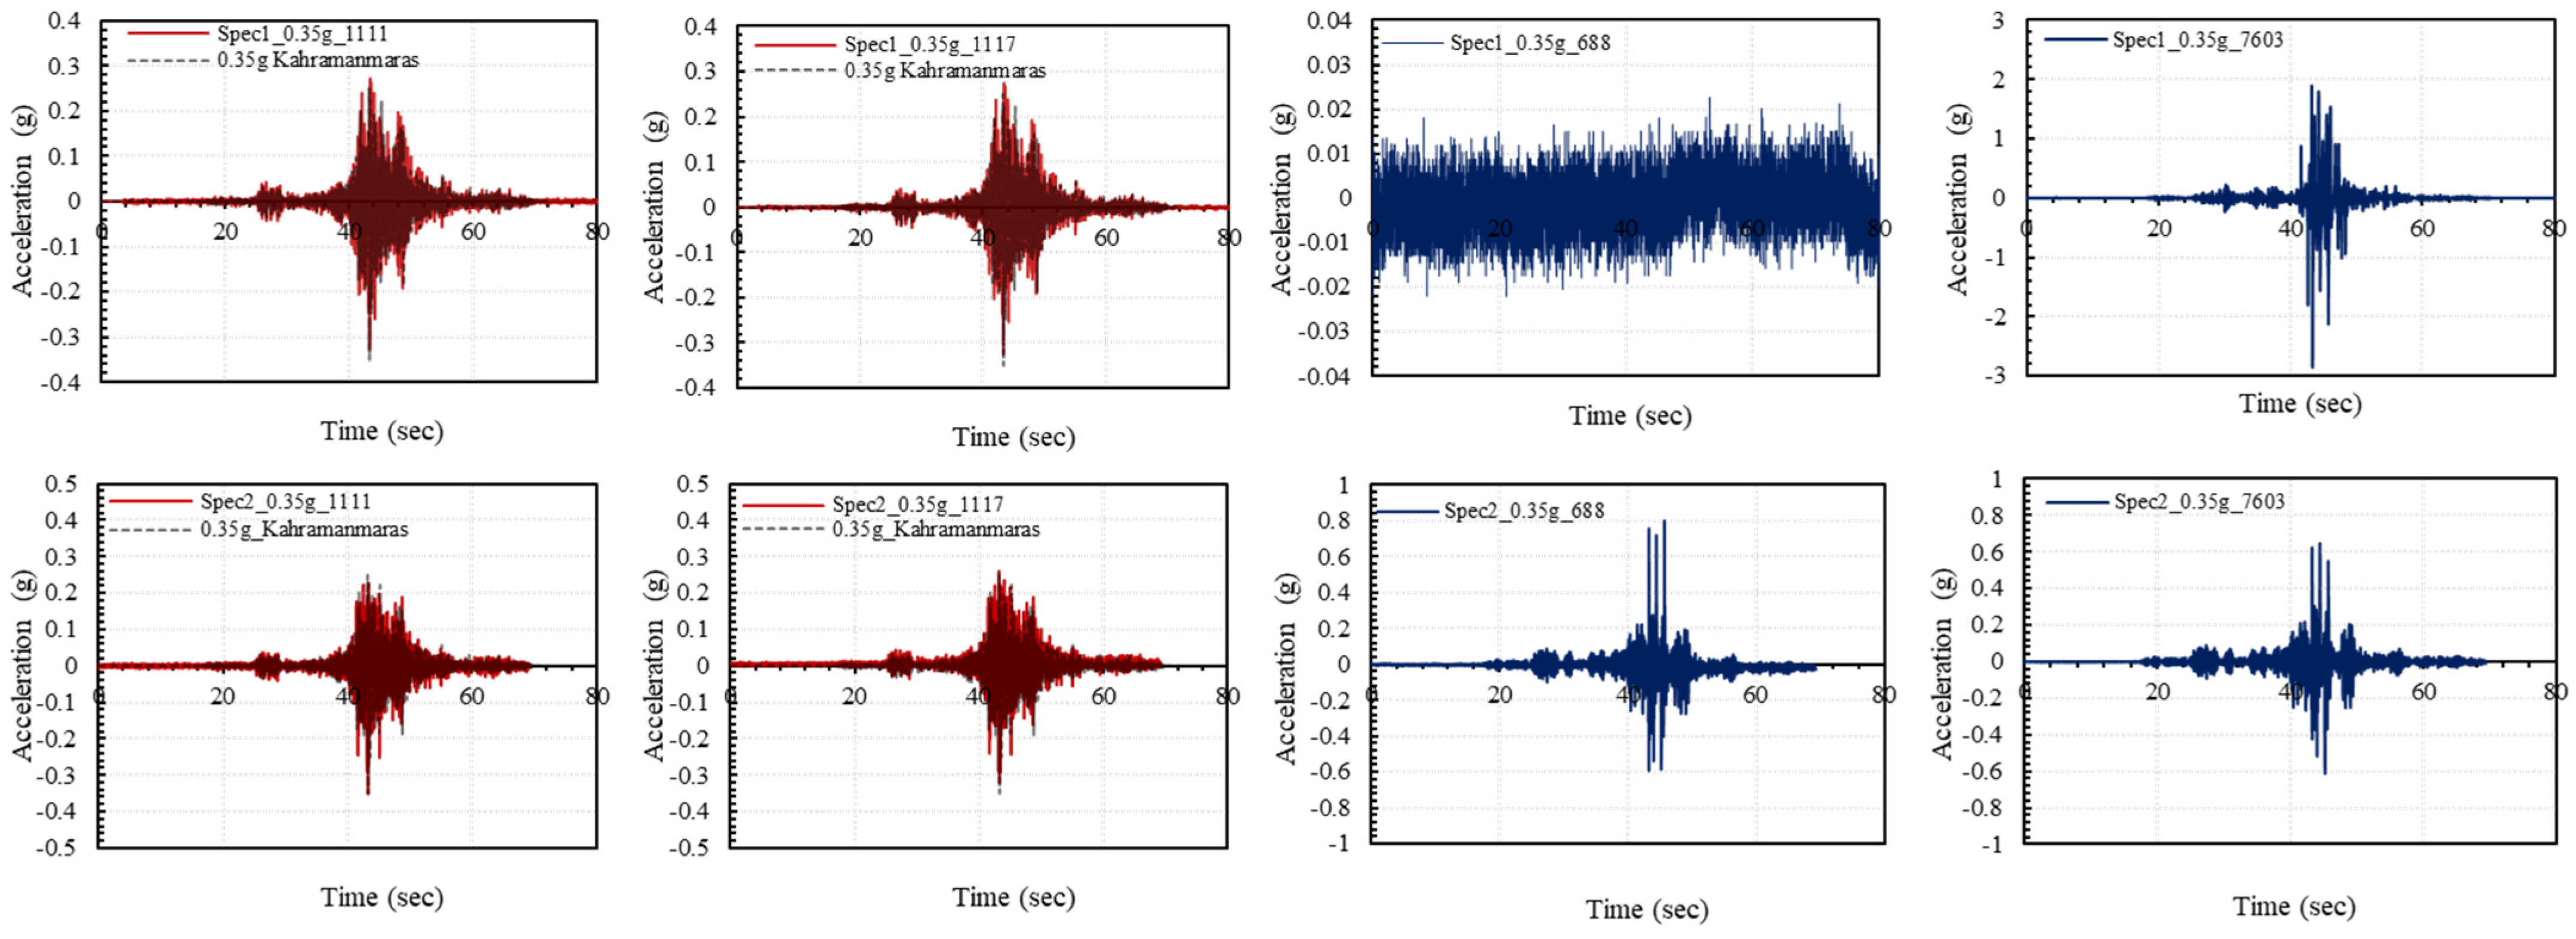
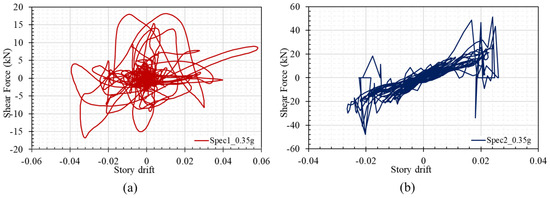
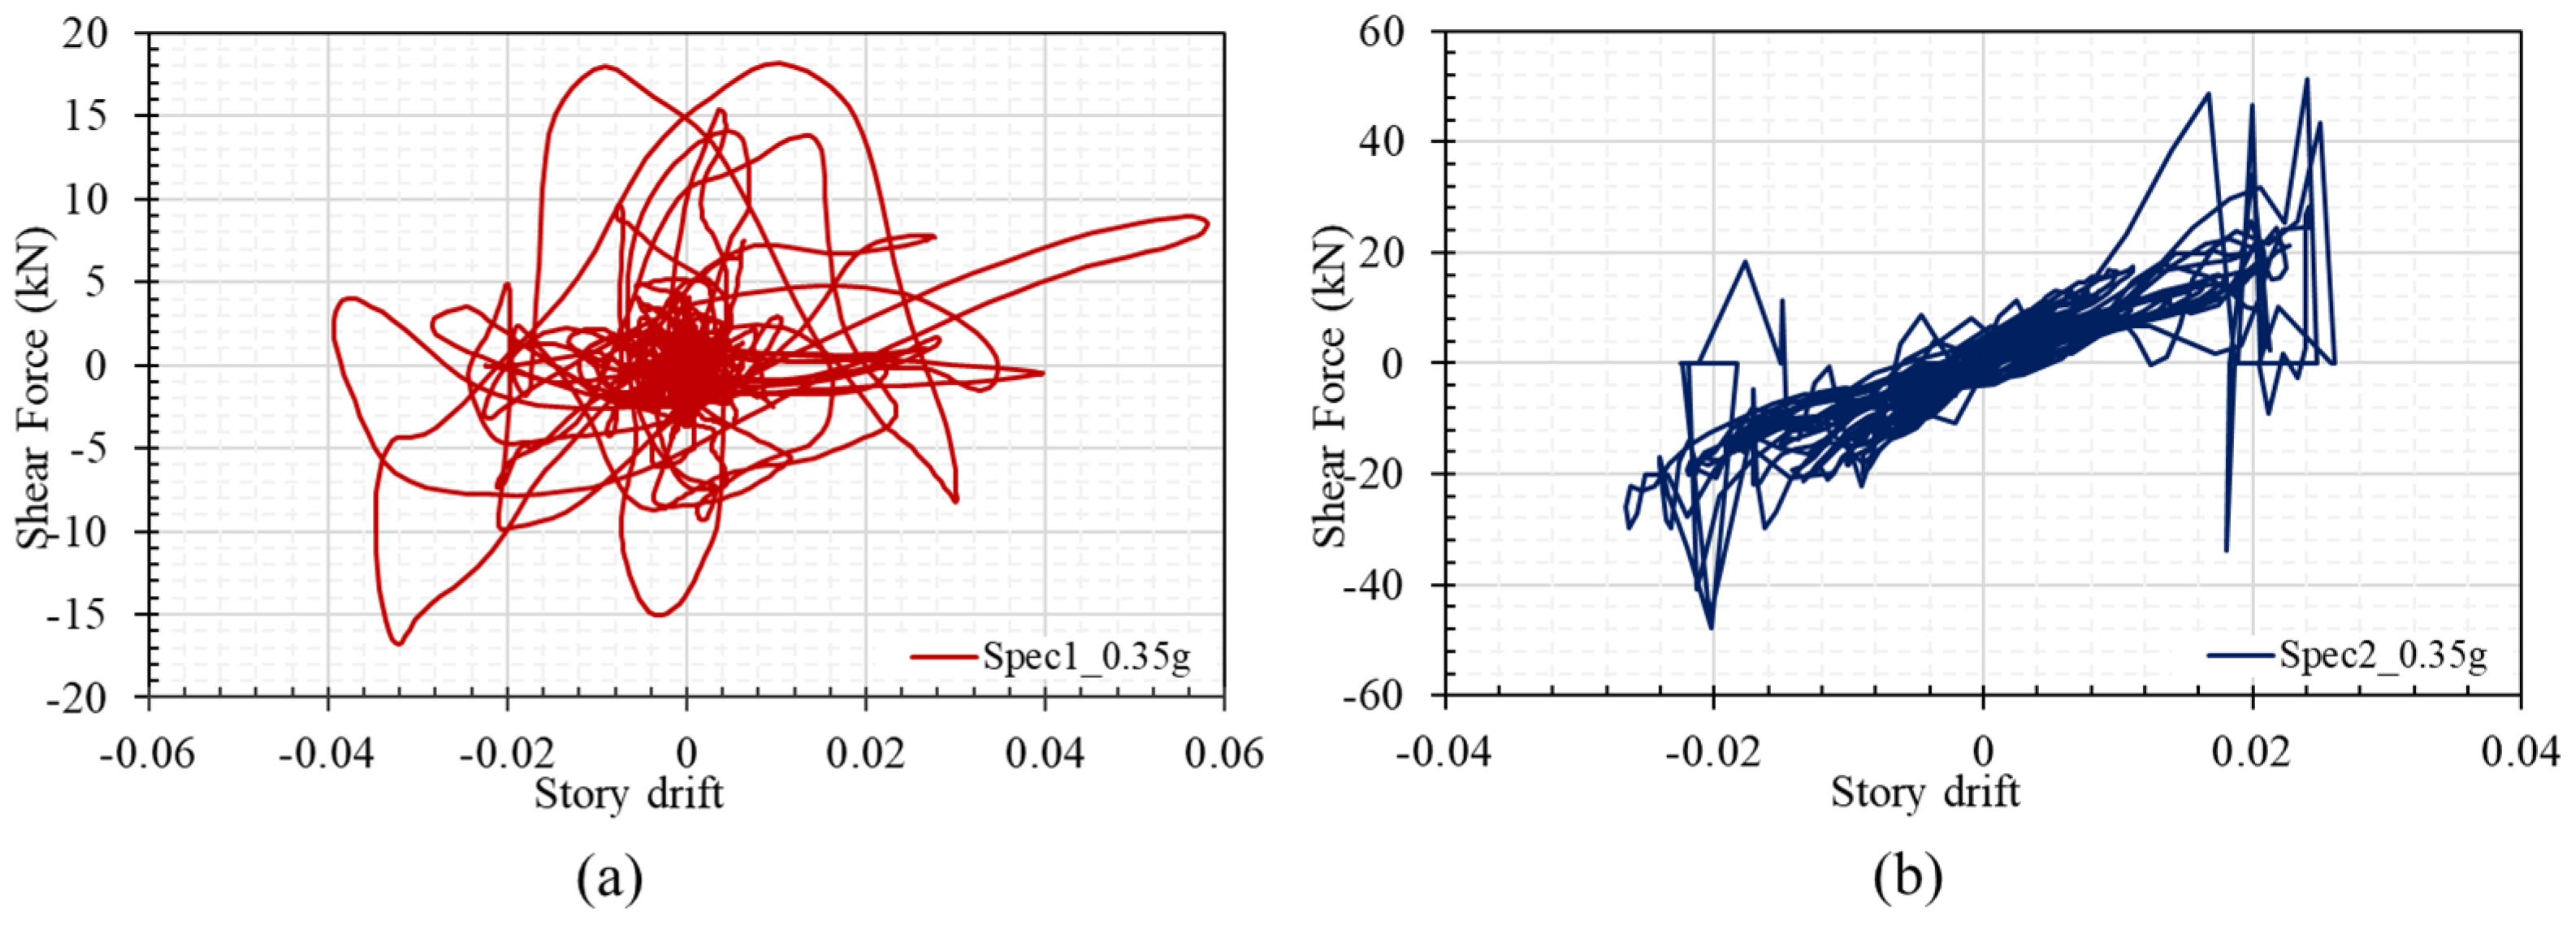
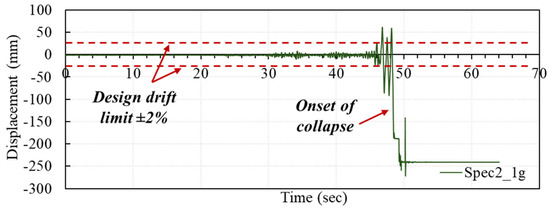
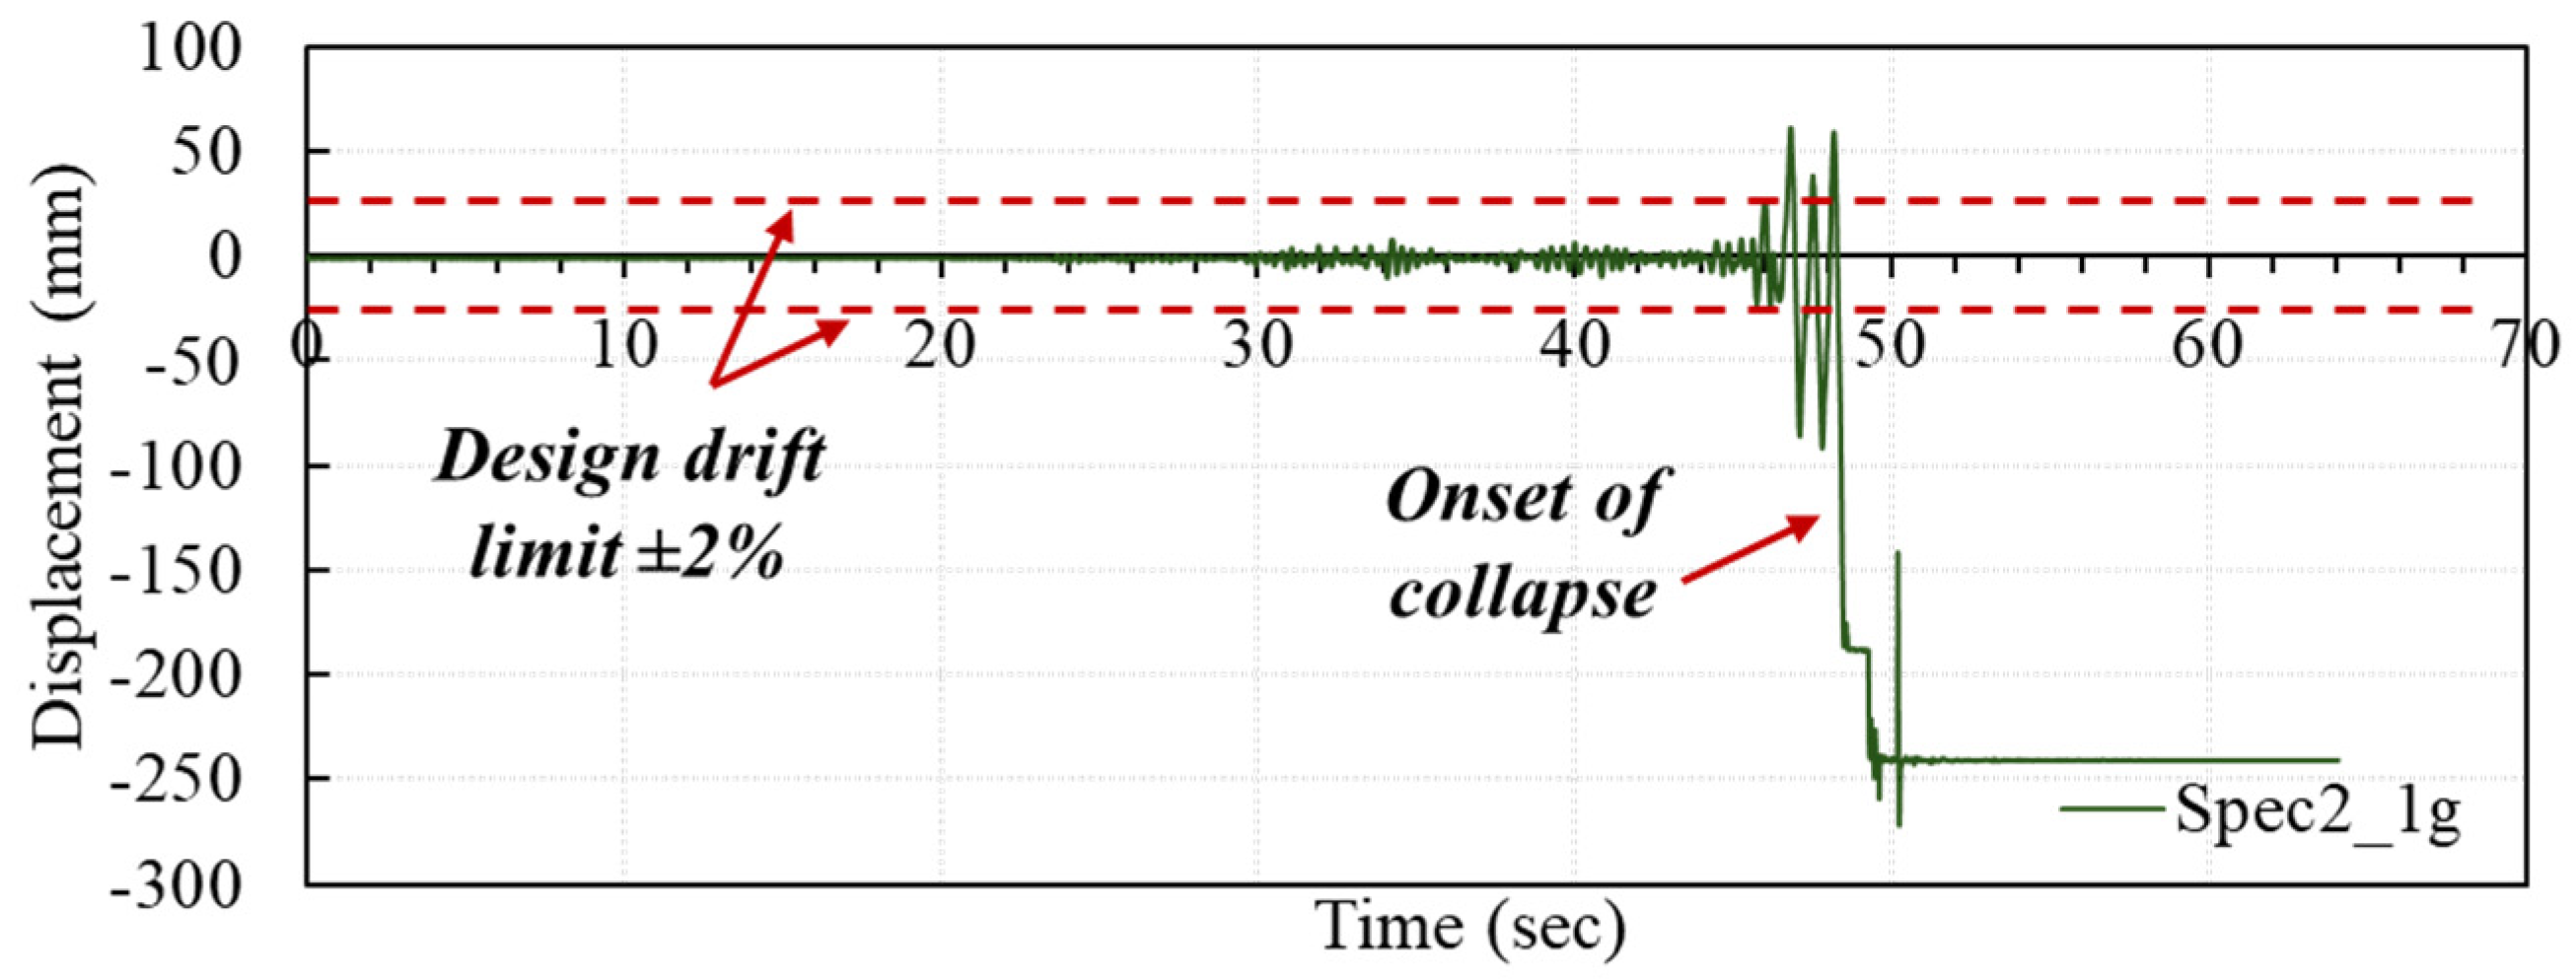
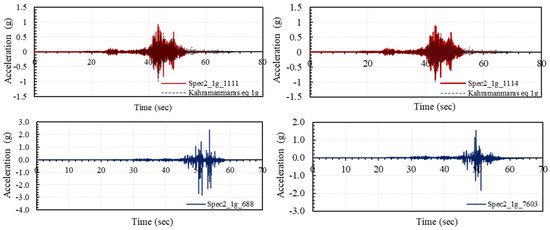
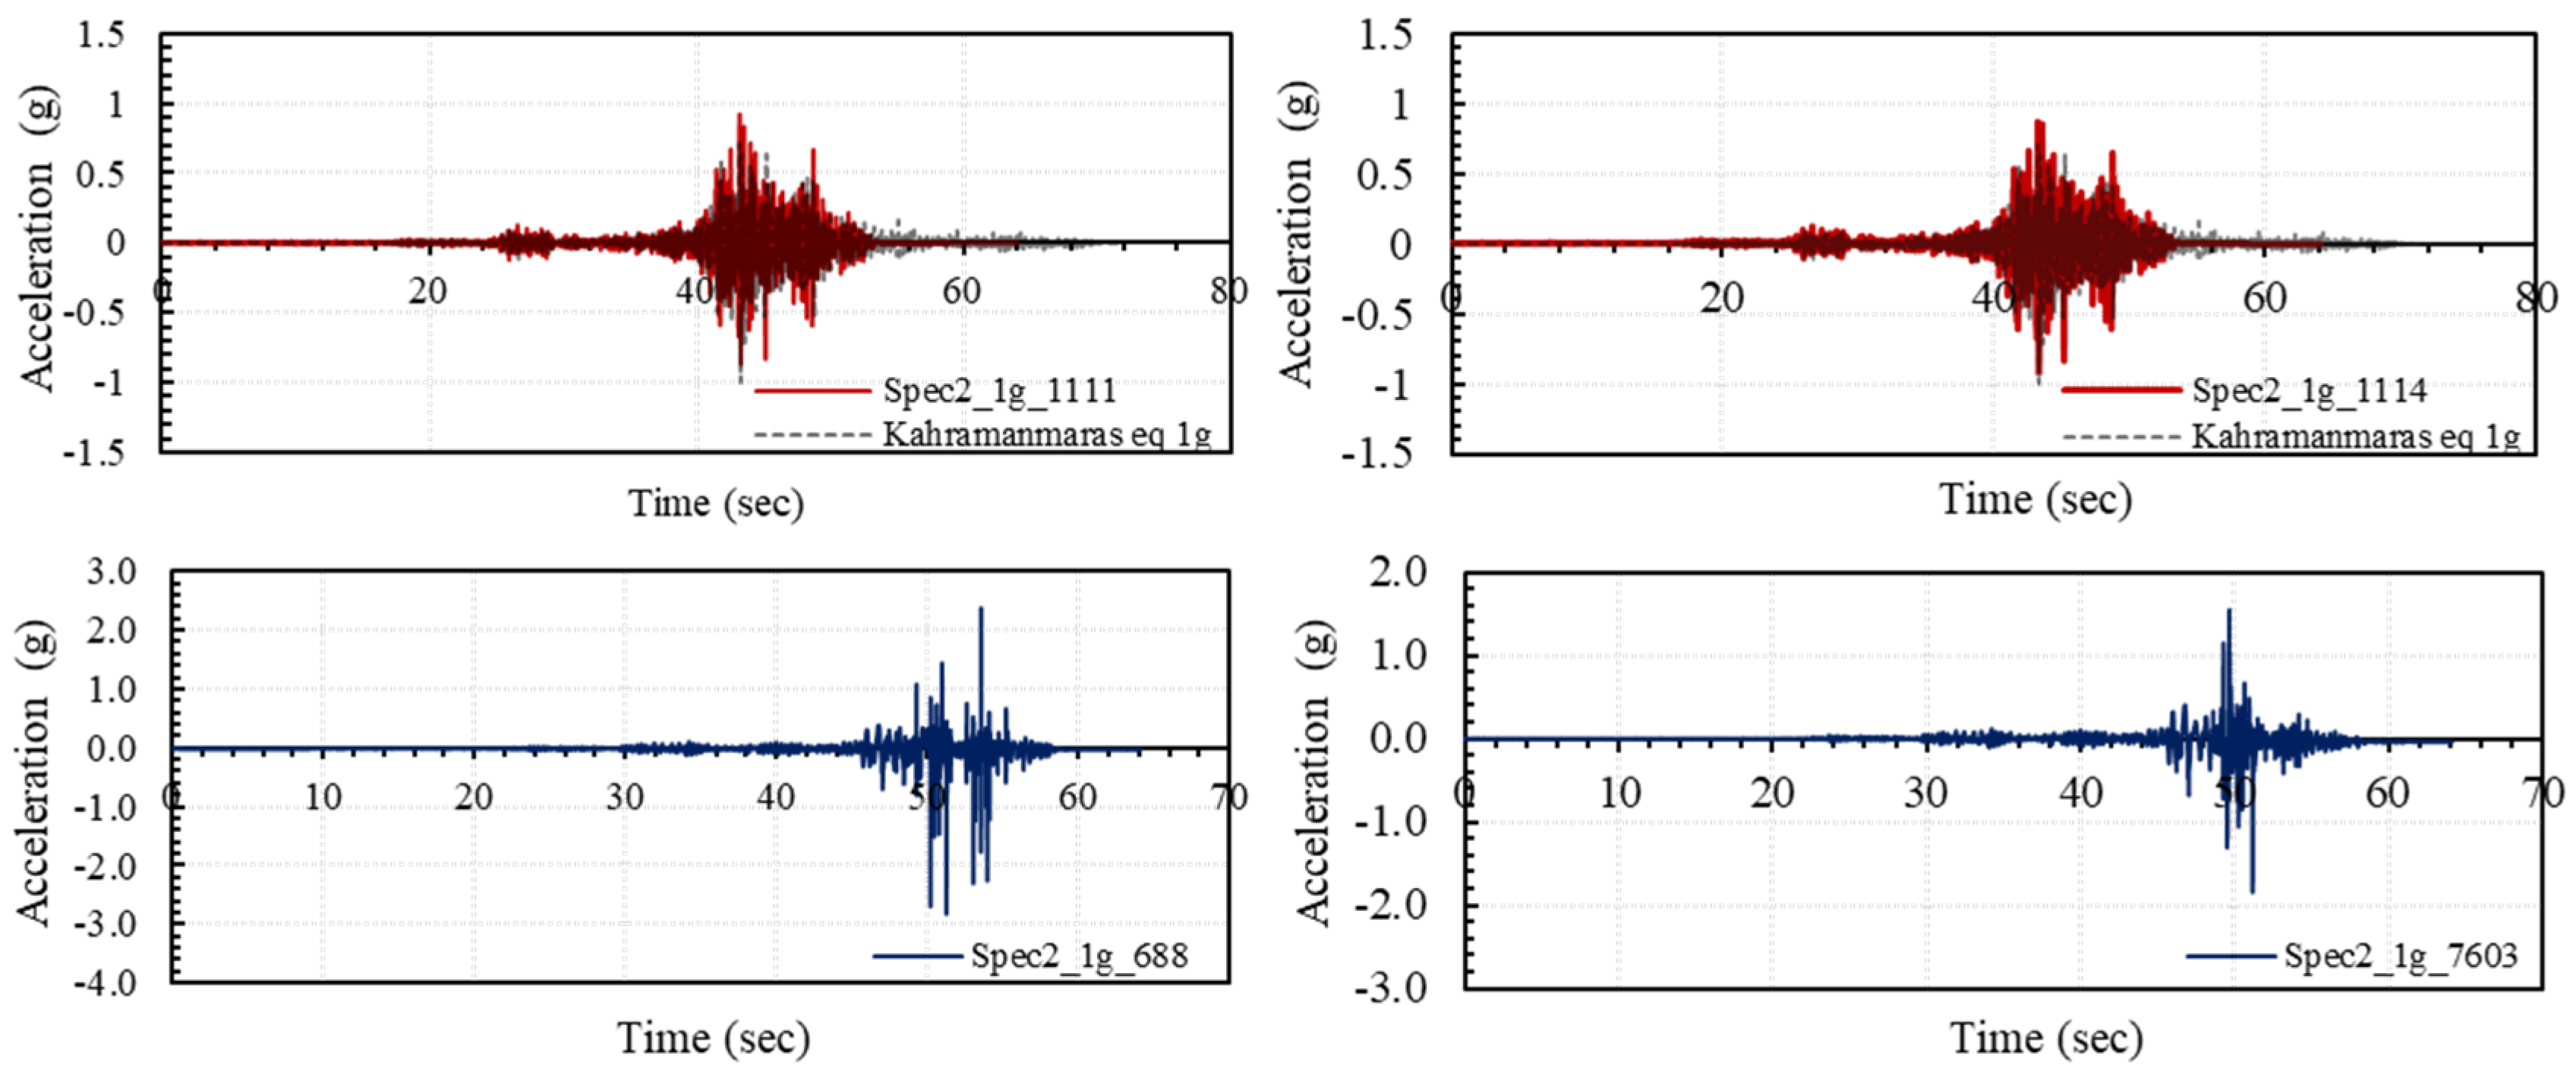
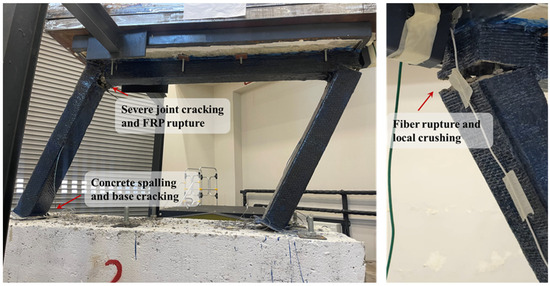
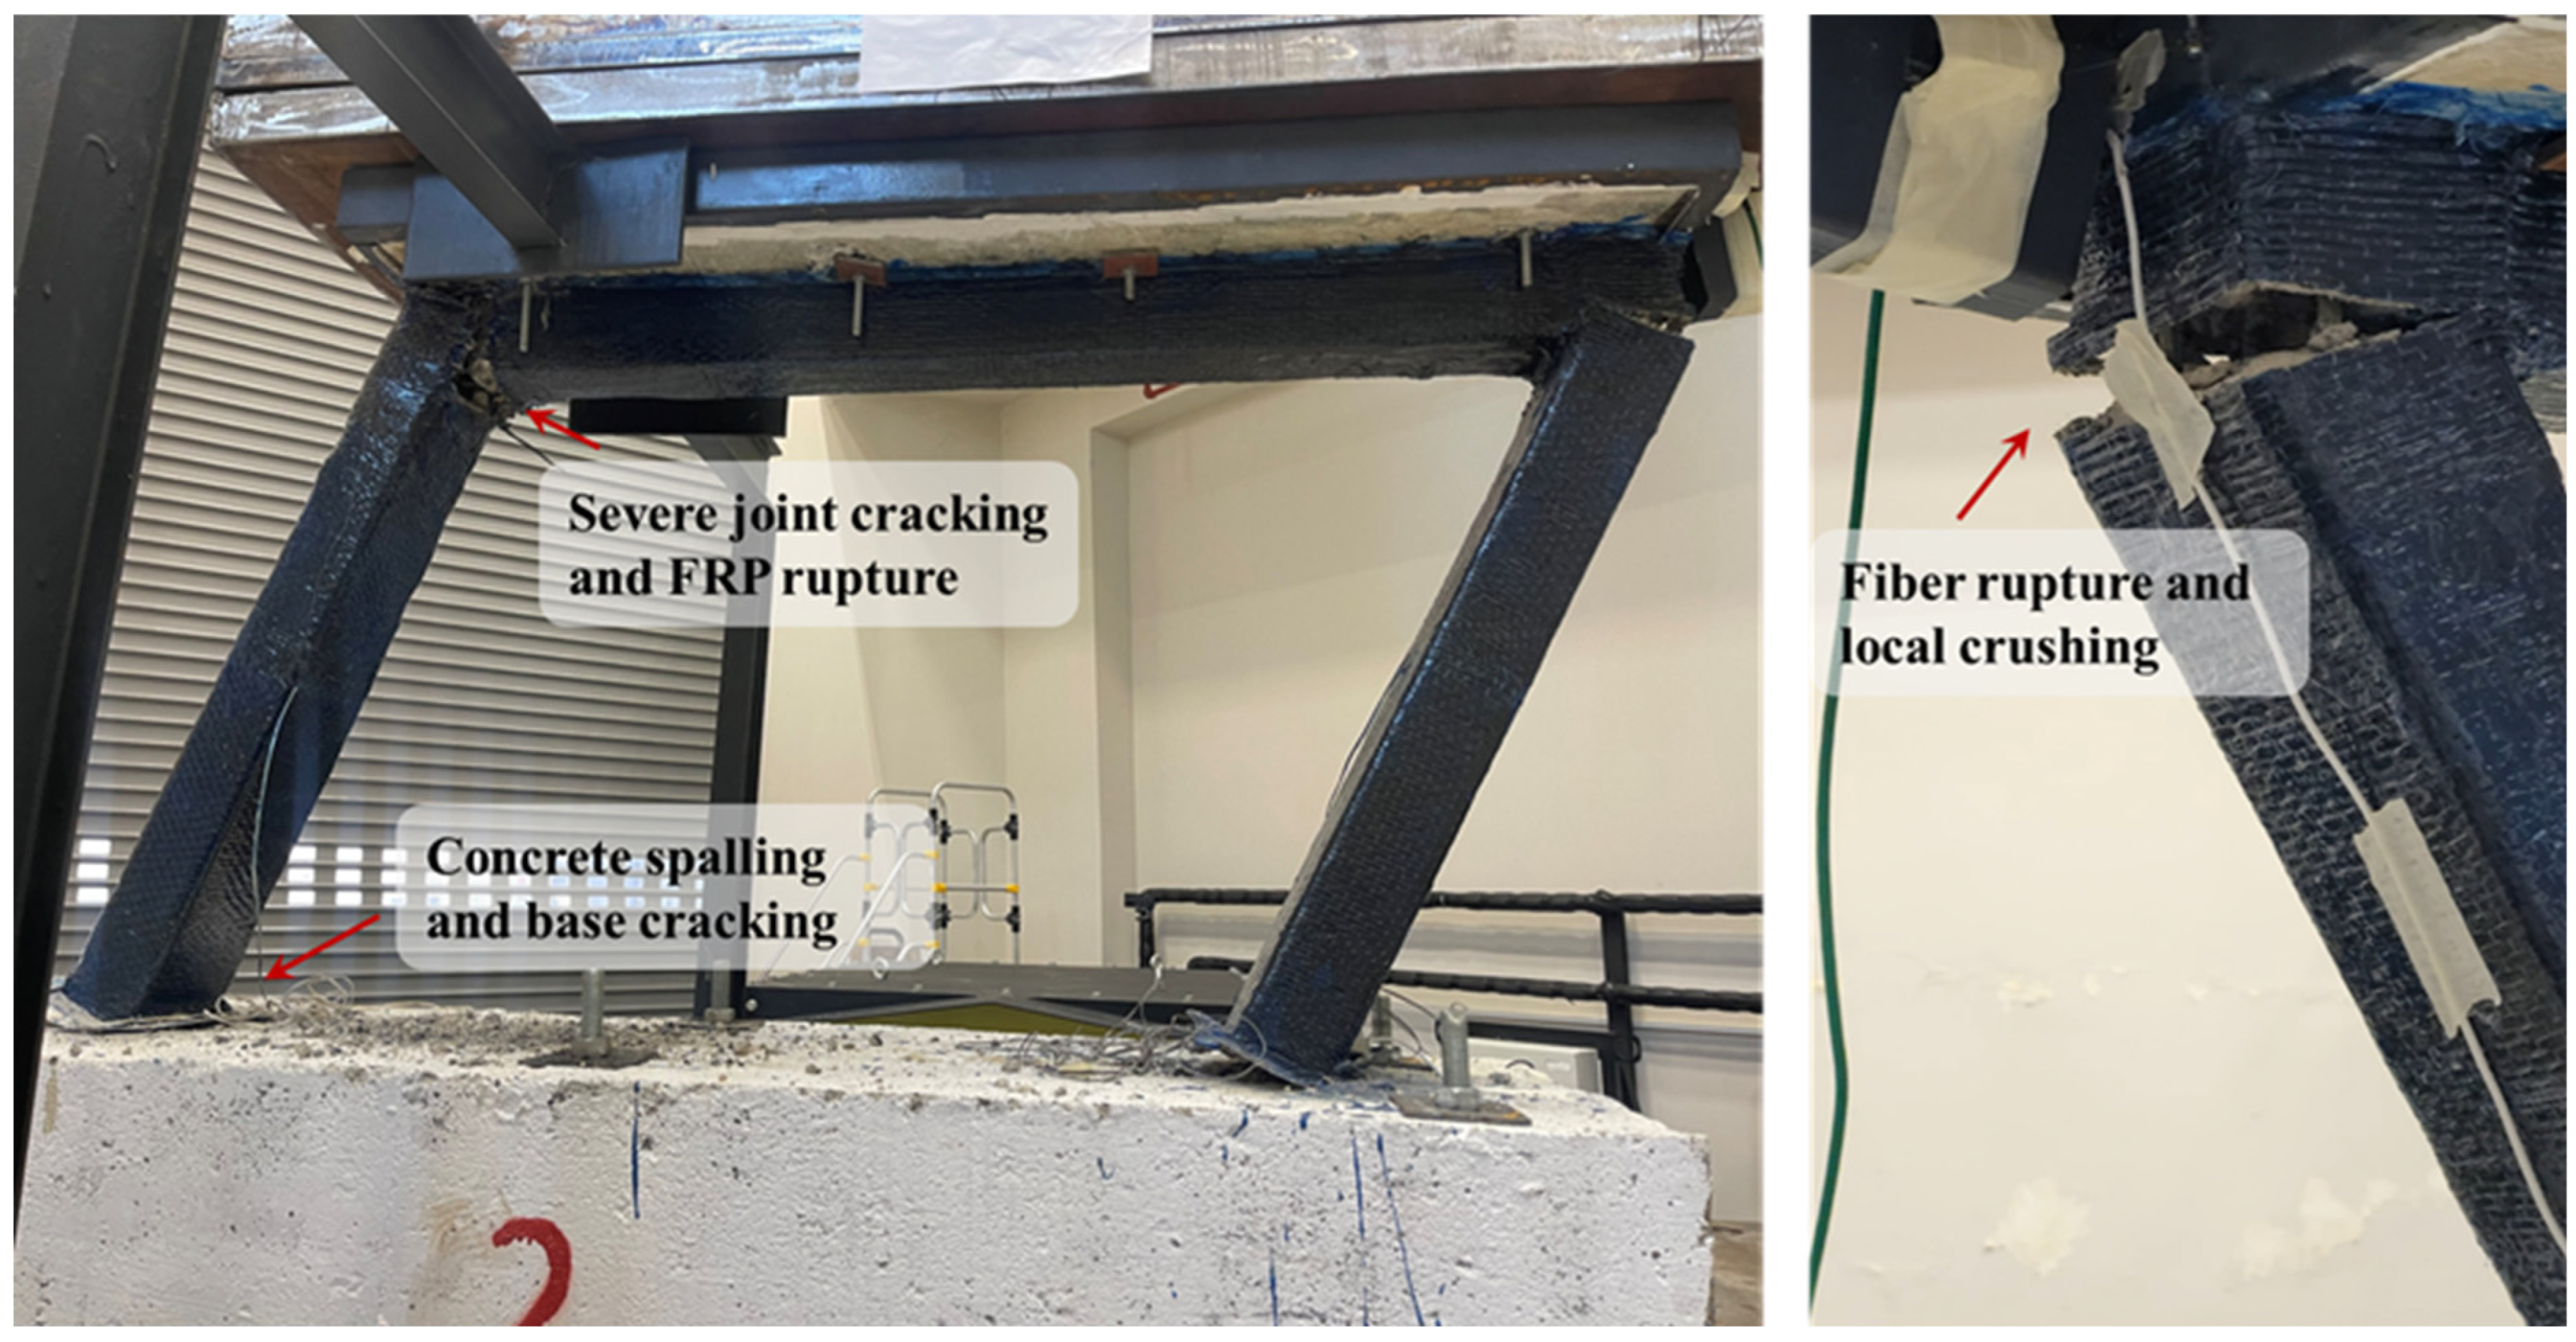
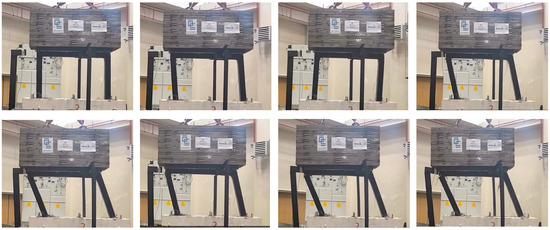
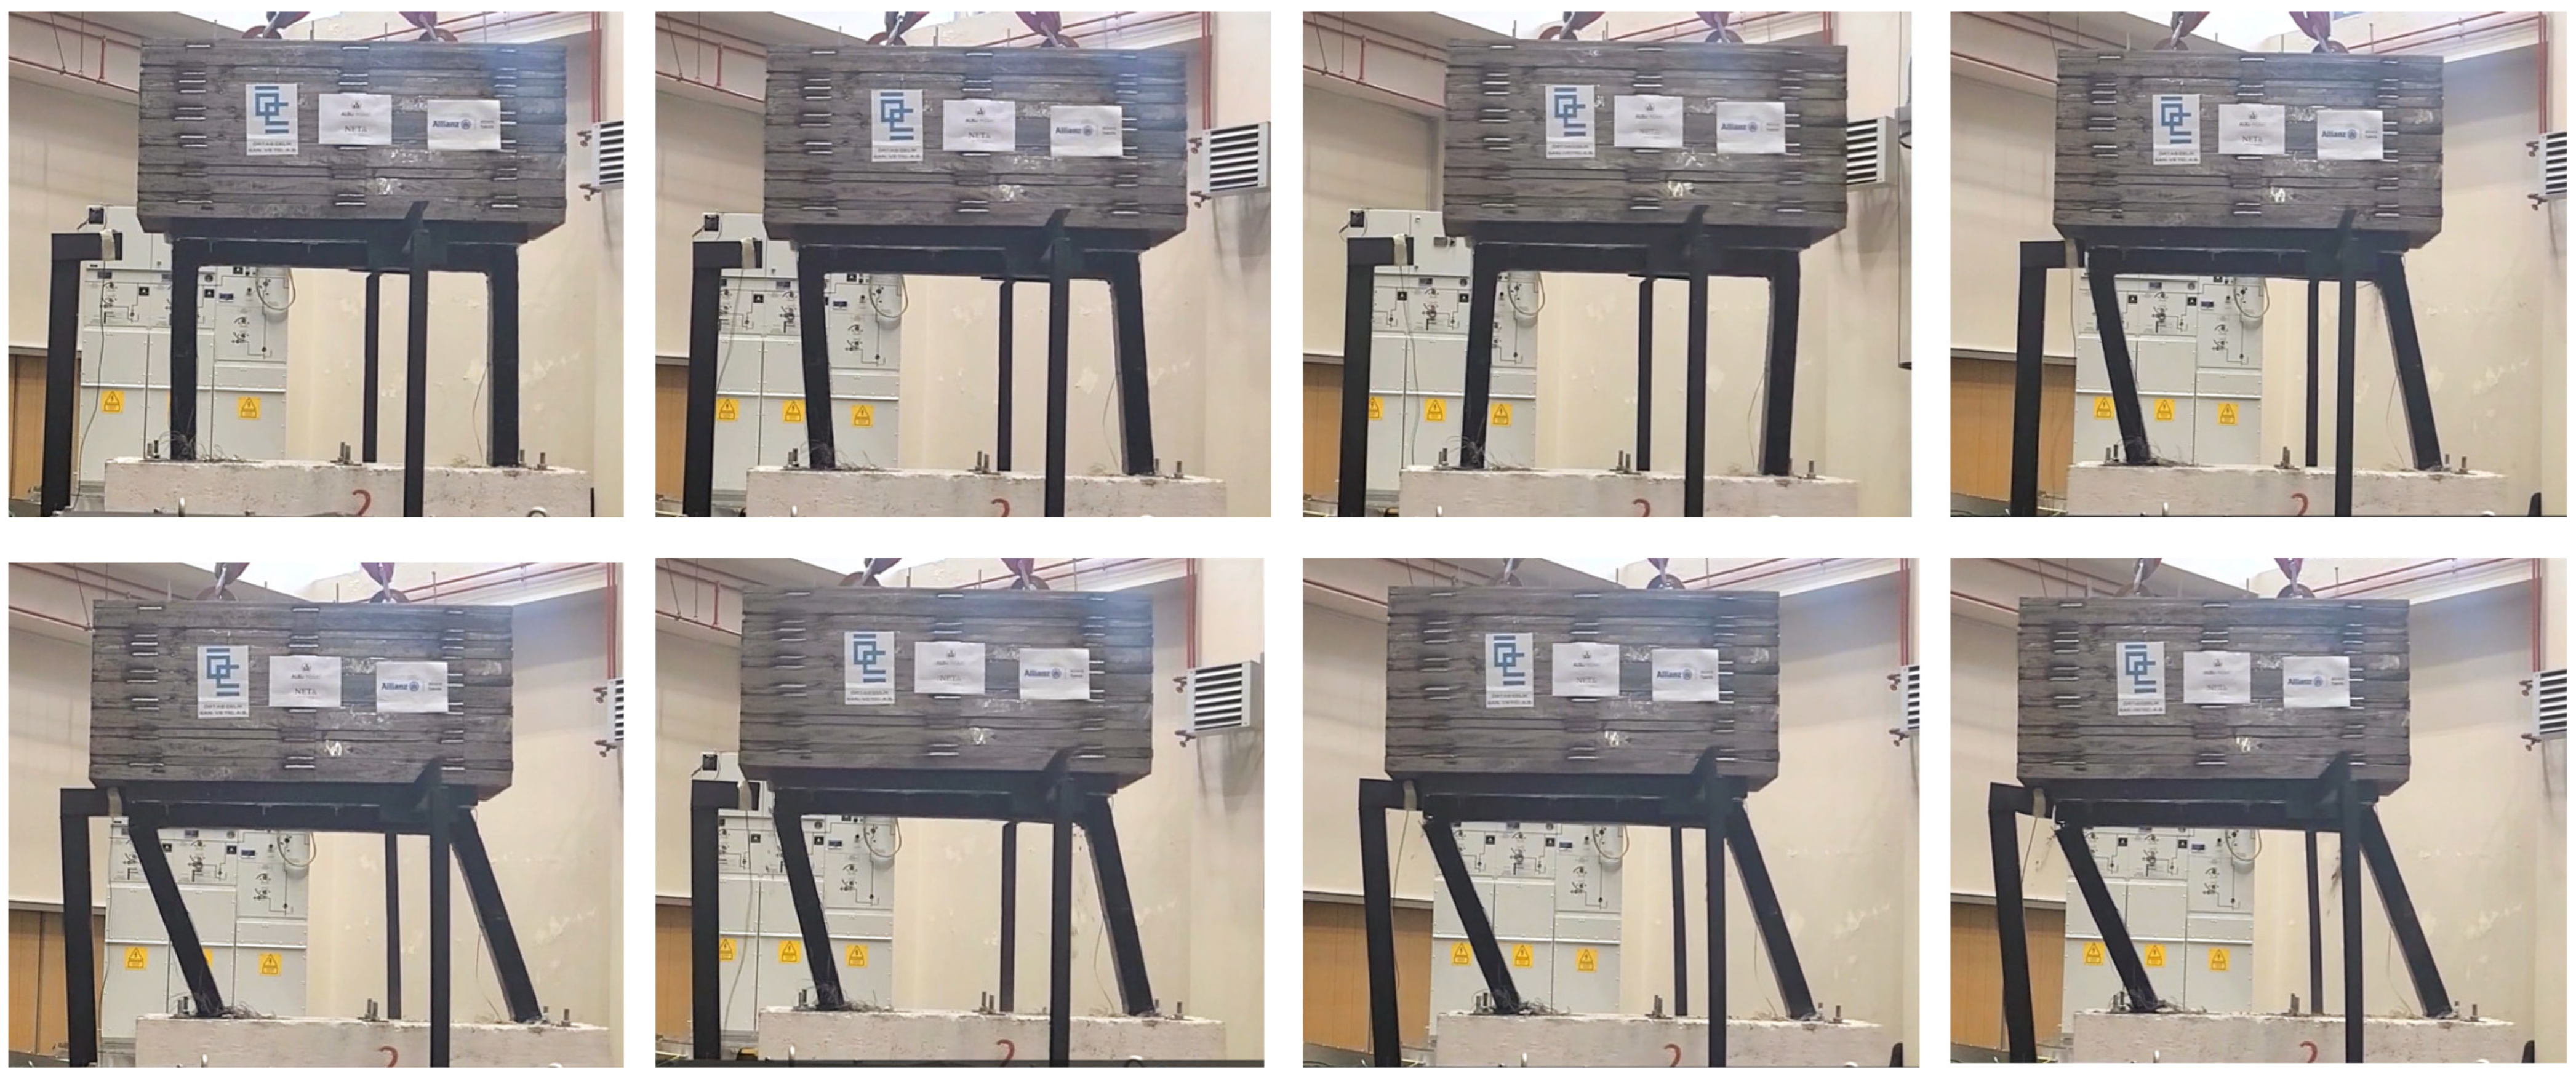
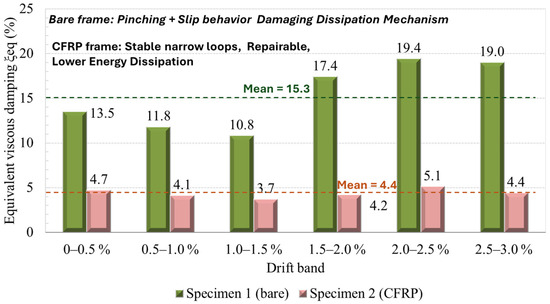
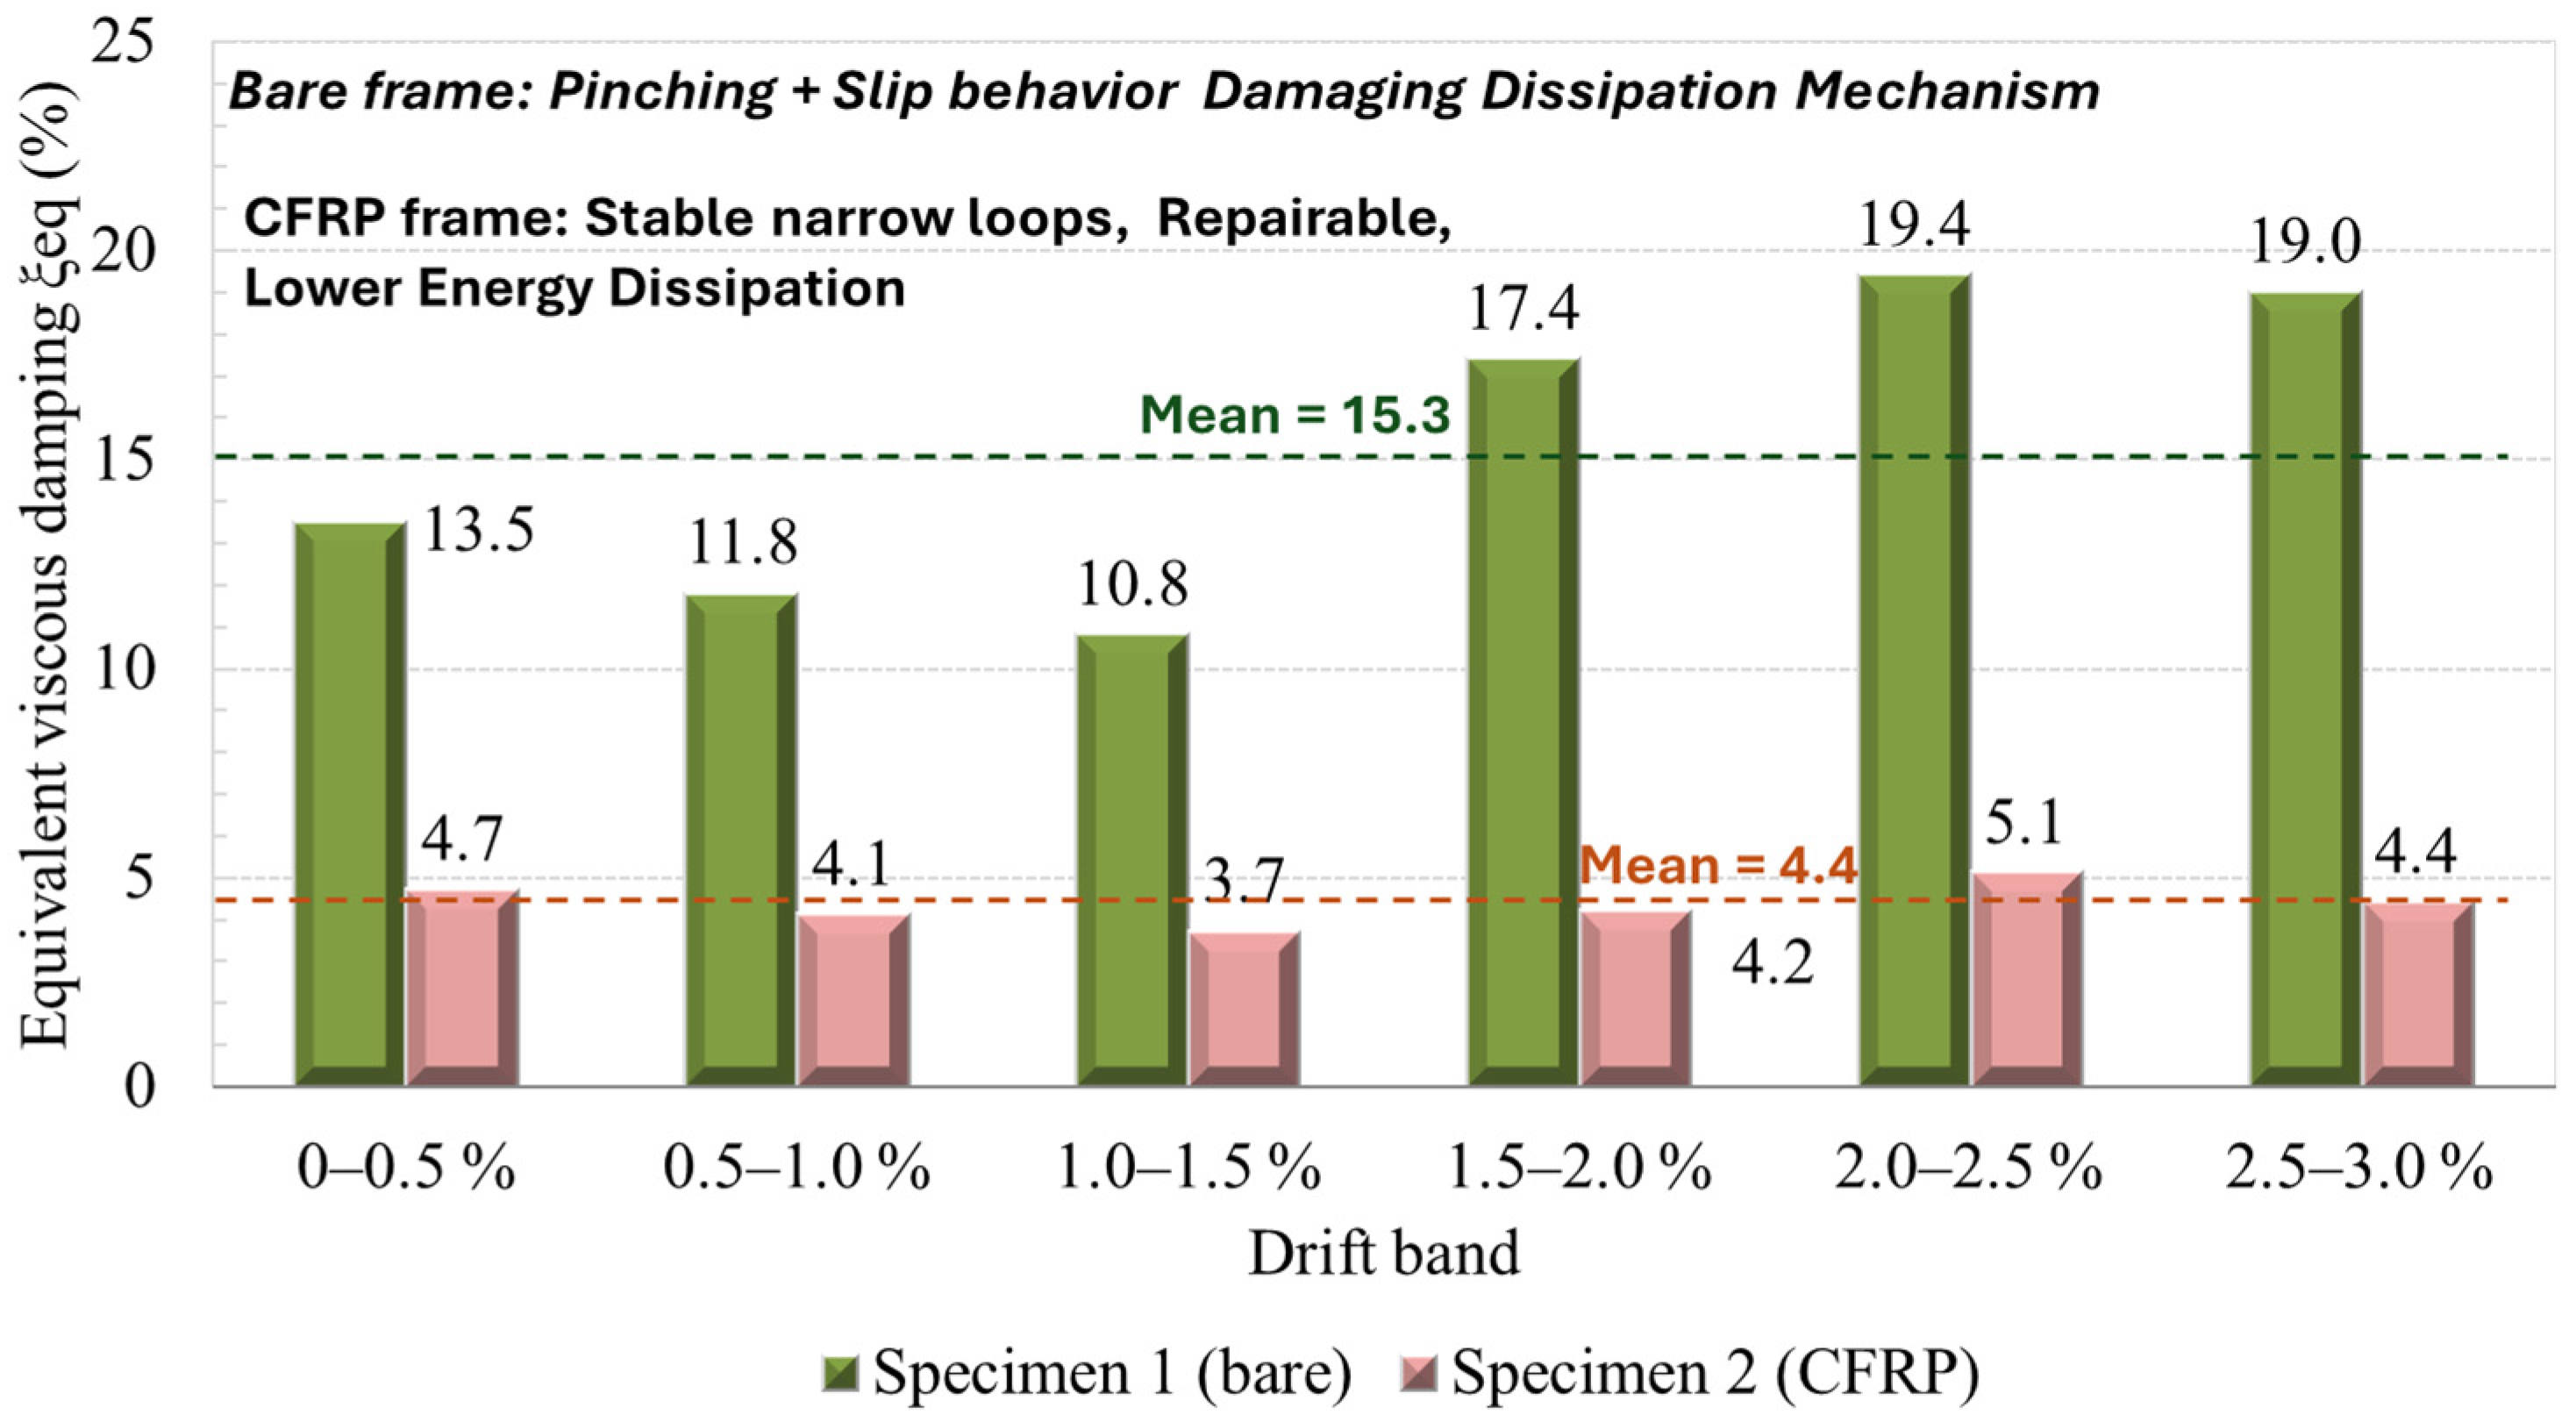
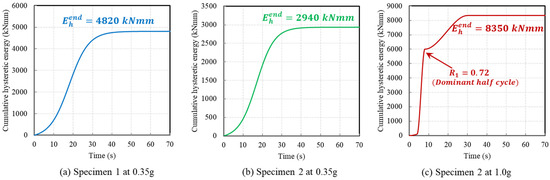
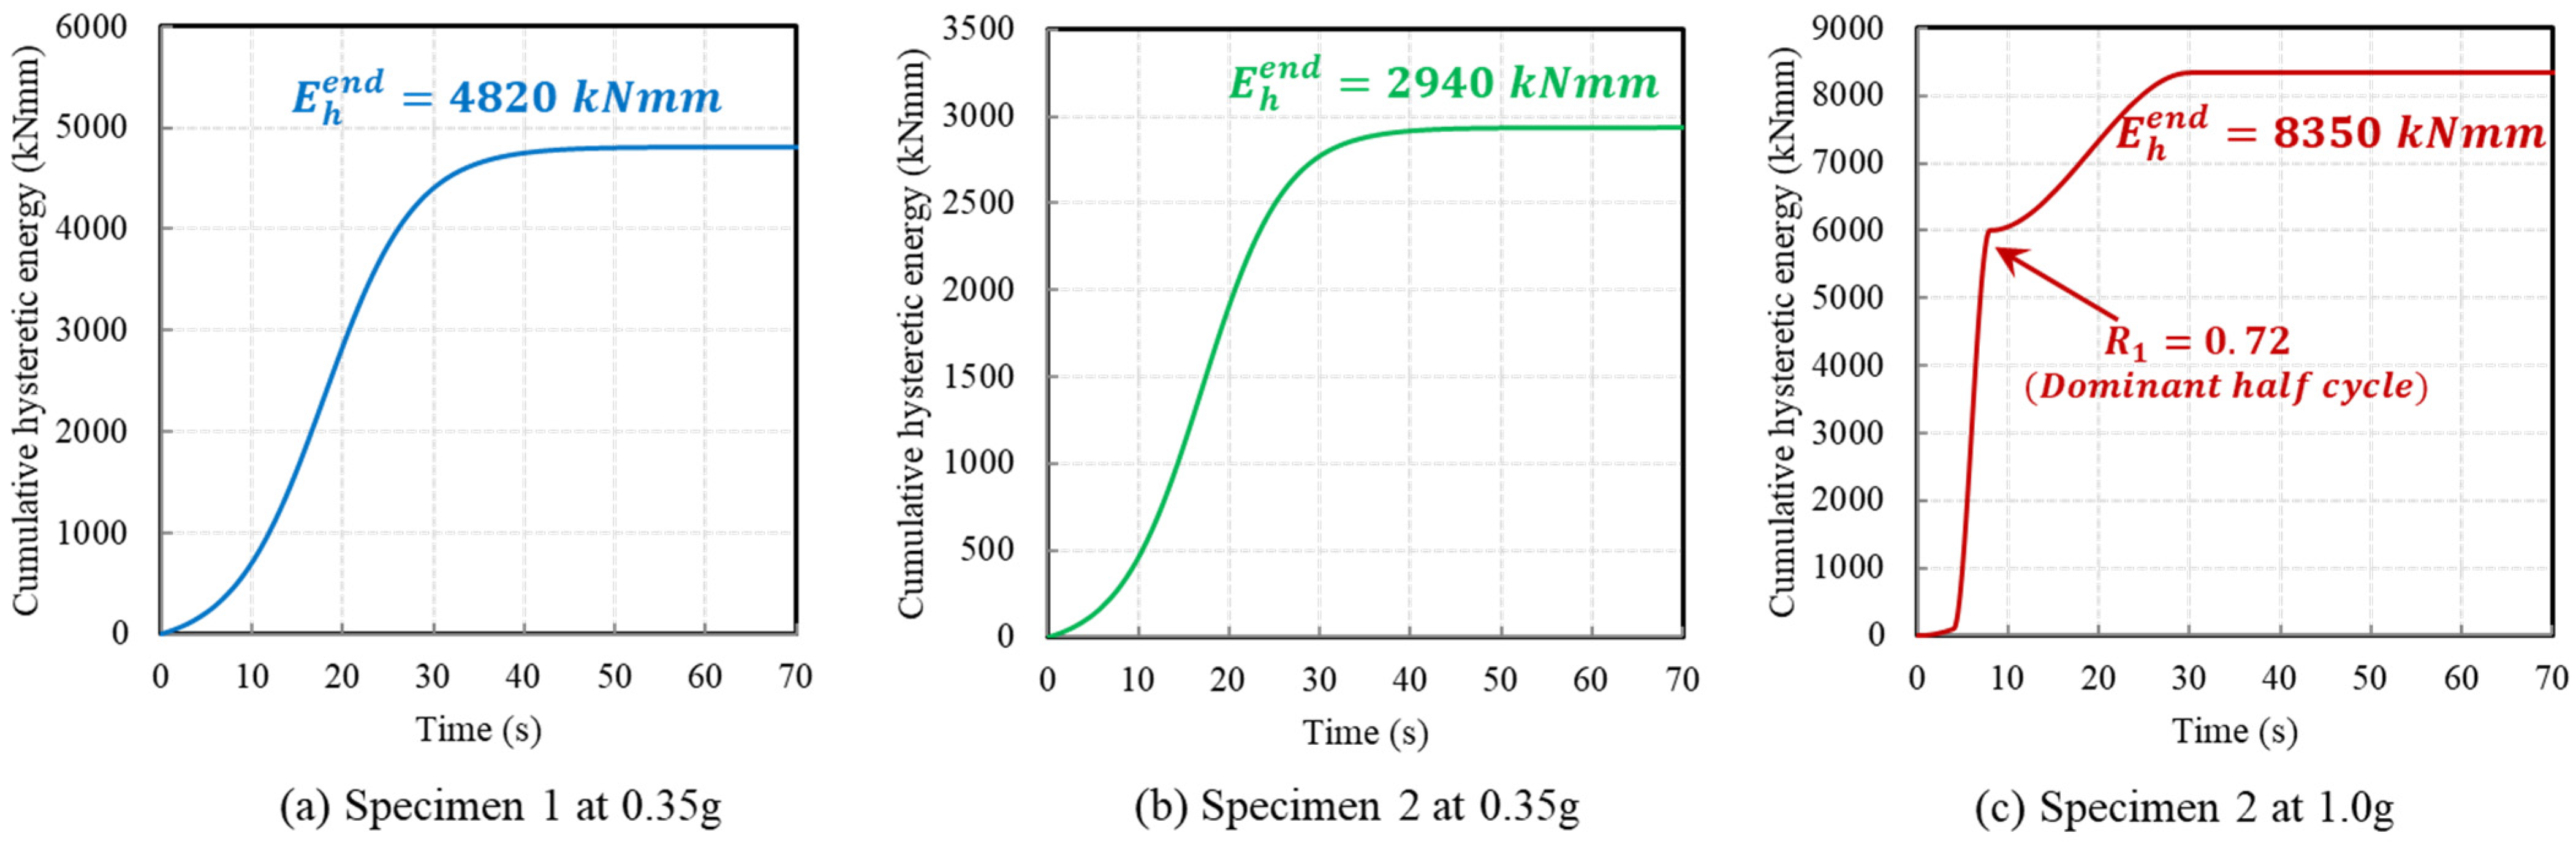
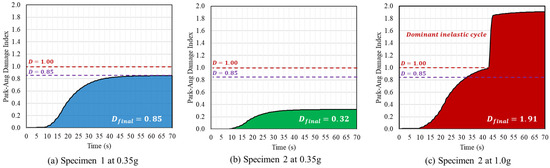
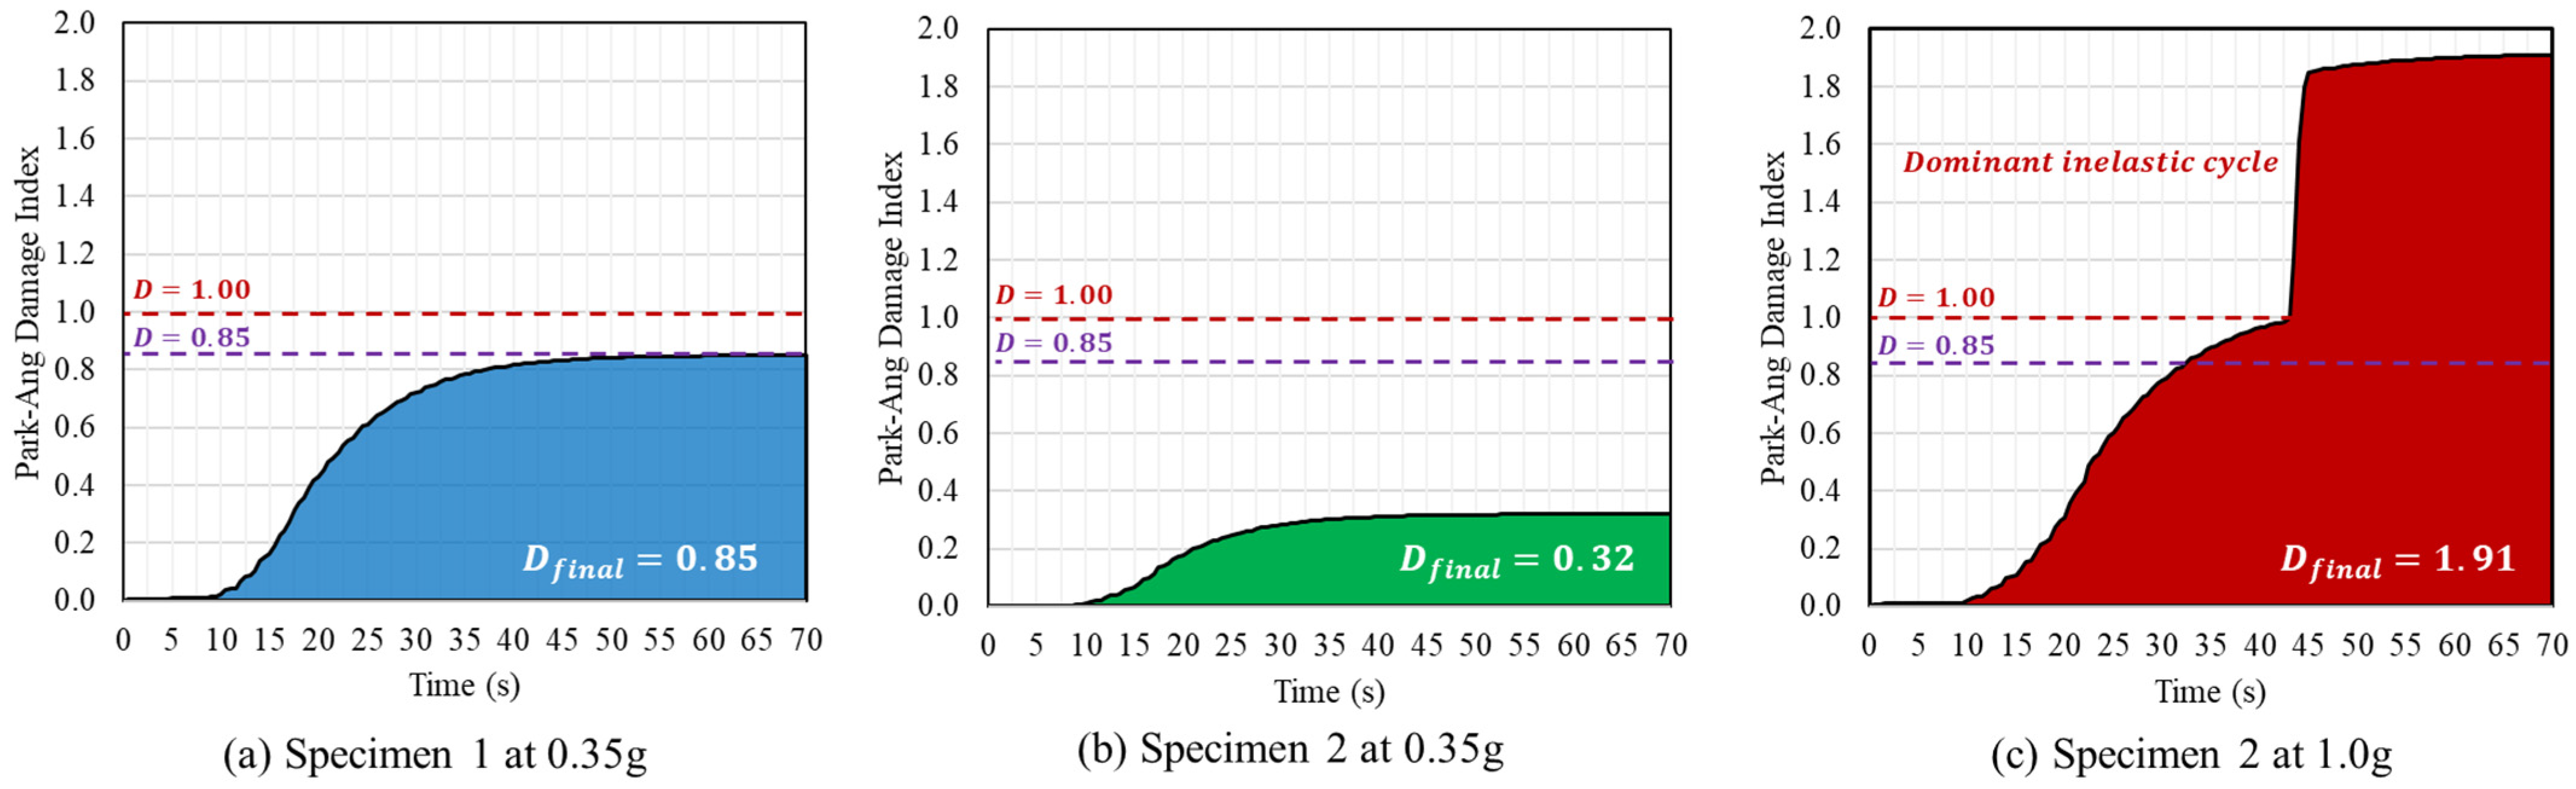

Disclaimer/Publisher’s Note: The statements, opinions and data contained in all publications are solely those of the individual author(s) and contributor(s) and not of MDPI and/or the editor(s). MDPI and/or the editor(s) disclaim responsibility for any injury to people or property resulting from any ideas, methods, instructions or products referred to in the content. |
© 2026 by the authors. Licensee MDPI, Basel, Switzerland. This article is an open access article distributed under the terms and conditions of the Creative Commons Attribution (CC BY) license.