1. Introduction
Since the beginning of the twenty-first century, global urbanization has continued to accelerate, and the urban built environment is facing unprecedented resource and ecological pressures. The United Nations World Urbanization Prospects: The 2018 Revision indicates that the proportion of the global population living in urban areas is projected to exceed 68% by 2050 [
1]. Rapid urban expansion has occupied surrounding agricultural land at a rate far exceeding population growth [
2]. Meanwhile, the food system generates substantial greenhouse gas emissions across production, processing, transportation, and consumption, and has become an important pressure that cannot be overlooked in urban low-carbon transitions [
3]. The continuous shrinkage of urban green space further intensifies the urban heat island effect and threatens residents’ health and the stable provision of ecosystem services [
4]. In response to these challenges, The United Nations Sustainable Development Goals (SDGs), particularly SDG 2 and SDG 11, focus on food security, sustainable agriculture, and inclusive, safe, resilient, and sustainable urban development, respectively, providing an important policy background for the development of urban agriculture and green infrastructure. The UN-Habitat World Cities Report 2022 also calls for greater policy investment in urban green production and environmentally friendly consumption [
5]. These developments provide an important policy context for integrating urban agriculture and urban green infrastructure into the urban built environment as carriers that combine food production with ecosystem service functions. As a nature-based solution (NBS), this approach can help reduce urban carbon emissions and provide an effective pathway for securing food supply for urban residents [
6].
Against this background, rooftop farms, as an innovative practice integrating urban agriculture with building-integrated green infrastructure, provide high-density cities with a solution for expanding green and productive spaces without requiring additional construction land. By cultivating crops on building rooftops, rooftop farms can improve rooftop thermal conditions, reduce building cooling loads through plant transpiration, shading, and substrate water retention, and, to a certain extent, shorten food transportation distances and reduce related carbon emissions [
7,
8]. In addition, compared with conventional green roofs, rooftop farms place greater emphasis on productivity, participation, and service functions. They not only provide fresh agricultural products but also create rooftop landscape spaces with productive, ornamental, and experiential value, thereby supporting horticultural education, community interaction, health-oriented recreation, and public activity organization [
9,
10]. Currently, rooftop farm practices have expanded from European and North American cities to high-density Asian cities such as those in China, Singapore, and Dhaka, Bangladesh, and have gradually been incorporated into urban green-space policies and agricultural environmental regulatory frameworks. For example, the LUSH 3.0 program of Singapore’s Urban Redevelopment Authority includes rooftop urban farms in the calculation of landscape replacement areas, while the European Union’s Common Agricultural Policy (CAP) is also promoting digital verification of agricultural activities, crop-status monitoring, and environmental compliance assessment [
11,
12]. This indicates that the development of rooftop farms involves not only the reuse of building space and the expansion of urban green space, but also the continuous monitoring of crop growth processes, the management of resource inputs, and the assessment of environmental performance. Therefore, rooftop farms have evolved from simple agricultural production spaces into multifunctional building-integrated green infrastructure that combines ecological regulation, food production, landscape display, and public-service functions.
Unlike conventional open-field agriculture or greenhouse cultivation, rooftop farms are typically located in open or semi-open building environments. Plant growth in these spaces is affected by regional climate, building height, roofing materials, shading, wind exposure, drainage conditions, and rooftop thermal conditions [
13,
14,
15], resulting in high environmental openness and spatial heterogeneity. These spatial and environmental characteristics mean that rooftop farm management must address not only crop yield but also landscape maintenance, public activity planning, and social-service provision. To maintain their production, landscape, and public service functions, rooftop farms increasingly require refined, data-driven smart management. However, because rooftop farms are generally located on urban building roofs, the deployment and maintenance of the physical sensors required for smart management are often constrained by cost, spatial accessibility, power supply conditions, deployment density, and long-term maintenance difficulty. As a result, comprehensive and real-time perception of plant growth status and environmental information remains challenging [
16]. This insufficient sensing capacity makes it difficult for managers to track plant growth status, phenological development, and potential risks in a timely manner, thereby increasing the operation and maintenance costs of rooftop farms and the uncertainty associated with the provision of public activities and social service functions.
In recent years, digital twin technologies have been increasingly applied to agriculture and plant management. In the field of plant landscape management, plants are the core elements of the landscape, and their growth is highly temporal and dynamic. Growth status, phenological development, and landscape effects continuously change with climatic fluctuations, substrate conditions, and management practices. Digital twins provide a framework for dynamically representing and updating the interactions between plant growth and complex environments. At present, digital twin studies on plant growth management in crop production mainly focus on several aspects. First, in facility environmental control, digital twins have been used in greenhouse horticulture to optimize climate, irrigation, and lighting strategies. For example, Hemming et al. used digital twin algorithms to remotely control greenhouses, significantly improving cherry tomato yield and resource use efficiency [
17]. Howard et al. designed several digital twin systems that incorporated artificial lighting, irrigation, and temperature control into a joint optimization framework, thereby improving production efficiency and greenhouse energy savings [
18,
19]. Second, in crop growth simulation, digital twin technologies have been deeply integrated with crop growth models, such as the World Food Studies (WOFOST) model, the Decision Support System for Agrotechnology Transfer (DSSAT) model, and the Tomato Growth (TOMGRO) model. Through data assimilation, remote sensing or Internet of Things data can be used to dynamically correct model parameters and achieve accurate prediction of crop growth, development, yield, and quality [
20,
21,
22]. Third, in precision field management, digital twins have been used to monitor soil moisture, guide intelligent irrigation, and predict pest and disease outbreaks [
23,
24]. Alves et al. developed a digital twin-based intelligent irrigation management system that simulated soil moisture dynamics using real-time data-driven models, thereby enabling water-saving irrigation [
25]. Although digital twin research on plant growth management has made progress, most existing studies remain concentrated at the monitoring level, while predictive digital twins for whole-process management are still at an early stage [
23]. Moreover, when digital twin technologies are applied to simulate complex living systems such as plants, they often lack fine-grained characterization of inter-plant differences and growth-process dynamics [
26].
Given the demand of digital twins for continuous sensing and dynamic synchronization, virtual sensor technology provides key support for constructing plant growth digital twin systems under conditions of limited physical sensing. A virtual sensor is a software-defined sensor that estimates target variables by using mathematical models and algorithms based on measurements from other physical sensors [
27]. In plant management, virtual sensors are mainly applied in two aspects. First, for environmental parameter estimation, particularly in response to the spatial heterogeneity of rooftop farm or greenhouse microclimates, Tomazzoli et al. [
28] developed virtual sensors based on linear regression and context-aware recurrent neural networks. These sensors can accurately estimate temperature and humidity at arbitrary locations using data from a small number of sensors and can generate environmental heat maps for the entire space. Dai X et al. applied reinforcement learning to indoor environment control [
29]. This method provides an effective approach for constructing refined environmental digital twins in rooftop farms with significant spatial heterogeneity. Second, for plant physiological parameter monitoring, leaf area index, aboveground biomass, phenology, and yield are core indicators for evaluating crop growth. Leaf area index (LAI) can be accurately retrieved by combining multispectral or hyperspectral images acquired from UAVs or near-ground remote sensing platforms with machine learning algorithms such as Gaussian process regression and random forests [
30,
31]. Aboveground biomass acquisition techniques mainly rely on LiDAR, RGB images, multispectral data, point cloud reconstruction, and machine learning inversion, emphasizing non-destructive, high-throughput, and multi-temporal monitoring [
32,
33,
34]. The acquisition of phenology and yield information has gradually shifted from traditional manual phenological surveys to automated identification based on remote sensing, phenotyping, and machine learning [
35,
36,
37,
38]. The key physiological data obtained through these digital technologies provide support for constructing plant digital twins. Thus, existing virtual sensor research has expanded from environmental variable estimation to plant state variable retrieval, providing multi-source and non-destructive observational support for plant digital twins. However, these methods have not yet formed a systematic framework in rooftop farm scenarios that couples crop growth models with environmental prediction models.
Taken together, existing studies have laid a solid foundation for the application of digital twins and virtual sensors in plant growth management, but several limitations remain. First, most studies have focused on relatively standardized scenarios such as greenhouses or open fields. Greenhouse environments are highly controllable, while open-field environments are usually oriented toward regional-scale agricultural production. In contrast, rooftop farms combine open planting environments with architectural spatial attributes, and plant growth is jointly affected by uncontrolled environmental conditions and spatial heterogeneity, including building microclimate, rooftop thermal environment, and wind environment. This special scenario has received limited attention in existing research. Second, current digital twin applications mainly focus on environmental monitoring, state visualization, or simulation optimization of a single process, while predictive digital twin research oriented toward whole-process plant management remains insufficient. Third, existing agricultural digital twin studies mainly aim to improve crop yield, resource use efficiency, or environmental control optimization, paying limited attention to the social service functions of rooftop farms as public open spaces, such as landscape display, science education, harvest experiences, and community participation. Finally, under the practical constraints of limited physical sensor deployment in rooftop farms, there is still a lack of an integrated technical pathway for smart rooftop farm management that combines limited physical sensor data, weather prediction based on long short-term memory (LSTM), crop growth simulation based on the Decision Support System for Agrotechnology Transfer (DSSAT), virtual sensor mechanisms, and a three-dimensional (3D) visualization platform to achieve dynamic estimation, short-term prediction, and visual representation of plant growth status.
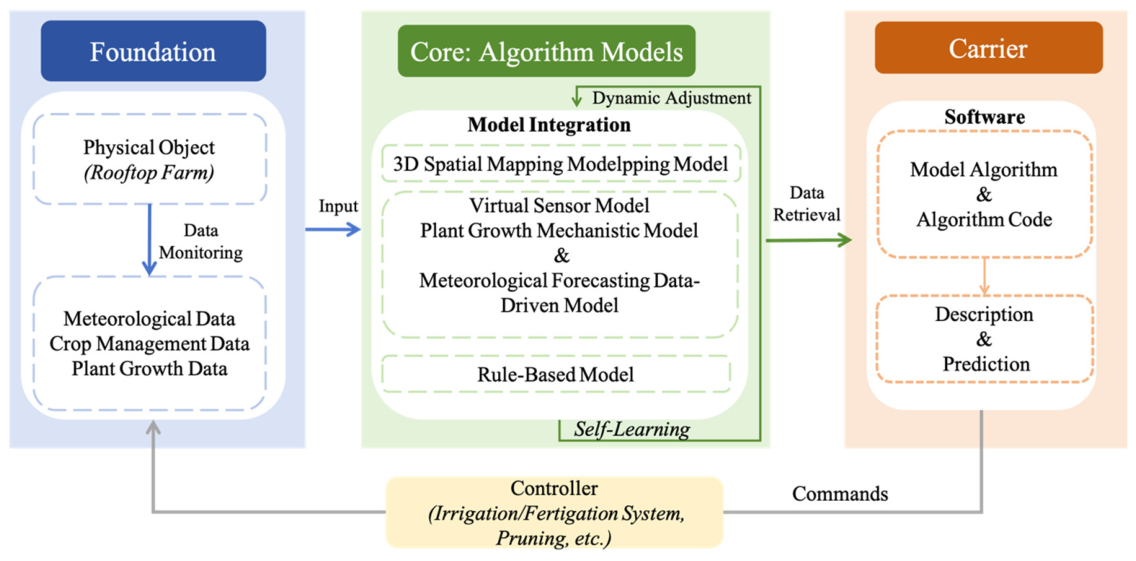
To address these gaps, this study uses a rooftop tomato farm in Xiamen, China, as a case study. An LSTM weather prediction model is coupled with the DSSAT crop growth model to form a virtual sensor module for rooftop farms, and a virtual sensor-driven plant growth digital twin platform is constructed. Compared with existing studies, the contributions of this study are as follows: (1) a digital twin framework for whole-process plant management in rooftop farms is proposed, which enables the integrated representation of key plant growth indicator monitoring, operation and maintenance decision-making, and three-dimensional visualization scenes, thereby providing a methodological reference for the smart operation and maintenance of rooftop farms and similar building green infrastructure systems; and (2) virtual sensor technology is introduced into rooftop farm scenarios, and a plant growth prediction method coupling LSTM-based weather prediction with DSSAT-based crop growth simulation is developed. This enables the system to combine short-term climate prediction with mechanism-driven plant state estimation under constrained physical sensor deployment, thereby realizing continuous estimation and dynamic simulation of plant growth status in rooftop farms under sensor-constrained conditions.
3. Experimental Design and Methods
3.1. Experiment Design
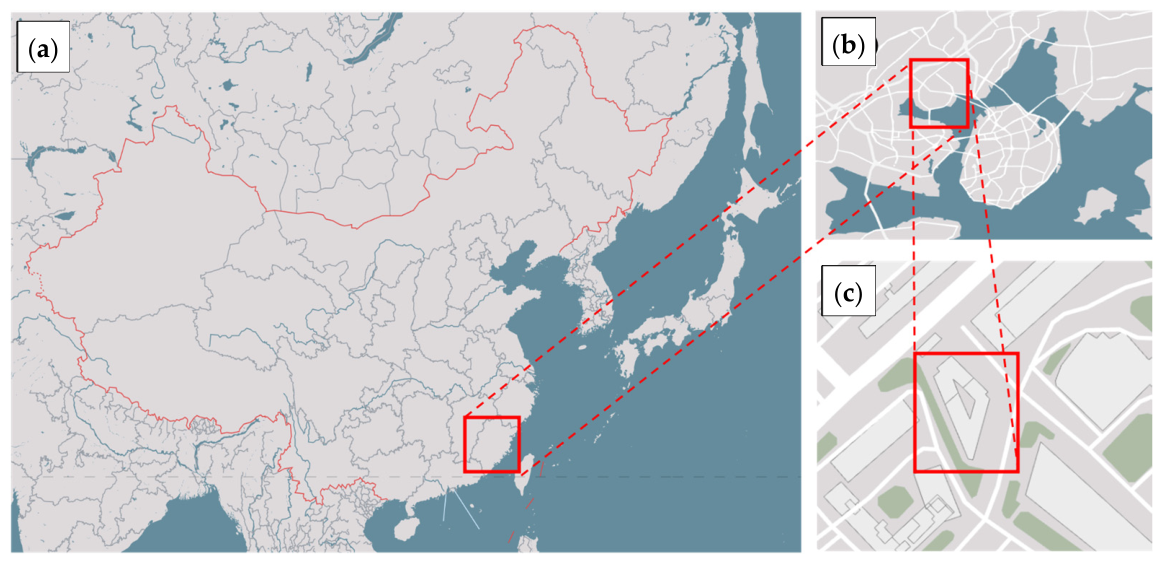
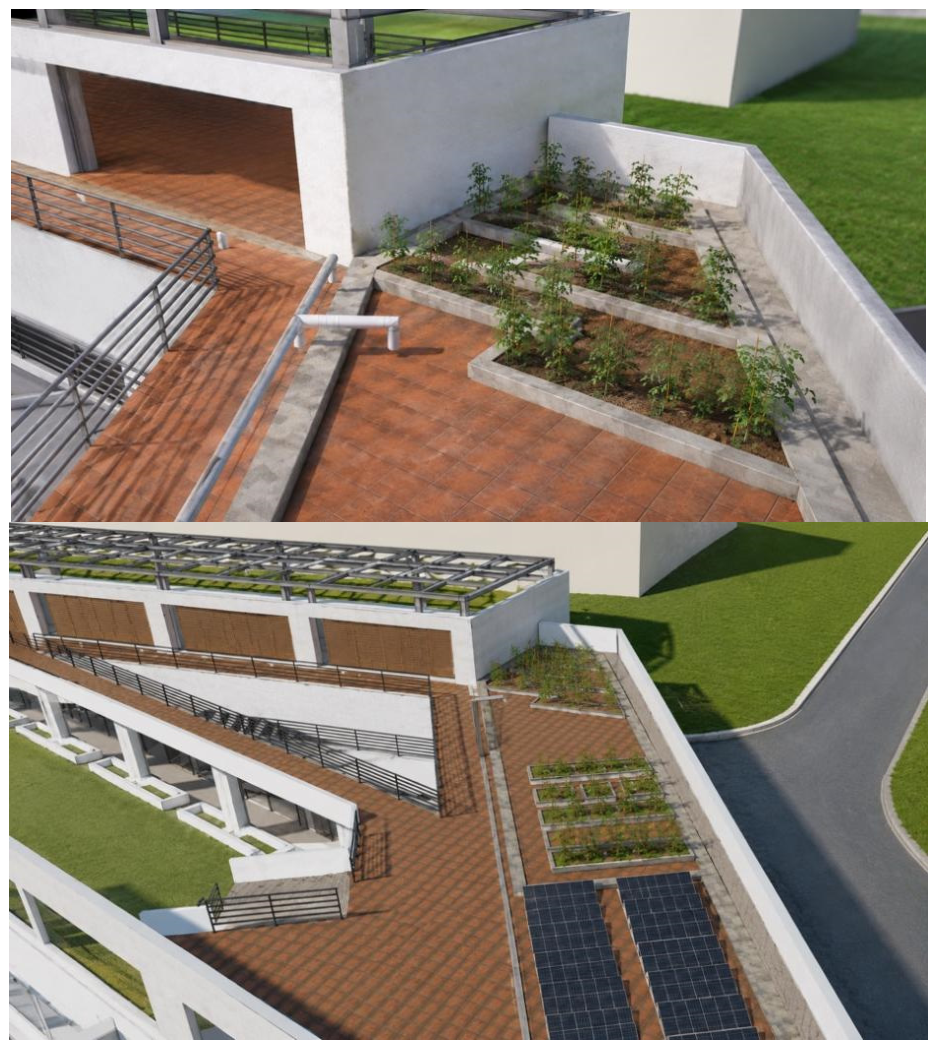
In this study, the rooftop on the fourth floor of the Li Chaoyao Building at the Xiamen Campus of Huaqiao University was selected as the experimental site, which is located in Xiamen, Fujian Province, China (
Figure 3). Xiamen is located on the southeastern coast of Fujian Province and has a typical subtropical maritime monsoon climate, characterized by hot summers, warm winters, and mild and humid conditions. The annual average temperature is approximately 22 °C, and precipitation is abundant, making the region suitable for the growth and development of various types of vegetation. However, typhoons frequently occur from July to September each year, and natural conditions such as high humidity, high salinity, and high wind speed pose challenges to rooftop cultivation.
In terms of the distribution of urban rooftop space resources, the green roof area of low-rise buildings, namely buildings with one to six floors, accounts for 70.6% of the total green roof area in Xiamen [
48]. This indicates that low-rise buildings are the main carriers of rooftop greening in this region. Based on this condition, the height of the experimental site is representative of low-rise buildings, and the experimental results can provide a reference for the optimized management and wider application of rooftop farms on similar low-rise buildings in southeastern coastal areas.
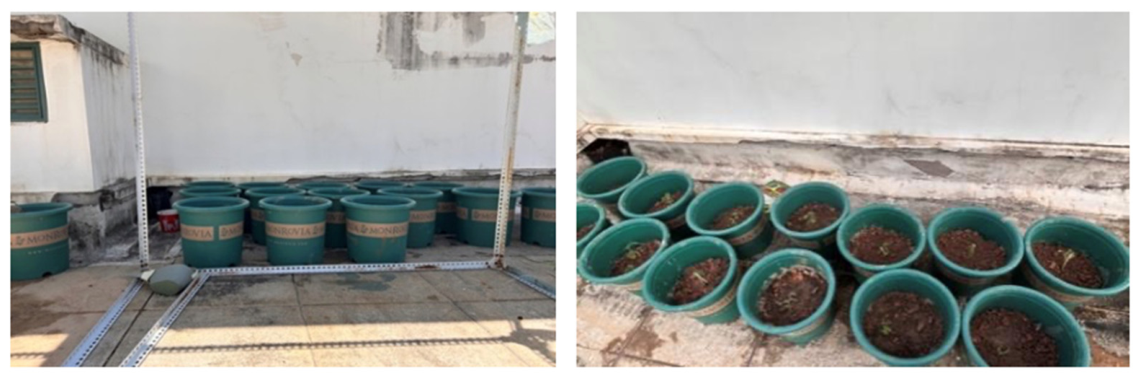
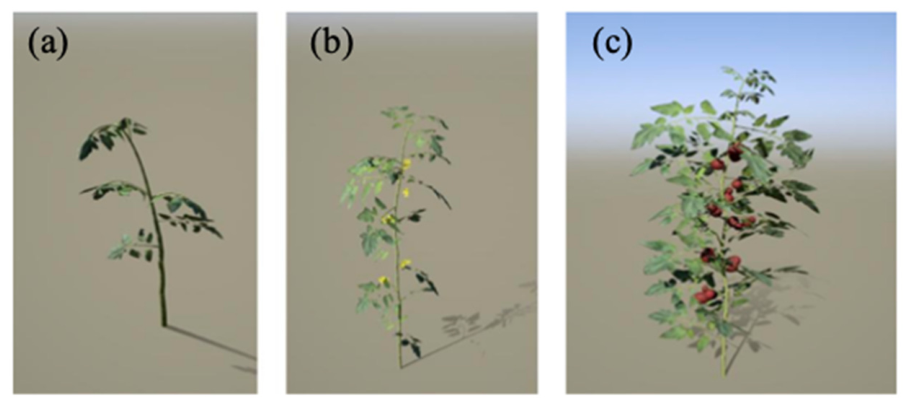
Tomato was selected as the experimental crop, and the cultivar was Fenguan No. 1 (
Figure 4). Tomato was chosen as the research object because it has both productive and ornamental value and can therefore reflect the multifunctional characteristics of rooftop farms. In addition, its phenological stages are clear, and key indicators such as leaf area index, aboveground biomass, and yield are relatively easy to monitor, making it suitable for data collection in plant growth simulation and prediction. Moreover, tomato is sensitive to changes in temperature, light, and water conditions, and can clearly reflect the influence of the rooftop microclimate on plant growth. It is therefore appropriate for validating the applicability of the virtual sensor-driven digital twin method proposed in this study in rooftop farm scenarios.
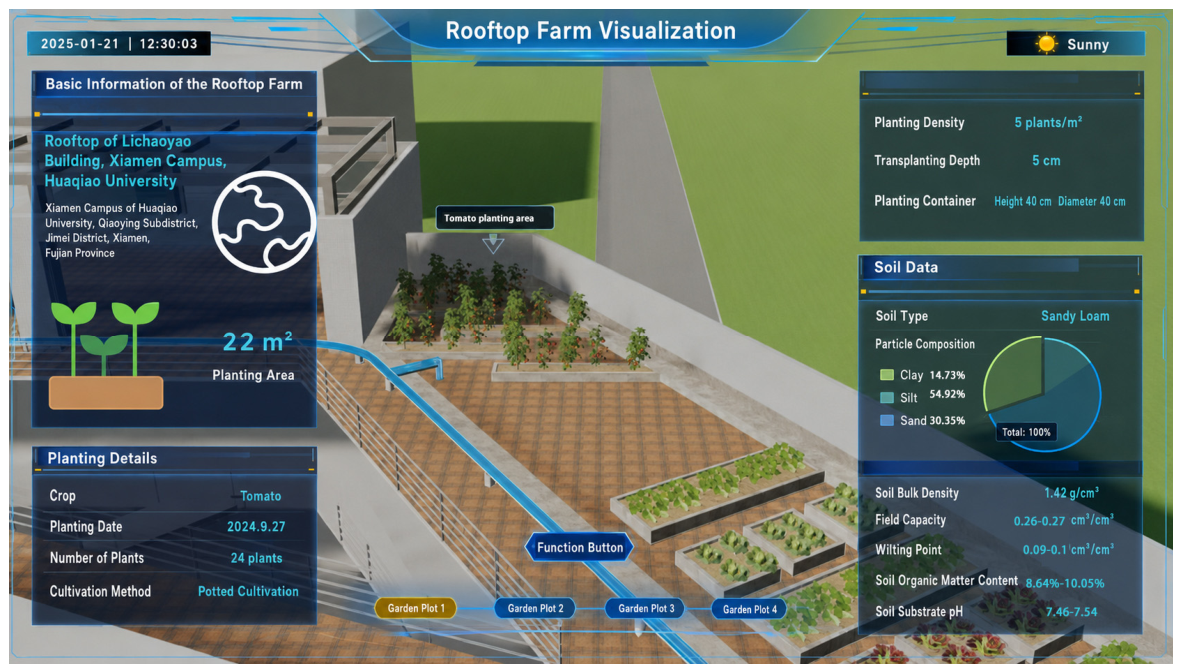
In this experiment, 24 tomato seedlings were transplanted on 27 September 2024. Pot cultivation was adopted. Each planting pot was approximately 39 cm in height and 40 cm in diameter, with one plant grown in each pot. The planting density was 5 plants/m2, and the transplanting depth was 5 cm. A small weather station was installed at the site to monitor air temperature, humidity, and photosynthetically active radiation in real time. The soil type was sandy loam, with an effective soil depth of 30 cm. Field management practices, including pruning, lateral shoot removal, and pest and disease control, were carried out according to conventional cultivation management standards.
3.2. Data Collection Methods
Data collection was conducted in the tomato experimental area on the rooftop of the fourth floor of the Li Chaoyao Building at the Xiamen Campus of Huaqiao University from 27 September 2024 to 29 January 2025. The collected data included four categories: physical environment data, growth environment data, plant growth data, and management knowledge data. These data were mainly obtained through field surveying and mapping, on-site photography, continuous monitoring by the weather station, soil sample measurement, regular field observations, and literature review.
- (1)
Physical environment data collection: The overall geometric structure of the rooftop, air-conditioning equipment, ventilation pipelines, drainage system, planting troughs, and planting substrate were obtained through field surveying and mapping. All surveying data were stored in the form of CAD architectural drawings, providing basic materials for the subsequent construction of the three-dimensional rooftop farm scene.
- (2)
Growth environment data collection: Growth environment data included meteorological data and soil data. Meteorological data were continuously collected by a small weather station installed in the rooftop tomato planting area. The collection period covered the entire process from tomato transplanting to the end of observation, namely from 27 September 2024 to 29 January 2025, and the data were exported from the device cloud platform. The variables recorded by the sensors included air temperature, air humidity, rainfall, and photosynthetically active radiation. The collected data were automatically stored by the platform.
The soil used in this study was sandy loam. Soil bulk density, field capacity, wilting point, clay content, silt content, initial soil water content, pH, and organic matter content were measured at different soil depths using standard laboratory procedures. These parameters were used to construct the DSSAT soil input file, and the measured soil properties are presented in
Table 1. The measurement of meteorological and soil data provided input and validation data for the operation of the virtual sensor.
- (3)
Plant growth data collection: Plant growth data included leaf area index (LAI), phenology, aboveground biomass, yield, and plant growth traits.
LAI measurements began on the 10th day after transplanting and were conducted once per week. During the early transplanting stage, the plants were still in the seedling recovery period, and leaf growth and canopy development had not yet stabilized. Therefore, 10 days after transplanting was selected as the starting point for monitoring to reduce the influence of transplanting disturbance on the observations. Weekly monitoring covered the major stages of tomato growth, including vegetative growth, flowering and fruiting, and later-stage decline, and met the data requirements for the stage-based calibration and validation of the crop growth model. The observation dates covered the main tomato growth stages, allowing the dynamic changes in LAI to be characterized more completely.
At each observation date, LAI was measured using an LAI-2200C Plant Canopy Analyzer (LI-COR Biosciences, Lincoln, NE, USA). For each measurement, one above-canopy reading and multiple below-canopy readings were taken around the tomato canopy according to the instrument operating procedure. The measurements were conducted under diffuse light conditions as far as possible to reduce the influence of direct solar radiation. The mean LAI value was then calculated and recorded for subsequent model validation (
Table 2). The data collection of LAI, phenology, aboveground biomass, and yield provided data references for the validation of the virtual sensor, while the collection of plant growth traits provided data references for the 3D Spatial Mapping Model.
Phenological stages were determined through field observation and manual recording. The recorded phenological indicators included the transplanting date, anthesis date, defined as the date when the first flower had opened on 50% of the plants, and maturity date, defined as the date when the first truss of fruit had matured on 50% of the plants. All phenological data were recorded manually (
Table 3). In addition, to avoid the peak typhoon season from July to September, the tomato seedlings were transplanted on 27 September 2024.
Aboveground biomass was measured by oven-drying and weighing. Measurements were conducted five times. At each sampling time, three vigorous plants with normal growth status were randomly selected for destructive sampling. After sampling, the plant materials were placed in an oven and dried to a constant weight. The samples were then weighed using a laboratory electronic balance, and the data were recorded (
Table 4).
Tomato yield was determined by recording the average number of fruits per plant and the average single-fruit weight, and the total fruit yield per hectare was then estimated based on planting density.
Plant growth traits were recorded every seven days using a ruler and a smartphone camera. The recorded traits included plant height, stem diameter, number of branches, maximum leaf length and width, number of leaves, fruit size, number of fruits, leaf color, stem and fruit color, plant morphology, number of flower trusses, and number of flowers.
- (4)
Management knowledge data collection: To construct a rule-based model for plant growth management decision-making, this study collected empirical data on tomato cultivation management through a literature review. The data were mainly obtained from relevant journal articles, dissertations, and cultivation technical materials indexed in China National Knowledge Infrastructure (CNKI). The search focused on studies related to potted tomato cultivation management, and systematically summarized management strategies for irrigation, fertilization, and canopy index regulation throughout the whole growth period.
These data were mainly used to extract management thresholds, regulation principles, and implementation conditions with practical reference value for tomato cultivation. On this basis, a rule-based model was constructed to provide support for management decisions related to irrigation, fertigation, and pruning in the rooftop farm plant growth digital twin system.
3.3. Three-Dimensional Spatial Mapping Model Construction Methods
The construction of the 3D spatial mapping model was based on the physical environment data and plant growth trait data of the rooftop farm collected in
Section 3.2. SketchUp was used to construct the site model of the rooftop farm, mainly including spatial elements such as the rooftop platform, planting areas, pathways, drainage facilities, air-conditioning equipment, and surrounding structures. The plant models were constructed using SpeedTree. According to the morphological characteristics of tomato plants at different growth stages, plant models were established for the seedling stage, flowering stage, and maturity stage.
After modeling was completed, scale correction, coordinate unification, and object naming were conducted for the site model and plant models, and the models were then combined according to the actual planting positions. Finally, the models were converted into binary glTF (.glb) format, which can be read by the digital twin visualization platform, providing a basis for subsequent data binding of LAI, aboveground biomass, phenology, yield, and other variables.
3.4. Rule-Based Model Construction Methods
The rule-based model was constructed based on the management knowledge data collected in
Section 3.2. It was used to transform tomato cultivation experience into management judgment logic that can be called by the system. In this study, the collected management knowledge was first classified and organized into three types of rule content: irrigation management, fertilization management, and canopy regulation. Then, the applicable growth stages, judgement conditions, and management recommendations in each type of rule were extracted. Finally, these rules were organized into a “condition–judgement–recommendation” rule structure.
According to the plant state variables output by the virtual sensor, including LAI, phenology, aboveground biomass, and yield, the rule-based model generated management recommendations for irrigation, fertilization, pruning, and harvesting activity arrangements.
3.5. Virtual Sensor Model Construction Methods
3.5.1. LSTM Weather Prediction Model Construction and Training Methods
LSTM Weather Prediction Model Construction Methods
In this study, weather prediction was incorporated as an important component of the virtual sensor. A data-driven model based on Long Short-Term Memory (LSTM) was developed to predict meteorological variables for the following seven days, thereby providing continuous environmental inputs for the subsequent DSSAT crop growth model. The input data were derived from historical observation sequences recorded by the rooftop on-site weather station, covering the period from January 2020 to February 2025. The raw data consisted of minute-level continuous records, with 1440 records per day, including minimum temperature, maximum temperature, rainfall, and solar radiation.
To satisfy the requirements of the LSTM model for time-series data, the original minute-level data were aggregated to the daily scale. Specifically, the daily maximum temperature was taken as the maximum value of each day, the daily minimum temperature as the minimum value of each day, the daily rainfall as the cumulative daily value, and the daily solar radiation as the cumulative daily value. To eliminate the influence of differences in feature scales on model training, Min–Max normalization was applied to scale all feature values to the range of [0, 1].
For sample construction, the daily meteorological data were transformed into time-series samples using a sliding-window strategy. The meteorological features of seven consecutive days were used as the input sequence to predict the corresponding meteorological variables for the following day. The model output variables included daily maximum temperature, daily minimum temperature, daily rainfall, and daily solar radiation.
LSTM Weather Prediction Model Training Methods
The preprocessed samples were divided chronologically into a training set and a test set, with 80% of the samples used for training and 20% used for testing. The training set was further divided into an actual training subset and a validation subset. The validation subset was used to monitor the training process and assist in adjusting model parameters. No random shuffling was performed during data partitioning in order to preserve the continuity of the meteorological time series.
The model architecture consisted of three LSTM hidden layers and one fully connected output layer, with a hidden dimension of 64. The Adam optimizer was used with an initial learning rate of 0.001, and L2 regularization was applied using a weight decay coefficient of 1 × 10⁻⁵. A weighted mean squared error was adopted as the loss function to balance the loss contributions of different meteorological variables during joint training. During training, a cosine annealing learning rate scheduling strategy was used, with T_max set to 2000, and the maximum number of training epochs was set to 10,000.
After training was completed, the LSTM model generated daily meteorological data for the following seven days using a rolling prediction strategy. Specifically, the meteorological sequence of the most recent seven days was used to predict the meteorological variables for the first future day. The predicted results were then added to the input sequence to continue predicting the subsequent dates until the sequences of daily maximum temperature, daily minimum temperature, rainfall, and solar radiation for the following seven days were obtained. These prediction results were subsequently used as future meteorological inputs for the DSSAT model.
3.5.2. DSSAT Plant Growth Simulation Model Construction Methods
The construction of the DSSAT model requires the input of weather data, soil data, field management data, and cultivar genetic parameters. Based on these inputs, the model was established and calibrated. According to the data acquisition methods described in
Section 2, the required datasets were prepared and imported into the model.
- (1)
Construction of weather data: The weather data obtained from the microclimate observation station at the Li Chaoyao Building, Xiamen Campus of Huaqiao University, from 2024 to 2025 were organized and imported using the WeatherMan weather module according to the format required by the DSSAT model. The input data included the latitude, longitude, and elevation of the observation station, as well as daily maximum temperature, daily minimum temperature, rainfall, and photosynthetically active radiation.
- (2)
Construction of soil data: The experimentally measured soil parameters were entered into the SBuild module. The soil type used in the experiment was sandy loam, and its soil properties are presented in
Table 1.
- (3)
Construction of field management data: The field management data during the 2024 experimental growth period were entered into the XBuild module. These data included the selection of the tomato cultivar, the constructed weather and soil files, the setting of the simulation period, and the configuration of management parameters such as planting density and transplanting date.
- (4)
Construction of cultivar genetic parameters data: The determination of crop cultivar genetic parameters is a key step in model calibration, as these parameters define the genetic characteristics, developmental traits, and growth parameters of the cultivar. Since the tomato cultivar used in this study, Fenguan No. 1, was the same as that used in Zhao Zilong’s study, and the experimental design was similar, the calibrated cultivar genetic parameters from that study were directly adopted as model inputs in the present study [
49]. This parameter set covers the simulation and validation of key indicators, including yield, leaf area index, aboveground biomass, flowering date, and maturity date (
Table 5).
3.5.3. LSTM–DSSAT Coupled Plant Growth Prediction Methods
In this study, plant growth prediction was conducted by coupling the LSTM data-driven model with the DSSAT mechanistic model. In this coupled framework, the LSTM model was used to generate short-term future weather drivers, while the DSSAT model converted these weather drivers into plant growth state variables. Specifically, the coupling process between LSTM and DSSAT consisted of four steps. First, the historical meteorological data collected by the rooftop weather station were aggregated and preprocessed at the daily scale, and the meteorological sequence of seven consecutive days was used as the input of the LSTM model. Second, the trained LSTM model generated daily meteorological variables for the following seven days, including Maximum Temperature, Minimum Temperature, Daily Accumulated Rainfall, and Daily Solar Radiation. Third, the predicted meteorological variables were written into the weather file in the format required by DSSAT and were used as DSSAT inputs together with constant data, including soil parameters, planting schemes, field management practices, and crop cultivar genetic parameters. Finally, DSSAT output plant state variables, including leaf area index, aboveground biomass, phenology, and fresh weight, which were then written into the MySQL database by scripts for access by the digital twin platform.
On this basis, to automate the prediction workflow, the model input data were divided into two categories: constant data and variable data. The constant data included soil parameters, planting schemes, field management practices, crop cultivar genetic parameters, and the initial configuration of the weather file, which were completed once during system initialization. The variable data consisted of meteorological variables, which needed to be dynamically updated each day and inserted into the weather file in a rolling manner. A Python (v3.12) script launched at a fixed time each day first called the trained LSTM model and generated a seven-day daily weather forecast sequence based on the latest measured meteorological data. The forecast was updated daily using the latest observed meteorological data (
Code S1). The script then automatically wrote the forecast results into the DSSAT weather file in .WTH format, replacing the old data for the corresponding dates (
Code S2). Through scheduling by Windows Task Scheduler, the DSSAT model was automatically run once per day and performed daily simulations based on the updated weather file and the preset constant data. After the simulation was completed, the script read the Summary.OUT output file generated by DSSAT, extracted the key growth indicators, converted them into the required format, and stored them in the MySQL database (
Code S3). Finally, the digital twin visualization platform called the relevant data through the database interface to realize the dynamic display and update of plant growth status.
3.5.4. Model Validation and Evaluation Metrics
Model validation was conducted using measured data independent of the calibration or training period. The coefficient of determination (R
2), root mean square error (RMSE), absolute relative error (ARE), and normalized root mean square error (nRMSE) were used to evaluate model performance and accuracy. R
2 was used to evaluate the goodness of fit of the model; the closer the R
2 value is to 1, the better the predictive performance of the model [
50]. RMSE mainly measures the difference between predicted values and observed values, with smaller RMSE values indicating higher accuracy [
51]. ARE and nRMSE are positively related to model simulation error; that is, smaller values indicate lower simulation error. For ARE, a machine learning or regression model is generally considered highly accurate when
10%, and relatively accurate when 10%
20%. The value of nRMSE ranges from 0 to 1 and is used to describe simulation performance by reflecting the average relative deviation between simulated and observed values. When nRMSE
10%, the model simulation accuracy is considered high; when 10%
20%, the simulation accuracy is considered relatively high; when 20%
30%, the model shows moderate deviation; and when
30%,the simulation results are considered to have large errors compared with the observed results [
52].
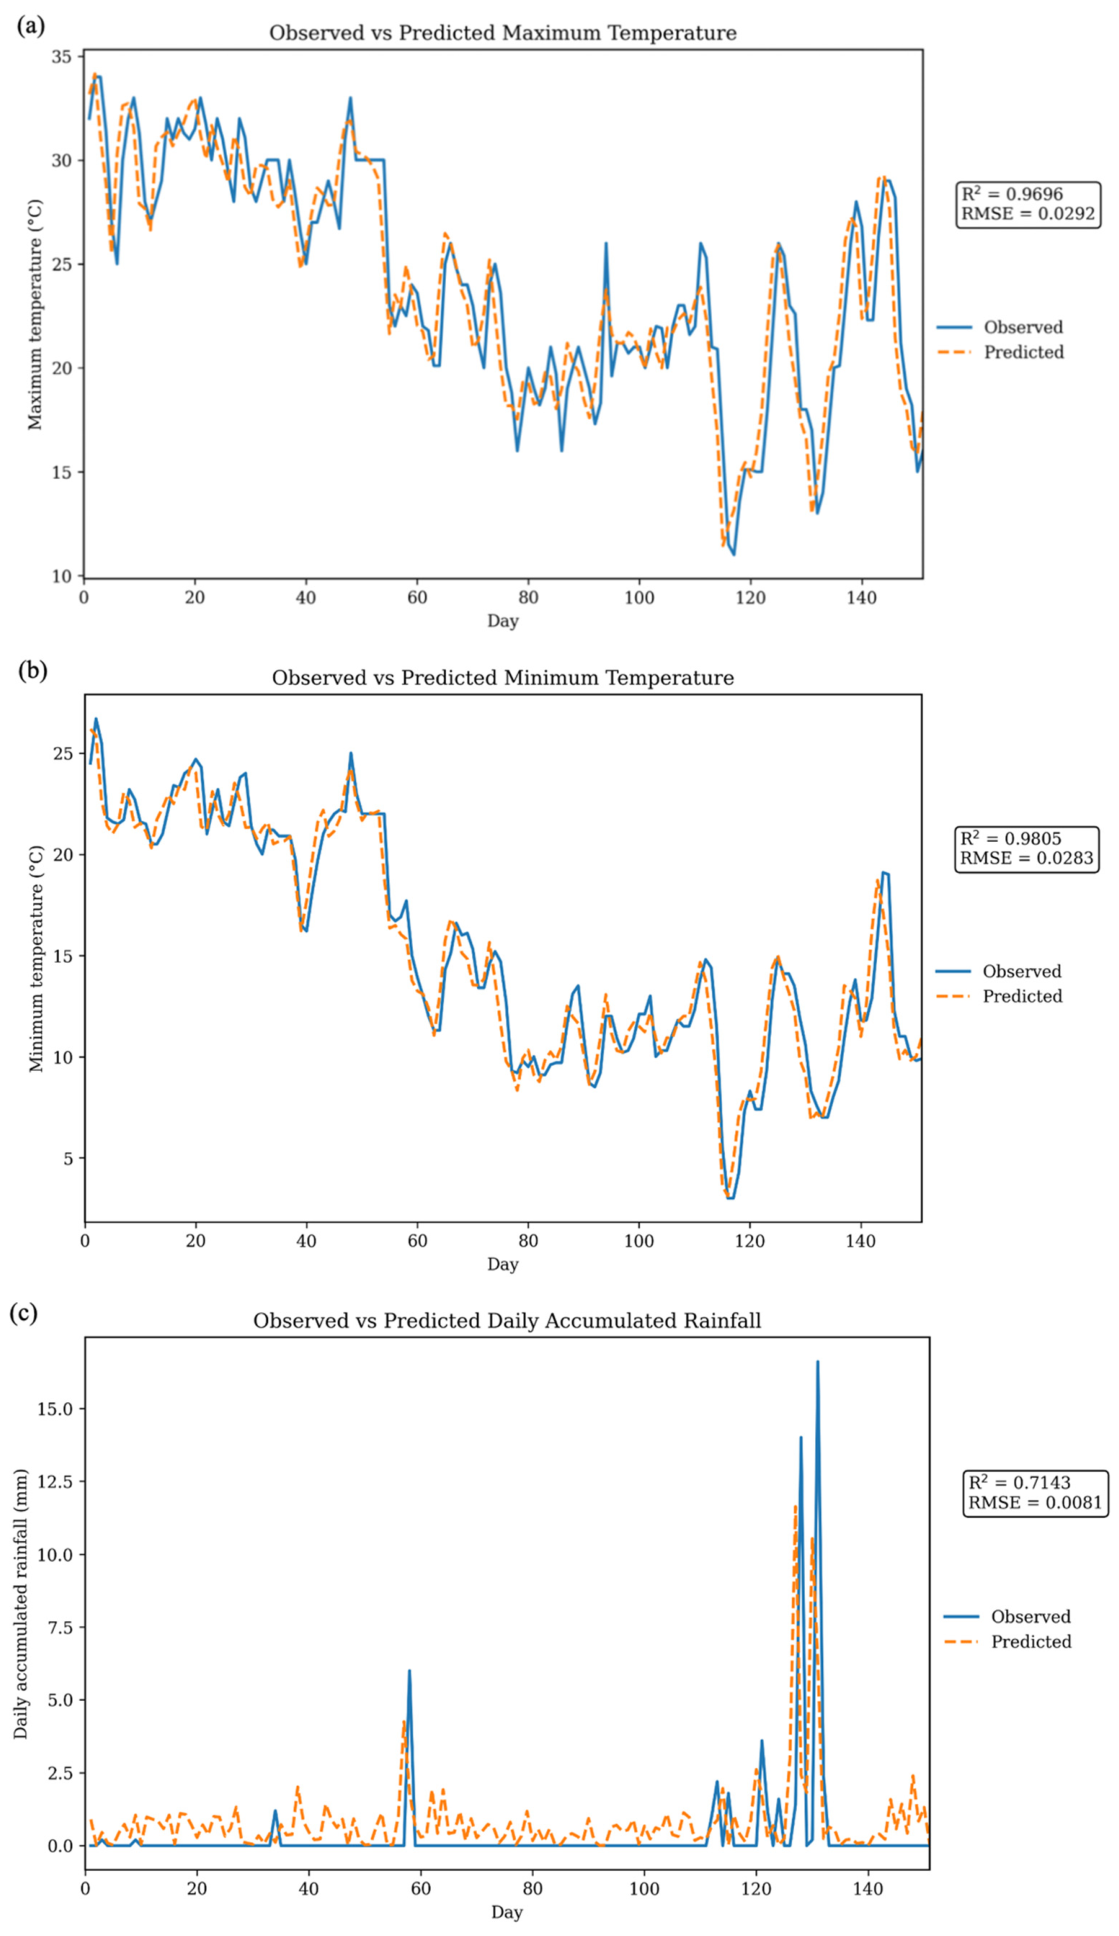
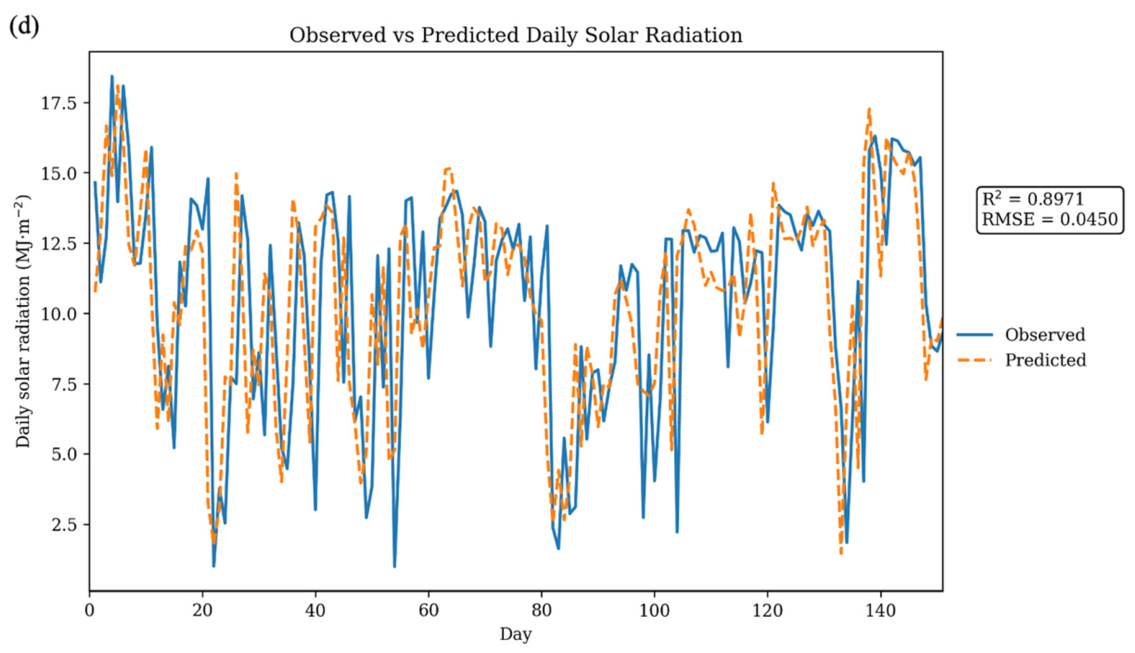
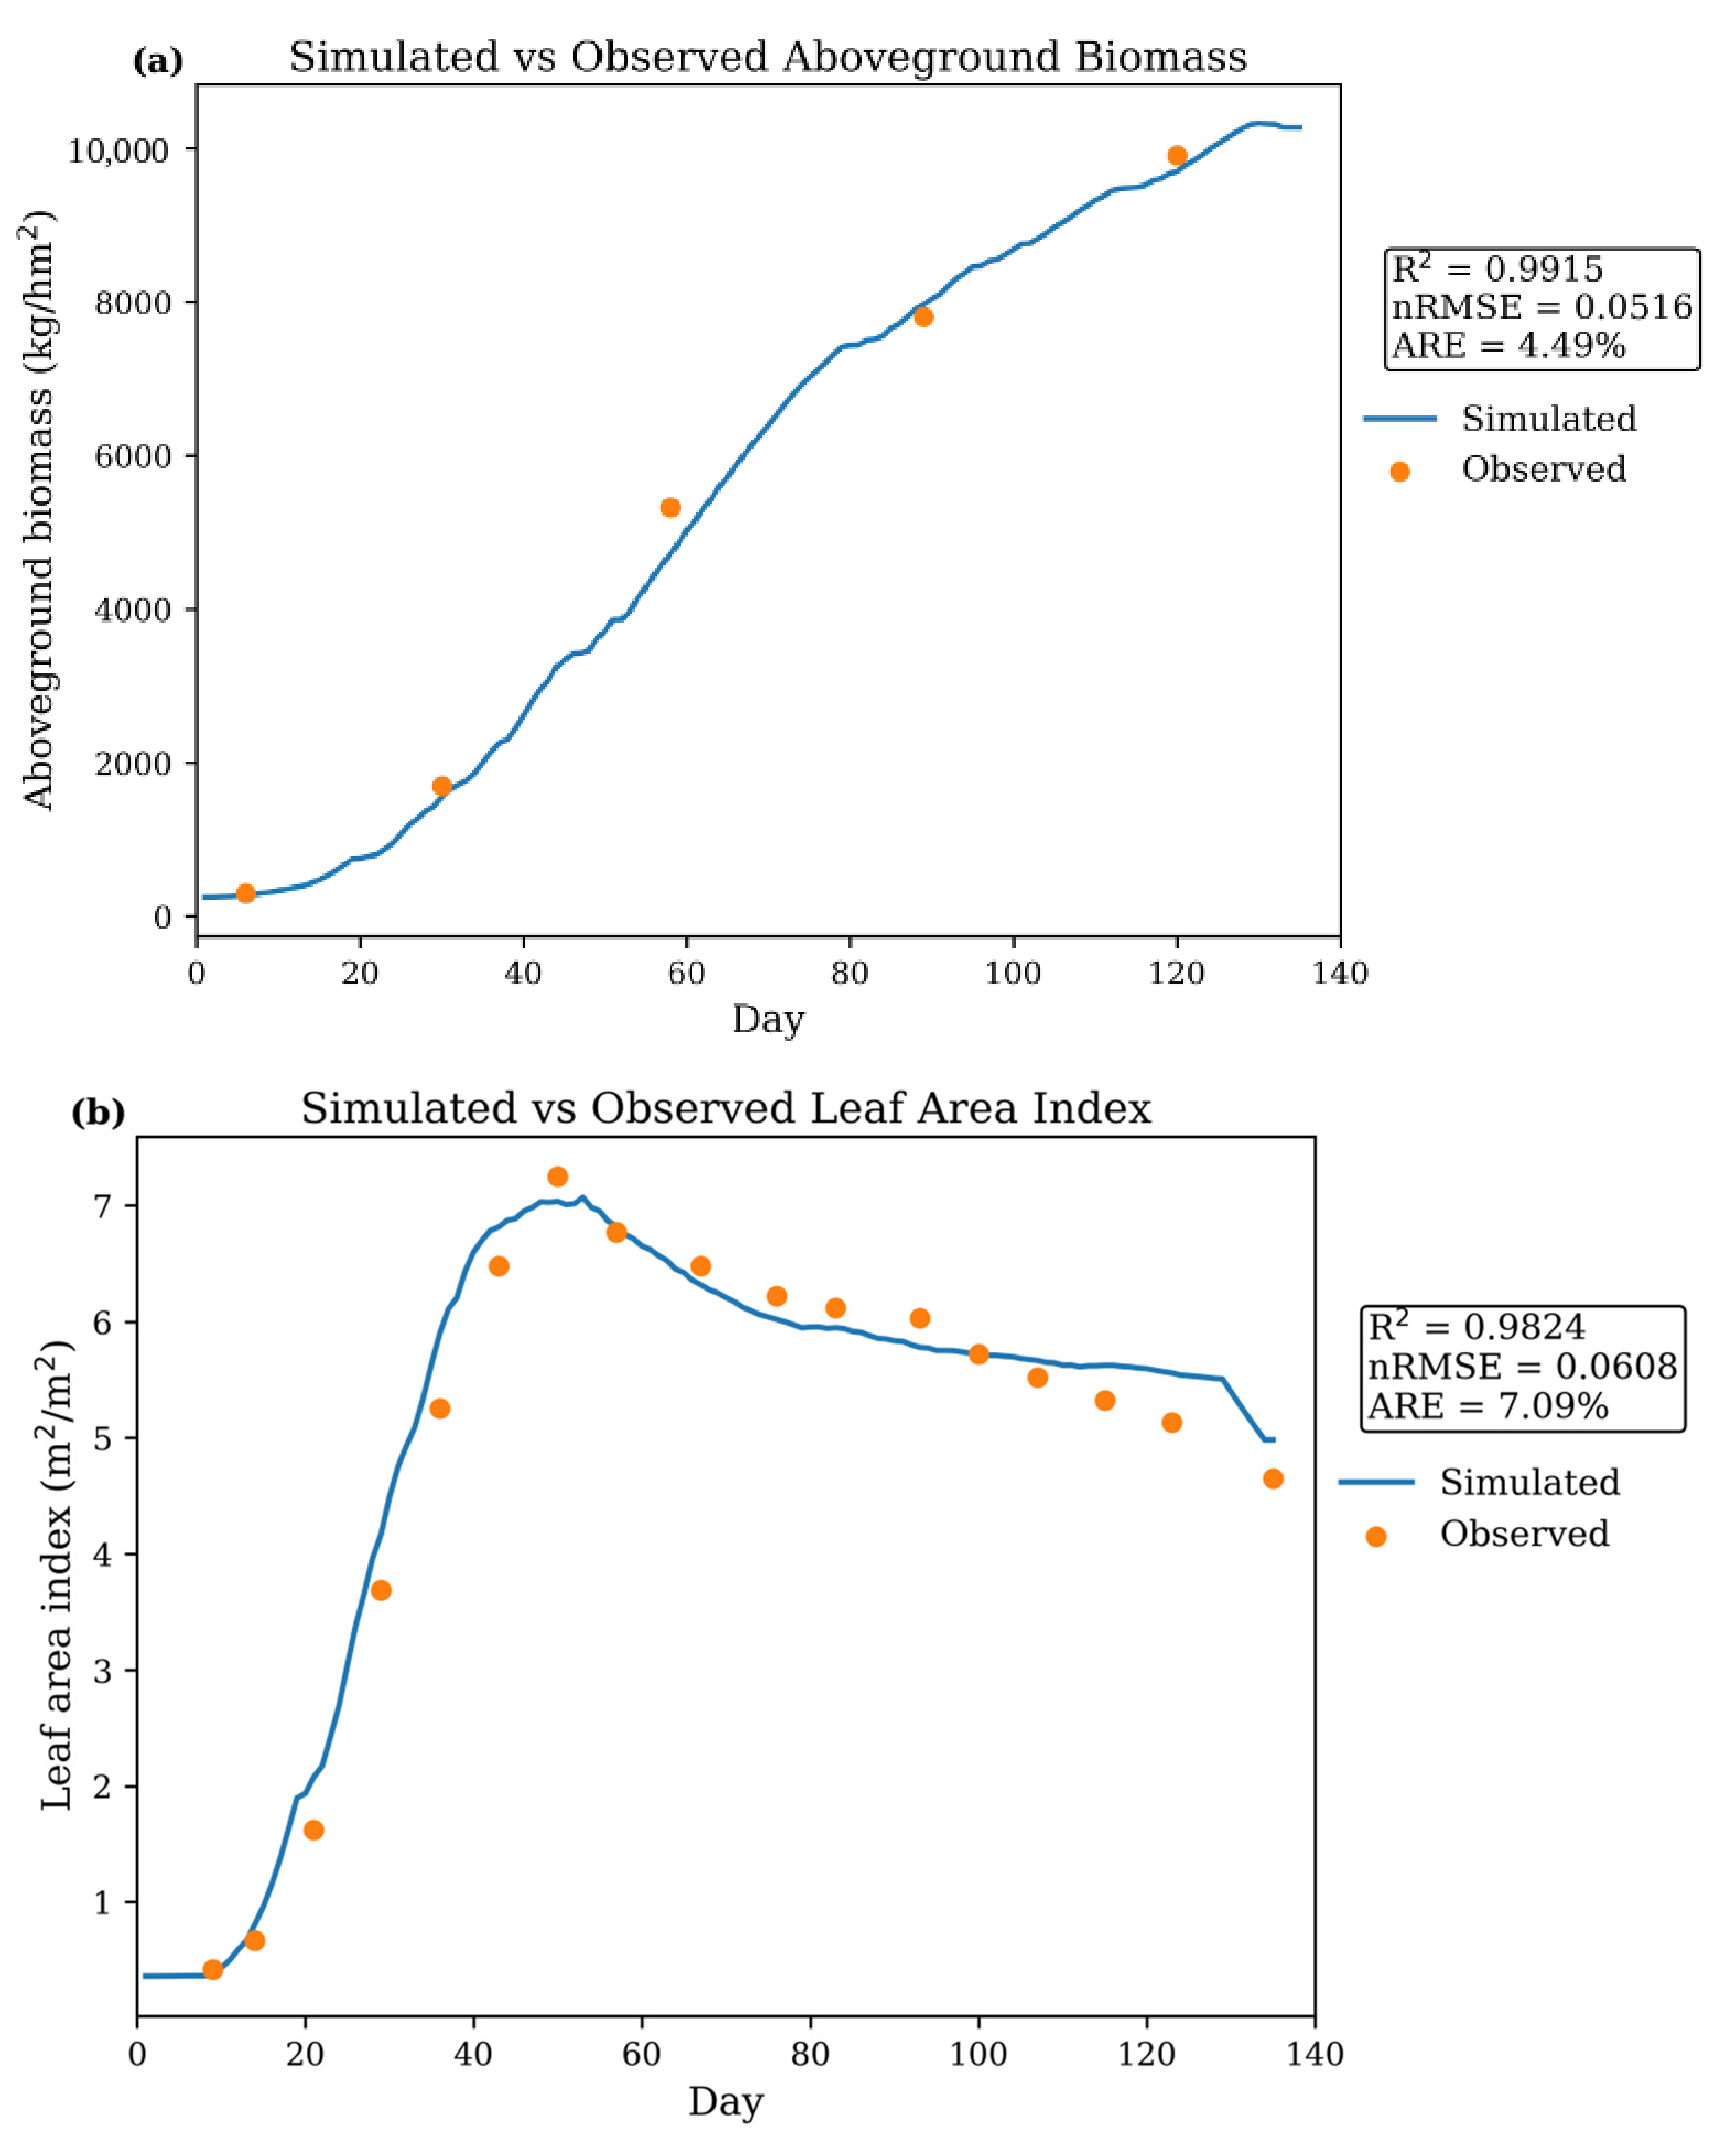
In this study, these indicators were used to test the performance of the DSSAT and LSTM models separately. For the DSSAT model, R2, RMSE, ARE, and nRMSE were used to evaluate the simulation performance for key growth indicators, including leaf area index, aboveground biomass, and phenology, in order to determine whether the calibrated model could accurately represent the growth process of rooftop farm tomatoes. For the LSTM model, these indicators were used to compare predicted meteorological variables with observed meteorological data, with a particular focus on the prediction performance for temperature, precipitation, and photosynthetically active radiation. This evaluation was conducted to determine whether the LSTM model could provide reliable future meteorological inputs for the DSSAT model. Based on the combined results of these evaluation indicators, the two sub-models were assessed to determine whether they met the accuracy requirements for subsequent virtual sensor coupling simulation and digital twin platform application.
The four evaluation metrics were calculated using the following equations:
where
denotes the observed value,
denotes the fitted value,
denotes the mean of the observed values, and
n denotes the number of data points.
and
denote the
-th simulated value, the
-th measured value, and the mean of the measured values, respectively.
3.6. Data Processing Methods
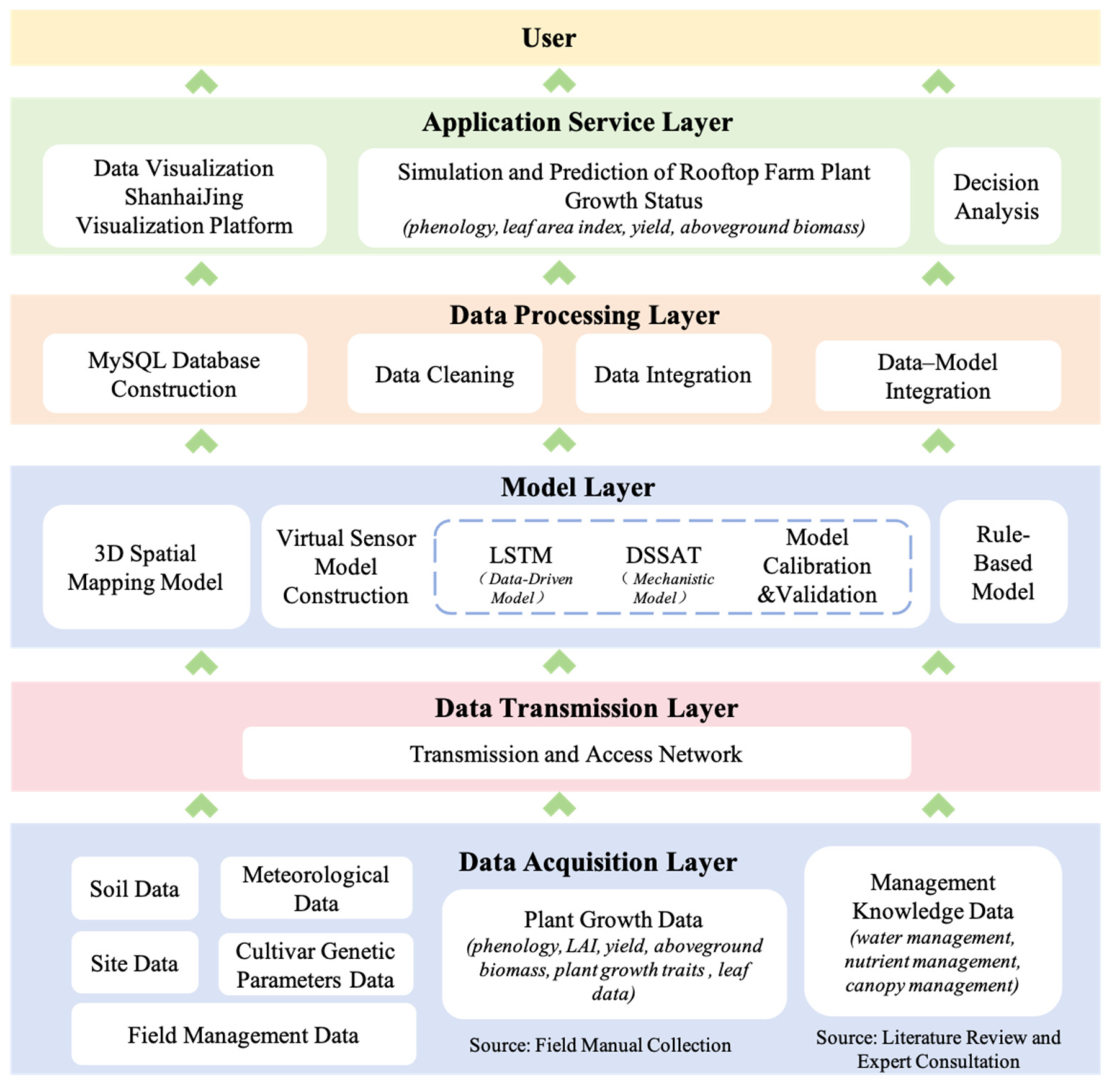
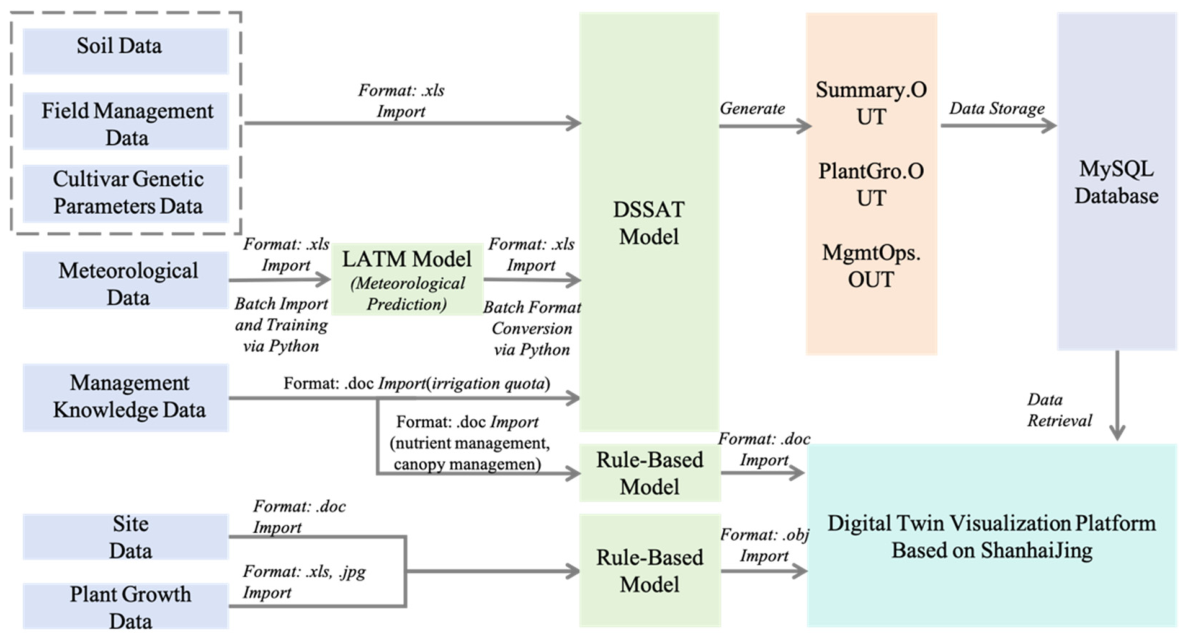
The data processing layer was used to uniformly organize, manage, and transform the multi-source heterogeneous data involved in the operation of the digital twin system. It mainly included four components: database construction, data cleaning, data integration, and data–model integration. The data processing workflow is shown in
Figure 5.
For database construction, a MySQL relational database was used to store and manage plant growth simulation and prediction data. The preprocessed data were imported into the database according to predefined field-mapping rules. The main fields included date, record type, leaf area index, aboveground biomass, anthesis date, maturity date, yield, number of irrigation events, and total irrigation amount, providing a basis for model result storage and platform calls.
For data cleaning, the raw data required unified preprocessing because of differences in data sources and formats, including on-site images, field surveying files, sensor-recorded data, and management knowledge data compiled from literature and online materials. The preprocessing procedures included format organization, field standardization, temporal alignment, outlier and missing-value checking, and the unification of variable names and units, so as to ensure the consistency of data calls and model computation.
For data integration, different types of data were organized according to their functions. Meteorological data, soil data, crop management data, and plant variety parameters were used as basic inputs for the operation of the virtual sensor model. Plant growth observation data were used for model validation. Management knowledge data were used to construct the rule-based model, while site data and plant growth trait data were used to construct the 3D spatial mapping model. These data were therefore organized into data resources that could be called by the digital twin system.
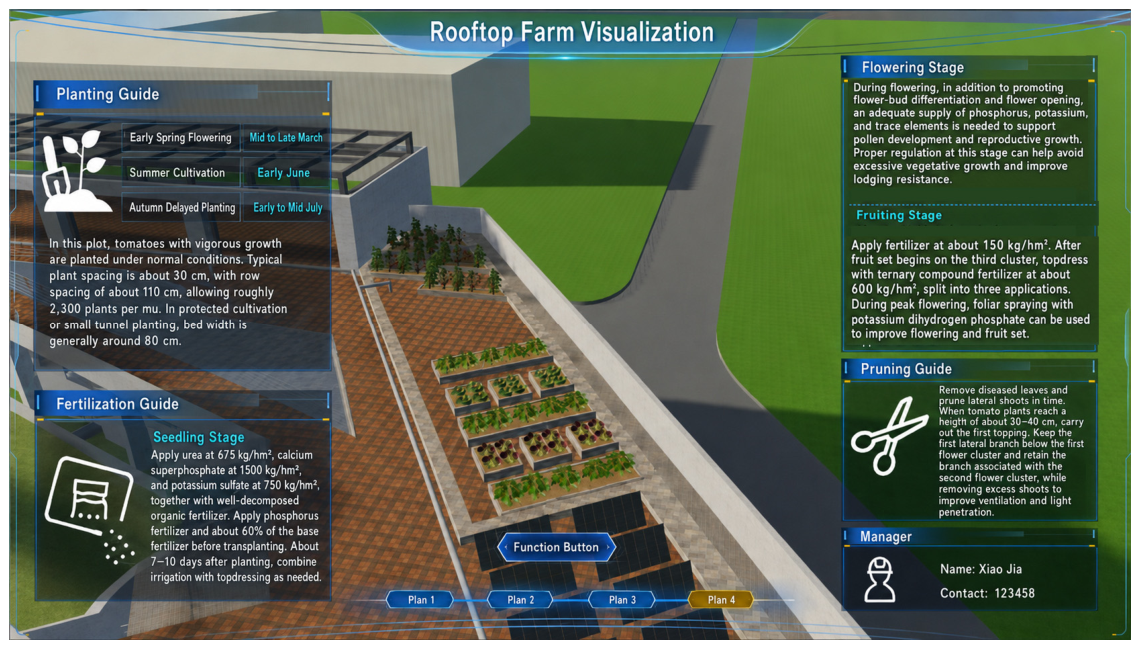
For data–model integration, meteorological observation data were first input into the LSTM model to generate meteorological prediction sequences for the following seven days. The predicted meteorological data, together with soil data, crop management data, and plant variety parameters, were then input into the DSSAT model to simulate and predict plant growth status. The DSSAT output files, including Summary.OUT, PlantGro.OUT, and MgmtOps.OUT, were parsed by Python scripts, and results such as leaf area index, aboveground biomass, phenology, yield, and irrigation information were written into the MySQL database. Meanwhile, management knowledge data were organized into the rule-based model, while site data and plant growth trait data were used to construct the 3D spatial mapping model. Finally, the database, 3D model files, and rule-based model were jointly connected to the Shanhaijing-based digital twin visualization platform, enabling linked display among data, models, and the visualization interface.
For platform selection, Shanhaijing Visualization was selected as the front-end display platform. The platform supports multiple data formats and connection methods, such as GLB files, Excel spreadsheet (XLS) files, and application programming interfaces (APIs), and provides functions for data binding and interactive design, meeting the requirements for dynamic updating and visual display of plant growth data in rooftop farms.
3.7. Application Service Layer Construction Methods
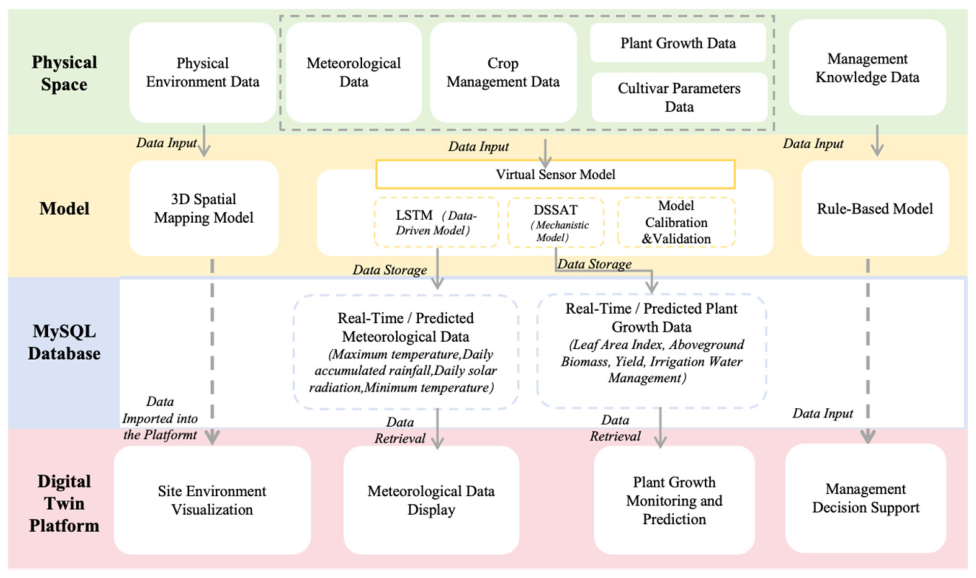
This section describes the construction methods of the application layer of the rooftop farm plant growth digital twin platform. Based on the preceding data collection, model construction, and data processing results, Shanhaijing Visualization was used as the front-end platform to integrate meteorological data, plant growth data, site environment data, and management knowledge data. Through database calls, 3D scene binding, and rule information display, the model outputs were transformed into functional modules of the platform. The platform integration workflow is shown in
Figure 6. The following subsections describe the integration of weather data, plant growth data, site environment data, and management knowledge data, respectively.
3.7.1. Weather Data Integration
Weather data integration aims to provide continuously updated environmental background information for the digital twin platform and to offer climatic support for interpreting plant growth monitoring and prediction results. As shown in
Figure 6, the weather data used in this study consist of two parts. The first part is the real-time observation data collected by the small on-site weather station, which mainly reflect the current microclimatic conditions of the rooftop farm. The second part is the seven-day daily weather prediction sequence generated by the LSTM model, which supports subsequent plant growth prediction.
In the integration workflow, the real-time weather observation data are first preprocessed and standardized to form platform-callable weather data. Meanwhile, the historical weather observation data are input into the LSTM model for training and prediction, generating meteorological variables for the following seven days, including Maximum Temperature, Minimum Temperature, Daily Accumulated Rainfall, and Daily Solar Radiation. On the one hand, the prediction results are written into the weather file required by the DSSAT model as driving inputs for plant growth prediction. On the other hand, both the real-time weather data and the predicted weather data are parsed by scripts and written into the MySQL database, forming weather data resources that can be directly accessed by the platform.
The Shanhaijing visualization platform reads the real-time and predicted weather data through the database interface and displays them separately in the platform interface. In this way, the platform can simultaneously present the current environmental status of the rooftop farm and the short-term future weather trends, providing environmental references for plant growth status assessment, phenology prediction, and subsequent management decision-making.
3.7.2. Plant Growth Data Integration
Plant growth data integration aims to convert the key state variables output by the crop growth model into data resources that can be stored, accessed, and visualized, thereby enabling the dynamic monitoring and predictive representation of the plant growth process in rooftop farms. As shown in
Figure 6, the generation of plant growth data depends on the operation of the virtual sensor model. The key indicators output by the model include leaf area index, aboveground biomass, anthesis date, maturity date, fresh weight, and irrigation-related information for both the simulated current day and the predicted following seven days.
During the data integration process, the DSSAT model output results are automatically parsed by Python scripts. After the key fields are extracted, they are written into the MySQL database to form a structured plant growth data table. The database fields are consistent with the platform display requirements, allowing the front end to access the data according to date, indicator type, and record type. In this way, the simulated and predicted values that were originally scattered across model output files are uniformly transformed into data resources that can be recognized by the digital twin platform.
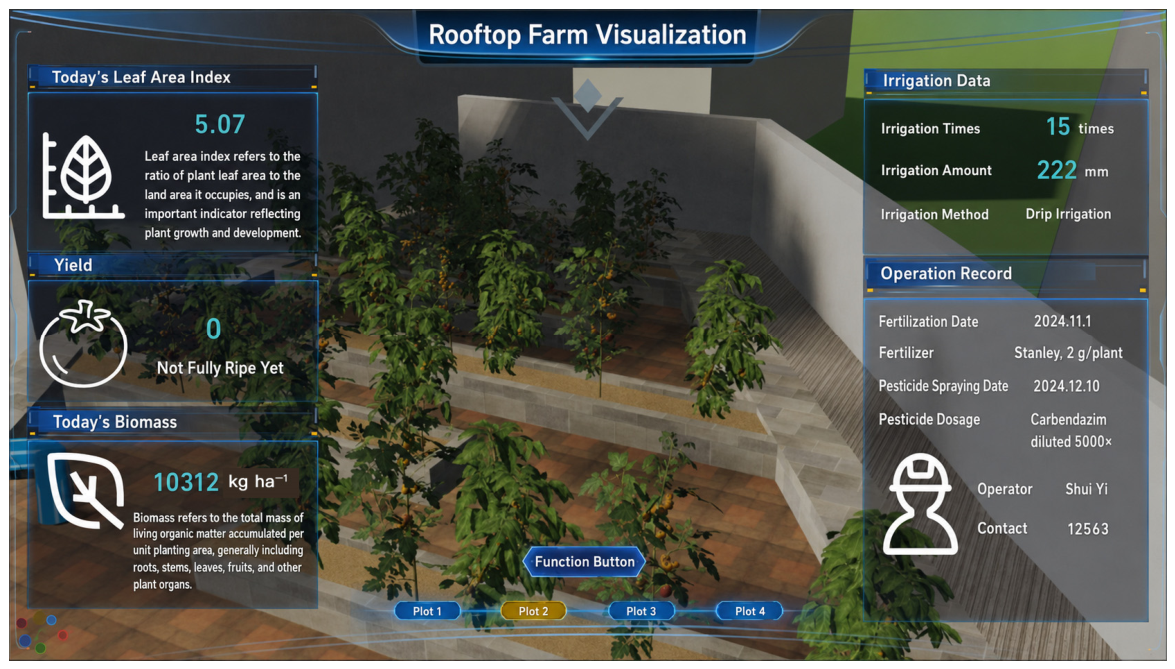
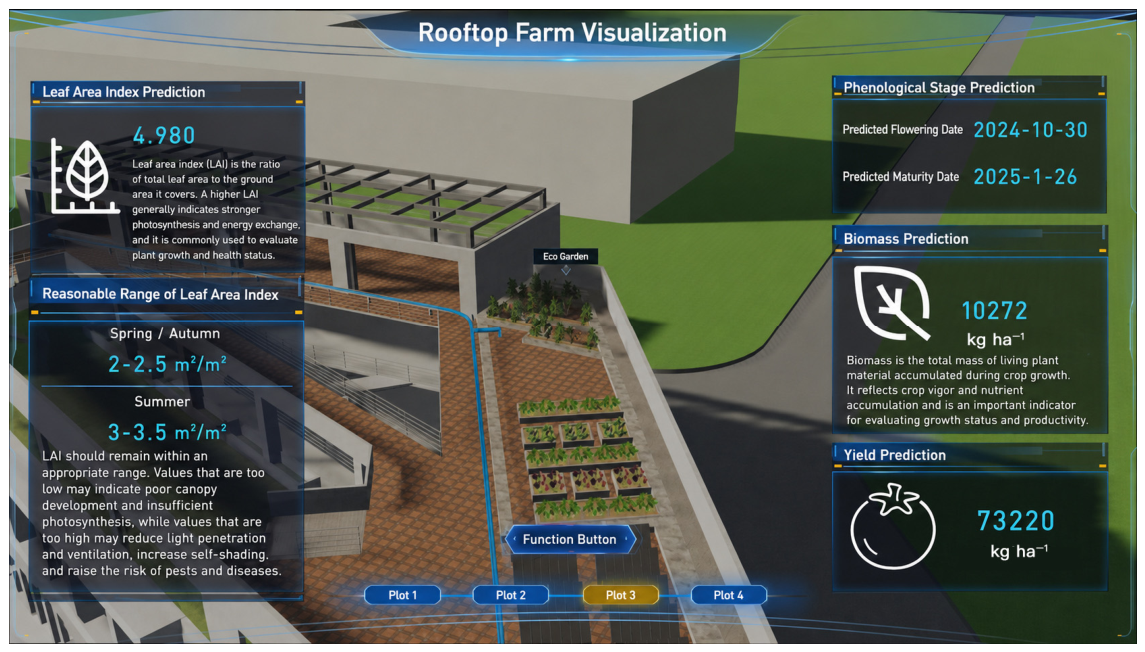
The Shanhaijing visualization platform reads the plant growth data through the database interface and displays indicators such as simulated and predicted leaf area index, aboveground biomass, fresh weight, and phenology in the form of charts, text, and status information. Meanwhile, based on preset data-binding logic, the platform can link selected plant growth indicators with the states of the 3D models. For example, the plant model state can be switched according to changes in anthesis date, maturity date, or leaf area index, thereby enabling linked visualization between plant growth data and the 3D scene.
3.7.3. Site Environment Data Integration
Site environment data integration aims to incorporate the spatial carrier, facility layout, and plant distribution of the rooftop farm into the platform in the form of a digital scene, thereby providing a visual representation basis for plant growth data and management information.
As shown in
Figure 6, this study first obtained site environment data, including roof structure, planting area layout, ventilation equipment, drainage facilities, irrigation facilities, and plant distribution, based on field surveying, on-site photography, and spatial data organization. Subsequently, 3D modeling software was used to construct the site model and plant models, and the model files were imported into the digital twin visualization platform. Using this 3D scene as the visual base map, the platform binds plant growth data, weather data, and management information to the corresponding spatial objects, thereby transforming the static site model into a dynamic digital twin scene.
3.7.4. Rule-Based Model Data Integration
Rule-Based model data integration aims to transform literature-based knowledge and empirical rules related to tomato cultivation management into decision-support information that can be directly displayed on the platform front end, thereby providing management support for the daily operation and maintenance of rooftop farms.
As shown in
Figure 6, this study structured the knowledge related to irrigation water management, fertilization management, and canopy regulation, and organized it according to plant growth stages and management types. On the platform side, the relevant content is displayed in the form of textual descriptions, management recommendations, and threshold reminders, and is linked with the plant growth monitoring and prediction results. For example, when the platform displays future trends in LAI, phenology, or irrigation requirements, it can simultaneously provide corresponding recommendations for pruning, water and fertilizer management, or activity organization. In this way, the platform realizes the transformation from model prediction results to management decision-making information.
5. Discussion
This study constructed and validated a virtual sensor-driven plant growth digital twin system using rooftop tomato cultivation in Xiamen as a case study. The results indicate that the framework coupling LSTM-based weather prediction with the DSSAT crop growth model can dynamically simulate key plant growth states and provide short-term predictions for the following seven days under constrained physical sensor deployment. This provides a feasible pathway for continuous plant growth monitoring in rooftop farms.
Compared with existing studies, this study provides several implications.
First, in terms of coupled model prediction, this study integrated the LSTM weather prediction model with the DSSAT crop growth model. The former was used to extend limited meteorological observations into future weather sequences, while the latter used the predicted meteorological inputs to drive the simulation of plant physiological processes. This coupling enabled the system to combine short-term climate prediction with mechanism-driven plant state estimation, rather than relying on static single-point inference. In terms of prediction accuracy, the model showed relatively high accuracy for phenology. The ARE values for anthesis and maturity prediction were only 3.23% and 4.20%, respectively, indicating that the parameterized representation of tomato developmental processes in the DSSAT model remained applicable in the rooftop environment. The ARE for yield prediction was 7.90%, which was still within an acceptable range, although the error was higher than that for phenological prediction. This may be related to deviations in the model simulation of dry matter allocation and fruit development under the specific local microclimatic conditions of rooftop farms. The errors of the coupled prediction framework may mainly come from two sources. One is the prediction bias of the LSTM model for future temperature, rainfall, and solar radiation, especially during heavy rainfall events or periods of abrupt radiation change. The other is the uncertainty in the parameterized representation of the DSSAT model, including differences between cultivar genetic parameters and actual planting conditions, as well as the limited spatial representativeness of single-point weather station observations for rooftop microclimates. In addition, errors in manually observed data may also affect model calibration and validation results. Future studies could further reduce model prediction uncertainty by increasing the frequency of ground-truth validation, introducing multi-source sensing data such as UAV remote sensing and canopy temperature monitoring, and applying data assimilation techniques.
Second, in terms of digital twin platform functions, this study focused on urban rooftop farms and integrated key plant growth indicators with a 3D visualization platform and operation and maintenance decision recommendations. As a result, the system not only supports monitoring and prediction, but also transforms prediction results into management reference information for irrigation, fertilization, pruning, harvesting experiences, and science education activities. This can support landscape management, social service scheduling, and refined operation and maintenance of rooftop farms. Unlike many existing studies that focus mainly on crop yield or resource-use efficiency as a single optimization objective, the platform constructed in this study can assist in optimizing irrigation timing and irrigation amount according to plant water demand and future weather prediction. This helps ensure normal plant growth while reducing water waste and the operation and maintenance risks associated with rooftop drainage and waterproofing. Meanwhile, based on predicted anthesis and maturity dates, managers can plan harvesting experiences, nature education, and community gardening activities in advance, thereby enhancing the social service function of rooftop farms as urban public spaces. The platform also helps compensate for insufficient continuous sensing capacity under constrained physical sensor deployment and provides a reference for the smart operation and maintenance of other urban green infrastructure systems, such as vertical greening systems, rooftop gardens, and community gardens.
Finally, this study still has several limitations. First, in terms of sample size, the experimental validation was based on single-season data from a single rooftop farm in Xiamen, and the amount of data was relatively limited. The generalizability of the model requires further verification using larger-scale and multi-season datasets. Second, in terms of crop type, this study used tomato as the research object, and the DSSAT model parameters were calibrated for a specific tomato cultivar. If the method is transferred to leafy vegetables, root and tuber crops, or other fruit and vegetable crops, cultivar parameters need to be recalibrated. Third, in terms of regional applicability, Xiamen has a subtropical monsoon climate, which differs significantly from the climatic conditions of northern cities or high-latitude regions. Therefore, the trained LSTM weather prediction model and localized DSSAT parameters cannot be directly applied to other regions with substantially different climates, and retraining and recalibration based on local climate data are required. Fourth, real rooftop farms often involve more complex spatial shading, wind environments, thermal conditions, drainage conditions, and constraints on sensor installation and maintenance. Single-point weather stations or a small number of sensors are insufficient to fully characterize the internal microclimatic differences in rooftop farms. Therefore, practical application of the system may be affected by data representativeness, sensor stability, and long-term operation and maintenance costs. Fifth, the long-term operation of the system in real rooftop scenarios is still limited by infrastructure stability. The prediction workflow depends on the continuous acquisition of meteorological data from the rooftop weather station, which provides important inputs for both LSTM weather prediction and DSSAT crop growth simulation. When power outages, network interruptions, or equipment failures occur, meteorological data updates may be suspended, thereby affecting the continuity of plant growth prediction. In such cases, missing meteorological data should be manually supplemented, or nearby weather stations and public weather forecast data should be used as alternative inputs. In the future, mechanisms for missing-data detection, backup data source switching, and redundant power supply could be further established to improve the stability of the system in real rooftop farm applications.
Future research could be further deepened in terms of model interpretability, system stability, and intelligent decision-making. On the one hand, explainable analysis methods such as SHAP could be introduced to identify the relative contributions of variables such as temperature, rainfall, and solar radiation to LAI prediction, thereby improving the transparency of the virtual sensor model. On the other hand, multi-point sensors, remote sensing images, and long-term operation and maintenance data could be incorporated to improve the system’s ability to represent the spatial heterogeneity of rooftop microclimates. In addition, the system could be extended to relatively controllable environments such as indoor plant factories. Combined with reinforcement learning methods, adaptive regulation of environmental factors such as temperature, humidity, light, and irrigation could be explored, promoting the system from a monitoring and prediction platform toward an intelligent decision-making and closed-loop control system.
6. Conclusions
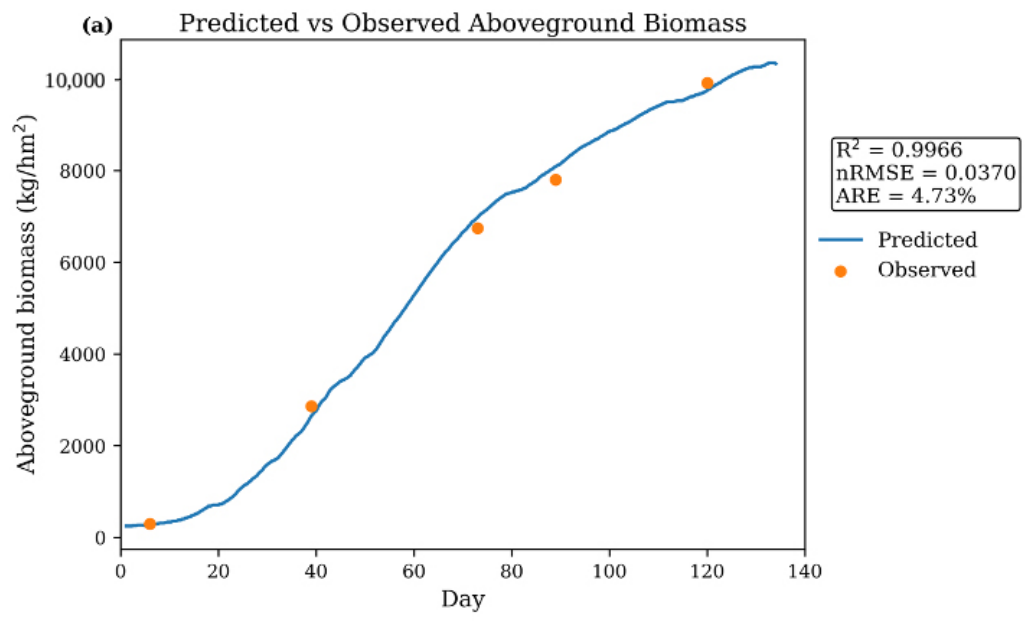
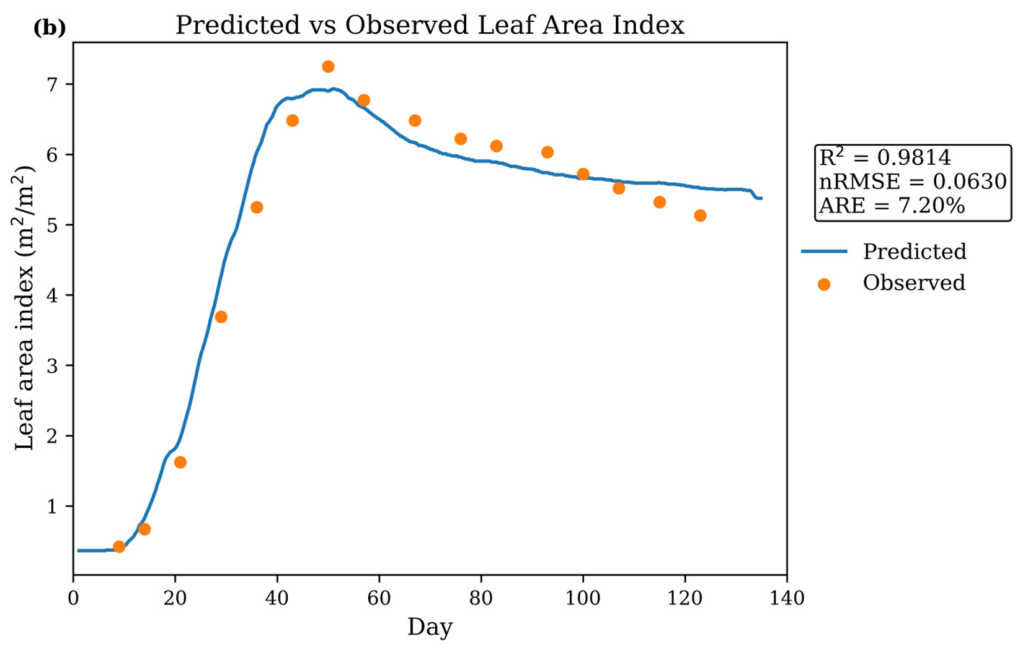
This study addresses practical challenges in rooftop farms, including strong microclimatic disturbances, significant environmental heterogeneity, and constraints on physical sensor deployment. A virtual sensor-based plant growth digital twin system for rooftop farms is proposed. Taking rooftop tomato cultivation in Xiamen, Fujian Province, as an empirical case, this study establishes a five-layer digital twin architecture that integrates physical-space data acquisition, virtual sensor modeling, database management, and 3D visualization. By coupling an LSTM weather prediction model with the DSSAT crop growth model, a closed-loop process of “sensing–simulation–prediction–decision-making” is formed for key state variables, including leaf area index, aboveground biomass, phenology, and yield. The empirical results show that the calibrated DSSAT model achieved an R2 of 0.9824 for LAI simulation and 0.9915 for aboveground biomass simulation. After introducing weather prediction, the coupled prediction framework still maintained R2 values of 0.9814 and 0.9966, respectively, while the prediction errors for phenology and yield remained within acceptable ranges.
The main contribution of this study is that it provides a practical smart management method for open rooftop farms, which are a type of green infrastructure integrating ecological regulation, food production, and public-space functions. By integrating data-driven prediction with mechanistic crop growth simulation through the virtual sensor mechanism, this study establishes a systematic technical pathway for the continuous representation, dynamic prediction, and visualized management of plant growth status under sensor-constrained conditions. From the perspective of building facility management, the proposed framework can provide data support for irrigation optimization and operation-related risk assessment, including potential drainage, waterproofing, and rooftop maintenance issues.