1. Introduction
As a strategic infrastructure for optimizing urban spatial structure and relieving traffic pressure, metro has become the core carrier of modern urban public transport systems due to its large capacity, high efficiency, and low-carbon environmental features. Therefore, accelerating metro construction is one of the important approaches to alleviate urban problems such as ground traffic congestion [
1,
2]. The shield tunneling method has become the preferred construction technique for metro tunnels owing to its high mechanization and excellent construction safety [
3]. However, when tunnels pass through existing buildings and structures at close range, ground loss and stress redistribution caused by shield tunneling will transfer to building foundations through surrounding soils. This generates additional stress and settlement in the foundations, which further affects the stability and safety of the overall building structure [
4,
5]. Accordingly, it is of great significance to investigate the deformation characteristics and influencing factors of buildings during shield tunneling construction, especially for buildings with piled-raft foundations.
During shield tunneling, the stress equilibrium of surrounding soils is disturbed, resulting in vertical displacement of soil layers. Such deformations affect not only the stability of the tunnel itself but also adjacent buildings. When additional stress in the building structure exceeds its bearing capacity, cracks occur. With increasing stress, cracks gradually expand, eventually leading to structural damage or even collapse [
6]. To date, many scholars have investigated the effects of shield tunneling on surface settlement. Shuai et al. [
7] investigated the influence of tunnel excavation on surrounding rock and proposed an analytical solution for surrounding rock stress, which provides a certain theoretical basis for analyzing the deformation effect induced by shield construction. Peck [
8] conducted statistical analyses based on extensive monitoring data, first proposed the concept of ground loss, and established a prediction method for surface settlement induced by tunnel excavation, namely the Peck formula. Celestino et al. [
9] proposed a Gaussian-density curve that better characterizes the features of surface settlement troughs. Studies have pointed out that the settlement trough slope calculated by the traditional Peck formula is often lower than the measured value, reducing prediction accuracy. Accordingly, a new curve model was derived to optimize the classical formula and improve consistency with actual settlement. Attewell [
10] made relevant assumptions, setting transverse surface settlement as a normal distribution and longitudinal settlement as a quadratic parabola distribution. Considering the effects of groundwater flow and soil spatial distribution, a three-dimensional settlement prediction model was developed. Lee and Rowe [
11] investigated three-dimensional ground deformations induced by tunnel excavation in soft clay. They established a three-dimensional elastic-plastic finite element model to simulate the construction process and the distribution of soil displacement and stress around the tunnel face and ground surface. The three-dimensional ground displacement and stress patterns were examined for two idealized cases: unlined tunnels and fully lined tunnels. The results revealed more obvious asymmetry and complexity in three-dimensional soil displacement modes.
Surface settlement and displacement caused by shield tunneling are directly transferred to the foundations and superstructures of existing buildings. Uneven ground deformation changes the original stress state of buildings, causing differential settlement, tilting, or even cracking of foundations, and introducing additional stress and deformation into the overall structure [
12]. Dmoton and King [
13] carried out laboratory model tests to study the influence of shield tunnel excavation on adjacent pile foundations. They confirmed that shield tunneling significantly affects the stability of surrounding pile foundations. Jenck and Dias [
14] analyzed the interaction between shield tunneling and adjacent buildings using FLAC3D. The results showed obvious changes in ground settlement above the corresponding building area. Soomro et al. [
15] conducted three-dimensional finite-element analyses to investigate the response of piled-raft foundations to sequential twin tunneling in soft clay, and found that twin-tunnel excavation causes lateral displacement, differential settlement and internal force changes in the foundation. He et al. [
16] analyzed the influence of shield tunneling on adjacent pile foundations by numerical simulation. The results show that shield tunnel undercrossing induces bending deformation of pile foundations toward the tunnel side.
In practical projects where shield tunnels undercross or side-cross existing buildings, the final deformation characteristics and failure risk of buildings are controlled by multiple factors rather than a single one. Jacobsz et al. [
17] conducted a series of centrifuge tests and found that the relative position between the tunnel and the pile base has a decisive effect on pile settlement. This conclusion was verified by field measurements from Selemetas et al. [
18] and Kaalberg et al. [
19]. Ng et al. [
20,
21,
22] and Lu et al. [
23] adopted the centrifuge modeling method to focus on pile responses induced by sequential excavation of twin tunnels in sandy strata. By setting different tunnel excavation depths, they systematically analyzed the influence mechanism of pile-tunnel relative positions. The results showed that pile settlement caused by twin-tunnel excavation is closely related to the position of each tunnel relative to the pile. The cumulative settlement caused by excavation near the pile base is 2.2 times that of excavation at the middle of the pile shaft. Liu et al. [
24] used finite element models to analyze pile responses under various excavation conditions. The results indicated that both soil cohesion of the bearing layer and the relative position between the pile tip and tunnel axis affect pile deformation. Wang et al. [
25] combined detailed case studies and advanced numerical modeling, and further demonstrated that the settlement induced by the second tunnel excavation is smaller than that caused by the first tunnel excavation owing to the sheltering effects of the adjacent first tunnel and pile foundations. Loganathan et al. [
26] investigated ground deformation and adjacent pile responses induced by tunnel excavation. They further supplemented the influence law of pile-tunnel relative positions. It was found that bending moment and lateral deflection of adjacent piles dominate pile deformation when the tunnel centerline is at or near the pile tip. By contrast, axial force change becomes the key factor when the tunnel centerline is below the pile tip. Liu et al. [
27] developed a testing apparatus for simulating shield tunneling undercrossing pile foundations, measured and analyzed soil displacements and pile responses induced by excavation, and revealed the influences of pile length, pile diameter, and pile-tunnel distance on the behavior of pile foundations.
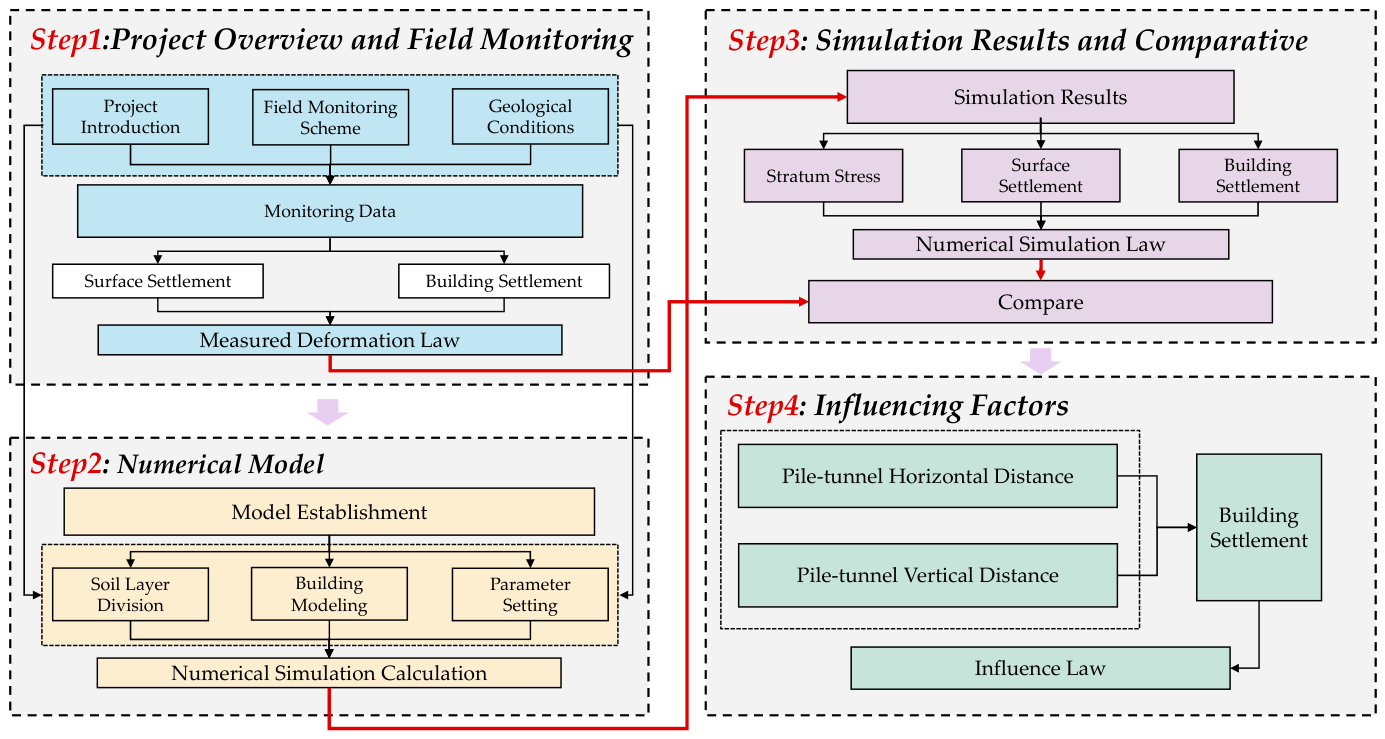
In summary, existing studies have conducted substantial work on surface settlement laws, building pile deformation characteristics, and influencing factors induced by shield tunneling. Existing field monitoring-based studies have accumulated massive data on ground surface settlement and building deformation and revealed macroscopic settlement laws, but the internal response and full-field deformation of deeply buried pile foundations are difficult to obtain directly due to on-site test limitations. Although previous studies have explored the effects of twin shield tunneling, most achievements focus on single piles and rarely consider the comprehensive impact on piled-raft buildings with greater overall stiffness and more complex stress mechanisms. In addition, current analyses of influencing factors mainly concentrate on ground surface settlement, while studies on the overall deformation response, differential settlement evolution, and dominant controlling factors of the whole building remain insufficient. Therefore, numerical modeling is adopted as the most effective approach in this study. Taking the section from Zhongyi Road Station to Housihu Fourth Road Station of Wuhan Metro Line 12 as the engineering background and Zizhu Kindergarten with a piled-raft foundation as the research object, this paper systematically analyzes the evolution laws of surface and building settlement through field monitoring, establishes a validated three-dimensional numerical model, and quantitatively investigates the key factors affecting building deformation. The conclusions can directly guide the design, construction and deformation control of this project and provide technical support for similar twin shield tunneling projects undercrossing piled-raft buildings. The research flow chart of this paper is shown in
Figure 1.
2. Engineering Profile and Field Monitoring
2.1. Project Overview
Wuhan Metro Line 12 is the only loop line in the urban rail transit network. It runs through Wuchang, Hankou, and Hanyang districts. The line connects two major transportation hubs: Wuchang Railway Station and Hankou Railway Station. It provides transfers with more than ten other metro lines, forming the core urban traffic framework. Line 12 has a total length of about 60.7 km, including 54.6 km of underground section, 5.4 km of elevated section, and 0.7 km of transition section. There are 36 stations along the line, with an average station spacing of about 1.69 km. The project is large in scale. The line twice crosses the Yangtze River and once crosses the Han River, as well as water areas such as Sha Lake and Mo Lake.
The line includes one depot and two parking lots. The Danshuichi Depot is located north of Danshuichi Road, adjacent to the Yangtze River and the Beijing-Guangzhou Railway. Its access tunnels connect Danshuichi Station and Baibuting Station. The Fuxingcun Parking Lot is situated in a railway-surrounded plot, bordering the Beijing-Guangzhou Railway to the north, and is accessed via Changfeng Station. The Banqiao Parking Lot is located east of Lizi Road and south of Nanhu Avenue, with access through Nanhu Avenue Station and Qingling Station. The line runs along major roads, including Changqing first Road, Housihu Avenue, Xingye Road, Yuanlin Road, Tuanjie Avenue, Shahu Avenue, Dong’an Road, Wuchang Railway Station, Ping’an Road, Baisha third Road, Sixin South Road, Fangcao Road, Heshan Road, Qintai Avenue, Hanxi Road, and Jiangfa Road, finally forming a closed loop.
The section studied in this paper is from Zhongyi Road Station to Housihu Fourth Road Station, where the tunnel passes beneath Zizhu Kindergarten. The building is a three-story frame structure with a piled-raft foundation. The raft foundation is about 33 m long, 25 m wide, and 1 m thick. The piles are prestressed concrete pipe piles with a length of about 16 m.
2.2. Interval Geological Conditions
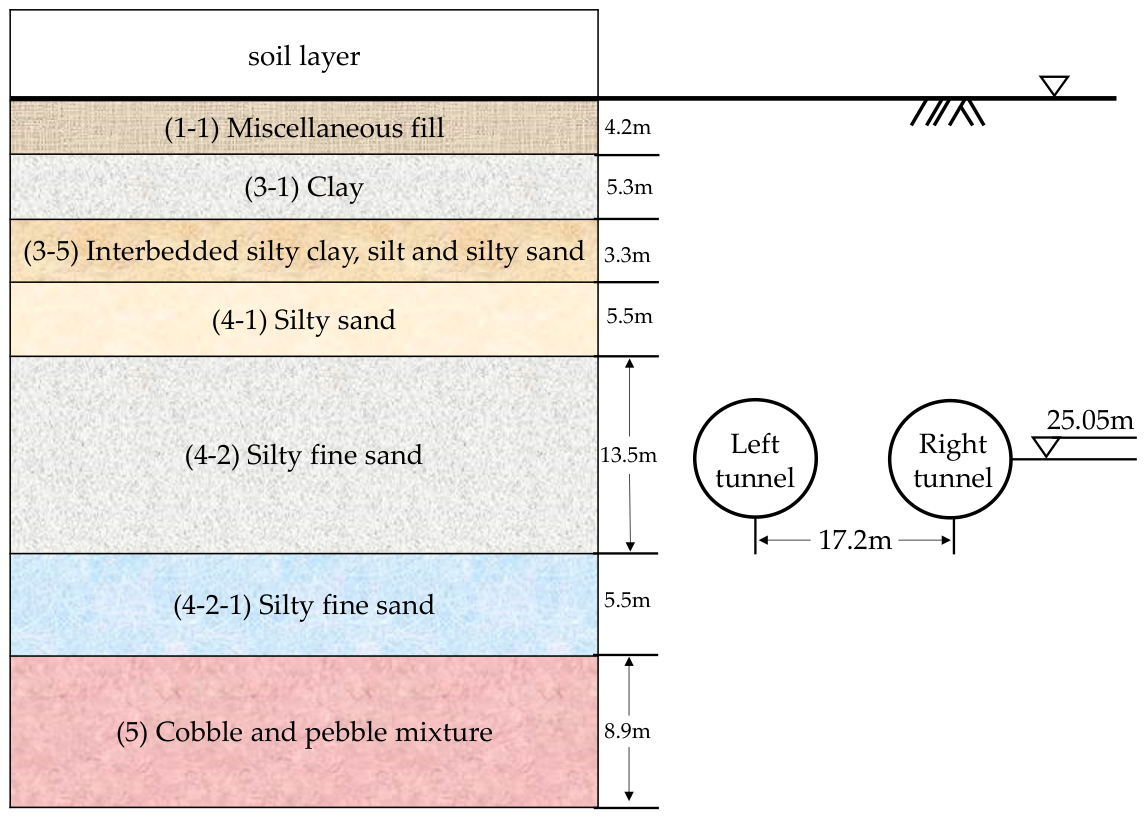
In this study, the right line of the section from Zhongyi Road Station to Housihu Fourth Road Station is 1313.40 m long, and the left line is also 1313.40 m long. According to the site investigation, the proposed site is divided into seven soil layers from top to bottom. They are (1-1) miscellaneous fill; (3-1) clay; (3-5) interbedded silty clay, silt and silty sand; (4-1) silty sand; (4-2) silty fine sand; (4-2-1) silty fine sand; (5) cobble and pebble mixture. The physical properties of each soil layer are listed in
Table 1.
2.3. Field Monitoring Plan
Combined with current monitoring specifications [
28] and the actual engineering conditions, the influence zone of the shield tunnel is defined as a circular area within 50 m from the tunnel centerline. Key monitoring is carried out for buildings and ground surface settlement within 20 m ahead and behind the shield cutter head. Taking the tunnel crossing beneath Zizhu Kindergarten as a case, monitoring schemes for ground settlement and building settlement are arranged around the kindergarten.
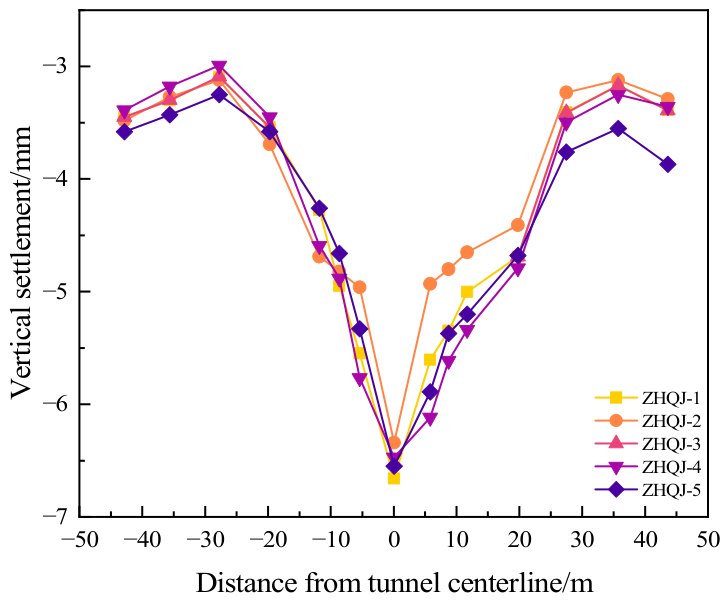
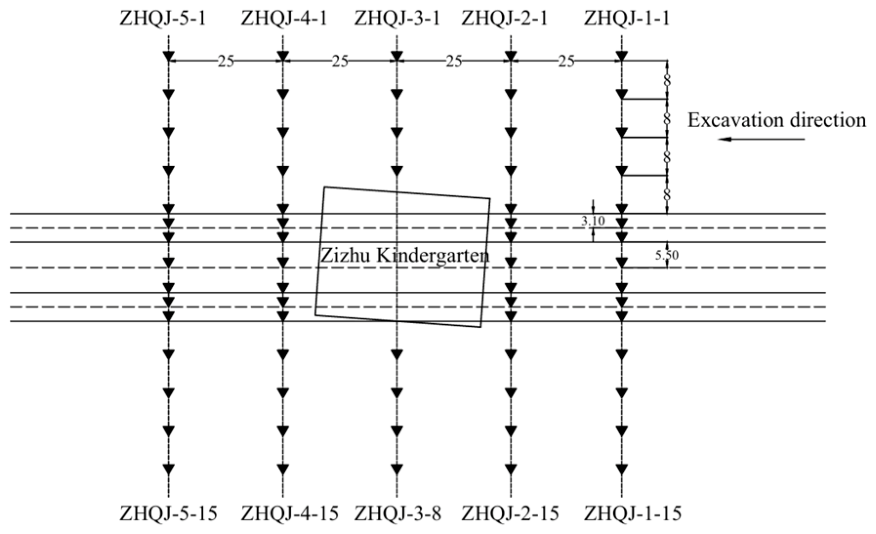
Ground Settlement Monitoring. A transverse monitoring section is set every 25 m. Thirteen ground monitoring points are arranged symmetrically along the direction perpendicular to the tunnel centerline at intervals of 5.5 m, 8.6 m, 11.7 m, 19.7 m, 27.7 m, 35.7 m, and 43.7 m. No points are placed within the building area. To protect points from rolling damage, monitoring points on roads are installed as manhole-type markers. Drilling is used for pavement installation, with the bottom of the steel bar placed inside the stable layer of the road surface. Monitoring points are installed smoothly to ensure safe passage for pedestrians and vehicles. All points are firmly installed and clearly marked for long-term preservation. The layout of ground settlement points is shown in
Figure 2. Ground settlement is observed using the second-order leveling method with an electronic level and invar staff.
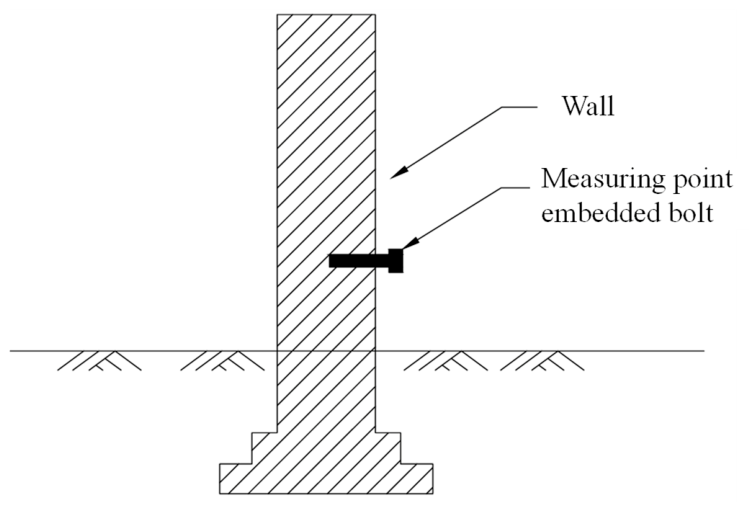
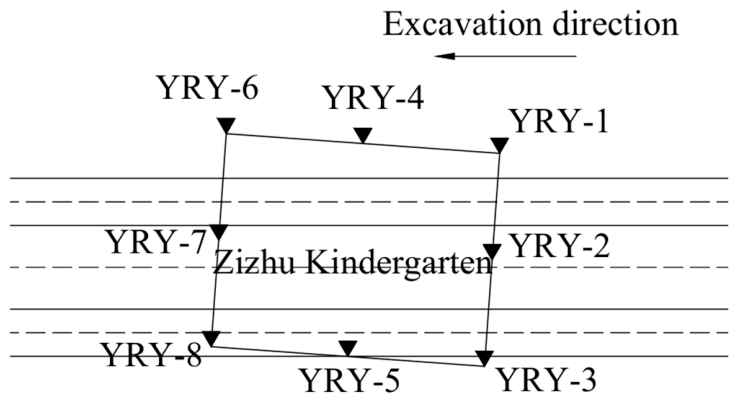
Building Settlement Monitoring. Monitoring points are installed by drilling holes on the outer walls of the building with an electric hammer and then embedding observation bolts. For vulnerable walls or buildings with cultural relic value, Leica barcode paper is used instead. Each measurement is directly referenced from the primary benchmark. Building inclination can be calculated using the settlement difference and horizontal distance between monitoring points. Monitoring points are arranged at building corners and bearing structures. Additional points are determined according to site conditions to ensure real settlement can be fully reflected. The installation method and layout of building settlement monitoring points are shown in
Figure 3 and
Figure 4, respectively.
During the construction of shield tunnels undercrossing existing buildings, reasonable monitoring control values serve as a critical link for risk early warning and structural safety guarantee. For this project, the safety evaluation criterion for construction is formulated as follows: When the measured value is less than the control value, the construction is in a safe state; When the measured value is equal to the control value, attention should be paid to potential risks; When the measured value exceeds the control value, the construction is deemed in a dangerous state. For the attention-level risk status, the monitoring frequency shall be increased intensively. For the dangerous status, daily monitoring shall be implemented. Meanwhile, a joint technical meeting involving the owner, design institute, construction contractor and monitoring unit shall be convened to assess potential risks, make targeted decisions, and adopt effective reinforcement and control measures, so as to continuously improve and optimize the subsequent design and construction scheme. The monitoring frequency and threshold control values of each monitoring item in this project are summarized in
Table 2.
4. Establishment and Calculation of Numerical Model
4.1. Necessity of Numerical Simulation
During the whole construction process of shield tunnels, complex dynamic interactions exist among the tunnel, surrounding strata, building foundations and superstructures, which continuously affect the buildings above the tunnel alignment. On the one hand, shield tunneling disturbs the adjacent soils and forms a three-dimensional stress relief zone centered at the tunnel crown, resulting in ground settlement. On the other hand, such ground settlement propagates to the soils around the pile foundations of undercrossed buildings and induces soil displacement, which further causes deformation of the pile foundations. The deformation is then transmitted upward through structural components and eventually leads to displacement of the building superstructure.
Since pile foundations are deeply buried underground, their mechanical responses cannot be directly captured by field monitoring. In addition, field monitoring only obtains discrete data at measuring points, which is insufficient to characterize the full-scale deformation field of the entire project and cannot provide solid data support for subsequent parametric analysis. Accordingly, this study establishes a three-dimensional numerical model using FLAC3D to investigate the deformation characteristics of buildings induced by shield tunneling in water-rich sandy strata, and further explores the key factors influencing building deformation based on the established model.
4.2. Model Establishment
When using the FLAC3D software with 7.0 version to simulate practical engineering problems, reasonable simplifications of the actual project are usually required to reduce the workload of modeling and balance computational accuracy and efficiency. Based on the geological conditions, building characteristics, and other factors of this shield tunneling project, appropriate simplifications are made for factors with minor influence or high complexity. Therefore, the following basic assumptions are adopted before conducting numerical simulations in this study.
- (1)
Each soil layer is assumed to be horizontally distributed, and is regarded as a homogeneous, isotropic elasto-plastic material.
- (2)
The soil is assumed to be normally consolidated, without over-consolidation or under-consolidation in its stress history.
- (3)
All components of the shield tunnel are assumed to be isotropic ideal elastic materials, and the material parameters remain constant during tunnel construction.
- (4)
Only the deformation of the building’s piled-raft foundation is investigated, and the superstructure is properly simplified.
The above assumptions may lead to slight deviations between the simulated results and the measured data. However, they will not affect the overall deformation trend and numerical magnitude, and the simulation is still sufficiently effective for the subsequent analysis.
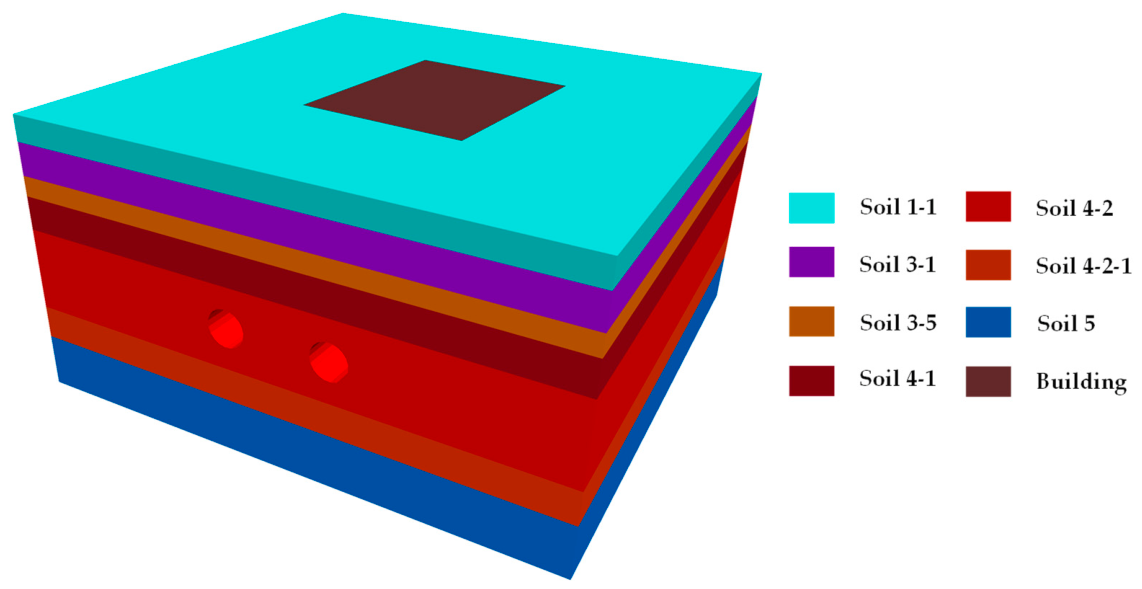
This study selects the tunnel section from Zhongyi Road Station to Housihu Fourth Road Station underneath the Zizhu Kindergarten as the research object. The numerical model is established with a length of 90 m, a width of 90 m and a depth of 46.2 m. The buried depth of the tunnel is 25.05 m, and the excavation length is 90 m. According to the geological investigation data and indoor test results, the stratum within the depth of 46.2 m is divided into seven soil layers from the ground surface downward, including miscellaneous fill (1-1), clay (3-1), interbedded silty clay, silt and silty sand (3-5), silty sand (4-1), silty fine sand (4-2), silty fine sand (4-2-1), and cobble-pebble mixed soil (5). The shield tunnel is mainly located within the silty fine sand layer (4-2). The overall model adopts a basic element size of 2 m. Hexahedral sweep meshing is applied to tunnel linings and surrounding soil. Five layers of progressive mesh refinement are implemented around the tunnel, with the minimum element size set to 1 m. The model contains approximately 483,290 solid elements in total. The layout of the tunnel strata is illustrated in
Figure 10.
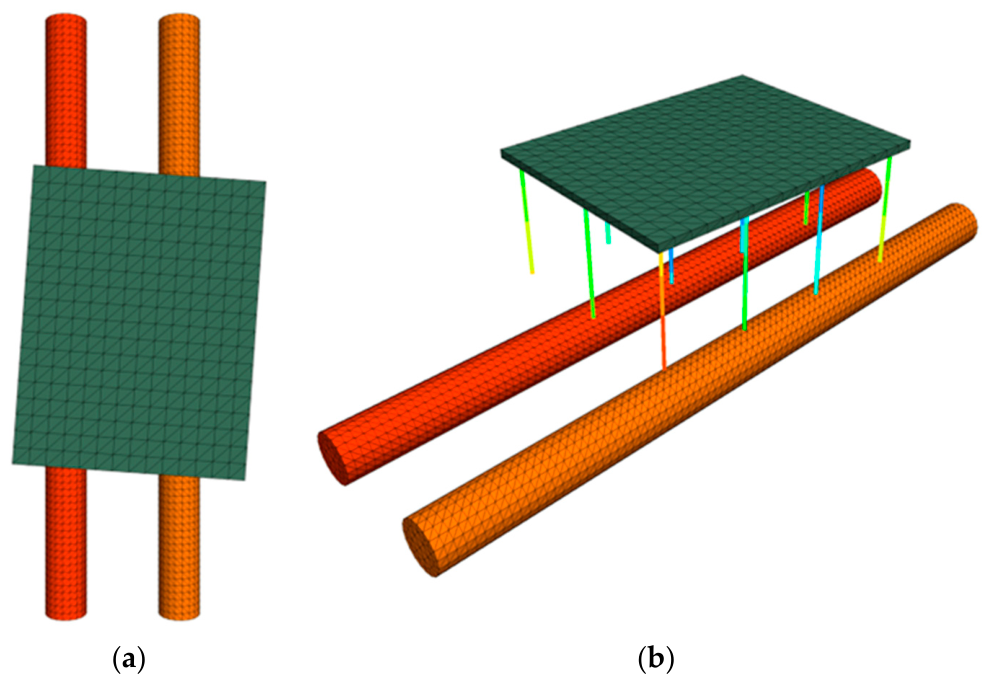
Considering the complexity and low computational efficiency of modeling the superstructure in numerical simulation, the above-ground structure of the building is reasonably simplified, while only the foundation part is retained for calculation. The piled-raft composite foundation of the kindergarten is adopted in the numerical simulation. The vertical load transmitted by the superstructure is equivalently converted into uniform vertical pressure acting on the top surface of the raft foundation, with an equivalent load taken as 15 kPa for each floor. The relative positional relationship between the building and the tunnel is shown in
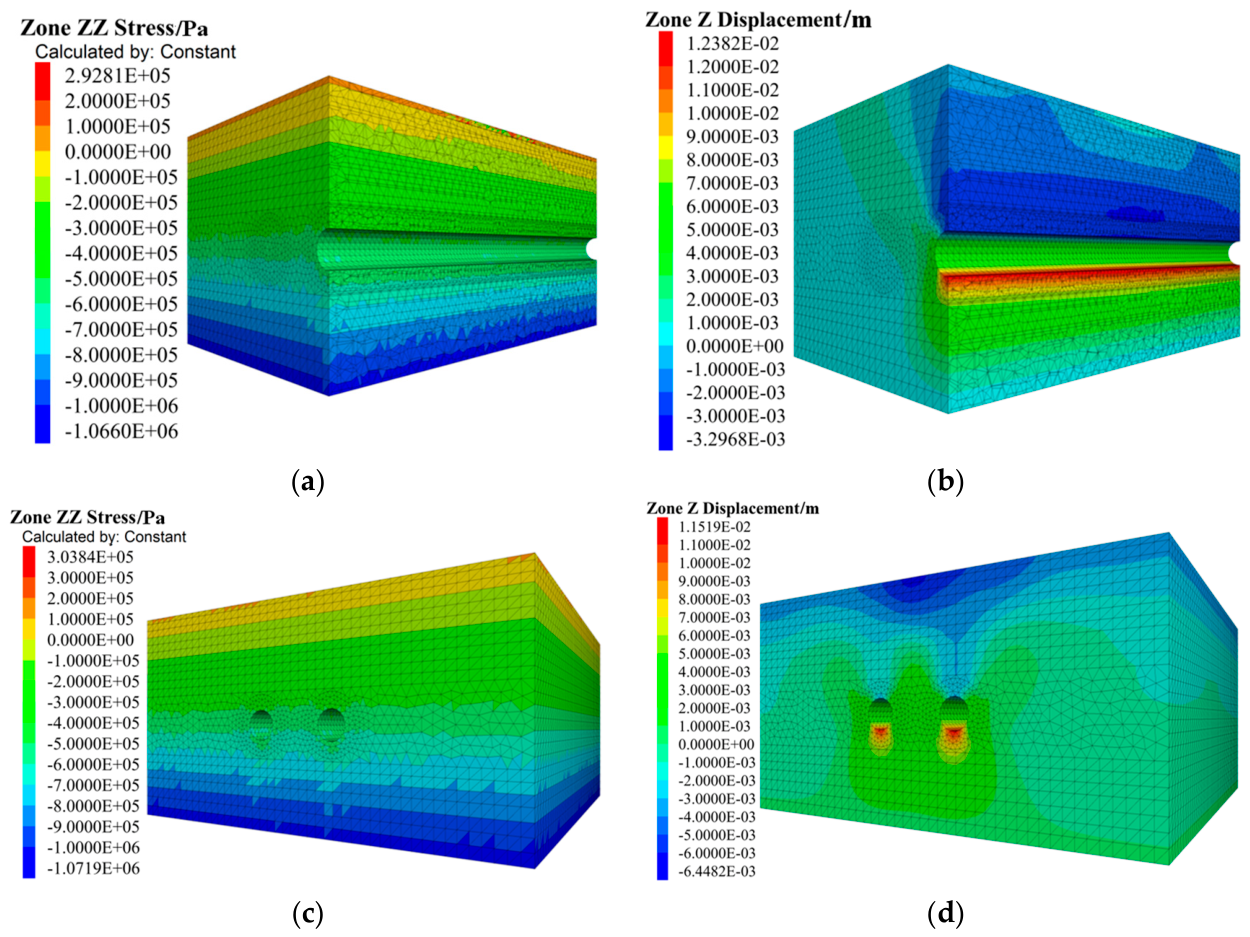
Figure 11. The completed FLAC3D numerical model is presented in
Figure 12.
4.3. Calculation Parameters
Previous studies have demonstrated that the selection of a constitutive model should avoid two extremes: excessively simple models that cannot capture the key characteristics of the problem, and overly complex models that require numerous difficult-to-determine parameters. The Mohr–Coulomb model has been widely adopted in numerical simulations due to its advantages of easily obtainable parameters and high computational efficiency. Although the Mohr–Coulomb model cannot distinguish between loading and unloading moduli, which inevitably introduces minor errors in the calculation of horizontal and vertical deformations, such errors are relatively small and can be reasonably neglected for shallow-buried tunnels. The buried depth of the tunnels in this study ranges from 25.05 m to 35.05 m, and therefore the Mohr–Coulomb model is suitable and sufficiently reliable for the present research. In this study, the Mohr–Coulomb plastic model, which is widely adopted in geotechnical engineering analysis with clear physical significance, is employed to simulate the soil mass. The Mohr–Coulomb constitutive model cannot distinguish between loading and unloading moduli, which may cause certain errors in the calculation of horizontal and vertical deformations. However, such deviations are acceptable for the analysis of the overall deformation law in this engineering case. Therefore, the adoption of the Mohr–Coulomb model is appropriate for this study. The detailed physical and mechanical parameters of each stratum are listed in
Table 3. The raft foundation of the building is simulated by the elastic constitutive model, and its relevant parameters are presented in
Table 4. The coupling spring parameters of pile units corresponding to each soil layer are shown in
Table 5.
Based on engineering practice and reasonable assumptions regarding mechanical boundary conditions: the front, rear, left and right boundaries of the model are constrained against lateral displacement, while the bottom boundary is restricted from vertical displacement. Accordingly, the ground surface is set as a free boundary, and normal displacement constraints are applied to the lateral sides and the base of the model. Gravity is adopted as the main loading condition with the gravitational acceleration taken as 9.81 m/s2. The initial in situ stress field is established by means of geostress balance in the initial calculation step.
4.4. Simulation Procedures
Combined with the actual engineering parameters, the single-ring length of tunnel segments in the numerical model is set as 1.5 m. Accordingly, the simulated excavation section is divided into standard calculation units with an advancing interval of 1.5 m. The detailed construction simulation procedures in FLAC3D for the shield tunneling section of Wuhan Metro Line 12 underneath Zizhu Kindergarten are defined as follows:
- (1)
Initial in situ stress calculation. Activate the stratum components, reserved excavation areas and grouting zones of the model, and impose boundary constraints together with gravity loading. Subsequently, clear the displacement field and perform calculation to obtain the initial stress state of the ground, which lays a fundamental stress condition for the subsequent construction simulation.
- (2)
Simulation of building construction. Sequentially activate structural elements including the building raft foundation and pile foundations. Adjust the mechanical parameters of piles, pile–soil interfaces and pile tips, modify the physical and mechanical properties of soil mass beneath the raft, and apply equivalent vertical loads on the top surface of the raft to complete the mechanical simulation of the building.
- (3)
Displacement reset before tunneling simulation. After the completion of building construction, ground deformation is assumed to be fully stabilized, and consolidation settlement of soil is neglected in this simulation. Before starting the shield excavation calculation, only the stress field induced by building construction is retained, while the cumulative ground displacement is cleared, so as to eliminate the interference of pre-construction deformation on tunneling-induced settlement analysis.
- (4)
Simulation of shield undercrossing construction. The total excavation length of the twin tunnels is 90 m. According to the actual segment length of 1.5 m per ring, the whole tunneling process is divided into 60 construction cycles. The excavation sequence follows the principle of constructing the right tunnel first and then the left tunnel; Activate the first 1.5 m excavation unit of the right tunnel, apply face pressure on the excavation surface, and activate the shield shell structure simultaneously; Activate the second excavation unit of the right tunnel, maintain the face pressure of the previous excavation step, and impose new face pressure as well as shield shell elements for the current advancing section; Repeat the above circulation procedures strictly until all 60 rings of the tunnel model excavation are fully completed.
6. Analysis of Factors Affecting the Foundations of Buildings Underrun by Shield Tunnels
To systematically evaluate the patterns of how changes in key parameters affect structures during the construction of double-line shield tunnels through water-saturated sand layers, this study utilized the three-dimensional finite-difference numerical model established previously. Multiple sets of typical comparative conditions were established, and single-factor parameter analyses were conducted by varying the horizontal and vertical clearances between the tunnel and piles. For each set of comparative conditions, the stratigraphic conditions and pile foundation layout remained constant, while a single variable was modified using the controlled variable method to ensure the comparability of the analysis results.
6.1. Horizontal Spacing of Pile Foundations
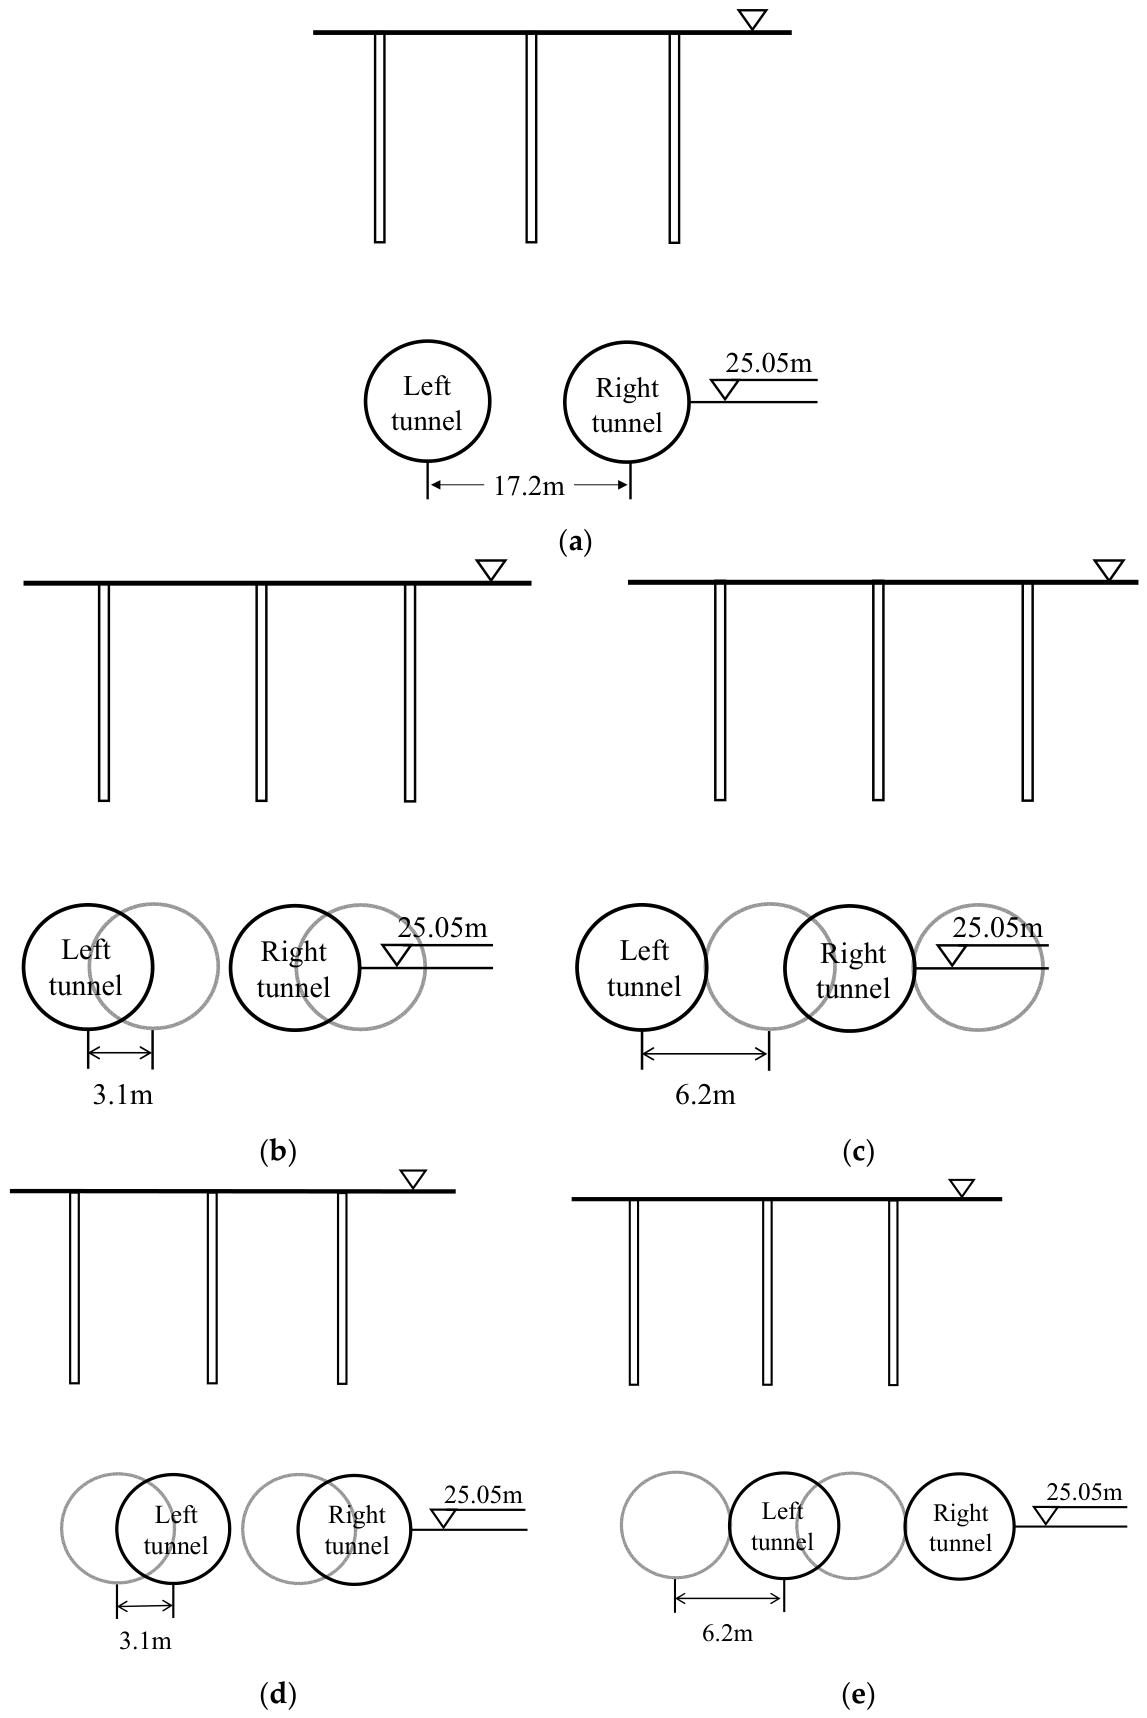
To clarify the influence of horizontal clear spacing on pile foundation response and ground disturbance, five groups of working conditions are designed. The actual relative position in the project is taken as the reference case (G1). Symmetric displacement adjustments of 0.5D and D are implemented on both sides along the pile group layout direction, where D is the outer diameter of the tunnel (taken as 6.2 m). Thus, four comparative cases (G2, G3, G4, G5) are established. The detailed settings and key parameter values of each case are listed in
Table 8. The spatial relative position between the building pile foundation and the tunnel under each case is shown in
Figure 16.
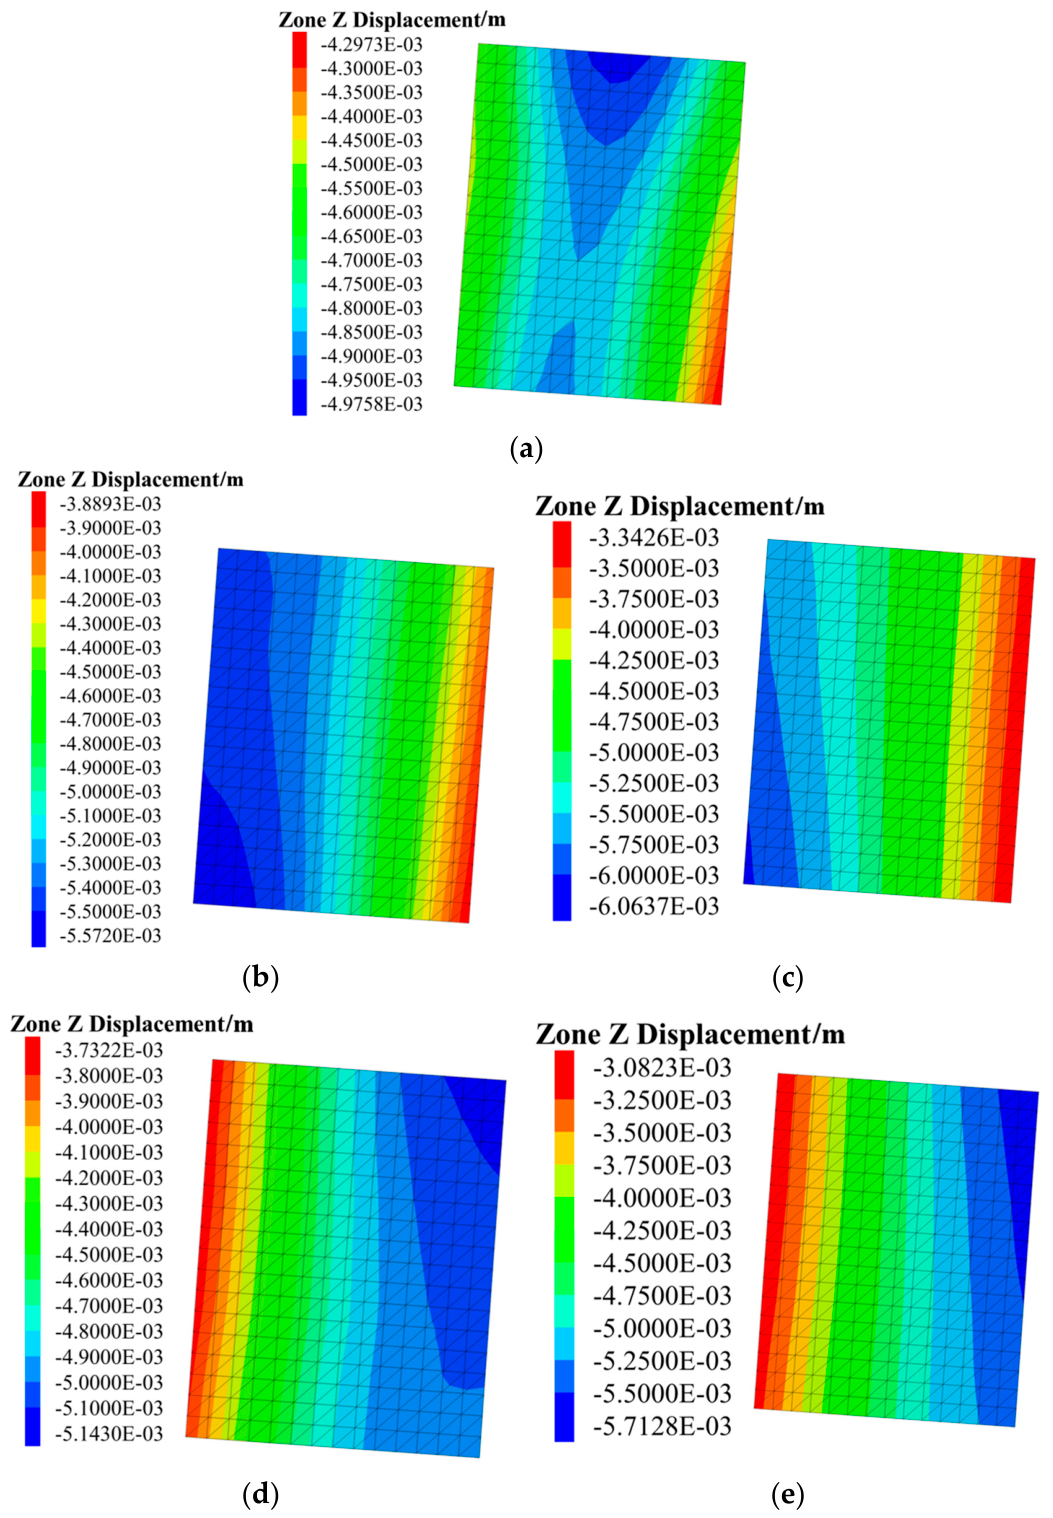
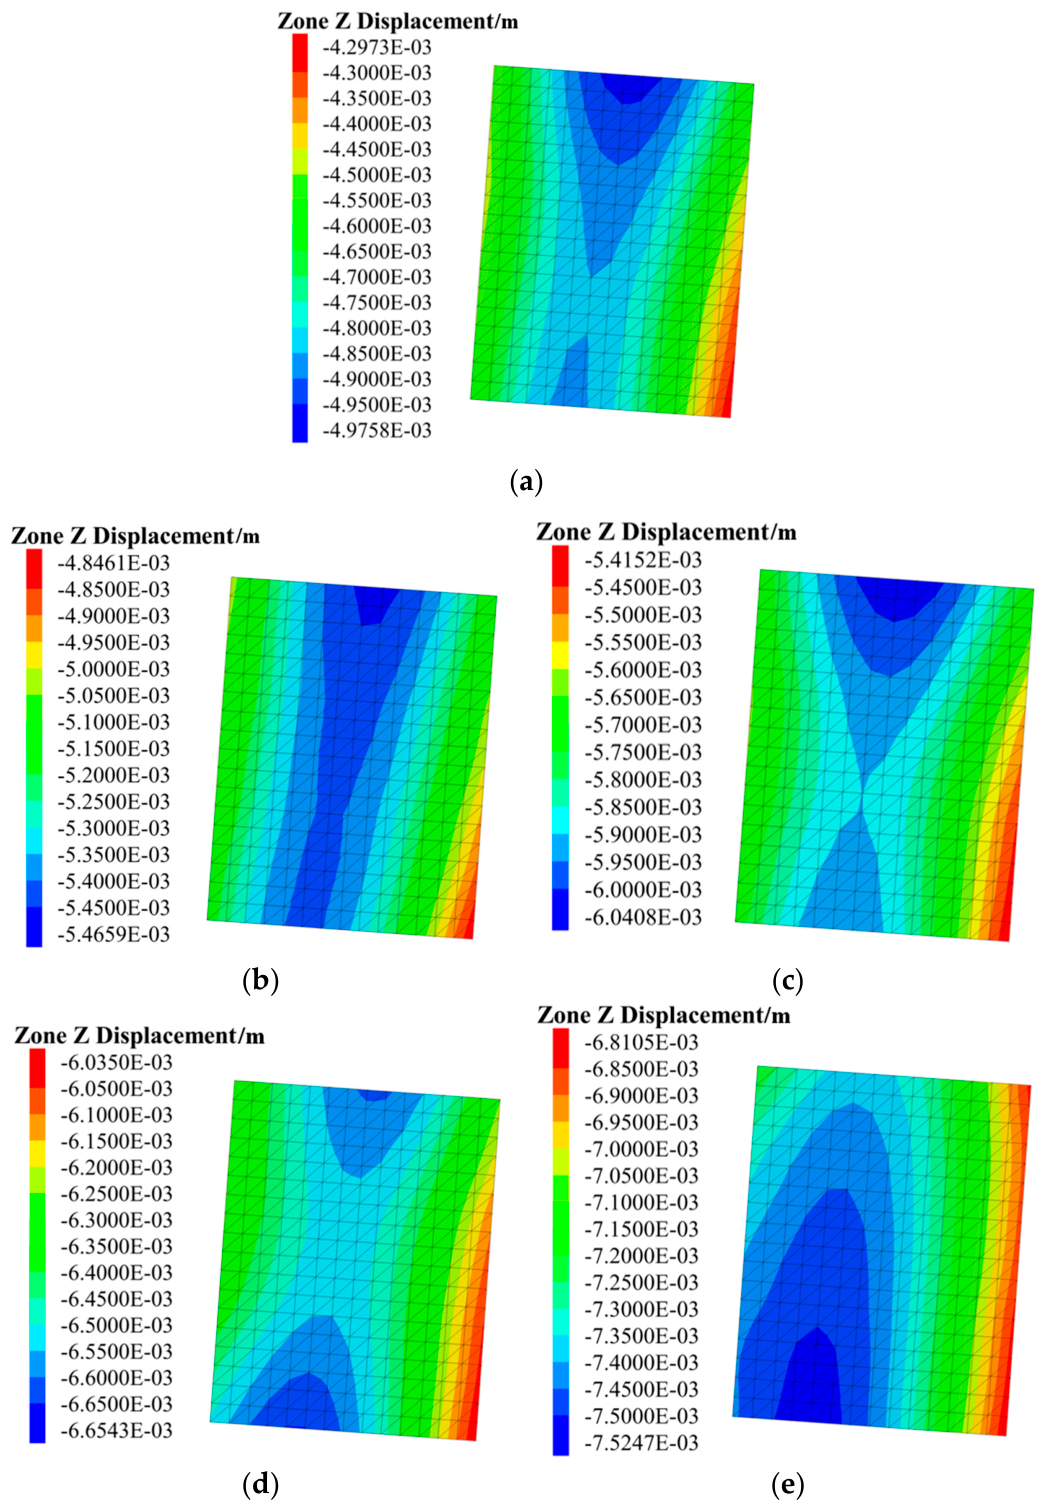
After the completion of twin-tunnel construction, the vertical displacement nephograms of the building raft foundation in this section are shown in
Figure 17. It can be seen from
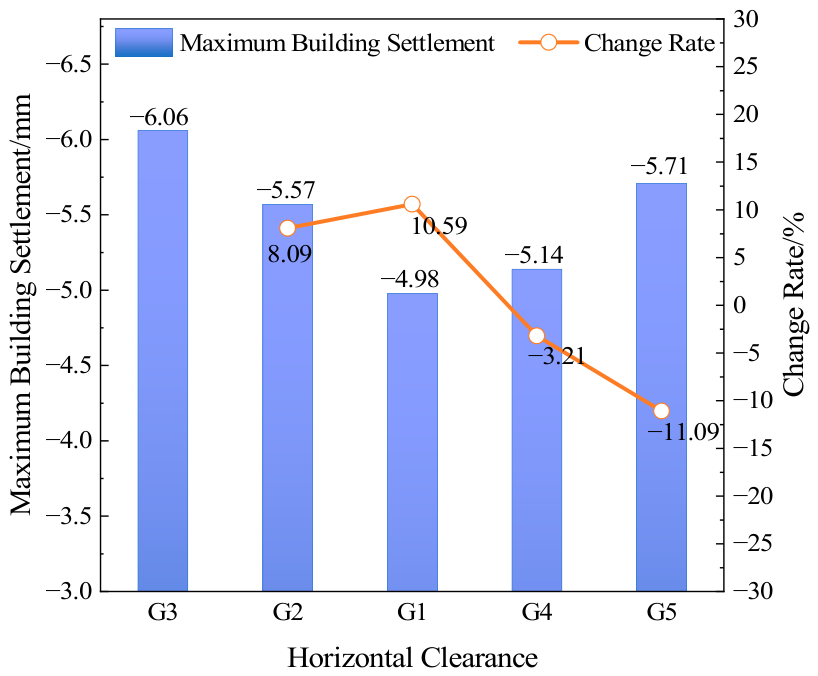
Figure 17 that changing only the relative position between the tunnel and the pile foundation has an insignificant effect on the vertical displacement of the tunnel lining. In the reference G1, the maximum vertical displacement of the building raft foundation is approximately 4.98 mm, and the location of maximum displacement is close to the center-line of the twin tunnels. In G2, the maximum vertical displacement of the building is about 5.57 mm. In G3, the maximum vertical displacement is about 6.06 mm. With the change in the relative position between tunnel and pile, the maximum displacement shifts closer to the later-excavated left-line tunnel. In G4, the maximum vertical displacement of the building is about 5.14 mm. In G5, the maximum vertical displacement is about 5.71 mm, and its position is closer to the first-excavated right-line tunnel.
It can be found that changing the horizontal relative position between the tunnel and piles directly alters the spatial correspondence between the stratum unloading disturbance zone and the piled-raft foundation of the building. In the reference case G1, the twin tunnels are symmetrically distributed beneath the building, and the ground settlement troughs induced by the construction of the left and right tunnels are superimposed almost symmetrically. Therefore, the maximum settlement of the raft foundation appears near the centerline of the twin tunnels, with a moderate settlement amplitude. In cases G2 and G3, the tunnels shift away from the right-line and toward the left -line. The unloading and stress relief zones generated by the excavation of the later-excavated left-line tunnel act more directly on the soil beneath the building raft. In addition, the disturbance zone formed by the previously excavated right-line and the disturbance zone of the left-line are superimposed asymmetrically, which significantly increases the raft settlement and shifts the maximum settlement toward the left-line. In cases G4 and G5, the tunnels shift toward the previously excavated right-line. The grouting reinforcement zone and stress relaxation zone formed by the early excavation of the right-line first affect the upper raft foundation, while the superposition effect of the disturbance from the later-excavated left-line is relatively weak. Thus, the maximum settlement of the raft is slightly smaller than that in cases G2 and G3, and the settlement center shifts toward the first-excavated right-line tunnel accordingly. Overall, the horizontal clear distance and relative orientation between the tunnel and piles determine the magnitude and distribution of the vertical displacement of the building raft by controlling the superposition range of settlement troughs, the intensity of unloading influence, and the constraint scope of the pile foundation.
The maximum building settlement and corresponding variation rate under various working conditions are presented in
Figure 18. It can be observed that the building settlement changes significantly with the variation of the horizontal relative position between the tunnel and the pile foundation, with the variation rate maintained at approximately 10%. As the building foundation gradually deviates from the tunnel alignment, the building settlement increases continuously, and the tendency of unilateral tilting becomes more pronounced. Therefore, it can be concluded that the eccentric undercrossing of shield tunnels poses a greater adverse impact on the superstructure buildings.
6.2. Vertical Spacing of Pile Foundations
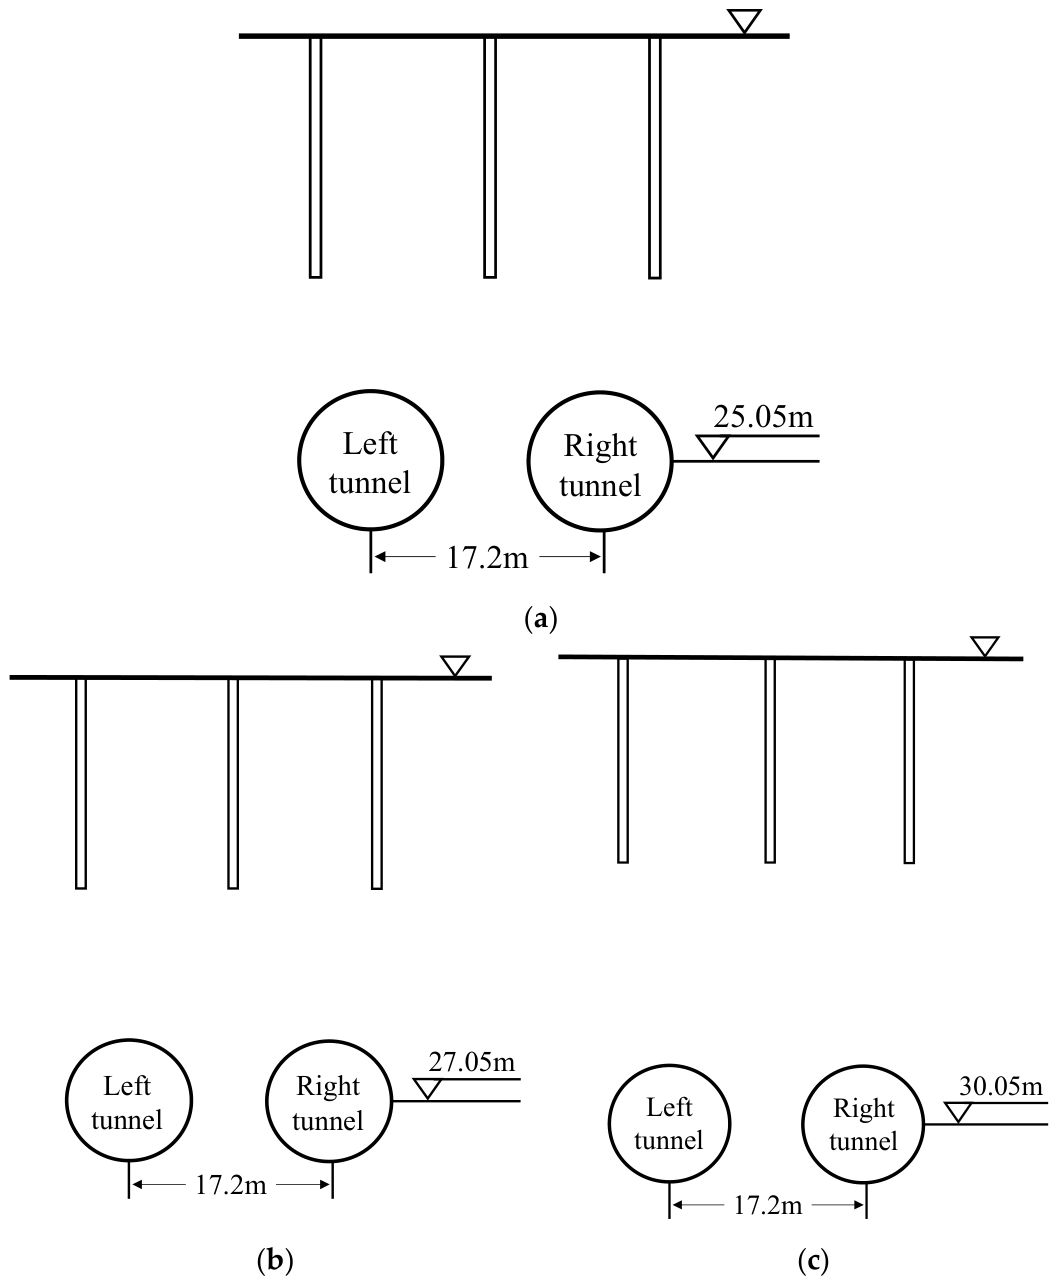
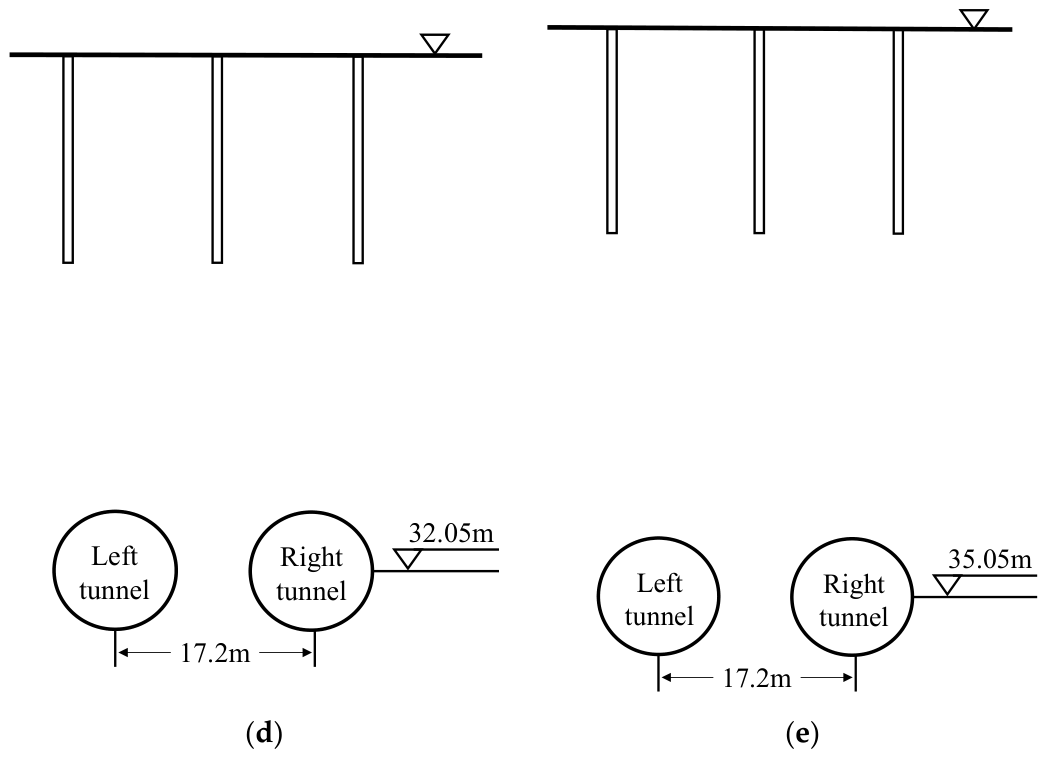
To analyze the impact of shield tunnel excavation on existing structures under different tunnel burial depths, five scenarios were established: 25.05 m (N1), 27.05 m (N2), 30.05 m (N3), 32.05 m (N4), and 35.05 m (N5). In the numerical simulation, other parameters in the model adopted the standard set of parameters from the simulation scheme. The parameter settings for the different tunnel burial depth conditions are shown in
Table 9. The relative spatial positions of the building pile foundations and the tunnel under each condition are shown in
Figure 19.
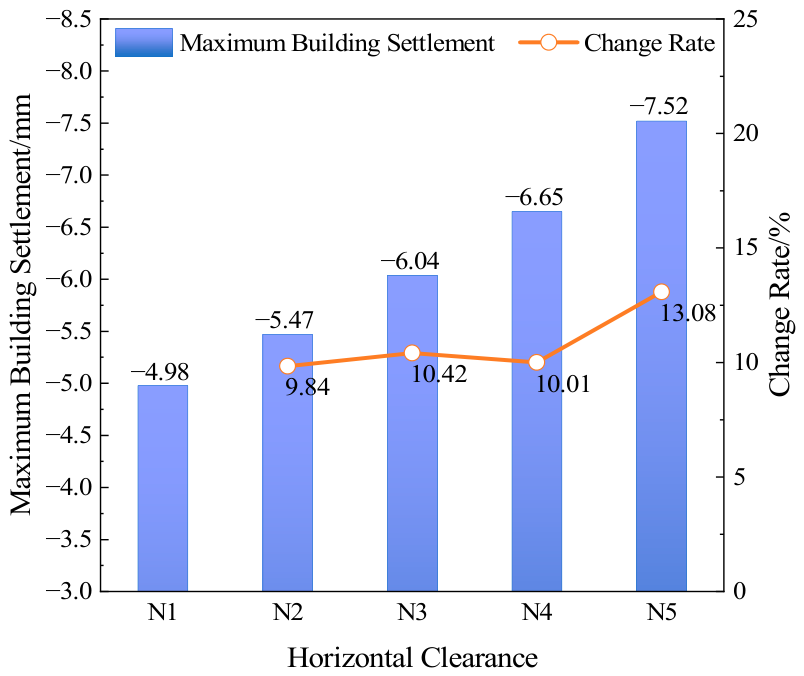
Figure 20 shows the contour plot of the vertical displacement of the raft foundation of the structure in the Z direction following the completion of the double-track tunnel construction. As the tunnel burial depth increases from 25.05 m to 35.05 m, the maximum vertical displacement in the Z-direction of the building raft foundation at the time of shield tunnel breakthrough shows an obvious monotonic increasing trend, which rises from 4.97 mm under case N1 to 7.52 mm under case N5 with an increase of 51.31%. From the perspective of displacement increment, the maximum displacement increases by 0.49 mm with a growth rate of 9.86% from N1 to N2, by 0.58 mm with a growth rate of 10.62% from N2 to N3, by 0.61 mm with a growth rate of 10.10% from N3 to N4, and by 0.87 mm with a growth rate of 13.08% from N4 to N5. It can be observed that the maximum vertical displacement of the building’s raft foundation exhibits a positive correlation with the tunnel burial depth. This is primarily because the increase in tunnel burial depth alters the transmission path and distribution characteristics of the unloading disturbance from the strata toward the ground surface. As the tunnel burial depth increases, the range of stress relief caused by excavation unloading and the depth of the plastic zone development correspondingly widen. During the transmission of vertical ground displacement toward the surface, the influence of the self-weight of the overlying soil and lateral constraints becomes more significant. Disturbance energy cannot be fully dissipated in the deep strata, thereby making the superimposed settlement effect in the raft foundation area of the superstructure more pronounced. At the same time, as the burial depth increases, the width and influence range of the ground settlement trough caused by shield construction correspondingly increase. The superposition of soil disturbances between the trailing left-line tunnel and the leading right-line tunnel becomes stronger, further exacerbating the overall vertical displacement of the raft foundation. Furthermore, stress levels in deep soil are higher, and soil rebound and consolidation deformation are more pronounced following excavation and unloading. Under the combined effect of coordinated deformation in the piled-raft foundation, this ultimately results in the maximum vertical displacement of the building increasing with the depth of the tunnel.
The maximum building settlement and corresponding change rate under different vertical clearances are presented in
Figure 21. It can be observed that as the vertical clearance between the tunnel and pile foundation increases continuously, the building settlement shows a continuous increasing trend, and the overall change rate presents an upward tendency. Taking case N1 as the reference, the settlement change rates of cases N2, N3 and N4 remain stable at around 10%, while the change rate of case N5 rises to 13.08%, indicating a significantly accelerated settlement growth. With the gradual increase in the vertical distance between the tunnel and the pile foundation, the influence of stratum disturbance caused by tunneling construction on the piled-raft foundation is continuously enhanced.
7. Conclusions
Based on the construction of the section between Zhongyi Road Station and Houhu Fourth Road Station on Wuhan Metro Line 12, this paper systematically investigates the impact of shield tunnel construction on the surrounding strata and the pile foundations of nearby buildings through field monitoring, numerical simulation, and parametric analysis. It clarifies the mechanisms of key influencing factors. The main conclusions are as follows.
- (1)
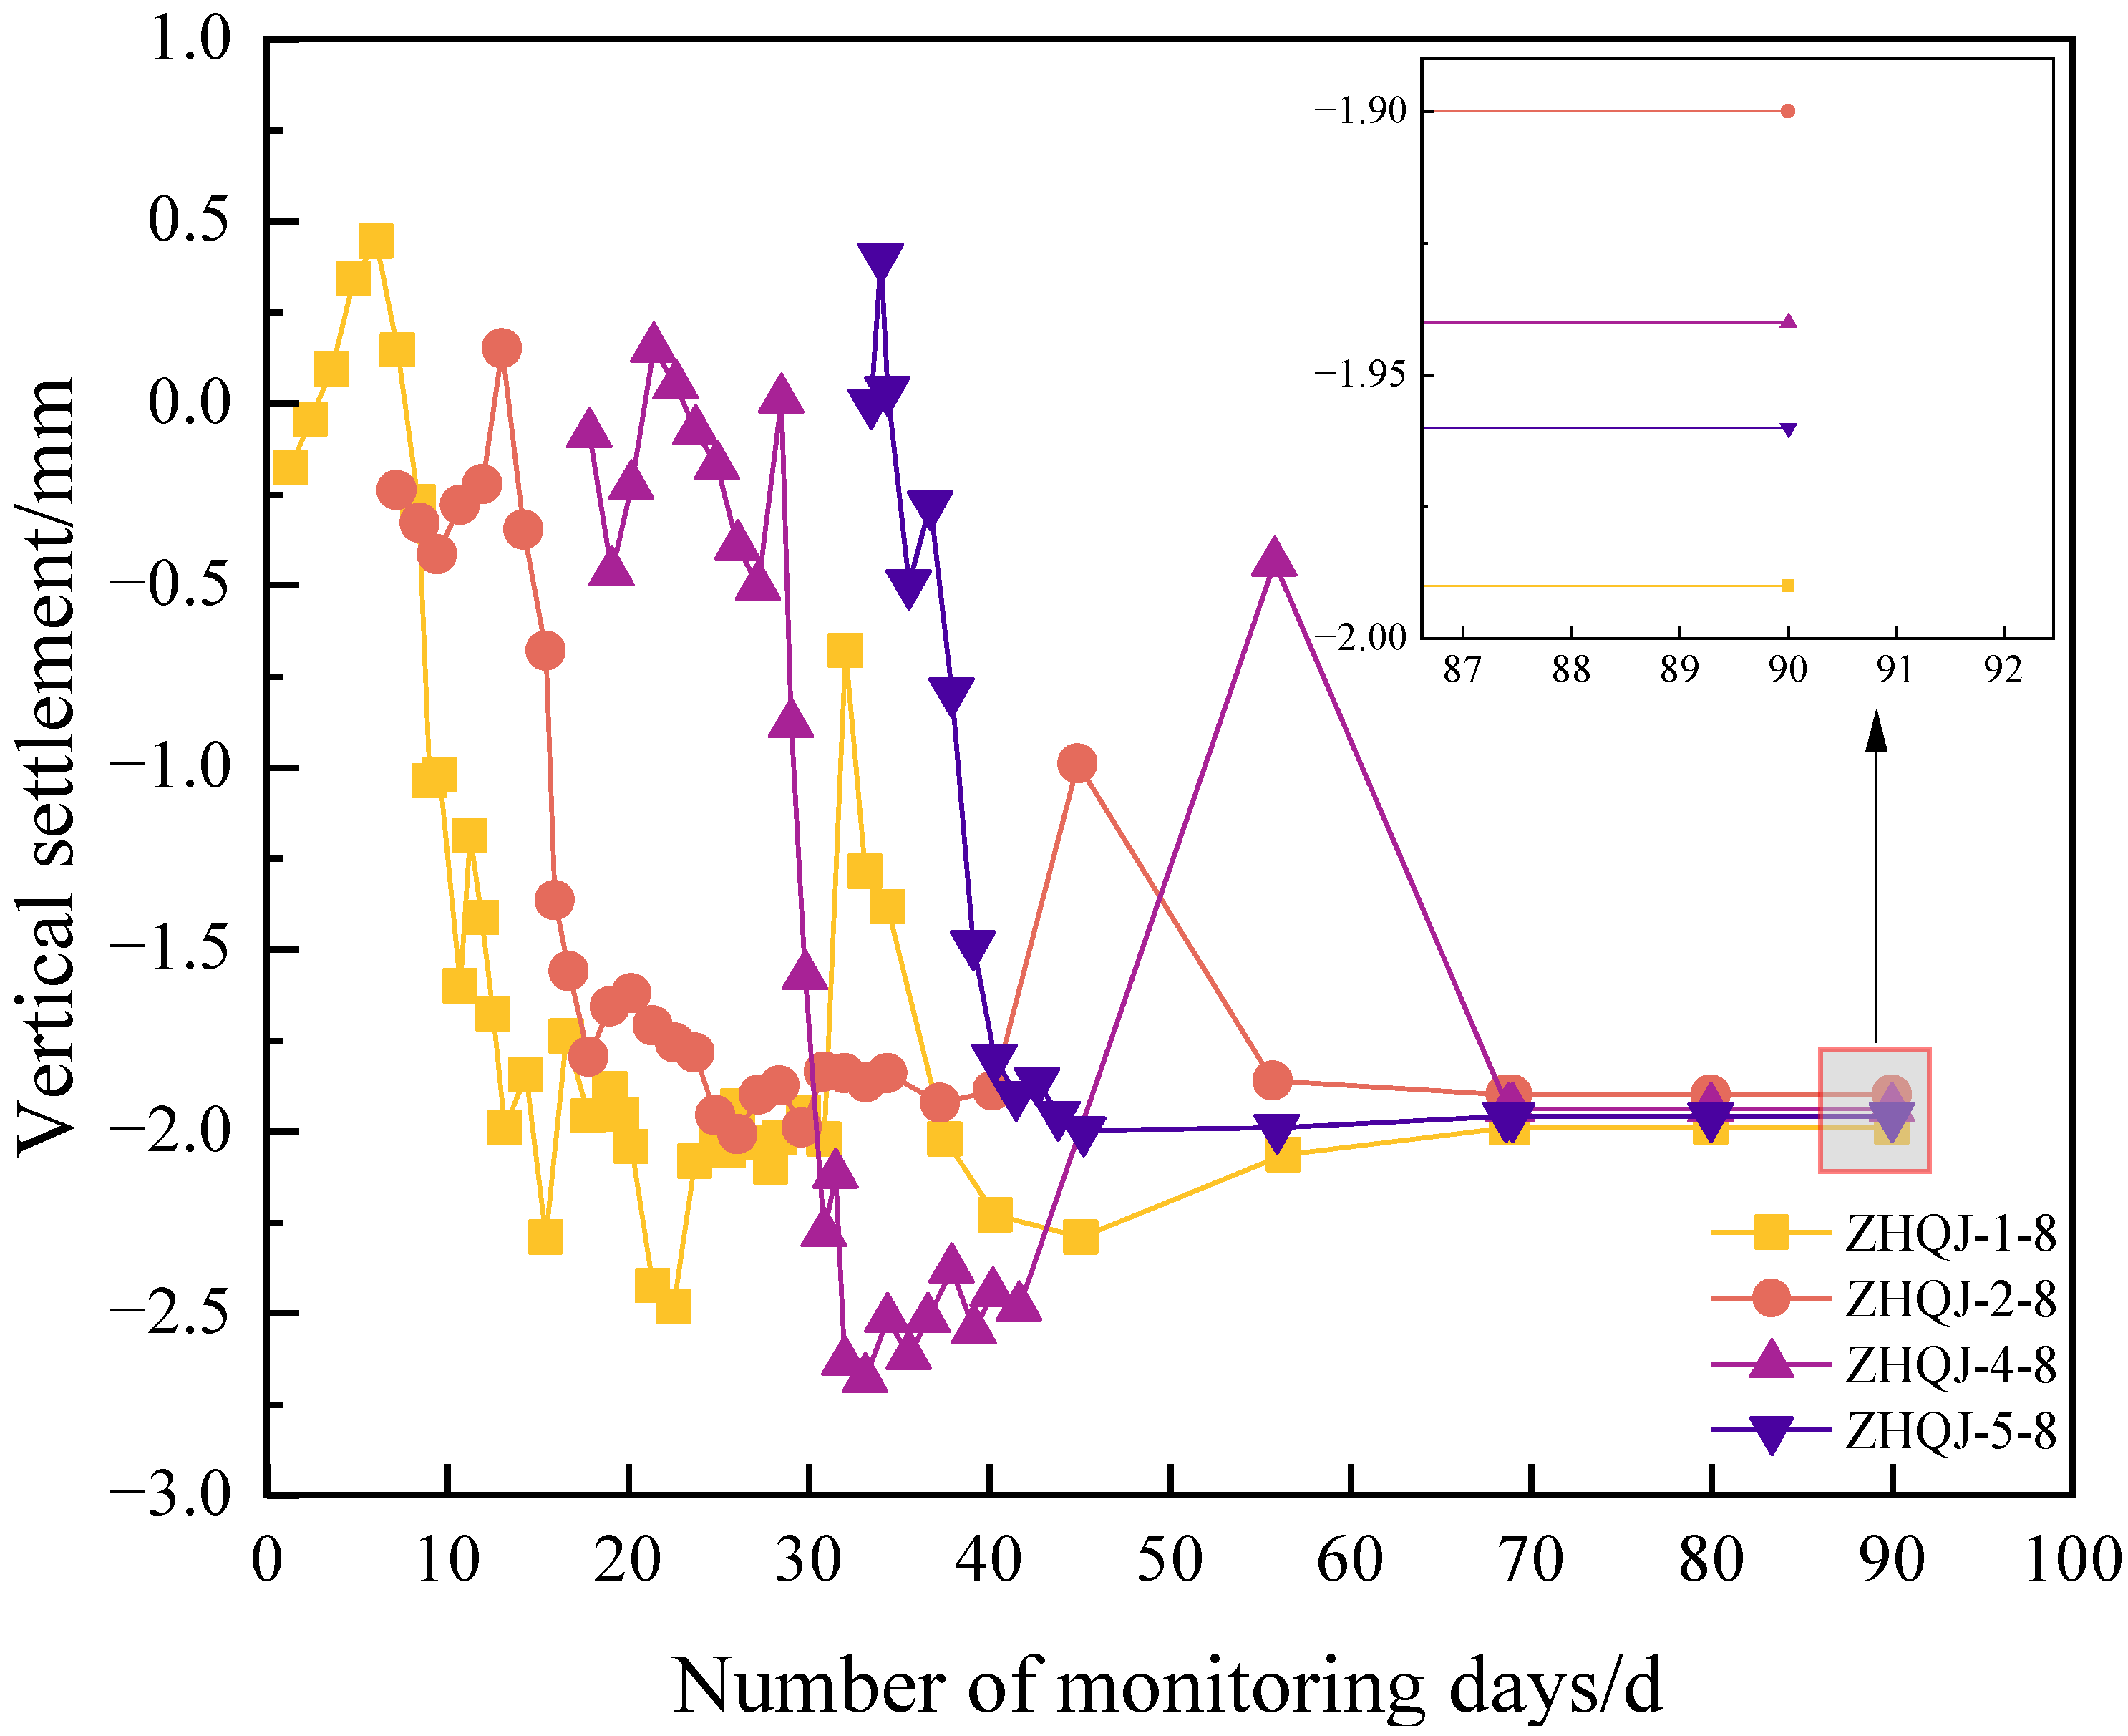
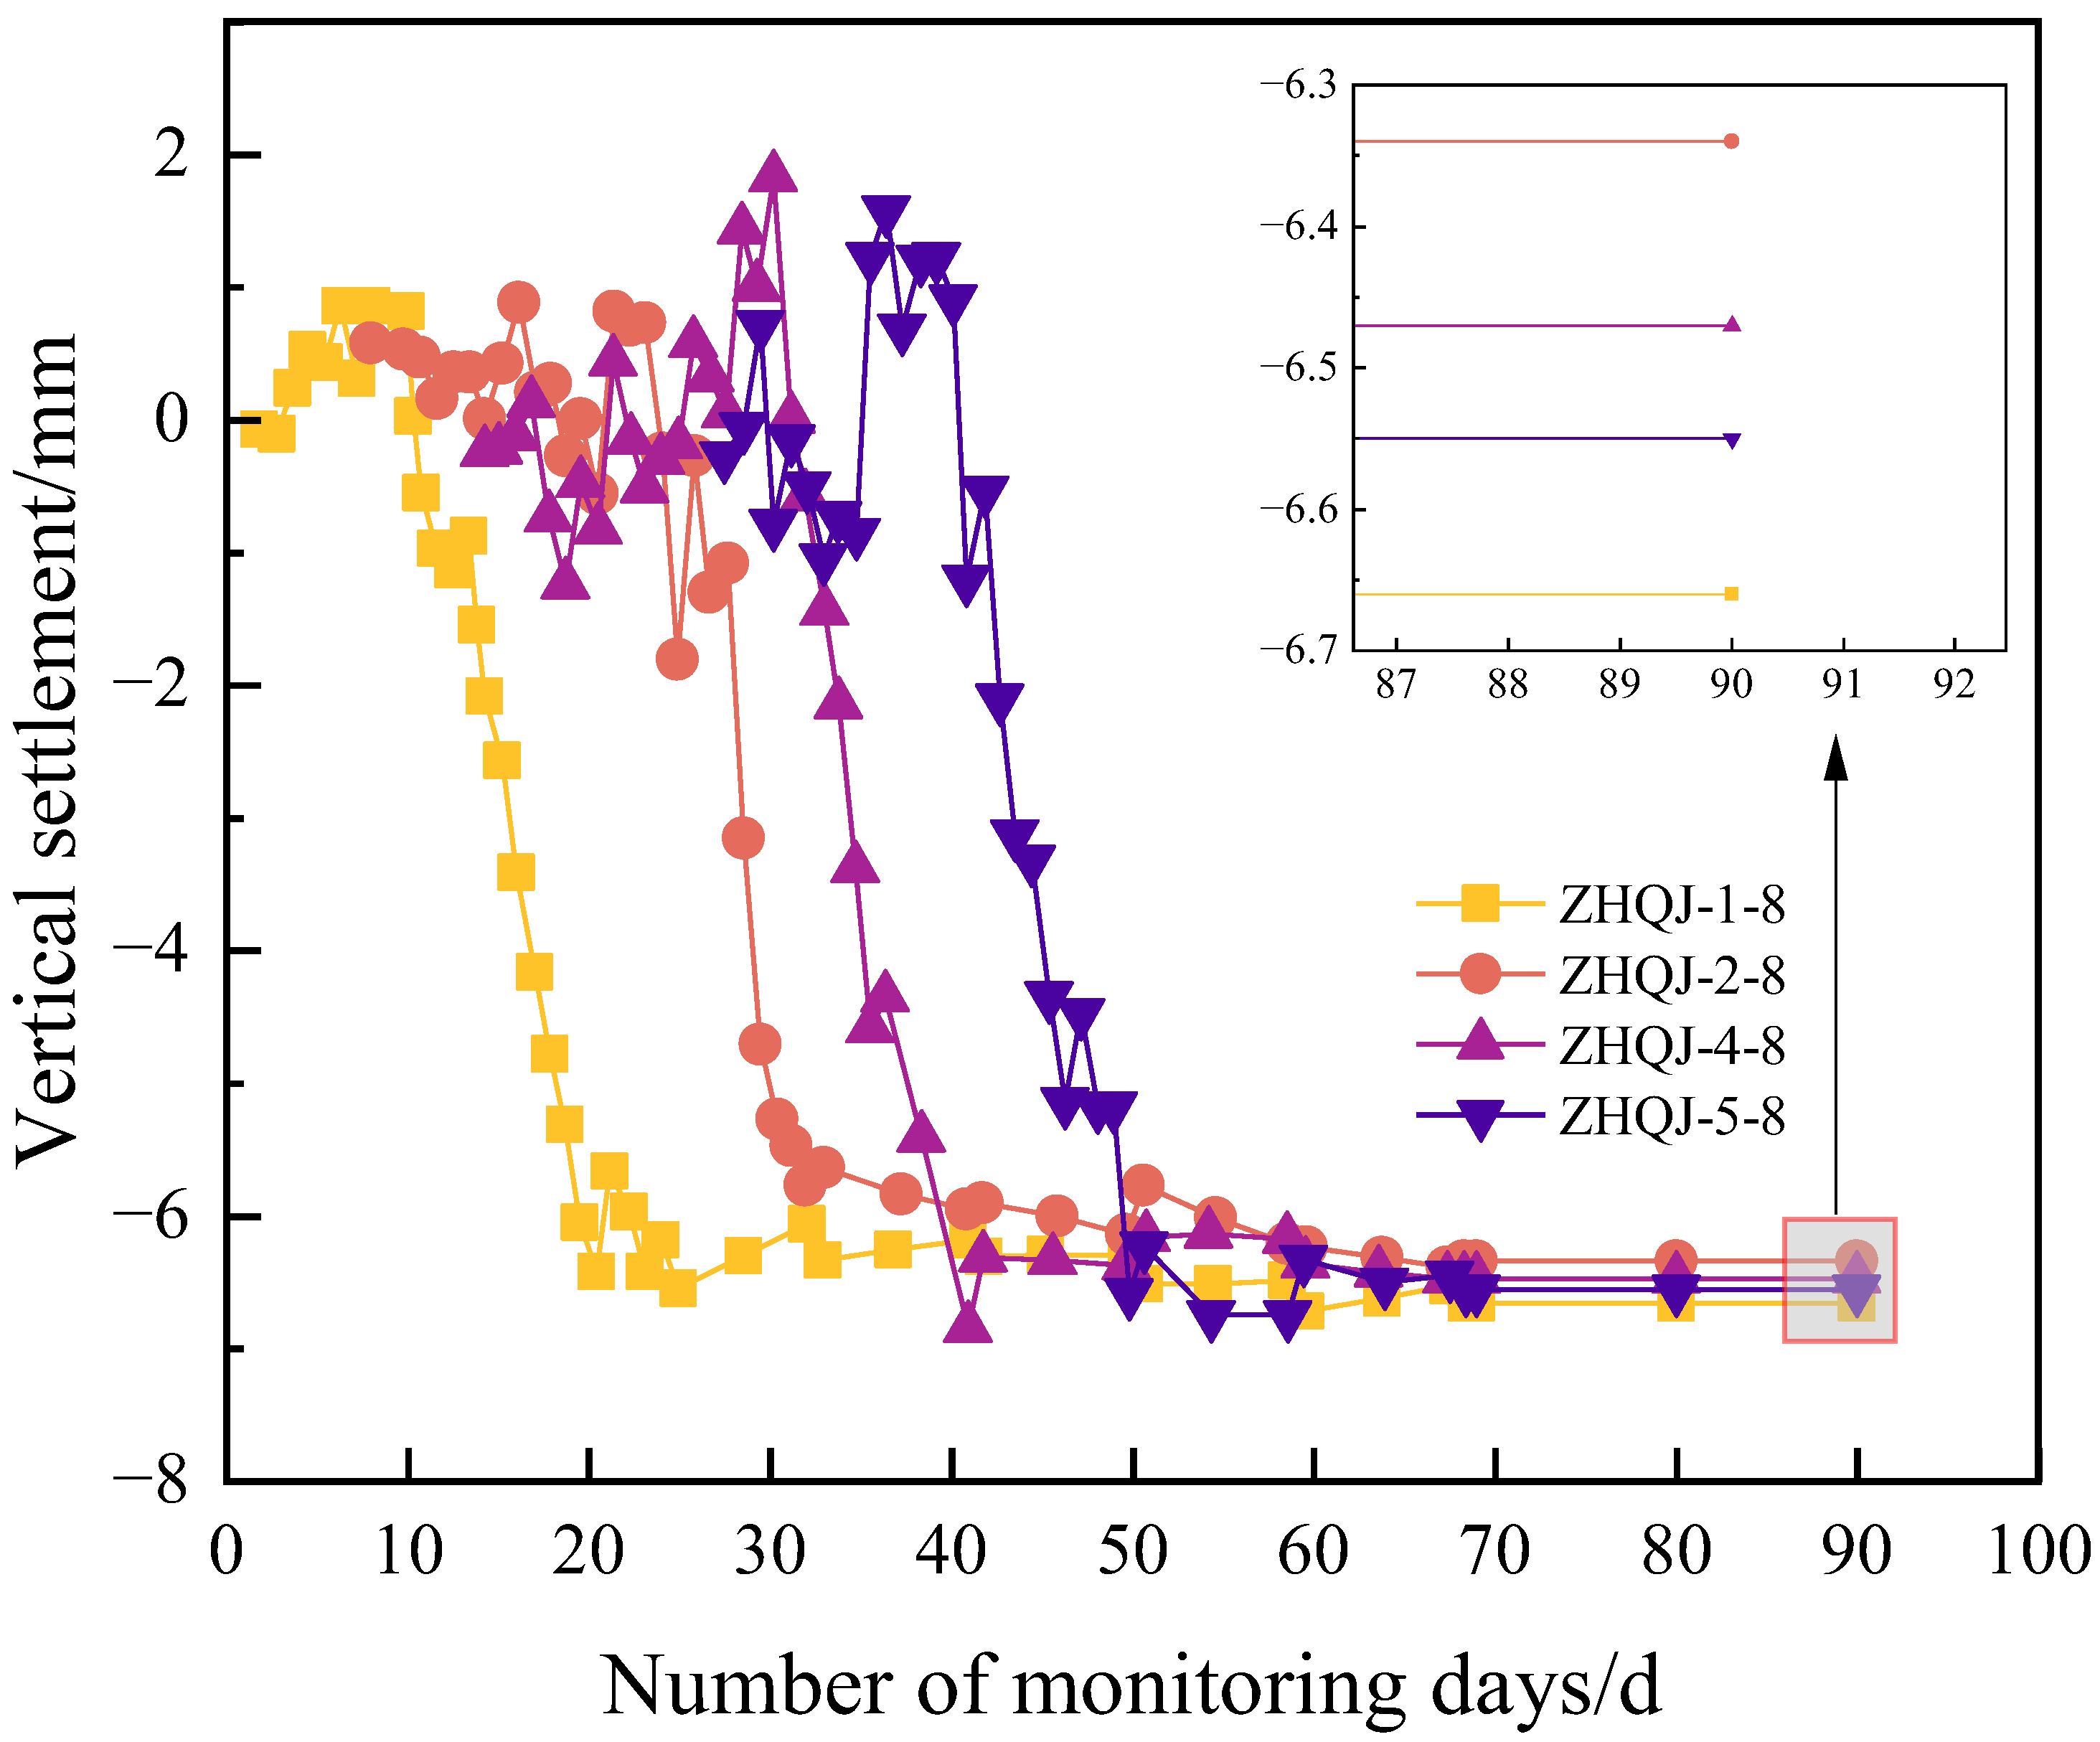
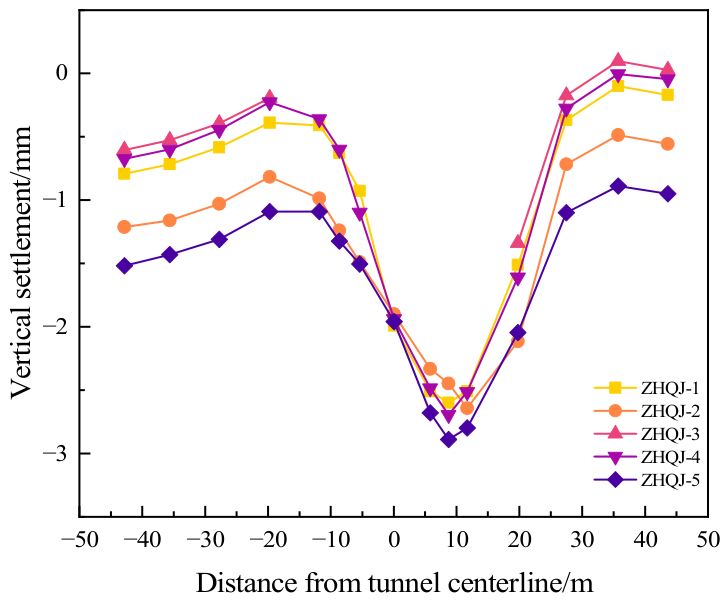
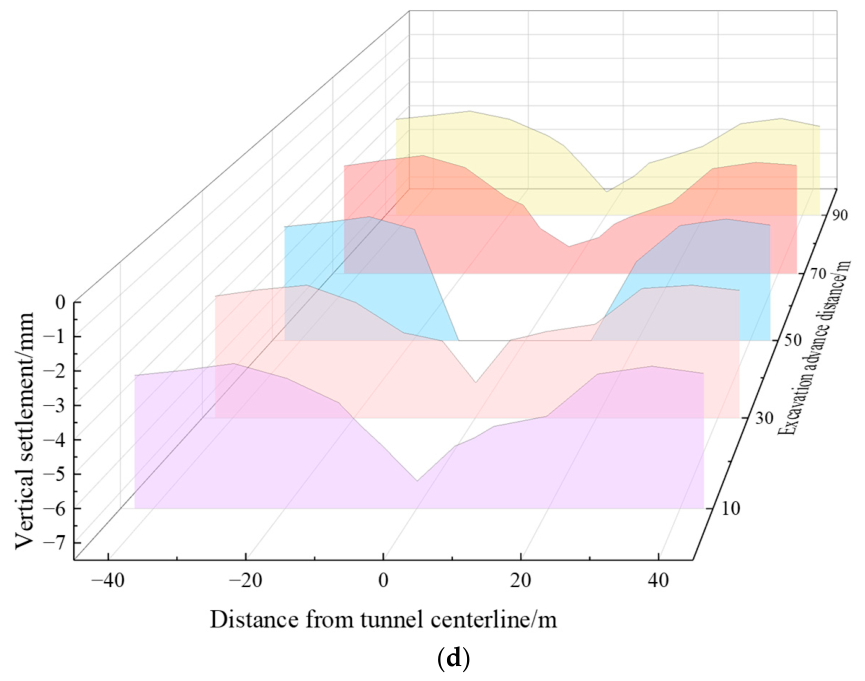
Field monitoring indicates that ground settlement induced by the construction of the right-line tunnel alone is minimal, with a maximum settlement of only −2.68 mm. Settlement increases significantly when both lines are constructed simultaneously, and the settlement curve exhibits a typical V-shaped distribution. Due to the rigid constraints imposed by the piled-raft foundation of the buildings, ground settlement in the areas near the buildings is significantly suppressed, resulting in a final settlement value lower than that in unconstrained areas. Building settlement progressed gradually with shield tunneling, reaching its maximum rate during the underpass phase. Settlement values at measurement points near the subsequent left-line tunnel were significantly greater than those near the right-line tunnel, exhibiting distinct characteristics of uneven settlement.
- (2)
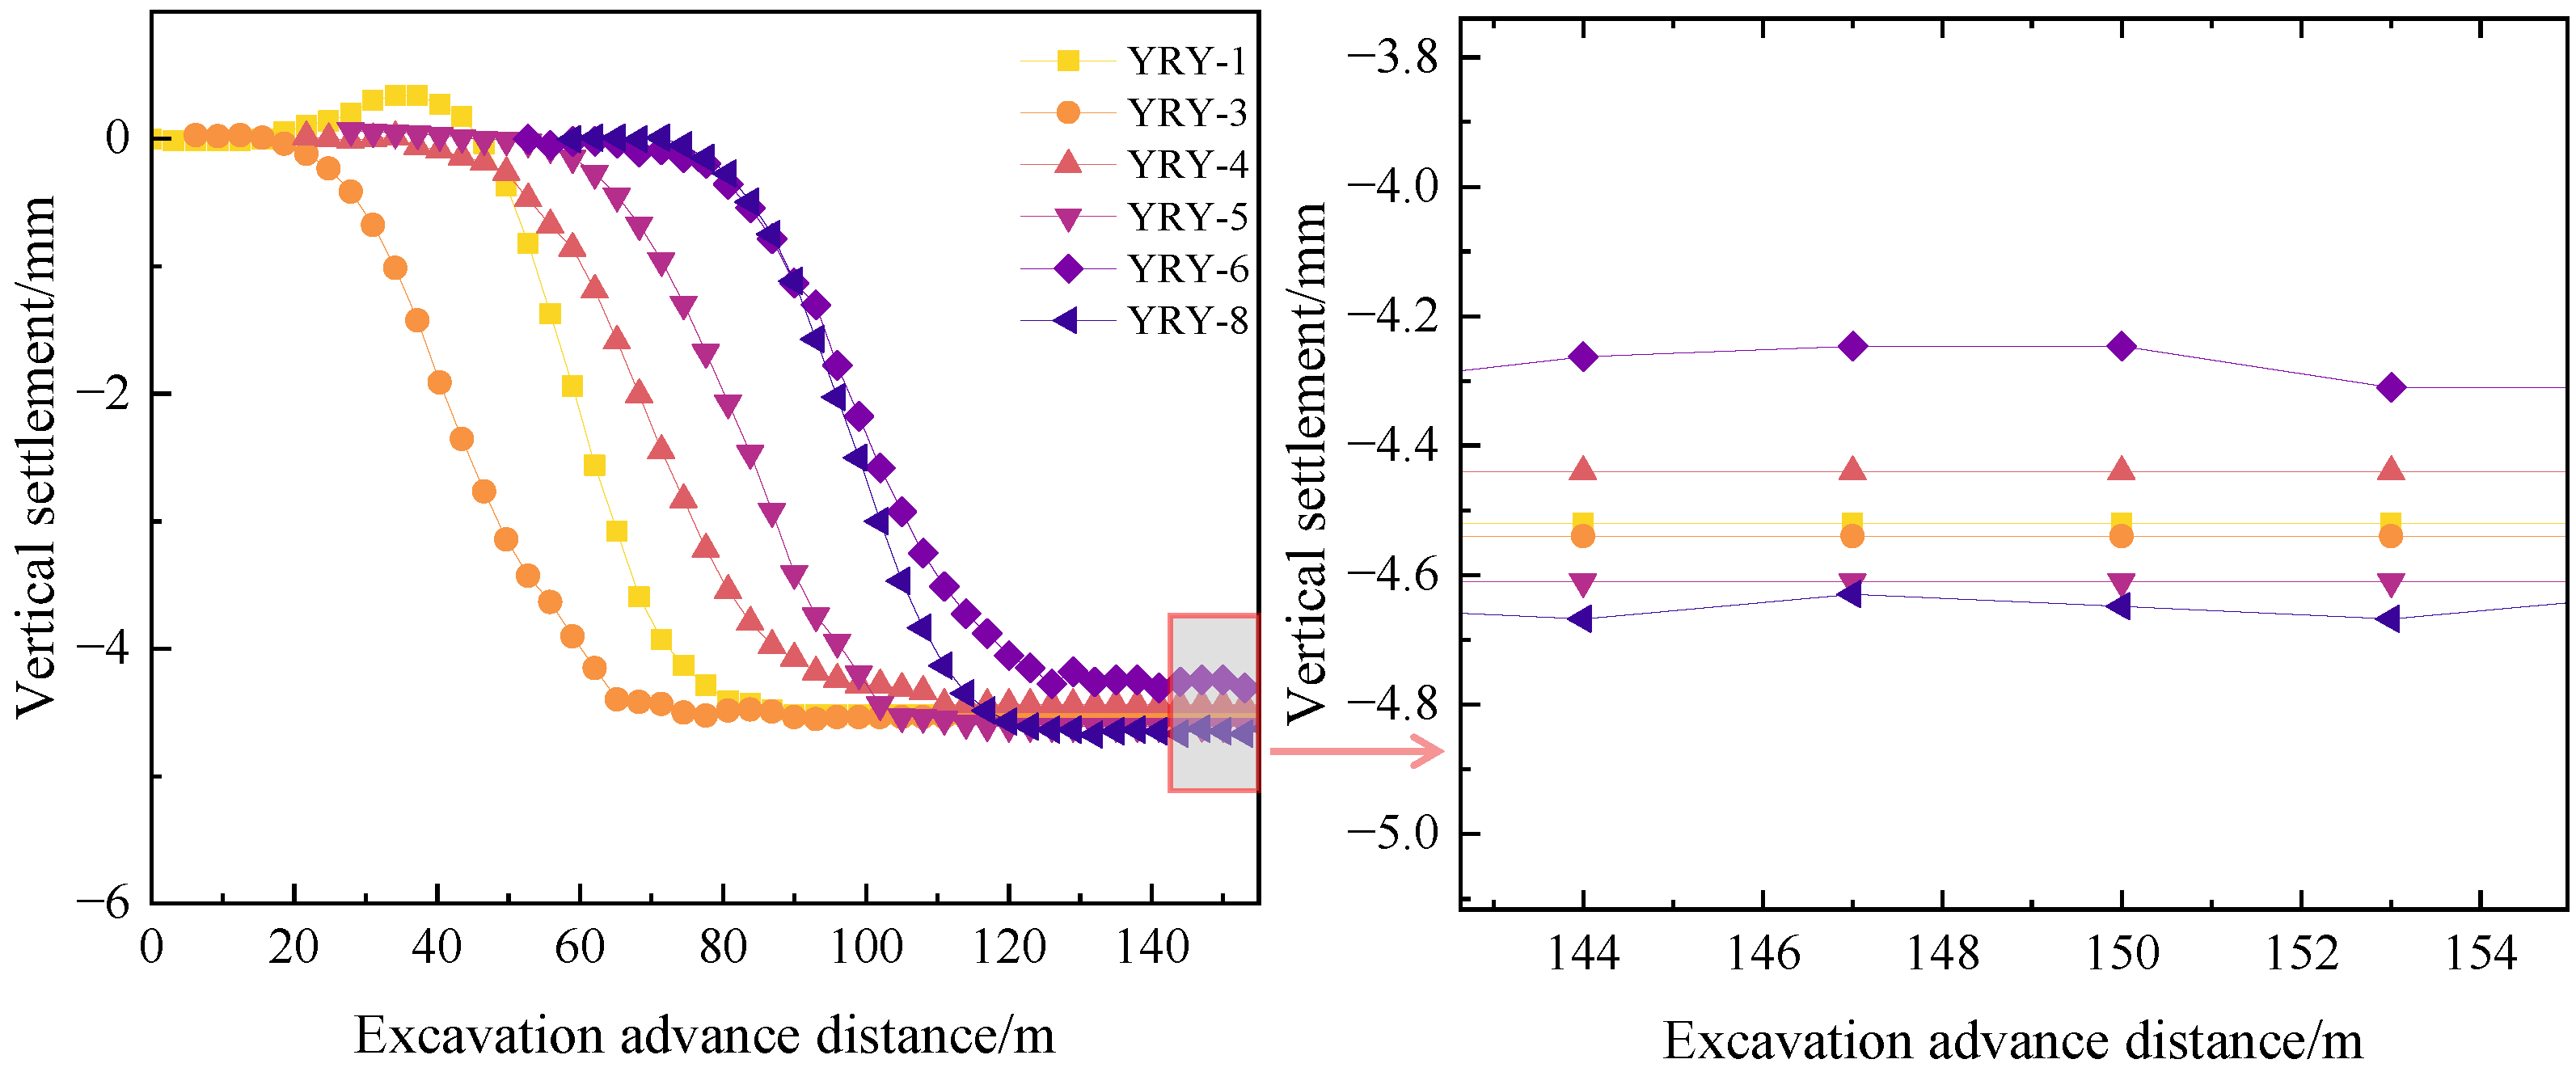
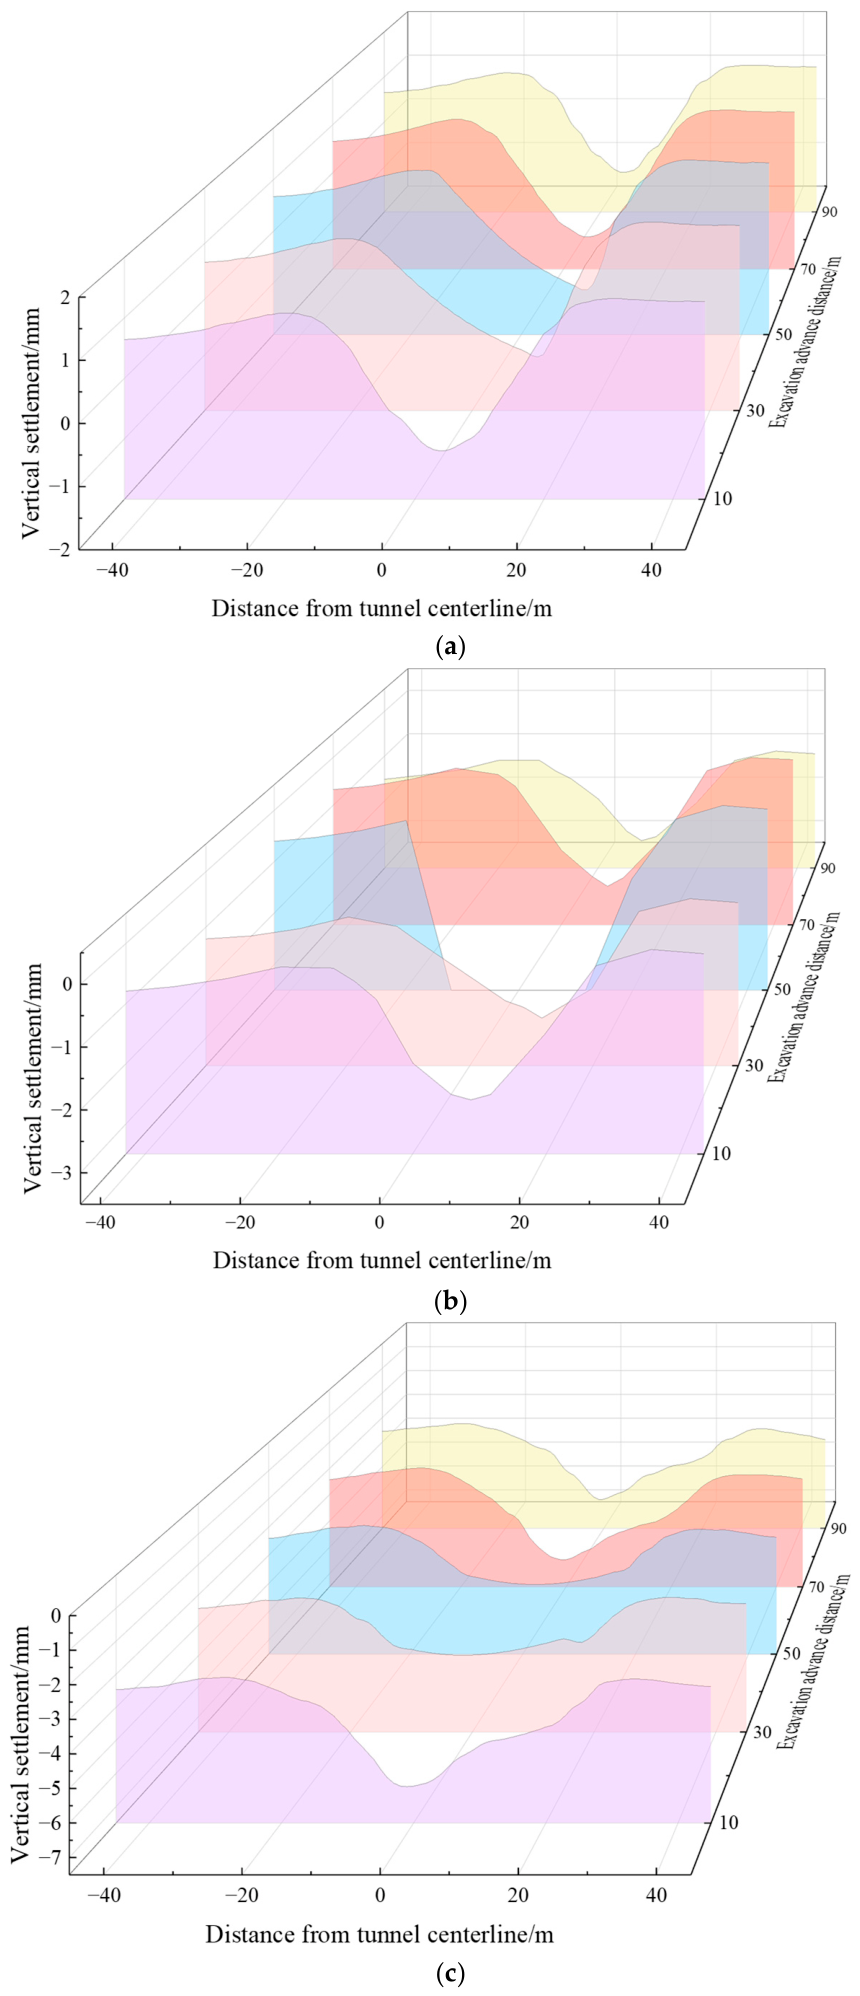
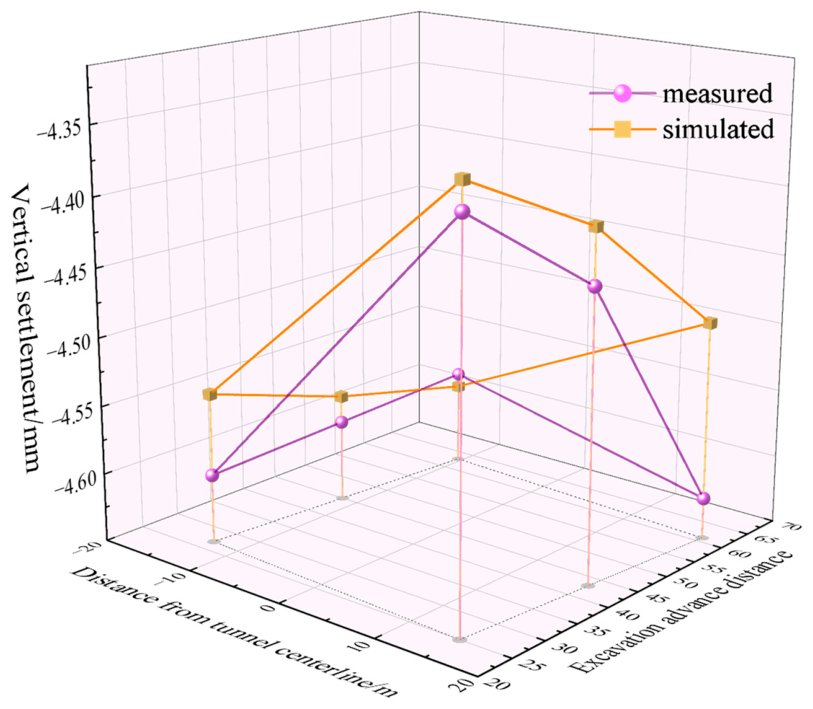
Numerical simulation results show that the ground settlement curves after both single-line and double-line construction exhibit distinct V-shaped characteristics; the maximum settlement of the building raft slab after construction completion is approximately 4.60 mm. Furthermore, the numerical simulation results show good agreement with field monitoring data, with consistent settlement trends and distribution patterns; the simulated values are slightly smaller than the measured values, verifying the rationality and reliability of the three-dimensional model and parameter selection in this study.
- (3)
The relative position of the piles and the tunnel is a key factor influencing building settlement. When the tunnel passes directly beneath the building, the disturbance effects from the left and right tunnel lines cancel each other out, resulting in uniform settlement distribution with smaller magnitudes. However, when the centerline of the double-tube tunnel is offset to one side, the building settlement values increase slightly. When the tunnel burial depth is significant—that is, when the vertical distance between the piles and the tunnel is considerable—the maximum settlement of the building’s raft foundation exhibits a certain upward trend. When a shield tunnel must inevitably pass beneath existing buildings, the horizontal alignment and vertical burial depth of the double-track tunnel should be reasonably optimized, provided site and design conditions permit, to minimize the adverse effects of construction on the building.
This article has obtained relatively comprehensive conclusions on the deformation response and influencing factors of piled-raft buildings undercrossed by shield tunnels. However, due to the limitations of research time and conditions, this investigation still has certain shortcomings that need to be acknowledged and improved in future work. First, the numerical model simplifies the dynamic and non-uniform distribution characteristics of the building superstructure loads, which may lead to minor deviations in the simulation of local soil stress and deformation transfer paths. Second, the simulation of key construction parameters during actual tunneling, such as synchronous grouting pressure, shield tail gap, tunneling speed, and face support pressure, is set as ideal constant values, while the dynamic fluctuation and real-time adjustment of these parameters in field construction are not fully considered. Accordingly, the research results and proposed laws are mainly applicable to shield tunneling projects in water-bearing sandy strata similar to the engineering background of this paper. For projects with significantly different geological conditions, structural forms, and construction technologies, further verification and optimization should be carried out combined with specific site conditions.




 and
and